Embed Size (px)
Citation preview
Phenolics and phenolic-polysaccharide linkages in
Chinese water chestnut (Eleocharis dulcis) cell walls.
Terri Grassby
BSc Chemistry with Industrial Experience
Submitted for the degree of
Doctor of Philosophy
University of East Anglia
Institute of Food Research
March 2008
© This copy of the thesis has been supplied on condition that anyone who
consults it is understood to recognise that its copyright rests with the author and
that no quotation from the thesis, nor any information derived therefrom, may be
published without the author’s prior written consent.
ABSTRACT
i
Abstract:
The main aim was to investigate the cell-wall cross-links in Chinese water
chestnut (CWC), in particular ferulic-acid-containing phenolic-polysaccharide
cross-links. The secondary aims were: to understand the gross composition of
CWC cell walls from the parenchyma, epidermis and sub-epidermis tissues of
the corm and the role of cell-wall composition in the plant’s physiology, and to
determine whether CWC contained higher oligomers of ferulic acid. Cell-wall
composition was investigated using a range of chemical analyses including
alkali phenolic extraction and methylation analysis. Chemical and biochemical
methods were evaluated for their ability to produce oligosaccharide fragments
attached to ferulic acid species. Mild acid hydrolysis followed by column
chromatography using Biogel P-2 was the method chosen. LC-MS was used to
identify compounds of interest.
The compositions of the epidermal tissues differed particularly in the proportions
of lignin and cellulose present. The relative amounts and proportions of the
phenolics varied considerably, possibly indicating their functions in the different
tissues. A multitude of phenolics were detected, a number of which now have
detailed UV information recorded about them. The LC-MS results indicate that
trimers and tetramers of ferulic acid are present, and provide some degree of
structural information for the trimers. A reasonable level of solubilisation was
achieved with mild acid hydrolysis, releasing ~70% of the arabinose, xylose and
galactose present into the supernatant. LC-MS indicated that multiple species
containing ferulic acid or diferulic acids linked to one or more pentose sugars
are present in the TFA hydrolysate and Biogel P-2 fractions, indicating that
ferulic acid and diferulic acid are linked to cell-wall sugars in CWC as in many
other monocots. Trimers and tetramers of ferulic acid were detected in a non-
maize substrate for the first time, implying the possibility of higher oligomers of
ferulic acid being present naturally in a wide range of cell walls.
CONTENTS
ii
Contents:
Abstract: i
Contents: ii
Figures: vii
Acknowledgements: 1
1 Introduction: 2
1.1 Plant cells 2
1.1.1 Structures in plant cells 2
1.2 Plant cell walls 4
1.2.1 Cellulose microfibrils 5
1.2.2 Pectin 6
1.2.3 Hemicelluloses 8
1.2.4 Phenolic compounds 11
1.2.5 Proteins 17
1.2.6 Enzymes 19
1.2.7 Structural relationships between polysaccharides in primary cell walls 21
1.2.8 Cell walls and growth regulation 25
1.2.9 Cell walls and defence 25
1.2.10 Cell walls and health 27
1.3 Studying the cell-wall matrix 28
1.3.1 Microscope-based investigations 28
1.3.2 Chemical investigations 30
1.3.3 Enzyme-based investigations 31
1.3.4 Mechanical analysis 32
1.4 Chinese water chestnut 33
1.4.1 Studies of CWC cell walls 34
1.5 Analytical theory 37
1.5.1 Gas-chromatography (GC) theory 37
1.5.2 High performance liquid chromatography (HPLC) theory 39
1.5.3 Mass spectrometry (MS) theory 40
1.6 Aims of investigation 42
1.6.1 Cell walls in different tissues of CWC 42
1.6.2 Cell wall cross-links 43
1.6.3 Higher oligomers of ferulic acid 43
CONTENTS
iii
2 General Materials and Methods: 44
2.1 Source of materials 44
2.2 Preparation of cell-wall material (CWM) 44
2.2.1 Preparation of parenchyma-cell-wall material 45
2.2.2 Preparation of epidermis-cell-wall materials 46
2.3 Total phenolic extraction 47
2.4 Sequential phenolic extraction 48
2.5 HPLC-MS analysis 49
2.6 Klason lignin 49
2.7 Neutral sugars 50
2.8 Uronic acids 52
2.9 Methylation analysis of carbohydrate linkages 52
2.9.1 NaOH-catalysed methylation analysis 53
2.9.2 Production of lithium dimsyl catalyst 55
2.9.3 Samples and initial preparation for lithium dimsyl-catalysed methylation 56
2.9.4 Lithium dimsyl-catalysed methylation reaction 56
2.9.5 Carboxyl reduction 57
2.9.6 Hydrolysis and acetylation 58
2.10 Microscopy 58
2.11 Vortex-induced cell separation (VICS) 59
2.12 Sequential extraction 59
2.12.1 CDTA extraction 60
2.12.2 Na2CO3 extraction 60
2.12.3 KOH extraction 60
3 Characterisation of Cell Walls of Chinese Water Chestnut: 61
3.1 Methods 61
3.2 Results 61
3.2.1 Phenolic composition 62
3.2.2 Carbohydrate composition 71
3.2.3 Microscopy 81
3.2.4 Vortex-induced cell separation (VICS) 82
3.3 Discussion 83
3.3.1 Comparison of tissue types 83
3.3.2 Implications for CWC parenchyma-cell-wall structure 86
4 Profiling of Unidentified Phenolics: 88
CONTENTS
iv
4.1 Attributes of unknown phenolics 88
4.1.1 Retention time 89
4.1.2 Relative retention time (RRT) 89
4.1.3 UV maxima and minima 89
4.1.4 Spectrum shape group 89
4.2 Unknown phenolics from total phenolic extraction 91
4.3 Unknown phenolics from sequential phenolic extraction 93
4.4 Unknown phenolics from further sequential phenolic extraction 95
4.5 Summary 96
5 Characterisation of Cell-Wall Polymers in Parenchyma of Chinese
Water Chestnut: 97
5.1 Methods 97
5.1.1 Analysis of extracts and residue 98
5.2 Results 99
5.2.1 Carbohydrate composition 99
5.2.2 Linkage analysis 100
5.2.3 Phenolic composition 103
5.3 Discussion 104
6 Development and Evaluation of Biochemical Methods of Cell-Wall
Disassembly: 106
6.1 Enzyme preparations 107
6.2 Methods 107
6.3 Yields 109
6.4 Analysis of residues and supernatants 109
6.4.1 Sugar composition 109
6.4.2 Phenolic composition 111
6.5 Releasable phenolics from Ultraflo and purified Driselase 115
6.6 Releasable sugars from Ultraflo and purified Driselase 116
6.7 Discussion 120
7 Development, Evaluation and Exploitation of Chemical Methods of
Cell-Wall Disassembly: 121
7.1 Methods 121
7.1.1 Ethanol precipitation 123
7.1.2 Characterisation of residues and supernatants 123
7.1.3 Separation of supernatant components by column chromatography 127
CONTENTS
v
7.2 Analysis of chromatography fractions to identify peaks and guide fraction
recombination 128
7.2.1 UV absorption at 214, 280, 320 and 350 nm 128
7.2.2 Phenol-H2SO4 total sugars assay 128
7.2.3 Folin-Ciocalteu total phenolic assay 129
7.2.4 Results for Run 1 129
7.2.5 Results of absorbance measurements 131
7.3 Characterisation of peaks 133
7.3.1 Thin-layer chromatography 133
7.3.2 Carbohydrate composition and linkage analysis of peaks 135
7.3.3 Phenolic composition 138
7.4 LC-MS to detect phenolic-polysaccharide linkages 139
7.4.1 Alkali extract of TFA/80%-ethanol precipitate 139
7.4.2 TFA Hydrolysate 3 140
7.4.3 Alkali extract of TFA Residue 3 141
7.4.4 Biogel P-2 chromatography peaks 143
7.5 Discussion 143
8 MS and NMR of Selected Components of Chinese Water Chestnut Cell
Walls: 145
8.1 Solid-phase-extraction theory 145
8.2 Nuclear magnetic resonance (NMR) theory 146
8.3 Methods 147
8.3.1 Scale-up of phenolic extraction of CWM 147
8.3.2 LC-MS experiments 148
8.3.3 NMR experiments 149
8.4 Molecules indicated by MS 151
8.4.1 PCWM alkali extract 152
8.4.2 SECWM alkali extract 154
8.4.3 ECWM alkali extract 156
8.4.4 Phenolic dimers and trimers 157
8.4.5 Phenolic-polysaccharide linkages 163
8.5 Discussion 164
9 General Discussion: 166
9.1 Cell walls in different tissues of CWC 166
9.2 Characterisation of unknown phenolics 167
CONTENTS
vi
9.3 Cell wall cross-links 167
9.4 Higher oligomers of ferulic acid 168
9.5 Limitations 168
9.6 Future work 169
9.6.1 Improved TFA hydrolysis methodology 169
9.6.2 Degradation of cell wall by purified CWC-specific enzymes 169
9.6.3 Improved LC-SPE methodology 170
9.6.4 Stability of phenolic-polysaccharide linkages in alkali 170
9.6.5 Investigations of CWC leaf-cell walls 170
9.6.6 Completion of CWC cell-wall models 171
9.6.7 Alternative methods of polysaccharide analysis 172
9.6.8 Commercial uses for CWC cell-wall information 172
10 Appendices: 174
A Solution preparation 174
B HPLC parameters 175
C GC parameters – sugars analysis 178
D GC parameters – PMAA analysis 181
E Uronic acid raw data 185
F Peak list for Unknown Phenolics 187
G Biogel P-2 original chromatograms 190
H Combining fractions from Biogel P-2 194
I MicroToF parameters 196
J NMR parameters 197
K Microscopy of CWC leaves 198
11 Glossary: 199
12 References: 201
LIST OF FIGURES
vii
Figures:
Figure 1: Features of a typical plant cell, based on Lack and Evans
(2001). ................................................................................................................ 2
Figure 2: Simplified cell-wall structure diagram, from Waldron and Faulds
(2007). ................................................................................................................ 5
Figure 3: AFM error-signal-mode image of hydrated Chinese water
chestnut cell wall (false colour), from Kirby et al (1996). ..................................... 6
Figure 4: General structures of flavonoids. ....................................................... 12
Figure 5: Chemical structures of diferulic acids identified in plant-cell walls. .... 14
Figure 6: Chemical structures of triferulic acids discovered in maize-cell
walls. ................................................................................................................. 15
Figure 7: Chemical structures of tetraferulic acids discovered in maize-cell
walls. ................................................................................................................. 16
Figure 8: Formation of isodityrosine, based on McNeil et al (1984). ................. 18
Figure 9: Definition of axes used in cell-wall models. ........................................ 21
Figure 10: Antibodies used in microscope investigations of plant-cell walls,
and the epitopes they bind to. ........................................................................... 30
Figure 11: Cell rupture (left) and cell separation (right), based on Brett and
Waldron (1996). ................................................................................................ 32
Figure 12: Chinese water-chestnut corms (left) and a sprouting corm
(right). ............................................................................................................... 33
Figure 13: CWC cell in alkali, showing concentration of phenolics at the
edges of the cell faces, visualised by UV microscopy, from Parker and
Waldron (1995). ................................................................................................ 35
Figure 14: Provisional cell-wall model of CWC parenchyma at the
interface of two cells (Cellulose is green, AX is blue, pectin is pink,
diferulic acid cross-links are purple). ................................................................. 36
Figure 15: Schematic of a gas chromatograph, based on Skoog et al
(1996). .............................................................................................................. 38
Figure 16: Schematic of a high-performance liquid chromatograph, based
on Skoog et al (1996). ....................................................................................... 39
Figure 17: Schematic of a magnetic-sector mass spectrometer. ...................... 41
LIST OF FIGURES
viii
Figure 18: Phenolic extract colours before acidifying; parenchyma (left),
epidermis (centre), sub-epidermis (right). ......................................................... 47
Figure 19: Configuration for separation of methylated polysaccharides
during linkage analysis by methylation. ............................................................. 54
Figure 20: Transferring butyl lithium to dropping funnel. ................................... 55
Figure 21: Raw chromatogram for total phenolic extraction of PCWM. ............. 62
Figure 22: Raw chromatogram for total phenolic extraction of ECWM. ............. 62
Figure 23: Raw chromatogram for total phenolic extraction of SECWM. .......... 63
Figure 24: Calculated yields of the phenolic components extracted from
the CWM of the three CWC tissues (errors are standard deviations of
three determinations). ....................................................................................... 63
Figure 25: Table showing varying proportions of phenolics in different
tissues. .............................................................................................................. 64
Figure 26: Comparison of the diferulic acid composition in CWC tissues. ........ 65
Figure 27: Observations of supernatants from CWC tissues during
sequential phenolic extraction. .......................................................................... 65
Figure 28: Calculated yields of the phenolic components sequentially
extracted from PCWM (top), ECWM (middle) and SECWM (bottom)
(errors are standard deviations of three determinations). ................................. 66
Figure 29: Percentage of phenolics released by sequential phenolic
extraction compared to total phenolic extraction yields for parenchyma,
epidermis and sub-epidermis. PCWM (top), ECWM (middle) and SECWM
(bottom). ........................................................................................................... 68
Figure 30: Retention times and identifying ions for positive ESI analysis of
1 M NaOH, 24 hr alkali extractions. ................................................................. 70
Figure 31: Results of 72% (w/w) H2SO4 hydrolysis of CWM (Batch 1)
(errors are standard deviation of three determinations). ................................... 71
Figure 32: Results of 1 M H2SO4 hydrolysis of CWM (Batch 1) (errors are
standard deviations of three determinations). ................................................... 72
Figure 33: Table showing the differences between the sugars hydrolysed
by 72% (w/w) and 1 M H2SO4 in µg/mg. ........................................................... 72
Figure 34: Comparison of carbohydrate composition to reference values
(uronic acids measured as GlcA equivalents). .................................................. 74
Figure 35: Methylation-analysis data for PCWM. .............................................. 75
LIST OF FIGURES
ix
Figure 36: Methylation-analysis data for ECWM and SECWM. ........................ 79
Figure 37: CWC sections illuminated by visible light (a); and UV light at pH
9.6 (b) (scale bar is 100 µm). ............................................................................ 81
Figure 38: VICS scores and liquor observations for different storage
conditions. ......................................................................................................... 82
Figure 39: Comparison of the composition of the different tissues of CWC. ..... 84
Figure 40: Cell-wall model of CWC parenchyma at the interface of two
cells. XG is the major hemicellulose, the proportion of AX has been
reduced. (Cellulose is green, XG is black, AX is blue, diferulic cross-links
are purple, and pectin is pink) ........................................................................... 87
Figure 41: Representative spectra shapes. ...................................................... 90
Figure 42: Example of attributes of known phenolics (RRT relative to
trans-cinnamic acid in standard mixture). ......................................................... 90
Figure 43: Attributes of known triferulic acids. .................................................. 90
Figure 44: Absorbance spectra for Unknown Phenolics A-G. ........................... 91
Figure 45: Attributes of Unknown Phenolics A-G from total phenolic
extraction. ......................................................................................................... 92
Figure 46: Relative abundance of unknown phenolics released by total
phenolic extraction from PCWM, ECWM and SECWM (errors are standard
deviations of three determinations). .................................................................. 92
Figure 47: Relative abundance of unknown phenolics released by
sequential phenolic extraction (PCWM (previous page), ECWM (top) and
SECWM (bottom), errors are standard deviations of three determinations). ..... 94
Figure 48: Attributes of Unknown Phenolics H-K. ............................................. 95
Figure 49: Sequential extraction procedure. ..................................................... 98
Figure 50: Yields for KOH extracts and residue from sequential extraction. ..... 99
Figure 51: Carbohydrate composition of extracts and residue from
sequential extraction. ...................................................................................... 100
Figure 52: Linkage analysis of sequential-extraction extracts and residue. .... 101
Figure 52b: Linkage analysis of sequential-extraction extracts and residue
(continued). ..................................................................................................... 102
Figure 53: Phenolics in sequential extracts and residue from sequential
extraction. ....................................................................................................... 103
Figure 54: Experimental scheme for enzyme digestions. ............................... 108
LIST OF FIGURES
x
Figure 55: Yields from preliminary enzyme digestion. ..................................... 109
Figure 56: Average sugar composition of residues after enzyme digestion,
compared to PCWM. ....................................................................................... 110
Figure 57: Average sugar composition of Supernatant 1 from each
enzyme digestion (per mg of PCWM digested), compared to PCWM. ............ 110
Figure 58: Supernatant 0 HPLC results (all peaks unidentified)...................... 111
Figure 59: Comparison of phenolics in undigested PCWM and enzyme
digest residues (values are averages from two digestions). ........................... 112
Figure 60: Phenolics in enzyme digest Supernatant 1 (alkali extracted)
(errors are standard deviations of two replicates from two digestions). .......... 113
Figure 61: Phenolics in enzyme digest Supernatant 2 (free phenolics)
(errors are standard deviations of two replicates from two digestions). .......... 113
Figure 62: Phenolics in enzyme digest Supernatant 3 (alkali extracted
after free phenolics removed) (errors are standard deviations of two
replicates from two digestions). ....................................................................... 114
Figure 63: Phenolics extracted from Ultraflo and purified Driselase by 4 M
NaOH. ............................................................................................................. 116
Figure 64: Sugars extracted from Ultraflo and purified Driselase by 72%
(w/w) H2SO4. ................................................................................................... 116
Figure 65: Table of selected enzyme-digestion conditions for other
researchers. .................................................................................................... 118
Figure 65b: Table of selected enzyme-digestion conditions for other
researchers (continued). ................................................................................. 119
Figure 66: TFA-hydrolysis fraction guide. ....................................................... 122
Figure 67: Yields of residue, hydrolysate and ethanol precipitate from TFA
hydrolyses. ...................................................................................................... 123
Figure 68: 1 M H2SO4 sugars results for the residue, supernatant and
ethanol precipitate from TFA Hydrolysis 1 (values are averages from two
determinations). .............................................................................................. 124
Figure 69: 72% (w/w) H2SO4 sugars results for the residue, supernatant
and ethanol precipitate from TFA Hydrolyses 2 and 3 (uronic acids
measured as GlcA equivalents). ..................................................................... 125
LIST OF FIGURES
xi
Figure 70: Phenolics in residue, precipitate and supernatant of TFA
Hydrolysis 1 (values are averages of two (residue and supernatant) or
three (precipitate) determinations). ................................................................. 126
Figure 71: Phenolics in residue, precipitate and supernatants of TFA
Hydrolyses 2 and 3. ........................................................................................ 126
Figure 72: Volumes of supernatant applied and fractions collected for
Biogel P-2 runs. .............................................................................................. 127
Figure 73: Comparison of total phenolics, total sugars and absorbance
data for Run 1 (total phenolics as ferulic acid equivalents x10, total sugars
as xylose equivalents). .................................................................................... 130
Figure 74: 1 M H2SO4 sugars results for selected fractions from Run 1
(values are averages from two determinations). ............................................. 130
Figure 75: Phenolics results for selected fractions from Run 1 (values are
averages of two determinations). .................................................................... 131
Figure 76: Absorbance of Biogel P-2 fractions at 320 nm (Runs 4-8). ............ 132
Figure 77: Diagram of TLC-plate layout. ......................................................... 133
Figure 78: TLC plate showing standards, combined peaks and residues
from the second TFA hydrolysis, with perceived spots marked in pencil. ....... 134
Figure 79: Sugars results for Peaks 1-11 (Set b – larger of the two
samples retrieved for each peak, see §7.2.5 for explanation). ........................ 135
Figure 80: Methylation-analysis data for Peaks 4, 6 and 7. ............................ 136
Figure 81: Methylation-analysis data for Peaks 2, 5, 3 and 8. ........................ 137
Figure 82: Phenolics in Peaks 1-11 (Set b – larger of the two samples
retrieved for each peak, see §7.2.5 for explanation). ...................................... 138
Figure 83: Total-ion and extracted-ion (m/z=579) chromatograms for
TFA/80%-ethanol Precipitate 3, showing the large number of possible
triferulic acids. ................................................................................................. 139
Figure 84: MS data for some ferulic acid-polysaccharide fragments. .............. 140
Figure 85: Total-ion and UV chromatograms for TFA-Hydrolysate 3. ............. 141
Figure 86: The diferulic acid-arabinose fragments detected in TFA-
Hydrolysate 3. ................................................................................................. 141
Figure 87: Total-ion and UV chromatograms for TFA-Residue-3 alkali
extract. ............................................................................................................ 142
LIST OF FIGURES
xii
Figure 88: UV and extracted-ion (m/z=579) chromatograms for TFA-
Residue-3 alkali extract. .................................................................................. 142
Figure 89: Structure of Ara-8,8’-DiFA (AT)-Ara as extracted from maize
bran by Bunzel et al (2008). ............................................................................ 144
Figure 90: Example chromatogram showing manual peak collection of
three peaks (1C12, 1D1, 1D2) and one blank (1D3). ...................................... 149
Figure 91: NMR spectra of blank and putatively-identified FA-Ara. ................. 150
Figure 92: Example of HPC calibration using sodium formate as calibrant. .... 151
Figure 93: Example of generated molecular formulae for ferulic acid. ............ 152
Figure 94: Total-ion and UV chromatograms of PCWM alkali extract. ............ 153
Figure 95: Compounds detected by accurate-mass MS in PCWM. ................ 153
Figure 96: Total-ion and UV chromatograms for SECWM alkali extract. ........ 154
Figure 97: Compounds detected by accurate-mass MS in SECWM. .............. 154
Figure 97b: Compounds detected by accurate-mass MS in SECWM
(continued). ..................................................................................................... 155
Figure 98: Total-ion and UV chromatograms for ECWM alkali extract. ........... 156
Figure 99: Compounds detected by accurate-mass MS in ECWM. ................ 157
Figure 100: Mass spectrum of 8,8'-DiFA (AT) extracted from TFA/80%-
ethanol Precipitate 3. ...................................................................................... 158
Figure 101: Mass spectrum of 5,5'-DiFA extracted from TFA/80%-ethanol
Precipitate 3. ................................................................................................... 159
Figure 102: Mass spectrum of 8-O-4'-DiFA extracted from TFA/80%-
ethanol Precipitate 3. ...................................................................................... 160
Figure 103: Splitting of 8-O-4'-DiFA to give m/z=193. ..................................... 160
Figure 104: Masses for triferulic and tetraferulic acids already discovered. .... 161
Figure 105: Accurate-mass spectrum of a triferulic acid from TFA/80%-
ethanol Precipitate 3. ...................................................................................... 161
Figure 106: Accurate-mass spectrum of a tetraferulic acid found in
TFA/80%-ethanol Precipitate 3. ...................................................................... 162
Figure 107: Accurate-mass spectrum of a tetraferulic acid found in
TFA/80%-ethanol Precipitate 3. ...................................................................... 162
Figure 108: Accurate-mass spectrum of a tetraferulic acid found in
TFA/80%-ethanol Precipitate 3. ...................................................................... 163
LIST OF FIGURES
xiii
Figure 109: Micrographs of Chinese water chestnut leaf-cell walls: a, leaf
septum, UV light, dark field; b, leaf septum in alkali, UV light, dark field; c,
leaf epidermis, UV light, bright field; d, leaf epidermis, UV light, dark field;
e, transverse section of leaf in alkali, bright field; f, transverse section of
leaf, UV light, dark field; g, thickened leaf septum in alkali, bright field; h,
thickened leaf septum in alkali, UV light, dark field. ........................................ 198
ACKNOWLEDGEMENTS
1
Acknowledgements:
The project and my living expenses were funded by a BBSRC (Biotechnology
and Biological Sciences Research Council) Committee grant. I would like to
thank Keith Waldron and Craig Faulds for the help and training they have given
me since the start of my PhD, and Adrian Parr for his advice as part of my
supervisory committee and help with the MS data interpretation.
Mary Parker used her considerable microscopy expertise to produce the
micrographs of autofluorescence in Chinese water chestnut cell walls as well as
training me to use the optical microscope. Fred Mellon ran my phenolic
extraction samples on the HPLC-MS machines and helped me to interpret the
data produced. Zara Merali did Klason lignin on my samples. Andrew Jay
trained me in the methylation methods and prepared the first batch of lithium
dimsyl reagent, as well as helping to carry out the methods on my samples.
John Eagles ran and patiently printed out the GC-MS data from all the
methylation linkage analyses. Katerina Kolenova shared with me her TLC
method for detection of sugars. Ian Colquhoun, Mark Philo and Laetitia Shintu
assisted me with the LC-SPE-NMR and associated data interpretation.
The numerous people who came and/or went in the lab in the last three years;
Andrew, Peter, Zara, Sam, Fiona, Graham and Giusy made the time fly by with
their gossip and jokes and Giovanna, who kept us all on our toes with her little
disasters.
Finally, I thank Mark for putting up with and encouraging me every step of the
way, even while writing his own thesis. I also thank my (soon to be) extended
family for not quite understanding what I’ve been doing for three years, but
supporting me every step of the way anyway.
INTRODUCTION
2
1 Introduction:
Cells are the basic building blocks of all multicellular organisms. They can
differentiate themselves to produce a vast array of specialised cells capable of
forming the tissues required for all the organs found in plants and animals.
1.1 Plant cells
The main differences between plant and animal cells are: plant cells have a
defined cell wall, primarily made up of cellulose; plant cells contain a vacuole in
addition to the cytoplasm; plant cells, that are capable of photosynthesis,
contain chloroplasts which contain the photosynthetic pigment chlorophyll
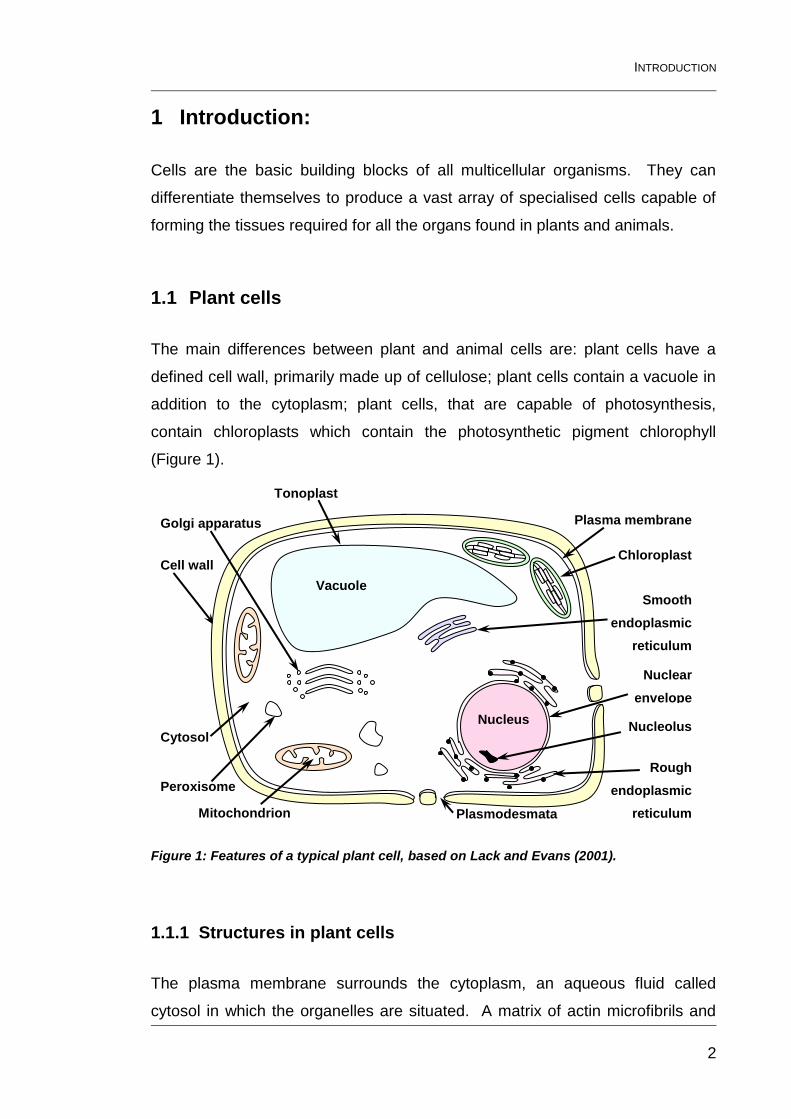
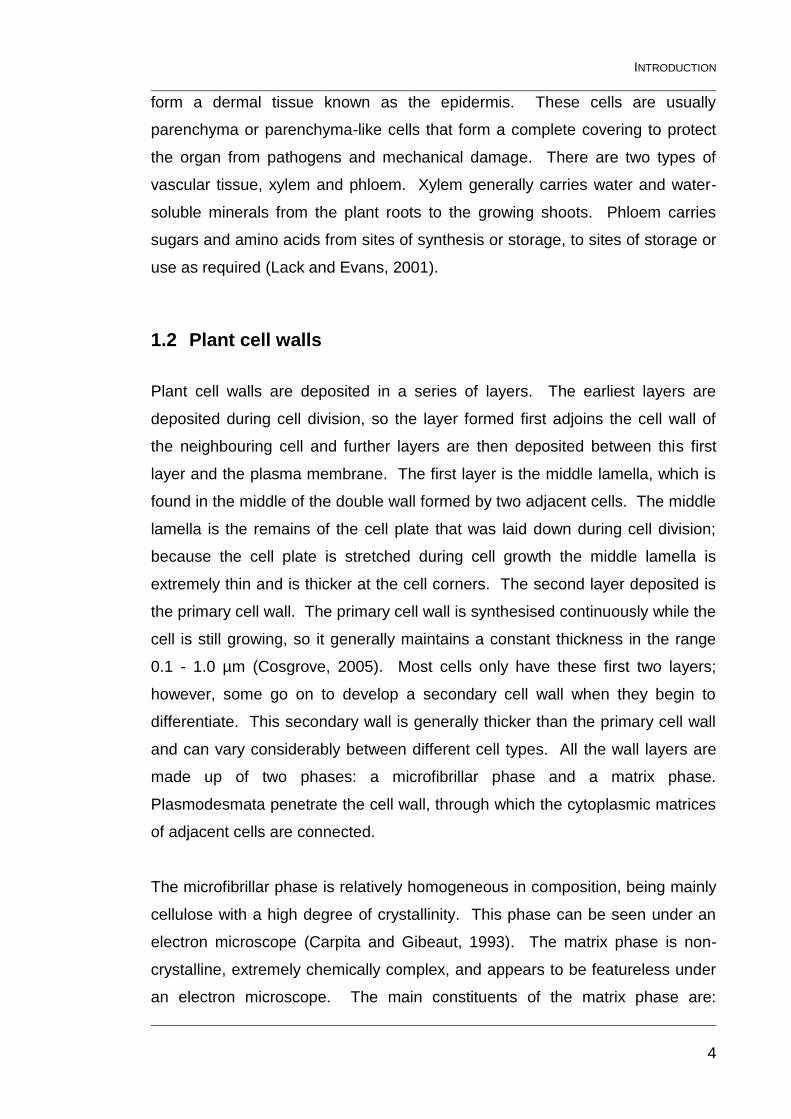
(Figure 1).
Figure 1: Features of a typical plant cell, based on Lack and Evans (2001).
1.1.1 Structures in plant cells
The plasma membrane surrounds the cytoplasm, an aqueous fluid called
cytosol in which the organelles are situated. A matrix of actin microfibrils and
Vacuole Smooth
endoplasmic
reticulum
Nuclear
envelope
Nucleus Nucleolus
Mitochondrion
Cytosol
Plasmodesmata
Rough
endoplasmic
reticulum
Plasma membrane
Chloroplast
Peroxisome
Cell wall
Golgi apparatus
Tonoplast
INTRODUCTION
3
tubulin microtubules facilitates the support and movement of the organelles
within the cell. The nucleus contains most of the cell’s genetic information in
the form of DNA and is surrounded by the nuclear envelope. The mitochondria
and chloroplasts also contain some genetic information. The vacuole is a
storage organelle that is also involved in osmotic regulation, particularly
maintaining cell turgor. It may occupy up to 90% of the cell volume, it contains
solutes dissolved in water, and is bounded by a membrane called the tonoplast.
The system of membranes found within the cell is termed the endomembrane
system, and this includes the nuclear envelope, the endoplasmic reticulum and
the Golgi apparatus. The endomembrane system is involved with the synthesis
and transport of materials within the cell. The chloroplasts (often found in the
leaves and stems only) contain the chlorophyll necessary for photosynthesis.
The mitochondria generate adenosine triphosphate (ATP) from stored food
reserves, which is then used in many of the metabolic processes of the cell
(Lack and Evans, 2001). The peroxisomes are small organelles that break
down organic molecules by oxidation, producing hydrogen peroxide in the
process. The hydrogen peroxide is then converted to water and oxygen. Plant
cell walls are described in depth in Section §1.2.
Plant tissues are made up from cells with a common function, either one type of
cell (simple tissues) or a collection of different cell types (complex tissues). The
three main types of plant tissue are: ground, dermal and vascular; and they
contain cells that may differ from the idealised version shown in Figure 1 to a
greater or lesser extent. The ground tissues contribute to the structural strength
and function of the plant. Parenchyma tissue is the most abundant type of
ground tissue in the plant, forming the bulk of the leaves, roots and stems. The
cells in parenchyma have thin flexible walls and large vacuoles, which often act
as storage for food reserves or water. Sclerenchyma tissue is made up of dead
cells, with lignified secondary walls, in organs that have completed their lateral
growth. These cells are either very long, thin fibres which occur singly or in
strands and bundles; or are irregularly shaped, often branched sclereids, which
also appear singly or in groups. It is small groups of sclereids scattered
throughout the parenchyma of pears (Pyrus) that gives pears their characteristic
gritty texture. The cells that make up the protective outer covering of an organ
INTRODUCTION
4
form a dermal tissue known as the epidermis. These cells are usually
parenchyma or parenchyma-like cells that form a complete covering to protect
the organ from pathogens and mechanical damage. There are two types of
vascular tissue, xylem and phloem. Xylem generally carries water and water-
soluble minerals from the plant roots to the growing shoots. Phloem carries
sugars and amino acids from sites of synthesis or storage, to sites of storage or
use as required (Lack and Evans, 2001).
1.2 Plant cell walls
Plant cell walls are deposited in a series of layers. The earliest layers are
deposited during cell division, so the layer formed first adjoins the cell wall of
the neighbouring cell and further layers are then deposited between this first
layer and the plasma membrane. The first layer is the middle lamella, which is
found in the middle of the double wall formed by two adjacent cells. The middle
lamella is the remains of the cell plate that was laid down during cell division;
because the cell plate is stretched during cell growth the middle lamella is
extremely thin and is thicker at the cell corners. The second layer deposited is
the primary cell wall. The primary cell wall is synthesised continuously while the
cell is still growing, so it generally maintains a constant thickness in the range
0.1 - 1.0 µm (Cosgrove, 2005). Most cells only have these first two layers;
however, some go on to develop a secondary cell wall when they begin to
differentiate. This secondary wall is generally thicker than the primary cell wall
and can vary considerably between different cell types. All the wall layers are
made up of two phases: a microfibrillar phase and a matrix phase.
Plasmodesmata penetrate the cell wall, through which the cytoplasmic matrices
of adjacent cells are connected.
The microfibrillar phase is relatively homogeneous in composition, being mainly
cellulose with a high degree of crystallinity. This phase can be seen under an
electron microscope (Carpita and Gibeaut, 1993). The matrix phase is non-
crystalline, extremely chemically complex, and appears to be featureless under
an electron microscope. The main constituents of the matrix phase are:
INTRODUCTION
5
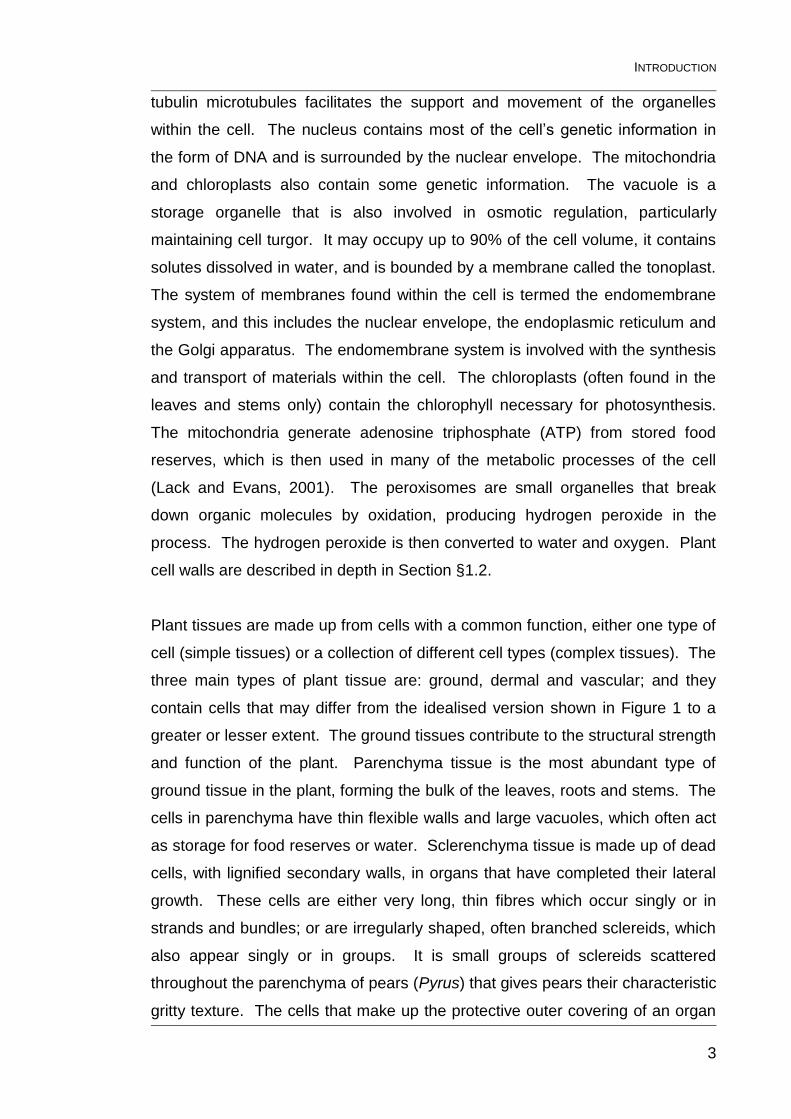
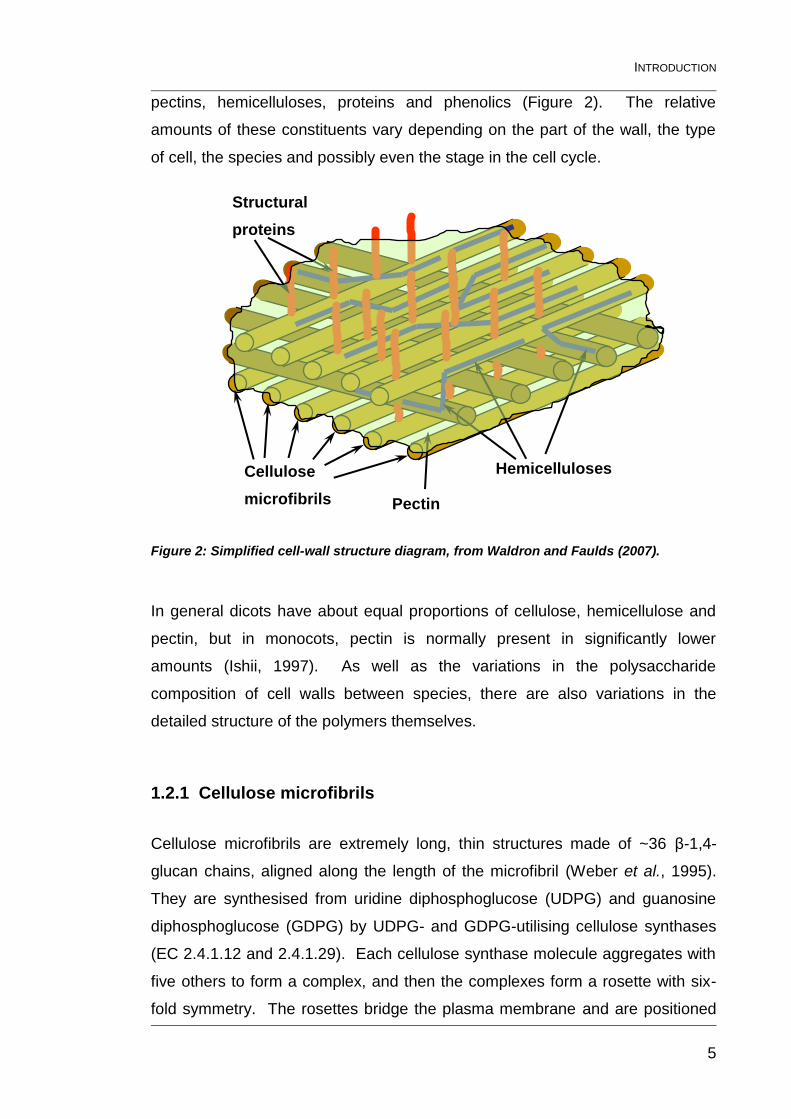
pectins, hemicelluloses, proteins and phenolics (Figure 2). The relative
amounts of these constituents vary depending on the part of the wall, the type
of cell, the species and possibly even the stage in the cell cycle.
Figure 2: Simplified cell-wall structure diagram, from Waldron and Faulds (2007).
In general dicots have about equal proportions of cellulose, hemicellulose and
pectin, but in monocots, pectin is normally present in significantly lower
amounts (Ishii, 1997). As well as the variations in the polysaccharide
composition of cell walls between species, there are also variations in the
detailed structure of the polymers themselves.
1.2.1 Cellulose microfibrils
Cellulose microfibrils are extremely long, thin structures made of ~36 β-1,4-
glucan chains, aligned along the length of the microfibril (Weber et al., 1995).
They are synthesised from uridine diphosphoglucose (UDPG) and guanosine
diphosphoglucose (GDPG) by UDPG- and GDPG-utilising cellulose synthases
(EC 2.4.1.12 and 2.4.1.29). Each cellulose synthase molecule aggregates with
five others to form a complex, and then the complexes form a rosette with six-
fold symmetry. The rosettes bridge the plasma membrane and are positioned
Pectin
Cellulose
microfibrils
Hemicelluloses
Structural
proteins
INTRODUCTION
6
to align with the underlying pattern of microtubules (Burk and Ye, 2002). The
cellulose synthase rosettes create a number of cellulose chains at the same
time, which then form the microfibrils (Lack and Evans, 2001). The cellulose
molecules form a (para) crystalline lattice held together with intramolecular and
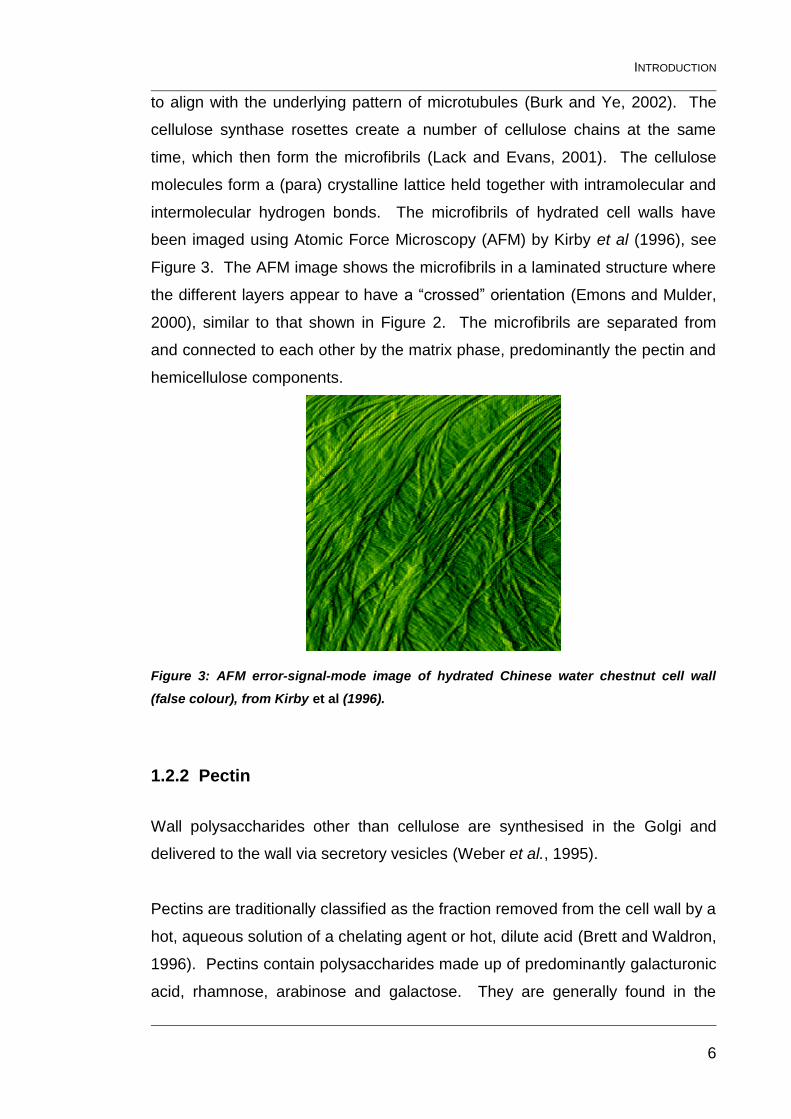
intermolecular hydrogen bonds. The microfibrils of hydrated cell walls have
been imaged using Atomic Force Microscopy (AFM) by Kirby et al (1996), see
Figure 3. The AFM image shows the microfibrils in a laminated structure where
the different layers appear to have a “crossed” orientation (Emons and Mulder,
2000), similar to that shown in Figure 2. The microfibrils are separated from
and connected to each other by the matrix phase, predominantly the pectin and
hemicellulose components.
Figure 3: AFM error-signal-mode image of hydrated Chinese water chestnut cell wall
(false colour), from Kirby et al (1996).
1.2.2 Pectin
Wall polysaccharides other than cellulose are synthesised in the Golgi and
delivered to the wall via secretory vesicles (Weber et al., 1995).
Pectins are traditionally classified as the fraction removed from the cell wall by a
hot, aqueous solution of a chelating agent or hot, dilute acid (Brett and Waldron,
1996). Pectins contain polysaccharides made up of predominantly galacturonic
acid, rhamnose, arabinose and galactose. They are generally found in the
INTRODUCTION
7
middle lamella and primary walls of dicotyledonous plants and in smaller
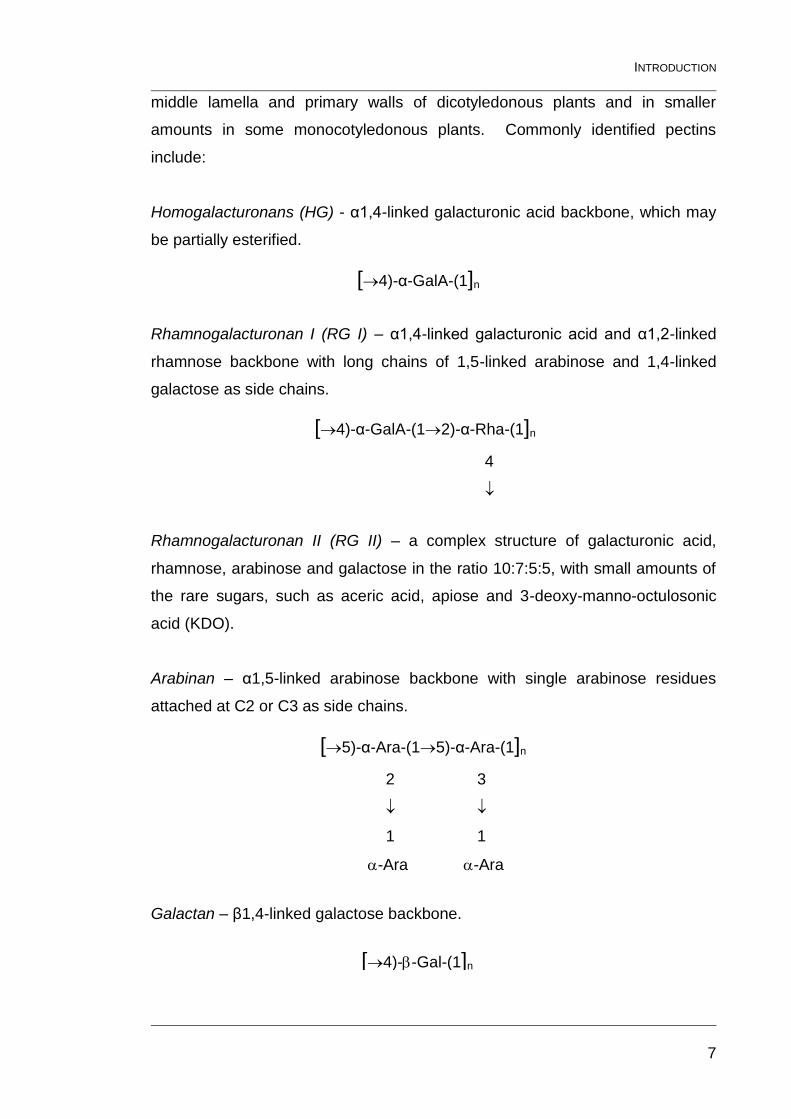
amounts in some monocotyledonous plants. Commonly identified pectins
include:
Homogalacturonans (HG) - α1,4-linked galacturonic acid backbone, which may
be partially esterified.
Rhamnogalacturonan I (RG I) – α1,4-linked galacturonic acid and α1,2-linked
rhamnose backbone with long chains of 1,5-linked arabinose and 1,4-linked
galactose as side chains.
Rhamnogalacturonan II (RG II) – a complex structure of galacturonic acid,
rhamnose, arabinose and galactose in the ratio 10:7:5:5, with small amounts of
the rare sugars, such as aceric acid, apiose and 3-deoxy-manno-octulosonic
acid (KDO).
Arabinan – α1,5-linked arabinose backbone with single arabinose residues
attached at C2 or C3 as side chains.
Galactan – β1,4-linked galactose backbone.
[4)-α-GalA-(1]n
[4)-α-GalA-(12)-α-Rha-(1]n
4
[5)-α-Ara-(15)-α-Ara-(1]n
2 3
1 1
-Ara -Ara
[4)--Gal-(1]n
INTRODUCTION
8
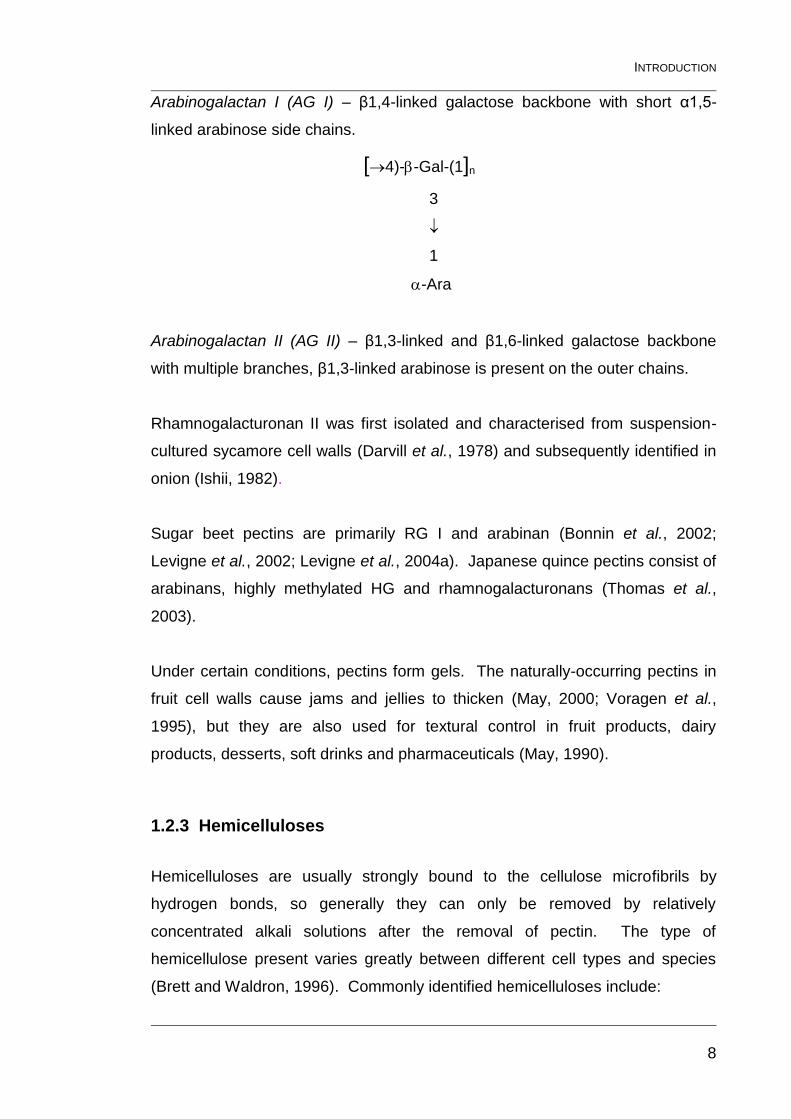
Arabinogalactan I (AG I) – β1,4-linked galactose backbone with short α1,5-
linked arabinose side chains.
Arabinogalactan II (AG II) – β1,3-linked and β1,6-linked galactose backbone
with multiple branches, β1,3-linked arabinose is present on the outer chains.
Rhamnogalacturonan II was first isolated and characterised from suspension-
cultured sycamore cell walls (Darvill et al., 1978) and subsequently identified in
onion (Ishii, 1982).
Sugar beet pectins are primarily RG I and arabinan (Bonnin et al., 2002;
Levigne et al., 2002; Levigne et al., 2004a). Japanese quince pectins consist of
arabinans, highly methylated HG and rhamnogalacturonans (Thomas et al.,
2003).
Under certain conditions, pectins form gels. The naturally-occurring pectins in
fruit cell walls cause jams and jellies to thicken (May, 2000; Voragen et al.,
1995), but they are also used for textural control in fruit products, dairy
products, desserts, soft drinks and pharmaceuticals (May, 1990).
1.2.3 Hemicelluloses
Hemicelluloses are usually strongly bound to the cellulose microfibrils by
hydrogen bonds, so generally they can only be removed by relatively
concentrated alkali solutions after the removal of pectin. The type of
hemicellulose present varies greatly between different cell types and species
(Brett and Waldron, 1996). Commonly identified hemicelluloses include:
[4)--Gal-(1]n
3
1
-Ara
INTRODUCTION
9
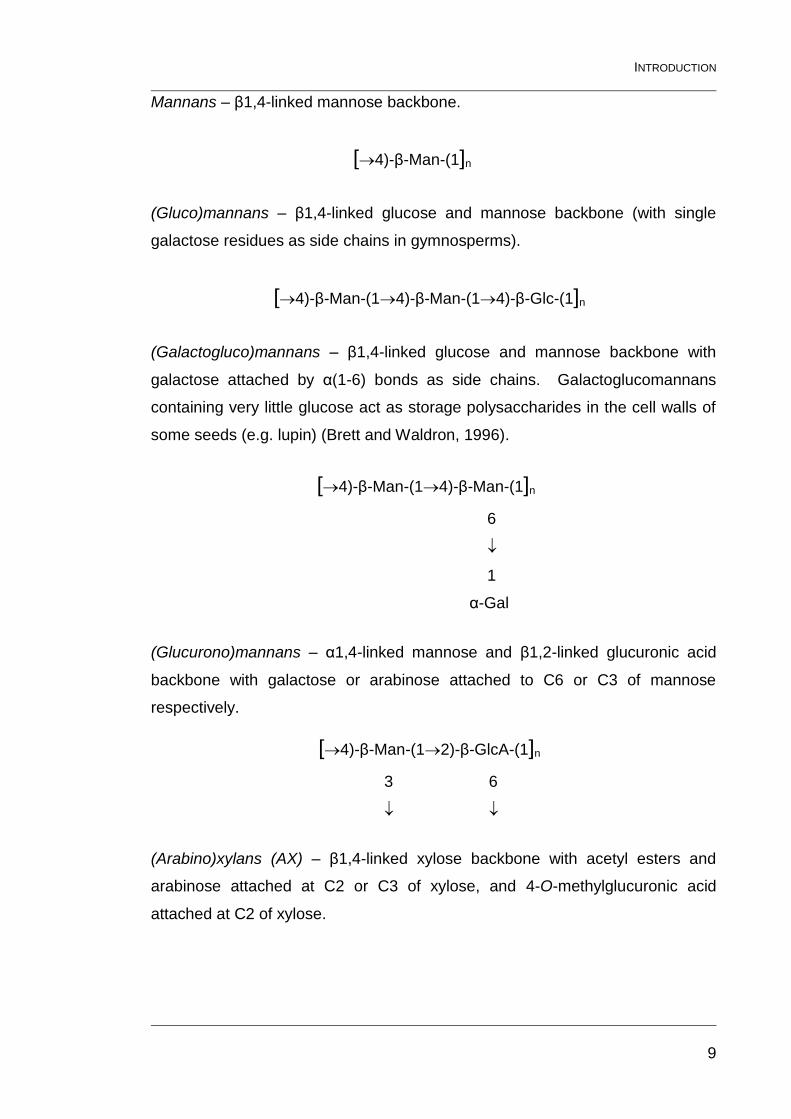
Mannans – β1,4-linked mannose backbone.
(Gluco)mannans – β1,4-linked glucose and mannose backbone (with single
galactose residues as side chains in gymnosperms).
(Galactogluco)mannans – β1,4-linked glucose and mannose backbone with
galactose attached by α(1-6) bonds as side chains. Galactoglucomannans
containing very little glucose act as storage polysaccharides in the cell walls of
some seeds (e.g. lupin) (Brett and Waldron, 1996).
(Glucurono)mannans – α1,4-linked mannose and β1,2-linked glucuronic acid
backbone with galactose or arabinose attached to C6 or C3 of mannose
respectively.
(Arabino)xylans (AX) – β1,4-linked xylose backbone with acetyl esters and
arabinose attached at C2 or C3 of xylose, and 4-O-methylglucuronic acid
attached at C2 of xylose.
[4)-β-Man-(1]n
[4)-β-Man-(14)-β-Man-(1]n
6
1
α-Gal
[4)-β-Man-(12)-β-GlcA-(1]n
3 6
[4)-β-Man-(14)-β-Man-(14)-β-Glc-(1]n
INTRODUCTION
10
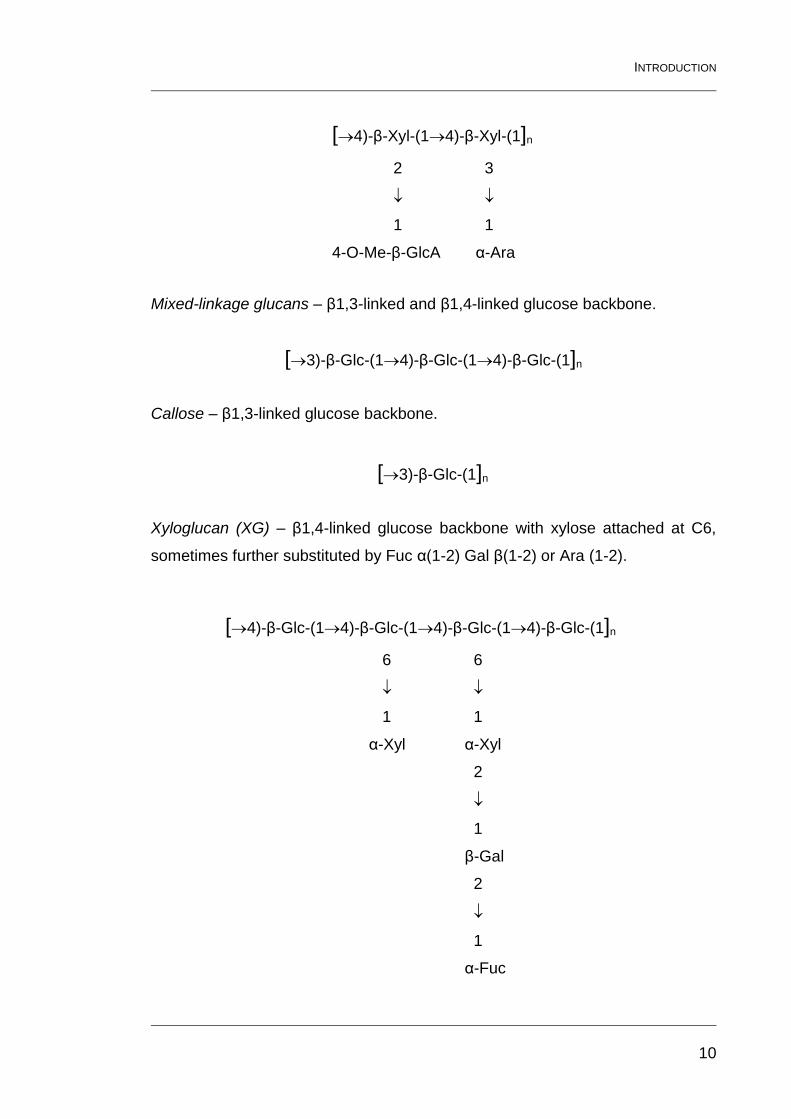
Mixed-linkage glucans – β1,3-linked and β1,4-linked glucose backbone.
Callose – β1,3-linked glucose backbone.
Xyloglucan (XG) – β1,4-linked glucose backbone with xylose attached at C6,
sometimes further substituted by Fuc α(1-2) Gal β(1-2) or Ara (1-2).
[4)-β-Xyl-(14)-β-Xyl-(1]n
2 3
1 1
4-O-Me-β-GlcA α-Ara
[4)-β-Glc-(14)-β-Glc-(14)-β-Glc-(14)-β-Glc-(1]n
6 6
1 1
α-Xyl α-Xyl
2
1
β-Gal
2
1
α-Fuc
[3)-β-Glc-(14)-β-Glc-(14)-β-Glc-(1]n
[3)-β-Glc-(1]n
INTRODUCTION
11
Xyloglucan is the major hemicellulose of dicot primary walls, at ~20% of the
primary cell wall, whereas in monocots it is a relatively minor component at ~1-
5% (Fry, 1988). Redgwell and Selvendran (1986) found xyloglucan in onion,
which showed structural features in common with the xyloglucans of
dicotyledonous plants. Carrot cell wall hemicelluloses consist of xylan, mannan
and xyloglucan (Massiot et al., 1988). Maize cell wall hemicelluloses consist of
glucuronoarabinoxylan, mixed-linkage glucan, xyloglucan and glucomannan
(Carpita et al., 2001).
1.2.4 Phenolic compounds
Phenolics are a group of compounds which have one or more hydroxyl groups
directly attached to a benzene ring (Shahidi and Naczk, 2004). They can be
divided into different categories dependent on the number of phenol subunits
they contain (Robbins, 2003) and further separated according to their structure
(Liu, 2004):
Simple phenolics – one phenol subunit
o Hydroxybenzoic acids and aldehydes (Gallic acid, vanillin etc)
o Hydroxycinnamic acids (Ferulic, caffeic, sinapic and p-coumaric
acid)
Polyphenols – at least two phenol subunits, which are further split into:
o Flavonoids (Figure 4) – two phenol subunits
Flavonols (Quercetin, Kaempferol etc)
Flavones (Apigenin, Chrysin, Luteolin)
Flavanols (Catechin, Epicatechin etc)
Flavanones (Eriodictyol, Hesperitin, Naringenin)
Anthocyanidins (Cyanidin, Pelargonidin, Delphinidin etc)
Isoflavonoids (Genistein, Daidzein etc)
o Stilbenes (Resveratrol etc)
o Coumarins (Umbelliferone etc)
o Tannins – three or more phenol subunits
INTRODUCTION
12
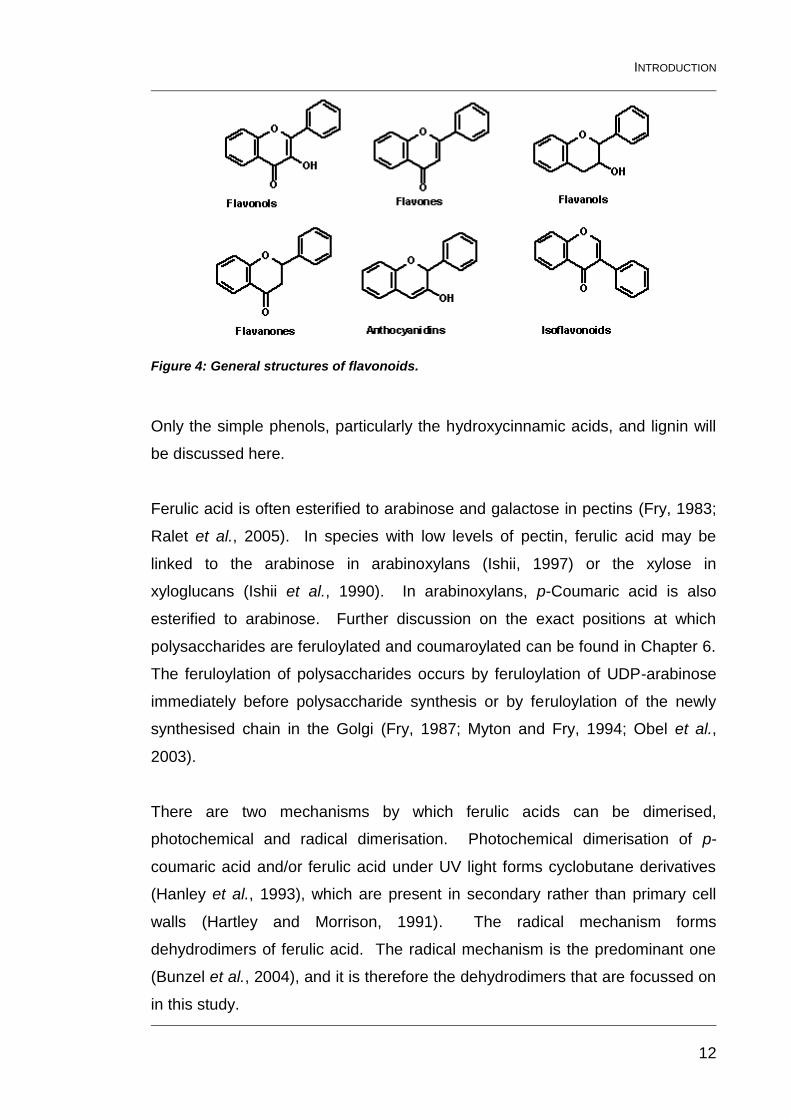
Figure 4: General structures of flavonoids.
Only the simple phenols, particularly the hydroxycinnamic acids, and lignin will
be discussed here.
Ferulic acid is often esterified to arabinose and galactose in pectins (Fry, 1983;
Ralet et al., 2005). In species with low levels of pectin, ferulic acid may be
linked to the arabinose in arabinoxylans (Ishii, 1997) or the xylose in
xyloglucans (Ishii et al., 1990). In arabinoxylans, p-Coumaric acid is also
esterified to arabinose. Further discussion on the exact positions at which
polysaccharides are feruloylated and coumaroylated can be found in Chapter 6.
The feruloylation of polysaccharides occurs by feruloylation of UDP-arabinose
immediately before polysaccharide synthesis or by feruloylation of the newly
synthesised chain in the Golgi (Fry, 1987; Myton and Fry, 1994; Obel et al.,
2003).
There are two mechanisms by which ferulic acids can be dimerised,
photochemical and radical dimerisation. Photochemical dimerisation of p-
coumaric acid and/or ferulic acid under UV light forms cyclobutane derivatives
(Hanley et al., 1993), which are present in secondary rather than primary cell
walls (Hartley and Morrison, 1991). The radical mechanism forms
dehydrodimers of ferulic acid. The radical mechanism is the predominant one
(Bunzel et al., 2004), and it is therefore the dehydrodimers that are focussed on
in this study.
INTRODUCTION
13
The simple phenolics and precursors for lignin are produced via the
phenylpropanoid pathway from phenylalanine and tyrosine. Ferulic acid is
generally the most abundant simple phenolic in cell walls.
Geissmann and Neukom (1971) showed that, in the presence of peroxidase
activity and hydrogen peroxide, two ferulic acid units (esterified to
polysaccharides) form a covalent cross-link.
Initially the 5,5’-DiFA was the only ferulic acid dimer found (Hartley and Jones,
1976), but subsequent studies suggested that the radical coupling of ferulic acid
should produce a whole range of diferulic acids, with the 8,5’-DiFA (BF)
predominating (Ralph et al., 1992), and this was shown to be the case by Ralph
et al (1994). The 8-O-4’-DiFA tends to predominate in grasses (Ralph et al.,
1994), but the predominant dimer is 5,5’-DiFA in barley bran (Renger and
Steinhart, 2000), 8-O-4’-DiFA in chufa (Parker et al., 2000) and 8,5’-DiFA (BF)
in sugar beet (Micard et al., 1997a). The diferulic acids found in plant cell walls,
including the less frequently reported 4-O-5’-DiFA (Bunzel et al., 2000),
8,5’-DiFA (decarboxylated) and 8,8’-DiFA (tetrahydrofuran) (Grabber et al.,
2000), are shown in Figure 5. The 8,5’-DiFA (DC) has probably been
overlooked in MS-based studies as it is not a true dimer, having lost CO2, and
hence has a molecular weight 44 units lower than the usual 386 at 342. The
8,8’-DiFA (THF) may also have been missed as it incorporates an additional
water molecule after radical coupling (Bunzel et al., 2004), and hence has a
molecular weight of 404.
Dimerisation of ferulic acid esterified to polysaccharides occurs mostly in the
protoplasm of suspension-cultured maize cells, but may occur in the cell wall
when H2O2 levels increase due to pathogenesis (Fry et al., 2000). In wheat cell
suspension cultures it appears that only the 8,5’-DiFA is formed
intraprotoplasmically with the other dimers being formed in the cell wall (Obel et
al., 2003).
INTRODUCTION
14
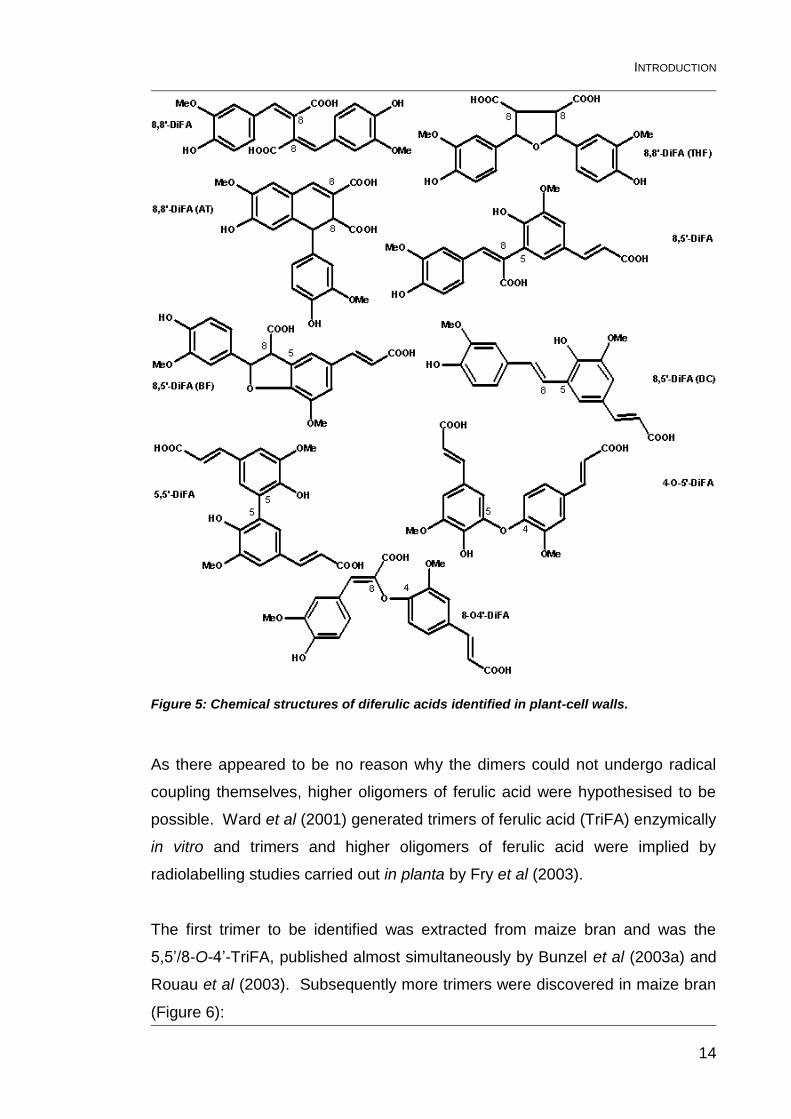
Figure 5: Chemical structures of diferulic acids identified in plant-cell walls.
As there appeared to be no reason why the dimers could not undergo radical
coupling themselves, higher oligomers of ferulic acid were hypothesised to be
possible. Ward et al (2001) generated trimers of ferulic acid (TriFA) enzymically
in vitro and trimers and higher oligomers of ferulic acid were implied by
radiolabelling studies carried out in planta by Fry et al (2003).
The first trimer to be identified was extracted from maize bran and was the
5,5’/8-O-4’-TriFA, published almost simultaneously by Bunzel et al (2003a) and
Rouau et al (2003). Subsequently more trimers were discovered in maize bran
(Figure 6):
INTRODUCTION
15
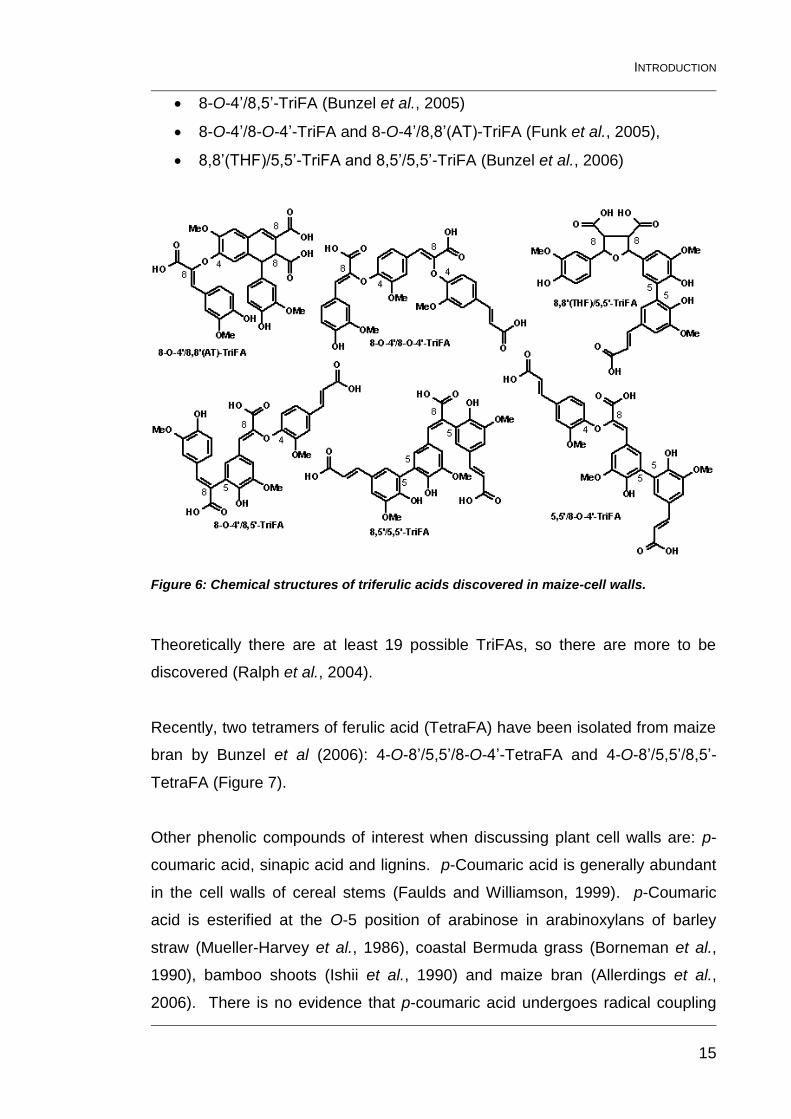
8-O-4’/8,5’-TriFA (Bunzel et al., 2005)
8-O-4’/8-O-4’-TriFA and 8-O-4’/8,8’(AT)-TriFA (Funk et al., 2005),
8,8’(THF)/5,5’-TriFA and 8,5’/5,5’-TriFA (Bunzel et al., 2006)
Figure 6: Chemical structures of triferulic acids discovered in maize-cell walls.
Theoretically there are at least 19 possible TriFAs, so there are more to be
discovered (Ralph et al., 2004).
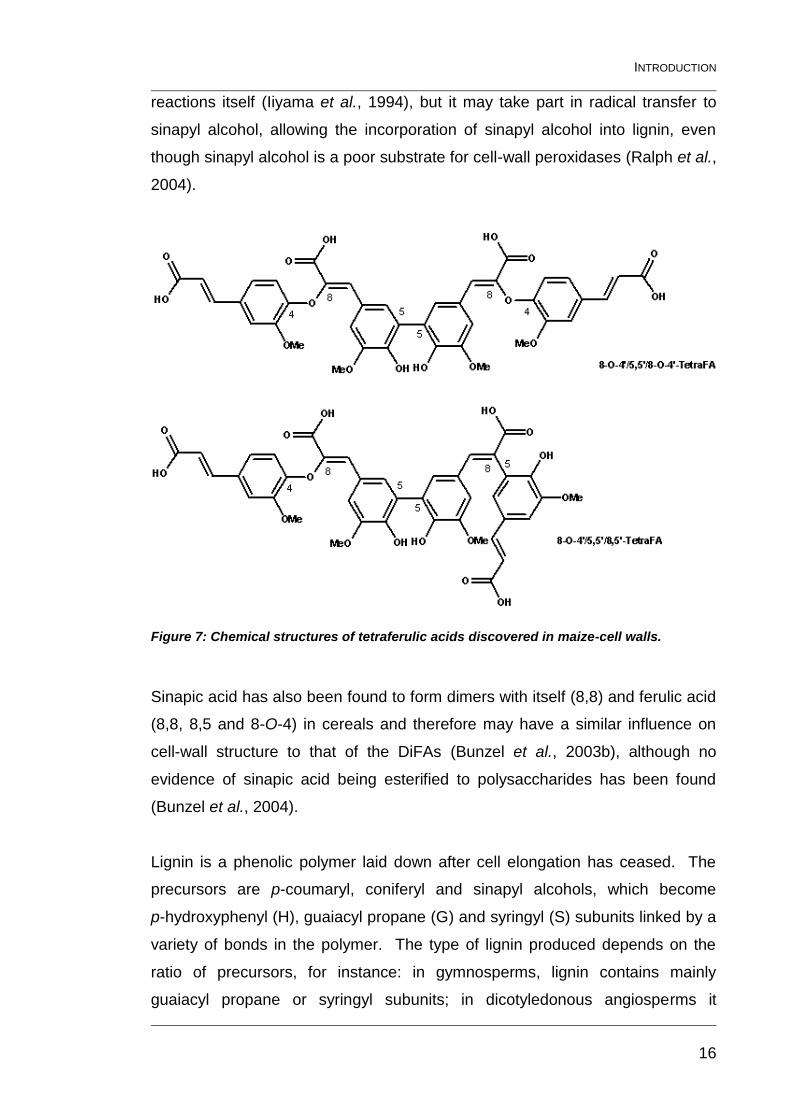
Recently, two tetramers of ferulic acid (TetraFA) have been isolated from maize
bran by Bunzel et al (2006): 4-O-8’/5,5’/8-O-4’-TetraFA and 4-O-8’/5,5’/8,5’-
TetraFA (Figure 7).
Other phenolic compounds of interest when discussing plant cell walls are: p-
coumaric acid, sinapic acid and lignins. p-Coumaric acid is generally abundant
in the cell walls of cereal stems (Faulds and Williamson, 1999). p-Coumaric
acid is esterified at the O-5 position of arabinose in arabinoxylans of barley
straw (Mueller-Harvey et al., 1986), coastal Bermuda grass (Borneman et al.,
1990), bamboo shoots (Ishii et al., 1990) and maize bran (Allerdings et al.,
2006). There is no evidence that p-coumaric acid undergoes radical coupling
INTRODUCTION
16
reactions itself (Iiyama et al., 1994), but it may take part in radical transfer to
sinapyl alcohol, allowing the incorporation of sinapyl alcohol into lignin, even
though sinapyl alcohol is a poor substrate for cell-wall peroxidases (Ralph et al.,
2004).
Figure 7: Chemical structures of tetraferulic acids discovered in maize-cell walls.
Sinapic acid has also been found to form dimers with itself (8,8) and ferulic acid
(8,8, 8,5 and 8-O-4) in cereals and therefore may have a similar influence on
cell-wall structure to that of the DiFAs (Bunzel et al., 2003b), although no
evidence of sinapic acid being esterified to polysaccharides has been found
(Bunzel et al., 2004).
Lignin is a phenolic polymer laid down after cell elongation has ceased. The
precursors are p-coumaryl, coniferyl and sinapyl alcohols, which become
p-hydroxyphenyl (H), guaiacyl propane (G) and syringyl (S) subunits linked by a
variety of bonds in the polymer. The type of lignin produced depends on the
ratio of precursors, for instance: in gymnosperms, lignin contains mainly
guaiacyl propane or syringyl subunits; in dicotyledonous angiosperms it
INTRODUCTION
17
contains guaiacyl propane and syringyl subunits; and in monocotyledonous
angiosperms, all three subunits are present (Seigler, 1998). The polymerisation
of lignin is a radical-coupling process mediated by peroxidases; as this is a
purely chemical process which proteins or enzymes are not controlling, there is
no defined primary structure to lignin (Ralph et al., 2004). Growth ceases in
fully lignified cells, and as the lignin forms an effective barrier to nutrients and
pathogens, lignified cells soon die, but they provide good protection to the rest
of the plant and provide structural support. Primary cell walls do not contain
lignin, but secondary cell walls contain 5–25% lignin (Bidlack et al., 1992).
Monomeric ferulic acid etherified to lignin is also esterified to arabinoxylans in
wheat internodes, thus proving that ferulates cross-link lignin and
polysaccharides (Iiyama et al., 1990). In contrast, p-coumaric acid does not
cross-link lignin and polysaccharides (Iiyama et al., 1994). The interactions
between ferulic, diferulic and p-coumaric acids and lignin were thought to
prevent cell-wall elongation (Fry, 1979), but cessation of growth in tall fescue
leaf blades and maize internodes occurs before the maximum accumulation of
ferulic and p-coumaric acid. In fact, the accretion of ferulate, diferulates and
p-coumarate continued after growth ended, continuing into secondary wall
formation in tall fescue leaf blades and maize internodes (Iiyama et al., 1994;
MacAdam and Grabber, 2002). Esters of ferulic acid are etherified to lignin
after wall growth ceases and therefore this process does not affect cell-wall
elongation (Iiyama et al., 1994).
1.2.5 Proteins
The cell walls of Arabidopsis are believed to contain at least 500 proteins, with
the possibility that there are up to 2000 (Jamet et al., 2006). Most of the cell
wall proteins are glycosylated (Brett and Waldron, 1996). The majority also
contain an unusual amino acid, hydroxyproline, which is not found in most
protoplasmic proteins. The role of proteins in the cell wall is difficult to study
due to problems in extracting them. The two main groups are structural
proteins and cell-wall enzymes (Jamet et al., 2006), the latter of which will be
INTRODUCTION
18
discussed in Section §1.2.6. Type I walls contain between 1 and 20% protein,
dependent on the specific tissue, whereas Type II walls contain ~0.5% (Fry,
1988).
Structural proteins:
Arabinogalactan proteins (AGP) – 90-98% sugar
Extensin – ~50% sugar
Glycine-rich proteins – ~70% glycine in a repetitive primary
structure; important in plant vascular systems and wound healing
Proline-rich proteins – 0-20% sugar; contain proline-proline amino
acid repeats; involved in plant development and nodule formation
Proline-rich AGP-like protein
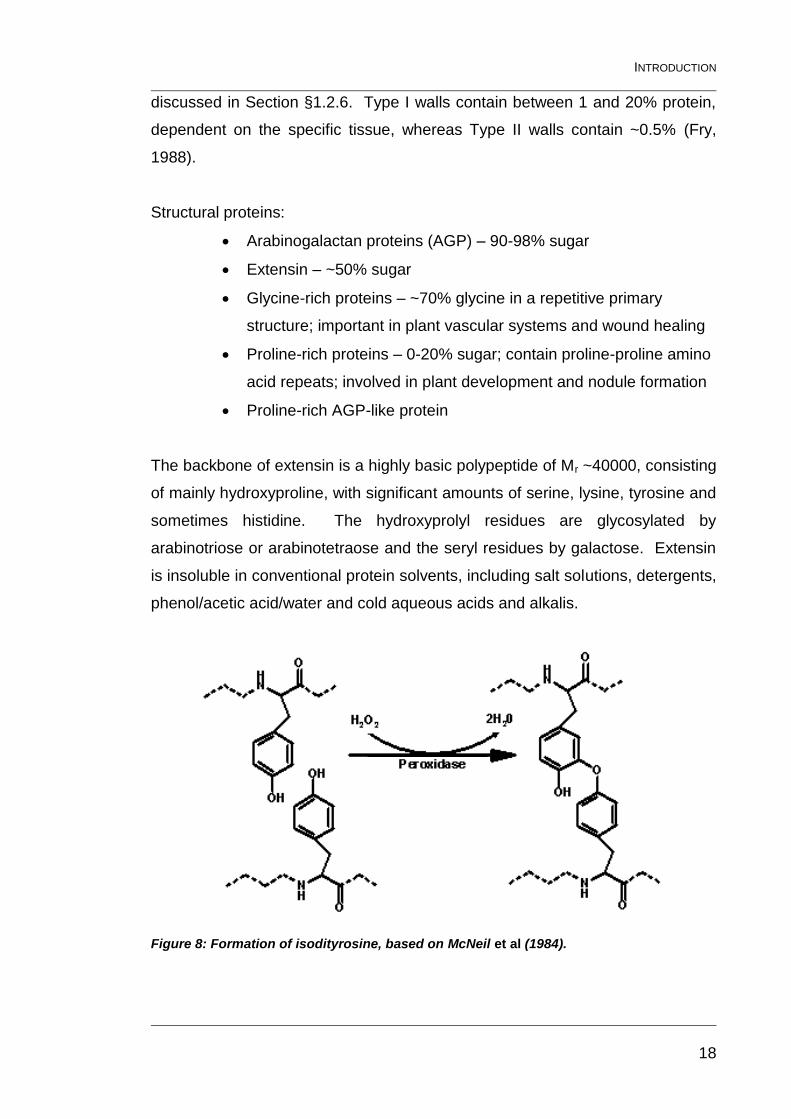
The backbone of extensin is a highly basic polypeptide of Mr ~40000, consisting
of mainly hydroxyproline, with significant amounts of serine, lysine, tyrosine and
sometimes histidine. The hydroxyprolyl residues are glycosylated by
arabinotriose or arabinotetraose and the seryl residues by galactose. Extensin
is insoluble in conventional protein solvents, including salt solutions, detergents,
phenol/acetic acid/water and cold aqueous acids and alkalis.
Figure 8: Formation of isodityrosine, based on McNeil et al (1984).
INTRODUCTION
19
The extensin units covalently attach to the protein backbones of other
proteins/extensins to form an interlocking network, as shown by Mort and
Lamport (1977) who used hydrogen fluoride to remove all the cell wall
carbohydrate, including that covalently attached to extensin, and still did not
release extensin. The linkage proposed for the covalent linkage between
extensin molecules is isodityrosine (Figure 8), as mildly acidified NaClO2
solubilises extensin by breaking phenolic linkages, but not peptide bonds
(McNeil et al., 1984).
Arabinogalactan proteins are 2-10% protein; the protein is acidic and contains
hydroxyproline, serine, alanine and glycine amino acids. The carbohydrate
chains contain galactose, arabinose, rhamnose, mannose, galacturonic and/or
glucuronic acids, and have a relatively high degree of polymerization (McNeil et
al., 1984). They are involved in cell-cell interactions and plant defence.
Expansins are pH-dependent wall-loosening proteins; they are activated as the
wall becomes more acidic. Expansins are capable of wall loosening without the
assistance of other enzymes or proteins and the addition of exogenous
expansin rapidly stimulates cell growth. Expansin treatment does not reduce
the strength of the cell wall, even while it is expanding. No enzymic activity that
can account for its action on the wall has been found in expansins, so it is
believed to act by disrupting the non-covalent bonds between wall
polysaccharides. Expansin action enhances cellulose degradation by cellulases
(Cosgrove, 2005).
1.2.6 Enzymes
There are a wide range of enzymes in the cell wall; however, their function in
the wall is still to be elucidated in some cases:
Glycoside hydrolases (EC category 3.2.1)
o Cellulase (EC 3.2.1.4)
o Polygalacturonase (EC 3.2.1.15)
INTRODUCTION
20
o β-glucosidase (EC 3.2.1.21)
o β-galactosidase (EC 3.2.1.23)
o β-xylosidase (EC 3.2.1.37 or 3.2.1.32)
o α-galactosidase (EC 3.2.1.22)
o xylanase (EC 3.2.1.8)
Esterases and lyases (EC categories 3.1 and 4)
o Pectin methylesterase (EC 3.1.1.11)
o Acid phosphatase (EC 3.1.3.2)
o Feruloyl esterase (EC 3.1.1.73)
o Acetyl esterase (EC 3.1.1.72)
Transglycosylases
o Xyloglucan:xyloglucosyl transferase (EC 2.4.1.207)
Peroxidases (EC 1.11.1.7)
Malate dehydrogenase (1.1.1.37)
Proteases (EC category 3.4)
Xyloglucan:xyloglucosyl transferase, otherwise known as xyloglucan
endotransglycosylase (XET) or xyloglucan endotransglucosylase/hydrolase
(XTH), has some transglycosylase activity in addition to hydrolase activity,
allowing it to sever the xyloglucan backbone and connect it to either another
xyloglucan chain or water (Cosgrove, 1999; Takeda et al., 2002).
Cellulase may cause wall loosening by releasing xyloglucans trapped in the
non-crystalline regions of cellulose microfibrils (Cosgrove, 2005)
Peroxidases produce the H2O2 required for the oxidative coupling of cell wall
components. They produce the H2O2 required to dimerise ferulic acid (linking
polysaccharide chains), and tyrosine (linking extensins). They require Ca2+ and
are inhibited by low pH (Fry, 1986). Peroxidase extracted from horseradish is
commonly used in experiments when the formation of ferulic acid dimers (and
higher oligomers) is desired (Oudgenoeg et al., 2002).
INTRODUCTION
21
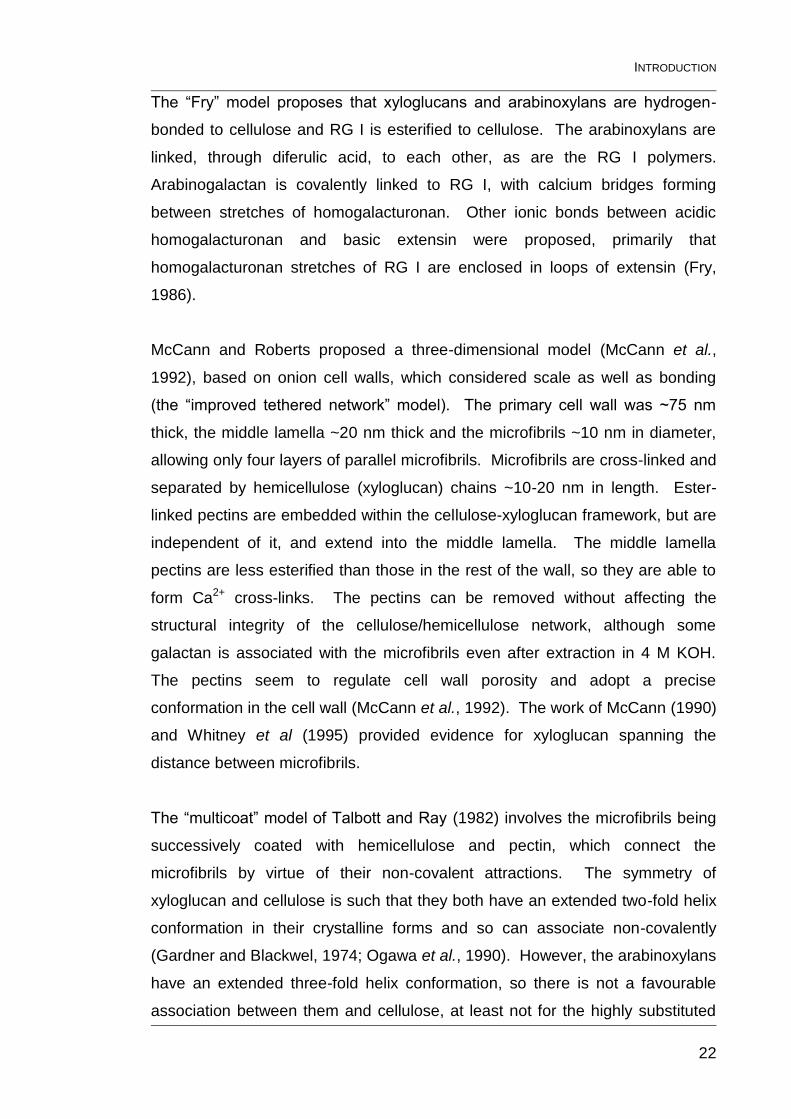
1.2.7 Structural relationships between polysaccharides in primary cell walls
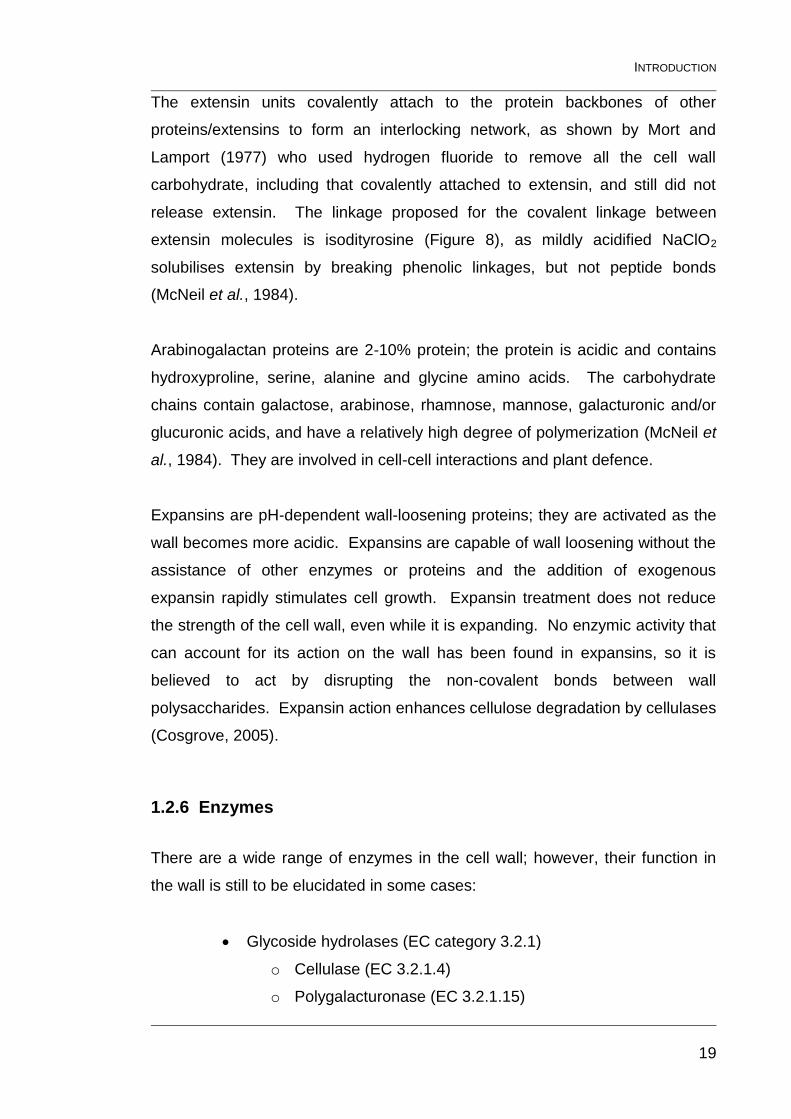
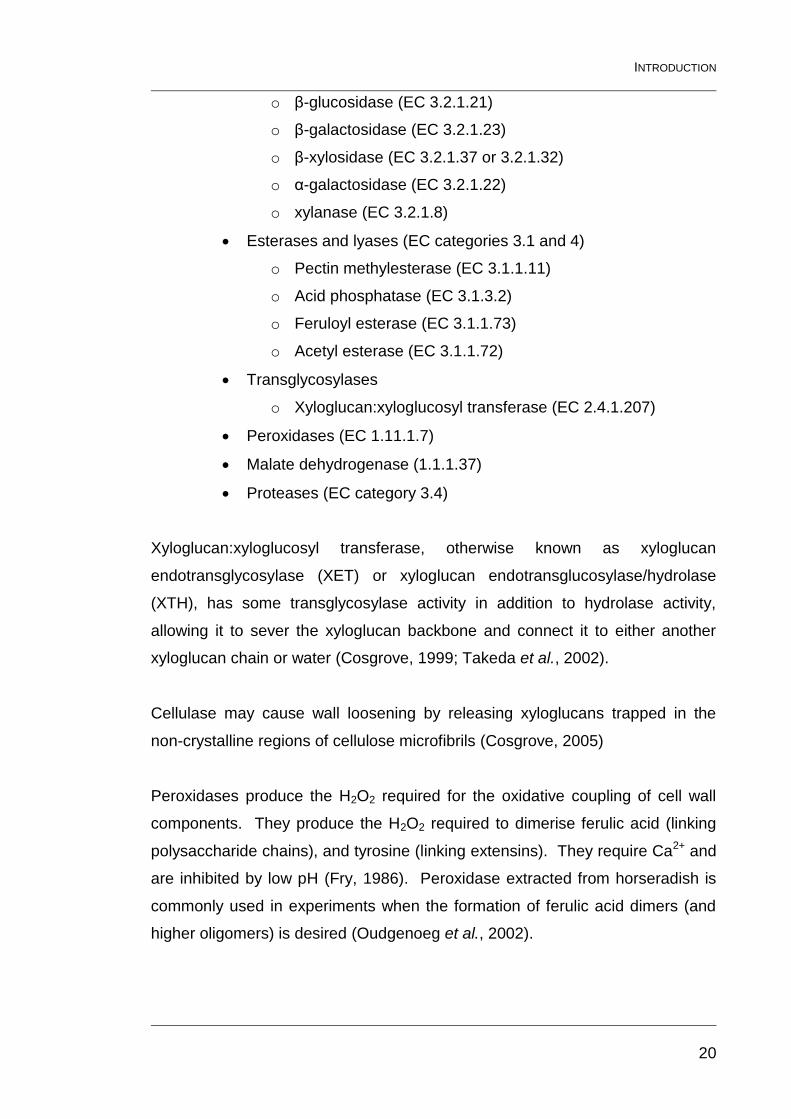
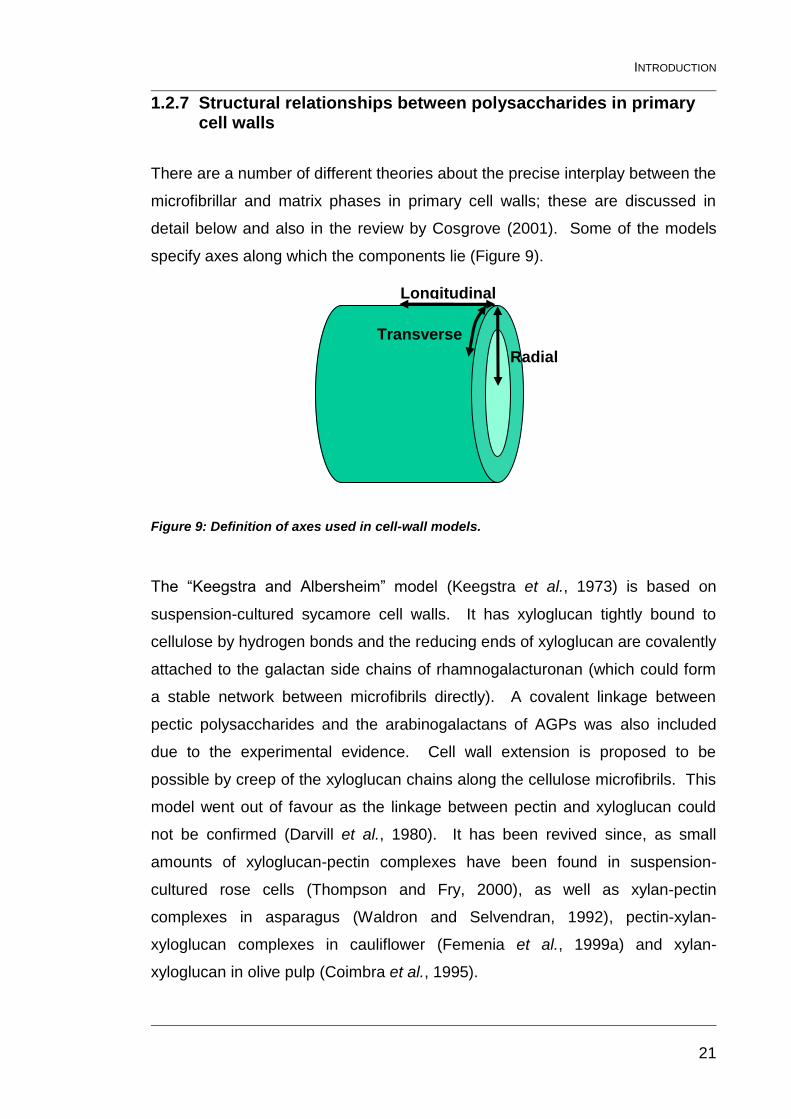
There are a number of different theories about the precise interplay between the
microfibrillar and matrix phases in primary cell walls; these are discussed in
detail below and also in the review by Cosgrove (2001). Some of the models
specify axes along which the components lie (Figure 9).
Figure 9: Definition of axes used in cell-wall models.
The “Keegstra and Albersheim” model (Keegstra et al., 1973) is based on
suspension-cultured sycamore cell walls. It has xyloglucan tightly bound to
cellulose by hydrogen bonds and the reducing ends of xyloglucan are covalently
attached to the galactan side chains of rhamnogalacturonan (which could form
a stable network between microfibrils directly). A covalent linkage between
pectic polysaccharides and the arabinogalactans of AGPs was also included
due to the experimental evidence. Cell wall extension is proposed to be
possible by creep of the xyloglucan chains along the cellulose microfibrils. This
model went out of favour as the linkage between pectin and xyloglucan could
not be confirmed (Darvill et al., 1980). It has been revived since, as small
amounts of xyloglucan-pectin complexes have been found in suspension-
cultured rose cells (Thompson and Fry, 2000), as well as xylan-pectin
complexes in asparagus (Waldron and Selvendran, 1992), pectin-xylan-
xyloglucan complexes in cauliflower (Femenia et al., 1999a) and xylan-
xyloglucan in olive pulp (Coimbra et al., 1995).
Longitudinal
Transverse
Radial
INTRODUCTION
22
The “Fry” model proposes that xyloglucans and arabinoxylans are hydrogen-
bonded to cellulose and RG I is esterified to cellulose. The arabinoxylans are
linked, through diferulic acid, to each other, as are the RG I polymers.
Arabinogalactan is covalently linked to RG I, with calcium bridges forming
between stretches of homogalacturonan. Other ionic bonds between acidic
homogalacturonan and basic extensin were proposed, primarily that
homogalacturonan stretches of RG I are enclosed in loops of extensin (Fry,
1986).
McCann and Roberts proposed a three-dimensional model (McCann et al.,
1992), based on onion cell walls, which considered scale as well as bonding
(the “improved tethered network” model). The primary cell wall was ~75 nm
thick, the middle lamella ~20 nm thick and the microfibrils ~10 nm in diameter,
allowing only four layers of parallel microfibrils. Microfibrils are cross-linked and
separated by hemicellulose (xyloglucan) chains ~10-20 nm in length. Ester-
linked pectins are embedded within the cellulose-xyloglucan framework, but are
independent of it, and extend into the middle lamella. The middle lamella
pectins are less esterified than those in the rest of the wall, so they are able to
form Ca2+ cross-links. The pectins can be removed without affecting the
structural integrity of the cellulose/hemicellulose network, although some
galactan is associated with the microfibrils even after extraction in 4 M KOH.
The pectins seem to regulate cell wall porosity and adopt a precise
conformation in the cell wall (McCann et al., 1992). The work of McCann (1990)
and Whitney et al (1995) provided evidence for xyloglucan spanning the
distance between microfibrils.
The “multicoat” model of Talbott and Ray (1982) involves the microfibrils being
successively coated with hemicellulose and pectin, which connect the
microfibrils by virtue of their non-covalent attractions. The symmetry of
xyloglucan and cellulose is such that they both have an extended two-fold helix
conformation in their crystalline forms and so can associate non-covalently
(Gardner and Blackwel, 1974; Ogawa et al., 1990). However, the arabinoxylans
have an extended three-fold helix conformation, so there is not a favourable
association between them and cellulose, at least not for the highly substituted
INTRODUCTION
23
arabinoxylans (Yui et al., 1995). Xylans and less highly substituted
arabinoxylans may be capable of associating with cellulose (McNeil et al., 1975;
Saulnier et al., 2007).
The “warp-weft” model of Lamport and Epstein (1983) includes the xyloglucan
linking the microfibrils, but gives a central role to protein cross-links. The
cellulose microfibrils (warp) are enclosed by isodityrosine-coupled extensin
molecules (weft). The “warp-weft” model is inappropriate for onion cell walls
due to the low proportion of cell wall protein (McCann et al., 1990) and this may
be true of other similar species.
The “Carpita and Gibeaut” model (Carpita and Gibeaut, 1993) is actually two
slightly different models that account for the differences between species; they
defined Type I cell walls to be those of dicots and most non-graminaceous
monocots and Type II cell walls to be those of the Gramineae. The Type I
model has xyloglucan chains hydrogen-bonded to the surface of the cellulose
microfibrils and woven together by their hydrogen bonds with each other, cross-
linking the microfibrils. The cellulose/xyloglucan layer is then sandwiched
between layers of covalently linked polygalacturonan (PGA) and
rhamnogalacturonan I. The PGA is condensed by Ca2+ cross-linking, or in
some species by formation of diferulic acid linkages between ferulic acid
monomers ester-linked to separate polysaccharide chains In the Type II
model, a small amount of xyloglucan binds to the cellulose microfibrils, but was
thought to not connect the microfibrils as they do in the Type I model. Type II
walls also tend to have low levels of pectin, although RG I and PGA were still
envisaged to form a longitudinal layer. The main connection between
microfibrils is achieved by glucuronoarabinoxylans, which hydrogen bond to the
microfibrils and to each other where there is little substitution of the
polysaccharide. As a substantial amount of the non-cellulosic polymers are not
removed by treatment with alkali the phenolic cross-linkages are thought to
wrap around the cellulose-xyloglucan-GAX interaction sites, preventing their
removal. They also considered how cell wall growth and growth cessation
might be achieved in the two models. In the Type I model xyloglucans are
severed allowing microfibrils to separate; expansion is halted by incorporation of
INTRODUCTION
24
extensin radially. In the Type II model, mixed-linkage glucans are synthesised
during expansion and take on a similar role to the xyloglucans of the Type I
wall; expansion is halted somewhat by threonine-rich proteins and more
significantly by esterified and etherified phenolic acids, at which point the mixed-
linkage glucans are no longer load-bearing.
Unlignified Type II cell walls have glucuronoarabinoxylans and mixed-linkage
glucans as their main non-cellulosic cell-wall polysaccharides, with pectic
polysaccharides and xyloglucans in smaller amounts. Unlignified Type I cell
walls have large amounts of pectic polysaccharides, with smaller amounts of
xyloglucans. Some monocots have cell wall compositions that are intermediate
between these two extremes; they tend to be the species that have ferulic acid
esters in their cell walls, for instance, pineapple (Smith and Harris, 1995).
Although xyloglucan binds strongly to cellulose in vitro (Valent and Albersheim,
1974), the models that suggest that the only interaction between cellulose and
xyloglucan is hydrogen-bonding probably need to be amended, as there is now
evidence that xyloglucan is partly interwoven in the amorphous regions of
cellulose, rather than just bound to the surface (Baba et al., 1994). The
evidence for this is that concentrated alkali (that makes the microfibrils swell) is
required to release xyloglucan, whereas mild alkali that prevents the hydrogen-
bonding of xyloglucan to cellulose does not release xyloglucan. In addition,
when treatment with concentrated alkali or an endoglucanase is used, virtually
no xyloglucan can be detected by an antibody designed for the purpose, but
there are still small lengths (Mr 9200, 15 nm) of xyloglucan that can be released
(Baba et al., 1994). This means a modification to this model is required as the
proposed method for expansion is unlikely to be possible.
Extracellular cross-linking of xylan and xyloglucan chains, by oxidative coupling
of phenolics, has been demonstrated in maize cell-suspension cultures (Kerr
and Fry, 2004). Modelling the feasibility of intramolecular diferulate formation in
grass walls indicated that linkages between ferulates on the same arabinoxylan
chain were only possible if the arabinoxylan relaxes its conformation (Hatfield
and Ralph, 1999), implying that linkages are formed intermolecularly.
INTRODUCTION
25
Sugar beet pectins are feruloylated and can be caused to gel by oxidative
cross-linking (Iiyama et al., 1994). Sugar beet contains diferulic acids and
therefore it is assumed that cross-linking of pectins occurs in vivo (Wende et al.,
1999).
1.2.8 Cell walls and growth regulation
Although many have tried to determine the mechanism by which cell elongation
is made possible by alterations to the cell wall, it has proven extremely difficult.
Cell wall elongation is pH-dependent, and decreasing pH increases the growth
rate. There is some degree of control over the pH of the cell wall and many of
the tropisms, such as phototropism, are produced in this way. The following are
interesting results related to cell wall growth.
Xyloglucan oligosaccharides show inhibitory effects on auxin-stimulated
growth of pea (McDougall and Fry, 1988).
Feruloyl oligosaccharides inhibited auxin-stimulated growth of rice (Ishii,
1997).
1.2.9 Cell walls and defence
Plant cell walls offer two types of defence for the plant as a whole: a passive
mechanism and an active defence mechanism.
As a passive defence mechanism, cell walls provide a physical barrier between
pathogens and the plant cell contents. The walls of surface cells may be
strengthened by the deposition of lignin or silica, which will not only make it
more difficult for pathogenic organisms to access the cell contents, but will deter
foraging animals, by making digestion more difficult. The outer cell wall of
endodermal cells may contain suberin, a layer of fatty acids ester-linked to
dicarboxylic acids and phenolics. Epidermal cells may have a layer of cutin, a
polymer of long-chain fatty acids held together by ester linkages, above the
INTRODUCTION
26
primary wall layer. Cutin and suberin are both hydrophobic, allowing the plant
to shed water and any associated microbes.
Pathogens attempting to penetrate the walls of their host must secrete a range
of cell-wall degrading enzymes. As part of the plant’s active defence
mechanism, the cell walls are capable of reacting to the attack. The enzymes
used by pathogens to break down the polysaccharides in the cell wall produce
oligosaccharides that can act as signalling molecules. The cell wall can
respond to these signalling molecules in a range of ways: by depositing more
lignin and/or cellulose in the cell wall around the attack site (making the wall
more difficult to penetrate) (Iiyama et al., 1994), releasing proteins to inhibit the
action of the pathogenic enzymes (Albersheim and Anderson, 1971; Juge,
2006) or using enzymes as a counter-attack against the pathogen (Cline and
Albersheim, 1981). The oligosaccharide signals may also induce the
neighbouring cells to defend themselves.
Phenolic acids have a range of properties that may help the plant defend itself:
They are astringent, especially in combination (Shahidi and Naczk,
2004), and therefore would deter foraging herbivores
Sinapic, p-coumaric and ferulic acids can inhibit mycelium growth of
Fusarium oxysporum, and they also inhibit the various cell-wall
degrading enzymes secreted by F. oxysporum when it attacks date palm
(El Modafar and El Boustani, 2001)
During a pathogen-induced oxidative burst, which may involve
extracellular H2O2 production, increased coupling of ferulic acid would
occur in the cell walls (Fry et al., 2000), increasing the degree of cross-
linking and reducing degradability
Synthesis of feruloyltyramine in response to wounding restricts the
enzymic dissolution of cell-wall polymers (Pearce et al., 1998)
Inactivation of plant viruses (Sridhar et al., 1979)
Presumably a combination of these factors makes ferulic acid a significant
factor in the resistance of wheat against wheat midge (Abdel-Aal et al., 2001).
INTRODUCTION
27
The defence mechanisms of plants exert their influence in agriculture,
biodiversity and food production. For instance, increasing the level of
polysaccharide cross-linking reduces the digestibility of plant cells in the
ruminant gut – a major factor in the economically important production of milk
and beef. It reduces further if the cross-linking is between lignin and
polysaccharides (Grabber et al., 1996; Ralph et al., 1996).
1.2.10 Cell walls and health
Cell walls are the main source of fibre in the human diet. Dietary fibre is defined
as “all the polysaccharides and lignin in the diet that are not digested by the
endogenous secretions of the human digestive tract” (Selvendran, 1991). Low
intake of foods containing dietary fibre, such as fruit, vegetables and cereals,
can contribute to constipation, diverticular disease, colorectal cancer, coronary
heart disease, diabetes and obesity (Selvendran, 1991). These negative effects
may also be due to a lack of other compounds, such as antioxidants, that are
also present in these foods.
Primary wall polysaccharides have been shown to bind heavy metals (Tahiri et
al., 2000; 2002), regulate serum cholesterol (Terpstra et al., 2002) and stimulate
the immune system (Yu et al., 2001). Also, many phenolics are known to have
one or more of the following beneficial activities: antioxidant, antimicrobial,
antimutagenic (Ferguson et al., 2003), anti-inflammatory, anticarcinogenic,
cholesterol-lowering and prevention of thrombosis and atherosclerosis (Ou and
Kwok, 2004).
Hydroxycinnamic acids, and an extract containing hydroxycinnamic acids
obtained by the saponification of the cell walls of wheat coleoptiles, have been
shown to have antimutagenic properties in a simple bacterial model (Ferguson
et al., 2003). Assuming this can be applied to humans, this may provide an
explanation as to why diets high in fibre, and hence hydroxycinnamic acids,
tend to protect people from cancer of the bowel and digestive tract. Ferulic acid
INTRODUCTION
28
forms a resonance-stabilized phenoxy radical, which scavenges a range of free
radicals. It also increases the activity of enzymes responsible for scavenging
free radicals and inhibits enzymes that catalyse the production of free radicals
(Kayahara 2000). Ferulic acid (and other phenolic acids) esterified to cell-wall
polymers cannot be absorbed in the human gut in this form, but there are
microbial esterases present in the intestine that can release them (Andreasen et
al., 2001a; Kroon et al., 1997) in a form which can then be absorbed
(Andreasen et al., 2001b). Ferulic acid is subsequently excreted as the free
form or conjugated to glucuronide in the urine (Chesson et al., 1999; Choudhury
et al., 1999).
Diferulic acids are more effective inhibitors of lipid peroxidation and better
scavengers of free radicals than ferulic acid on a molar basis (Garcia-Conesa et
al., 1997). As with ferulic acid, diferulic acids bound to cell walls are not
absorbed directly by humans; however it has been shown in rats that free
diferulic acids are absorbed in the intestine (Andreasen et al., 2001b). Caco-2
cells (a cancer cell line that differentiates into enterocyte-like cells similar to
those in the small intestine) have the ability to de-esterify model DiFA-diester
substrates, particularly the 8-O-4’-DiFA diester (Kern et al., 2003). Increasing
the concentration of ferulic acid and diferulic acid does not affect the
degradation of nonlignified cell wall by human intestinal microbes (Funk et al.,
2007).
1.3 Studying the cell-wall matrix
There are many approaches taken for studying the wall matrix and they
generally utilise whole tissue or purified cell-wall material. The different
approaches are described below.
1.3.1 Microscope-based investigations
The distribution of phenolics in whole tissue can be visualised using UV
microscopy (ferulic acid fluoresces blue); and simple chemical treatments, such
INTRODUCTION
29
as dilute ammonium hydroxide, can induce more intense pH dependent
autofluorescence (ferulic acid autofluoresces green). Studies on monocots
show that some subclasses and families are more likely to contain high levels of
phenolics than others. For instance, the subclass Commelinales and the
families Philydraceae, Pontederiaceae and Haemodoraceae have relatively
high levels (Harris and Hartley, 1980). Even very low levels of ferulic acid (>88
µg/mg) can be detected by pH-dependent autofluorescence (Carnachan and
Harris, 2000). Other histochemical stains can be used:
Alcian blue stains pectin blue
Ruthenium red stains pectin red
Sudan 7B stains suberin pink/red
Fluorol yellow 088 gives a yellow fluorescence with suberin under UV
light
Dimethoxybenzaldehyde stains condensed tannins red
Naturestoffreagenz A gives a yellow fluorescence with flavonoids under
UV light
Reactive oxygen species give a deep-brown reaction product with H2O2
(Gunawardena et al., 2007)
Phloroglucinol-HCl stains lignin red (Carnachan and Harris, 2000)
Toluidine blue O stains polychromatically; lignin stains green or blue-
green and rhamnogalacturonans stain pink or purple (Carnachan and
Harris, 2000)
Sirofluor, a chemical found in aniline blue, gives a yellow fluorescence
with callose (Stone et al., 1984)
Calcofluor stains cellulose blue (Roberts, 2001)
The distribution of matrix polymers has been investigated using electron
microscopy and immunocytochemistry in potatoes (Parker et al., 2001) and
peas (Pisum sativum L. cv Avola) (McCartney and Knox, 2002). There are a
number of monoclonal (mAb) and polyclonal (pAb) antibodies that have been
used for this purpose; most of them are specific for a particular polysaccharide
or protein epitope; and these are listed in Figure 10:
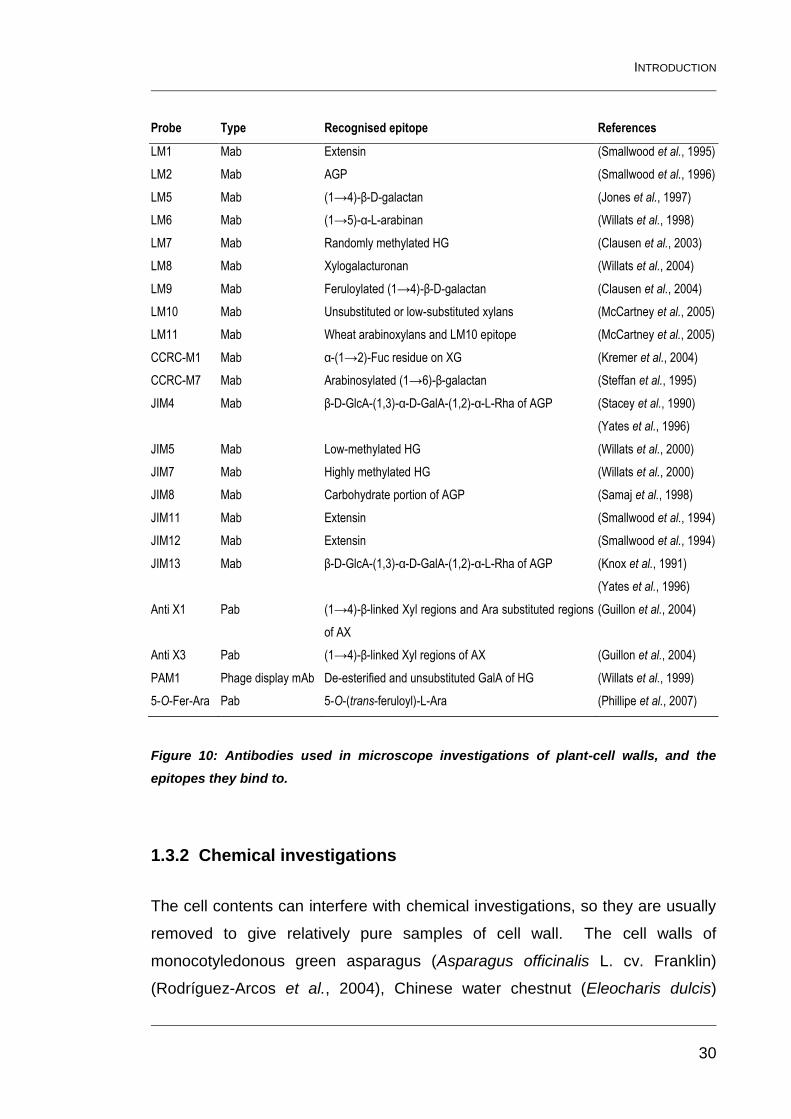
INTRODUCTION
30
Probe Type Recognised epitope References
LM1 Mab Extensin (Smallwood et al., 1995)
LM2 Mab AGP (Smallwood et al., 1996)
LM5 Mab (1→4)-β-D-galactan (Jones et al., 1997)
LM6 Mab (1→5)-α-L-arabinan (Willats et al., 1998)
LM7 Mab Randomly methylated HG (Clausen et al., 2003)
LM8 Mab Xylogalacturonan (Willats et al., 2004)
LM9 Mab Feruloylated (1→4)-β-D-galactan (Clausen et al., 2004)
LM10 Mab Unsubstituted or low-substituted xylans (McCartney et al., 2005)
LM11 Mab Wheat arabinoxylans and LM10 epitope (McCartney et al., 2005)
CCRC-M1 Mab α-(1→2)-Fuc residue on XG (Kremer et al., 2004)
CCRC-M7 Mab Arabinosylated (1→6)-β-galactan (Steffan et al., 1995)
JIM4 Mab β-D-GlcA-(1,3)-α-D-GalA-(1,2)-α-L-Rha of AGP (Stacey et al., 1990)
(Yates et al., 1996)
JIM5 Mab Low-methylated HG (Willats et al., 2000)
JIM7 Mab Highly methylated HG (Willats et al., 2000)
JIM8 Mab Carbohydrate portion of AGP (Samaj et al., 1998)
JIM11 Mab Extensin (Smallwood et al., 1994)
JIM12 Mab Extensin (Smallwood et al., 1994)
JIM13 Mab β-D-GlcA-(1,3)-α-D-GalA-(1,2)-α-L-Rha of AGP (Knox et al., 1991)
(Yates et al., 1996)
Anti X1 Pab (1→4)-β-linked Xyl regions and Ara substituted regions
of AX
(Guillon et al., 2004)
Anti X3 Pab (1→4)-β-linked Xyl regions of AX (Guillon et al., 2004)
PAM1 Phage display mAb De-esterified and unsubstituted GalA of HG (Willats et al., 1999)
5-O-Fer-Ara Pab 5-O-(trans-feruloyl)-L-Ara (Phillipe et al., 2007)
Figure 10: Antibodies used in microscope investigations of plant-cell walls, and the
epitopes they bind to.
1.3.2 Chemical investigations
The cell contents can interfere with chemical investigations, so they are usually
removed to give relatively pure samples of cell wall. The cell walls of
monocotyledonous green asparagus (Asparagus officinalis L. cv. Franklin)
(Rodríguez-Arcos et al., 2004), Chinese water chestnut (Eleocharis dulcis)
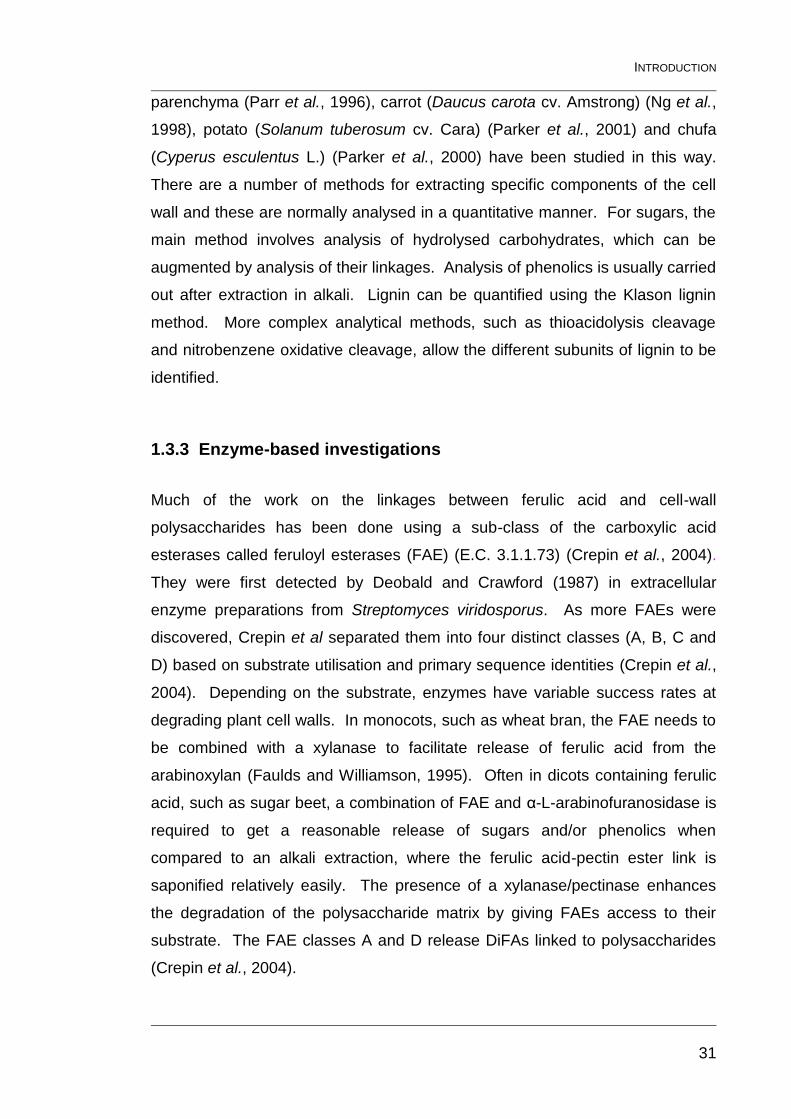
INTRODUCTION
31
parenchyma (Parr et al., 1996), carrot (Daucus carota cv. Amstrong) (Ng et al.,
1998), potato (Solanum tuberosum cv. Cara) (Parker et al., 2001) and chufa
(Cyperus esculentus L.) (Parker et al., 2000) have been studied in this way.
There are a number of methods for extracting specific components of the cell
wall and these are normally analysed in a quantitative manner. For sugars, the
main method involves analysis of hydrolysed carbohydrates, which can be
augmented by analysis of their linkages. Analysis of phenolics is usually carried
out after extraction in alkali. Lignin can be quantified using the Klason lignin
method. More complex analytical methods, such as thioacidolysis cleavage
and nitrobenzene oxidative cleavage, allow the different subunits of lignin to be
identified.
1.3.3 Enzyme-based investigations
Much of the work on the linkages between ferulic acid and cell-wall
polysaccharides has been done using a sub-class of the carboxylic acid
esterases called feruloyl esterases (FAE) (E.C. 3.1.1.73) (Crepin et al., 2004).
They were first detected by Deobald and Crawford (1987) in extracellular
enzyme preparations from Streptomyces viridosporus. As more FAEs were
discovered, Crepin et al separated them into four distinct classes (A, B, C and
D) based on substrate utilisation and primary sequence identities (Crepin et al.,
2004). Depending on the substrate, enzymes have variable success rates at
degrading plant cell walls. In monocots, such as wheat bran, the FAE needs to
be combined with a xylanase to facilitate release of ferulic acid from the
arabinoxylan (Faulds and Williamson, 1995). Often in dicots containing ferulic
acid, such as sugar beet, a combination of FAE and α-L-arabinofuranosidase is
required to get a reasonable release of sugars and/or phenolics when
compared to an alkali extraction, where the ferulic acid-pectin ester link is
saponified relatively easily. The presence of a xylanase/pectinase enhances
the degradation of the polysaccharide matrix by giving FAEs access to their
substrate. The FAE classes A and D release DiFAs linked to polysaccharides
(Crepin et al., 2004).
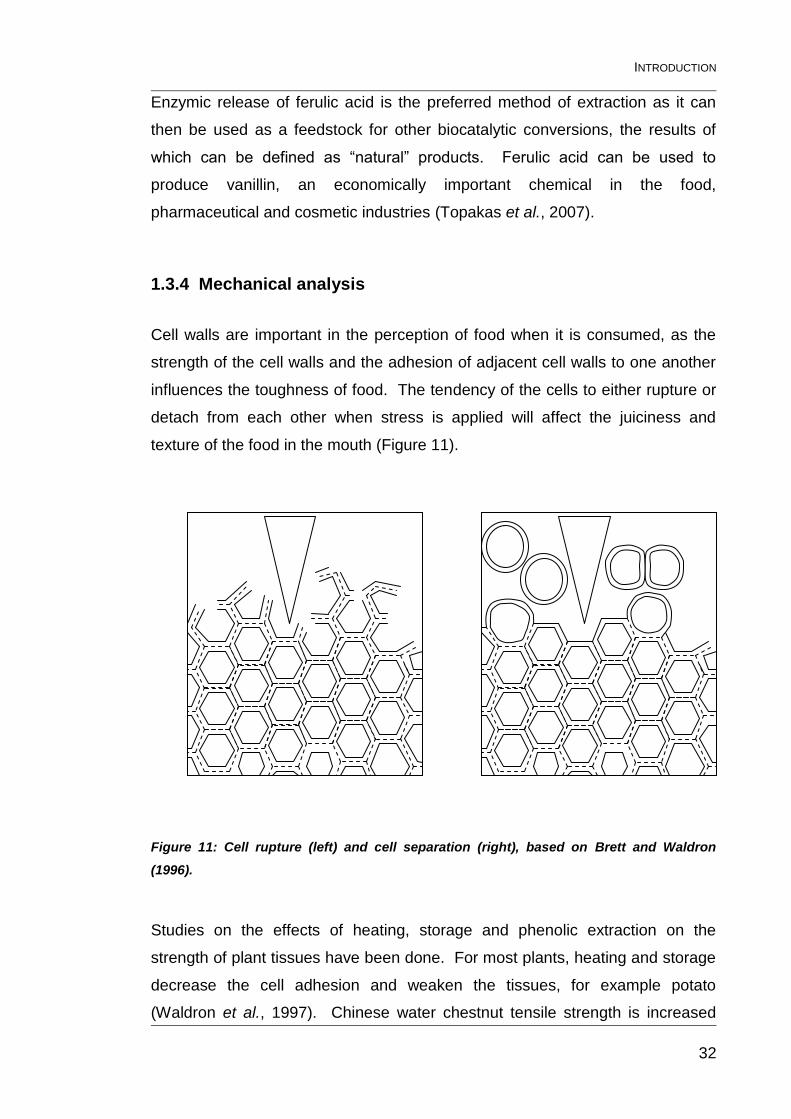
INTRODUCTION
32
Enzymic release of ferulic acid is the preferred method of extraction as it can
then be used as a feedstock for other biocatalytic conversions, the results of
which can be defined as “natural” products. Ferulic acid can be used to
produce vanillin, an economically important chemical in the food,
pharmaceutical and cosmetic industries (Topakas et al., 2007).
1.3.4 Mechanical analysis
Cell walls are important in the perception of food when it is consumed, as the
strength of the cell walls and the adhesion of adjacent cell walls to one another
influences the toughness of food. The tendency of the cells to either rupture or
detach from each other when stress is applied will affect the juiciness and
texture of the food in the mouth (Figure 11).
Figure 11: Cell rupture (left) and cell separation (right), based on Brett and Waldron
(1996).
Studies on the effects of heating, storage and phenolic extraction on the
strength of plant tissues have been done. For most plants, heating and storage
decrease the cell adhesion and weaken the tissues, for example potato
(Waldron et al., 1997). Chinese water chestnut tensile strength is increased
INTRODUCTION
33
slightly by heating (Waldron et al., 1997), but is decreased by alkali extraction of
phenolics, in particular in 1 M NaOH, when 8,8’-DiFA (AT) is removed,
indicating this may form part of a key phenolic-polysaccharide linkage (Parker et
al., 2003).
1.4 Chinese water chestnut
Chinese water chestnut (Eleocharis dulcis (Burman f.) Trin ex Henschel) is a
plant in the family Cyperaceae. It grows naturally, and by cultivation, in many
parts of Asia, and recently small-scale cultivation has started in Australia and
the USA. The inedible leaves grow to between 1 and 1.5 metres high and are
used in some countries to produce mats (Klok et al., 2002). The Chinese water
chestnut (CWC) corms are oblate spheres, of diameter 3-4 cm, with a dark
brown skin and a ring of leaf-bases around the apex (Figure 12).
Figure 12: Chinese water-chestnut corms (left) and a sprouting corm (right).
The edible part of the corm consists of thin-walled parenchyma cells containing
starch granules, interspersed with vascular strands (Parker and Waldron, 1995).
CWC is widely known to retain a crisp texture when cooked and this has been
shown mechanically by three separate groups (Loh and Breene, 1981; Mudahar
and Jen, 1991; Parker et al., 2003). They grow in paddy-like ponds, and are
therefore beset by a wide range of pathogenic organisms, protection from which
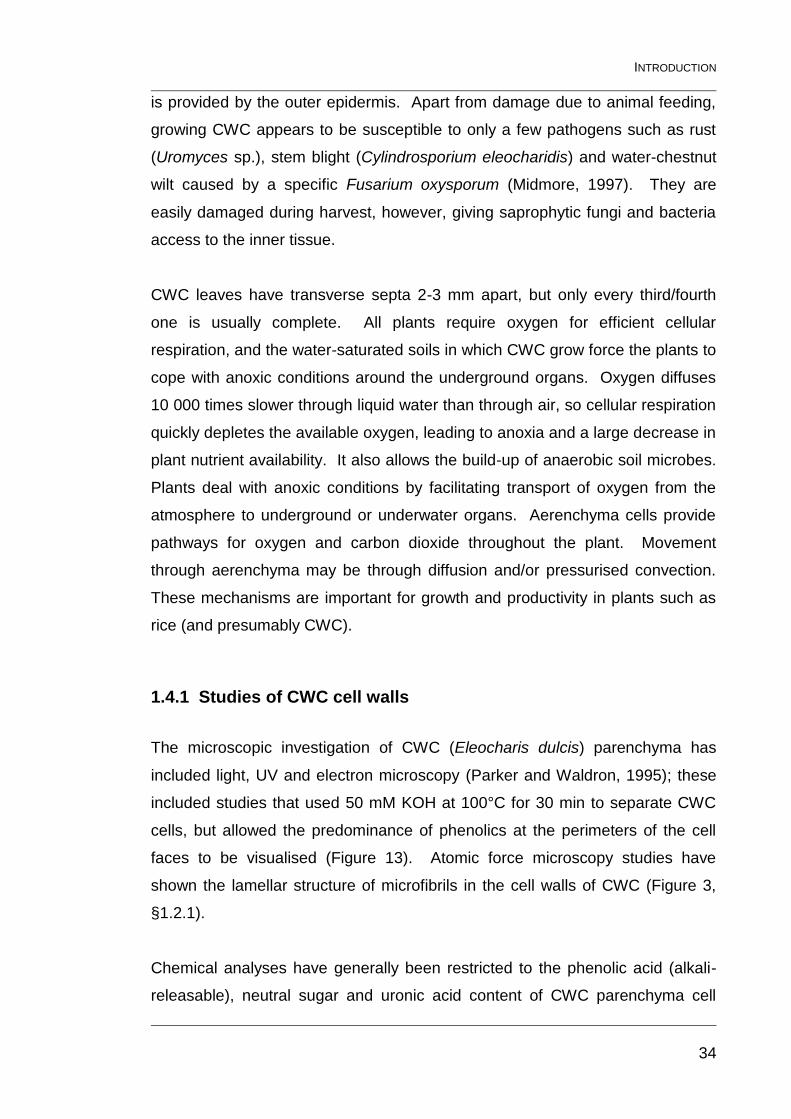
INTRODUCTION
34
is provided by the outer epidermis. Apart from damage due to animal feeding,
growing CWC appears to be susceptible to only a few pathogens such as rust
(Uromyces sp.), stem blight (Cylindrosporium eleocharidis) and water-chestnut
wilt caused by a specific Fusarium oxysporum (Midmore, 1997). They are
easily damaged during harvest, however, giving saprophytic fungi and bacteria
access to the inner tissue.
CWC leaves have transverse septa 2-3 mm apart, but only every third/fourth
one is usually complete. All plants require oxygen for efficient cellular
respiration, and the water-saturated soils in which CWC grow force the plants to
cope with anoxic conditions around the underground organs. Oxygen diffuses
10 000 times slower through liquid water than through air, so cellular respiration
quickly depletes the available oxygen, leading to anoxia and a large decrease in
plant nutrient availability. It also allows the build-up of anaerobic soil microbes.
Plants deal with anoxic conditions by facilitating transport of oxygen from the
atmosphere to underground or underwater organs. Aerenchyma cells provide
pathways for oxygen and carbon dioxide throughout the plant. Movement
through aerenchyma may be through diffusion and/or pressurised convection.
These mechanisms are important for growth and productivity in plants such as
rice (and presumably CWC).
1.4.1 Studies of CWC cell walls
The microscopic investigation of CWC (Eleocharis dulcis) parenchyma has
included light, UV and electron microscopy (Parker and Waldron, 1995); these
included studies that used 50 mM KOH at 100°C for 30 min to separate CWC
cells, but allowed the predominance of phenolics at the perimeters of the cell
faces to be visualised (Figure 13). Atomic force microscopy studies have
shown the lamellar structure of microfibrils in the cell walls of CWC (Figure 3,
§1.2.1).
Chemical analyses have generally been restricted to the phenolic acid (alkali-
releasable), neutral sugar and uronic acid content of CWC parenchyma cell
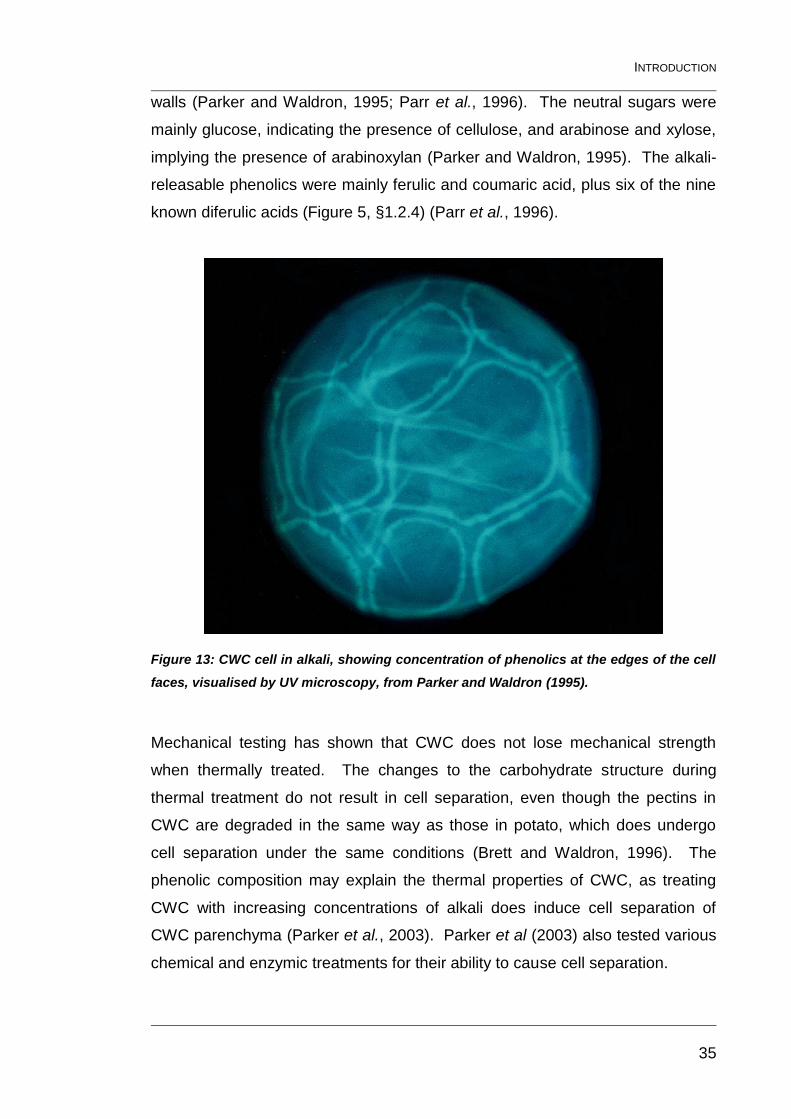
INTRODUCTION
35
walls (Parker and Waldron, 1995; Parr et al., 1996). The neutral sugars were
mainly glucose, indicating the presence of cellulose, and arabinose and xylose,
implying the presence of arabinoxylan (Parker and Waldron, 1995). The alkali-
releasable phenolics were mainly ferulic and coumaric acid, plus six of the nine
known diferulic acids (Figure 5, §1.2.4) (Parr et al., 1996).
Figure 13: CWC cell in alkali, showing concentration of phenolics at the edges of the cell
faces, visualised by UV microscopy, from Parker and Waldron (1995).
Mechanical testing has shown that CWC does not lose mechanical strength
when thermally treated. The changes to the carbohydrate structure during
thermal treatment do not result in cell separation, even though the pectins in
CWC are degraded in the same way as those in potato, which does undergo
cell separation under the same conditions (Brett and Waldron, 1996). The
phenolic composition may explain the thermal properties of CWC, as treating
CWC with increasing concentrations of alkali does induce cell separation of
CWC parenchyma (Parker et al., 2003). Parker et al (2003) also tested various
chemical and enzymic treatments for their ability to cause cell separation.
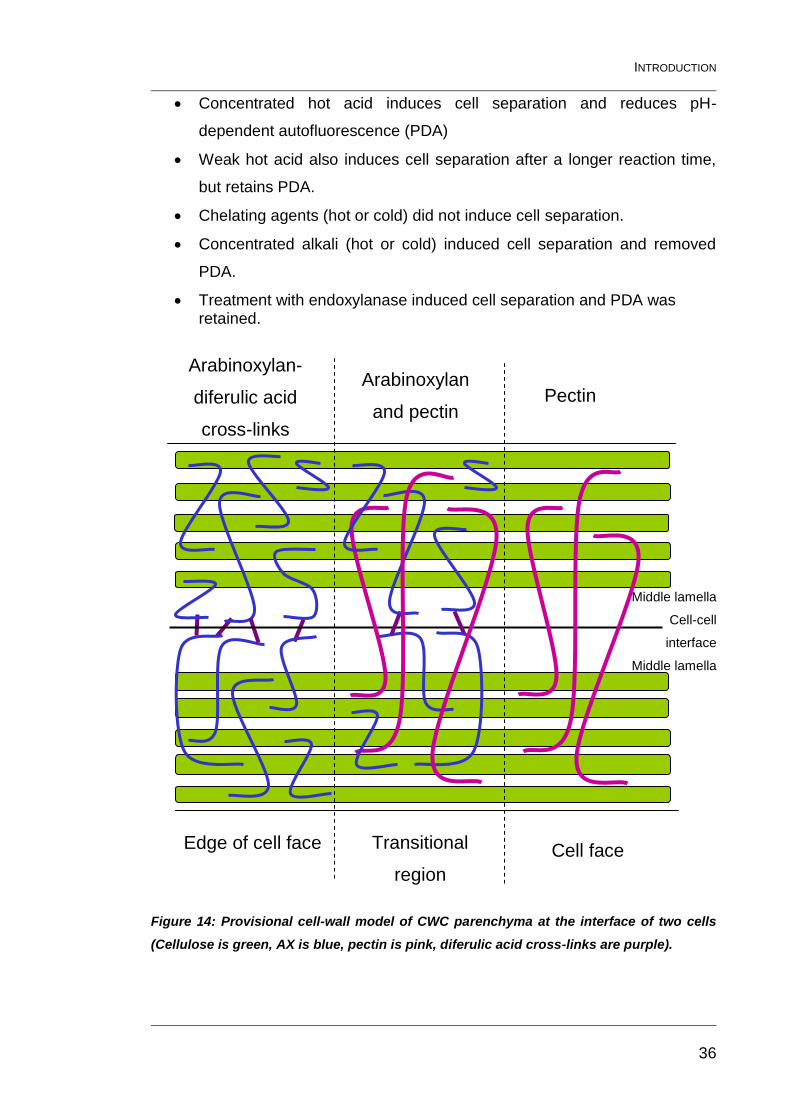
INTRODUCTION
36
Concentrated hot acid induces cell separation and reduces pH-
dependent autofluorescence (PDA)
Weak hot acid also induces cell separation after a longer reaction time,
but retains PDA.
Chelating agents (hot or cold) did not induce cell separation.
Concentrated alkali (hot or cold) induced cell separation and removed
PDA.
Treatment with endoxylanase induced cell separation and PDA was retained.
Figure 14: Provisional cell-wall model of CWC parenchyma at the interface of two cells
(Cellulose is green, AX is blue, pectin is pink, diferulic acid cross-links are purple).
Arabinoxylan-
diferulic acid
cross-links
Pectin Arabinoxylan
and pectin
Edge of cell face Transitional
region
Cell face
Middle lamella
Cell-cell
interface
Middle lamella
INTRODUCTION
37
From these results, it can be assumed that xylans are a key component of CWC
cell-cell adhesion, as apparently are diferulic acids, but not calcium-containing
pectins. If the cell walls of CWC are consistent with the Type II cell wall then
the xylans are arabinoxylans, and they are hydrogen-bonded to the cellulose
microfibrils. The high concentration of ferulic and diferulic acids implies that
these may cross-link the arabinoxylans, therefore breaking the arabinoxylan
backbone, or de-esterifying (di)ferulic acids with alkali will cause cell separation.
These results have been incorporated into a provisional cell-wall diagram
(Figure 14).
To incorporate the heterogeneity of the cell wall with regards to the distribution
of phenolics on the cell surface, the provisional wall model is presented in three
sections, one rich in arabinoxylan and ferulic acid (load-bearing edges of cell
faces), one rich in pectin (non-load-bearing cell faces), and one where the two
are superimposed as they might be in a transitional region. The arabinoxylans
are hydrogen-bonded to the surface of the cellulose microfibrils. The pectins
form a separate network not connected to the microfibrils or arabinoxylans.
1.5 Analytical theory
1.5.1 Gas-chromatography (GC) theory
Gas chromatography is used to quantify cell wall sugars, as the derivatisation
required to make them volatile is relatively quick and simple and gives
quantitative results.
A schematic of a gas chromatograph is shown in Figure 15. Gas
chromatography involves injection of a vaporised sample onto the head of a
chromatographic column. Elution of the sample is achieved due to the flow of
an inert gaseous mobile phase such as nitrogen or helium. As the mobile
phase is inert it does not interact with the molecules of the analyte; it only
transports the analyte through the column. The choice of mobile phase
depends to an extent on the detector used and upon economics. Nitrogen is
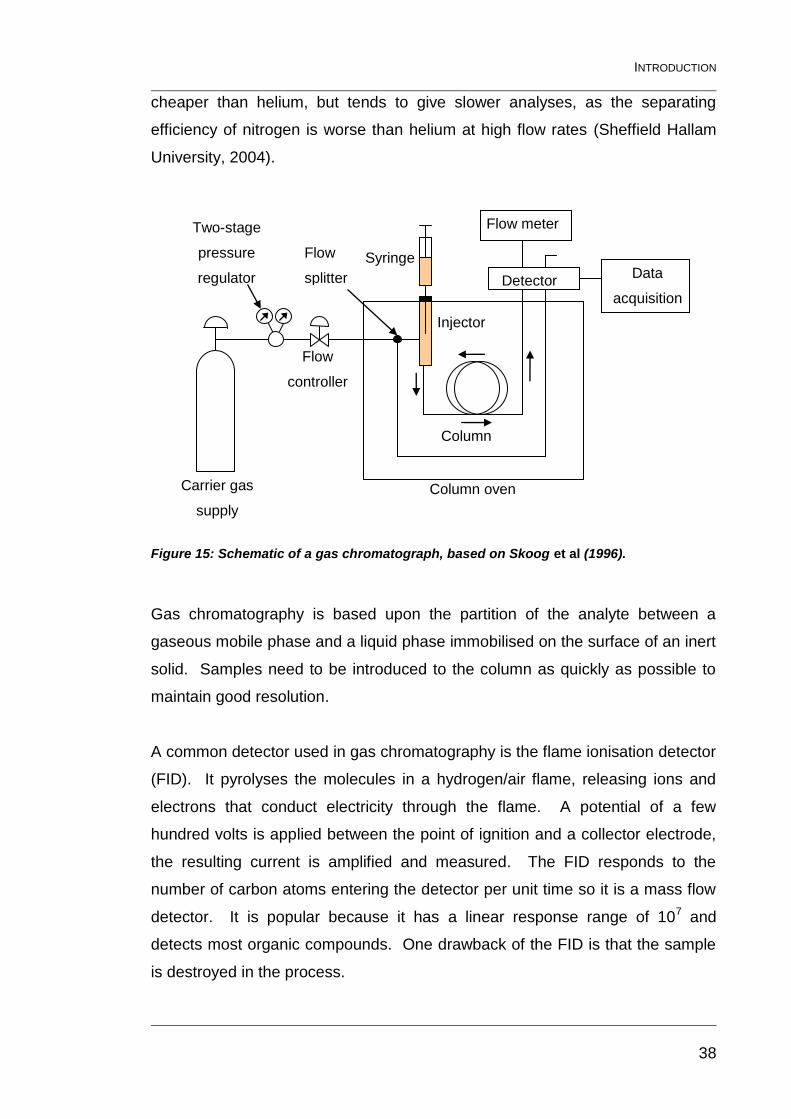
INTRODUCTION
38
cheaper than helium, but tends to give slower analyses, as the separating
efficiency of nitrogen is worse than helium at high flow rates (Sheffield Hallam
University, 2004).
Figure 15: Schematic of a gas chromatograph, based on Skoog et al (1996).
Gas chromatography is based upon the partition of the analyte between a
gaseous mobile phase and a liquid phase immobilised on the surface of an inert
solid. Samples need to be introduced to the column as quickly as possible to
maintain good resolution.
A common detector used in gas chromatography is the flame ionisation detector
(FID). It pyrolyses the molecules in a hydrogen/air flame, releasing ions and
electrons that conduct electricity through the flame. A potential of a few
hundred volts is applied between the point of ignition and a collector electrode,
the resulting current is amplified and measured. The FID responds to the
number of carbon atoms entering the detector per unit time so it is a mass flow
detector. It is popular because it has a linear response range of 107 and
detects most organic compounds. One drawback of the FID is that the sample
is destroyed in the process.
Two-stage
pressure
regulator
Column oven
Flow
splitter
Flow
controller
Detector
Column
Injector
Syringe
Flow meter
Carrier gas
supply
Data
acquisition
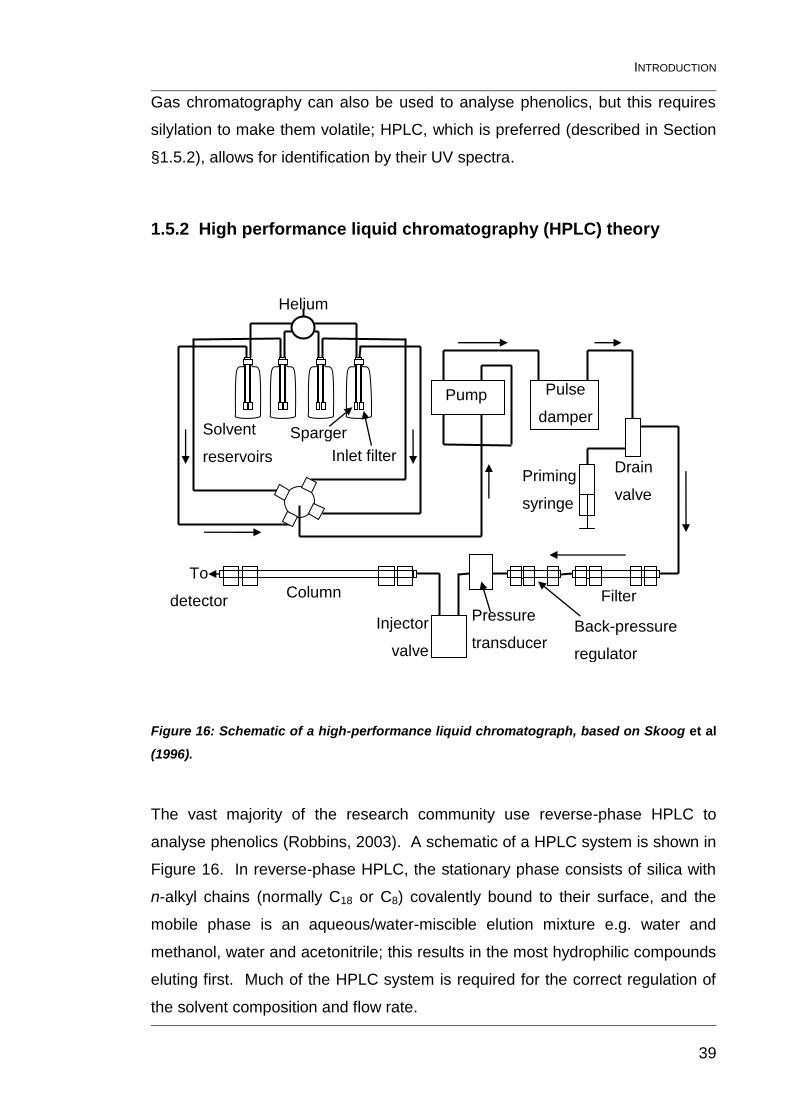
INTRODUCTION
39
Gas chromatography can also be used to analyse phenolics, but this requires
silylation to make them volatile; HPLC, which is preferred (described in Section
§1.5.2), allows for identification by their UV spectra.
1.5.2 High performance liquid chromatography (HPLC) theory
Figure 16: Schematic of a high-performance liquid chromatograph, based on Skoog et al
(1996).
The vast majority of the research community use reverse-phase HPLC to
analyse phenolics (Robbins, 2003). A schematic of a HPLC system is shown in
Figure 16. In reverse-phase HPLC, the stationary phase consists of silica with
n-alkyl chains (normally C18 or C8) covalently bound to their surface, and the
mobile phase is an aqueous/water-miscible elution mixture e.g. water and
methanol, water and acetonitrile; this results in the most hydrophilic compounds
eluting first. Much of the HPLC system is required for the correct regulation of
the solvent composition and flow rate.
Pressure
transducer Back-pressure
regulator
To
detector
Pump Pulse
damper
Priming
syringe
Column
Drain
valve
Filter
Solvent
reservoirs
Sparger
Inlet filter
Injector
valve
Helium
INTRODUCTION
40
Three detectors commonly used with HPLC Detectors are UV diode-array
detectors (DAD), refractive-index detectors (RI) and mass-spectrometer
detectors (MS). Diode-array detectors require light from a broad-spectrum light
source to be shone through the sample. The light that is not absorbed by the
sample is detected by an array of photosensitive diodes that detect the intensity
of a particular wavelength of light, which is then recorded by a computer. The
spectra produced are often characteristic of the compound that produced them,
aiding identification. Refractive-index detectors detect the change in refractive
index between the sample and a suitable reference material; they are sensitive
to external environment changes, but are useful for detecting non-ionic and
non-light absorbing/fluorescing compounds. Mass spectrometry is described in
detail in Section §1.5.3.
1.5.3 Mass spectrometry (MS) theory
A mass spectrometer produces ions from a sample and separates them
according to their mass-to-charge ratio. The process of ionisation usually
produces molecular and fragment ions giving an indication of molecular weight
and structural information that may help with identification. There are a number
of methods for ionisation, and the method used depends on the type of
compound being analysed.
Electron impact (EI) – volatile samples
Chemical ionisation (CI) – volatile samples
Fast atom bombardment (FAB) – involatile or high molecular weight
samples
Electrospray ionisation (ESI) – involatile or high molecular weight
samples
Matrix-assisted laser desorption ionisation (MALDI) – involatile or high
molecular weight samples
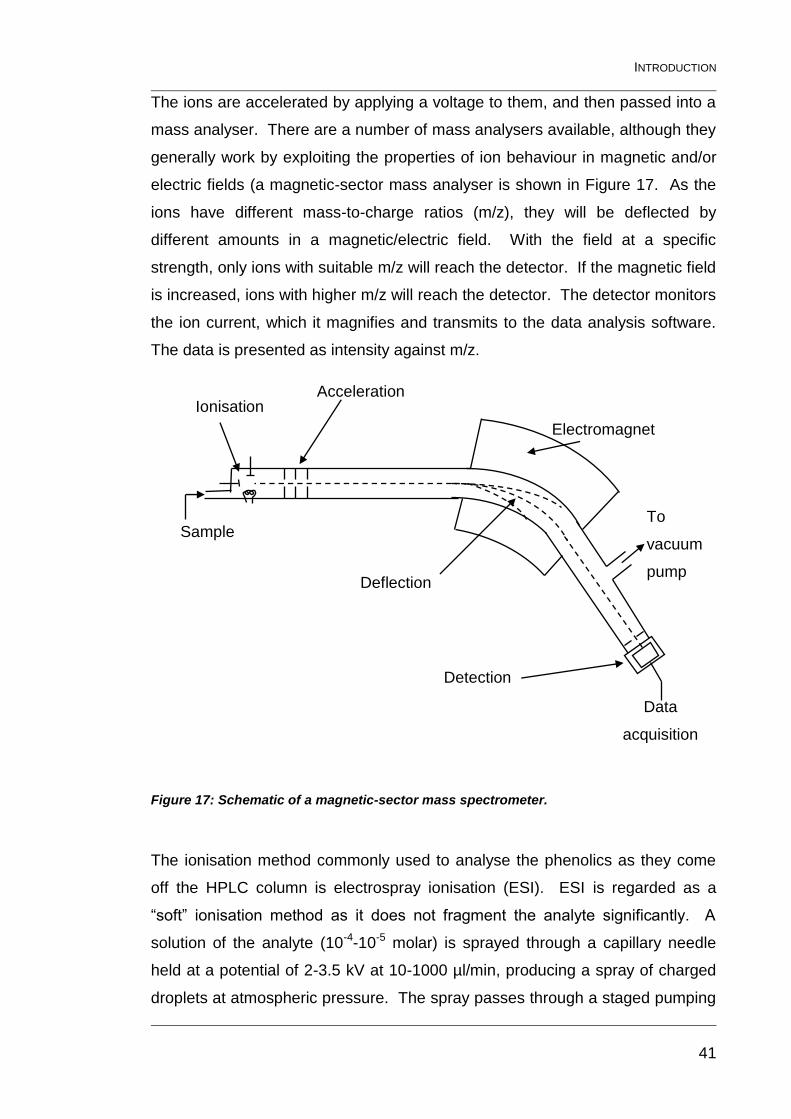
INTRODUCTION
41
The ions are accelerated by applying a voltage to them, and then passed into a
mass analyser. There are a number of mass analysers available, although they
generally work by exploiting the properties of ion behaviour in magnetic and/or
electric fields (a magnetic-sector mass analyser is shown in Figure 17. As the
ions have different mass-to-charge ratios (m/z), they will be deflected by
different amounts in a magnetic/electric field. With the field at a specific
strength, only ions with suitable m/z will reach the detector. If the magnetic field
is increased, ions with higher m/z will reach the detector. The detector monitors
the ion current, which it magnifies and transmits to the data analysis software.
The data is presented as intensity against m/z.
Figure 17: Schematic of a magnetic-sector mass spectrometer.
The ionisation method commonly used to analyse the phenolics as they come
off the HPLC column is electrospray ionisation (ESI). ESI is regarded as a
“soft” ionisation method as it does not fragment the analyte significantly. A
solution of the analyte (10-4-10-5 molar) is sprayed through a capillary needle
held at a potential of 2-3.5 kV at 10-1000 µl/min, producing a spray of charged
droplets at atmospheric pressure. The spray passes through a staged pumping
Electromagnet
Data
acquisition
To
vacuum
pump
Detection
Acceleration
Deflection
Sample
Ionisation
INTRODUCTION
42
system during which the droplets shrink due to solvent evaporation, releasing
charged molecules. These charged molecules are then mass-analysed by the
mass spectrometer. ESI is particularly useful for large molecules, as with this
method they acquire multiple charges, bringing them within the mass/charge
ratio range of conventional mass spectrometers. ESI is also useful for smaller,
highly charged, thermally labile compounds (Mellon, 2000). ESI can be used to
produce positive or negative ions. The positive ions are normally adducts of the
analyte with hydrogen, sodium or potassium. Instead of a magnetic-sector
mass analyser, the mass spectrometers used had a triple quadrupole or time-
of-flight (ToF) mass analyser. The quadrupole mass analyser is more
complicated than the magnetic-sector mass analyser, but it works along similar
principles. The ToF mass analyser uses the principle that each ion is imparted
with the same amount of energy, so heavier ions travel more slowly than lighter
ions, and therefore measuring the time taken to travel a certain distance can
provide the m/z of an ion.
1.6 Aims of investigation
The aims of this investigation were as follows:
1.6.1 Cell walls in different tissues of CWC
Renard et al (1999) found different ratios of ferulic acid to dimers in different
tissues of quinoa and suggested this may be due to their different roles. There
have also been differences in the proportions of diferulic acid isomers present in
the tissues of sugar beet (Wende 2000). Parker et al (2000) found that the
parenchyma cell wall of chufa, another Cyperaceae, had ferulic acid as the
predominant phenolic, whereas in the epidermis p-coumaric acid was
predominant. The sugar content also differed considerably. The differences in
gross composition of CWC cell walls from three different tissues of the corm:
the white, edible parenchyma; the brown outermost layer of epidermis; and the
sub-epidermal layer of vascular tissue, were investigated and their likely roles in
the plant’s physiology put forward.
INTRODUCTION
43
1.6.2 Cell wall cross-links
The cell wall cross-links in CWC have been inferred, but not properly
elucidated; therefore, this investigation focussed on extracting phenolic-
polysaccharide fragments and characterising them to see if they were similar to
those already seen in the Amaranthaceae (feruloylation at the O-2 position of
Ara residues in arabinans and/or O-5 position of Gal residues in galactans) or
the Poaceae (feruloylation at the O-5 position of Ara residues in arabinoxylans)
(Ishii, 1997). In particular, the 8,8’-DiFA (AT) was of interest as previous
research had implicated it in the thermal stability of CWC mechanical properties
(Parker et al., 2003).
1.6.3 Higher oligomers of ferulic acid
As other investigators had shown at the beginning of this investigation (Bunzel
et al., 2003a; Rouau et al., 2003), that higher oligomers of ferulic acid were
present in vivo, the presence of trimers and tetramers was anticipated. Finding
higher oligomers of ferulic acid in CWC would show that they are not restricted
to maize or even the Poaceae. Assuming trimers were found, it was hoped that
their molecular structures could be elucidated by NMR.
MATERIALS AND METHODS
44
2 General Materials and Methods:
All reagents, unless otherwise stated, were of analytical grade.
2.1 Source of materials
Fresh CWC (Eleocharis dulcis var. unknown) were obtained from local
suppliers. The fresh CWC are generally vacuum-packed at source and
refrigerated at 4°C during transport and presale storage. The CWC were
peeled and chopped into cubes, roughly 1 cm to a side, removing any diseased
areas as they were encountered. The pieces of peel, including tops and
bottoms, were kept separate from the parenchyma pieces. The peel and
parenchyma were frozen in separate vacuum flasks using liquid nitrogen; they
were then stored at -20°C until needed.
All the methods presented in this chapter were based on standard methods
developed and validated over a period of ten years on a number of different
plant species.
2.2 Preparation of cell-wall material (CWM)
There are many ways of preparing cell-wall material, which have been
compared in a paper by Renard (2005), but none of the methods described was
exactly the same as that described below. Based on the findings of Parr et al
(1997) that the sodium dodecyl sulfate (SDS) method gave more reproducible
results, the following method was adapted from the methods described by Fry
(1988) and Brett and Waldron (1996).
Two batches of cell wall material were prepared from CWC parenchyma using
the method given below for the following amounts of material: Batch 1 ~400 g
frozen fresh weight (4 preparations); Batch 2 ~3,100 g frozen fresh weight (29
MATERIALS AND METHODS
45
preparations). The fresh corms were purchased separately from different
suppliers.
2.2.1 Preparation of parenchyma-cell-wall material
Approximately 100 g of CWC parenchyma was blended using a Waring blender
(330 W, Fisher) in 200 ml of 1.5% SDS containing 5 mM Na2S2O5 (Appendix A)
in 2-5 bursts of 30 s until all large lumps had been broken down. Further
homogenization was carried out using an Ystral Homogenizer (Ystral GmbH) on
power level 3 (500 W, 16000 rpm) for 6 minutes. Drops of octanol were added
as required to reduce foaming. The homogenate was filtered through a 100-µm
nylon mesh (VWR) and washed with 100 ml 0.5% SDS solution containing
3 mM Na2S2O5. The excess liquid was squeezed from the residue, which was
transferred to a beaker. Any remaining residue was washed off the mesh using
200 ml 0.5% SDS solution (as before) into the beaker. The suspension was
filtered through the mesh again, washing with 100 ml 0.5% SDS solution.
Excess liquid was squeezed out of the residue, which was transferred to a 1 L
ceramic ball mill. The residue was washed into the ball mill with ~180 ml 0.5%
SDS solution, so the tops of the ceramic balls were just showing above the
surface. The ball mill was run at 60 rpm for 1 hr at 4°C. The contents of the
ball mill were sieved and washed with deionised water into a metal beaker.
Unwanted particles of epidermis were decanted off. The cell-wall mixture was
filtered through a 100-µm mesh, washing with 1 L of deionised water. A small
sample of cell-wall mixture was tested for starch by staining with I2/KI solution
(see Appendix A) and examining it under a microscope, at which point there
were usually still some starch granules trapped in cells that had been ruptured.
The mesh was washed with ~1 L of deionised water into a metal beaker then
homogenised with an Ystral Homogenizer on power level 2 (500 W, 13000 rpm)
for 3 minutes to release the starch granules. The mixture was filtered again
through the 100-µm mesh and washed with deionised water (~6 L) until no
starch was visible under the microscope. The majority of the excess liquid was
squeezed out of the residue, which then stuck together in clumps. The residue
MATERIALS AND METHODS
46
was transferred to a plastic bottle with ~70 ml deionised water and frozen
(-20°C).
2.2.2 Preparation of epidermis-cell-wall materials
The CWC peel from Batch 1 (3 preparations) was used to produce CWM using
the above method, although they were blended using a Waring blender for 4
bursts of 30 s. Once the samples had been ball milled, they were carefully
decanted to separate the dark brown outer layer of skin (the epidermis), from
the light brown inner layer of epidermis (sub-epidermis), which were called the
ECWM and SECWM samples respectively, and the residual parenchyma (not
used). The samples of epidermis and sub-epidermis were frozen (-20°C) in
deionised water. The frozen samples of epidermis were defrosted and
combined, as were the sub-epidermis samples. They were homogenised with
an Ystral Homogenizer on power level 2 for 3 minutes to release the starch
granules. They were then filtered through a 70-µm nylon mesh and washed
with deionised water (2-8 litres) until no starch granules were observed under
the microscope. The CWM was redispersed in deionised water and frozen
(-20°C).
To obtain dry CWM, the suspensions (Batch 1/Batch 2) were defrosted and
filtered through a 70-µm nylon mesh (different mesh used for each tissue to
prevent cross contamination) and washed with 250/2000 ml ethanol (BDH).
The solid was redispersed in 300/500 ml of ethanol and filtered again through
the 70-µm mesh. It was then washed with 400/500 ml ethanol and 150/500 ml
of acetone (Fisher). The filter was then turned out onto a suitable dish and left
to dry overnight in a fume cupboard, lightly covered with a piece of perforated
aluminium foil to prevent contamination. The dry CWM tended to form loosely-
associated clumps. During the alcohol washing, the epidermis and sub-
epidermis samples released a yellow-coloured compound, which was probably
chlorogenic acid. Dry CWMs were stored in sealed jars at room temperature.
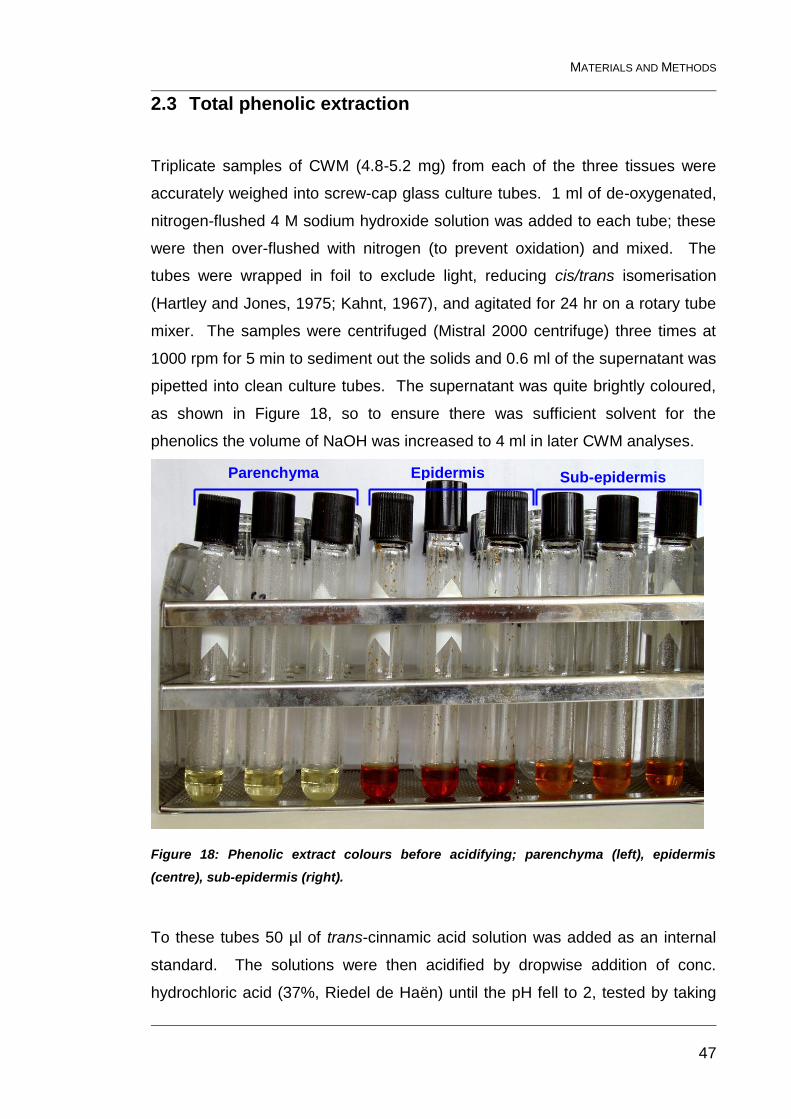
MATERIALS AND METHODS
47
2.3 Total phenolic extraction
Triplicate samples of CWM (4.8-5.2 mg) from each of the three tissues were
accurately weighed into screw-cap glass culture tubes. 1 ml of de-oxygenated,
nitrogen-flushed 4 M sodium hydroxide solution was added to each tube; these
were then over-flushed with nitrogen (to prevent oxidation) and mixed. The
tubes were wrapped in foil to exclude light, reducing cis/trans isomerisation
(Hartley and Jones, 1975; Kahnt, 1967), and agitated for 24 hr on a rotary tube
mixer. The samples were centrifuged (Mistral 2000 centrifuge) three times at
1000 rpm for 5 min to sediment out the solids and 0.6 ml of the supernatant was
pipetted into clean culture tubes. The supernatant was quite brightly coloured,
as shown in Figure 18, so to ensure there was sufficient solvent for the
phenolics the volume of NaOH was increased to 4 ml in later CWM analyses.
Figure 18: Phenolic extract colours before acidifying; parenchyma (left), epidermis
(centre), sub-epidermis (right).
To these tubes 50 µl of trans-cinnamic acid solution was added as an internal
standard. The solutions were then acidified by dropwise addition of conc.
hydrochloric acid (37%, Riedel de Haën) until the pH fell to 2, tested by taking
Epidermis Parenchyma Sub-epidermis
MATERIALS AND METHODS
48
very small aliquots and spotting them onto pH paper. The tubes were mixed
well to make sure the neutralisation was complete. The aqueous phase was
then extracted three times with ethyl acetate (Riedel de Haën, HPLC grade),
3 ml, centrifuging for three minutes at 200 rpm to separate the layers. The ethyl
acetate extracts were combined in a clean culture tube. The ethyl acetate was
evaporated to dryness using a sample concentrator (Techne) set at 40°C, under
a flow of N2. The dry samples were redissolved in 1 ml methanol:water
(50:50 v:v). 200 µl of the samples were filtered through a 0.2 µm PVDF filter
into a “yellow” Chromacol vial.
The samples were analysed on the HPLC using the method set up for simple
phenolics, the main parameters of which are described in Appendix B. Solvent
A was acetonitrile:methanol:water (40:40:20 v:v:v) and Solvent B was 10% (v/v)
acetonitrile in water, both containing 70 µl/L TFA. The solvent flow was set to
1 ml/min, and the initial solvent composition of 10% A and 90% B was held for
0.5 min, over 25 min the composition was changed linearly to 75% A and 25%
B, the composition was further changed to 100% A linearly over 5 min, finally an
exponential gradient of -3 returned the solvent composition to 10% A, 90% B
over 10 min and this composition was held for 2 min.
2.4 Sequential phenolic extraction
The sequential phenolic extraction was carried out in much the same way as
the total phenolic extraction, but with the following differences. Larger samples
of 10-12 mg CWM (Batch 1) were used. Four different concentrations of
sodium hydroxide solution were used for the extractions, 0.1 M, 1 M, 2 M and
4 M. The extractions were carried out in order, on Batch 1 CWM samples,
under the following conditions: (i) 4 ml, 0.1 M NaOH, 1 hr; (ii) 4 ml, 0.1M NaOH,
24 hr; (iii) 4 ml, 1 M NaOH, 24 hr; (iv) 4 ml, 2 M NaOH, 24 hr and (v) 4 ml, 4 M
NaOH, 24 hr. All NaOH solutions were made with de-oxygenated deionised
water. Between each extraction the samples were centrifuged at 1000-2500
rpm for 5-20 min until the solids sedimented sufficiently to remove the majority
of the supernatant, which was pipetted into clean culture tubes. To these tubes
MATERIALS AND METHODS
49
50 µl of trans-cinnamic acid solution was added as an internal standard. The
solutions were then treated in the same way as the total phenolic extraction
samples. Occasionally, the ethyl acetate extractions produced a stable layer of
foam above the water/ethyl acetate interface; this was reduced in volume by
gentle swirling, which allowed most of the ethyl acetate fraction to be removed.
The experiment was also carried out on ~10 mg of PCWM (Batch 2) under the
following conditions: (i) 4 ml, 0.1 M NaOH, 1 hr; (ii) 4 ml, 0.1M NaOH, 24 hr; (iii)
4 ml, 1 M NaOH, 24 hr and (iv) 4 ml, 2 M NaOH, 24 hr, (v) 4 ml, 4M NaOH,
24 hr. For comparison, separate total phenolic extractions over 24 hr or 4 days
were also carried out. The extracts were treated as above.
HPLC was carried out on the sequentially extracted samples in the same way
as on the total phenolic extracts.
2.5 HPLC-MS analysis
Reverse-phase HPLC followed by positive-ESI MS (and negative ESI MS in
some cases) was performed on samples of CWM (~20 mg) extracted in 0.1 M
NaOH (8 ml) for 24 hr. The samples were analysed on a Jasco 1500 series
HPLC system with a Micromass Quattro II detector operated by Fred Mellon.
The HPLC column and method were the same as that used in the phenolic
extractions.
2.6 Klason lignin
Lignin analysis was carried out by Zara Merali using the method adapted from
Theander and Westerlund (1986) described in Merali et al (2007). Duplicate
samples of CWM (~50 mg) were dispersed in 0.75 ml of 72% (w/w) H2SO4 for
3 hr at room temperature. The samples were diluted with 9.0 ml deionised
water and incubated for 2.5 hr in an oven at 100°C. The samples were filtered
through pre-weighed sintered glass funnels (10 mm diameter, Fisher Scientific)
MATERIALS AND METHODS
50
under vacuum to recover the insoluble residue. The residue was washed three
times with water (<40°C) until it was free of acid. The glass funnels (with
residues) were dried at 50°C in an oven until a constant weight was obtained.
Klason lignin was calculated gravimetrically as follows:
Lignin (%) = ((W1-W2) x 100)/S
where:
W1 = weight of glass filter + dried residue
W2 = weight of glass filter
S = weight of initial sample
2.7 Neutral sugars
Triplicate samples (2-4 mg) of CWM (Batch 1) from the three tissue types were
weighed into clean screw cap culture tubes. To each tube was added 200 µl of
72% (w/w) H2SO4, in which the samples were left to stand at room temperature
for 3 hours, with occasional mixing. The samples were then put on ice while
2.2 ml of deionised water was added to each tube to dilute the acid to 1 M
concentration. Each tube was shaken thoroughly and put in a hotblock (Griffin)
at 100-110°C for one hour. From each sample, 0.5 ml was removed to a
microtube tube and frozen at -20°C for later use in determining the uronic acid
composition. The remaining samples were put back into the hotblock at 100-
110°C for a further 1.5 hr. The samples were allowed to cool, and then 200 µl
of 1 mg/ml 2-deoxyglucose solution (2-DOG) was added to each tube to act as
an internal standard. From these samples 1 ml was transferred to clean culture
tubes, which had 300 µl of 25% (w/w) NH3 solution added. The tubes were
mixed and small aliquots of the solutions were tested to check they were alkali,
typically pH 8-9. The samples were incubated with 100 µl of 5% (w/w) NH3
containing 150 mg/ml of NaBH4 for 1 hr at 30°C in a water bath. The samples
were put on ice and 200 µl of glacial acetic acid (Riedel de Haën) was added
and mixed in. 300 µl of the resulting solution was transferred to a clean culture
tube and cooled on ice while 450 µl of 1-methylimidazole (Sigma) and 3 ml of
MATERIALS AND METHODS
51
acetic anhydride were added. The samples were mixed and incubated at 30°C
for 30 min in a water bath, before cooling on ice again. Each tube had 3.5 ml of
deionised water and 3 ml of dichloromethane (Fluka) added before shaking
vigorously and leaving to separate. The lower organic layer was removed by
teat pipette to a clean culture tube. The aqueous layer was extracted with a
further 2 ml of dichloromethane and the organic layer combined with the
previous extract. The dichloromethane extract was extracted twice with 3 ml of
deionised water, keeping and combining the dichloromethane layer from each.
The dichloromethane was evaporated until only a viscous film of alditol acetates
remained, using a sample concentrator (Techne) set at 40°C, under N2. The
samples were then redissolved in 1 ml of acetone (Fisher), 0.1 ml of these
solutions were transferred to “yellow” Chromacol vials ready for analysis.
Stock solutions of the following sugars were made up in 25 ml volumetric flasks
to a concentration of 1 mg/ml with deionised water: rhamnose, fucose,
arabinose, xylose, mannose, galactose and glucose. The standard solutions
were made up by combining 0, 100, 200, 300 or 400 µl of each of these stock
solutions. Deionised water and 72% (w/w) H2SO4 were added to the stock
solution mixtures to give a final H2SO4 concentration of 1 M.
To each sugar standard, 200 µl of 1 mg/ml 2-deoxyglucose solution (2-DOG)
was added as an internal standard. Samples of these sugar standards, 1 ml,
were treated the same way as the CWM samples from and including the point
at which 300 µl of 25% (w/w) NH3 was added, to provide a standard curve for
the GC, and give response factors for each sugar.
A further hydrolysis of the CWM sugars was carried out using 1 M H2SO4 to
determine the amount of non-cellulosic sugars. Triplicate samples (2-3 mg) of
CWM from the three tissue types were weighed into clean screw-cap culture
tubes. Deionised water (2.2 ml) was added to each tube before 200 µl of 72%
(w/w) H2SO4 was also added, to give a final H2SO4 concentration of 1 M. The
samples were then incubated at 100-110°C for 2.5 hr and the experiment
continued from the equivalent point in the 72% (w/w) H2SO4 hydrolysis.
MATERIALS AND METHODS
52
All the alditol acetates produced were run on the GC using the method for
sugars analysis set out in Appendix C. The quantification used the calculations
from Sawardeker et al (1965).
2.8 Uronic acids
The uronic acid samples kept back from the neutral sugars analysis were
diluted with 2 ml of deionised water, to give a total volume of 2.5 ml. Standard
solutions (5, 15, 25 and 35 µg/ml) of glucuronic acid were made up. Four
screw-cap culture tubes per sample/standard were acid-washed, rinsed and
dried. The tubes were cooled in ice and cold water. To each tube, 1.2 ml of
sulfuric acid reagent (Appendix A) and 0.2 ml of sample/standard were added
before being vortexed and placed back in ice and cold water. The tubes were
sealed and heated in a hotblock (Techne) at 100-110°C for 10 min. The tubes
were cooled in ice and cold water, checking that they were completely cold
before proceeding. To three tubes of each set of four was added 20 µl of 0.15%
m-phenyl phenol in 0.5% NaOH to 3 of 4 replicates. The last tube of each set
had 20 µl of 0.5% NaOH added as a control. The tubes were vortexed for a
count of ten, and then put in a light-proof box to exclude light from the tubes.
After 40 min (parenchyma and epidermis samples) or 55 min (sub-epidermis
samples) in the dark, 0.2 ml of each sample/standard was transferred to the
wells in a plate for the plate reader. Standards had been out of the dark for
approximately two hours by the time the absorbance was measured. Standards
were used on both plates used. The plate reader measured the absorbance at
490 nm.
2.9 Methylation analysis of carbohydrate linkages
Three variations on the methylation method were used: the NaOH method, the
lithium dimsyl method, and the lithium dimsyl method with a carboxyl reduction
step. This analysis was done three separate times either personally or with the
help of Andrew Jay and not all methods were carried out on all occasions.
MATERIALS AND METHODS
53
2.9.1 NaOH-catalysed methylation analysis
The method of Nunes and Coimbra (2001) was modified for this part of the
methylation analysis. Triplicate samples (3.5-5 mg) of PCWM and SECWM
were weighed accurately into small screw cap vials (ECWM was not finely
divided enough to be worth attempting). A starch control (0.9 mg) and a blank
were also run to identify any contaminants. 1 ml of anhydrous dimethyl
sulfoxide (DMSO), which had been stored over activated molecular sieve
particles and tested for water using calcium hydride, was added to each vial.
The vials were sealed with a PTFE-lined septum. The septa were pierced using
short needles, and then the vials were put into a vacuum manifold. The
samples were twice degassed for about 5 minutes and then flushed with N2.
The needles were removed and the vials heated for 40 min at 90°C by standing
them on a hotblock at 90°C. The samples were sonicated for 1 hr at room
temperature. The samples were stored overnight at room temperature, and
then sonicated at room temperature for a further 1 hr 35 min. Sodium hydroxide
pellets were ground to a powder using a cleaned and dried Janke & Kunkel A10
mill (180 W, 20000rpm). As much sodium hydroxide as possible was collected
into a sealed vial before it started to absorb water. Approximately 0.25 g of
sodium hydroxide powder was added to each vial. The vials were sealed and
degassed for 1 hr (short needles through septa to vent gas), and then flushed
with N2. The samples were sonicated at room temperature for 1 hr and then
stored at 4°C for 30 min until they froze solid. 1 ml of methyl iodide was added
to each sample using a “bent” needle, while the vials were vented as before.
The samples were shaken until they had melted and mixed thoroughly with the
methyl iodide, and then stored overnight (~20 hr) at 4°C. To each sample 2 ml
of deionised water and 200 µl of glacial acetic acid were added. The vials were
shaken until well mixed. The methyl iodide was removed by bubbling N2
through the solution while the vials were standing on a hotblock at 40°C. Sep
Pak tC18 mini columns were preconditioned by sucking through 5 ml
acetonitrile and 5 ml deionised water under vacuum (Figure 19). Deionised
water (5 ml) was added to each sample, and then the samples were transferred
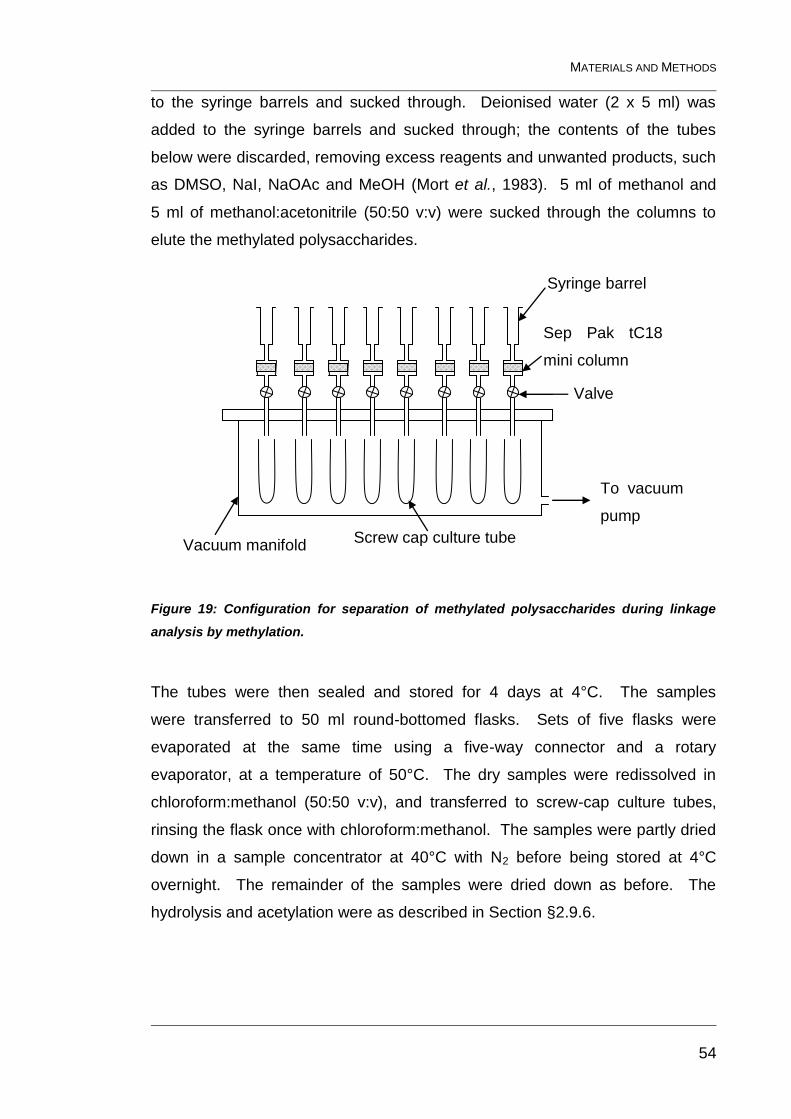
MATERIALS AND METHODS
54
to the syringe barrels and sucked through. Deionised water (2 x 5 ml) was
added to the syringe barrels and sucked through; the contents of the tubes
below were discarded, removing excess reagents and unwanted products, such
as DMSO, NaI, NaOAc and MeOH (Mort et al., 1983). 5 ml of methanol and
5 ml of methanol:acetonitrile (50:50 v:v) were sucked through the columns to
elute the methylated polysaccharides.
Figure 19: Configuration for separation of methylated polysaccharides during linkage
analysis by methylation.
The tubes were then sealed and stored for 4 days at 4°C. The samples
were transferred to 50 ml round-bottomed flasks. Sets of five flasks were
evaporated at the same time using a five-way connector and a rotary
evaporator, at a temperature of 50°C. The dry samples were redissolved in
chloroform:methanol (50:50 v:v), and transferred to screw-cap culture tubes,
rinsing the flask once with chloroform:methanol. The samples were partly dried
down in a sample concentrator at 40°C with N2 before being stored at 4°C
overnight. The remainder of the samples were dried down as before. The
hydrolysis and acetylation were as described in Section §2.9.6.
To vacuum
pump
Vacuum manifold Screw cap culture tube
Sep Pak tC18
mini column
Valve
Syringe barrel
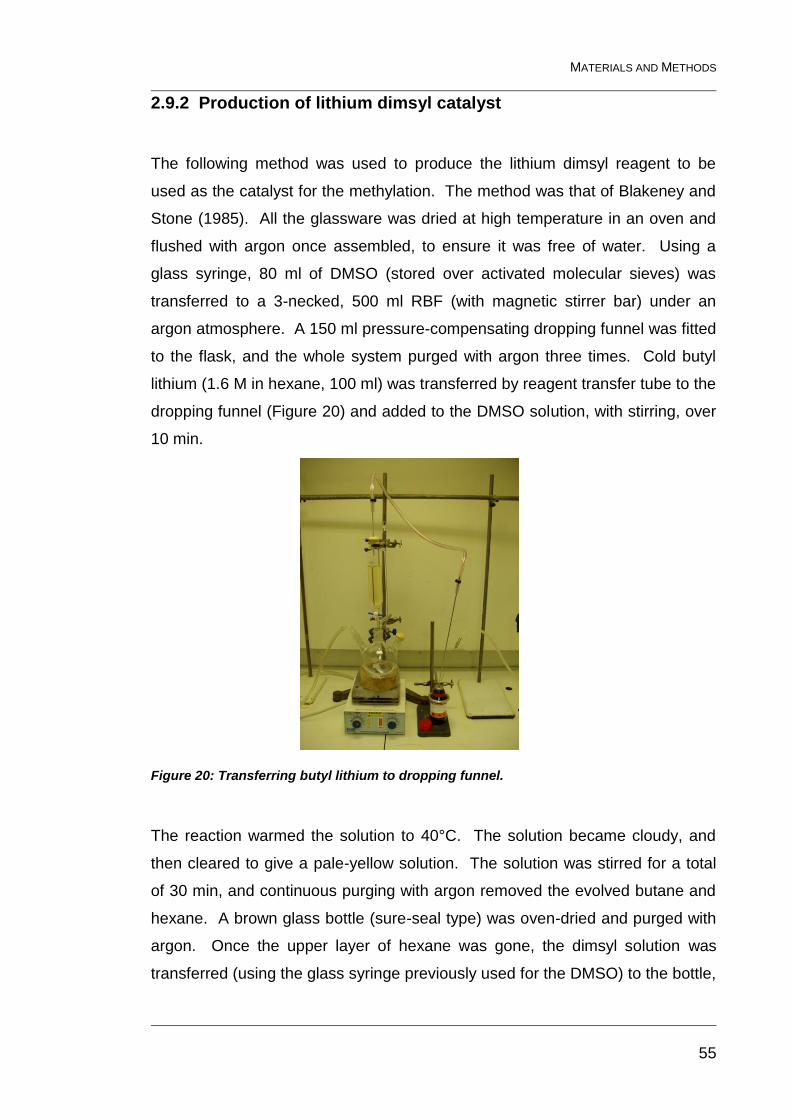
MATERIALS AND METHODS
55
2.9.2 Production of lithium dimsyl catalyst
The following method was used to produce the lithium dimsyl reagent to be
used as the catalyst for the methylation. The method was that of Blakeney and
Stone (1985). All the glassware was dried at high temperature in an oven and
flushed with argon once assembled, to ensure it was free of water. Using a
glass syringe, 80 ml of DMSO (stored over activated molecular sieves) was
transferred to a 3-necked, 500 ml RBF (with magnetic stirrer bar) under an
argon atmosphere. A 150 ml pressure-compensating dropping funnel was fitted
to the flask, and the whole system purged with argon three times. Cold butyl
lithium (1.6 M in hexane, 100 ml) was transferred by reagent transfer tube to the
dropping funnel (Figure 20) and added to the DMSO solution, with stirring, over
10 min.
Figure 20: Transferring butyl lithium to dropping funnel.
The reaction warmed the solution to 40°C. The solution became cloudy, and
then cleared to give a pale-yellow solution. The solution was stirred for a total
of 30 min, and continuous purging with argon removed the evolved butane and
hexane. A brown glass bottle (sure-seal type) was oven-dried and purged with
argon. Once the upper layer of hexane was gone, the dimsyl solution was
transferred (using the glass syringe previously used for the DMSO) to the bottle,
MATERIALS AND METHODS
56
which was sealed with a rubber septum; this was covered in foil and double
contained for storage in the freezer.
2.9.3 Samples and initial preparation for lithium dimsyl-catalysed
methylation
A blank tube and an acetan polysaccharide were used as controls. The acetan
had been produced in-house from Acetobacter xylinium (potassium salt, freeze-
dried) and had a defined structure (MacCormick et al., 1993; Ojinnaka et al.,
1996). The controls and samples, one each of PCWM Batches 1 and 2, were
dispersed in dry DMSO (1 ml) under argon by heating at 90°C for 1 hr, then
sonicating at 20°C for 2 hr. They were methylated using lithium dimsyl catalyst
as described below (§2.9.4); then the methylated samples were divided into
two, one portion to be carboxyl-reduced (§2.9.5), the other not, before being
hydrolysed and acetylated (§2.9.6).
2.9.4 Lithium dimsyl-catalysed methylation reaction
Lithium dimsyl catalyst (200 µl) was added to the samples using a 1 ml syringe
(with Teflon plunger) and then they were left to stand for 10 minutes. The
samples were stored in the freezer overnight, before adding 1 ml of methyl
iodide to the frozen samples, using a 1 ml syringe. The samples were mixed
until homogeneous and all frozen material had melted, before being stored over
4 nights at 4°C. Deionised water (2 ml) and acetic acid (200 µl) were added,
and then argon was bubbled gently through the solution to remove excess
methyl iodide at 42°C. Deionised water was added (3 ml), and then the solution
was washed into prepared dialysis tubing (MWCO 12-14000 Da) using more
water. Samples were dialysed against 5 litres of deionised water overnight, with
one change of water after 1-2 hr. The contents of each dialysis tube were
transferred to 50 ml round-bottomed flasks and evaporated to dryness before
being redissolved in 2 ml of chloroform:methanol (1:1 v:v) and filtered through a
plug of GF paper in a glass pipette into a sovirel tube. The RBF was rinsed with
MATERIALS AND METHODS
57
2 ml more of chloroform:methanol (1:1 v:v), which was also filtered. The
sample was split between two tubes, and was then dried down under N2 at
40°C. One from each set was dried in an evacuated desiccator over CaO to be
used in the carboxyl reduction.
2.9.5 Carboxyl reduction
The carboxyl reduction allows the detection of uronic acids, separate from their
neutral equivalents, hence providing more structural information about the
polysaccharides. The carboxyl reduction step needs to be done after the
methylation of the polysaccharide and before the acid hydrolysis. Lithium
triethylborodeuteride (LiBD(C2H5)3) is used as a molar solution in
tetrahydrofuran to reduce the methyl esters of the carboxyl groups on uronic
acids in methylated polysaccharides. They are reduced to di-deuterio-labelled
alcohols (unmethylated) at the C-6 of the sugar residues.
The samples that had been dried in a desiccator had 8 ml of LiBD(C2H5)3
solution added, using a clean, dry gas-tight syringe with Teflon barrel and “Luer-
lok” fitting with needle. The air space above the samples was quickly flushed
with argon and the tubes sealed before incubating at 64°C for 4-6 hours.
Having cooled overnight, ethanol was added dropwise with cautious mixing, and
then the samples were left overnight, unsealed to evolve hydrogen. Each
sample was poured into a 25 ml beaker, and 8 ml ethanol, 3 ml water and 2 ml
of 20% phosphoric acid (H3PO4) were added. Back neutralisation required the
addition of ~1 g of Na2CO3 and 2 ml water. The supernatant was decanted into
a 3 cm sintered glass funnel (no. 3) under suction to a 100 ml Buchner flask.
The beaker was rinsed with a further 10 ml of ethanol and 3 x 10 ml of
chloroform:methanol (1:1 v:v). The filtrate was transferred to a round-bottomed
flask and evaporated to dryness at 50°C, then redissolved in 2 x 2 ml
chloroform:methanol (1:1 v:v). The solution was filtered through a plug of GF
paper in a glass pipette, into a Sovirel tube, in which it was dried down under N2
at 40°C (Redgewell and Selvendran, 1986).
MATERIALS AND METHODS
58
2.9.6 Hydrolysis and acetylation
The method of Nunes and Coimbra (2001) was modified for this part of the
methylation analysis. The carboxyl-reduced and unreduced samples had 1 ml
of 2 M trifluoroacetic acid (TFA) added, the tubes were sealed, gently mixed
and heated at 121°C for 1 hr in order for the hydrolysis to occur. The samples
were evaporated until dry (~1 hr) at 40°C under N2. Two drops of 35%
ammonia was added to each tube, followed by 100 µl of 5% (w/w) NH3
containing 150 mg/ml of NaBD4, before heating for 1 hr at 30°C. The samples
were put on ice and 200 µl of glacial acetic acid (Riedel de Haën) was added to
neutralise the alkali. The samples were acetylated by adding 450 µl of
1-methylimidazole (Sigma) and 3 ml of acetic anhydride and incubating at 30°C
for 30 min, before cooling on ice. Each tube had 3-4 ml of deionised water and
3 ml of dichloromethane (Fluka) added before shaking vigorously and leaving to
separate. The tubes were centrifuged at 100 rpm for 1 min to separate the
layers. The lower organic layer, containing the partially methylated alditol
acetates, was removed by Pasteur pipette to a clean tube. The aqueous layer
was extracted with a further 2 ml of dichloromethane. The combined organic
layers were evaporated at 40°C, under a flow of N2, until only a viscous film
remained. The samples were then redissolved in 0.5 ml of acetone (Fisher).
The samples were transferred to two “yellow” Chromacol vials (0.15 ml per
sample), ready for analysis by GC and GC-MS. Standards were prepared by
purposely undermethylating monosaccharides by the NaOH method, without
the sonication steps. The GC and GC-MS (Agilent 5973 Mass Selective
Detector) were set up to run the same GC method, which is given in Appendix
D, where the mass spectrometry parameters are also listed. The GC-MS was
operated by John Eagles.
2.10 Microscopy
Mary Parker carried out light microscopy of the CWC parenchyma, epidermis
and sub-epidermis. Transverse sections of the epidermis of CWC were cut by
hand and photographed unstained under visible light, and under UV light at pH
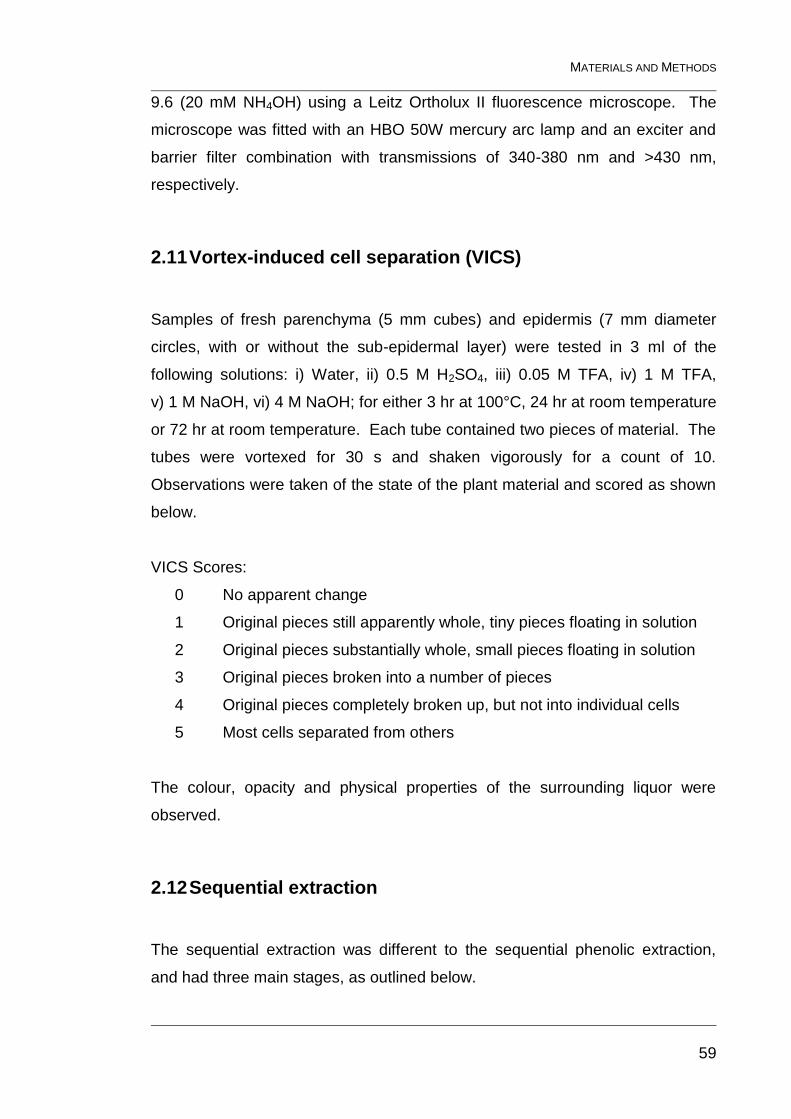
MATERIALS AND METHODS
59
9.6 (20 mM NH4OH) using a Leitz Ortholux II fluorescence microscope. The
microscope was fitted with an HBO 50W mercury arc lamp and an exciter and
barrier filter combination with transmissions of 340-380 nm and >430 nm,
respectively.
2.11 Vortex-induced cell separation (VICS)
Samples of fresh parenchyma (5 mm cubes) and epidermis (7 mm diameter
circles, with or without the sub-epidermal layer) were tested in 3 ml of the
following solutions: i) Water, ii) 0.5 M H2SO4, iii) 0.05 M TFA, iv) 1 M TFA,
v) 1 M NaOH, vi) 4 M NaOH; for either 3 hr at 100°C, 24 hr at room temperature
or 72 hr at room temperature. Each tube contained two pieces of material. The
tubes were vortexed for 30 s and shaken vigorously for a count of 10.
Observations were taken of the state of the plant material and scored as shown
below.
VICS Scores:
0 No apparent change
1 Original pieces still apparently whole, tiny pieces floating in solution
2 Original pieces substantially whole, small pieces floating in solution
3 Original pieces broken into a number of pieces
4 Original pieces completely broken up, but not into individual cells
5 Most cells separated from others
The colour, opacity and physical properties of the surrounding liquor were
observed.
2.12 Sequential extraction
The sequential extraction was different to the sequential phenolic extraction,
and had three main stages, as outlined below.
MATERIALS AND METHODS
60
2.12.1 CDTA extraction
The CDTA solution was prepared by mixing 0.48 g of Na2S2O5 and 9.1 g of
CDTA (Na+ salt, Sigma) in 400 ml deionised water (to give final concentrations
of 5 and 50 mM respectively). NaOH solution (2 M) was added dropwise,
bringing the pH back up to 7. As the pH increased the CDTA dissolved. The
solution was then made up to 500 ml with deionised water. PCWM (2 g, Batch
2) was extracted with 250 ml of 50mM CDTA at room temperature (~20°C) for
6 hr. The suspension was filtered through GF/C under vacuum and the residue
washed with additional deionised water. The filtrate was frozen at -20°C. The
residue was treated further with 250 ml of 50 mM CDTA for 2 hr, the residue
and filtrate separated as above and the filtrate frozen.
2.12.2 Na2CO3 extraction
The residue was sequentially extracted with 250 ml of 50 mM Na2CO3
(containing 20 mM NaBH4) at 4°C for 18 hr, then at room temperature (~20°C)
for 2 hr. The suspensions were filtered as above and the filtrates neutralised
with 4 M acetic acid to prevent further reaction. The filtrates were frozen and
the residue extracted further as described below.
2.12.3 KOH extraction
The residue was extracted in 250 ml of degassed 0.5 M, 1 M and 4 M KOH
containing 20 mM NaBH4 at room temperature for 2 hr. The KOH suspensions
were centrifuged at 15000g for 10 min at 18°C in a Beckmann Avanti J-20
centrifuge using polypropylene copolymer (PPCO) centrifuge bottles. The
supernatants were filtered as above and neutralised before being frozen. The
KOH supernatants were concentrated by rotary evaporation at 50°C, and then
dialysed against deionised water. The dialysed supernatants were frozen, and
then the supernatants and final residue were freeze-dried.
CHARACTERISATION
61
3 Characterisation of Cell Walls of Chinese Water Chestnut:
Phenolics of CWC parenchyma-cell walls have been studied previously by Parr
et al (1996), but not the epidermal tissues, which one would expect to contain
greater quantities of phenolics because they are coloured and in closer contact
with the waterlogged environment of a paddy field.
Cell-wall polysaccharides were investigated for the three tissues of CWC;
parenchyma (PCWM), epidermis (ECWM) and sub-epidermis (SECWM), in
order to verify the previous work done on CWC parenchyma by Parr et al (1996)
and extend this to the other tissues. The neutral sugars and total uronic acid
contents were quantified and their linkage patterns investigated to determine
the types of polysaccharide present. As CWC is a monocotyledon, one might
expect it to have a similar polysaccharide composition to that of other
monocotyledons.
3.1 Methods
Neutral sugars, uronic acids, phenolics and Klason lignin were quantified as
described in Chapter 2. Linkage analysis was also carried out as described in
Chapter 2. All analyses were carried out on Batch 1 CWM unless otherwise
stated.
3.2 Results
The yields of purified cell-wall material from the frozen parenchyma, epidermis
and sub-epidermis tissues were 5.7, 8.3 and 17.3 g/kg frozen tissue
respectively. This is a little low in respect to the parenchyma, but probably just
reflects inexperience with the method, as the yield for Batch 2 of parenchyma
was 9.6 g/kg frozen tissue.
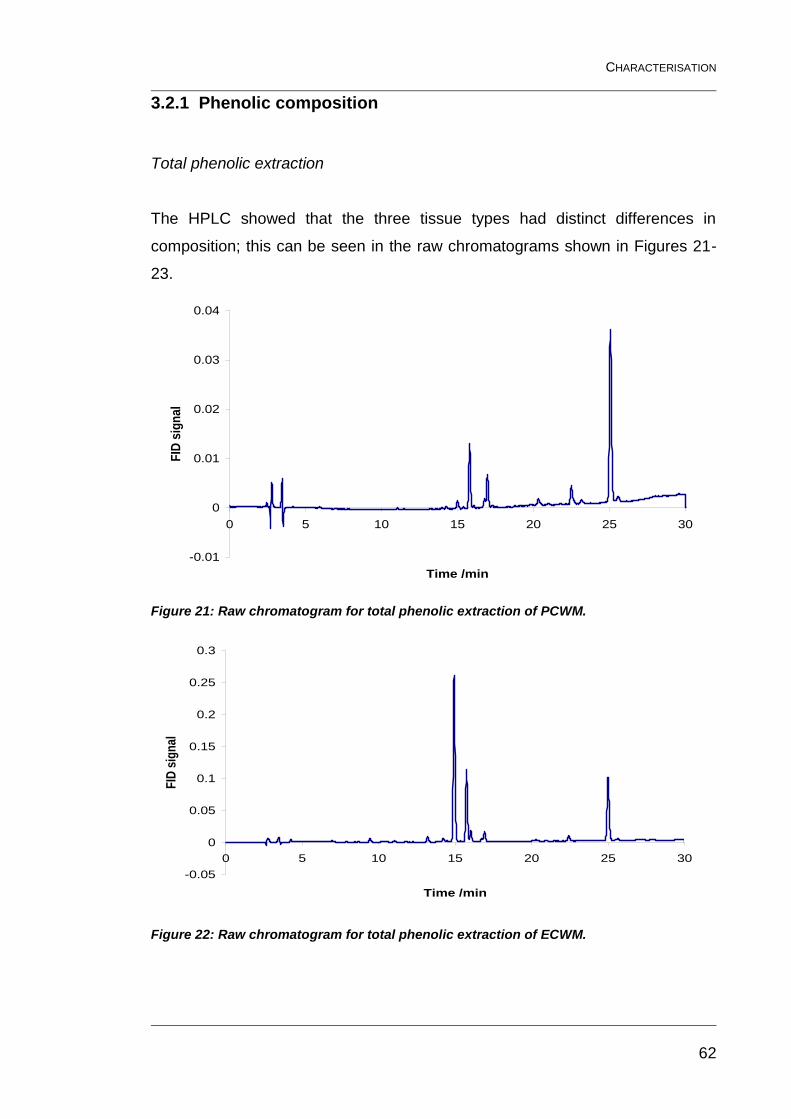
CHARACTERISATION
62
3.2.1 Phenolic composition
Total phenolic extraction
The HPLC showed that the three tissue types had distinct differences in
composition; this can be seen in the raw chromatograms shown in Figures 21-
23.
-0.01
0
0.01
0.02
0.03
0.04
0 5 10 15 20 25 30
Time /min
FID
sig
nal
Figure 21: Raw chromatogram for total phenolic extraction of PCWM.
-0.05
0
0.05
0.1
0.15
0.2
0.25
0.3
0 5 10 15 20 25 30
Time /min
FID
sig
nal
Figure 22: Raw chromatogram for total phenolic extraction of ECWM.
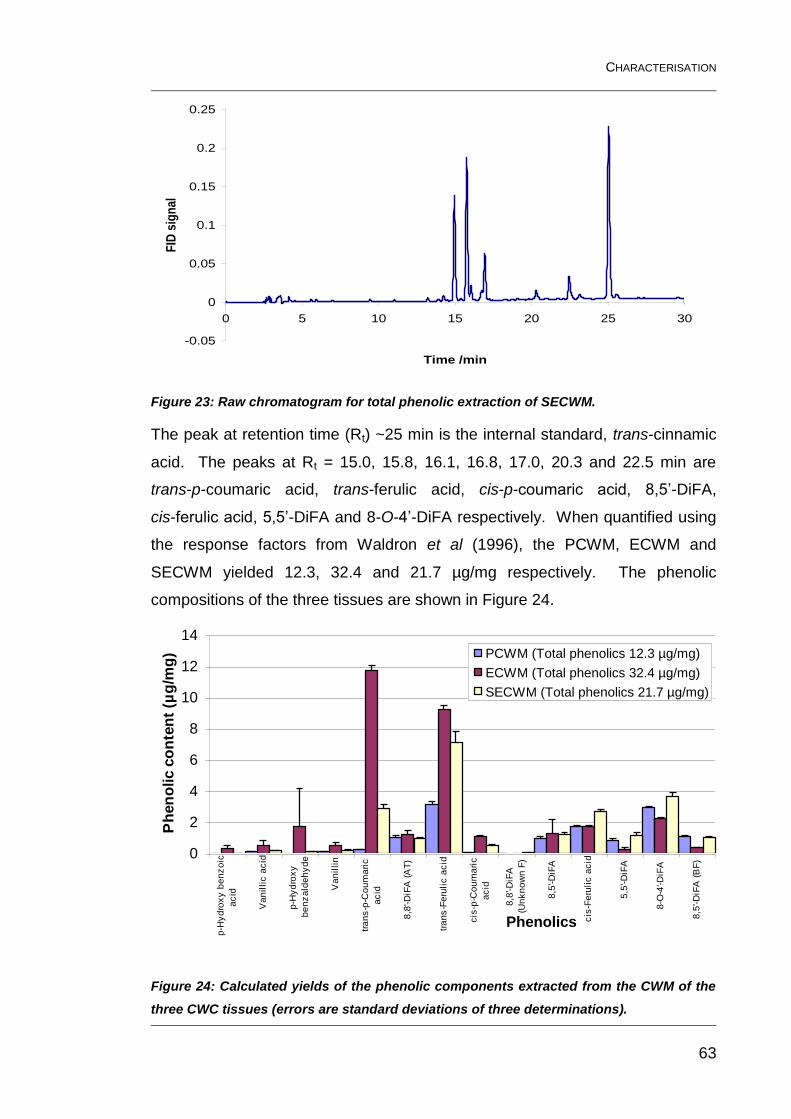
CHARACTERISATION
63
-0.05
0
0.05
0.1
0.15
0.2
0.25
0 5 10 15 20 25 30
Time /min
FID
sig
nal
Figure 23: Raw chromatogram for total phenolic extraction of SECWM.
The peak at retention time (Rt) ~25 min is the internal standard, trans-cinnamic
acid. The peaks at Rt = 15.0, 15.8, 16.1, 16.8, 17.0, 20.3 and 22.5 min are
trans-p-coumaric acid, trans-ferulic acid, cis-p-coumaric acid, 8,5’-DiFA,
cis-ferulic acid, 5,5’-DiFA and 8-O-4’-DiFA respectively. When quantified using
the response factors from Waldron et al (1996), the PCWM, ECWM and
SECWM yielded 12.3, 32.4 and 21.7 µg/mg respectively. The phenolic
compositions of the three tissues are shown in Figure 24.
0
2
4
6
8
10
12
14
p-H
yd
rox
y b
en
zo
ic
ac
id
Va
nil
lic
ac
id
p-H
yd
rox
y
be
nz
ald
eh
yd
e
Va
nil
lin
tra
ns
-p-C
ou
ma
ric
ac
id
8,8
'-DiF
A (
AT
)
tra
ns
-Fe
ruli
c a
cid
cis
-p-C
ou
ma
ric
ac
id
8,8
'-DiF
A
(Un
kn
ow
n F
)
8,5
'-DiF
A
cis
-Fe
ruli
c a
cid
5,5
'-DiF
A
8-O
-4'-D
iFA
8,5
'-DiF
A (
BF
)
Phenolics
Ph
en
olic c
on
ten
t (µ
g/m
g) PCWM (Total phenolics 12.3 µg/mg)
ECWM (Total phenolics 32.4 µg/mg)
SECWM (Total phenolics 21.7 µg/mg)
Figure 24: Calculated yields of the phenolic components extracted from the CWM of the
three CWC tissues (errors are standard deviations of three determinations).
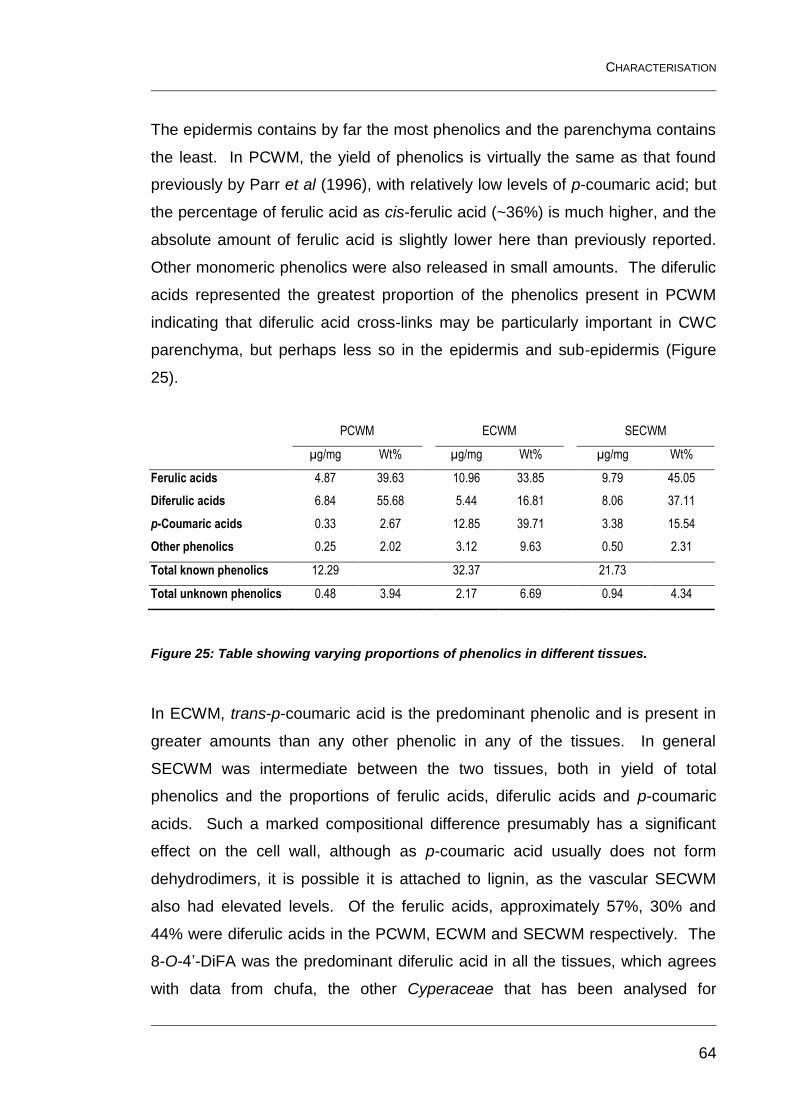
CHARACTERISATION
64
The epidermis contains by far the most phenolics and the parenchyma contains
the least. In PCWM, the yield of phenolics is virtually the same as that found
previously by Parr et al (1996), with relatively low levels of p-coumaric acid; but
the percentage of ferulic acid as cis-ferulic acid (~36%) is much higher, and the
absolute amount of ferulic acid is slightly lower here than previously reported.
Other monomeric phenolics were also released in small amounts. The diferulic
acids represented the greatest proportion of the phenolics present in PCWM
indicating that diferulic acid cross-links may be particularly important in CWC
parenchyma, but perhaps less so in the epidermis and sub-epidermis (Figure
25).
PCWM ECWM SECWM
µg/mg Wt% µg/mg Wt% µg/mg Wt%
Ferulic acids 4.87 39.63 10.96 33.85 9.79 45.05
Diferulic acids 6.84 55.68 5.44 16.81 8.06 37.11
p-Coumaric acids 0.33 2.67 12.85 39.71 3.38 15.54
Other phenolics 0.25 2.02 3.12 9.63 0.50 2.31
Total known phenolics 12.29 32.37 21.73
Total unknown phenolics 0.48 3.94 2.17 6.69 0.94 4.34
Figure 25: Table showing varying proportions of phenolics in different tissues.
In ECWM, trans-p-coumaric acid is the predominant phenolic and is present in
greater amounts than any other phenolic in any of the tissues. In general
SECWM was intermediate between the two tissues, both in yield of total
phenolics and the proportions of ferulic acids, diferulic acids and p-coumaric
acids. Such a marked compositional difference presumably has a significant
effect on the cell wall, although as p-coumaric acid usually does not form
dehydrodimers, it is possible it is attached to lignin, as the vascular SECWM
also had elevated levels. Of the ferulic acids, approximately 57%, 30% and
44% were diferulic acids in the PCWM, ECWM and SECWM respectively. The
8-O-4’-DiFA was the predominant diferulic acid in all the tissues, which agrees
with data from chufa, the other Cyperaceae that has been analysed for
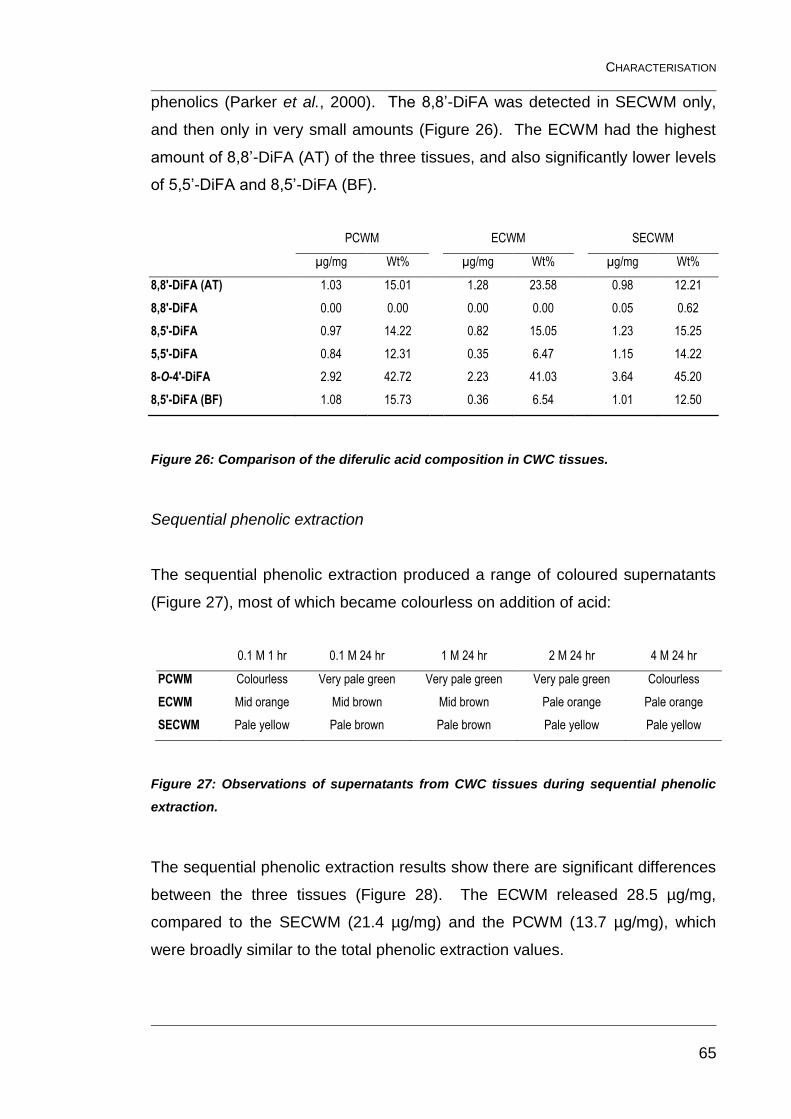
CHARACTERISATION
65
phenolics (Parker et al., 2000). The 8,8’-DiFA was detected in SECWM only,
and then only in very small amounts (Figure 26). The ECWM had the highest
amount of 8,8’-DiFA (AT) of the three tissues, and also significantly lower levels
of 5,5’-DiFA and 8,5’-DiFA (BF).
PCWM ECWM SECWM
µg/mg Wt% µg/mg Wt% µg/mg Wt%
8,8'-DiFA (AT) 1.03 15.01 1.28 23.58 0.98 12.21
8,8'-DiFA 0.00 0.00 0.00 0.00 0.05 0.62
8,5'-DiFA 0.97 14.22 0.82 15.05 1.23 15.25
5,5'-DiFA 0.84 12.31 0.35 6.47 1.15 14.22
8-O-4'-DiFA 2.92 42.72 2.23 41.03 3.64 45.20
8,5'-DiFA (BF) 1.08 15.73 0.36 6.54 1.01 12.50
Figure 26: Comparison of the diferulic acid composition in CWC tissues.
Sequential phenolic extraction
The sequential phenolic extraction produced a range of coloured supernatants
(Figure 27), most of which became colourless on addition of acid:
0.1 M 1 hr 0.1 M 24 hr 1 M 24 hr 2 M 24 hr 4 M 24 hr
PCWM Colourless Very pale green Very pale green Very pale green Colourless
ECWM Mid orange Mid brown Mid brown Pale orange Pale orange
SECWM Pale yellow Pale brown Pale brown Pale yellow Pale yellow
Figure 27: Observations of supernatants from CWC tissues during sequential phenolic
extraction.
The sequential phenolic extraction results show there are significant differences
between the three tissues (Figure 28). The ECWM released 28.5 µg/mg,
compared to the SECWM (21.4 µg/mg) and the PCWM (13.7 µg/mg), which
were broadly similar to the total phenolic extraction values.
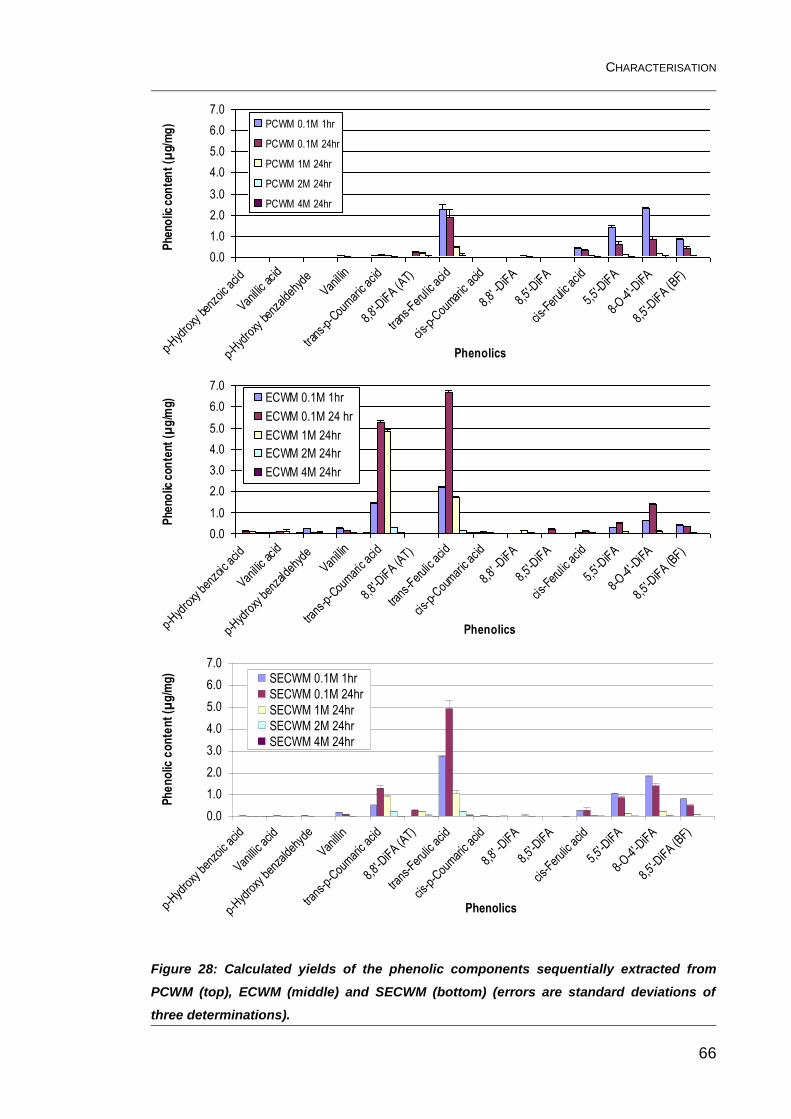
CHARACTERISATION
66
0.0
1.0
2.0
3.0
4.0
5.0
6.0
7.0
p-Hyd
roxy
benz
oic a
cid
Vanilli
c ac
id
p-Hyd
roxy
benz
aldeh
yde
Vanilli
n
trans
-p-C
oum
aric
acid
8,8'-
DiFA (A
T)
trans
-Fer
ulic
acid
cis-p
-Cou
maric
acid
8,8'
-DiF
A
8,5'-
DiFA
cis-F
eruli
c acid
5,5'-
DiFA
8-O
-4'-D
iFA
8,5'-
DiFA (B
F)
Phenolics
Phe
nolic
con
ten
t (µ
g/m
g) PCWM 0.1M 1hr
PCWM 0.1M 24hr
PCWM 1M 24hr
PCWM 2M 24hr
PCWM 4M 24hr
0.0
1.0
2.0
3.0
4.0
5.0
6.0
7.0
p-Hyd
roxy
benz
oic a
cid
Vanilli
c ac
id
p-Hyd
roxy
benz
aldeh
yde
Vanilli
n
trans
-p-C
oum
aric
acid
8,8'-
DiFA (A
T)
trans
-Fer
ulic a
cid
cis-p
-Cou
mar
ic ac
id
8,8'
-DiF
A
8,5'-
DiFA
cis-F
erul
ic ac
id
5,5'-
DiFA
8-O
-4'-D
iFA
8,5'-
DiFA (B
F)
Phenolics
Phe
nolic
con
tent
(µ
g/m
g) ECWM 0.1M 1hr
ECWM 0.1M 24 hr
ECWM 1M 24hr
ECWM 2M 24hr
ECWM 4M 24hr
0.0
1.0
2.0
3.0
4.0
5.0
6.0
7.0
p-Hyd
roxy
ben
zoic
acid
Vanilli
c acid
p-Hyd
roxy
ben
zalde
hyde
Vanilli
n
trans
-p-C
oum
aric
acid
8,8'-
DiFA (A
T)
trans
-Fer
ulic a
cid
cis-p
-Cou
mar
ic ac
id
8,8'
-DiF
A
8,5'-
DiFA
cis-F
eruli
c acid
5,5'-
DiFA
8-O-4
'-DiF
A
8,5'-
DiFA (B
F)
Phenolics
Ph
en
olic
co
nte
nt
(µg
/mg
) SECWM 0.1M 1hr
SECWM 0.1M 24hr
SECWM 1M 24hr
SECWM 2M 24hr
SECWM 4M 24hr
Figure 28: Calculated yields of the phenolic components sequentially extracted from
PCWM (top), ECWM (middle) and SECWM (bottom) (errors are standard deviations of
three determinations).
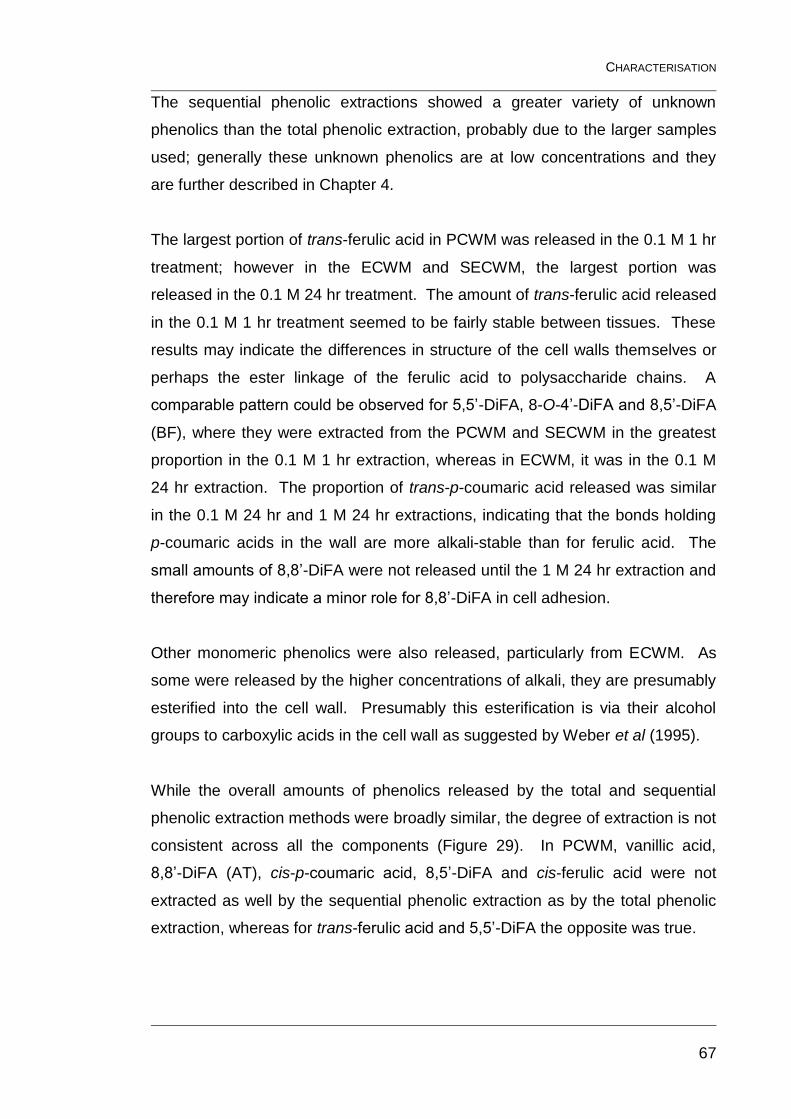
CHARACTERISATION
67
The sequential phenolic extractions showed a greater variety of unknown
phenolics than the total phenolic extraction, probably due to the larger samples
used; generally these unknown phenolics are at low concentrations and they
are further described in Chapter 4.
The largest portion of trans-ferulic acid in PCWM was released in the 0.1 M 1 hr
treatment; however in the ECWM and SECWM, the largest portion was
released in the 0.1 M 24 hr treatment. The amount of trans-ferulic acid released
in the 0.1 M 1 hr treatment seemed to be fairly stable between tissues. These
results may indicate the differences in structure of the cell walls themselves or
perhaps the ester linkage of the ferulic acid to polysaccharide chains. A
comparable pattern could be observed for 5,5’-DiFA, 8-O-4’-DiFA and 8,5’-DiFA
(BF), where they were extracted from the PCWM and SECWM in the greatest
proportion in the 0.1 M 1 hr extraction, whereas in ECWM, it was in the 0.1 M
24 hr extraction. The proportion of trans-p-coumaric acid released was similar
in the 0.1 M 24 hr and 1 M 24 hr extractions, indicating that the bonds holding
p-coumaric acids in the wall are more alkali-stable than for ferulic acid. The
small amounts of 8,8’-DiFA were not released until the 1 M 24 hr extraction and
therefore may indicate a minor role for 8,8’-DiFA in cell adhesion.
Other monomeric phenolics were also released, particularly from ECWM. As
some were released by the higher concentrations of alkali, they are presumably
esterified into the cell wall. Presumably this esterification is via their alcohol
groups to carboxylic acids in the cell wall as suggested by Weber et al (1995).
While the overall amounts of phenolics released by the total and sequential
phenolic extraction methods were broadly similar, the degree of extraction is not
consistent across all the components (Figure 29). In PCWM, vanillic acid,
8,8’-DiFA (AT), cis-p-coumaric acid, 8,5’-DiFA and cis-ferulic acid were not
extracted as well by the sequential phenolic extraction as by the total phenolic
extraction, whereas for trans-ferulic acid and 5,5’-DiFA the opposite was true.
CHARACTERISATION
68
0
50
100
150
200
250
300
350
Unkno
wn A
Unkno
wn B
p-Hyd
roxy
ben
zoic
acid
Vanilli
c acid
p-Hyd
roxy
ben
zalde
hyde
Vanilli
n
Unkno
wn D
Unkno
wn E
trans
-p-C
oum
aric
acid
8,8'-
DiFA (A
T)
trans
-Fer
ulic a
cid
cis-p
-Cou
mar
ic ac
id
8,8'
-DiF
A
8,5'-
DiFA
cis-F
eruli
c acid
5,5'-
DiFA
8-O-4
'-DiF
A
8,5'-
DiFA (B
F)
Unkno
wn G (m
ixtur
e)Tot
al
Phenolics
Per
cen
tag
e re
leas
ed c
om
par
ed t
o t
ota
l
ph
eno
lic e
xtra
ctio
n y
ield
s
PCWM 4 M 24 hr
PCWM 2 M 24 hr
PCWM 1 M 24 hr
PCWM 0.1 M 24 hr
PCWM 0.1 M 1 hr
0
50
100
150
200
250
300
350
Unkno
wn A
Unkno
wn B
p-Hyd
roxy
ben
zoic
acid
Vanilli
c acid
p-Hyd
roxy
ben
zalde
hyde
Vanilli
n
Unkno
wn D
Unkno
wn E
trans
-p-C
oum
aric
acid
8,8'-
DiFA (A
T)
trans
-Fer
ulic a
cid
cis-p
-Cou
mar
ic ac
id
8,8'
-DiF
A
8,5'-
DiFA
cis-F
eruli
c acid
5,5'-
DiFA
8-O-4
'-DiF
A
8,5'-
DiFA (B
F)
Unkno
wn G (m
ixtur
e)Tot
al
Phenolics
Per
cen
tag
e re
leas
ed c
om
par
ed t
o t
ota
l
ph
eno
lic e
xtra
ctio
n y
ield
s
ECWM 4 M 24 hr
ECWM 2 M 24 hr
ECWM 1 M 24 hr
ECWM 0.1 M 24 hr
ECWM 0.1 M 1 hr
0
50
100
150
200
250
300
350
Unkno
wn A
Unkno
wn B
p-Hyd
roxy
ben
zoic
acid
Vanilli
c acid
p-Hyd
roxy
ben
zalde
hyde
Vanilli
n
Unkno
wn D
Unkno
wn E
trans
-p-C
oum
aric
acid
8,8'-
DiFA (A
T)
trans
-Fer
ulic a
cid
cis-p
-Cou
mar
ic ac
id
8,8'
-DiF
A
8,5'-
DiFA
cis-F
eruli
c acid
5,5'-
DiFA
8-O-4
'-DiF
A
8,5'-
DiFA (B
F)
Unkno
wn G (m
ixtur
e)Tot
al
Phenolics
Per
cen
tag
e re
leas
ed c
om
par
ed t
o
tota
l ph
eno
lic e
xtra
ctio
n y
ield
s SECWM 4 M 24 hr
SECWM 2 M 24 hr
SECWM 1 M 24 hr
SECWM 0.1 M 24 hr
SECWM 0.1 M 1 hr
Figure 29: Percentage of phenolics released by sequential phenolic extraction compared
to total phenolic extraction yields for parenchyma, epidermis and sub-epidermis. PCWM
(top), ECWM (middle) and SECWM (bottom).
CHARACTERISATION
69
In ECWM, Unknown B, p-hydroxybenzaldehyde, cis-p-coumaric acid, 8,5’-DiFA,
cis-ferulic acid and Unknown G were not extracted as well by the sequential
phenolic extraction as by the total phenolic extraction, whereas more of
Unknown A, 5,5’-DiFA and 8,5’-DiFA (BF) were extracted. In SECWM,
Unknown B, 8,8’-DiFA (AT), cis-p-coumaric acid, 8,5’-DiFA and cis-ferulic acid
were extracted more by the total phenolic extraction, whereas Unknown A,
vanillin, 8,8’-DiFA and 5,5’-DiFA were extracted more by the sequential phenolic
extraction.
The greater than 100% extraction of components by the sequential phenolic
extraction may be due to the CWM being in alkali for a longer period of time in
the sequential extraction, which may allow extraction of less accessible
components. The less than 100% extraction of components by sequential
phenolic extraction is most likely to be due to decomposition.
HPLC-MS analysis
Preliminary results from the HPLC-MS analysis are given for specific
compounds in Figure 30. Assignments have been made on the basis of the
quasimolecular ion masses, such as M+H, M+Na and characteristic
fragmentation ions. An m/z=387 (M+H)+ indicates a diferulic acid, an m/z=579
(M+H)+ indicates a triferulic acid.
Two triferulic acids (TriFA) were identified at Rt=20.6 and 23.1 min. The first
trimer was indicated by peaks at m/z=543 (M-2H2O+H)+, 561 (M-H2O+H)+, 387
(DiFA+H)+ in positive ESI, and m/z=577 (M-H)- in negative ESI. The second
trimer was indicated by peaks at m/z=543 (M-2H2O+H)+, 561 (M-H2O+H)+, 579
(M+H)+, 593 (M-H2O+MeOH)+, 369 (DiFA-H2O)+, 193 (FA-H)+, in positive ESI
and m/z=577 (M-H)- in negative ESI. Accurate-mass HPLC-MS was carried out
on more concentrated samples and the results are given in Section §8.4.
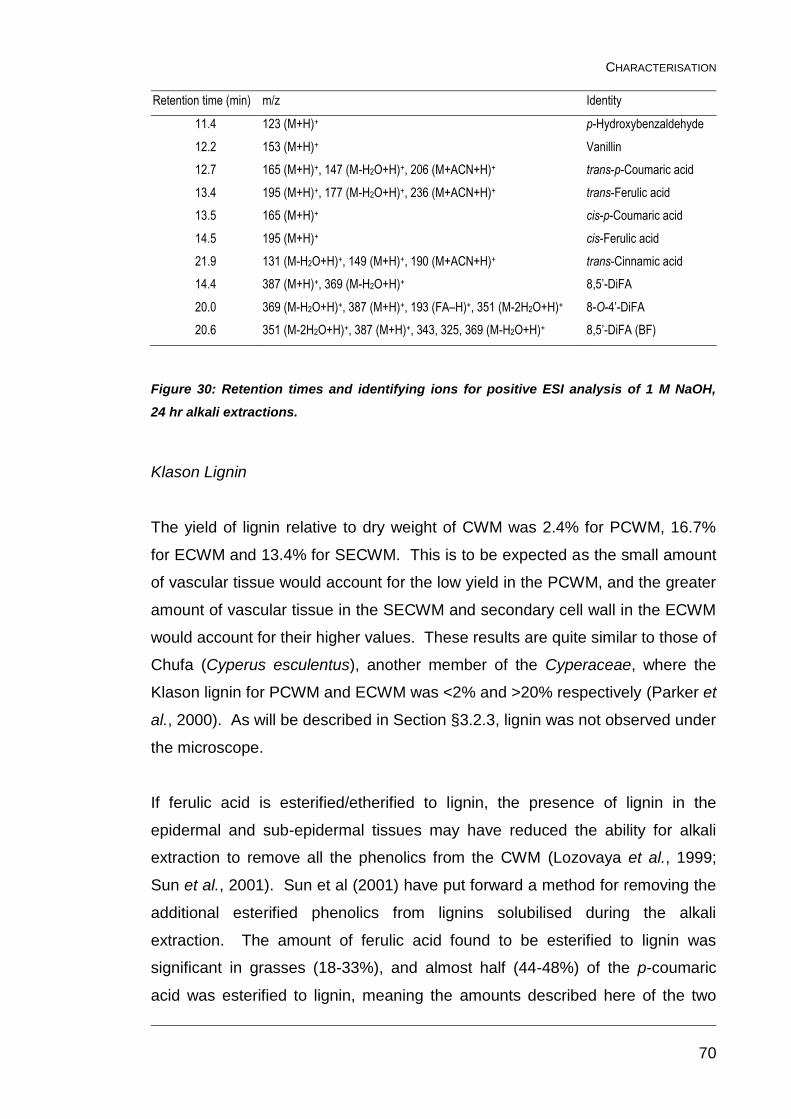
CHARACTERISATION
70
Retention time (min) m/z Identity
11.4 123 (M+H)+ p-Hydroxybenzaldehyde
12.2 153 (M+H)+ Vanillin
12.7 165 (M+H)+, 147 (M-H2O+H)+, 206 (M+ACN+H)+ trans-p-Coumaric acid
13.4 195 (M+H)+, 177 (M-H2O+H)+, 236 (M+ACN+H)+ trans-Ferulic acid
13.5 165 (M+H)+ cis-p-Coumaric acid
14.5 195 (M+H)+ cis-Ferulic acid
21.9 131 (M-H2O+H)+, 149 (M+H)+, 190 (M+ACN+H)+ trans-Cinnamic acid
14.4 387 (M+H)+, 369 (M-H2O+H)+ 8,5’-DiFA
20.0 369 (M-H2O+H)+, 387 (M+H)+, 193 (FA–H)+, 351 (M-2H2O+H)+ 8-O-4’-DiFA
20.6 351 (M-2H2O+H)+, 387 (M+H)+, 343, 325, 369 (M-H2O+H)+ 8,5’-DiFA (BF)
Figure 30: Retention times and identifying ions for positive ESI analysis of 1 M NaOH,
24 hr alkali extractions.
Klason Lignin
The yield of lignin relative to dry weight of CWM was 2.4% for PCWM, 16.7%
for ECWM and 13.4% for SECWM. This is to be expected as the small amount
of vascular tissue would account for the low yield in the PCWM, and the greater
amount of vascular tissue in the SECWM and secondary cell wall in the ECWM
would account for their higher values. These results are quite similar to those of
Chufa (Cyperus esculentus), another member of the Cyperaceae, where the
Klason lignin for PCWM and ECWM was <2% and >20% respectively (Parker et
al., 2000). As will be described in Section §3.2.3, lignin was not observed under
the microscope.
If ferulic acid is esterified/etherified to lignin, the presence of lignin in the
epidermal and sub-epidermal tissues may have reduced the ability for alkali
extraction to remove all the phenolics from the CWM (Lozovaya et al., 1999;
Sun et al., 2001). Sun et al (2001) have put forward a method for removing the
additional esterified phenolics from lignins solubilised during the alkali
extraction. The amount of ferulic acid found to be esterified to lignin was
significant in grasses (18-33%), and almost half (44-48%) of the p-coumaric
acid was esterified to lignin, meaning the amounts described here of the two
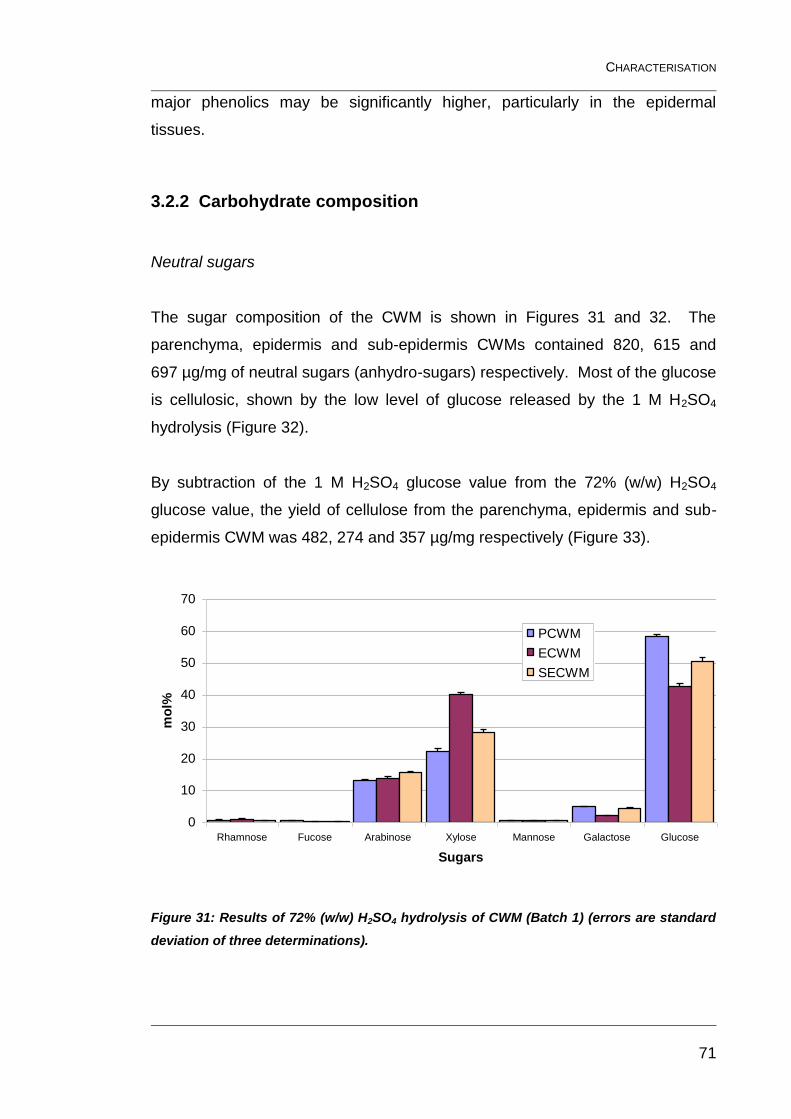
CHARACTERISATION
71
major phenolics may be significantly higher, particularly in the epidermal
tissues.
3.2.2 Carbohydrate composition
Neutral sugars
The sugar composition of the CWM is shown in Figures 31 and 32. The
parenchyma, epidermis and sub-epidermis CWMs contained 820, 615 and
697 µg/mg of neutral sugars (anhydro-sugars) respectively. Most of the glucose
is cellulosic, shown by the low level of glucose released by the 1 M H2SO4
hydrolysis (Figure 32).
By subtraction of the 1 M H2SO4 glucose value from the 72% (w/w) H2SO4
glucose value, the yield of cellulose from the parenchyma, epidermis and sub-
epidermis CWM was 482, 274 and 357 µg/mg respectively (Figure 33).
0
10
20
30
40
50
60
70
Rhamnose Fucose Arabinose Xylose Mannose Galactose Glucose
Sugars
mo
l%
PCWM
ECWM
SECWM
Figure 31: Results of 72% (w/w) H2SO4 hydrolysis of CWM (Batch 1) (errors are standard
deviation of three determinations).
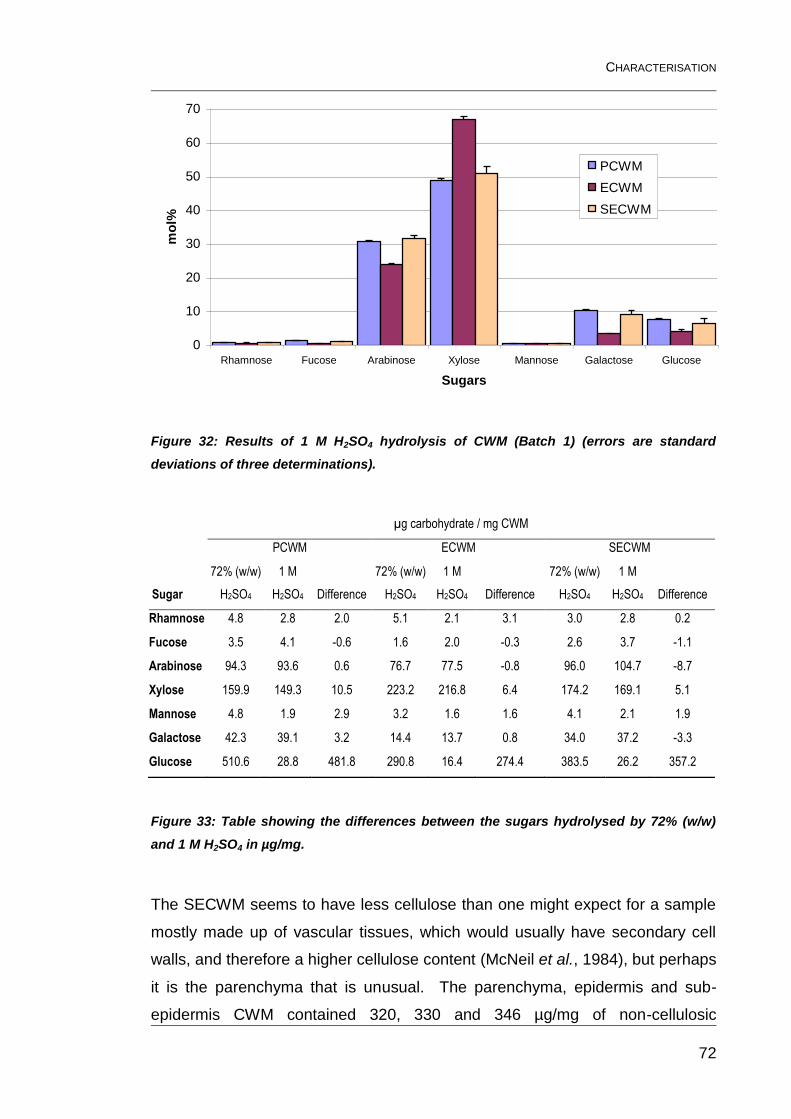
CHARACTERISATION
72
0
10
20
30
40
50
60
70
Rhamnose Fucose Arabinose Xylose Mannose Galactose Glucose
Sugars
mo
l%PCWM
ECWM
SECWM
Figure 32: Results of 1 M H2SO4 hydrolysis of CWM (Batch 1) (errors are standard
deviations of three determinations).
µg carbohydrate / mg CWM
PCWM ECWM SECWM
Sugar
72% (w/w)
H2SO4
1 M
H2SO4 Difference
72% (w/w)
H2SO4
1 M
H2SO4 Difference
72% (w/w)
H2SO4
1 M
H2SO4 Difference
Rhamnose 4.8 2.8 2.0 5.1 2.1 3.1 3.0 2.8 0.2
Fucose 3.5 4.1 -0.6 1.6 2.0 -0.3 2.6 3.7 -1.1
Arabinose 94.3 93.6 0.6 76.7 77.5 -0.8 96.0 104.7 -8.7
Xylose 159.9 149.3 10.5 223.2 216.8 6.4 174.2 169.1 5.1
Mannose 4.8 1.9 2.9 3.2 1.6 1.6 4.1 2.1 1.9
Galactose 42.3 39.1 3.2 14.4 13.7 0.8 34.0 37.2 -3.3
Glucose 510.6 28.8 481.8 290.8 16.4 274.4 383.5 26.2 357.2
Figure 33: Table showing the differences between the sugars hydrolysed by 72% (w/w)
and 1 M H2SO4 in µg/mg.
The SECWM seems to have less cellulose than one might expect for a sample
mostly made up of vascular tissues, which would usually have secondary cell
walls, and therefore a higher cellulose content (McNeil et al., 1984), but perhaps
it is the parenchyma that is unusual. The parenchyma, epidermis and sub-
epidermis CWM contained 320, 330 and 346 µg/mg of non-cellulosic
CHARACTERISATION
73
carbohydrate respectively. As can be seen in Figure 33, the composition of the
carbohydrates varied significantly between the different tissues. The
parenchyma had a larger proportion of glucose than the parenchyma or
epidermis, but it also had less xylose. The epidermis had significantly more
xylose than the other tissues, but less glucose and galactose. The sub-
epidermis sample generally had intermediate amounts apart from arabinose,
which was present in slightly greater amounts than in the other tissues. The low
level of mannose in all three tissues implied that there were very few, if any,
mannans, glucomannans or galactomannans in the CWC. Xylans, arabinans,
arabinoxylans and xyloglucans were likely to be more abundant cell-wall
polysaccharides.
The epidermis of the locule lining of pineapple, another sub-tropical monocot,
contained a similar mol% of each sugar as the epidermis of CWC, whereas the
parenchyma was fairly similar bar the proportion of glucose, which was
significantly higher in CWC than in pineapple (Smith and Harris, 1995). The cell
walls of chufa parenchyma have a broadly similar composition to PCWM, but
the amount of arabinose is higher and the amount of glucose is lower in chufa.
The cell walls of the chufa epidermis had a similar composition to those of
ECWM, but the amounts of arabinose and glucose were lower in chufa (Parker
et al., 2000).
Uronic acids
The average amounts of uronic acid in parenchyma, epidermis and sub-
epidermis were 124, 78 and 88 µg/mg of CWM respectively (raw data in
Appendix E). The errors for the epidermis and sub-epidermis samples were
quite large; this may have been due to the variation of particle size in these
tissues. No distinction between galacturonic and glucuronic acids could be
made using this method; therefore the uronic acid could have come from
rhamnogalacturonan, homogalacturonan or glucuronoarabinoxylan.
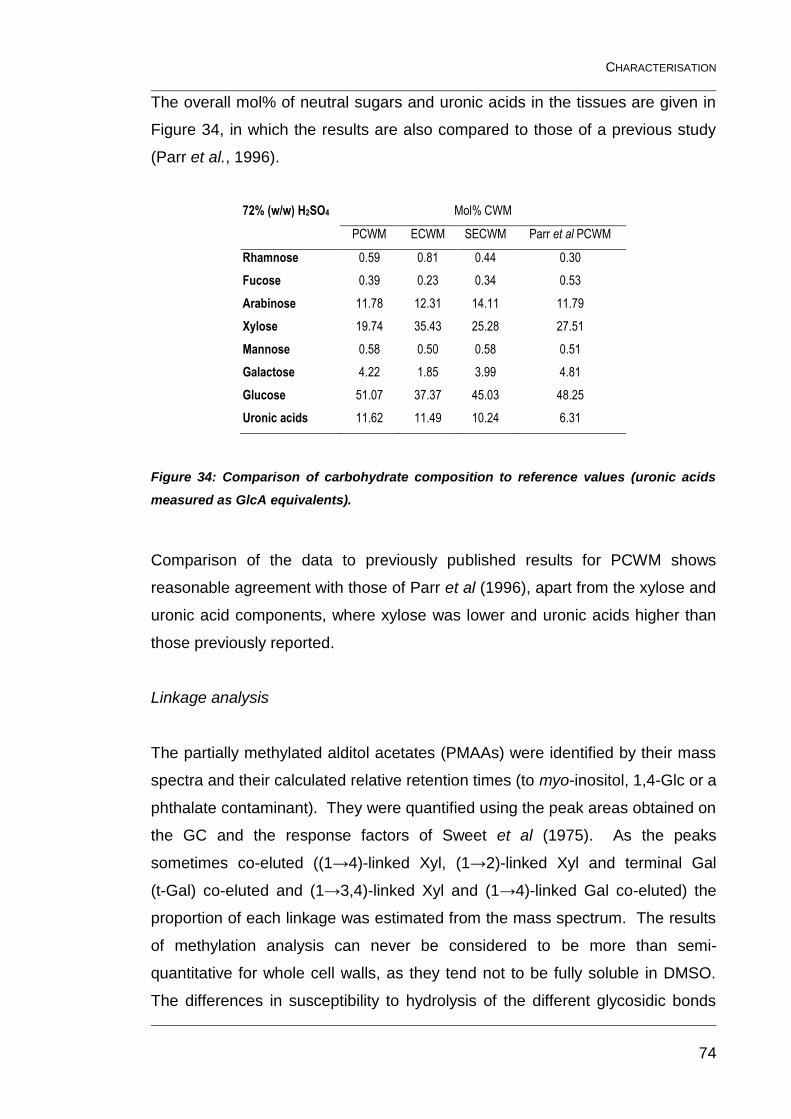
CHARACTERISATION
74
The overall mol% of neutral sugars and uronic acids in the tissues are given in
Figure 34, in which the results are also compared to those of a previous study
(Parr et al., 1996).
72% (w/w) H2SO4 Mol% CWM
PCWM ECWM SECWM Parr et al PCWM
Rhamnose 0.59 0.81 0.44 0.30
Fucose 0.39 0.23 0.34 0.53
Arabinose 11.78 12.31 14.11 11.79
Xylose 19.74 35.43 25.28 27.51
Mannose 0.58 0.50 0.58 0.51
Galactose 4.22 1.85 3.99 4.81
Glucose 51.07 37.37 45.03 48.25
Uronic acids 11.62 11.49 10.24 6.31
Figure 34: Comparison of carbohydrate composition to reference values (uronic acids
measured as GlcA equivalents).
Comparison of the data to previously published results for PCWM shows
reasonable agreement with those of Parr et al (1996), apart from the xylose and
uronic acid components, where xylose was lower and uronic acids higher than
those previously reported.
Linkage analysis
The partially methylated alditol acetates (PMAAs) were identified by their mass
spectra and their calculated relative retention times (to myo-inositol, 1,4-Glc or a
phthalate contaminant). They were quantified using the peak areas obtained on
the GC and the response factors of Sweet et al (1975). As the peaks
sometimes co-eluted ((1→4)-linked Xyl, (1→2)-linked Xyl and terminal Gal
(t-Gal) co-eluted and (1→3,4)-linked Xyl and (1→4)-linked Gal co-eluted) the
proportion of each linkage was estimated from the mass spectrum. The results
of methylation analysis can never be considered to be more than semi-
quantitative for whole cell walls, as they tend not to be fully soluble in DMSO.
The differences in susceptibility to hydrolysis of the different glycosidic bonds
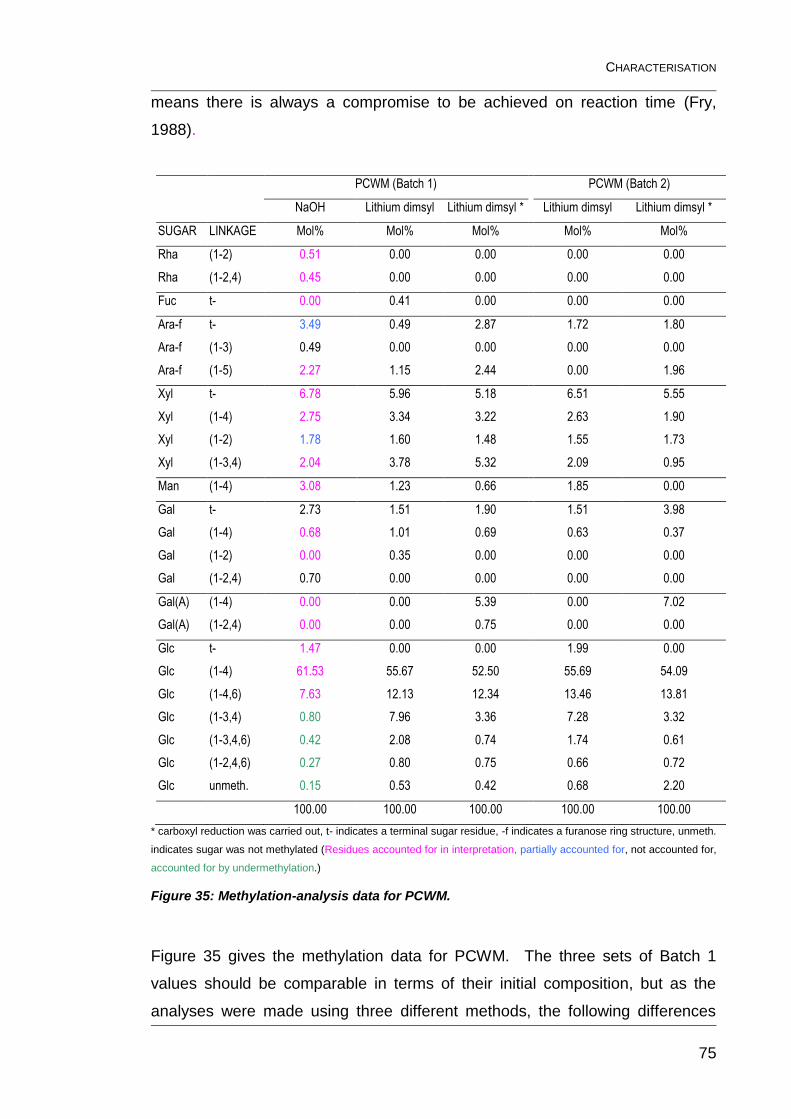
CHARACTERISATION
75
means there is always a compromise to be achieved on reaction time (Fry,
1988).
PCWM (Batch 1) PCWM (Batch 2)
NaOH Lithium dimsyl Lithium dimsyl * Lithium dimsyl Lithium dimsyl *
SUGAR LINKAGE Mol% Mol% Mol% Mol% Mol%
Rha (1-2) 0.51 0.00 0.00 0.00 0.00
Rha (1-2,4) 0.45 0.00 0.00 0.00 0.00
Fuc t- 0.00 0.41 0.00 0.00 0.00
Ara-f t- 3.49 0.49 2.87 1.72 1.80
Ara-f (1-3) 0.49 0.00 0.00 0.00 0.00
Ara-f (1-5) 2.27 1.15 2.44 0.00 1.96
Xyl t- 6.78 5.96 5.18 6.51 5.55
Xyl (1-4) 2.75 3.34 3.22 2.63 1.90
Xyl (1-2) 1.78 1.60 1.48 1.55 1.73
Xyl (1-3,4) 2.04 3.78 5.32 2.09 0.95
Man (1-4) 3.08 1.23 0.66 1.85 0.00
Gal t- 2.73 1.51 1.90 1.51 3.98
Gal (1-4) 0.68 1.01 0.69 0.63 0.37
Gal (1-2) 0.00 0.35 0.00 0.00 0.00
Gal (1-2,4) 0.70 0.00 0.00 0.00 0.00
Gal(A) (1-4) 0.00 0.00 5.39 0.00 7.02
Gal(A) (1-2,4) 0.00 0.00 0.75 0.00 0.00
Glc t- 1.47 0.00 0.00 1.99 0.00
Glc (1-4) 61.53 55.67 52.50 55.69 54.09
Glc (1-4,6) 7.63 12.13 12.34 13.46 13.81
Glc (1-3,4) 0.80 7.96 3.36 7.28 3.32
Glc (1-3,4,6) 0.42 2.08 0.74 1.74 0.61
Glc (1-2,4,6) 0.27 0.80 0.75 0.66 0.72
Glc unmeth. 0.15 0.53 0.42 0.68 2.20
100.00 100.00 100.00 100.00 100.00
* carboxyl reduction was carried out, t- indicates a terminal sugar residue, -f indicates a furanose ring structure, unmeth.
indicates sugar was not methylated (Residues accounted for in interpretation, partially accounted for, not accounted for,
accounted for by undermethylation.)
Figure 35: Methylation-analysis data for PCWM.
Figure 35 gives the methylation data for PCWM. The three sets of Batch 1
values should be comparable in terms of their initial composition, but as the
analyses were made using three different methods, the following differences
CHARACTERISATION
76
indicate presumed differences in the reaction kinetics/thermodynamics and/or
separation methods. For instance, the lithium dimsyl-catalysed samples
showed no rhamnose present, less arabinose was detected and the glucose
seemed to suffer more from undermethylation. Fucose and galactose were
present, whereas with the NaOH-catalysed samples no fucose or galactose was
detected. The use of Sep-Pak cartridges or dialysis may have affected the
composition detected if the oligosaccharides that were removed during dialysis,
but not Sep-Pak elution, were of a particular type. The tendency for uronic
acids to undergo β-elimination was minimised by having one addition of methyl
iodide, and that at as low a temperature as possible, but was probably not
negated completely.
Comparing the two batches of PCWM, the PMAAs present in larger amounts,
such as (1→4) and (1→4,6)-linked Glc, show reasonably close agreement, but
some of the others do not. There is a systematic difference between the
carboxyl-reduced samples and their non-reduced equivalents, the former
allowing the detection of (1→4)-linked GalA (and in Batch 1, some
(1→2,4)-linked GalA) along with more arabinose, but less mannose, galactose
and highly linked glucose, indicating a lower incidence of undermethylation than
with the lithium dimsyl method alone.
In both the non-reduced and reduced methods, Batch 1 had a higher total area
than Batch 2, so these results are probably more reliable, as it appears more
sample was injected on the column.
Taking into account the 72% (w/w) and 1 M H2SO4 results, which are probably
more accurate than the methylation analysis results, an estimated 50 mol% of
cell wall polysaccharide is cellulose, leaving 11.5 mol% of (1→4)-linked Glc in
other polysaccharides.
Adding this remaining (1→4)-linked Glc (11.5 mol%) to t-Xyl (6.8 mol%) and
(1→4,6)-linked Glc (7.6 mol%), t-Fuc (0.4 mol%), (1→2)-linked Gal (0.4 mol%)
and (1→2)-linked Xyl (0.4 mol%) results in approximately 27 mol% of
xyloglucan. By including at least one residue of each of the above types (plus
CHARACTERISATION
77
two t-Glc) the minimum degree of polymerisation of xyloglucan was estimated to
be 77 (33:18:21:1:1:1:2). The percentage of branching points as inferred from
the ratio of t-Xyl residues to total non-cellulosic (1→4)-linked and (1→4,6)-
linked Glc residues is ~35%. The amount of xyloglucan is particularly high for a
monocot, and would be considered quite high for a Type I wall (Fry, 1988).
Using the system of O’Neill and York (O'Neill and York, 2003) the repeating
units might be XXGG and XGGG, with some XFGG, which is more similar to
other Poales, such as maize than anything else described. The other possibility
is a mixture of XXGGG and XXFGG. Perhaps the high levels of xyloglucan in
the cell wall could be due to it being used as storage carbohydrate, as it is in
nasturtium seeds and tamarind (Waldron and Faulds, 2007).
Glucuronoxylans would usually be indicated by the (1→4)-linked Xyl, but the
lack of glucuronic acid precludes this interpretation (Femenia et al., 1999b);
instead t-Ara, (1→4)-linked and (1→3,4)-linked Xyl indicate arabinoxylans
(~7 mol%). By including at least one of each residue and two t-Xyl residues the
degree of polymerisation of arabinoxylan was estimated to be 29 (8:11:8:2),
which is probably lower than the reality. The percentage of branching points as
inferred from the ratio of (1→3,4)-linked Xyl residues to (1→4)-linked and
(1→3,4)-linked Xyl residues is ~43%
The proportions of GalA, Rha, Ara and Gal suggest two possible structural
configurations. The first, assumes that the polysaccharide is RG I with
significantly more GalA residues than Rha residues in the backbone, and long,
predominantly Ara and Gal side chains. Alternatively, there may be sections of
the polysaccharide that are predominantly homogalacturonan interspersed with
sections of RG I. The sum of (1→2)-linked and (1→2,4)-linked Rha, (1→4)-
linked GalA, (1→5)-linked Ara and (1→4)-linked Gal indicates ~9.3 mol% of
RG I/HG. The degree of polymerisation of this polymer was estimated to be
~207 (11:10:119:50:15:2), indicating the complexity of the polymer. The
percentage of branching points as inferred from the ratio of (1→2,4)-linked Rha
residues to (1→2)-linked and (1→2,4)-linked Rha and (1→4)-linked GalA
residues is ~7%, with approximately half of the rhamnose residues substituted.
CHARACTERISATION
78
Glucomannan is indicated by (1→4)-linked Man residues, and including
sufficient (1→4)-linked Glc to give a 2:1 Man:Glc ratio indicates ~4.5 mol% is
present. Glucomannan is the main hemicellulose polymer in the secondary
wall, one type of glucomannan (Man:Glc is 1.6:1) is found in the corms of
Amorphophallus species, as a carbohydrate reserve (Waldron and Faulds,
2007), and the same could be true for CWC.
A lack of (1→3)-linked Glc indicates there are no mixed linkage glucans or
callose present, as would be expected for a non-Graminaceous monocot
(McNeil et al., 1984). A lack of (1→3)-linked Gal indicates there are no AG II
polysaccharides present and therefore, as AG II is generally associated with
arabinogalactan proteins, there are unlikely to be any AGPs in the cell walls
(Waldron and Faulds, 2007). A lack of glucuronic acid rules out
glucuronomannans.
In vivo acetylation of (1→4)-linked Glc at C3 may produce (1→3,4)-linked Glc
residues under mild methylation conditions (Ryden and Selvendran, 1990). The
(1→3,4)-linked Glc residues may also have been produced by
undermethylation, thought to be responsible for the improbable (1→3,4,6)-
linked, (1→2,4,6)-linked and (1→2,3,4,6)-linked Glc residues.
Undermethylation is probably due to steric crowding within the cellulose
microfibrils.
The presence of only (1→3,4) Xyl and not (1→2,4) Xyl branching points in the
arabinoxylan implies it is more like those of the Gramineae (i.e. Oat spelt), but
essentially the opposite of birchwood and larchwood xylans, which have only
(1→2,4) Xyl branching points (Waldron and Faulds, 2007).
Onion has a significant proportion of xyloglucan in the cell wall, indicating it is
more similar to dicotyledon parenchyma tissue than grass mesophyll
(Redgewell and Selvendran, 1986); the same can now be said of CWC PCWM.
Methylation of the other tissues was also carried out. The SECWM underwent
methylation with NaOH catalysis at the same time as the PCWM did; however
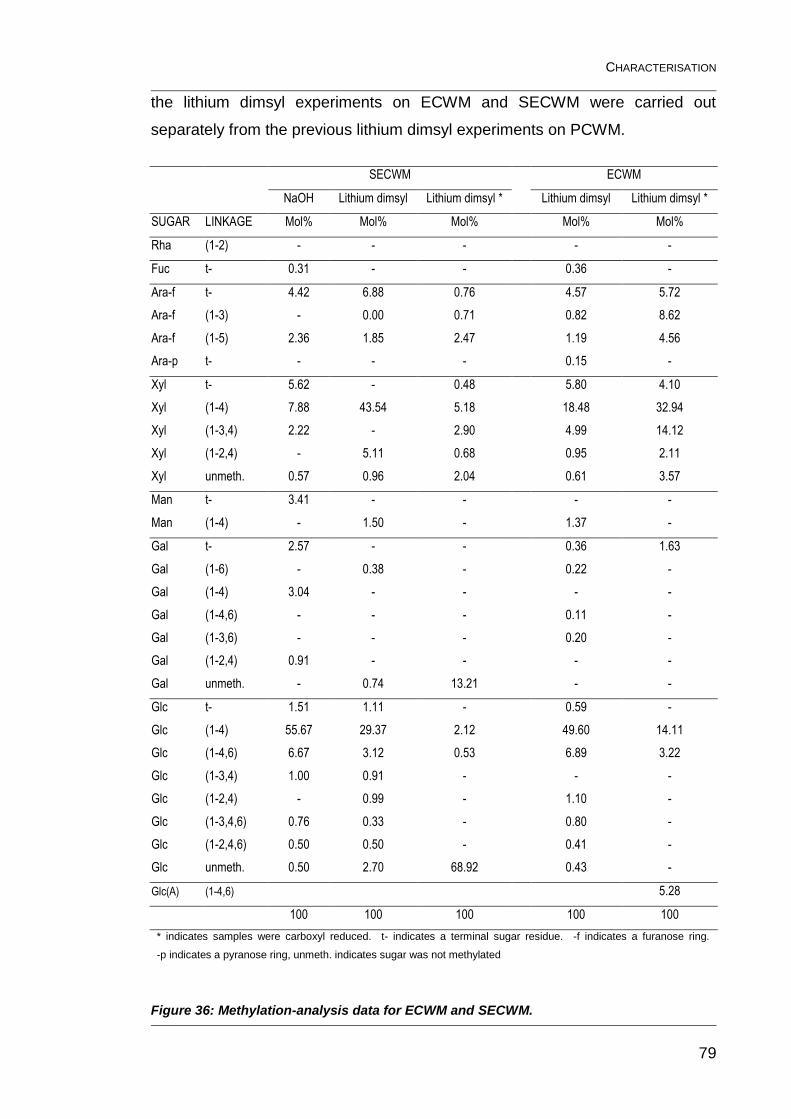
CHARACTERISATION
79
the lithium dimsyl experiments on ECWM and SECWM were carried out
separately from the previous lithium dimsyl experiments on PCWM.
SECWM ECWM
NaOH Lithium dimsyl Lithium dimsyl * Lithium dimsyl Lithium dimsyl *
SUGAR LINKAGE Mol% Mol% Mol% Mol% Mol%
Rha (1-2) - - - - -
Fuc t- 0.31 - - 0.36 -
Ara-f t- 4.42 6.88 0.76 4.57 5.72
Ara-f (1-3) - 0.00 0.71 0.82 8.62
Ara-f (1-5) 2.36 1.85 2.47 1.19 4.56
Ara-p t- - - - 0.15 -
Xyl t- 5.62 - 0.48 5.80 4.10
Xyl (1-4) 7.88 43.54 5.18 18.48 32.94
Xyl (1-3,4) 2.22 - 2.90 4.99 14.12
Xyl (1-2,4) - 5.11 0.68 0.95 2.11
Xyl unmeth. 0.57 0.96 2.04 0.61 3.57
Man t- 3.41 - - - -
Man (1-4) - 1.50 - 1.37 -
Gal t- 2.57 - - 0.36 1.63
Gal (1-6) - 0.38 - 0.22 -
Gal (1-4) 3.04 - - - -
Gal (1-4,6) - - - 0.11 -
Gal (1-3,6) - - - 0.20 -
Gal (1-2,4) 0.91 - - - -
Gal unmeth. - 0.74 13.21 - -
Glc t- 1.51 1.11 - 0.59 -
Glc (1-4) 55.67 29.37 2.12 49.60 14.11
Glc (1-4,6) 6.67 3.12 0.53 6.89 3.22
Glc (1-3,4) 1.00 0.91 - - -
Glc (1-2,4) - 0.99 - 1.10 -
Glc (1-3,4,6) 0.76 0.33 - 0.80 -
Glc (1-2,4,6) 0.50 0.50 - 0.41 -
Glc unmeth. 0.50 2.70 68.92 0.43 -
Glc(A) (1-4,6) 5.28
100 100 100 100 100
* indicates samples were carboxyl reduced. t- indicates a terminal sugar residue. -f indicates a furanose ring.
-p indicates a pyranose ring, unmeth. indicates sugar was not methylated
Figure 36: Methylation-analysis data for ECWM and SECWM.
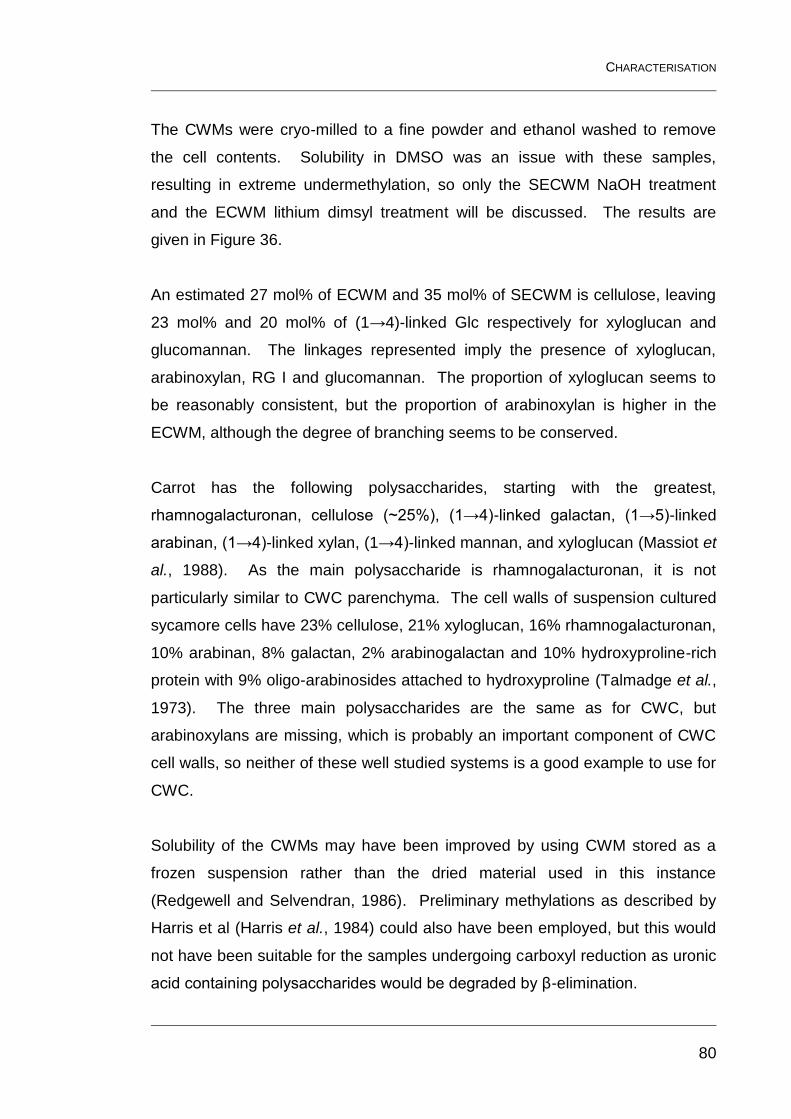
CHARACTERISATION
80
The CWMs were cryo-milled to a fine powder and ethanol washed to remove
the cell contents. Solubility in DMSO was an issue with these samples,
resulting in extreme undermethylation, so only the SECWM NaOH treatment
and the ECWM lithium dimsyl treatment will be discussed. The results are
given in Figure 36.
An estimated 27 mol% of ECWM and 35 mol% of SECWM is cellulose, leaving
23 mol% and 20 mol% of (1→4)-linked Glc respectively for xyloglucan and
glucomannan. The linkages represented imply the presence of xyloglucan,
arabinoxylan, RG I and glucomannan. The proportion of xyloglucan seems to
be reasonably consistent, but the proportion of arabinoxylan is higher in the
ECWM, although the degree of branching seems to be conserved.
Carrot has the following polysaccharides, starting with the greatest,
rhamnogalacturonan, cellulose (~25%), (1→4)-linked galactan, (1→5)-linked
arabinan, (1→4)-linked xylan, (1→4)-linked mannan, and xyloglucan (Massiot et
al., 1988). As the main polysaccharide is rhamnogalacturonan, it is not
particularly similar to CWC parenchyma. The cell walls of suspension cultured
sycamore cells have 23% cellulose, 21% xyloglucan, 16% rhamnogalacturonan,
10% arabinan, 8% galactan, 2% arabinogalactan and 10% hydroxyproline-rich
protein with 9% oligo-arabinosides attached to hydroxyproline (Talmadge et al.,
1973). The three main polysaccharides are the same as for CWC, but
arabinoxylans are missing, which is probably an important component of CWC
cell walls, so neither of these well studied systems is a good example to use for
CWC.
Solubility of the CWMs may have been improved by using CWM stored as a
frozen suspension rather than the dried material used in this instance
(Redgewell and Selvendran, 1986). Preliminary methylations as described by
Harris et al (Harris et al., 1984) could also have been employed, but this would
not have been suitable for the samples undergoing carboxyl reduction as uronic
acid containing polysaccharides would be degraded by β-elimination.
CHARACTERISATION
81
The ratio of arabinose to xylose for arabinoxylans that bind to cellulose is 0.44
(22% branching), for arabinoxylans that do not bind to cellulose the ratio is 1.38
(65% branching, half of which are doubly branched) (McNeil et al., 1975). The
ratio of arabinose to xylose is 0.42 in CWC parenchyma. Highly substituted
xylans are more likely to be flexible enough to support intramolecular formation
of dimers (Hatfield 1999), but PCWM arabinoxylans have an intermediate
degree of substitution, which may hinder the formation of dimers extracellularly,
but not intraprotoplasmically.
3.2.3 Microscopy
CWC flesh has been shown previously to autofluoresce under alkali conditions
(Brett and Waldron, 1996), but again these investigations did not include the
skin. Figure 37a shows the morphology and natural pigmentation of the CWC
epidermis. Figure 37b shows the yellow/green autofluorescence of the
parenchyma cell walls at pH 9.6, the outer cortex cell walls are turquoise
indicating the presence of ferulic acid, the vascular bundles that serve the buds
and scales on the surface in the skin are blue indicating the presence of lignin.
Figure 37: CWC sections illuminated by visible light (a); and UV light at pH 9.6 (b) (scale
bar is 100 µm).
The autofluorescence seems to taper out towards the surface. This is unlikely
to be due to a lack of phenolics, as the total and sequential extractions of
phenolics showed the epidermis contained more than the parenchyma. This
(a) (b)
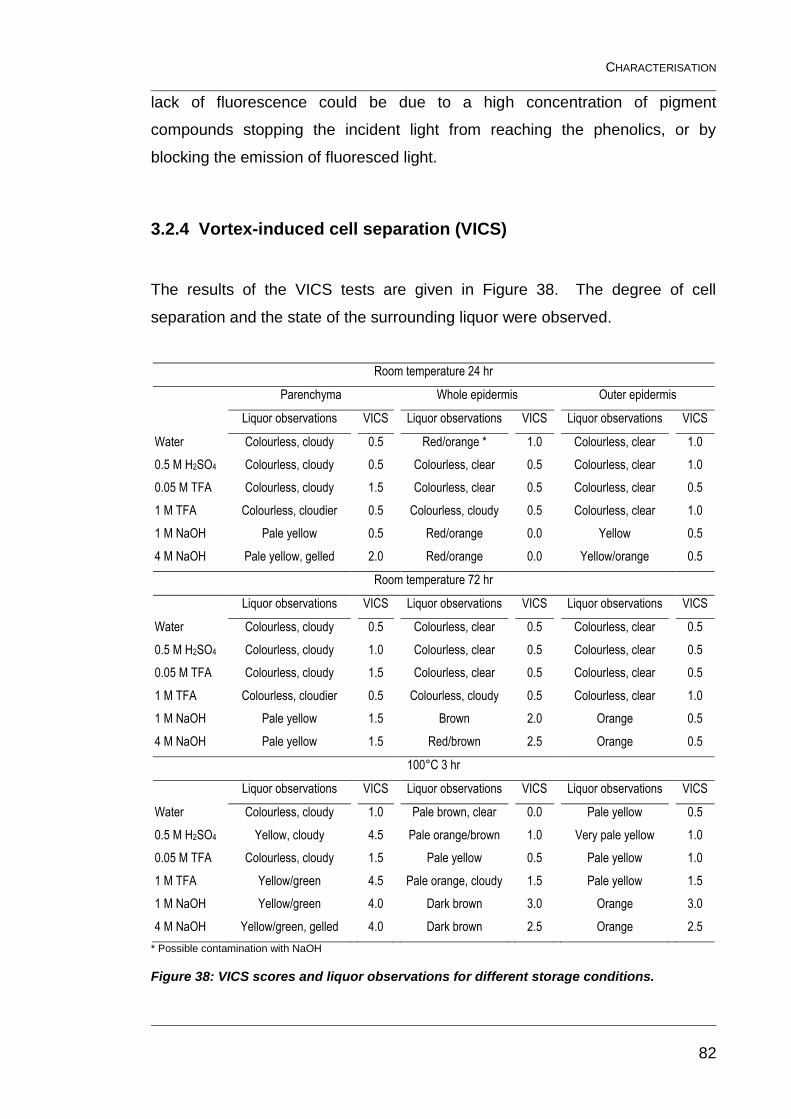
CHARACTERISATION
82
lack of fluorescence could be due to a high concentration of pigment
compounds stopping the incident light from reaching the phenolics, or by
blocking the emission of fluoresced light.
3.2.4 Vortex-induced cell separation (VICS)
The results of the VICS tests are given in Figure 38. The degree of cell
separation and the state of the surrounding liquor were observed.
Room temperature 24 hr
Parenchyma Whole epidermis Outer epidermis
Liquor observations VICS Liquor observations VICS Liquor observations VICS
Water Colourless, cloudy 0.5 Red/orange * 1.0 Colourless, clear 1.0
0.5 M H2SO4 Colourless, cloudy 0.5 Colourless, clear 0.5 Colourless, clear 1.0
0.05 M TFA Colourless, cloudy 1.5 Colourless, clear 0.5 Colourless, clear 0.5
1 M TFA Colourless, cloudier 0.5 Colourless, cloudy 0.5 Colourless, clear 1.0
1 M NaOH Pale yellow 0.5 Red/orange 0.0 Yellow 0.5
4 M NaOH Pale yellow, gelled 2.0 Red/orange 0.0 Yellow/orange 0.5
Room temperature 72 hr
Liquor observations VICS Liquor observations VICS Liquor observations VICS
Water Colourless, cloudy 0.5 Colourless, clear 0.5 Colourless, clear 0.5
0.5 M H2SO4 Colourless, cloudy 1.0 Colourless, clear 0.5 Colourless, clear 0.5
0.05 M TFA Colourless, cloudy 1.5 Colourless, clear 0.5 Colourless, clear 0.5
1 M TFA Colourless, cloudier 0.5 Colourless, cloudy 0.5 Colourless, clear 1.0
1 M NaOH Pale yellow 1.5 Brown 2.0 Orange 0.5
4 M NaOH Pale yellow 1.5 Red/brown 2.5 Orange 0.5
100°C 3 hr
Liquor observations VICS Liquor observations VICS Liquor observations VICS
Water Colourless, cloudy 1.0 Pale brown, clear 0.0 Pale yellow 0.5
0.5 M H2SO4 Yellow, cloudy 4.5 Pale orange/brown 1.0 Very pale yellow 1.0
0.05 M TFA Colourless, cloudy 1.5 Pale yellow 0.5 Pale yellow 1.0
1 M TFA Yellow/green 4.5 Pale orange, cloudy 1.5 Pale yellow 1.5
1 M NaOH Yellow/green 4.0 Dark brown 3.0 Orange 3.0
4 M NaOH Yellow/green, gelled 4.0 Dark brown 2.5 Orange 2.5
* Possible contamination with NaOH
Figure 38: VICS scores and liquor observations for different storage conditions.
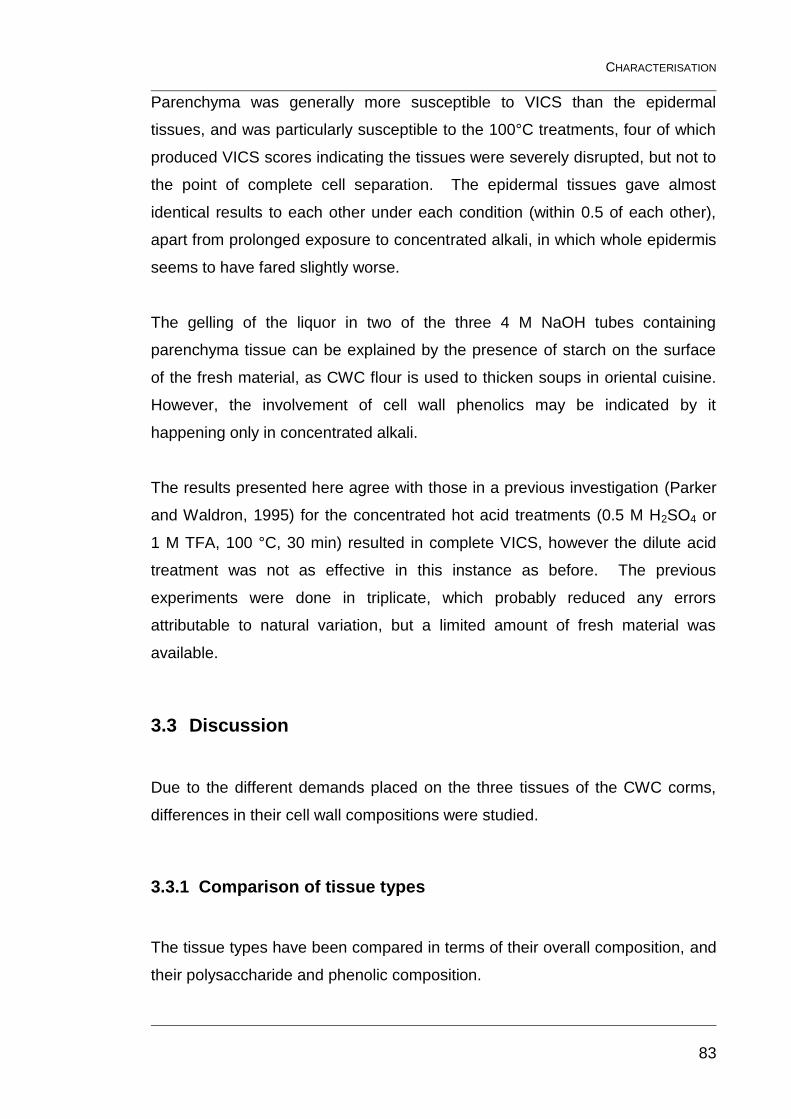
CHARACTERISATION
83
Parenchyma was generally more susceptible to VICS than the epidermal
tissues, and was particularly susceptible to the 100°C treatments, four of which
produced VICS scores indicating the tissues were severely disrupted, but not to
the point of complete cell separation. The epidermal tissues gave almost
identical results to each other under each condition (within 0.5 of each other),
apart from prolonged exposure to concentrated alkali, in which whole epidermis
seems to have fared slightly worse.
The gelling of the liquor in two of the three 4 M NaOH tubes containing
parenchyma tissue can be explained by the presence of starch on the surface
of the fresh material, as CWC flour is used to thicken soups in oriental cuisine.
However, the involvement of cell wall phenolics may be indicated by it
happening only in concentrated alkali.
The results presented here agree with those in a previous investigation (Parker
and Waldron, 1995) for the concentrated hot acid treatments (0.5 M H2SO4 or
1 M TFA, 100 °C, 30 min) resulted in complete VICS, however the dilute acid
treatment was not as effective in this instance as before. The previous
experiments were done in triplicate, which probably reduced any errors
attributable to natural variation, but a limited amount of fresh material was
available.
3.3 Discussion
Due to the different demands placed on the three tissues of the CWC corms,
differences in their cell wall compositions were studied.
3.3.1 Comparison of tissue types
The tissue types have been compared in terms of their overall composition, and
their polysaccharide and phenolic composition.
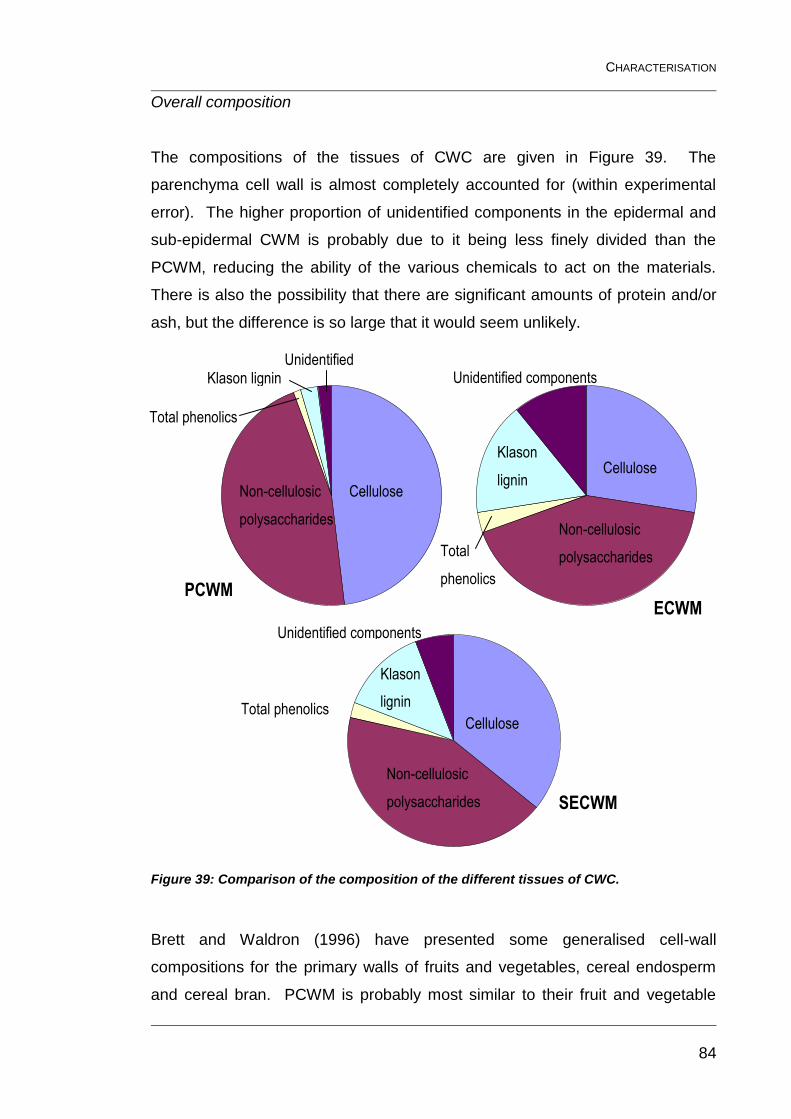
CHARACTERISATION
84
Overall composition
The compositions of the tissues of CWC are given in Figure 39. The
parenchyma cell wall is almost completely accounted for (within experimental
error). The higher proportion of unidentified components in the epidermal and
sub-epidermal CWM is probably due to it being less finely divided than the
PCWM, reducing the ability of the various chemicals to act on the materials.
There is also the possibility that there are significant amounts of protein and/or
ash, but the difference is so large that it would seem unlikely.
Figure 39: Comparison of the composition of the different tissues of CWC.
Brett and Waldron (1996) have presented some generalised cell-wall
compositions for the primary walls of fruits and vegetables, cereal endosperm
and cereal bran. PCWM is probably most similar to their fruit and vegetable
Cellulose
Cellulose
Cellulose
ECWM PCWM
SECWM
Total phenolics
Total
phenolics
Total phenolics
Klason
lignin
Klason lignin
Klason
lignin
Unidentified components
Unidentified
components Unidentified components
Non-cellulosic
polysaccharides
Non-cellulosic
polysaccharides
Non-cellulosic
polysaccharides
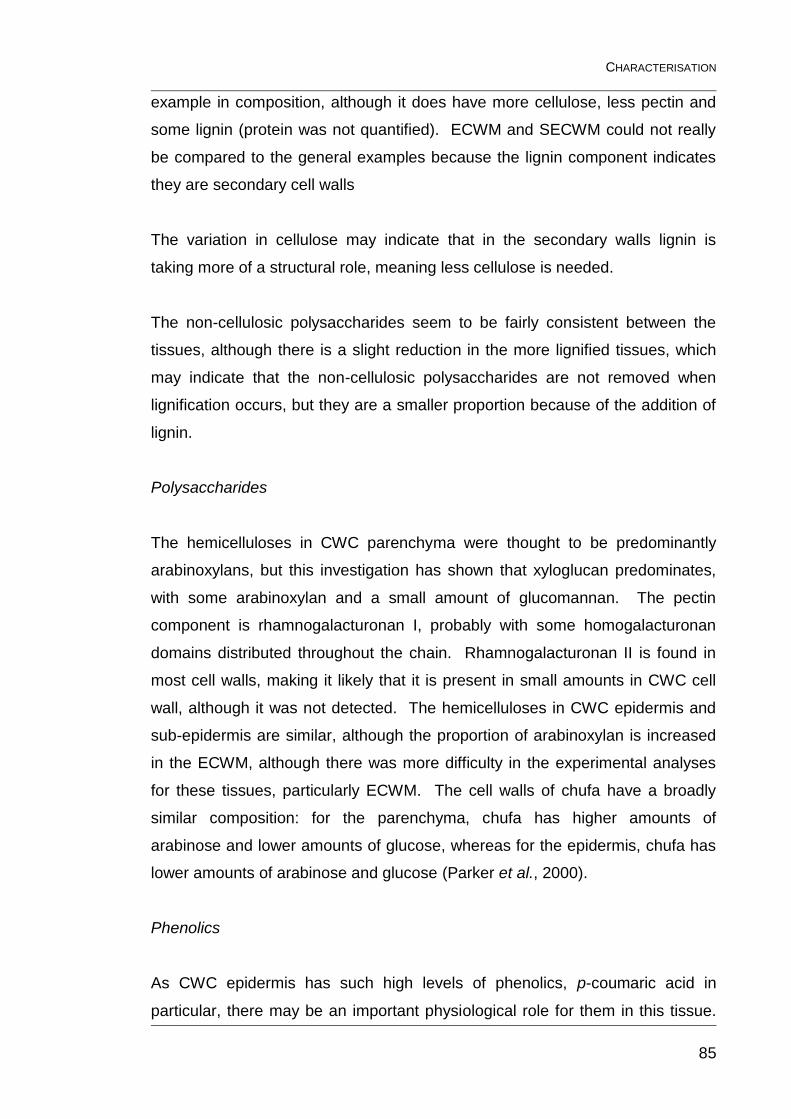
CHARACTERISATION
85
example in composition, although it does have more cellulose, less pectin and
some lignin (protein was not quantified). ECWM and SECWM could not really
be compared to the general examples because the lignin component indicates
they are secondary cell walls
The variation in cellulose may indicate that in the secondary walls lignin is
taking more of a structural role, meaning less cellulose is needed.
The non-cellulosic polysaccharides seem to be fairly consistent between the
tissues, although there is a slight reduction in the more lignified tissues, which
may indicate that the non-cellulosic polysaccharides are not removed when
lignification occurs, but they are a smaller proportion because of the addition of
lignin.
Polysaccharides
The hemicelluloses in CWC parenchyma were thought to be predominantly
arabinoxylans, but this investigation has shown that xyloglucan predominates,
with some arabinoxylan and a small amount of glucomannan. The pectin
component is rhamnogalacturonan I, probably with some homogalacturonan
domains distributed throughout the chain. Rhamnogalacturonan II is found in
most cell walls, making it likely that it is present in small amounts in CWC cell
wall, although it was not detected. The hemicelluloses in CWC epidermis and
sub-epidermis are similar, although the proportion of arabinoxylan is increased
in the ECWM, although there was more difficulty in the experimental analyses
for these tissues, particularly ECWM. The cell walls of chufa have a broadly
similar composition: for the parenchyma, chufa has higher amounts of
arabinose and lower amounts of glucose, whereas for the epidermis, chufa has
lower amounts of arabinose and glucose (Parker et al., 2000).
Phenolics
As CWC epidermis has such high levels of phenolics, p-coumaric acid in
particular, there may be an important physiological role for them in this tissue.
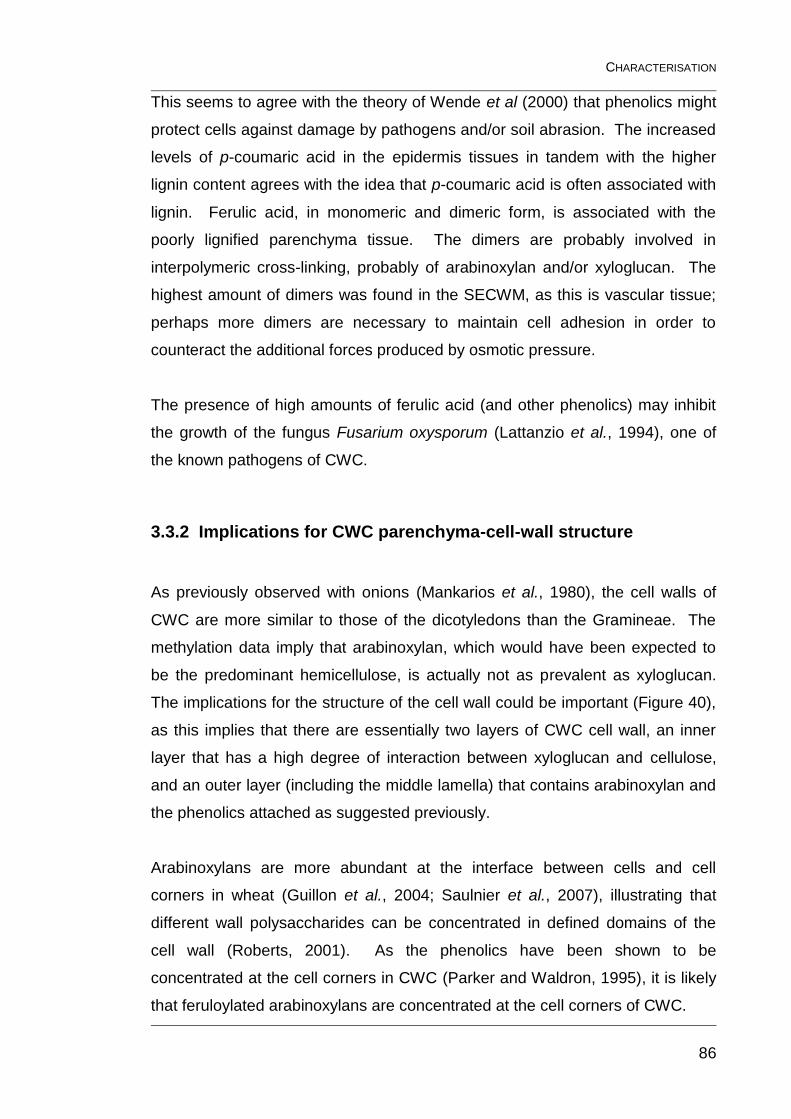
CHARACTERISATION
86
This seems to agree with the theory of Wende et al (2000) that phenolics might
protect cells against damage by pathogens and/or soil abrasion. The increased
levels of p-coumaric acid in the epidermis tissues in tandem with the higher
lignin content agrees with the idea that p-coumaric acid is often associated with
lignin. Ferulic acid, in monomeric and dimeric form, is associated with the
poorly lignified parenchyma tissue. The dimers are probably involved in
interpolymeric cross-linking, probably of arabinoxylan and/or xyloglucan. The
highest amount of dimers was found in the SECWM, as this is vascular tissue;
perhaps more dimers are necessary to maintain cell adhesion in order to
counteract the additional forces produced by osmotic pressure.
The presence of high amounts of ferulic acid (and other phenolics) may inhibit
the growth of the fungus Fusarium oxysporum (Lattanzio et al., 1994), one of
the known pathogens of CWC.
3.3.2 Implications for CWC parenchyma-cell-wall structure
As previously observed with onions (Mankarios et al., 1980), the cell walls of
CWC are more similar to those of the dicotyledons than the Gramineae. The
methylation data imply that arabinoxylan, which would have been expected to
be the predominant hemicellulose, is actually not as prevalent as xyloglucan.
The implications for the structure of the cell wall could be important (Figure 40),
as this implies that there are essentially two layers of CWC cell wall, an inner
layer that has a high degree of interaction between xyloglucan and cellulose,
and an outer layer (including the middle lamella) that contains arabinoxylan and
the phenolics attached as suggested previously.
Arabinoxylans are more abundant at the interface between cells and cell
corners in wheat (Guillon et al., 2004; Saulnier et al., 2007), illustrating that
different wall polysaccharides can be concentrated in defined domains of the
cell wall (Roberts, 2001). As the phenolics have been shown to be
concentrated at the cell corners in CWC (Parker and Waldron, 1995), it is likely
that feruloylated arabinoxylans are concentrated at the cell corners of CWC.
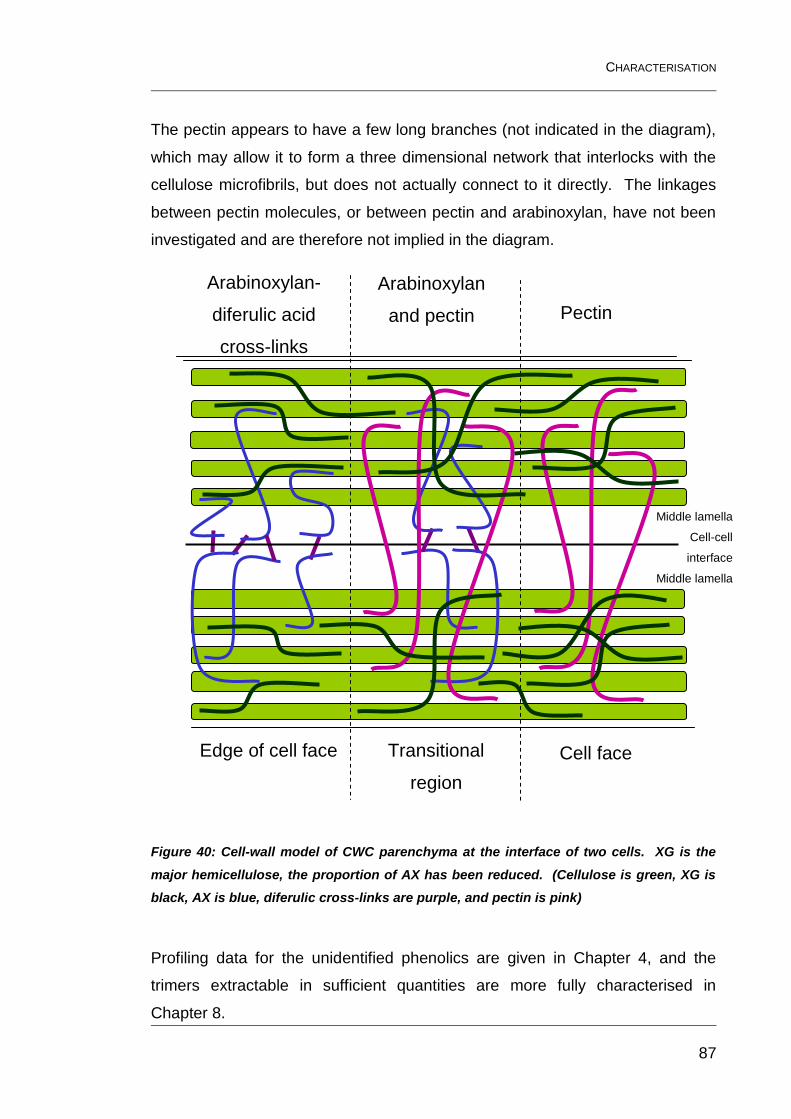
CHARACTERISATION
87
The pectin appears to have a few long branches (not indicated in the diagram),
which may allow it to form a three dimensional network that interlocks with the
cellulose microfibrils, but does not actually connect to it directly. The linkages
between pectin molecules, or between pectin and arabinoxylan, have not been
investigated and are therefore not implied in the diagram.
Figure 40: Cell-wall model of CWC parenchyma at the interface of two cells. XG is the
major hemicellulose, the proportion of AX has been reduced. (Cellulose is green, XG is
black, AX is blue, diferulic cross-links are purple, and pectin is pink)
Profiling data for the unidentified phenolics are given in Chapter 4, and the
trimers extractable in sufficient quantities are more fully characterised in
Chapter 8.
Arabinoxylan-
diferulic acid
cross-links
Pectin
Arabinoxylan
and pectin
Edge of cell face Transitional
region
Cell face
Middle lamella
Cell-cell
interface
Middle lamella
PROFILING OF UNKNOWNS
88
4 Profiling of Unidentified Phenolics:
The chromatographic profiles of the CWM phenolics are extremely complex and
so in Chapter 3 only the identified phenolics were quantified. In this chapter the
unidentified phenolics from CWM will be discussed.
Ralph et al (2000) have said that many plant cell wall components are still to be
identified and this was found to be the case in Chinese water chestnut. As well
as the well-documented phenolics described in Section §3.2.1, a number of
unidentified compounds were discernible in the HPLC chromatograms. These
compounds had UV spectra that were similar to the known phenolics. The total
phenolic extraction produced seven unknowns (A-G), the first sequential
phenolic extraction increased this number to eleven (H-K) and the second
sequential phenolic extraction gave a total of 89 UV spectra (both known and
unknown). Although these compounds are probably present in extremely small
quantities, there is no way of knowing how important they are as part of the cell
wall structure; after all, years ago, phenolics as a group were not regarded as
being present in large enough quantities to make a difference to cell-wall
properties, and so were not quantified as a matter of course, as they are now.
4.1 Attributes of unknown phenolics
Without extensive experimentation these phenolics cannot be identified, but
their properties can be catalogued in order to make subsequent assignment
easier, which should allow one to go back to the data once the required
identification work is carried out. For each unidentified compound four
attributes were recorded:
Retention time
Relative retention time
UV maxima and minima
Spectrum shape group
PROFILING OF UNKNOWNS
89
4.1.1 Retention time
In general, as retention time increases, the molecules get larger, meaning that
hydroxybenzoic acids and aldehydes are followed by hydroxycinnamic acids,
then by dehydrodimers, then presumably by dehydrotrimers etc (although there
is considerable overlap).
4.1.2 Relative retention time (RRT)
Relative retention time is the retention time of a peak relative to that of an
internal standard, which can aid identification because it should be reproducible
between runs, assuming the same solvent gradient and column are used.
4.1.3 UV maxima and minima
The UV chromatogram is produced at just one wavelength (280 nm), but the
DAD detects and records the spectrum from 200 to 360 nm. Examining the
spectrum of a compound can allow measurement of the wavelengths at which
the absorption is at a maximum or minimum. These wavelengths can be
compared to literature values and to each other to indicate their degree of
conjugation, for example the absorption maxima of benzene, benzoic acid and
cinnamic acid in water are 203.5, 230 and 273 nm respectively, showing the
absorption maxima increasing as conjugation increases.
4.1.4 Spectrum shape group
The shape of the spectrum may give some indication of similarities in the
molecular structure to known components. The known molecules have been
split into eight groups in terms of their general spectra; the unknowns will then
be assigned to the closest group. The representative spectra shapes are
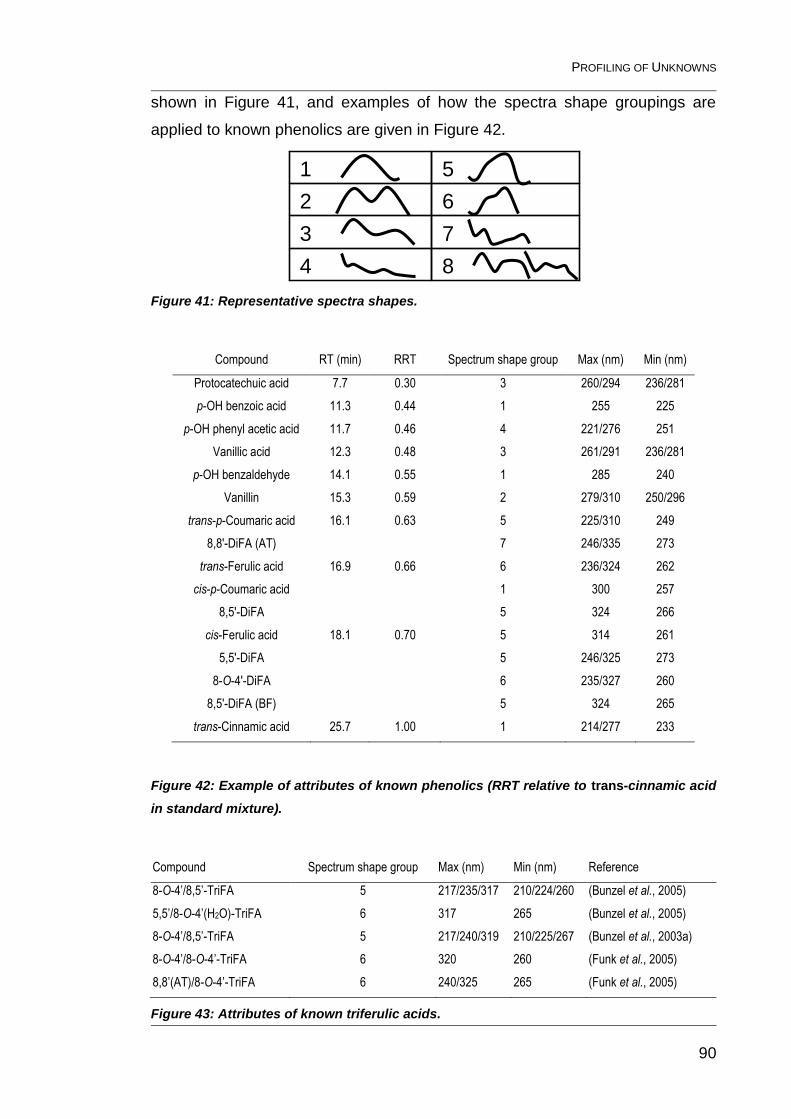
PROFILING OF UNKNOWNS
90
shown in Figure 41, and examples of how the spectra shape groupings are
applied to known phenolics are given in Figure 42.
Figure 41: Representative spectra shapes.
Compound RT (min) RRT Spectrum shape group Max (nm) Min (nm)
Protocatechuic acid 7.7 0.30 3 260/294 236/281
p-OH benzoic acid 11.3 0.44 1 255 225
p-OH phenyl acetic acid 11.7 0.46 4 221/276 251
Vanillic acid 12.3 0.48 3 261/291 236/281
p-OH benzaldehyde 14.1 0.55 1 285 240
Vanillin 15.3 0.59 2 279/310 250/296
trans-p-Coumaric acid 16.1 0.63 5 225/310 249
8,8'-DiFA (AT) 7 246/335 273
trans-Ferulic acid 16.9 0.66 6 236/324 262
cis-p-Coumaric acid 1 300 257
8,5'-DiFA 5 324 266
cis-Ferulic acid 18.1 0.70 5 314 261
5,5'-DiFA 5 246/325 273
8-O-4'-DiFA 6 235/327 260
8,5'-DiFA (BF) 5 324 265
trans-Cinnamic acid 25.7 1.00 1 214/277 233
Figure 42: Example of attributes of known phenolics (RRT relative to trans-cinnamic acid
in standard mixture).
Compound Spectrum shape group Max (nm) Min (nm) Reference
8-O-4’/8,5’-TriFA 5 217/235/317 210/224/260 (Bunzel et al., 2005)
5,5’/8-O-4’(H2O)-TriFA 6 317 265 (Bunzel et al., 2005)
8-O-4’/8,5’-TriFA 5 217/240/319 210/225/267 (Bunzel et al., 2003a)
8-O-4’/8-O-4’-TriFA 6 320 260 (Funk et al., 2005)
8,8’(AT)/8-O-4’-TriFA 6 240/325 265 (Funk et al., 2005)
Figure 43: Attributes of known triferulic acids.
8 4
7 3
6 2
5 1
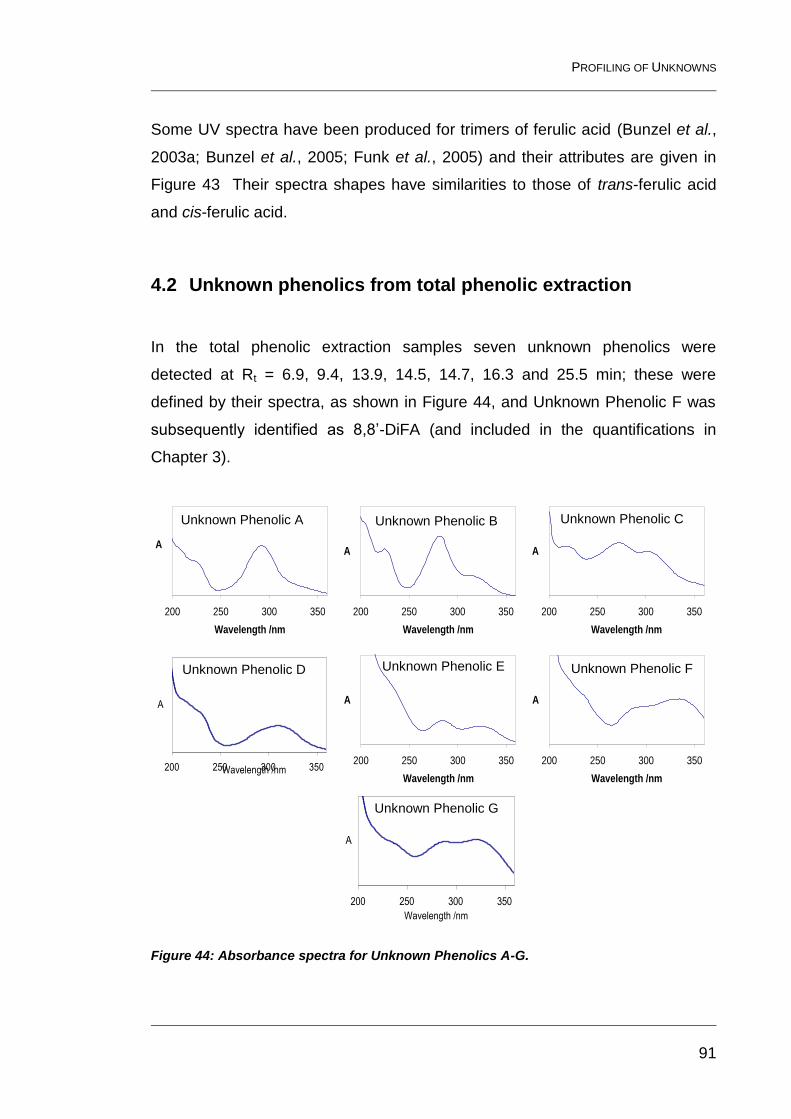
PROFILING OF UNKNOWNS
91
Some UV spectra have been produced for trimers of ferulic acid (Bunzel et al.,
2003a; Bunzel et al., 2005; Funk et al., 2005) and their attributes are given in
Figure 43 Their spectra shapes have similarities to those of trans-ferulic acid
and cis-ferulic acid.
4.2 Unknown phenolics from total phenolic extraction
In the total phenolic extraction samples seven unknown phenolics were
detected at Rt = 6.9, 9.4, 13.9, 14.5, 14.7, 16.3 and 25.5 min; these were
defined by their spectra, as shown in Figure 44, and Unknown Phenolic F was
subsequently identified as 8,8’-DiFA (and included in the quantifications in
Chapter 3).
200 250 300 350
Wavelength /nm
A
200 250 300 350
Wavelength /nm
A
200 250 300 350
Wavelength /nm
A
200 250 300 350Wavelength /nm
A
200 250 300 350
Wavelength /nm
A
200 250 300 350
Wavelength /nm
A
200 250 300 350
Wavelength /nm
A
Figure 44: Absorbance spectra for Unknown Phenolics A-G.
Unknown Phenolic A Unknown Phenolic B Unknown Phenolic C
Unknown Phenolic D Unknown Phenolic E Unknown Phenolic F
Unknown Phenolic G
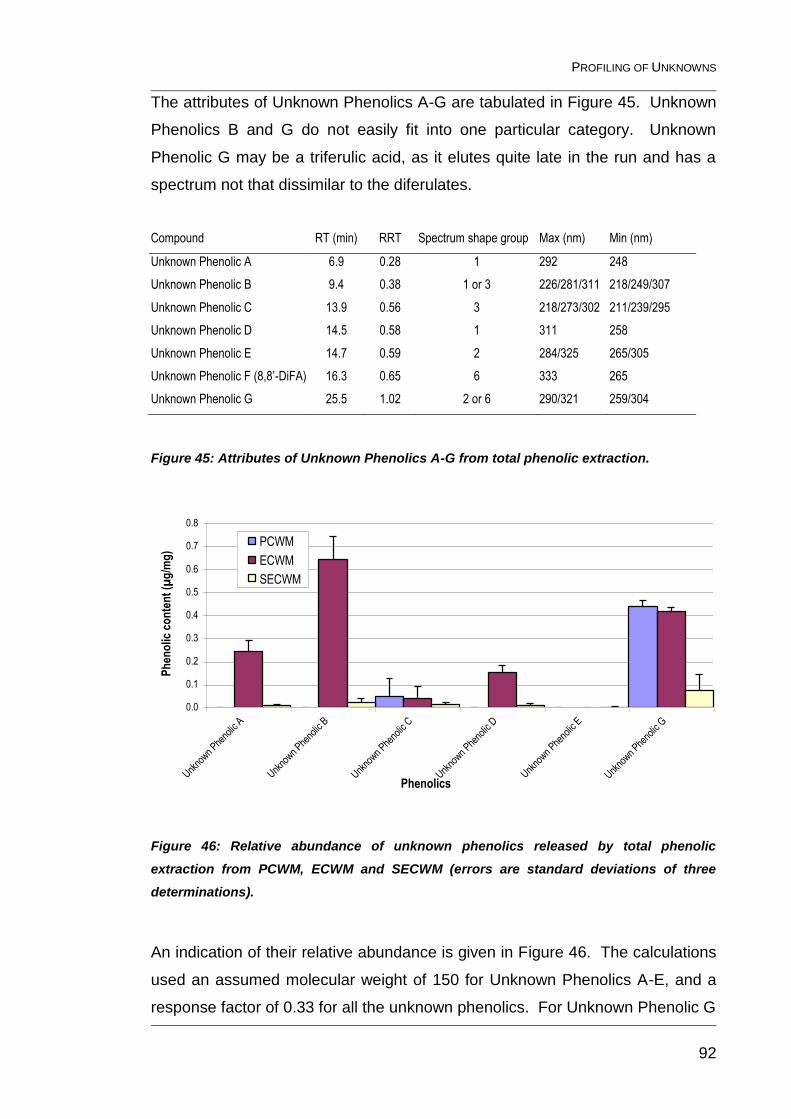
PROFILING OF UNKNOWNS
92
The attributes of Unknown Phenolics A-G are tabulated in Figure 45. Unknown
Phenolics B and G do not easily fit into one particular category. Unknown
Phenolic G may be a triferulic acid, as it elutes quite late in the run and has a
spectrum not that dissimilar to the diferulates.
Compound RT (min) RRT Spectrum shape group Max (nm) Min (nm)
Unknown Phenolic A 6.9 0.28 1 292 248
Unknown Phenolic B 9.4 0.38 1 or 3 226/281/311 218/249/307
Unknown Phenolic C 13.9 0.56 3 218/273/302 211/239/295
Unknown Phenolic D 14.5 0.58 1 311 258
Unknown Phenolic E 14.7 0.59 2 284/325 265/305
Unknown Phenolic F (8,8’-DiFA) 16.3 0.65 6 333 265
Unknown Phenolic G 25.5 1.02 2 or 6 290/321 259/304
Figure 45: Attributes of Unknown Phenolics A-G from total phenolic extraction.
0.0
0.1
0.2
0.3
0.4
0.5
0.6
0.7
0.8
Unkno
wn Phe
nolic
A
Unkno
wn Phe
nolic
B
Unkno
wn Phe
nolic
C
Unkno
wn Phe
nolic
D
Unkno
wn Phe
nolic
E
Unkno
wn Phe
nolic
G
Phenolics
Ph
eno
lic c
on
ten
t (µ
g/m
g)
PCWM
ECWM
SECWM
Figure 46: Relative abundance of unknown phenolics released by total phenolic
extraction from PCWM, ECWM and SECWM (errors are standard deviations of three
determinations).
An indication of their relative abundance is given in Figure 46. The calculations
used an assumed molecular weight of 150 for Unknown Phenolics A-E, and a
response factor of 0.33 for all the unknown phenolics. For Unknown Phenolic G
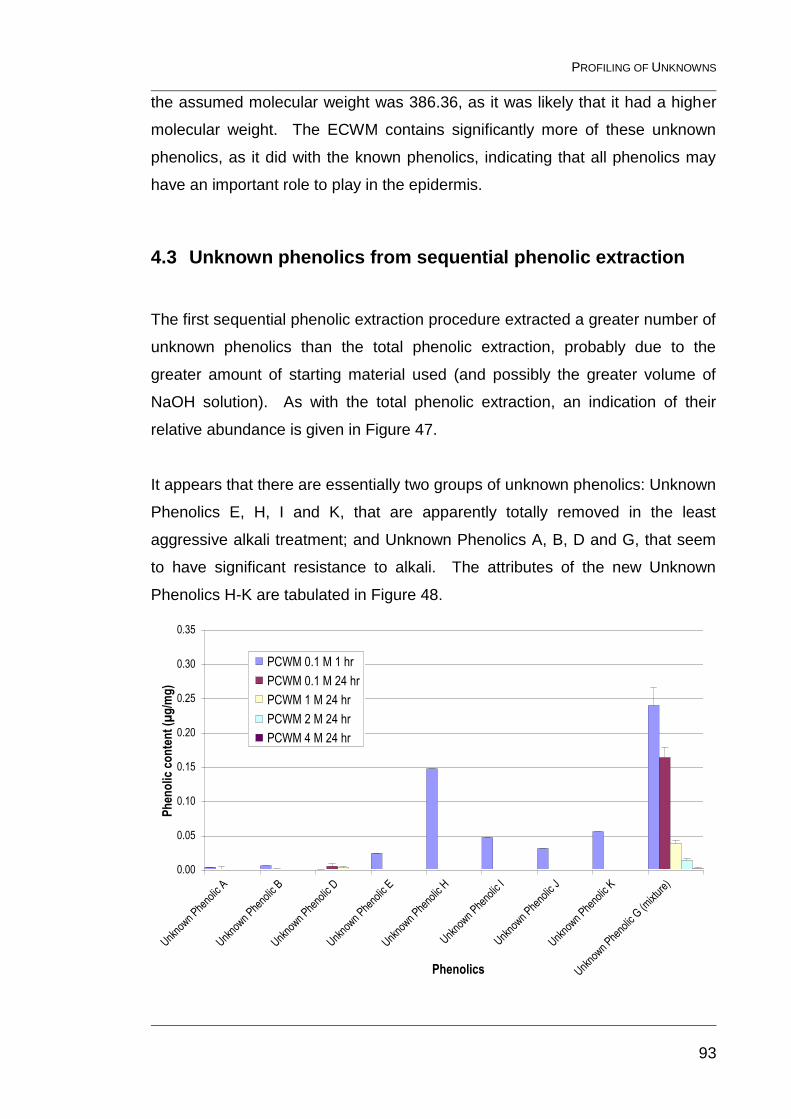
PROFILING OF UNKNOWNS
93
the assumed molecular weight was 386.36, as it was likely that it had a higher
molecular weight. The ECWM contains significantly more of these unknown
phenolics, as it did with the known phenolics, indicating that all phenolics may
have an important role to play in the epidermis.
4.3 Unknown phenolics from sequential phenolic extraction
The first sequential phenolic extraction procedure extracted a greater number of
unknown phenolics than the total phenolic extraction, probably due to the
greater amount of starting material used (and possibly the greater volume of
NaOH solution). As with the total phenolic extraction, an indication of their
relative abundance is given in Figure 47.
It appears that there are essentially two groups of unknown phenolics: Unknown
Phenolics E, H, I and K, that are apparently totally removed in the least
aggressive alkali treatment; and Unknown Phenolics A, B, D and G, that seem
to have significant resistance to alkali. The attributes of the new Unknown
Phenolics H-K are tabulated in Figure 48.
0.00
0.05
0.10
0.15
0.20
0.25
0.30
0.35
Unkno
wn Phe
nolic
A
Unkno
wn Phe
nolic
B
Unkno
wn Phe
nolic
D
Unkno
wn Phe
nolic
E
Unkno
wn Phe
nolic
H
Unkno
wn Phe
nolic
I
Unkno
wn Phe
nolic
J
Unkno
wn Phe
nolic
K
Unkno
wn Phe
nolic
G (m
ixtur
e)
Phenolics
Ph
eno
lic c
on
ten
t (µ
g/m
g)
PCWM 0.1 M 1 hr
PCWM 0.1 M 24 hr
PCWM 1 M 24 hr
PCWM 2 M 24 hr
PCWM 4 M 24 hr
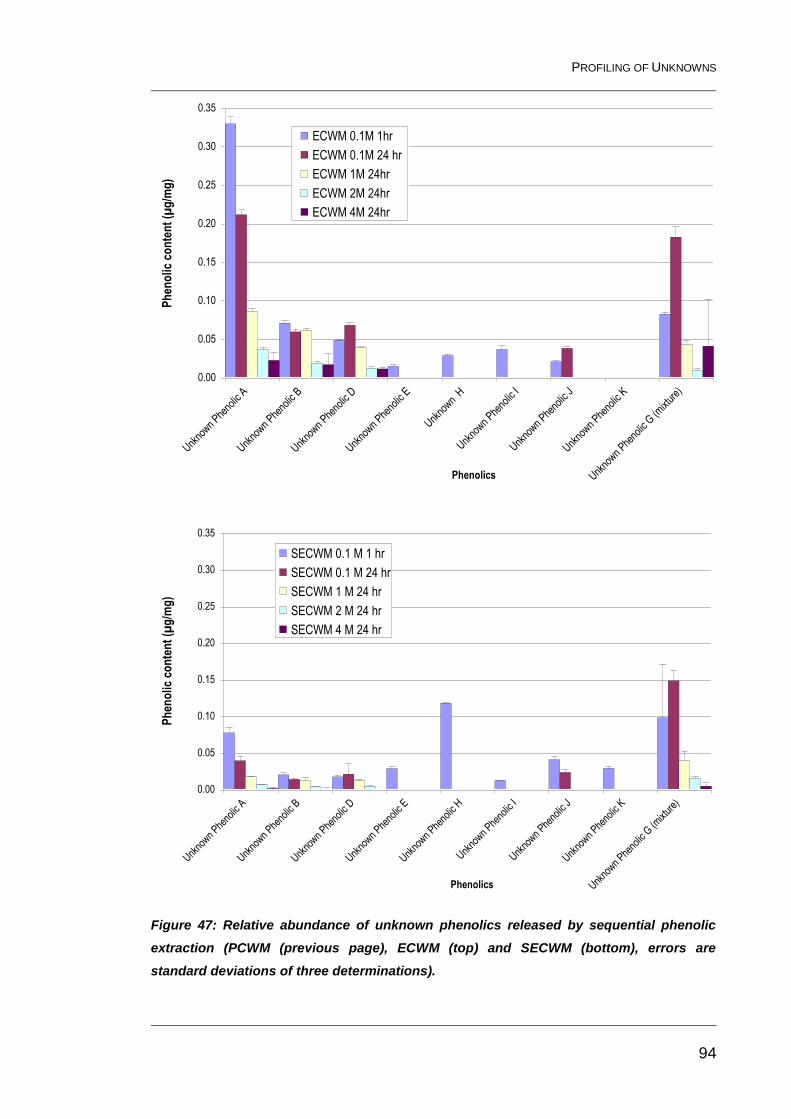
PROFILING OF UNKNOWNS
94
0.00
0.05
0.10
0.15
0.20
0.25
0.30
0.35
Unkno
wn Phe
nolic
A
Unkno
wn Phe
nolic
B
Unkno
wn Phe
nolic
D
Unkno
wn Phe
nolic
E
Unkno
wn H
Unkno
wn Phe
nolic
I
Unkno
wn Phe
nolic
J
Unkno
wn Phe
nolic
K
Unkno
wn Phe
nolic
G (m
ixtur
e)
Phenolics
Ph
eno
lic c
on
ten
t (µ
g/m
g)
ECWM 0.1M 1hr
ECWM 0.1M 24 hr
ECWM 1M 24hr
ECWM 2M 24hr
ECWM 4M 24hr
0.00
0.05
0.10
0.15
0.20
0.25
0.30
0.35
Unkno
wn Phe
nolic
A
Unkno
wn Phe
nolic
B
Unkno
wn Phe
nolic
D
Unkno
wn Phe
nolic
E
Unkno
wn Phe
nolic
H
Unkno
wn Phe
nolic
I
Unkno
wn Phe
nolic
J
Unkno
wn Phe
nolic
K
Unkno
wn Phe
nolic
G (m
ixtur
e)
Phenolics
Ph
eno
lic c
on
ten
t (µ
g/m
g)
SECWM 0.1 M 1 hr
SECWM 0.1 M 24 hr
SECWM 1 M 24 hr
SECWM 2 M 24 hr
SECWM 4 M 24 hr
Figure 47: Relative abundance of unknown phenolics released by sequential phenolic
extraction (PCWM (previous page), ECWM (top) and SECWM (bottom), errors are
standard deviations of three determinations).
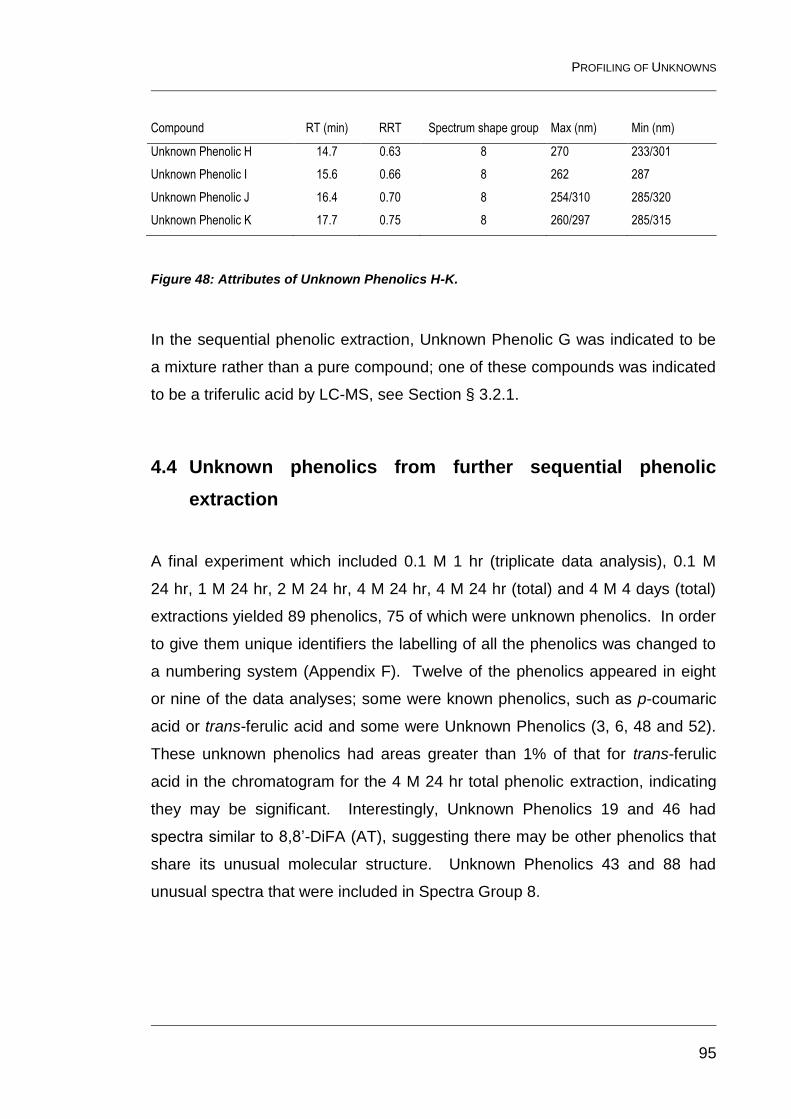
PROFILING OF UNKNOWNS
95
Compound RT (min) RRT Spectrum shape group Max (nm) Min (nm)
Unknown Phenolic H 14.7 0.63 8 270 233/301
Unknown Phenolic I 15.6 0.66 8 262 287
Unknown Phenolic J 16.4 0.70 8 254/310 285/320
Unknown Phenolic K 17.7 0.75 8 260/297 285/315
Figure 48: Attributes of Unknown Phenolics H-K.
In the sequential phenolic extraction, Unknown Phenolic G was indicated to be
a mixture rather than a pure compound; one of these compounds was indicated
to be a triferulic acid by LC-MS, see Section § 3.2.1.
4.4 Unknown phenolics from further sequential phenolic
extraction
A final experiment which included 0.1 M 1 hr (triplicate data analysis), 0.1 M
24 hr, 1 M 24 hr, 2 M 24 hr, 4 M 24 hr, 4 M 24 hr (total) and 4 M 4 days (total)
extractions yielded 89 phenolics, 75 of which were unknown phenolics. In order
to give them unique identifiers the labelling of all the phenolics was changed to
a numbering system (Appendix F). Twelve of the phenolics appeared in eight
or nine of the data analyses; some were known phenolics, such as p-coumaric
acid or trans-ferulic acid and some were Unknown Phenolics (3, 6, 48 and 52).
These unknown phenolics had areas greater than 1% of that for trans-ferulic
acid in the chromatogram for the 4 M 24 hr total phenolic extraction, indicating
they may be significant. Interestingly, Unknown Phenolics 19 and 46 had
spectra similar to 8,8’-DiFA (AT), suggesting there may be other phenolics that
share its unusual molecular structure. Unknown Phenolics 43 and 88 had
unusual spectra that were included in Spectra Group 8.
PROFILING OF UNKNOWNS
96
4.5 Summary
A thorough survey of CWC parenchyma cell wall phenolics has been carried out
and sufficient information recorded about each compound to enable
identification, and possibly quantification, in the future. Selected samples were
analysed by LC-MS and the results are given in Chapter 8.
SEQUENTIAL EXTRACTION
97
5 Characterisation of Cell-Wall Polymers in Parenchyma of Chinese Water Chestnut:
The sequential extraction of cell-wall polymers should help to test the
hypothesis about the cell wall structure of CWC, by giving fractions of
polysaccharides that can be analysed to determine if their structure agrees with
that suggested.
The traditional sequential extraction involves the following steps (Redgewell and
Selvendran, 1986; Selvendran and O'Neill, 1987):
2 M Imidazole, pH 7, 20°C – Imidazole removes very weakly bound
pectic polysaccharides held in the wall by Ca2+ only.
50 mM CDTA (cyclohexane-trans-1,2-diamine-N,N,N’,N’-tetraacetate,
Na+ salt), pH 6, 20°C – CDTA is a chelating agent which is thought to
solubilise pectic polysaccharides held in place by Ca2+ ions.
50 mM Na2CO3, 1°C and 20°C – Na2CO3 removes pectic
polysaccharides by hydrolysis of weak ester cross-links. Pectic
polysaccharides are prone to -elimination reactions at higher
temperatures, so low temperatures are used first. NaBH4 is used to
prevent step-wise peeling of sugar units from the reducing terminus of
polysaccharides, by reducing the reducing carbonyl group to an alcohol.
KOH, 20°C – Increasing concentrations of alkali are used in sequence,
usually 0.5 M, 1 M and 4 M. The 0.5 M KOH extracts any remaining
pectin. 1 M KOH extracts different hemicelluloses, such as
arabinoxylans. 4 M KOH extracts xyloglucans, and combining 4 M KOH
with 3-4% boric acid extracts glucomannans.
5.1 Methods
Previous sequential extractions of PCWM indicated that only a small proportion
of the sugars present were extracted before the 0.5 M KOH stage (Ng and
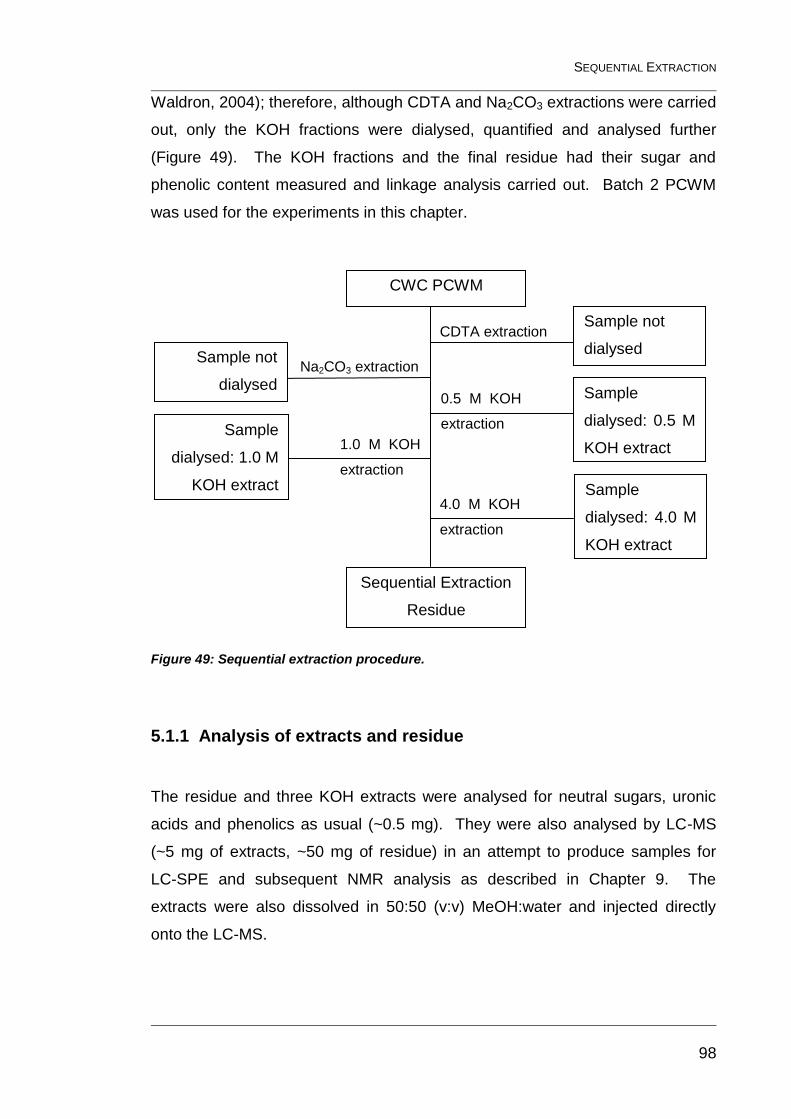
SEQUENTIAL EXTRACTION
98
Waldron, 2004); therefore, although CDTA and Na2CO3 extractions were carried
out, only the KOH fractions were dialysed, quantified and analysed further
(Figure 49). The KOH fractions and the final residue had their sugar and
phenolic content measured and linkage analysis carried out. Batch 2 PCWM
was used for the experiments in this chapter.
Figure 49: Sequential extraction procedure.
5.1.1 Analysis of extracts and residue
The residue and three KOH extracts were analysed for neutral sugars, uronic
acids and phenolics as usual (~0.5 mg). They were also analysed by LC-MS
(~5 mg of extracts, ~50 mg of residue) in an attempt to produce samples for
LC-SPE and subsequent NMR analysis as described in Chapter 9. The
extracts were also dissolved in 50:50 (v:v) MeOH:water and injected directly
onto the LC-MS.
CWC PCWM
Sequential Extraction
Residue
Sample not
dialysed CDTA extraction
Na2CO3 extraction Sample not
dialysed Sample
dialysed: 0.5 M
KOH extract
0.5 M KOH
extraction Sample
dialysed: 1.0 M
KOH extract
1.0 M KOH
extraction
Sample
dialysed: 4.0 M
KOH extract
4.0 M KOH
extraction
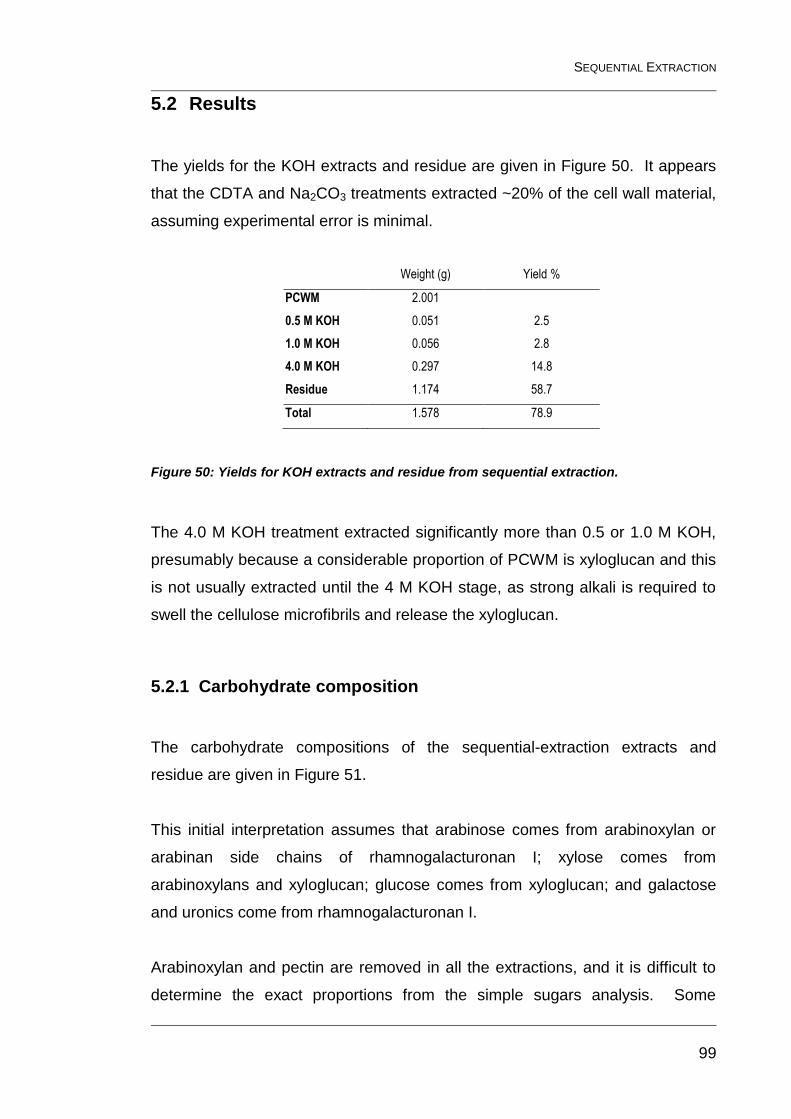
SEQUENTIAL EXTRACTION
99
5.2 Results
The yields for the KOH extracts and residue are given in Figure 50. It appears
that the CDTA and Na2CO3 treatments extracted ~20% of the cell wall material,
assuming experimental error is minimal.
Weight (g) Yield %
PCWM 2.001
0.5 M KOH 0.051 2.5
1.0 M KOH 0.056 2.8
4.0 M KOH 0.297 14.8
Residue 1.174 58.7
Total 1.578 78.9
Figure 50: Yields for KOH extracts and residue from sequential extraction.
The 4.0 M KOH treatment extracted significantly more than 0.5 or 1.0 M KOH,
presumably because a considerable proportion of PCWM is xyloglucan and this
is not usually extracted until the 4 M KOH stage, as strong alkali is required to
swell the cellulose microfibrils and release the xyloglucan.
5.2.1 Carbohydrate composition
The carbohydrate compositions of the sequential-extraction extracts and
residue are given in Figure 51.
This initial interpretation assumes that arabinose comes from arabinoxylan or
arabinan side chains of rhamnogalacturonan I; xylose comes from
arabinoxylans and xyloglucan; glucose comes from xyloglucan; and galactose
and uronics come from rhamnogalacturonan I.
Arabinoxylan and pectin are removed in all the extractions, and it is difficult to
determine the exact proportions from the simple sugars analysis. Some
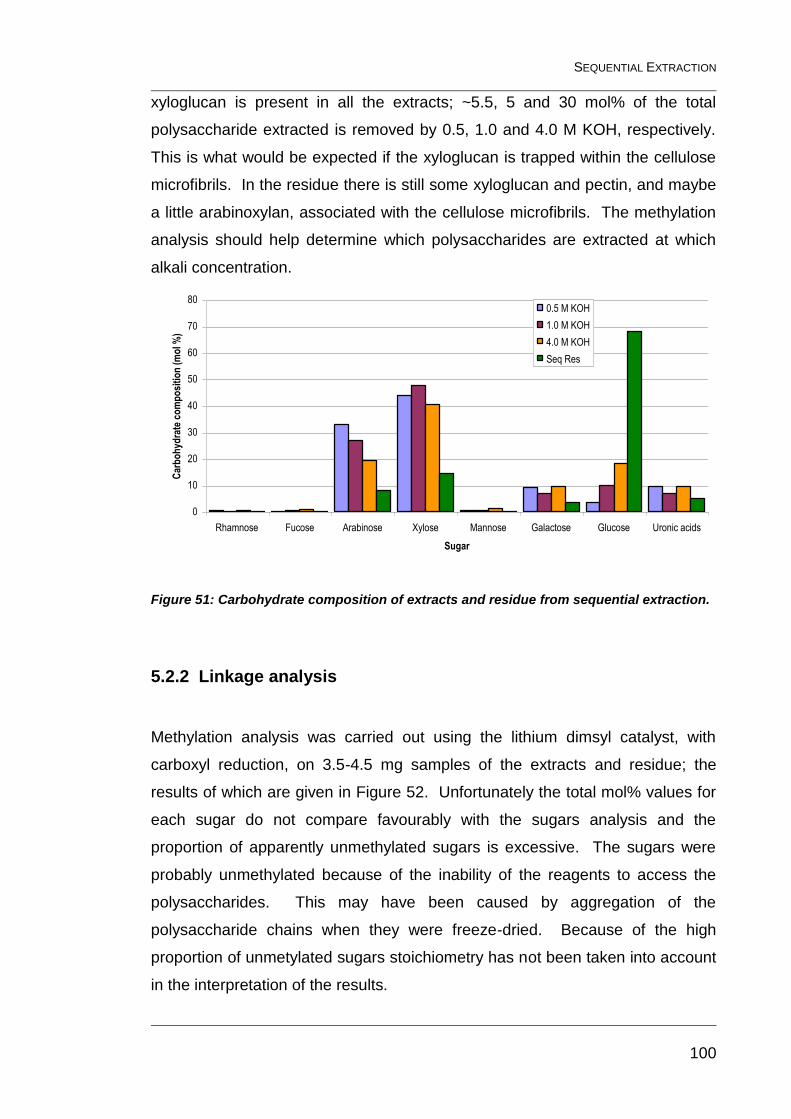
SEQUENTIAL EXTRACTION
100
xyloglucan is present in all the extracts; ~5.5, 5 and 30 mol% of the total
polysaccharide extracted is removed by 0.5, 1.0 and 4.0 M KOH, respectively.
This is what would be expected if the xyloglucan is trapped within the cellulose
microfibrils. In the residue there is still some xyloglucan and pectin, and maybe
a little arabinoxylan, associated with the cellulose microfibrils. The methylation
analysis should help determine which polysaccharides are extracted at which
alkali concentration.
0
10
20
30
40
50
60
70
80
Rhamnose Fucose Arabinose Xylose Mannose Galactose Glucose Uronic acids
Sugar
Car
bo
hyd
rate
co
mp
osi
tio
n (
mo
l %)
0.5 M KOH
1.0 M KOH
4.0 M KOH
Seq Res
Figure 51: Carbohydrate composition of extracts and residue from sequential extraction.
5.2.2 Linkage analysis
Methylation analysis was carried out using the lithium dimsyl catalyst, with
carboxyl reduction, on 3.5-4.5 mg samples of the extracts and residue; the
results of which are given in Figure 52. Unfortunately the total mol% values for
each sugar do not compare favourably with the sugars analysis and the
proportion of apparently unmethylated sugars is excessive. The sugars were
probably unmethylated because of the inability of the reagents to access the
polysaccharides. This may have been caused by aggregation of the
polysaccharide chains when they were freeze-dried. Because of the high
proportion of unmetylated sugars stoichiometry has not been taken into account
in the interpretation of the results.
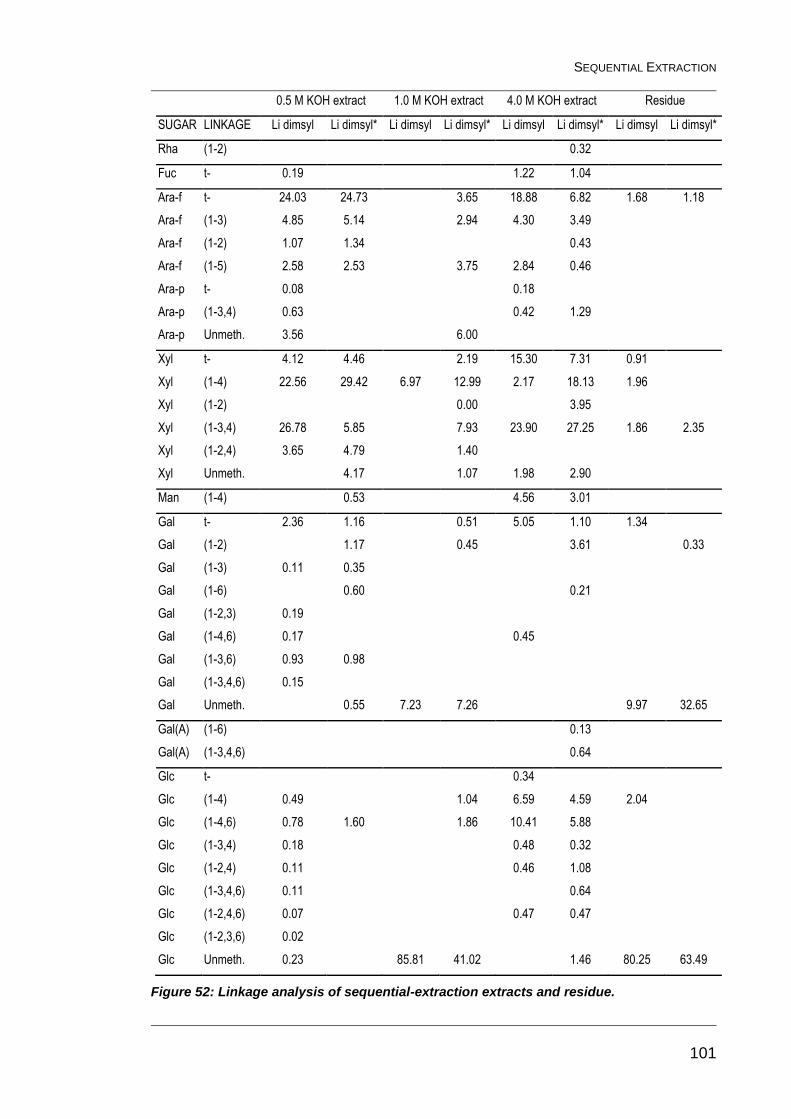
SEQUENTIAL EXTRACTION
101
0.5 M KOH extract 1.0 M KOH extract 4.0 M KOH extract Residue
SUGAR LINKAGE Li dimsyl Li dimsyl* Li dimsyl Li dimsyl* Li dimsyl Li dimsyl* Li dimsyl Li dimsyl*
Rha (1-2) 0.32
Fuc t- 0.19 1.22 1.04
Ara-f t- 24.03 24.73 3.65 18.88 6.82 1.68 1.18
Ara-f (1-3) 4.85 5.14 2.94 4.30 3.49
Ara-f (1-2) 1.07 1.34 0.43
Ara-f (1-5) 2.58 2.53 3.75 2.84 0.46
Ara-p t- 0.08 0.18
Ara-p (1-3,4) 0.63 0.42 1.29
Ara-p Unmeth. 3.56 6.00
Xyl t- 4.12 4.46 2.19 15.30 7.31 0.91
Xyl (1-4) 22.56 29.42 6.97 12.99 2.17 18.13 1.96
Xyl (1-2) 0.00 3.95
Xyl (1-3,4) 26.78 5.85 7.93 23.90 27.25 1.86 2.35
Xyl (1-2,4) 3.65 4.79 1.40
Xyl Unmeth. 4.17 1.07 1.98 2.90
Man (1-4) 0.53 4.56 3.01
Gal t- 2.36 1.16 0.51 5.05 1.10 1.34
Gal (1-2) 1.17 0.45 3.61 0.33
Gal (1-3) 0.11 0.35
Gal (1-6) 0.60 0.21
Gal (1-2,3) 0.19
Gal (1-4,6) 0.17 0.45
Gal (1-3,6) 0.93 0.98
Gal (1-3,4,6) 0.15
Gal Unmeth. 0.55 7.23 7.26 9.97 32.65
Gal(A) (1-6) 0.13
Gal(A) (1-3,4,6) 0.64
Glc t- 0.34
Glc (1-4) 0.49 1.04 6.59 4.59 2.04
Glc (1-4,6) 0.78 1.60 1.86 10.41 5.88
Glc (1-3,4) 0.18 0.48 0.32
Glc (1-2,4) 0.11 0.46 1.08
Glc (1-3,4,6) 0.11 0.64
Glc (1-2,4,6) 0.07 0.47 0.47
Glc (1-2,3,6) 0.02
Glc Unmeth. 0.23 85.81 41.02 1.46 80.25 63.49
Figure 52: Linkage analysis of sequential-extraction extracts and residue.
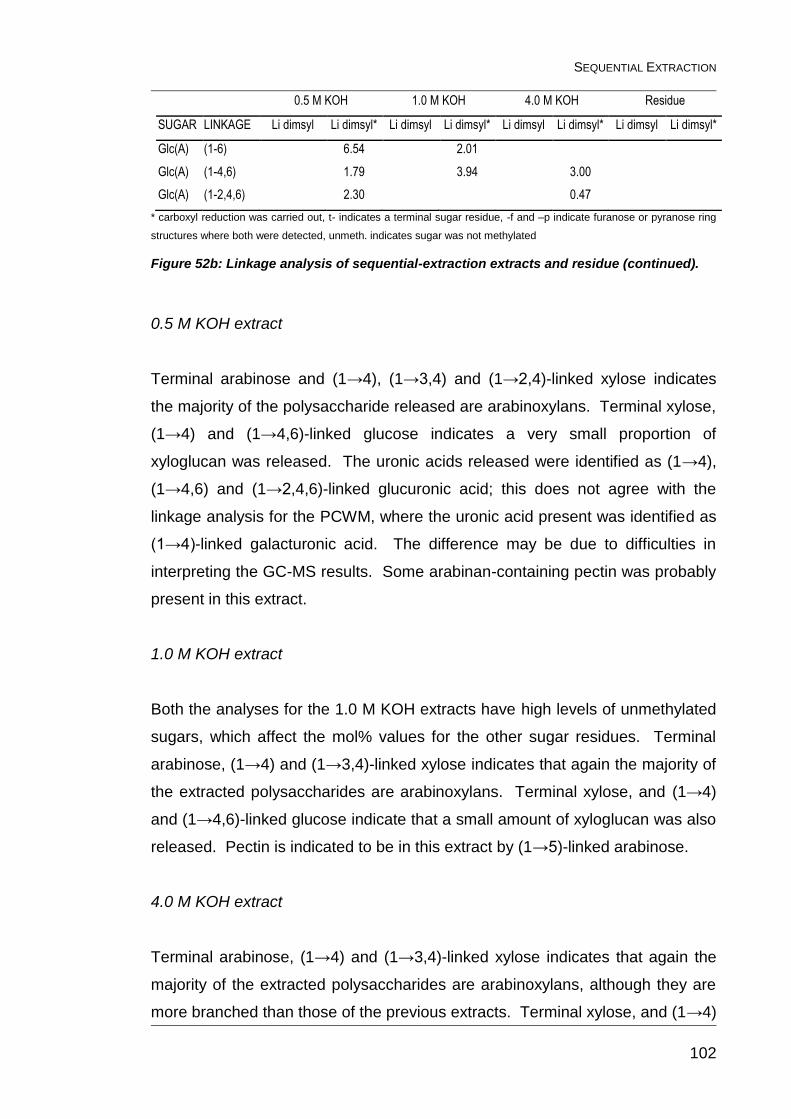
SEQUENTIAL EXTRACTION
102
0.5 M KOH 1.0 M KOH 4.0 M KOH Residue
SUGAR LINKAGE Li dimsyl Li dimsyl* Li dimsyl Li dimsyl* Li dimsyl Li dimsyl* Li dimsyl Li dimsyl*
Glc(A) (1-6) 6.54 2.01
Glc(A) (1-4,6) 1.79 3.94 3.00
Glc(A) (1-2,4,6) 2.30 0.47
* carboxyl reduction was carried out, t- indicates a terminal sugar residue, -f and –p indicate furanose or pyranose ring
structures where both were detected, unmeth. indicates sugar was not methylated
Figure 52b: Linkage analysis of sequential-extraction extracts and residue (continued).
0.5 M KOH extract
Terminal arabinose and (1→4), (1→3,4) and (1→2,4)-linked xylose indicates
the majority of the polysaccharide released are arabinoxylans. Terminal xylose,
(1→4) and (1→4,6)-linked glucose indicates a very small proportion of
xyloglucan was released. The uronic acids released were identified as (1→4),
(1→4,6) and (1→2,4,6)-linked glucuronic acid; this does not agree with the
linkage analysis for the PCWM, where the uronic acid present was identified as
(1→4)-linked galacturonic acid. The difference may be due to difficulties in
interpreting the GC-MS results. Some arabinan-containing pectin was probably
present in this extract.
1.0 M KOH extract
Both the analyses for the 1.0 M KOH extracts have high levels of unmethylated
sugars, which affect the mol% values for the other sugar residues. Terminal
arabinose, (1→4) and (1→3,4)-linked xylose indicates that again the majority of
the extracted polysaccharides are arabinoxylans. Terminal xylose, and (1→4)
and (1→4,6)-linked glucose indicate that a small amount of xyloglucan was also
released. Pectin is indicated to be in this extract by (1→5)-linked arabinose.
4.0 M KOH extract
Terminal arabinose, (1→4) and (1→3,4)-linked xylose indicates that again the
majority of the extracted polysaccharides are arabinoxylans, although they are
more branched than those of the previous extracts. Terminal xylose, and (1→4)
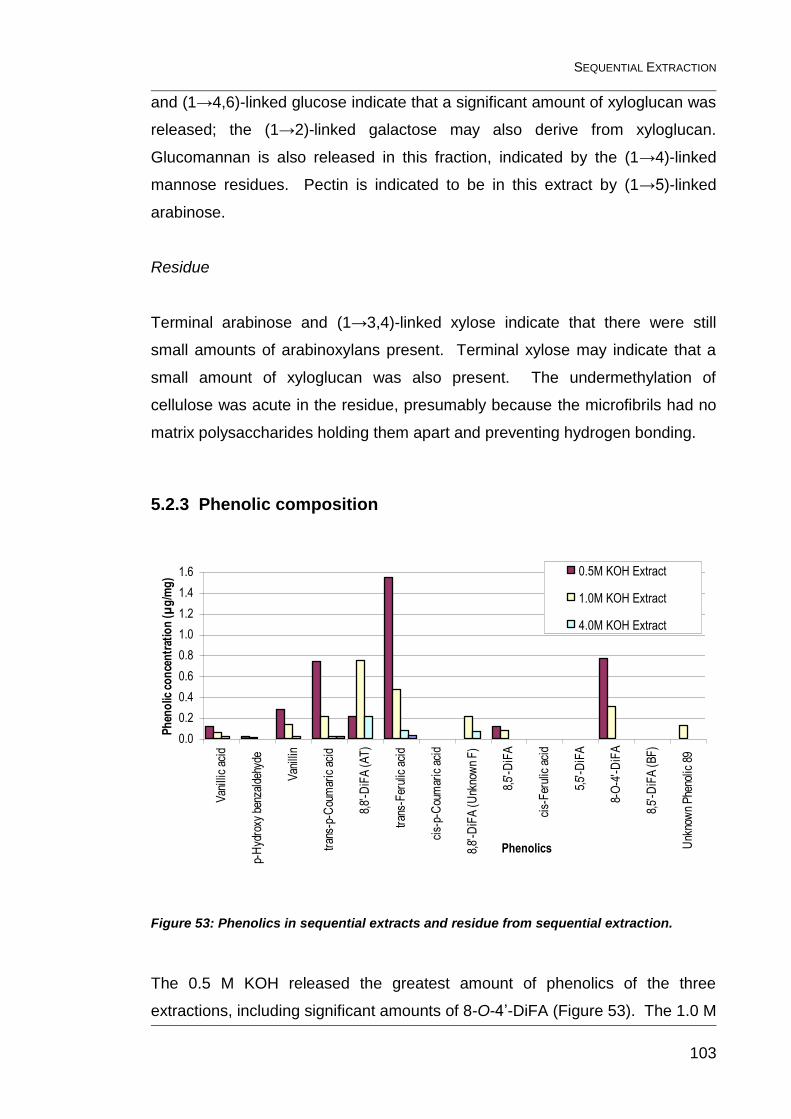
SEQUENTIAL EXTRACTION
103
and (1→4,6)-linked glucose indicate that a significant amount of xyloglucan was
released; the (1→2)-linked galactose may also derive from xyloglucan.
Glucomannan is also released in this fraction, indicated by the (1→4)-linked
mannose residues. Pectin is indicated to be in this extract by (1→5)-linked
arabinose.
Residue
Terminal arabinose and (1→3,4)-linked xylose indicate that there were still
small amounts of arabinoxylans present. Terminal xylose may indicate that a
small amount of xyloglucan was also present. The undermethylation of
cellulose was acute in the residue, presumably because the microfibrils had no
matrix polysaccharides holding them apart and preventing hydrogen bonding.
5.2.3 Phenolic composition
0.0
0.2
0.4
0.6
0.8
1.0
1.2
1.4
1.6
Van
illic
aci
d
p-H
ydro
xy b
enza
ldeh
yde
Van
illin
tran
s-p-
Cou
mar
ic a
cid
8,8'
-DiF
A (
AT
)
tran
s-F
erul
ic a
cid
cis-
p-C
oum
aric
aci
d
8,8'
-DiF
A (
Unk
now
n F
)
8,5'
-DiF
A
cis-
Fer
ulic
aci
d
5,5'
-DiF
A
8-O
-4'-
DiF
A
8,5'
-DiF
A (
BF
)
Unk
now
n P
heno
lic 8
9
Phenolics
Ph
eno
lic c
on
cen
trat
ion
(µ
g/m
g) 0.5M KOH Extract
1.0M KOH Extract
4.0M KOH Extract
Sequential ExtractionResidue
Figure 53: Phenolics in sequential extracts and residue from sequential extraction.
The 0.5 M KOH released the greatest amount of phenolics of the three
extractions, including significant amounts of 8-O-4’-DiFA (Figure 53). The 1.0 M
SEQUENTIAL EXTRACTION
104
KOH released a greater amount of 8,8’-DiFA (AT), 8,8’-DiFA and Unknown
Phenolic 89 than the 0.5 M KOH extraction, with 8,8’-DiFA (AT) being the most
prevalent; this may be due to these phenolics having more stable ester bonds to
their respective polysaccharides, or because they are partially protected by the
polysaccharides removed by previous extractions.
The 4.0 M KOH extract contained relatively small amounts of phenolics, but
8,8’-DiFA (AT) was present in the greatest amounts, suggesting that its linkages
to polysaccharides are more resistant to alkali than those of the other phenolics.
The sequential extraction residue released trans-ferulic and trans-p-coumaric
acid only. It would seem that the residue, which should have been fully
extracted by the previous treatments, yields more phenolics when treated with
4 M NaOH, this has been observed previously in brewers’ spent grain, wheat
bran and asparagus, (Mandalari et al., 2005; Rodríguez-Arcos et al., 2004).
5.3 Discussion
At least 80% of the parenchyma cell wall is stable in CDTA and Na2CO3. The
residue provides ~59% of the yield, which is quite close to the value of 48% for
cellulose, but does indicate that some other polysaccharides are also present.
The arabinoxylan that is present is preferentially extracted in the lower
concentrations of KOH, whereas xyloglucan is removed at higher
concentrations.
These results agree with the hypothesis that xyloglucans do not just hydrogen-
bond to the surface of the microfibrils, but are trapped within them, and can only
be released by swelling of the microfibrils in concentrated alkali (Baba et al.,
1994). The arabinoxylans that are extracted by 4.0 M KOH are held in the wall
by a mechanism that is not disrupted until the 4.0 M KOH extraction; the
mechanism could be the physical entanglement with xyloglucan, or alkali-stable
covalent cross-links to xyloglucan. It appears that not only the 8,8’-DiFA (AT),
but also the 8,8’-DiFA could have a role in this mechanism, as these were the
only dimers removed by the 4.0 M KOH. Perhaps they form a few key linkages
SEQUENTIAL EXTRACTION
105
that make the difference between the polysaccharides being soluble or
insoluble. The linkages across the middle lamella, which are probably the
8,8’-DiFA (AT), are responsible for cell adhesion, but may break in 1.0 M KOH
due to being more exposed.
The methylation analysis should be repeated; preferably on samples that have
not been freeze-dried, to reduce undermethylation due to aggregation. It may
be better to use the NaOH method, which seems to be more reliable.
BIOCHEMICAL DECONSTRUCTION
106
6 Development and Evaluation of Biochemical Methods of Cell-Wall Disassembly:
Pectins in the cell walls of the dicotyledonous Amaranthaceae species, such as
sugar beet (Clausen et al., 2004; Colquhoun et al., 1994; Rombouts and
Thibault, 1986), spinach (Fry, 1982; Ishii and Tobita, 1993) and quinoa (Renard
et al., 1999), have been found to be feruloylated at O-2 and/or O-5 of Ara
residues in the arabinan chains, or O-6 of Gal residues in the galactan chains,
in the side chains of homogalacturonan and rhamnogalacturonan (Micard et al.,
1997b; Ralet et al., 2005). Heteroxylans in the cell walls of monocotyledonous
species such as wheat (Saulnier et al., 2007; Smith and Hartley, 1983), barley
(Gubler et al., 1985) and pineapple (Smith and Harris, 2001) are feruloylated at
O-5 of Ara residues or GlcA residues. Feruloylated xyloglucan (O-4 of xylose
feruloylated) has been found in bamboo shoots by Ishii et al (1990). Ishii (1997)
reviewed all the phenolic polysaccharides that had been produced up to that
date. Since then a number of feruloylated (but not p-coumaroylated)
polysaccharides have been discovered.
The ability of ferulic acid dimers to cross-link polysaccharides was first proved
by Ishii (1991) who isolated and characterized a 5,5’-DiFA esterified to two
arabinoxylan trisaccharides. Ferulic acid dimers that are connected to
oligosaccharides at both ends have been isolated from maize bran, specifically
Ara-5,5’-DiFA-Ara, Xyl-Ara-5,5’-DiFA-Ara and Ara-8-O-4’-DiFA-Ara, using mild
acid hydrolysis (Allerdings et al., 2005; Saulnier et al., 1999) and from sugar
beet, specifically Ara-Ara-8-O-4’-DiFA-Ara-Ara, using enzyme digestion
(Levigne et al., 2004b). Even a small number of these dimers, forming
extracellularly, could significantly affect the mechanical properties of the cell
walls by increasing the Mw of the polysaccharides significantly and creating a
three dimensional network (Saulnier et al., 2007).
In order to expand our understanding of CWC cell wall structure, fragments of
polysaccharide, esterified with ferulic acid and its dimers, need to be produced.
Of particular interest is the 8,8’-DiFA (AT), due to its proposed role in cell
BIOCHEMICAL DECONSTRUCTION
107
adhesion (Parker, 2000). The preferred method to achieve this is enzyme
digestion, as with foreknowledge of the activities present in the formulations,
there is some degree of control as to which linkages are broken. This chapter
details the preliminary work for the enzyme digestion method.
6.1 Enzyme preparations
Three enzyme preparations were tested: T. viride xylanase – a pure xylanase;
Ultraflo (Humicola insolens) - a mixture of β-glucanase and xylanase, with small
amounts of cellulase, pentosanase, arabinanase, feruloyl esterase and
hemicellulase activity; Driselase (Basidiomycetes) – a mixture of laminarinase,
xylanase and cellulase (from Sigma-Aldrich data sheet), with no feruloyl
esterase activity.
6.2 Methods
Fry (1982) noted that Driselase contained phenolic contaminants, so the
Driselase powder was partially purified as described by him, with a few slight
modifications. 1 g of Driselase powder was dissolved in 10 ml of sodium
acetate buffer (50 mM pH 5.0) at 4°C for 2 hr. The resulting suspension was
centrifuged at 13,000 rpm, 4°C for 15 min to remove solid material. The
supernatant was collected and combined, and the pellet resuspended in buffer
twice followed by centrifugation as above to ensure that all of the enzyme was
transferred. The volume of supernatant was measured and sufficient
(NH4)2SO4 added to give a 75% saturated solution, before mixing at 4°C for
2 hr. The suspension was centrifuged as above and the supernatant discarded.
The pellet was resuspended in 75% saturated (NH4)2SO4 twice and centrifuged
as above. The resulting pellet was dissolved in 28 ml of water, and then 2.5 ml
aliquots eluted on pre-prepared PD-10 columns using 3.5 ml of water. The
solution had 3.016 g of glycerol added per ml of solution before freezing at
-20°C. All Driselase used in the experiments described in this chapter was
purified in this way.
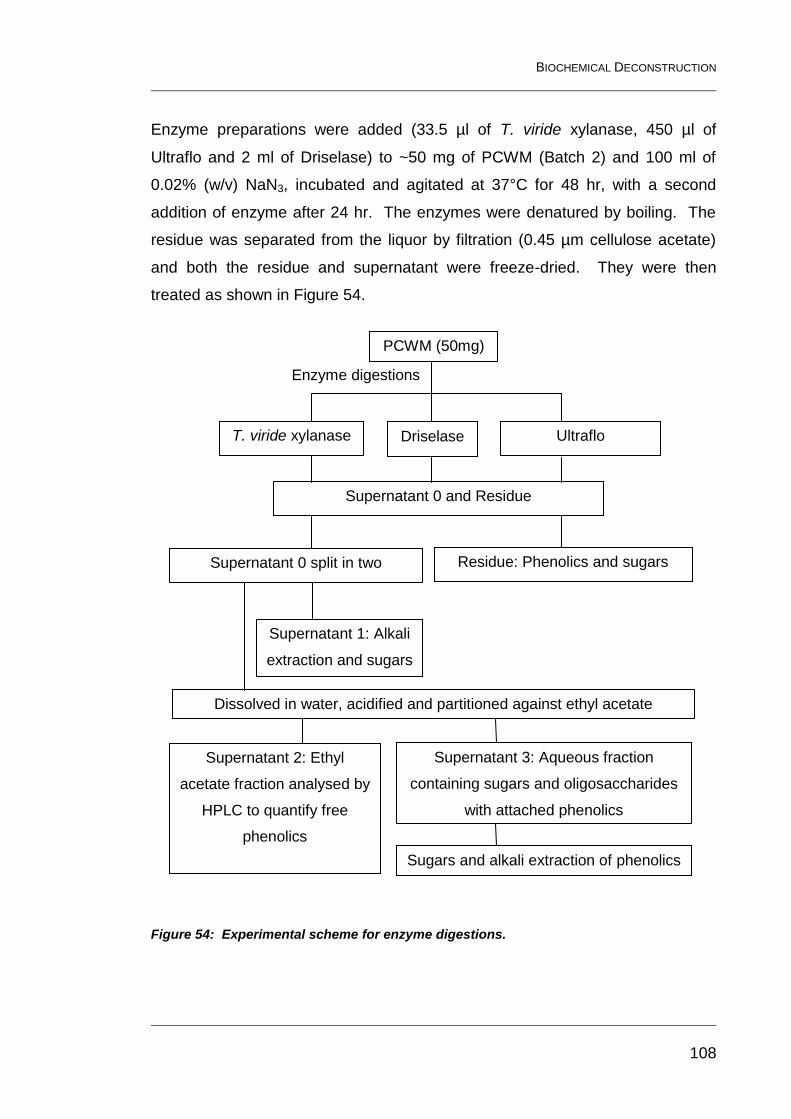
BIOCHEMICAL DECONSTRUCTION
108
Enzyme preparations were added (33.5 µl of T. viride xylanase, 450 µl of
Ultraflo and 2 ml of Driselase) to ~50 mg of PCWM (Batch 2) and 100 ml of
0.02% (w/v) NaN3, incubated and agitated at 37°C for 48 hr, with a second
addition of enzyme after 24 hr. The enzymes were denatured by boiling. The
residue was separated from the liquor by filtration (0.45 µm cellulose acetate)
and both the residue and supernatant were freeze-dried. They were then
treated as shown in Figure 54.
Figure 54: Experimental scheme for enzyme digestions.
PCWM (50mg)
Enzyme digestions
T. viride xylanase Driselase Ultraflo
Supernatant 0 and Residue
Residue: Phenolics and sugars Supernatant 0 split in two
Supernatant 3: Aqueous fraction
containing sugars and oligosaccharides
with attached phenolics
Supernatant 2: Ethyl
acetate fraction analysed by
HPLC to quantify free
phenolics
Sugars and alkali extraction of phenolics
Dissolved in water, acidified and partitioned against ethyl acetate
Supernatant 1: Alkali
extraction and sugars
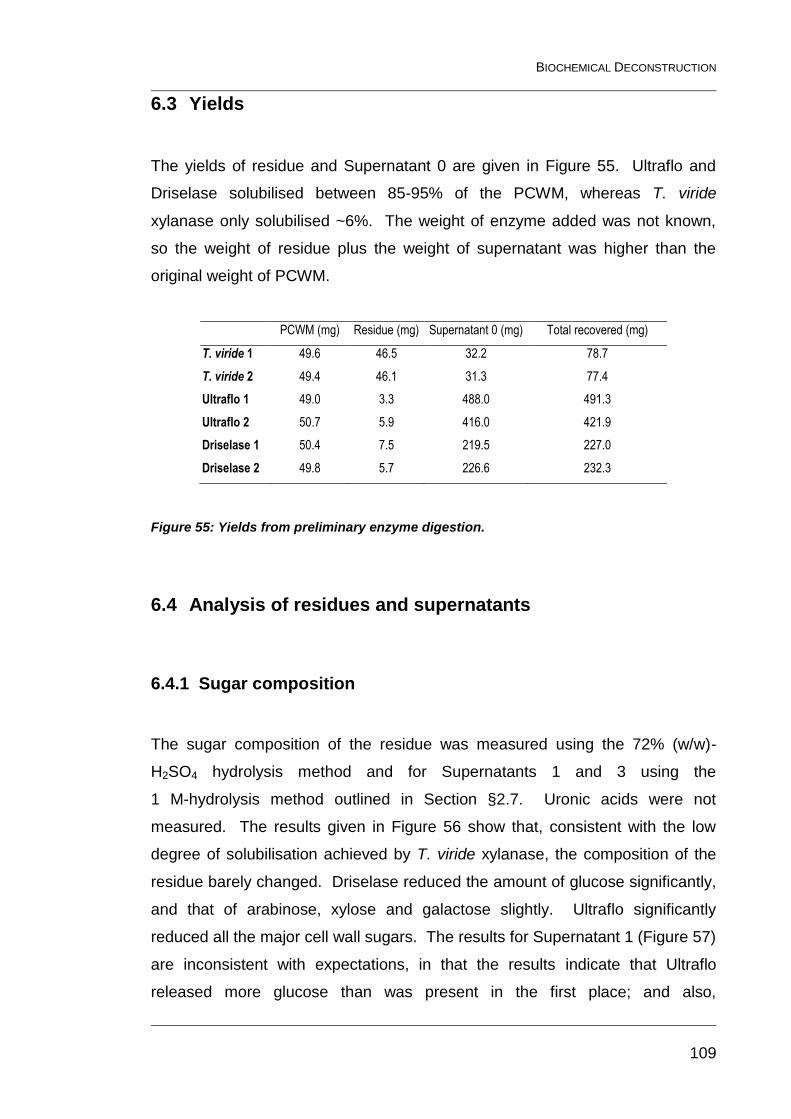
BIOCHEMICAL DECONSTRUCTION
109
6.3 Yields
The yields of residue and Supernatant 0 are given in Figure 55. Ultraflo and
Driselase solubilised between 85-95% of the PCWM, whereas T. viride
xylanase only solubilised ~6%. The weight of enzyme added was not known,
so the weight of residue plus the weight of supernatant was higher than the
original weight of PCWM.
PCWM (mg) Residue (mg) Supernatant 0 (mg) Total recovered (mg)
T. viride 1 49.6 46.5 32.2 78.7
T. viride 2 49.4 46.1 31.3 77.4
Ultraflo 1 49.0 3.3 488.0 491.3
Ultraflo 2 50.7 5.9 416.0 421.9
Driselase 1 50.4 7.5 219.5 227.0
Driselase 2 49.8 5.7 226.6 232.3
Figure 55: Yields from preliminary enzyme digestion.
6.4 Analysis of residues and supernatants
6.4.1 Sugar composition
The sugar composition of the residue was measured using the 72% (w/w)-
H2SO4 hydrolysis method and for Supernatants 1 and 3 using the
1 M-hydrolysis method outlined in Section §2.7. Uronic acids were not
measured. The results given in Figure 56 show that, consistent with the low
degree of solubilisation achieved by T. viride xylanase, the composition of the
residue barely changed. Driselase reduced the amount of glucose significantly,
and that of arabinose, xylose and galactose slightly. Ultraflo significantly
reduced all the major cell wall sugars. The results for Supernatant 1 (Figure 57)
are inconsistent with expectations, in that the results indicate that Ultraflo
released more glucose than was present in the first place; and also,
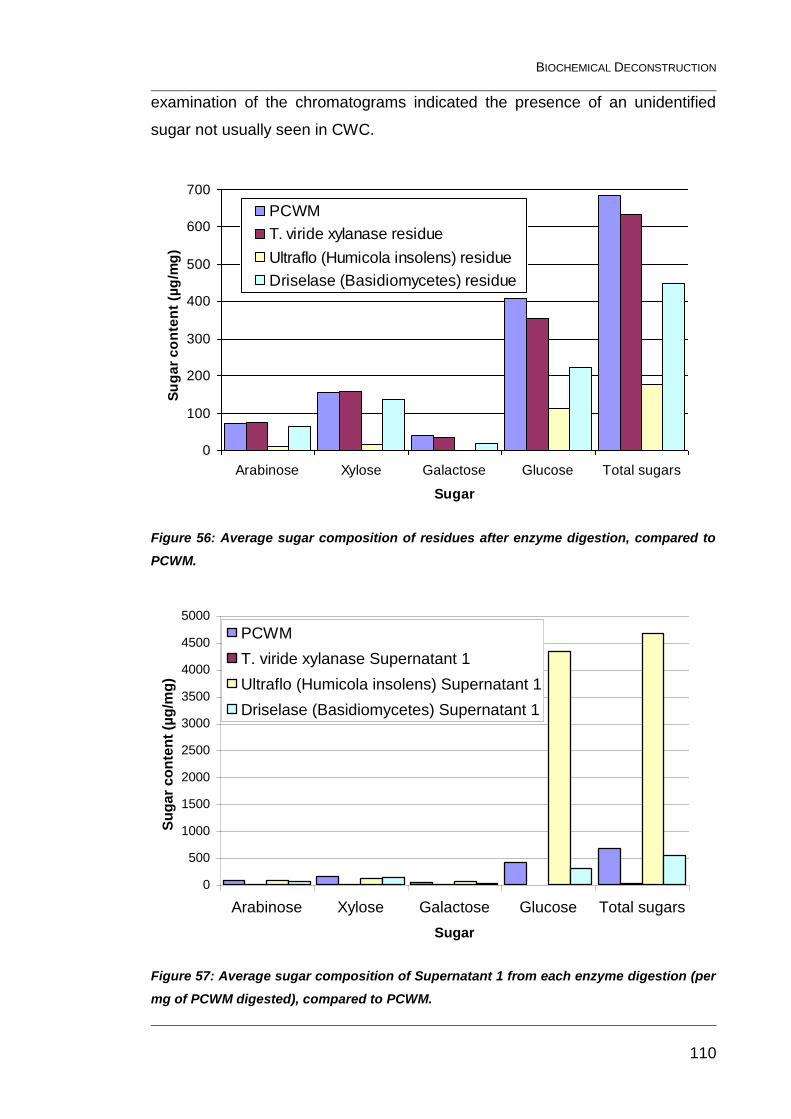
BIOCHEMICAL DECONSTRUCTION
110
examination of the chromatograms indicated the presence of an unidentified
sugar not usually seen in CWC.
0
100
200
300
400
500
600
700
Arabinose Xylose Galactose Glucose Total sugars
Sugar
Su
ga
r c
on
ten
t (µ
g/m
g)
PCWM
T. viride xylanase residue
Ultraflo (Humicola insolens) residue
Driselase (Basidiomycetes) residue
Figure 56: Average sugar composition of residues after enzyme digestion, compared to
PCWM.
0
500
1000
1500
2000
2500
3000
3500
4000
4500
5000
Arabinose Xylose Galactose Glucose Total sugars
Sugar
Su
gar
co
nte
nt
(µg
/mg
)
PCWM
T. viride xylanase Supernatant 1
Ultraflo (Humicola insolens) Supernatant 1
Driselase (Basidiomycetes) Supernatant 1
Figure 57: Average sugar composition of Supernatant 1 from each enzyme digestion (per
mg of PCWM digested), compared to PCWM.
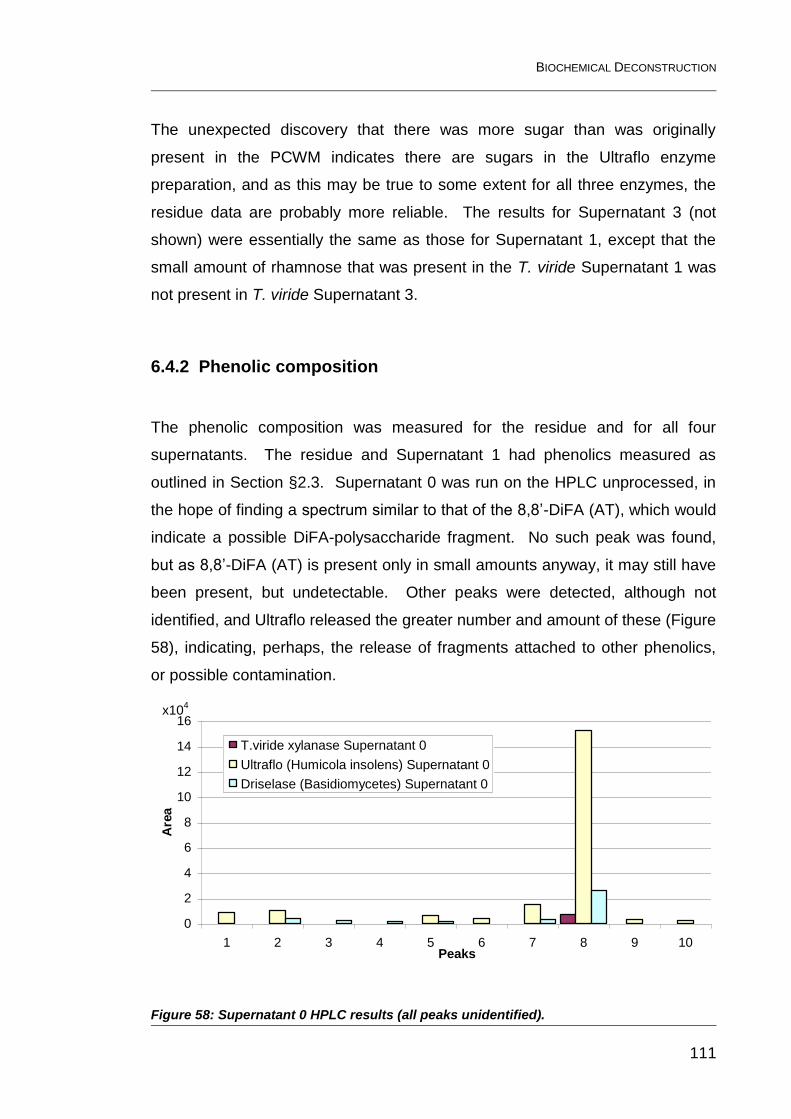
BIOCHEMICAL DECONSTRUCTION
111
The unexpected discovery that there was more sugar than was originally
present in the PCWM indicates there are sugars in the Ultraflo enzyme
preparation, and as this may be true to some extent for all three enzymes, the
residue data are probably more reliable. The results for Supernatant 3 (not
shown) were essentially the same as those for Supernatant 1, except that the
small amount of rhamnose that was present in the T. viride Supernatant 1 was
not present in T. viride Supernatant 3.
6.4.2 Phenolic composition
The phenolic composition was measured for the residue and for all four
supernatants. The residue and Supernatant 1 had phenolics measured as
outlined in Section §2.3. Supernatant 0 was run on the HPLC unprocessed, in
the hope of finding a spectrum similar to that of the 8,8’-DiFA (AT), which would
indicate a possible DiFA-polysaccharide fragment. No such peak was found,
but as 8,8’-DiFA (AT) is present only in small amounts anyway, it may still have
been present, but undetectable. Other peaks were detected, although not
identified, and Ultraflo released the greater number and amount of these (Figure
58), indicating, perhaps, the release of fragments attached to other phenolics,
or possible contamination.
0
2
4
6
8
10
12
14
16
1 2 3 4 5 6 7 8 9 10Peaks
Are
a
T.viride xylanase Supernatant 0
Ultraflo (Humicola insolens) Supernatant 0
Driselase (Basidiomycetes) Supernatant 0
x104
Figure 58: Supernatant 0 HPLC results (all peaks unidentified).
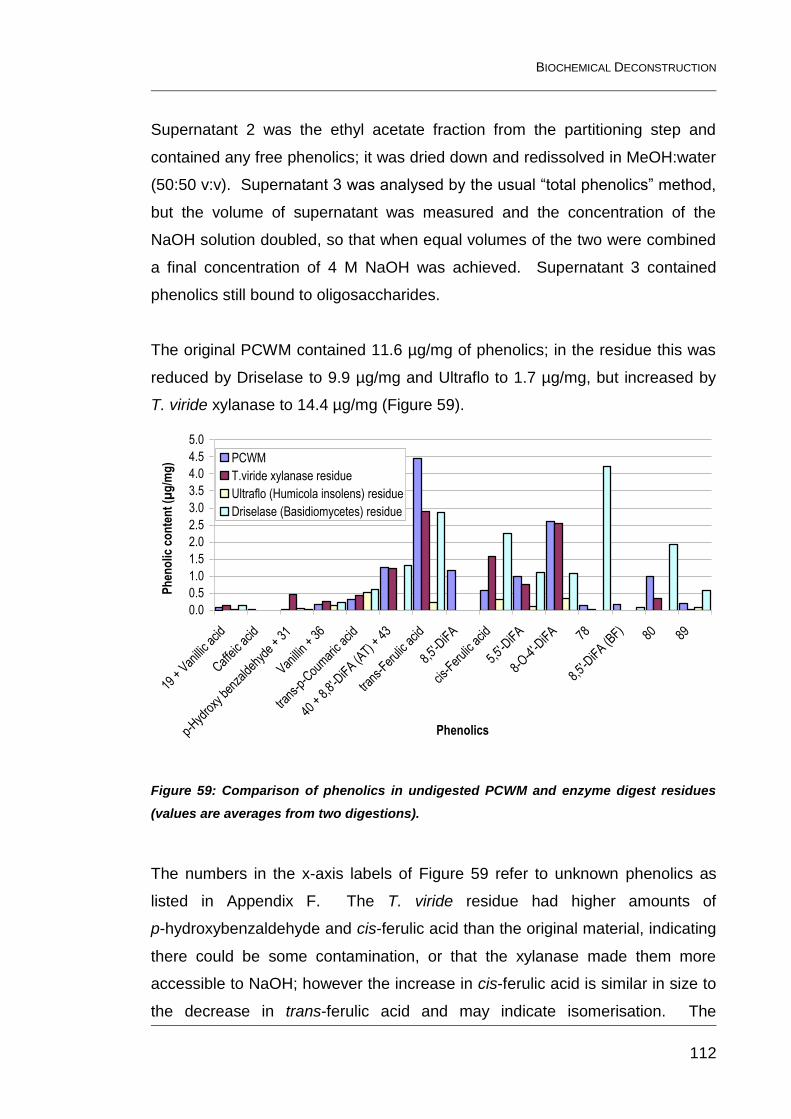
BIOCHEMICAL DECONSTRUCTION
112
Supernatant 2 was the ethyl acetate fraction from the partitioning step and
contained any free phenolics; it was dried down and redissolved in MeOH:water
(50:50 v:v). Supernatant 3 was analysed by the usual “total phenolics” method,
but the volume of supernatant was measured and the concentration of the
NaOH solution doubled, so that when equal volumes of the two were combined
a final concentration of 4 M NaOH was achieved. Supernatant 3 contained
phenolics still bound to oligosaccharides.
The original PCWM contained 11.6 µg/mg of phenolics; in the residue this was
reduced by Driselase to 9.9 µg/mg and Ultraflo to 1.7 µg/mg, but increased by
T. viride xylanase to 14.4 µg/mg (Figure 59).
0.0
0.5
1.0
1.5
2.0
2.5
3.0
3.5
4.0
4.5
5.0
19 +
Van
illic a
cid
Caffe
ic ac
id
p-Hyd
roxy
ben
zalde
hyde
+ 3
1
Vanilli
n +
36
trans
-p-C
oum
aric
acid
40 +
8,8
'-DiF
A (AT) +
43
trans
-Fer
ulic a
cid
8,5'-
DiFA
cis-F
eruli
c acid
5,5'-
DiFA
8-O-4
'-DiF
A 78
8,5'-
DiFA (B
F)80 89
Phenolics
Ph
eno
lic c
on
ten
t (µ
g/m
g) PCWM
T.viride xylanase residue
Ultraflo (Humicola insolens) residue
Driselase (Basidiomycetes) residue
Figure 59: Comparison of phenolics in undigested PCWM and enzyme digest residues
(values are averages from two digestions).
The numbers in the x-axis labels of Figure 59 refer to unknown phenolics as
listed in Appendix F. The T. viride residue had higher amounts of
p-hydroxybenzaldehyde and cis-ferulic acid than the original material, indicating
there could be some contamination, or that the xylanase made them more
accessible to NaOH; however the increase in cis-ferulic acid is similar in size to
the decrease in trans-ferulic acid and may indicate isomerisation. The
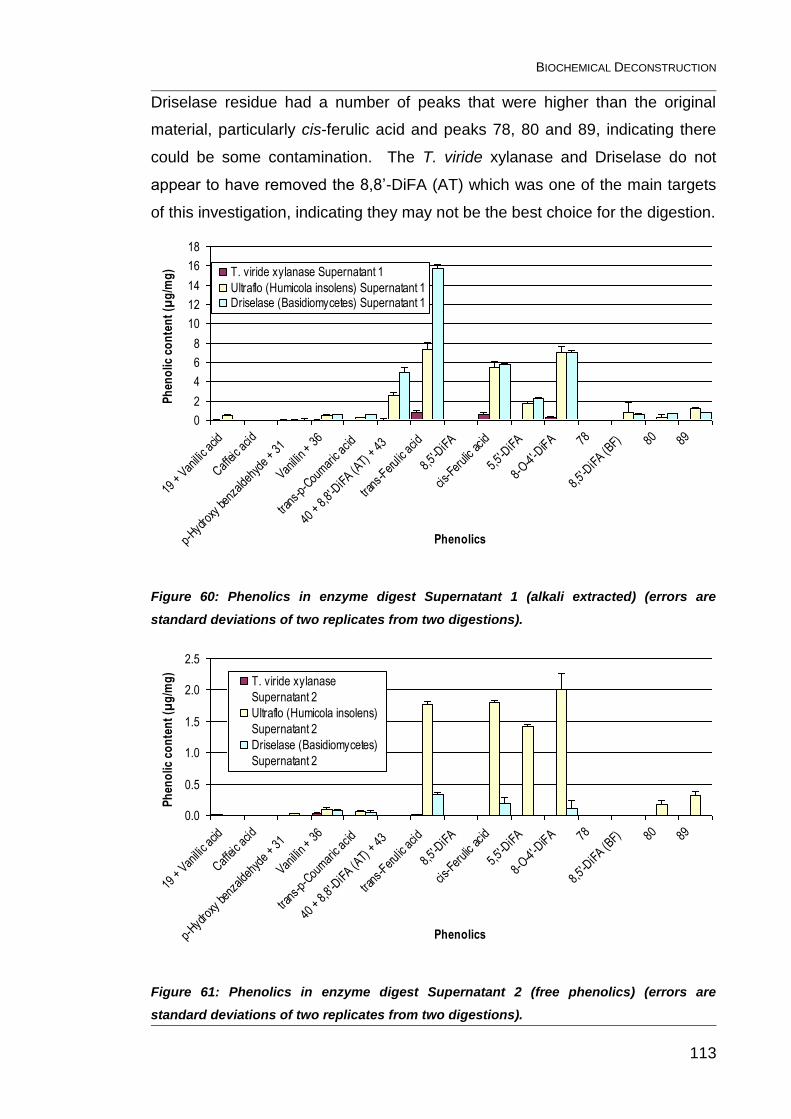
BIOCHEMICAL DECONSTRUCTION
113
Driselase residue had a number of peaks that were higher than the original
material, particularly cis-ferulic acid and peaks 78, 80 and 89, indicating there
could be some contamination. The T. viride xylanase and Driselase do not
appear to have removed the 8,8’-DiFA (AT) which was one of the main targets
of this investigation, indicating they may not be the best choice for the digestion.
0
2
4
6
8
10
12
14
16
18
19 +
Van
illic a
cid
Caffei
c acid
p-Hyd
roxy
benz
aldeh
yde
+ 31
Vanilli
n + 3
6
trans
-p-C
oum
aric
acid
40 +
8,8
'-DiF
A (AT)
+ 4
3
trans
-Fer
ulic
acid
8,5'-
DiFA
cis-F
eruli
c ac
id
5,5'-
DiFA
8-O-4
'-DiF
A 78
8,5'-
DiFA (B
F) 80 89
Phenolics
Ph
eno
lic c
on
ten
t (µ
g/m
g) T. viride xylanase Supernatant 1
Ultraflo (Humicola insolens) Supernatant 1Driselase (Basidiomycetes) Supernatant 1
Figure 60: Phenolics in enzyme digest Supernatant 1 (alkali extracted) (errors are
standard deviations of two replicates from two digestions).
0.0
0.5
1.0
1.5
2.0
2.5
19 +
Van
illic a
cid
Caffei
c acid
p-Hyd
roxy
benz
aldeh
yde
+ 31
Vanilli
n + 3
6
trans
-p-C
oum
aric
acid
40 +
8,8
'-DiF
A (AT)
+ 4
3
trans
-Fer
ulic
acid
8,5'-
DiFA
cis-F
eruli
c ac
id
5,5'-
DiFA
8-O-4
'-DiF
A 78
8,5'-
DiFA (B
F) 80 89
Phenolics
Ph
eno
lic c
on
ten
t (µ
g/m
g)
T. viride xylanase
Supernatant 2
Ultraflo (Humicola insolens)
Supernatant 2
Driselase (Basidiomycetes)
Supernatant 2
Figure 61: Phenolics in enzyme digest Supernatant 2 (free phenolics) (errors are
standard deviations of two replicates from two digestions).
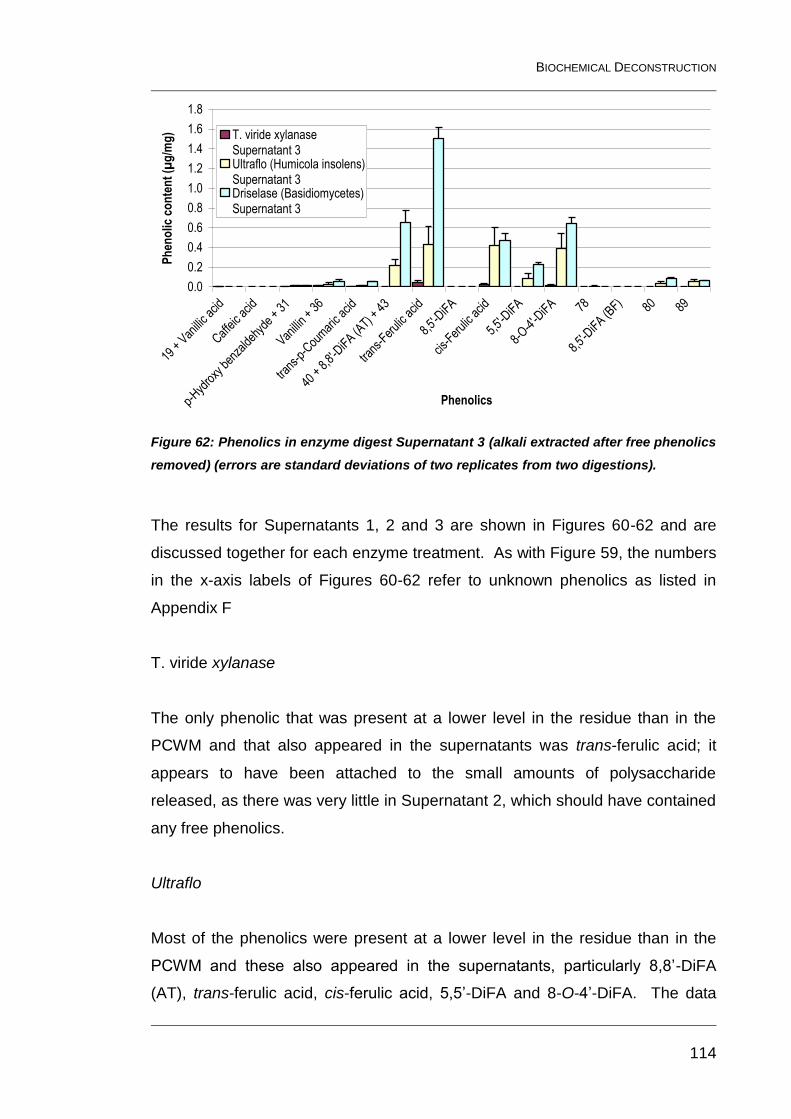
BIOCHEMICAL DECONSTRUCTION
114
0.0
0.2
0.4
0.6
0.8
1.0
1.2
1.4
1.6
1.8
19 +
Van
illic a
cid
Caffe
ic ac
id
p-Hyd
roxy
ben
zalde
hyde
+ 3
1
Vanilli
n +
36
trans
-p-C
oum
aric
acid
40 +
8,8
'-DiF
A (AT) +
43
trans
-Fer
ulic a
cid
8,5'-
DiFA
cis-F
eruli
c acid
5,5'-
DiFA
8-O-4
'-DiF
A 78
8,5'-
DiFA (B
F) 80 89
Phenolics
Ph
eno
lic c
on
ten
t (µ
g/m
g) T. viride xylanase
Supernatant 3Ultraflo (Humicola insolens)Supernatant 3Driselase (Basidiomycetes)Supernatant 3
Figure 62: Phenolics in enzyme digest Supernatant 3 (alkali extracted after free phenolics
removed) (errors are standard deviations of two replicates from two digestions).
The results for Supernatants 1, 2 and 3 are shown in Figures 60-62 and are
discussed together for each enzyme treatment. As with Figure 59, the numbers
in the x-axis labels of Figures 60-62 refer to unknown phenolics as listed in
Appendix F
T. viride xylanase
The only phenolic that was present at a lower level in the residue than in the
PCWM and that also appeared in the supernatants was trans-ferulic acid; it
appears to have been attached to the small amounts of polysaccharide
released, as there was very little in Supernatant 2, which should have contained
any free phenolics.
Ultraflo
Most of the phenolics were present at a lower level in the residue than in the
PCWM and these also appeared in the supernatants, particularly 8,8’-DiFA
(AT), trans-ferulic acid, cis-ferulic acid, 5,5’-DiFA and 8-O-4’-DiFA. The data
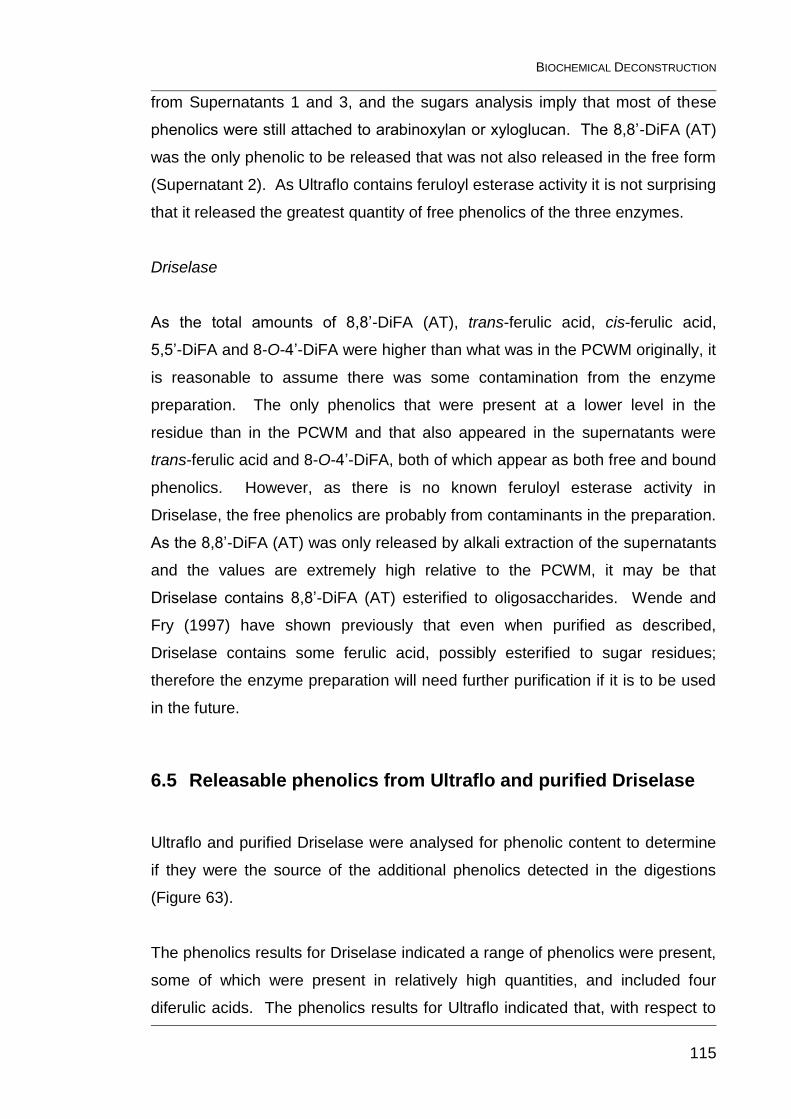
BIOCHEMICAL DECONSTRUCTION
115
from Supernatants 1 and 3, and the sugars analysis imply that most of these
phenolics were still attached to arabinoxylan or xyloglucan. The 8,8’-DiFA (AT)
was the only phenolic to be released that was not also released in the free form
(Supernatant 2). As Ultraflo contains feruloyl esterase activity it is not surprising
that it released the greatest quantity of free phenolics of the three enzymes.
Driselase
As the total amounts of 8,8’-DiFA (AT), trans-ferulic acid, cis-ferulic acid,
5,5’-DiFA and 8-O-4’-DiFA were higher than what was in the PCWM originally, it
is reasonable to assume there was some contamination from the enzyme
preparation. The only phenolics that were present at a lower level in the
residue than in the PCWM and that also appeared in the supernatants were
trans-ferulic acid and 8-O-4’-DiFA, both of which appear as both free and bound
phenolics. However, as there is no known feruloyl esterase activity in
Driselase, the free phenolics are probably from contaminants in the preparation.
As the 8,8’-DiFA (AT) was only released by alkali extraction of the supernatants
and the values are extremely high relative to the PCWM, it may be that
Driselase contains 8,8’-DiFA (AT) esterified to oligosaccharides. Wende and
Fry (1997) have shown previously that even when purified as described,
Driselase contains some ferulic acid, possibly esterified to sugar residues;
therefore the enzyme preparation will need further purification if it is to be used
in the future.
6.5 Releasable phenolics from Ultraflo and purified Driselase
Ultraflo and purified Driselase were analysed for phenolic content to determine
if they were the source of the additional phenolics detected in the digestions
(Figure 63).
The phenolics results for Driselase indicated a range of phenolics were present,
some of which were present in relatively high quantities, and included four
diferulic acids. The phenolics results for Ultraflo indicated that, with respect to
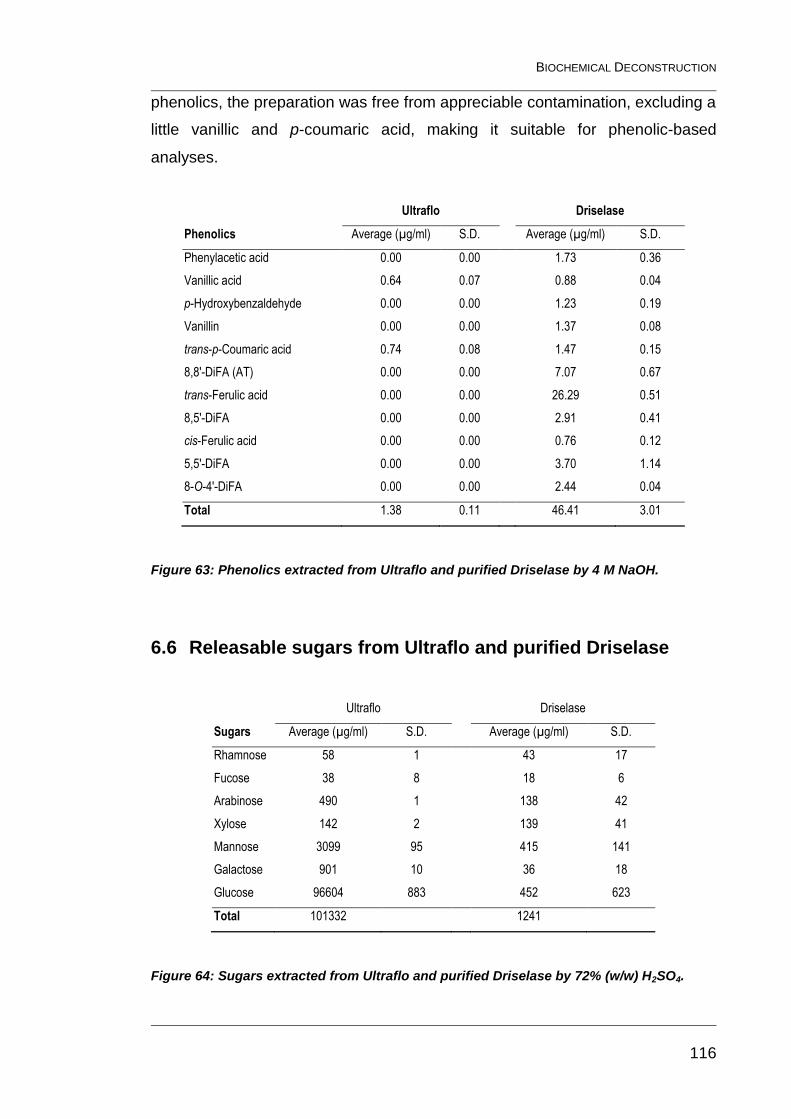
BIOCHEMICAL DECONSTRUCTION
116
phenolics, the preparation was free from appreciable contamination, excluding a
little vanillic and p-coumaric acid, making it suitable for phenolic-based
analyses.
Ultraflo Driselase
Phenolics Average (µg/ml) S.D. Average (µg/ml) S.D.
Phenylacetic acid 0.00 0.00 1.73 0.36
Vanillic acid 0.64 0.07 0.88 0.04
p-Hydroxybenzaldehyde 0.00 0.00 1.23 0.19
Vanillin 0.00 0.00 1.37 0.08
trans-p-Coumaric acid 0.74 0.08 1.47 0.15
8,8'-DiFA (AT) 0.00 0.00 7.07 0.67
trans-Ferulic acid 0.00 0.00 26.29 0.51
8,5'-DiFA 0.00 0.00 2.91 0.41
cis-Ferulic acid 0.00 0.00 0.76 0.12
5,5'-DiFA 0.00 0.00 3.70 1.14
8-O-4'-DiFA 0.00 0.00 2.44 0.04
Total 1.38 0.11 46.41 3.01
Figure 63: Phenolics extracted from Ultraflo and purified Driselase by 4 M NaOH.
6.6 Releasable sugars from Ultraflo and purified Driselase
Ultraflo Driselase
Sugars Average (µg/ml) S.D. Average (µg/ml) S.D.
Rhamnose 58 1 43 17
Fucose 38 8 18 6
Arabinose 490 1 138 42
Xylose 142 2 139 41
Mannose 3099 95 415 141
Galactose 901 10 36 18
Glucose 96604 883 452 623
Total 101332 1241
Figure 64: Sugars extracted from Ultraflo and purified Driselase by 72% (w/w) H2SO4.
BIOCHEMICAL DECONSTRUCTION
117
Ultraflo and purified Driselase were analysed for sugar content to determine if
they were the source of the additional sugars detected in the digestions (Figure
64). The sugars results for Driselase were inconsistent, but on average there
were ~1250 µg/ml, particularly glucose and mannose (~400 µg/ml each). The
sugars results for Ultraflo were high (~100 mg/ml), and resulted in the GC
chromatogram showing overloaded peaks.
As expected from the digestion results glucose was present in the greatest
amounts. At least some of the sugars could be covalently attached to the
enzymes, so the figures above are maximum values. However, it would
indicate that neither of these enzyme preparations is suitable for the current
investigation; even so a number of researchers have used Driselase to produce
phenolic-oligosaccharides in the past (Bunzel et al., 2002; Levigne et al., 2004a;
Ralet et al., 1994b). The manufacturer’s data sheet (Sigma-Aldrich) for
Driselase states that approximately 15% of the raw powder is protein. This
shows that there are significant amounts of other components, which
presumably include sugars and phenolics. Studies that have used Driselase,
without purification, may have been affected by the phenolic contamination
shown here and quantified by Wende and Fry (1997) as 39.6 nmol saponifiable
ferulate in 2.5 mg purified Driselase. Figure 65 lists a selection of references
that have used Driselase (or a component thereof) to break down plant cell-wall
polysaccharides, whole CWM or alcohol-insolubule residue (AIR). For each
one the type and amount of substrate is given, as is the type of purification of
Driselase used, and whether enzyme-only controls were included. The types of
purification method used have been encoded in Figures 65 and 65b as follows:
NS – No method specified
Supernatant – Raw Driselase powder dissolved in water or buffer, then
centrifuged, and the resulting supernatant used
Fry – The partial purification method described by Fry (1982) or similar
Specific – More specific methods designed to isolate a particular enzyme activity
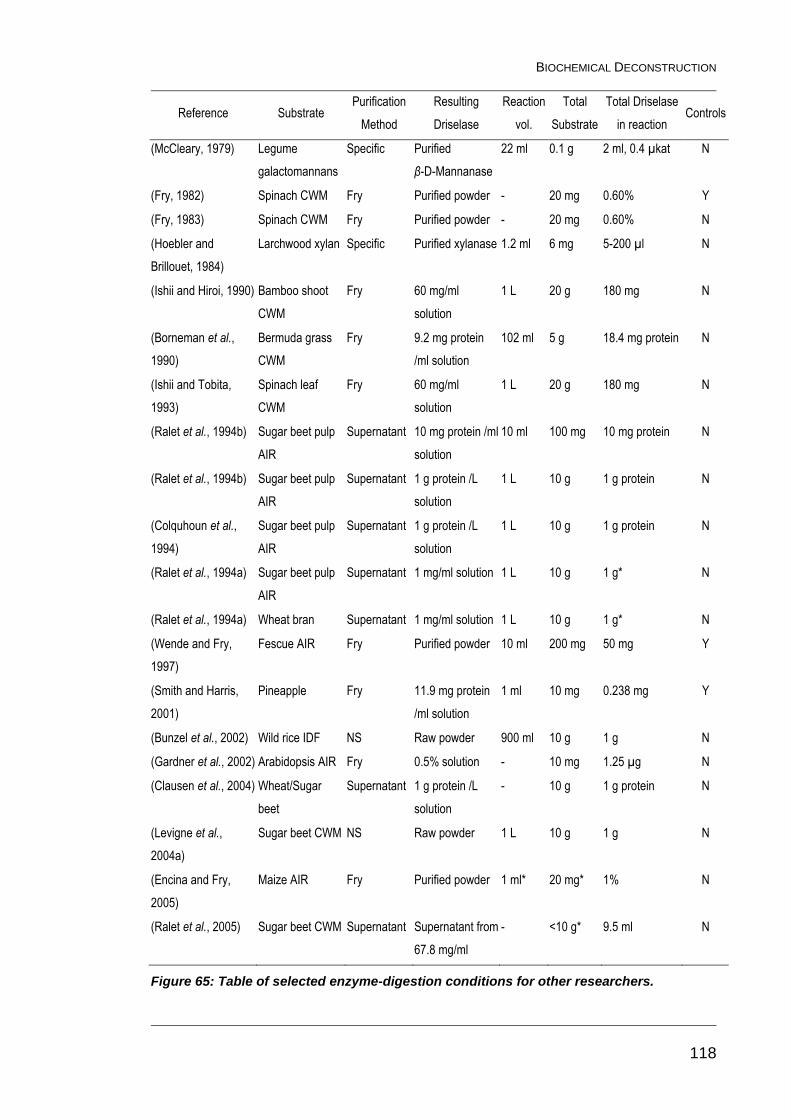
BIOCHEMICAL DECONSTRUCTION
118
Reference Substrate Purification
Method
Resulting
Driselase
Reaction
vol.
Total
Substrate
Total Driselase
in reaction Controls
(McCleary, 1979) Legume
galactomannans
Specific Purified
β-D-Mannanase
22 ml 0.1 g 2 ml, 0.4 µkat N
(Fry, 1982) Spinach CWM Fry Purified powder - 20 mg 0.60% Y
(Fry, 1983) Spinach CWM Fry Purified powder - 20 mg 0.60% N
(Hoebler and
Brillouet, 1984)
Larchwood xylan Specific Purified xylanase 1.2 ml 6 mg 5-200 µl N
(Ishii and Hiroi, 1990) Bamboo shoot
CWM
Fry 60 mg/ml
solution
1 L 20 g 180 mg N
(Borneman et al.,
1990)
Bermuda grass
CWM
Fry 9.2 mg protein
/ml solution
102 ml 5 g 18.4 mg protein N
(Ishii and Tobita,
1993)
Spinach leaf
CWM
Fry 60 mg/ml
solution
1 L 20 g 180 mg N
(Ralet et al., 1994b) Sugar beet pulp
AIR
Supernatant 10 mg protein /ml
solution
10 ml 100 mg 10 mg protein N
(Ralet et al., 1994b) Sugar beet pulp
AIR
Supernatant 1 g protein /L
solution
1 L 10 g 1 g protein N
(Colquhoun et al.,
1994)
Sugar beet pulp
AIR
Supernatant 1 g protein /L
solution
1 L 10 g 1 g protein N
(Ralet et al., 1994a) Sugar beet pulp
AIR
Supernatant 1 mg/ml solution 1 L 10 g 1 g* N
(Ralet et al., 1994a) Wheat bran Supernatant 1 mg/ml solution 1 L 10 g 1 g* N
(Wende and Fry,
1997)
Fescue AIR Fry Purified powder 10 ml 200 mg 50 mg Y
(Smith and Harris,
2001)
Pineapple Fry 11.9 mg protein
/ml solution
1 ml 10 mg 0.238 mg Y
(Bunzel et al., 2002) Wild rice IDF NS Raw powder 900 ml 10 g 1 g N
(Gardner et al., 2002) Arabidopsis AIR Fry 0.5% solution - 10 mg 1.25 µg N
(Clausen et al., 2004) Wheat/Sugar
beet
Supernatant 1 g protein /L
solution
- 10 g 1 g protein N
(Levigne et al.,
2004a)
Sugar beet CWM NS Raw powder 1 L 10 g 1 g N
(Encina and Fry,
2005)
Maize AIR Fry Purified powder 1 ml* 20 mg* 1% N
(Ralet et al., 2005) Sugar beet CWM Supernatant Supernatant from
67.8 mg/ml
- <10 g* 9.5 ml N
Figure 65: Table of selected enzyme-digestion conditions for other researchers.
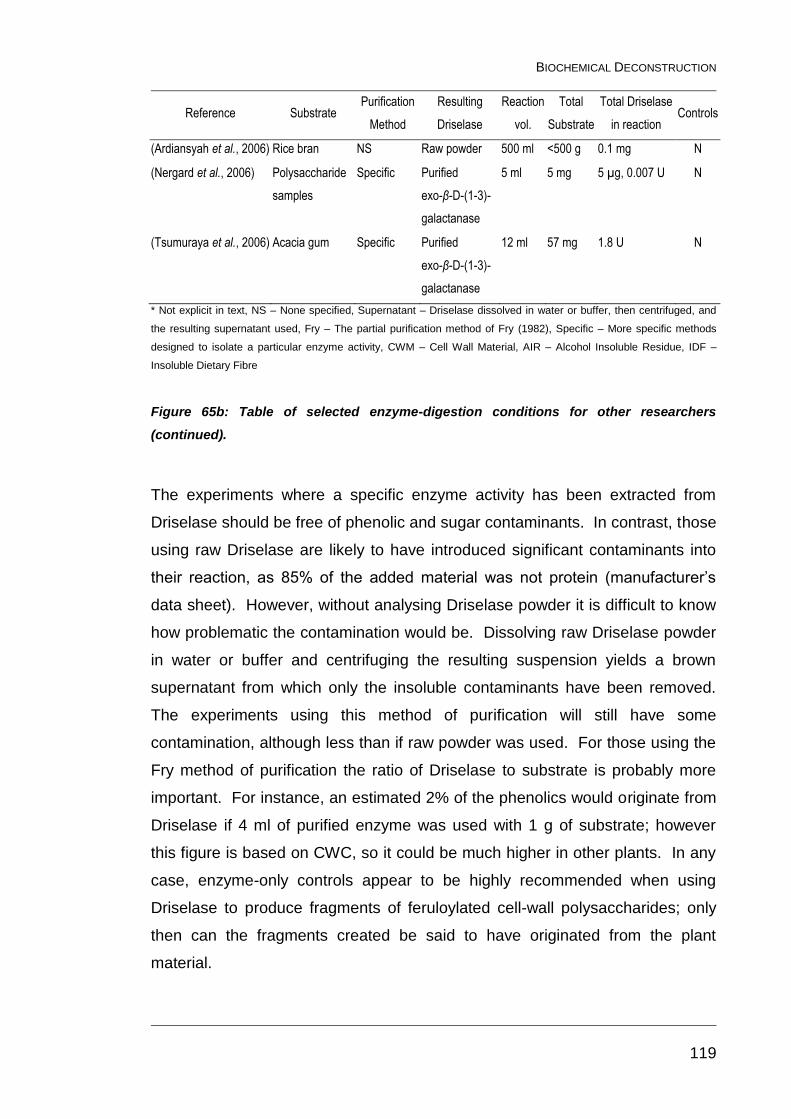
BIOCHEMICAL DECONSTRUCTION
119
Reference Substrate Purification
Method
Resulting
Driselase
Reaction
vol.
Total
Substrate
Total Driselase
in reaction Controls
(Ardiansyah et al., 2006) Rice bran NS Raw powder 500 ml <500 g 0.1 mg N
(Nergard et al., 2006) Polysaccharide
samples
Specific Purified
exo-β-D-(1-3)-
galactanase
5 ml 5 mg 5 µg, 0.007 U N
(Tsumuraya et al., 2006) Acacia gum Specific Purified
exo-β-D-(1-3)-
galactanase
12 ml 57 mg 1.8 U N
* Not explicit in text, NS – None specified, Supernatant – Driselase dissolved in water or buffer, then centrifuged, and
the resulting supernatant used, Fry – The partial purification method of Fry (1982), Specific – More specific methods
designed to isolate a particular enzyme activity, CWM – Cell Wall Material, AIR – Alcohol Insoluble Residue, IDF –
Insoluble Dietary Fibre
Figure 65b: Table of selected enzyme-digestion conditions for other researchers
(continued).
The experiments where a specific enzyme activity has been extracted from
Driselase should be free of phenolic and sugar contaminants. In contrast, those
using raw Driselase are likely to have introduced significant contaminants into
their reaction, as 85% of the added material was not protein (manufacturer’s
data sheet). However, without analysing Driselase powder it is difficult to know
how problematic the contamination would be. Dissolving raw Driselase powder
in water or buffer and centrifuging the resulting suspension yields a brown
supernatant from which only the insoluble contaminants have been removed.
The experiments using this method of purification will still have some
contamination, although less than if raw powder was used. For those using the
Fry method of purification the ratio of Driselase to substrate is probably more
important. For instance, an estimated 2% of the phenolics would originate from
Driselase if 4 ml of purified enzyme was used with 1 g of substrate; however
this figure is based on CWC, so it could be much higher in other plants. In any
case, enzyme-only controls appear to be highly recommended when using
Driselase to produce fragments of feruloylated cell-wall polysaccharides; only
then can the fragments created be said to have originated from the plant
material.
BIOCHEMICAL DECONSTRUCTION
120
6.7 Discussion
Driselase would have been the enzyme preparation of choice, due to its high
degree of solubilisation of the material and lack of FAE activity, but as it was
contaminated with the very phenolics that were of most interest, it was deemed
unsuitable. Ultraflo was also unsuitable due to the apparent contamination from
sugars and its ability to release esterified phenolics. As the T. viride xylanase
was poor at solubilising the material there was no choice but to resort to mild
acid hydrolysis, as described in Chapter 7.
For those wishing to use Driselase for future studies a possible method for
avoiding the phenolic contamination problem would be to purify out the
individual activities and recombine them to give a clean preparation with known
activity. The isolation of an exo-β-(1→3)-D-galactanase and an exo-cellulase
(Kanda et al., 1978; Tsumuraya et al., 2006) from Driselase has already been
achieved.
CHEMICAL DECONSTRUCTION
121
7 Development, Evaluation and Exploitation of Chemical Methods of Cell-Wall Disassembly:
The aim of these experiments was to elucidate the nature of the phenolic-
polysaccharide associations, particularly those which cross-link polysaccharide
chains. This included determining which phenolics are esterified to
polysaccharides, and whether they cross-link polysaccharide chains, particularly
the 8,8’-DiFA (AT) that is thought to be so important for cell adhesion in CWC
(Parker, 2000).
As enzyme digestion was not suitable for this, due to the contamination of the
enzyme preparations with sugars and phenolics (see Chapter 6), a chemical
method was chosen, even though chemical methods are less specific. The
method chosen to produce the phenolic-polysaccharide fragments from CWC
PCWM was mild acid hydrolysis with 0.05 M TFA, which has been used to
produce phenolic-polysaccharide fragments in the past (Allerdings et al., 2005;
Allerdings et al., 2006; Funk et al., 2005; Saulnier et al., 1999).
7.1 Methods
As multiple hydrolyses were carried out and numerous sub-fractions were
produced, a flow diagram has been produced as a guide to the various
treatments (Figure 66).
Fragments were produced by mild acid hydrolysis of ~1 g PCWM (Batch 2)
using 100 ml of 0.05 M TFA at 100°C for 3 hr. These conditions were chosen
by refering to kinetic experiments done by Saulnier et al (1995) that showed that
a 3 hr hydrolysis gave the best balance between hydrolysing the sugars and
leaving the phenolics esterified to sugars. The mixture was cooled and filtered
through a 0.45 µm PTFE membrane filter under vacuum (the filter was
moistened with ethanol first). The residue was washed with 2 x 100 ml of water,
combining the washings with the original filtrate, and then frozen. The TFA was
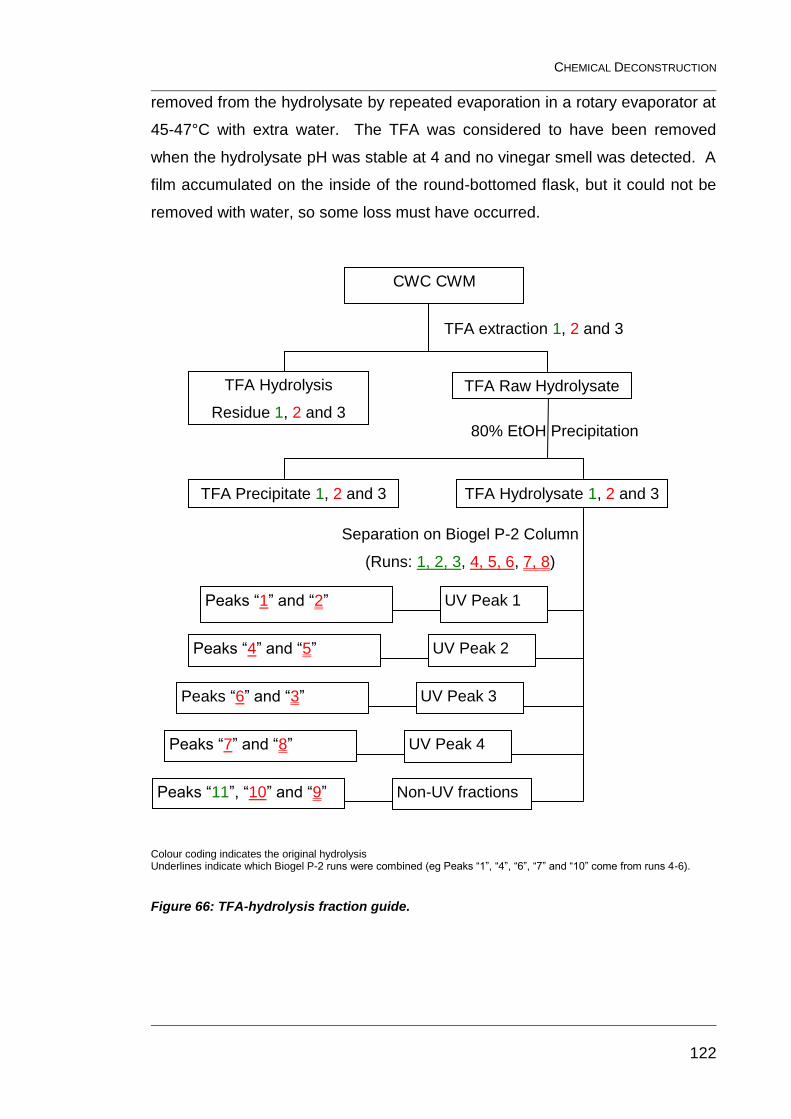
CHEMICAL DECONSTRUCTION
122
removed from the hydrolysate by repeated evaporation in a rotary evaporator at
45-47°C with extra water. The TFA was considered to have been removed
when the hydrolysate pH was stable at 4 and no vinegar smell was detected. A
film accumulated on the inside of the round-bottomed flask, but it could not be
removed with water, so some loss must have occurred.
Colour coding indicates the original hydrolysis Underlines indicate which Biogel P-2 runs were combined (eg Peaks “1”, “4”, “6”, “7” and “10” come from runs 4-6).
Figure 66: TFA-hydrolysis fraction guide.
CWC CWM
TFA Hydrolysis
Residue 1, 2 and 3
TFA extraction 1, 2 and 3
TFA Raw Hydrolysate
80% EtOH Precipitation
TFA Hydrolysate 1, 2 and 3 TFA Precipitate 1, 2 and 3
UV Peak 1
UV Peak 2
UV Peak 3
UV Peak 4
Separation on Biogel P-2 Column
(Runs: 1, 2, 3, 4, 5, 6, 7, 8)
Non-UV fractions
Peaks “1” and “2”
Peaks “4” and “5”
Peaks “6” and “3”
Peaks “7” and “8”
Peaks “11”, “10” and “9”
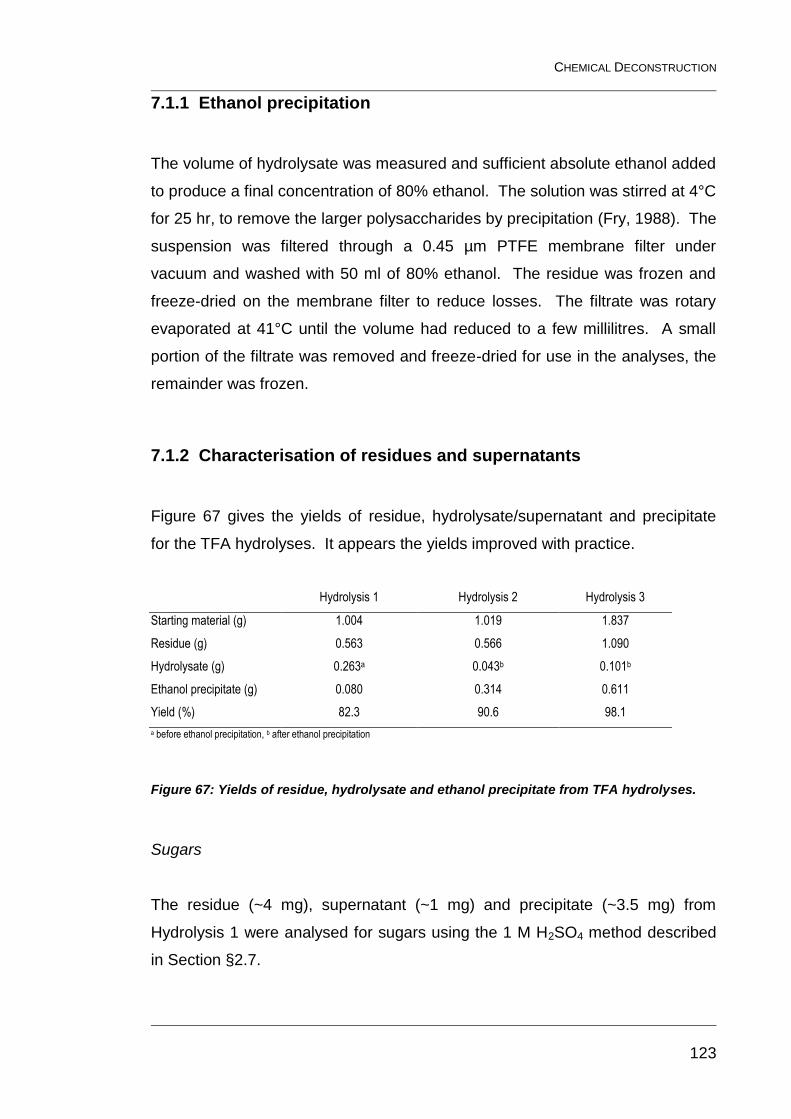
CHEMICAL DECONSTRUCTION
123
7.1.1 Ethanol precipitation
The volume of hydrolysate was measured and sufficient absolute ethanol added
to produce a final concentration of 80% ethanol. The solution was stirred at 4°C
for 25 hr, to remove the larger polysaccharides by precipitation (Fry, 1988). The
suspension was filtered through a 0.45 µm PTFE membrane filter under
vacuum and washed with 50 ml of 80% ethanol. The residue was frozen and
freeze-dried on the membrane filter to reduce losses. The filtrate was rotary
evaporated at 41°C until the volume had reduced to a few millilitres. A small
portion of the filtrate was removed and freeze-dried for use in the analyses, the
remainder was frozen.
7.1.2 Characterisation of residues and supernatants
Figure 67 gives the yields of residue, hydrolysate/supernatant and precipitate
for the TFA hydrolyses. It appears the yields improved with practice.
Hydrolysis 1 Hydrolysis 2 Hydrolysis 3
Starting material (g) 1.004 1.019 1.837
Residue (g) 0.563 0.566 1.090
Hydrolysate (g) 0.263a 0.043b 0.101b
Ethanol precipitate (g) 0.080 0.314 0.611
Yield (%) 82.3 90.6 98.1
a before ethanol precipitation, b after ethanol precipitation
Figure 67: Yields of residue, hydrolysate and ethanol precipitate from TFA hydrolyses.
Sugars
The residue (~4 mg), supernatant (~1 mg) and precipitate (~3.5 mg) from
Hydrolysis 1 were analysed for sugars using the 1 M H2SO4 method described
in Section §2.7.
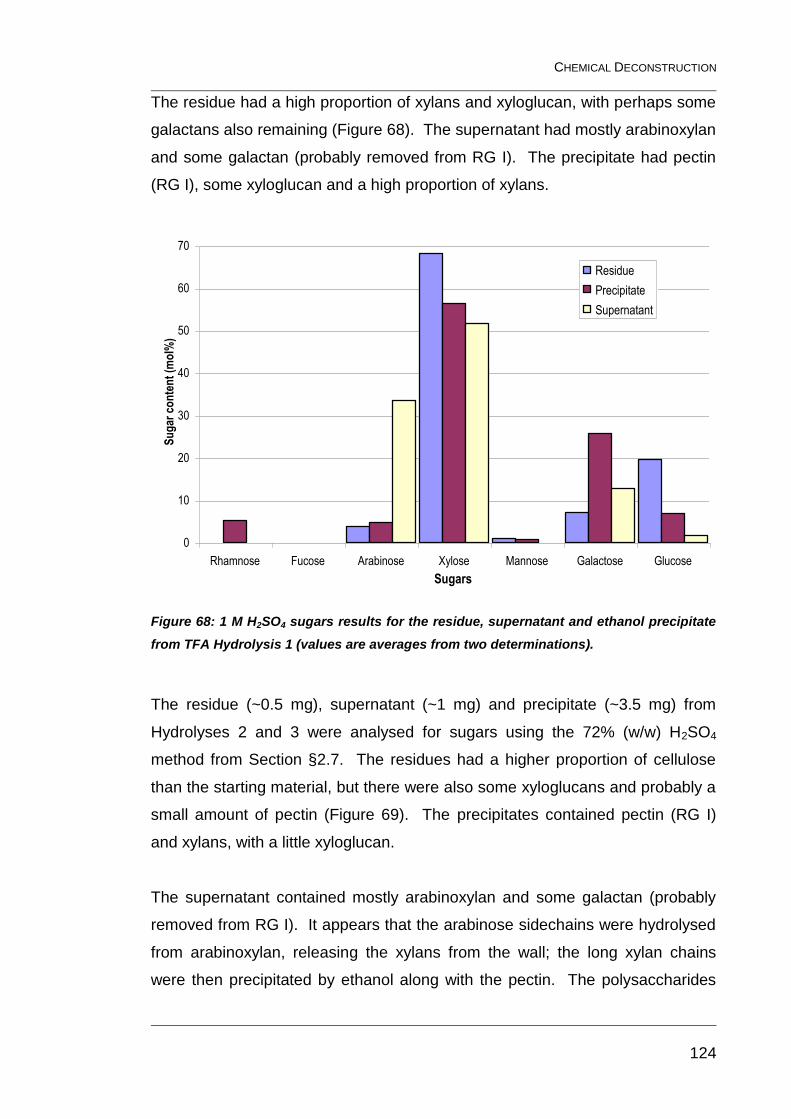
CHEMICAL DECONSTRUCTION
124
The residue had a high proportion of xylans and xyloglucan, with perhaps some
galactans also remaining (Figure 68). The supernatant had mostly arabinoxylan
and some galactan (probably removed from RG I). The precipitate had pectin
(RG I), some xyloglucan and a high proportion of xylans.
0
10
20
30
40
50
60
70
Rhamnose Fucose Arabinose Xylose Mannose Galactose Glucose
Sugars
Su
gar
co
nte
nt
(mo
l%)
Residue
Precipitate
Supernatant
Figure 68: 1 M H2SO4 sugars results for the residue, supernatant and ethanol precipitate
from TFA Hydrolysis 1 (values are averages from two determinations).
The residue (~0.5 mg), supernatant (~1 mg) and precipitate (~3.5 mg) from
Hydrolyses 2 and 3 were analysed for sugars using the 72% (w/w) H2SO4
method from Section §2.7. The residues had a higher proportion of cellulose
than the starting material, but there were also some xyloglucans and probably a
small amount of pectin (Figure 69). The precipitates contained pectin (RG I)
and xylans, with a little xyloglucan.
The supernatant contained mostly arabinoxylan and some galactan (probably
removed from RG I). It appears that the arabinose sidechains were hydrolysed
from arabinoxylan, releasing the xylans from the wall; the long xylan chains
were then precipitated by ethanol along with the pectin. The polysaccharides
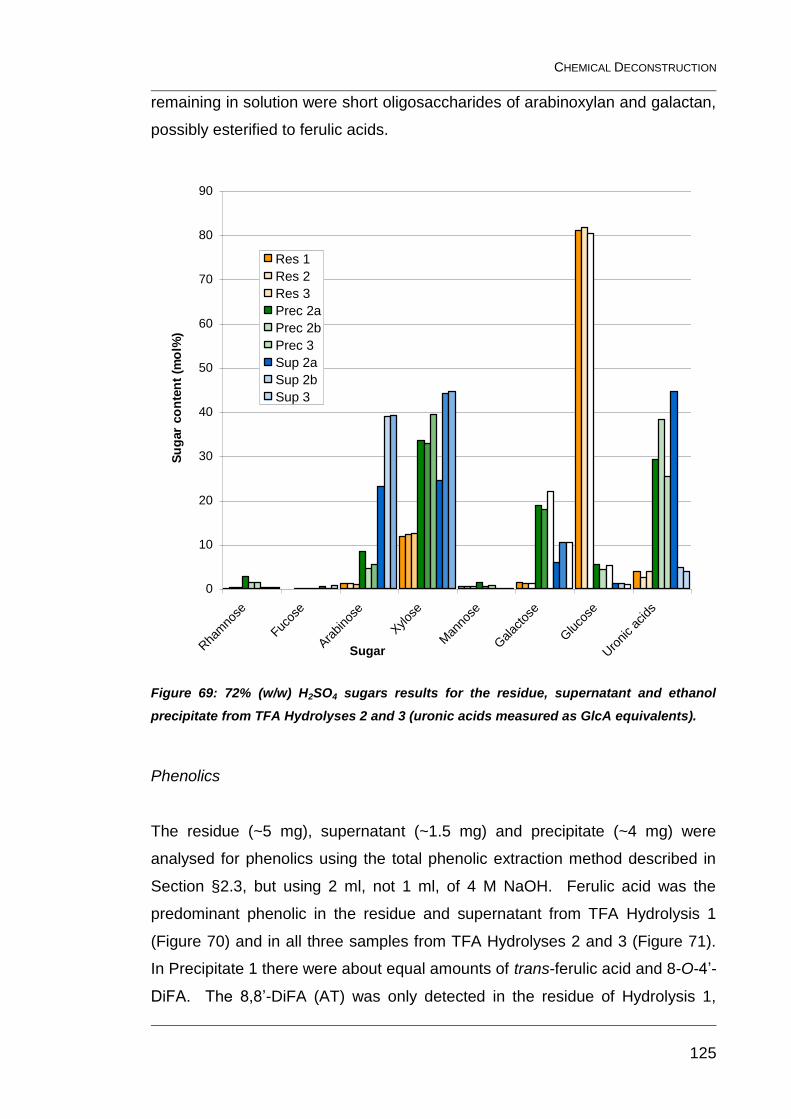
CHEMICAL DECONSTRUCTION
125
remaining in solution were short oligosaccharides of arabinoxylan and galactan,
possibly esterified to ferulic acids.
0
10
20
30
40
50
60
70
80
90
Rha
mno
se
Fucos
e
Ara
bino
se
Xylos
e
Man
nose
Galac
tose
Gluco
se
Uro
nic ac
ids
Sugar
Su
gar
co
nte
nt
(mo
l%)
Res 1
Res 2
Res 3
Prec 2a
Prec 2b
Prec 3
Sup 2a
Sup 2b
Sup 3
Figure 69: 72% (w/w) H2SO4 sugars results for the residue, supernatant and ethanol
precipitate from TFA Hydrolyses 2 and 3 (uronic acids measured as GlcA equivalents).
Phenolics
The residue (~5 mg), supernatant (~1.5 mg) and precipitate (~4 mg) were
analysed for phenolics using the total phenolic extraction method described in
Section §2.3, but using 2 ml, not 1 ml, of 4 M NaOH. Ferulic acid was the
predominant phenolic in the residue and supernatant from TFA Hydrolysis 1
(Figure 70) and in all three samples from TFA Hydrolyses 2 and 3 (Figure 71).
In Precipitate 1 there were about equal amounts of trans-ferulic acid and 8-O-4’-
DiFA. The 8,8’-DiFA (AT) was only detected in the residue of Hydrolysis 1,
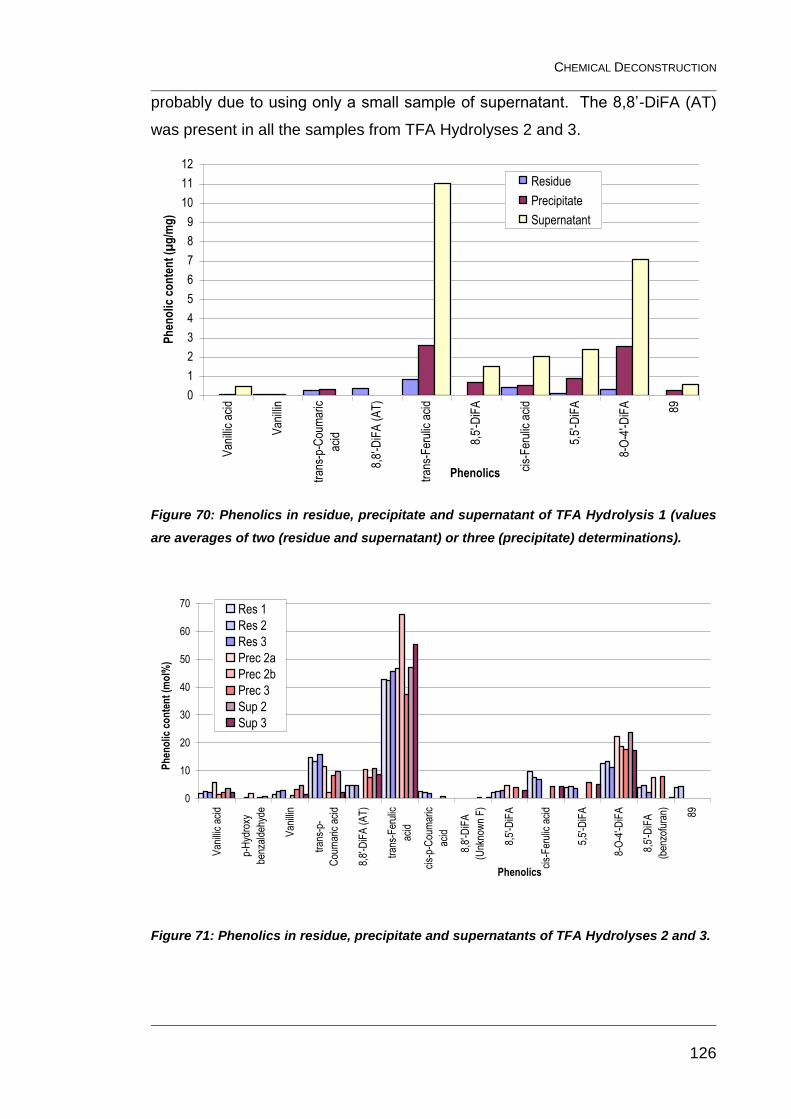
CHEMICAL DECONSTRUCTION
126
probably due to using only a small sample of supernatant. The 8,8’-DiFA (AT)
was present in all the samples from TFA Hydrolyses 2 and 3.
0
1
2
3
4
5
6
7
8
9
10
11
12
Van
illic
aci
d
Van
illin
tran
s-p-
Cou
mar
ic
acid
8,8'
-DiF
A (
AT
)
tran
s-F
erul
ic a
cid
8,5'
-DiF
A
cis-
Fer
ulic
aci
d
5,5'
-DiF
A
8-O
-4'-D
iFA 89
Phenolics
Ph
eno
lic
con
ten
t (µ
g/m
g)
Residue
Precipitate
Supernatant
Figure 70: Phenolics in residue, precipitate and supernatant of TFA Hydrolysis 1 (values
are averages of two (residue and supernatant) or three (precipitate) determinations).
0
10
20
30
40
50
60
70
Van
illic
aci
d
p-H
ydro
xy
benz
alde
hyde
Van
illin
tran
s-p-
Cou
mar
ic a
cid
8,8'
-DiF
A (
AT
)
tran
s-F
erul
ic
acid
cis-
p-C
oum
aric
acid
8,8'
-DiF
A
(Unk
now
n F
)
8,5'
-DiF
A
cis-
Fer
ulic
aci
d
5,5'
-DiF
A
8-O
-4'-D
iFA
8,5'
-DiF
A
(ben
zofu
ran) 89
Phenolics
Ph
eno
lic c
on
ten
t (m
ol%
)
Res 1
Res 2
Res 3
Prec 2a
Prec 2b
Prec 3
Sup 2
Sup 3
Figure 71: Phenolics in residue, precipitate and supernatants of TFA Hydrolyses 2 and 3.
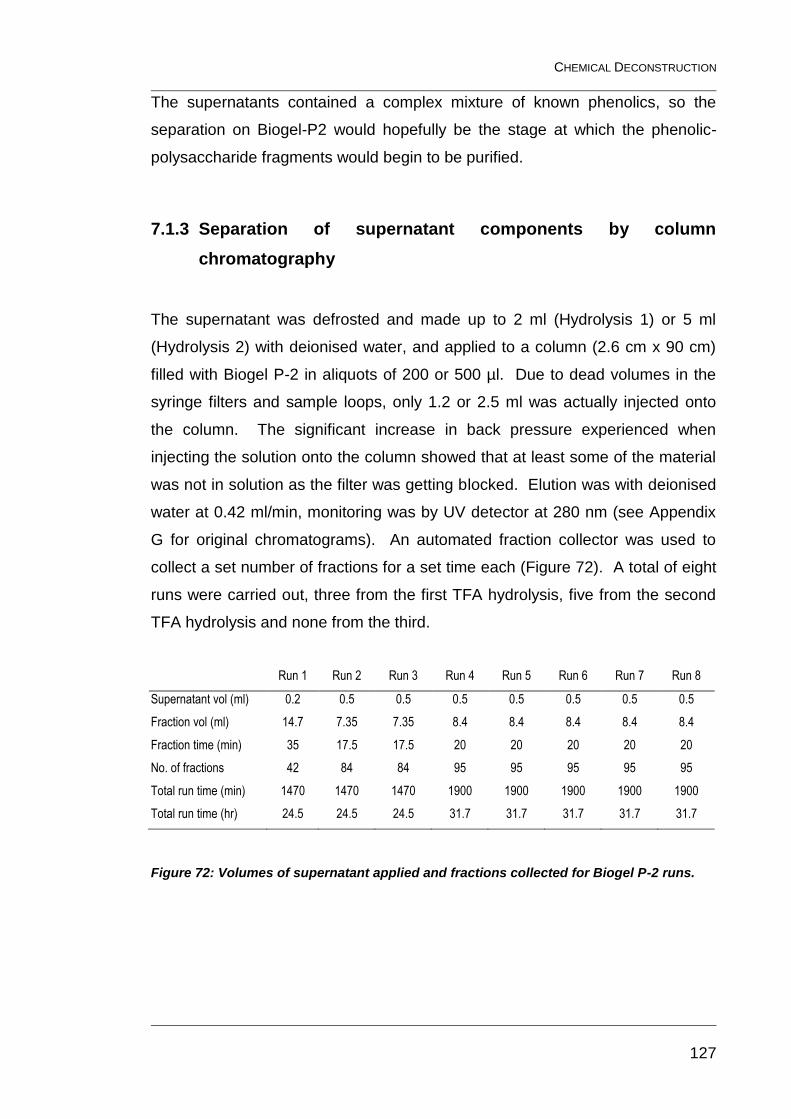
CHEMICAL DECONSTRUCTION
127
The supernatants contained a complex mixture of known phenolics, so the
separation on Biogel-P2 would hopefully be the stage at which the phenolic-
polysaccharide fragments would begin to be purified.
7.1.3 Separation of supernatant components by column
chromatography
The supernatant was defrosted and made up to 2 ml (Hydrolysis 1) or 5 ml
(Hydrolysis 2) with deionised water, and applied to a column (2.6 cm x 90 cm)
filled with Biogel P-2 in aliquots of 200 or 500 µl. Due to dead volumes in the
syringe filters and sample loops, only 1.2 or 2.5 ml was actually injected onto
the column. The significant increase in back pressure experienced when
injecting the solution onto the column showed that at least some of the material
was not in solution as the filter was getting blocked. Elution was with deionised
water at 0.42 ml/min, monitoring was by UV detector at 280 nm (see Appendix
G for original chromatograms). An automated fraction collector was used to
collect a set number of fractions for a set time each (Figure 72). A total of eight
runs were carried out, three from the first TFA hydrolysis, five from the second
TFA hydrolysis and none from the third.
Run 1 Run 2 Run 3 Run 4 Run 5 Run 6 Run 7 Run 8
Supernatant vol (ml) 0.2 0.5 0.5 0.5 0.5 0.5 0.5 0.5
Fraction vol (ml) 14.7 7.35 7.35 8.4 8.4 8.4 8.4 8.4
Fraction time (min) 35 17.5 17.5 20 20 20 20 20
No. of fractions 42 84 84 95 95 95 95 95
Total run time (min) 1470 1470 1470 1900 1900 1900 1900 1900
Total run time (hr) 24.5 24.5 24.5 31.7 31.7 31.7 31.7 31.7
Figure 72: Volumes of supernatant applied and fractions collected for Biogel P-2 runs.
CHEMICAL DECONSTRUCTION
128
7.2 Analysis of chromatography fractions to identify peaks and
guide fraction recombination
Individual fractions did not contain enough phenolic-polysaccharide for the
structural determination analyses, so the fractions were analysed to determine
which fractions should be combined with each other.
7.2.1 UV absorption at 214, 280, 320 and 350 nm
Absorbances were measured using quartz cuvettes and a spectrophotometer
fitted with a cell changer. Initially every fraction was analysed, in later runs only
the fractions collected during a peak, as indicated by the FPLC UV detector,
were analysed. After each set of samples the cuvettes were rinsed with distilled
water and 100% ethanol and left to dry.
7.2.2 Phenol-H2SO4 total sugars assay
This method was scaled down from the original put forward by Dubois et al
(1956) for use on a microplate scale. In acid-washed culture tubes, 80 µl of
sample/glucose standard was combined with 2 µl of 80% (w/v) phenol solution
and 200 µl of 96% (w/v) H2SO4. To ensure the reaction went to completion, the
samples were vortexed and heated at 100°C for 10 min, and then cooled in an
ice bath (Masuko et al., 2005). The absorbance of 200 µl of the resulting
solutions was measured at 490 nm using a Molecular Devices microplate
reader (Sunnyvale, California). This method is not quantitative when a mixture
of sugars is being analysed due to the variation in colour response between
different sugars.
CHEMICAL DECONSTRUCTION
129
7.2.3 Folin-Ciocalteu total phenolic assay
In 1.5 ml microtubes, 625 µl of sample/ferulic acid standard was combined with
625 µl of Folin-Ciocalteu reagent (diluted to 1.0 N acid from supplied 2.0 N acid
solution; Sigma-Aldrich, Dorset, UK). The samples were incubated at room
temperature for 3 min, 125 µl of saturated Na2CO3 solution was added, and
then the samples were incubated at room temperature for 1 hr. The microtubes
were centrifuged (Heraeus Biofuge Fresco; Thermo Scientific, Waltham.
Massachusetts) at 13000 rpm for 5 min to sediment any precipitate, and then
the absorbance of 200 µl of supernatant was measured at 750 nm, using a
microplate reader. This method measures the reducing capacity of a sample
and is therefore not specific for phenol groups; it is less suitable for complex
samples (Huang et al., 2005), particularly those containing protein, as the
procedure was developed from a protein assay (Singleton et al., 1998).
However, in these samples, it is unlikely that there are significant amounts of
interfering compounds.
7.2.4 Results for Run 1
Measurements of total sugars, total phenolics and absorbance at 280 nm were
compared for all fractions of Run 1 (Figure 73). Some of the sugar peaks were
not coincident with a phenolic peak, implying that the phenolics were only
attached to certain oligosaccharides.
Fractions (7-9, 21 and 23-26) were selected for 1 M H2SO4 sugars analysis; the
results showed that only arabinose, xylose and galactose were present (Figure
74). Fraction 9 appeared to contain no sugar whatsoever. Of the fractions that
did contain sugars, Fractions 7, 8 and 21 contained only xylose, Fraction 23
contained xylose and galactose, Fraction 26 contained arabinose and xylose
and Fractions 24 and 25 contained all three sugars.
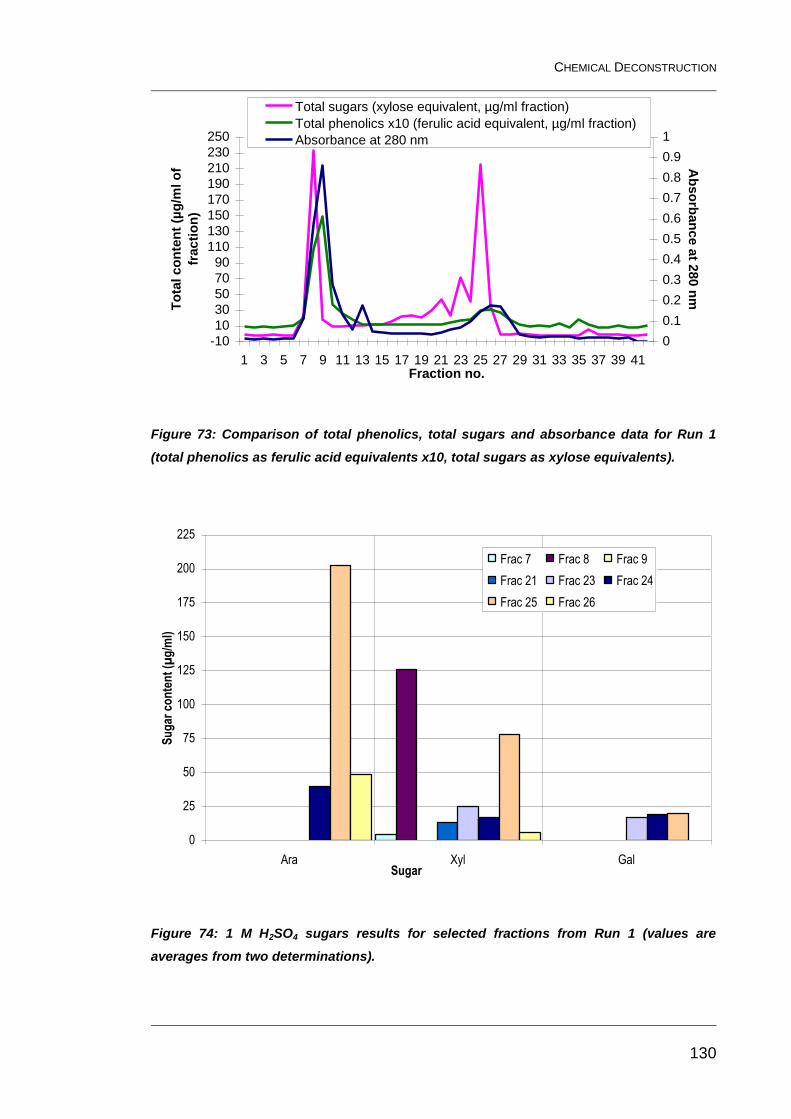
CHEMICAL DECONSTRUCTION
130
-10
10
30
50
70
90
110
130
150
170
190
210
230
250
1 3 5 7 9 11 13 15 17 19 21 23 25 27 29 31 33 35 37 39 41Fraction no.
To
tal co
nte
nt
(µg
/ml o
f
fracti
on
)
0
0.1
0.2
0.3
0.4
0.5
0.6
0.7
0.8
0.9
1
Ab
so
rban
ce a
t 280 n
mTotal sugars (xylose equivalent, µg/ml fraction)
Total phenolics x10 (ferulic acid equivalent, µg/ml fraction)
Absorbance at 280 nm
Figure 73: Comparison of total phenolics, total sugars and absorbance data for Run 1
(total phenolics as ferulic acid equivalents x10, total sugars as xylose equivalents).
0
25
50
75
100
125
150
175
200
225
Ara Xyl GalSugar
Su
gar
co
nte
nt
(µg
/ml)
Frac 7 Frac 8 Frac 9
Frac 21 Frac 23 Frac 24
Frac 25 Frac 26
Figure 74: 1 M H2SO4 sugars results for selected fractions from Run 1 (values are
averages from two determinations).
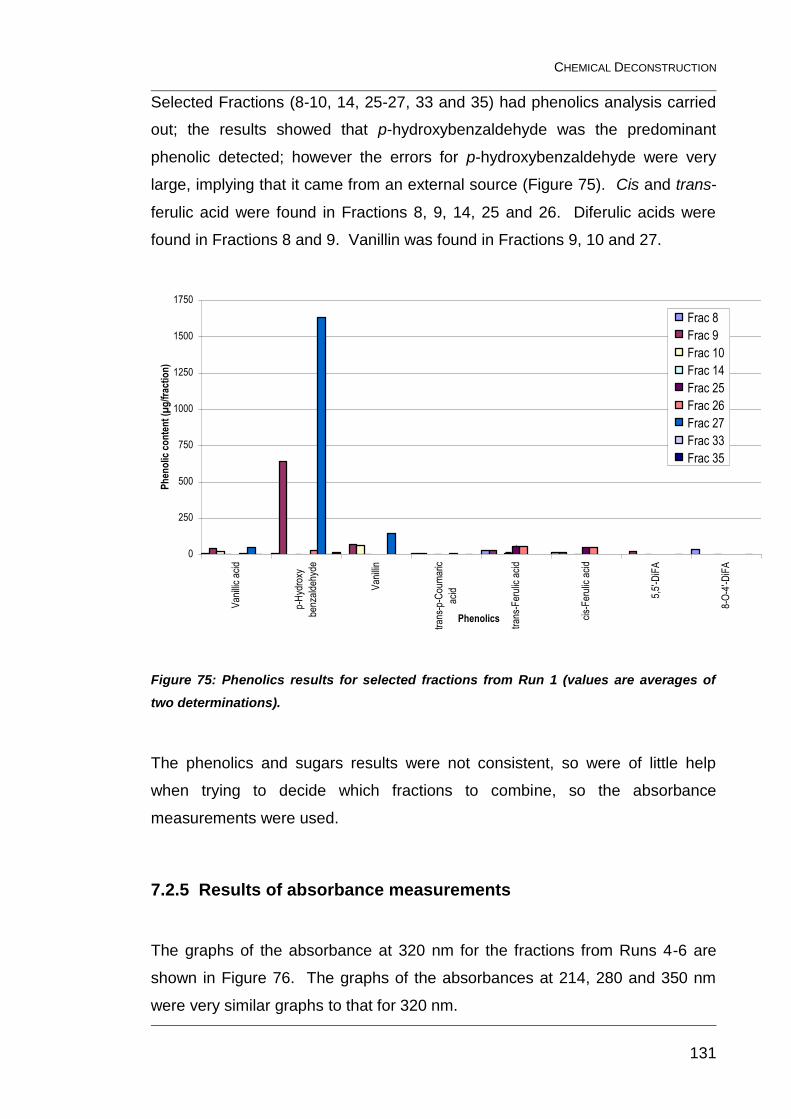
CHEMICAL DECONSTRUCTION
131
Selected Fractions (8-10, 14, 25-27, 33 and 35) had phenolics analysis carried
out; the results showed that p-hydroxybenzaldehyde was the predominant
phenolic detected; however the errors for p-hydroxybenzaldehyde were very
large, implying that it came from an external source (Figure 75). Cis and trans-
ferulic acid were found in Fractions 8, 9, 14, 25 and 26. Diferulic acids were
found in Fractions 8 and 9. Vanillin was found in Fractions 9, 10 and 27.
0
250
500
750
1000
1250
1500
1750
Van
illic
aci
d
p-H
ydro
xy
benz
alde
hyde
Van
illin
tran
s-p-
Cou
mar
ic
acid
tran
s-F
erul
ic a
cid
cis-
Fer
ulic
aci
d
5,5'
-DiF
A
8-O
-4'-D
iFA
Phenolics
Ph
eno
lic c
on
ten
t (µ
g/f
ract
ion
)
Frac 8
Frac 9
Frac 10
Frac 14
Frac 25
Frac 26
Frac 27
Frac 33
Frac 35
Figure 75: Phenolics results for selected fractions from Run 1 (values are averages of
two determinations).
The phenolics and sugars results were not consistent, so were of little help
when trying to decide which fractions to combine, so the absorbance
measurements were used.
7.2.5 Results of absorbance measurements
The graphs of the absorbance at 320 nm for the fractions from Runs 4-6 are
shown in Figure 76. The graphs of the absorbances at 214, 280 and 350 nm
were very similar graphs to that for 320 nm.
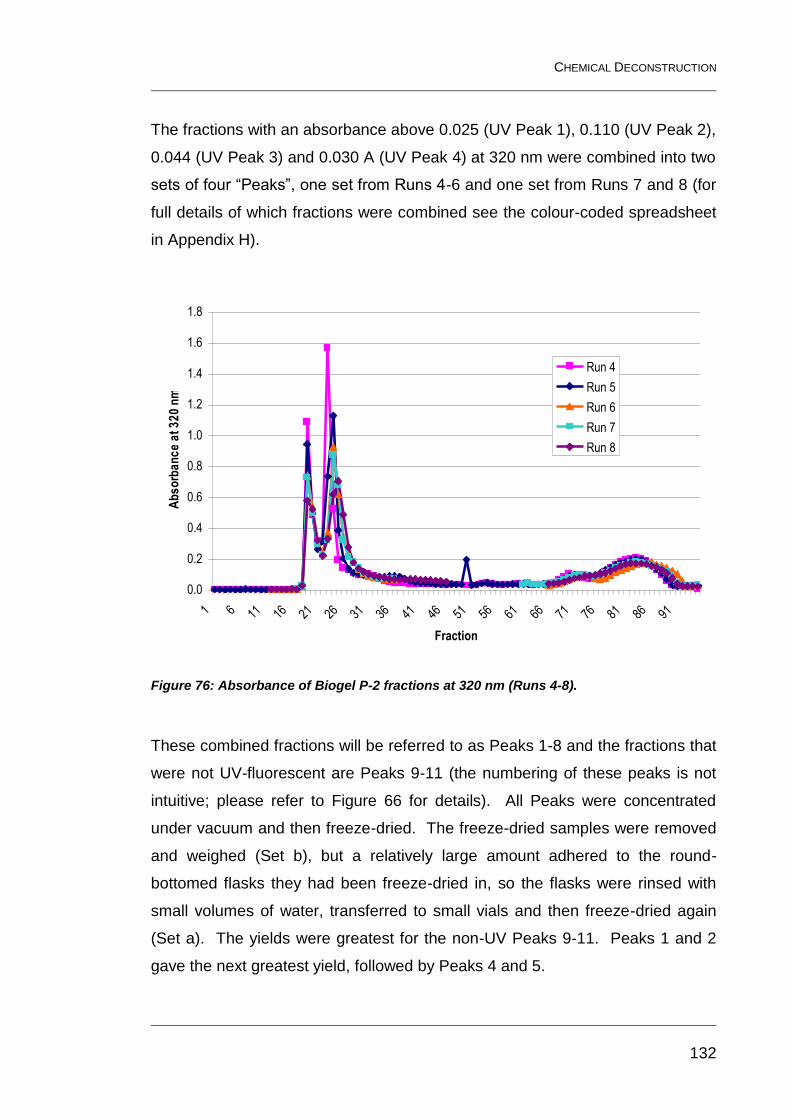
CHEMICAL DECONSTRUCTION
132
The fractions with an absorbance above 0.025 (UV Peak 1), 0.110 (UV Peak 2),
0.044 (UV Peak 3) and 0.030 A (UV Peak 4) at 320 nm were combined into two
sets of four “Peaks”, one set from Runs 4-6 and one set from Runs 7 and 8 (for
full details of which fractions were combined see the colour-coded spreadsheet
in Appendix H).
0.0
0.2
0.4
0.6
0.8
1.0
1.2
1.4
1.6
1.8
1 6 11 16 21 26 31 36 41 46 51 56 61 66 71 76 81 86 91
Fraction
Ab
so
rba
nc
e a
t 3
20
nm
Run 4
Run 5
Run 6
Run 7
Run 8
Figure 76: Absorbance of Biogel P-2 fractions at 320 nm (Runs 4-8).
These combined fractions will be referred to as Peaks 1-8 and the fractions that
were not UV-fluorescent are Peaks 9-11 (the numbering of these peaks is not
intuitive; please refer to Figure 66 for details). All Peaks were concentrated
under vacuum and then freeze-dried. The freeze-dried samples were removed
and weighed (Set b), but a relatively large amount adhered to the round-
bottomed flasks they had been freeze-dried in, so the flasks were rinsed with
small volumes of water, transferred to small vials and then freeze-dried again
(Set a). The yields were greatest for the non-UV Peaks 9-11. Peaks 1 and 2
gave the next greatest yield, followed by Peaks 4 and 5.
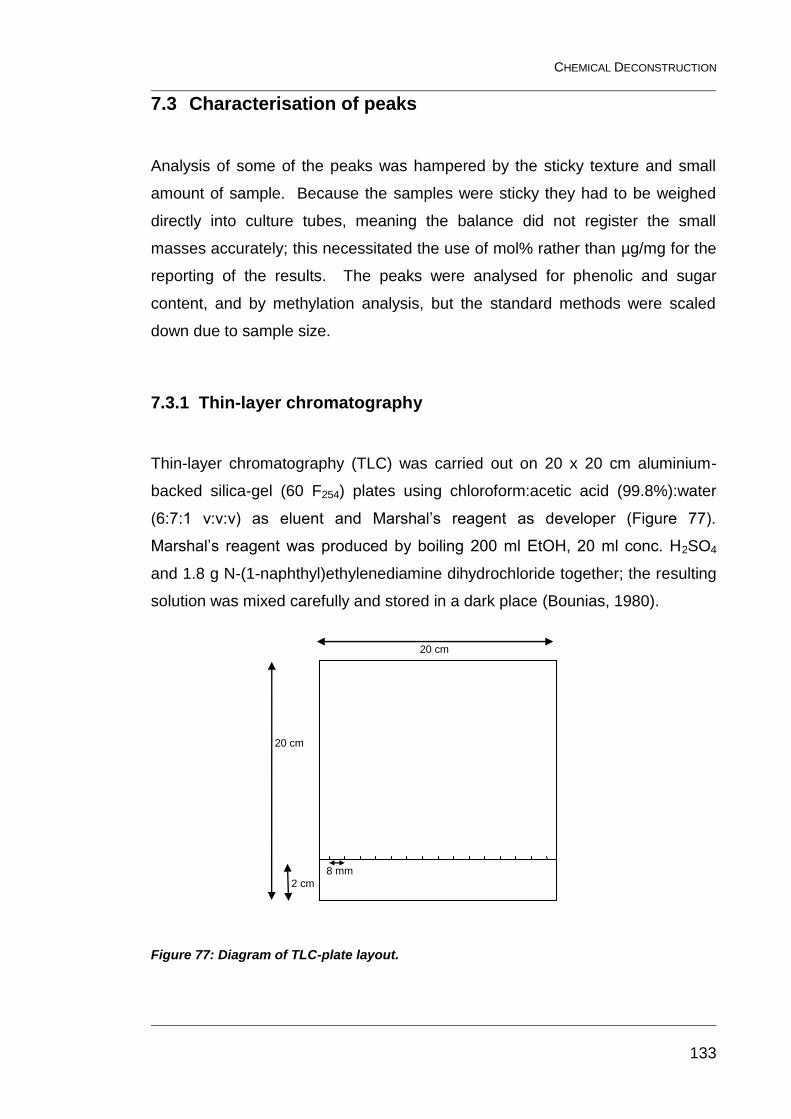
CHEMICAL DECONSTRUCTION
133
7.3 Characterisation of peaks
Analysis of some of the peaks was hampered by the sticky texture and small
amount of sample. Because the samples were sticky they had to be weighed
directly into culture tubes, meaning the balance did not register the small
masses accurately; this necessitated the use of mol% rather than µg/mg for the
reporting of the results. The peaks were analysed for phenolic and sugar
content, and by methylation analysis, but the standard methods were scaled
down due to sample size.
7.3.1 Thin-layer chromatography
Thin-layer chromatography (TLC) was carried out on 20 x 20 cm aluminium-
backed silica-gel (60 F254) plates using chloroform:acetic acid (99.8%):water
(6:7:1 v:v:v) as eluent and Marshal’s reagent as developer (Figure 77).
Marshal’s reagent was produced by boiling 200 ml EtOH, 20 ml conc. H2SO4
and 1.8 g N-(1-naphthyl)ethylenediamine dihydrochloride together; the resulting
solution was mixed carefully and stored in a dark place (Bounias, 1980).
Figure 77: Diagram of TLC-plate layout.
8 mm
20 cm
2 cm
20 cm
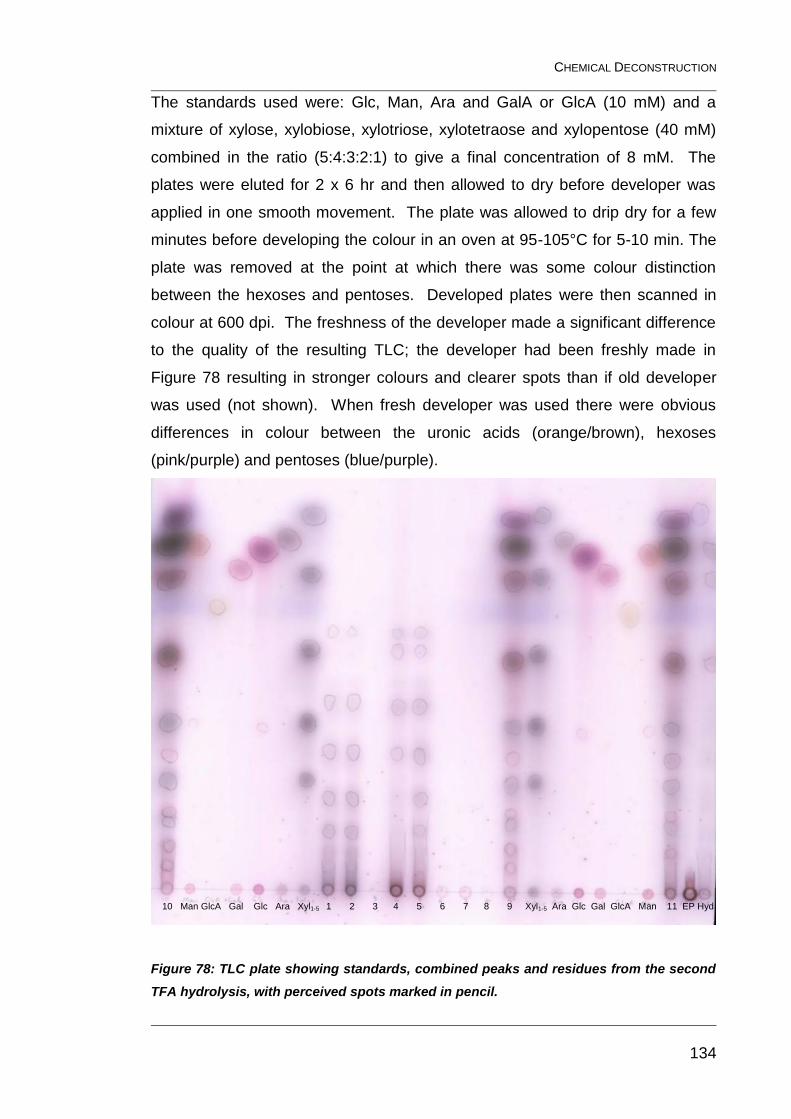
CHEMICAL DECONSTRUCTION
134
The standards used were: Glc, Man, Ara and GalA or GlcA (10 mM) and a
mixture of xylose, xylobiose, xylotriose, xylotetraose and xylopentose (40 mM)
combined in the ratio (5:4:3:2:1) to give a final concentration of 8 mM. The
plates were eluted for 2 x 6 hr and then allowed to dry before developer was
applied in one smooth movement. The plate was allowed to drip dry for a few
minutes before developing the colour in an oven at 95-105°C for 5-10 min. The
plate was removed at the point at which there was some colour distinction
between the hexoses and pentoses. Developed plates were then scanned in
colour at 600 dpi. The freshness of the developer made a significant difference
to the quality of the resulting TLC; the developer had been freshly made in
Figure 78 resulting in stronger colours and clearer spots than if old developer
was used (not shown). When fresh developer was used there were obvious
differences in colour between the uronic acids (orange/brown), hexoses
(pink/purple) and pentoses (blue/purple).
Figure 78: TLC plate showing standards, combined peaks and residues from the second
TFA hydrolysis, with perceived spots marked in pencil.
10 Man GlcA Gal Glc Ara Xyl1-5 1 2 3 4 5 6 7 8 9 Xyl1-5 Ara Glc Gal GlcA Man 11 EP Hyd
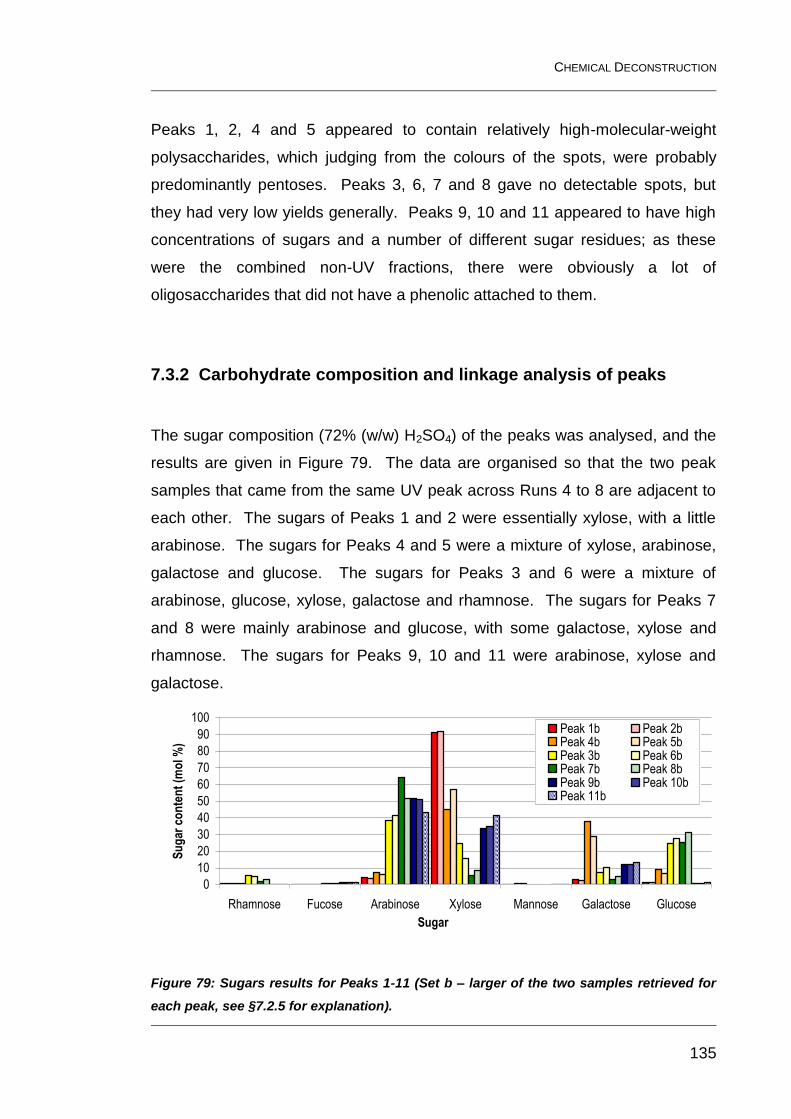
CHEMICAL DECONSTRUCTION
135
Peaks 1, 2, 4 and 5 appeared to contain relatively high-molecular-weight
polysaccharides, which judging from the colours of the spots, were probably
predominantly pentoses. Peaks 3, 6, 7 and 8 gave no detectable spots, but
they had very low yields generally. Peaks 9, 10 and 11 appeared to have high
concentrations of sugars and a number of different sugar residues; as these
were the combined non-UV fractions, there were obviously a lot of
oligosaccharides that did not have a phenolic attached to them.
7.3.2 Carbohydrate composition and linkage analysis of peaks
The sugar composition (72% (w/w) H2SO4) of the peaks was analysed, and the
results are given in Figure 79. The data are organised so that the two peak
samples that came from the same UV peak across Runs 4 to 8 are adjacent to
each other. The sugars of Peaks 1 and 2 were essentially xylose, with a little
arabinose. The sugars for Peaks 4 and 5 were a mixture of xylose, arabinose,
galactose and glucose. The sugars for Peaks 3 and 6 were a mixture of
arabinose, glucose, xylose, galactose and rhamnose. The sugars for Peaks 7
and 8 were mainly arabinose and glucose, with some galactose, xylose and
rhamnose. The sugars for Peaks 9, 10 and 11 were arabinose, xylose and
galactose.
0
10
20
30
40
50
60
70
80
90
100
Rhamnose Fucose Arabinose Xylose Mannose Galactose Glucose
Sugar
Su
gar
co
nte
nt
(mo
l %)
Peak 1b Peak 2bPeak 4b Peak 5bPeak 3b Peak 6bPeak 7b Peak 8bPeak 9b Peak 10bPeak 11b
Figure 79: Sugars results for Peaks 1-11 (Set b – larger of the two samples retrieved for
each peak, see §7.2.5 for explanation).
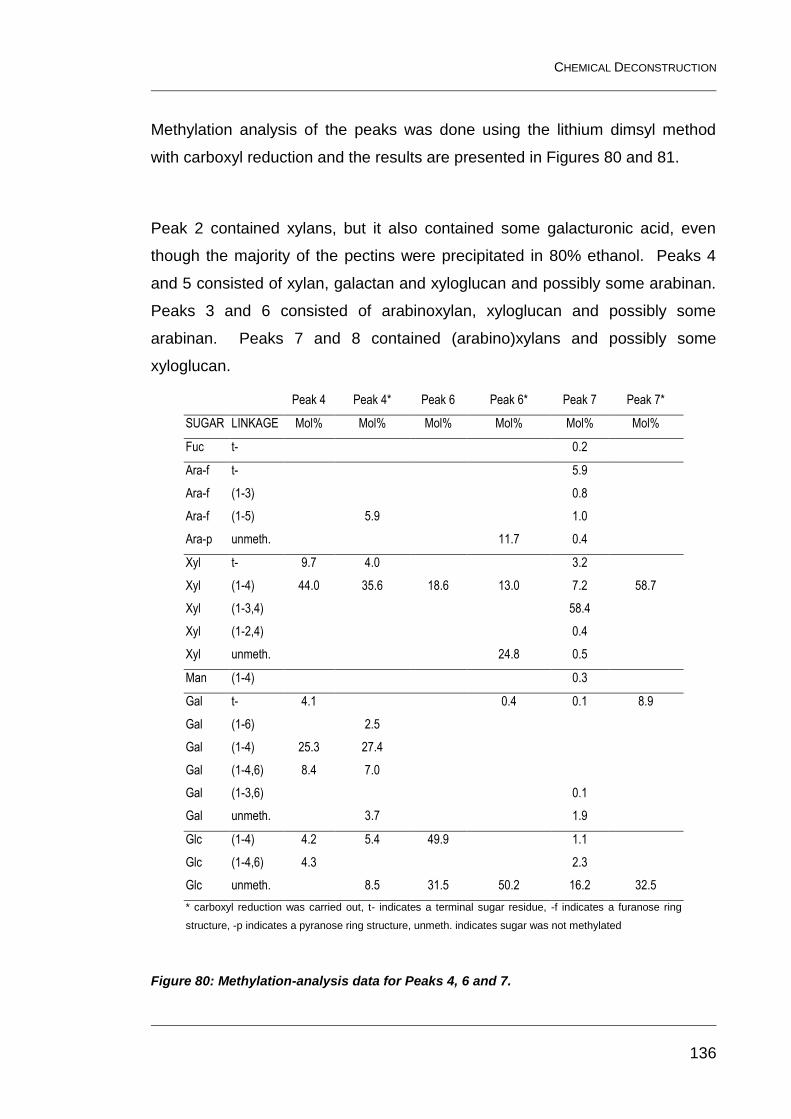
CHEMICAL DECONSTRUCTION
136
Methylation analysis of the peaks was done using the lithium dimsyl method
with carboxyl reduction and the results are presented in Figures 80 and 81.
Peak 2 contained xylans, but it also contained some galacturonic acid, even
though the majority of the pectins were precipitated in 80% ethanol. Peaks 4
and 5 consisted of xylan, galactan and xyloglucan and possibly some arabinan.
Peaks 3 and 6 consisted of arabinoxylan, xyloglucan and possibly some
arabinan. Peaks 7 and 8 contained (arabino)xylans and possibly some
xyloglucan.
Peak 4 Peak 4* Peak 6 Peak 6* Peak 7 Peak 7*
SUGAR LINKAGE Mol% Mol% Mol% Mol% Mol% Mol%
Fuc t- 0.2
Ara-f t- 5.9
Ara-f (1-3) 0.8
Ara-f (1-5) 5.9 1.0
Ara-p unmeth. 11.7 0.4
Xyl t- 9.7 4.0 3.2
Xyl (1-4) 44.0 35.6 18.6 13.0 7.2 58.7
Xyl (1-3,4) 58.4
Xyl (1-2,4) 0.4
Xyl unmeth. 24.8 0.5
Man (1-4) 0.3
Gal t- 4.1 0.4 0.1 8.9
Gal (1-6) 2.5
Gal (1-4) 25.3 27.4
Gal (1-4,6) 8.4 7.0
Gal (1-3,6) 0.1
Gal unmeth. 3.7 1.9
Glc (1-4) 4.2 5.4 49.9 1.1
Glc (1-4,6) 4.3 2.3
Glc unmeth. 8.5 31.5 50.2 16.2 32.5
* carboxyl reduction was carried out, t- indicates a terminal sugar residue, -f indicates a furanose ring
structure, -p indicates a pyranose ring structure, unmeth. indicates sugar was not methylated
Figure 80: Methylation-analysis data for Peaks 4, 6 and 7.
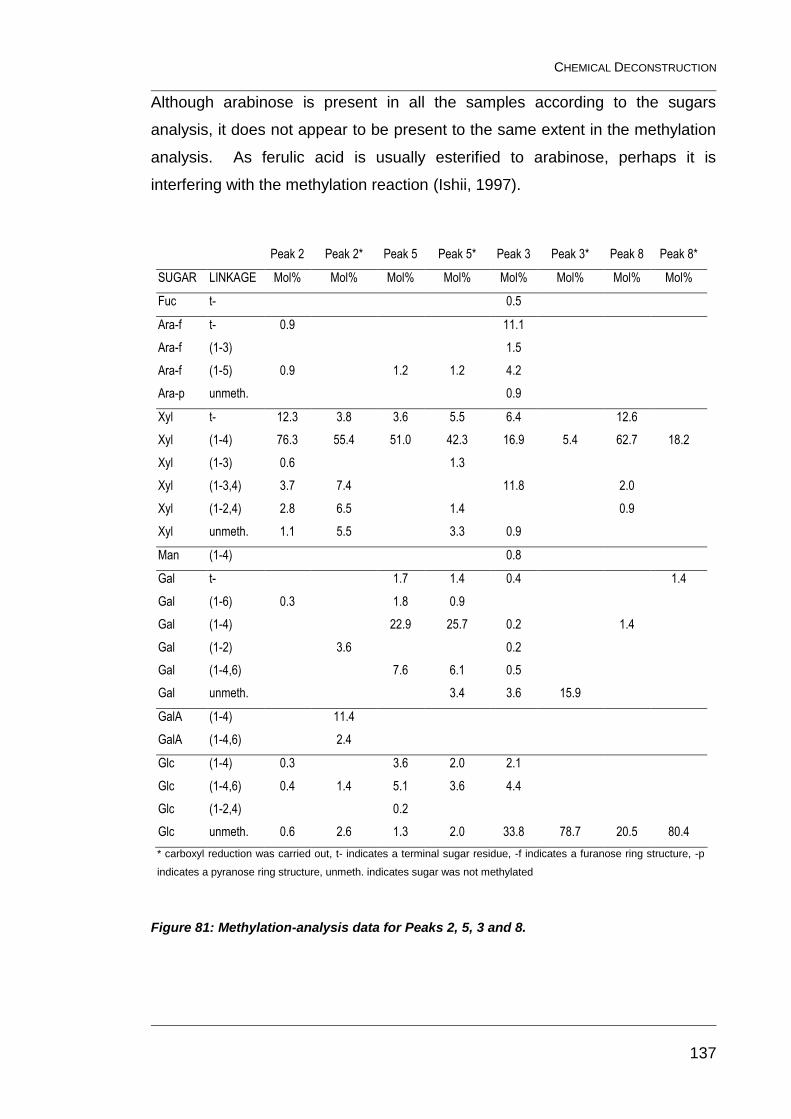
CHEMICAL DECONSTRUCTION
137
Although arabinose is present in all the samples according to the sugars
analysis, it does not appear to be present to the same extent in the methylation
analysis. As ferulic acid is usually esterified to arabinose, perhaps it is
interfering with the methylation reaction (Ishii, 1997).
Peak 2 Peak 2* Peak 5 Peak 5* Peak 3 Peak 3* Peak 8 Peak 8*
SUGAR LINKAGE Mol% Mol% Mol% Mol% Mol% Mol% Mol% Mol%
Fuc t- 0.5
Ara-f t- 0.9 11.1
Ara-f (1-3) 1.5
Ara-f (1-5) 0.9 1.2 1.2 4.2
Ara-p unmeth. 0.9
Xyl t- 12.3 3.8 3.6 5.5 6.4 12.6
Xyl (1-4) 76.3 55.4 51.0 42.3 16.9 5.4 62.7 18.2
Xyl (1-3) 0.6 1.3
Xyl (1-3,4) 3.7 7.4 11.8 2.0
Xyl (1-2,4) 2.8 6.5 1.4 0.9
Xyl unmeth. 1.1 5.5 3.3 0.9
Man (1-4) 0.8
Gal t- 1.7 1.4 0.4 1.4
Gal (1-6) 0.3 1.8 0.9
Gal (1-4) 22.9 25.7 0.2 1.4
Gal (1-2) 3.6 0.2
Gal (1-4,6) 7.6 6.1 0.5
Gal unmeth. 3.4 3.6 15.9
GalA (1-4) 11.4
GalA (1-4,6) 2.4
Glc (1-4) 0.3 3.6 2.0 2.1
Glc (1-4,6) 0.4 1.4 5.1 3.6 4.4
Glc (1-2,4) 0.2
Glc unmeth. 0.6 2.6 1.3 2.0 33.8 78.7 20.5 80.4
* carboxyl reduction was carried out, t- indicates a terminal sugar residue, -f indicates a furanose ring structure, -p
indicates a pyranose ring structure, unmeth. indicates sugar was not methylated
Figure 81: Methylation-analysis data for Peaks 2, 5, 3 and 8.
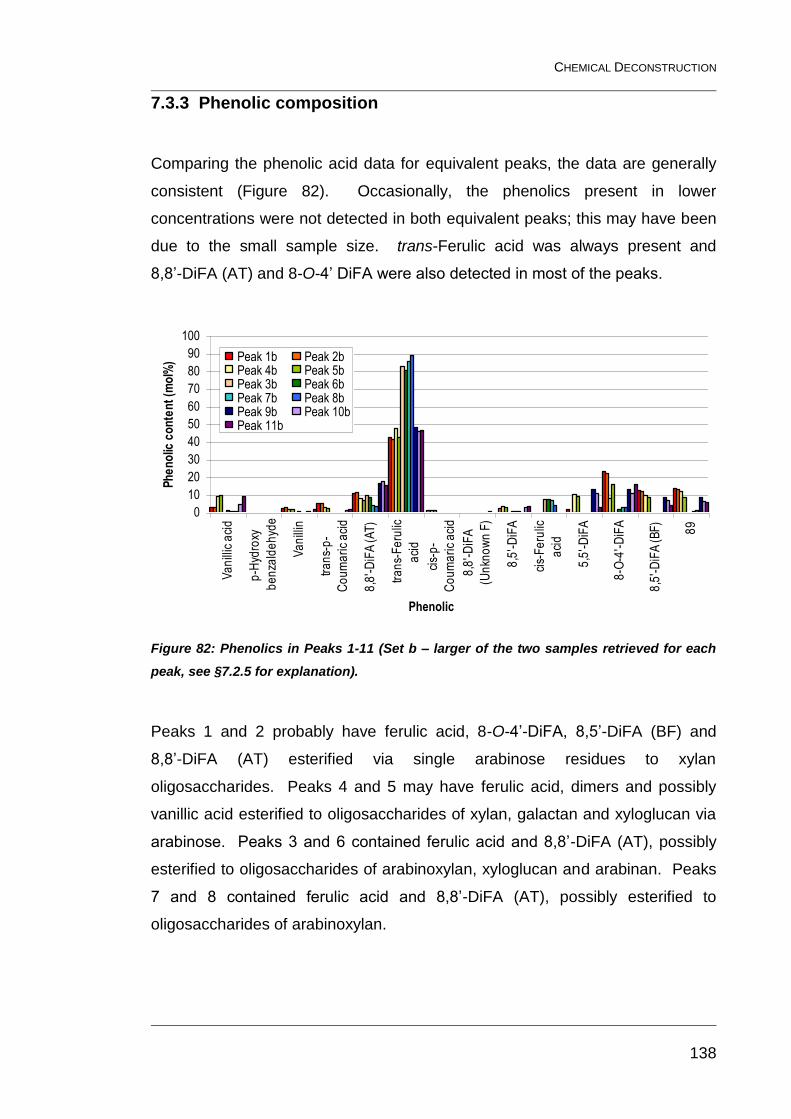
CHEMICAL DECONSTRUCTION
138
7.3.3 Phenolic composition
Comparing the phenolic acid data for equivalent peaks, the data are generally
consistent (Figure 82). Occasionally, the phenolics present in lower
concentrations were not detected in both equivalent peaks; this may have been
due to the small sample size. trans-Ferulic acid was always present and
8,8’-DiFA (AT) and 8-O-4’ DiFA were also detected in most of the peaks.
0
10
20
30
40
50
60
70
80
90
100
Va
nill
ic a
cid
p-H
ydro
xy
be
nza
lde
hyd
e
Va
nill
in
tra
ns-
p-
Co
um
ari
c a
cid
8,8
'-D
iFA
(A
T)
tra
ns-
Fe
rulic
aci
d
cis-
p-
Co
um
ari
c a
cid
8,8
'-D
iFA
(Un
kno
wn
F)
8,5
'-D
iFA
cis-
Fe
rulic
aci
d
5,5
'-D
iFA
8-O
-4'-
DiF
A
8,5
'-D
iFA
(B
F)
89
Phenolic
Ph
en
olic
co
nte
nt
(mo
l%) Peak 1b Peak 2b
Peak 4b Peak 5bPeak 3b Peak 6bPeak 7b Peak 8bPeak 9b Peak 10bPeak 11b
Figure 82: Phenolics in Peaks 1-11 (Set b – larger of the two samples retrieved for each
peak, see §7.2.5 for explanation).
Peaks 1 and 2 probably have ferulic acid, 8-O-4’-DiFA, 8,5’-DiFA (BF) and
8,8’-DiFA (AT) esterified via single arabinose residues to xylan
oligosaccharides. Peaks 4 and 5 may have ferulic acid, dimers and possibly
vanillic acid esterified to oligosaccharides of xylan, galactan and xyloglucan via
arabinose. Peaks 3 and 6 contained ferulic acid and 8,8’-DiFA (AT), possibly
esterified to oligosaccharides of arabinoxylan, xyloglucan and arabinan. Peaks
7 and 8 contained ferulic acid and 8,8’-DiFA (AT), possibly esterified to
oligosaccharides of arabinoxylan.
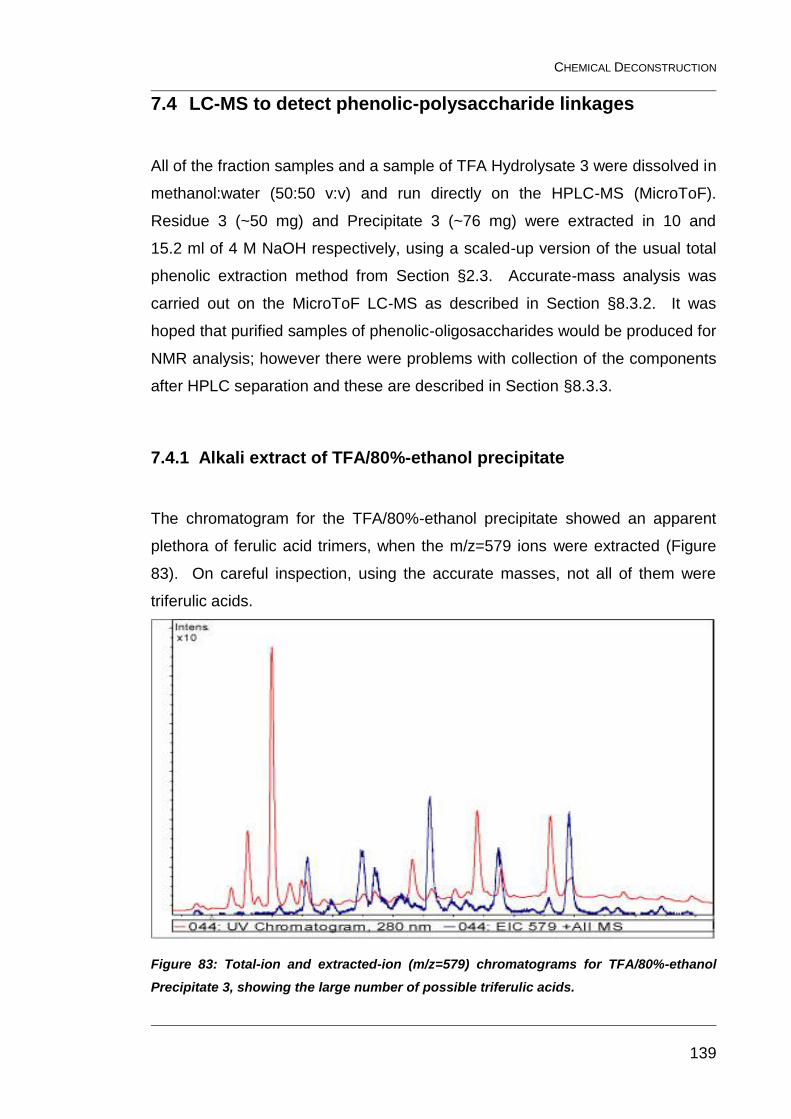
CHEMICAL DECONSTRUCTION
139
7.4 LC-MS to detect phenolic-polysaccharide linkages
All of the fraction samples and a sample of TFA Hydrolysate 3 were dissolved in
methanol:water (50:50 v:v) and run directly on the HPLC-MS (MicroToF).
Residue 3 (~50 mg) and Precipitate 3 (~76 mg) were extracted in 10 and
15.2 ml of 4 M NaOH respectively, using a scaled-up version of the usual total
phenolic extraction method from Section §2.3. Accurate-mass analysis was
carried out on the MicroToF LC-MS as described in Section §8.3.2. It was
hoped that purified samples of phenolic-oligosaccharides would be produced for
NMR analysis; however there were problems with collection of the components
after HPLC separation and these are described in Section §8.3.3.
7.4.1 Alkali extract of TFA/80%-ethanol precipitate
The chromatogram for the TFA/80%-ethanol precipitate showed an apparent
plethora of ferulic acid trimers, when the m/z=579 ions were extracted (Figure
83). On careful inspection, using the accurate masses, not all of them were
triferulic acids.
Figure 83: Total-ion and extracted-ion (m/z=579) chromatograms for TFA/80%-ethanol
Precipitate 3, showing the large number of possible triferulic acids.
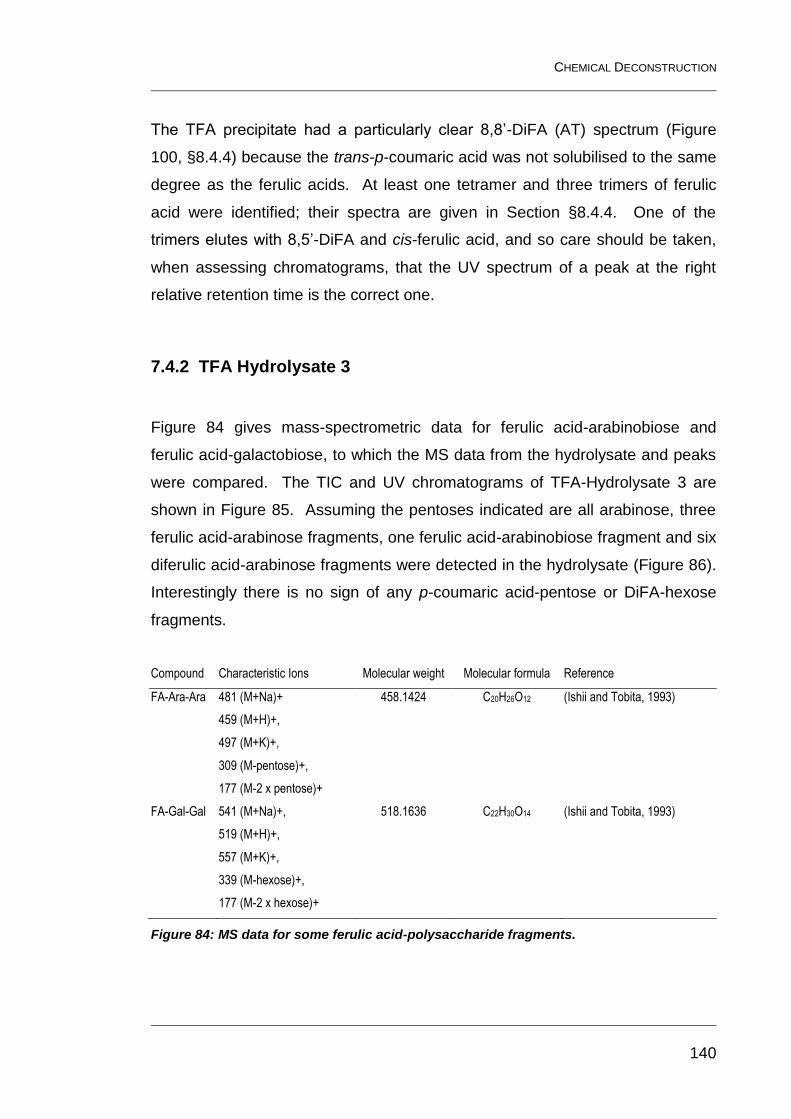
CHEMICAL DECONSTRUCTION
140
The TFA precipitate had a particularly clear 8,8’-DiFA (AT) spectrum (Figure
100, §8.4.4) because the trans-p-coumaric acid was not solubilised to the same
degree as the ferulic acids. At least one tetramer and three trimers of ferulic
acid were identified; their spectra are given in Section §8.4.4. One of the
trimers elutes with 8,5’-DiFA and cis-ferulic acid, and so care should be taken,
when assessing chromatograms, that the UV spectrum of a peak at the right
relative retention time is the correct one.
7.4.2 TFA Hydrolysate 3
Figure 84 gives mass-spectrometric data for ferulic acid-arabinobiose and
ferulic acid-galactobiose, to which the MS data from the hydrolysate and peaks
were compared. The TIC and UV chromatograms of TFA-Hydrolysate 3 are
shown in Figure 85. Assuming the pentoses indicated are all arabinose, three
ferulic acid-arabinose fragments, one ferulic acid-arabinobiose fragment and six
diferulic acid-arabinose fragments were detected in the hydrolysate (Figure 86).
Interestingly there is no sign of any p-coumaric acid-pentose or DiFA-hexose
fragments.
Compound Characteristic Ions Molecular weight Molecular formula Reference
FA-Ara-Ara 481 (M+Na)+
459 (M+H)+,
497 (M+K)+,
309 (M-pentose)+,
177 (M-2 x pentose)+
458.1424 C20H26O12 (Ishii and Tobita, 1993)
FA-Gal-Gal 541 (M+Na)+,
519 (M+H)+,
557 (M+K)+,
339 (M-hexose)+,
177 (M-2 x hexose)+
518.1636 C22H30O14 (Ishii and Tobita, 1993)
Figure 84: MS data for some ferulic acid-polysaccharide fragments.
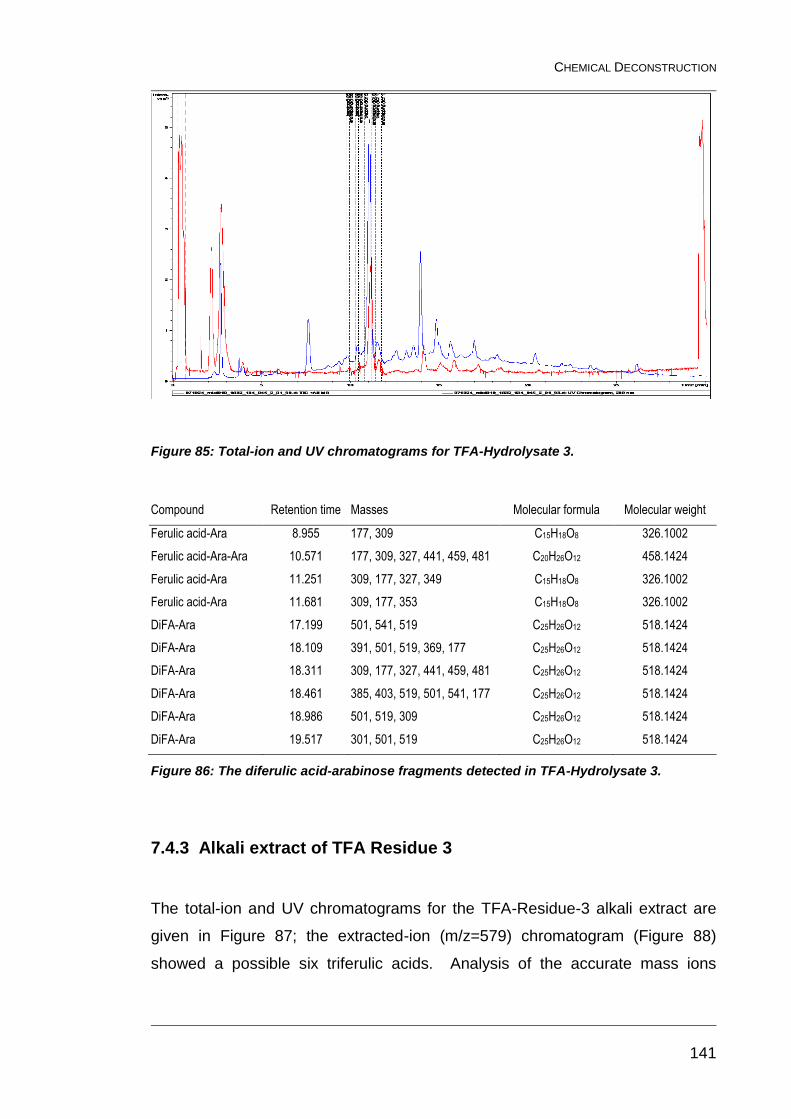
CHEMICAL DECONSTRUCTION
141
Figure 85: Total-ion and UV chromatograms for TFA-Hydrolysate 3.
Compound Retention time Masses Molecular formula Molecular weight
Ferulic acid-Ara 8.955 177, 309 C15H18O8 326.1002
Ferulic acid-Ara-Ara 10.571 177, 309, 327, 441, 459, 481 C20H26O12 458.1424
Ferulic acid-Ara 11.251 309, 177, 327, 349 C15H18O8 326.1002
Ferulic acid-Ara 11.681 309, 177, 353 C15H18O8 326.1002
DiFA-Ara 17.199 501, 541, 519 C25H26O12 518.1424
DiFA-Ara 18.109 391, 501, 519, 369, 177 C25H26O12 518.1424
DiFA-Ara 18.311 309, 177, 327, 441, 459, 481 C25H26O12 518.1424
DiFA-Ara 18.461 385, 403, 519, 501, 541, 177 C25H26O12 518.1424
DiFA-Ara 18.986 501, 519, 309 C25H26O12 518.1424
DiFA-Ara 19.517 301, 501, 519 C25H26O12 518.1424
Figure 86: The diferulic acid-arabinose fragments detected in TFA-Hydrolysate 3.
7.4.3 Alkali extract of TFA Residue 3
The total-ion and UV chromatograms for the TFA-Residue-3 alkali extract are
given in Figure 87; the extracted-ion (m/z=579) chromatogram (Figure 88)
showed a possible six triferulic acids. Analysis of the accurate mass ions
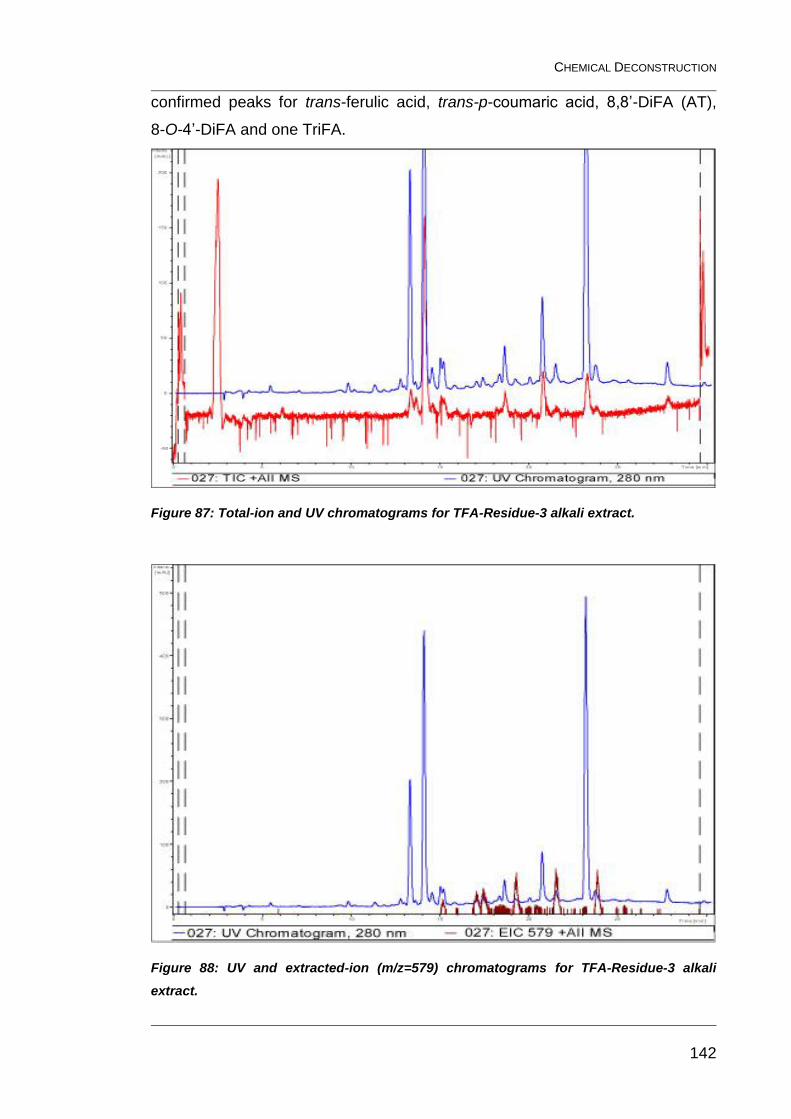
CHEMICAL DECONSTRUCTION
142
confirmed peaks for trans-ferulic acid, trans-p-coumaric acid, 8,8’-DiFA (AT),
8-O-4’-DiFA and one TriFA.
Figure 87: Total-ion and UV chromatograms for TFA-Residue-3 alkali extract.
Figure 88: UV and extracted-ion (m/z=579) chromatograms for TFA-Residue-3 alkali
extract.
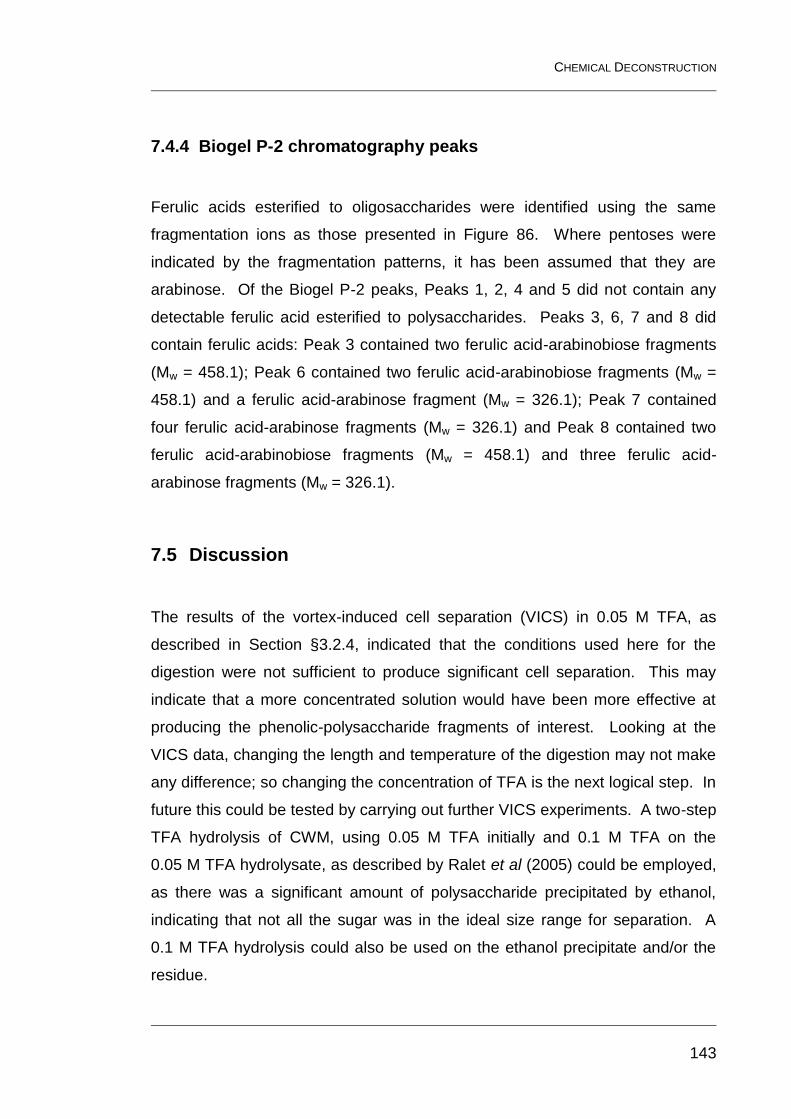
CHEMICAL DECONSTRUCTION
143
7.4.4 Biogel P-2 chromatography peaks
Ferulic acids esterified to oligosaccharides were identified using the same
fragmentation ions as those presented in Figure 86. Where pentoses were
indicated by the fragmentation patterns, it has been assumed that they are
arabinose. Of the Biogel P-2 peaks, Peaks 1, 2, 4 and 5 did not contain any
detectable ferulic acid esterified to polysaccharides. Peaks 3, 6, 7 and 8 did
contain ferulic acids: Peak 3 contained two ferulic acid-arabinobiose fragments
(Mw = 458.1); Peak 6 contained two ferulic acid-arabinobiose fragments (Mw =
458.1) and a ferulic acid-arabinose fragment (Mw = 326.1); Peak 7 contained
four ferulic acid-arabinose fragments (Mw = 326.1) and Peak 8 contained two
ferulic acid-arabinobiose fragments (Mw = 458.1) and three ferulic acid-
arabinose fragments (Mw = 326.1).
7.5 Discussion
The results of the vortex-induced cell separation (VICS) in 0.05 M TFA, as
described in Section §3.2.4, indicated that the conditions used here for the
digestion were not sufficient to produce significant cell separation. This may
indicate that a more concentrated solution would have been more effective at
producing the phenolic-polysaccharide fragments of interest. Looking at the
VICS data, changing the length and temperature of the digestion may not make
any difference; so changing the concentration of TFA is the next logical step. In
future this could be tested by carrying out further VICS experiments. A two-step
TFA hydrolysis of CWM, using 0.05 M TFA initially and 0.1 M TFA on the
0.05 M TFA hydrolysate, as described by Ralet et al (2005) could be employed,
as there was a significant amount of polysaccharide precipitated by ethanol,
indicating that not all the sugar was in the ideal size range for separation. A
0.1 M TFA hydrolysis could also be used on the ethanol precipitate and/or the
residue.
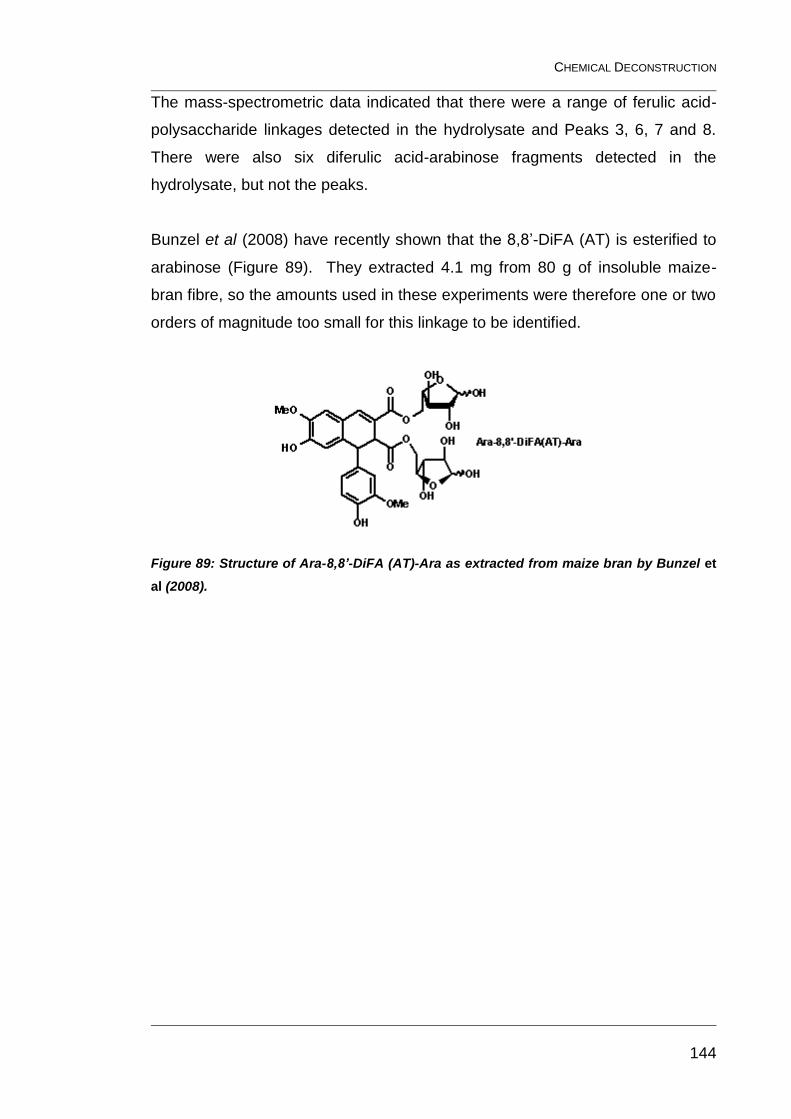
CHEMICAL DECONSTRUCTION
144
The mass-spectrometric data indicated that there were a range of ferulic acid-
polysaccharide linkages detected in the hydrolysate and Peaks 3, 6, 7 and 8.
There were also six diferulic acid-arabinose fragments detected in the
hydrolysate, but not the peaks.
Bunzel et al (2008) have recently shown that the 8,8’-DiFA (AT) is esterified to
arabinose (Figure 89). They extracted 4.1 mg from 80 g of insoluble maize-
bran fibre, so the amounts used in these experiments were therefore one or two
orders of magnitude too small for this linkage to be identified.
Figure 89: Structure of Ara-8,8’-DiFA (AT)-Ara as extracted from maize bran by Bunzel et
al (2008).
MS AND NMR
145
8 MS and NMR of Selected Components of Chinese Water Chestnut Cell Walls:
The aim of the work in this chapter was to get the structural information via
accurate mass spectrometry and NMR to determine the phenolic-
polysaccharide linkages present in CWC cell walls and also to find and identify
any higher oligomers of ferulic acid that may be present. In particular, the
8,8’-DiFA (AT) esterified to polysaccharide was sought in order to prove that
CWC contained this linkage, lending support to the hypothesis that it plays a
key part in the thermal stability of CWC mechanical properties (Parker et al.,
2003). Finding higher oligomers of ferulic acid in CWC would show that they
are not restricted to maize or even the Poaceae. Assuming trimers were found
by MS, it was hoped that their molecular structures could be elucidated by
NMR.
8.1 Solid-phase-extraction theory
Solid-phase extraction of peaks resulting from liquid chromatography of a
complex mixture is a relatively new technique that has allowed Exarchou et al to
analyse in detail the secondary metabolites of oregano (Exarchou et al., 2003).
The main advantages of this method are:
The elution solvent can be different from the NMR solvent as the elution
solvent is evaporated off before addition of the NMR solvent, reducing the
volume of deuterated solvents required and allowing the most suitable solvents
to be used for both stages.
Samples are concentrated as the volume of solvent required to elute the
sample from the cartridge is often less than was used to apply it; the
concentration can be further increased by using the same cartridges on multiple
runs of the same sample, giving a substantial increase in sensitivity.
Although this is a new technique there has been a rapid take-up of the
technology for studying crude alcohol extracts from plants (Christophoridou et
MS AND NMR
146
al., 2007; Exarchou et al., 2003; Wang et al., 2003). This appears to be the first
study that has focused on cell-wall components.
8.2 Nuclear magnetic resonance (NMR) theory
Nuclear Magnetic Resonance (NMR) uses the magnetic properties of particular
nuclei to give structural information about the molecule in question. Some
nuclei have a nuclear spin (I) and the presence of a spin makes these nuclei
behave like tiny bar magnets. Nuclei with an odd mass number have nuclear
spins that are multiples of ½. In an applied magnetic field the nuclear magnets
can align themselves in 2I + 1 ways. Both 1H and 13C have spins of ½; they can
therefore only have two alignments, one aligned with the applied field (low
energy) and one opposed to it (high energy). When a radio-frequency signal is
applied to the system at the natural frequency at which they turn in the magnetic
field, some of the nuclei are promoted from the low-energy state to the high-
energy state. The frequencies are dependent on the size of the magnetic field,
so for greater resolution powerful superconducting magnets cooled with liquid
helium are used, allowing the higher operational frequencies (200-750 MHz)
found in modern machines. Fourier-transform (FT)-style data acquisition gives
a good signal to noise ratio from one pulse and is therefore quicker than the
traditional continuous-wave (CW) method. Using the FT method allows the
results from multiple pulses to be added together, further improving the signal to
noise ratio; this is particularly useful for 13C experiments. It is necessary to use
solvents that do not contain 1H; D2O, CCl4, and CDCl3 are commonly used, and
the choice is generally determined by the solubility of the target compound.
There are three main pieces of data for each NMR peak:
The area under the peak (integration) gives an indication of how many atoms
are in that particular environment; this is particularly useful for proton spectra.
The chemical shift (δ) is a field-independent measure of this phenomenon
defined by the difference between the peak frequency and the frequency of the
internal standard, TMS (tetramethylsilane), in Hz, divided by the operating
frequency in MHz. It is expressed as fractions of the applied field in parts per
MS AND NMR
147
million (ppm). Chemical shift is plotted from right to left with the maximum
values being 10 (for 1H) and 200 (for 13C). Minute differences in the magnetic
environment of each nucleus, due to variations in electron density, slightly affect
the frequency at which the nucleus comes into resonance, so each chemically
distinct atom will give a separate peak in the spectrum. Nuclei in a high-
electron-density region experience a field that is slightly weaker than those in a
low-electron-density region, so bonding to an electronegative atom would shift
the peak to the left, as it would withdraw electrons. The presence of π bonds
and benzene rings can also significantly affect the chemical shift. A proton has
two possible spin states, so a 13C atom bonded to a proton will experience two
slightly different magnetic fields. There is a very small energy difference
between these two states, so they are essentially equally likely; this gives rise to
a doublet peak as the two states have slightly different resonance frequencies.
The separation between the two peaks is called the coupling constant, J; when
there is only one bond between the carbon and hydrogen, it is properly labelled
as 1JCH. If there were two protons, they would both split the peak twice, giving
four peaks, but as the coupling constant is the same, two of the peaks overlap
to give the central peak, which has double the intensity of the other two. Three
protons would give four peaks with the intensity ratio 1:3:3:1. Similarly, four
protons would give five peaks with the intensity ratio 1:4:6:4:1. Proton-
decoupled 13C spectra have this effect cancelled by irradiating the sample with
a strong signal covering the frequencies normally used for measuring proton
spectra. The coupling constant can provide useful structural information in
proton spectra, as the size of the coupling constant can give an indication of
how the protons are linked to each other.
8.3 Methods
8.3.1 Scale-up of phenolic extraction of CWM
To get a good result from the NMR experiments approximately 1 mg of the pure
compound is required. From previous experiments it was clear that a large
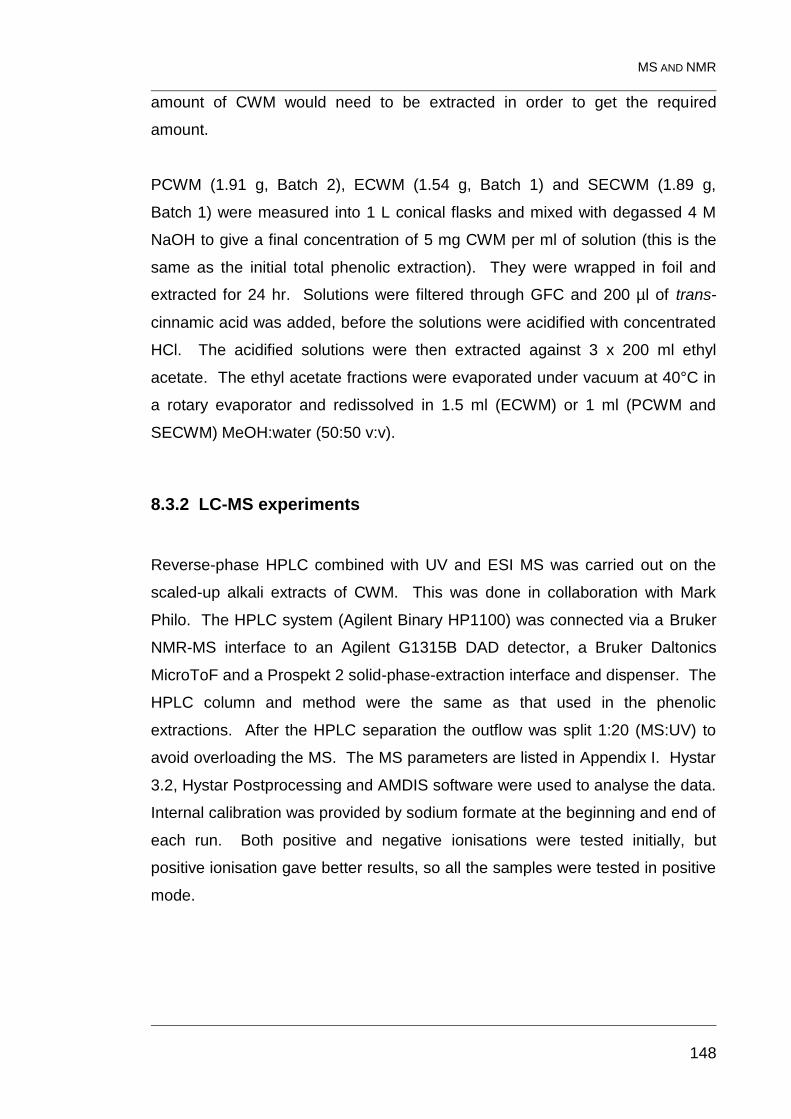
MS AND NMR
148
amount of CWM would need to be extracted in order to get the required
amount.
PCWM (1.91 g, Batch 2), ECWM (1.54 g, Batch 1) and SECWM (1.89 g,
Batch 1) were measured into 1 L conical flasks and mixed with degassed 4 M
NaOH to give a final concentration of 5 mg CWM per ml of solution (this is the
same as the initial total phenolic extraction). They were wrapped in foil and
extracted for 24 hr. Solutions were filtered through GFC and 200 µl of trans-
cinnamic acid was added, before the solutions were acidified with concentrated
HCl. The acidified solutions were then extracted against 3 x 200 ml ethyl
acetate. The ethyl acetate fractions were evaporated under vacuum at 40°C in
a rotary evaporator and redissolved in 1.5 ml (ECWM) or 1 ml (PCWM and
SECWM) MeOH:water (50:50 v:v).
8.3.2 LC-MS experiments
Reverse-phase HPLC combined with UV and ESI MS was carried out on the
scaled-up alkali extracts of CWM. This was done in collaboration with Mark
Philo. The HPLC system (Agilent Binary HP1100) was connected via a Bruker
NMR-MS interface to an Agilent G1315B DAD detector, a Bruker Daltonics
MicroToF and a Prospekt 2 solid-phase-extraction interface and dispenser. The
HPLC column and method were the same as that used in the phenolic
extractions. After the HPLC separation the outflow was split 1:20 (MS:UV) to
avoid overloading the MS. The MS parameters are listed in Appendix I. Hystar
3.2, Hystar Postprocessing and AMDIS software were used to analyse the data.
Internal calibration was provided by sodium formate at the beginning and end of
each run. Both positive and negative ionisations were tested initially, but
positive ionisation gave better results, so all the samples were tested in positive
mode.
MS AND NMR
149
8.3.3 NMR experiments
Peaks of interest were identified from the MS and UV data of the samples. The
samples containing interesting peaks were run again and the real-time UV and
total-ion chromatograms were used to select peaks for collection manually
(Figure 90). The peaks were collected on Hysphere GP 10-12 µm cartridges.
The Hysphere GP cartridges were chosen for this experiment as they contain a
good generic sorbent, which also has good elution efficiency (Bert Ooms et al.,
2000). After the cartridges were dried with dry N2, they were eluted using
140 µl of deuterated acetonitrile (99.8%d, Cambridge Isotope Laboratories),
transferred to 1.5 ml microtubes and frozen in a dry nitrogen atmosphere at
–20°C to reduce contamination with protons until the NMR was available.
Figure 90: Example chromatogram showing manual peak collection of three peaks (1C12,
1D1, 1D2) and one blank (1D3).
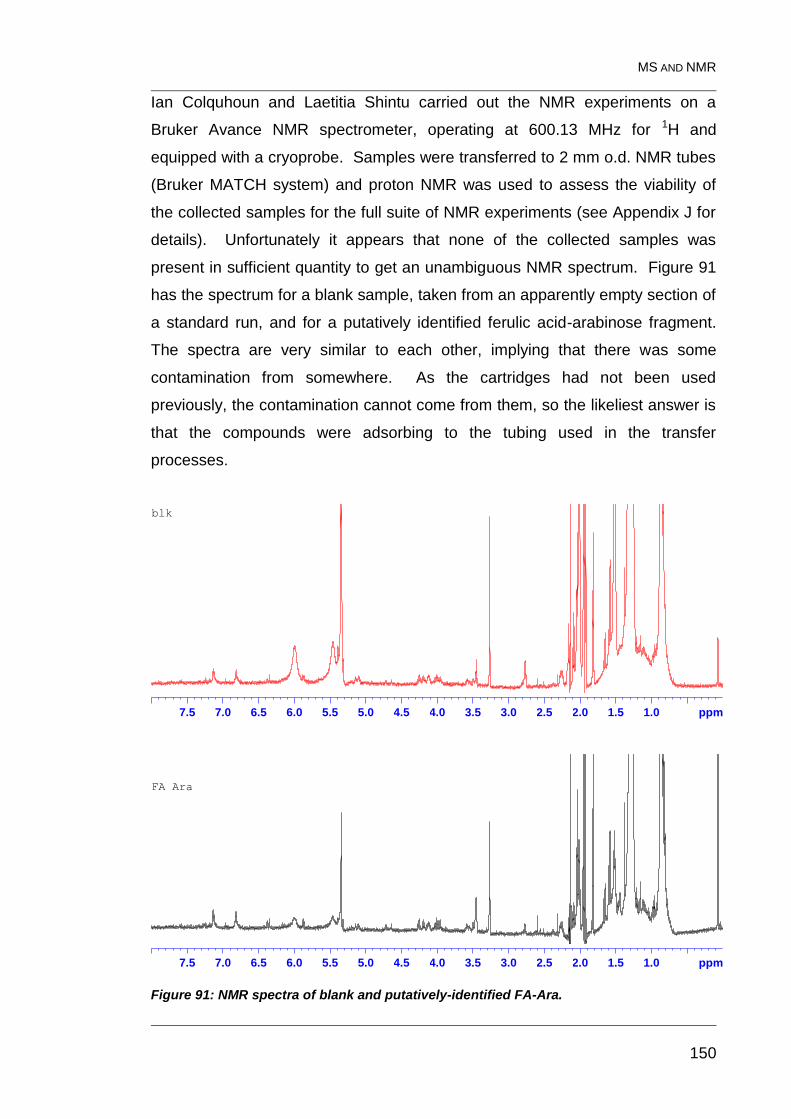
MS AND NMR
150
Ian Colquhoun and Laetitia Shintu carried out the NMR experiments on a
Bruker Avance NMR spectrometer, operating at 600.13 MHz for 1H and
equipped with a cryoprobe. Samples were transferred to 2 mm o.d. NMR tubes
(Bruker MATCH system) and proton NMR was used to assess the viability of
the collected samples for the full suite of NMR experiments (see Appendix J for
details). Unfortunately it appears that none of the collected samples was
present in sufficient quantity to get an unambiguous NMR spectrum. Figure 91
has the spectrum for a blank sample, taken from an apparently empty section of
a standard run, and for a putatively identified ferulic acid-arabinose fragment.
The spectra are very similar to each other, implying that there was some
contamination from somewhere. As the cartridges had not been used
previously, the contamination cannot come from them, so the likeliest answer is
that the compounds were adsorbing to the tubing used in the transfer
processes.
7.5 7.0 6.5 6.0 5.5 5.0 4.5 4.0 3.5 3.0 2.5 2.0 1.5 1.0 ppm
7.5 7.0 6.5 6.0 5.5 5.0 4.5 4.0 3.5 3.0 2.5 2.0 1.5 1.0 ppm
FA Ara
blk
Figure 91: NMR spectra of blank and putatively-identified FA-Ara.
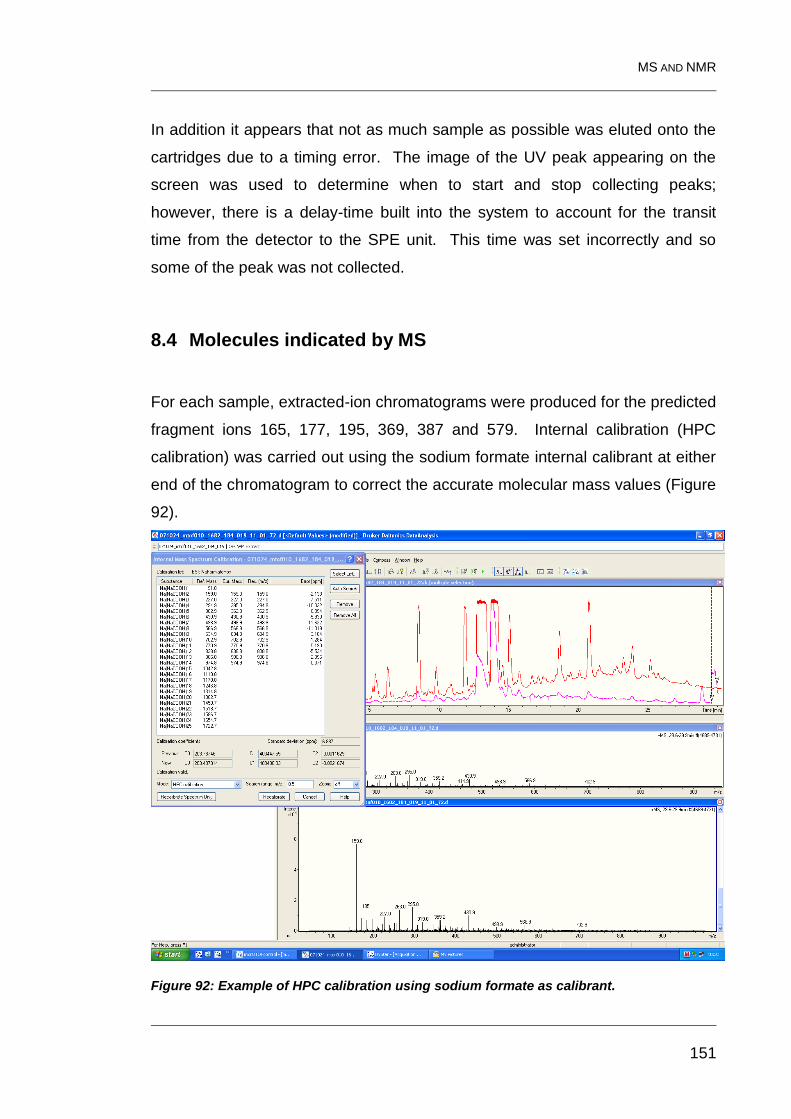
MS AND NMR
151
In addition it appears that not as much sample as possible was eluted onto the
cartridges due to a timing error. The image of the UV peak appearing on the
screen was used to determine when to start and stop collecting peaks;
however, there is a delay-time built into the system to account for the transit
time from the detector to the SPE unit. This time was set incorrectly and so
some of the peak was not collected.
8.4 Molecules indicated by MS
For each sample, extracted-ion chromatograms were produced for the predicted
fragment ions 165, 177, 195, 369, 387 and 579. Internal calibration (HPC
calibration) was carried out using the sodium formate internal calibrant at either
end of the chromatogram to correct the accurate molecular mass values (Figure
92).
Figure 92: Example of HPC calibration using sodium formate as calibrant.
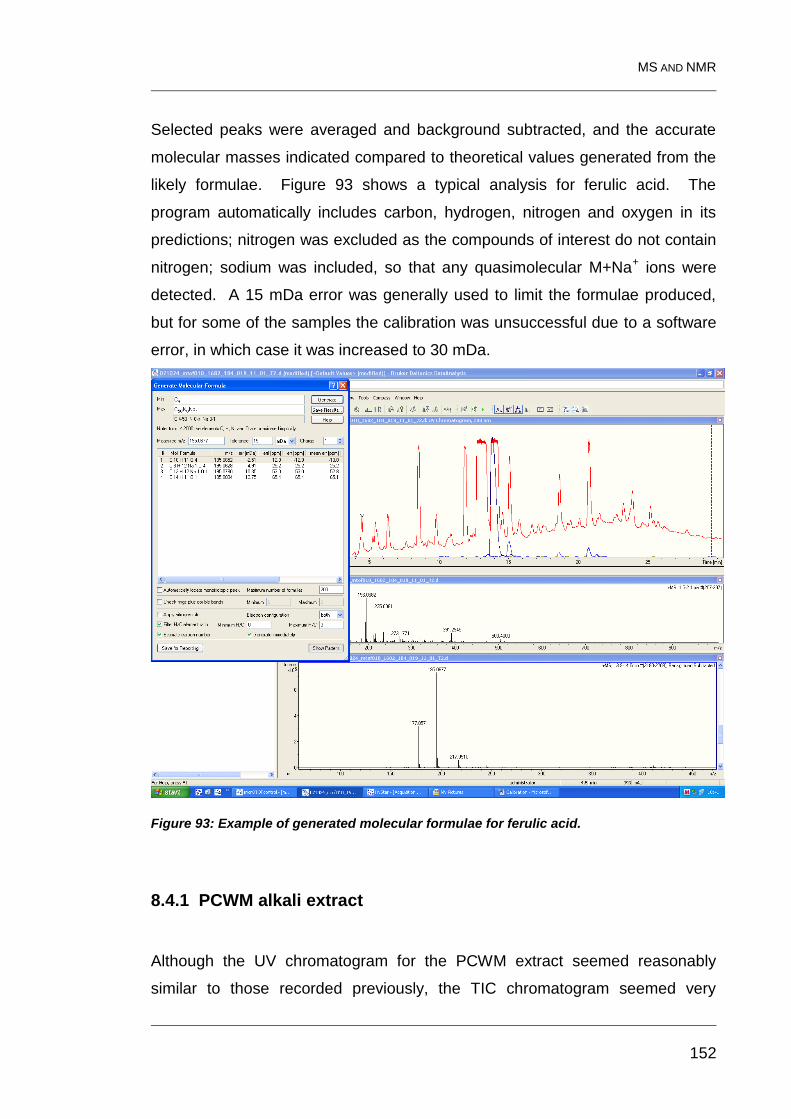
MS AND NMR
152
Selected peaks were averaged and background subtracted, and the accurate
molecular masses indicated compared to theoretical values generated from the
likely formulae. Figure 93 shows a typical analysis for ferulic acid. The
program automatically includes carbon, hydrogen, nitrogen and oxygen in its
predictions; nitrogen was excluded as the compounds of interest do not contain
nitrogen; sodium was included, so that any quasimolecular M+Na+ ions were
detected. A 15 mDa error was generally used to limit the formulae produced,
but for some of the samples the calibration was unsuccessful due to a software
error, in which case it was increased to 30 mDa.
Figure 93: Example of generated molecular formulae for ferulic acid.
8.4.1 PCWM alkali extract
Although the UV chromatogram for the PCWM extract seemed reasonably
similar to those recorded previously, the TIC chromatogram seemed very
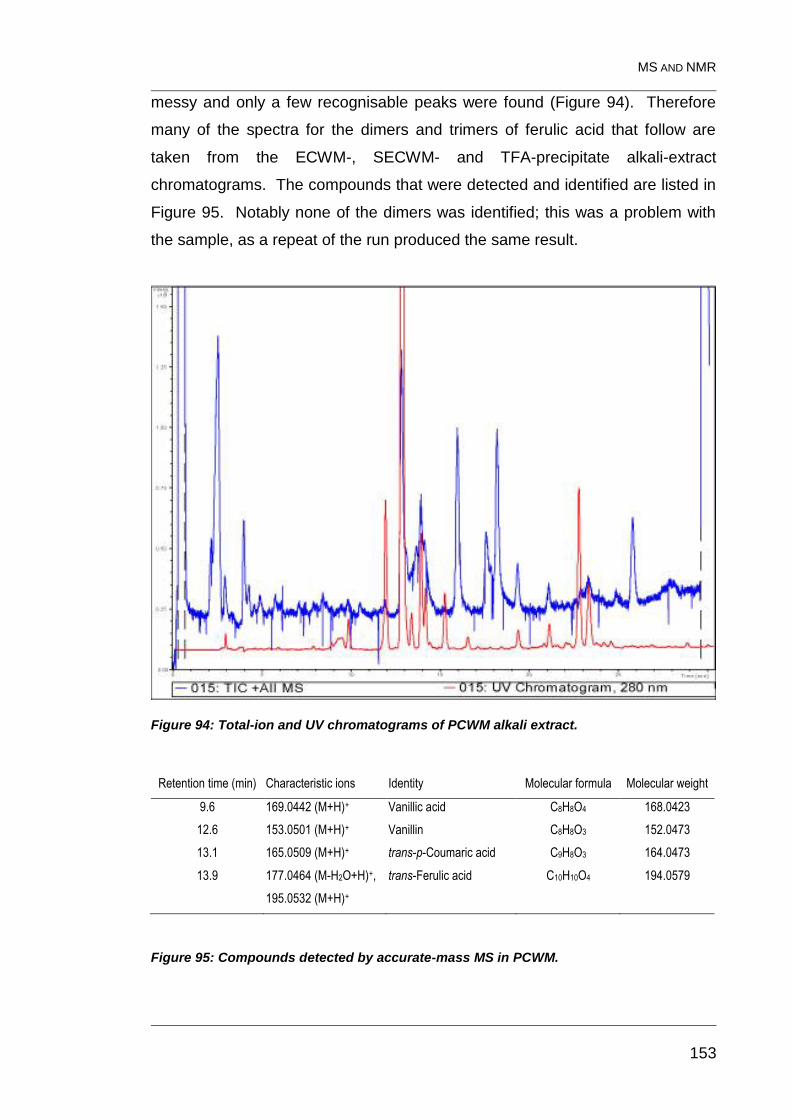
MS AND NMR
153
messy and only a few recognisable peaks were found (Figure 94). Therefore
many of the spectra for the dimers and trimers of ferulic acid that follow are
taken from the ECWM-, SECWM- and TFA-precipitate alkali-extract
chromatograms. The compounds that were detected and identified are listed in
Figure 95. Notably none of the dimers was identified; this was a problem with
the sample, as a repeat of the run produced the same result.
Figure 94: Total-ion and UV chromatograms of PCWM alkali extract.
Retention time (min) Characteristic ions Identity Molecular formula Molecular weight
9.6 169.0442 (M+H)+ Vanillic acid C8H8O4 168.0423
12.6 153.0501 (M+H)+ Vanillin C8H8O3 152.0473
13.1 165.0509 (M+H)+ trans-p-Coumaric acid C9H8O3 164.0473
13.9 177.0464 (M-H2O+H)+,
195.0532 (M+H)+
trans-Ferulic acid C10H10O4 194.0579
Figure 95: Compounds detected by accurate-mass MS in PCWM.
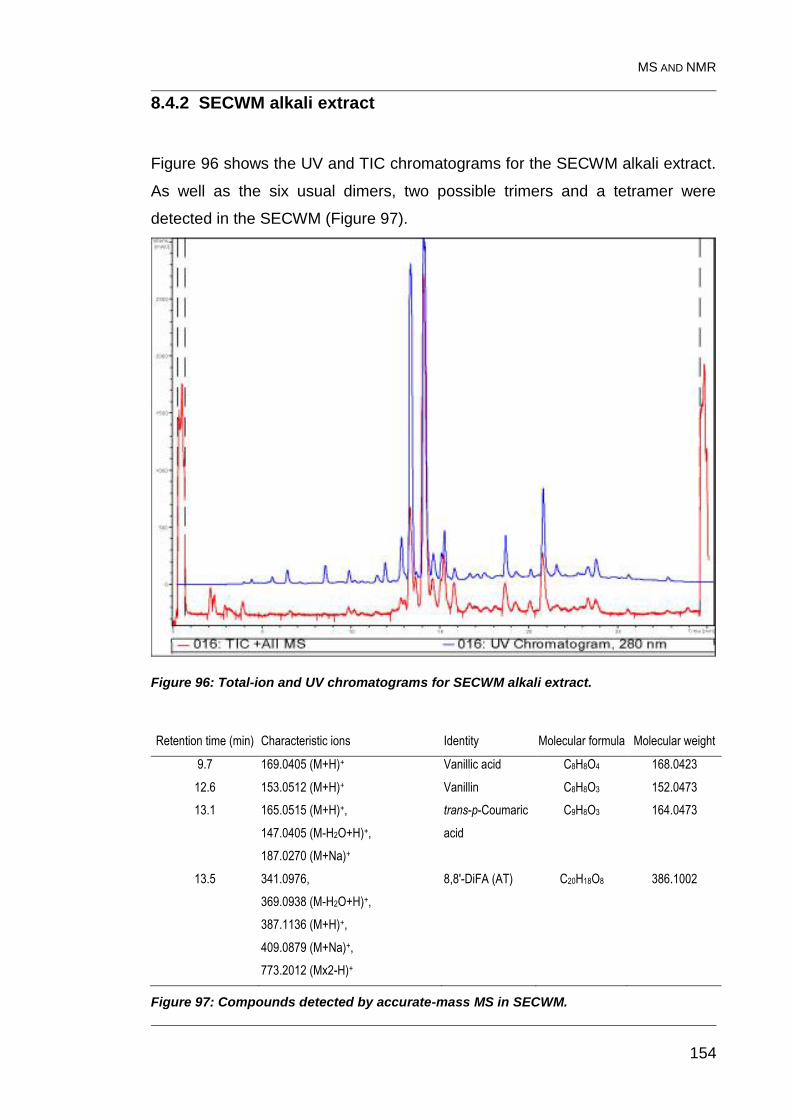
MS AND NMR
154
8.4.2 SECWM alkali extract
Figure 96 shows the UV and TIC chromatograms for the SECWM alkali extract.
As well as the six usual dimers, two possible trimers and a tetramer were
detected in the SECWM (Figure 97).
Figure 96: Total-ion and UV chromatograms for SECWM alkali extract.
Retention time (min) Characteristic ions Identity Molecular formula Molecular weight
9.7 169.0405 (M+H)+ Vanillic acid C8H8O4 168.0423
12.6 153.0512 (M+H)+ Vanillin C8H8O3 152.0473
13.1 165.0515 (M+H)+,
147.0405 (M-H2O+H)+,
187.0270 (M+Na)+
trans-p-Coumaric
acid
C9H8O3 164.0473
13.5 341.0976,
369.0938 (M-H2O+H)+,
387.1136 (M+H)+,
409.0879 (M+Na)+,
773.2012 (Mx2-H)+
8,8'-DiFA (AT) C20H18O8 386.1002
Figure 97: Compounds detected by accurate-mass MS in SECWM.
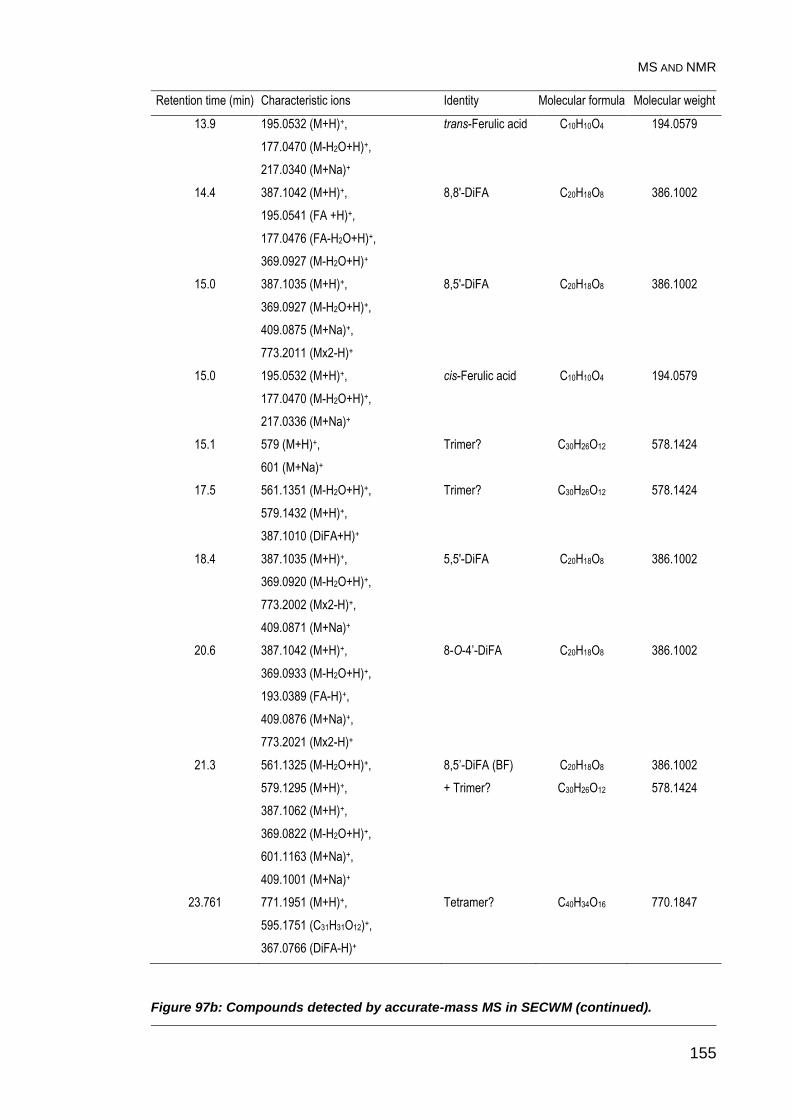
MS AND NMR
155
Retention time (min) Characteristic ions Identity Molecular formula Molecular weight
13.9 195.0532 (M+H)+,
177.0470 (M-H2O+H)+,
217.0340 (M+Na)+
trans-Ferulic acid C10H10O4 194.0579
14.4 387.1042 (M+H)+,
195.0541 (FA +H)+,
177.0476 (FA-H2O+H)+,
369.0927 (M-H2O+H)+
8,8'-DiFA C20H18O8 386.1002
15.0 387.1035 (M+H)+,
369.0927 (M-H2O+H)+,
409.0875 (M+Na)+,
773.2011 (Mx2-H)+
8,5'-DiFA C20H18O8 386.1002
15.0 195.0532 (M+H)+,
177.0470 (M-H2O+H)+,
217.0336 (M+Na)+
cis-Ferulic acid C10H10O4 194.0579
15.1 579 (M+H)+,
601 (M+Na)+
Trimer? C30H26O12 578.1424
17.5 561.1351 (M-H2O+H)+,
579.1432 (M+H)+,
387.1010 (DiFA+H)+
Trimer? C30H26O12 578.1424
18.4 387.1035 (M+H)+,
369.0920 (M-H2O+H)+,
773.2002 (Mx2-H)+,
409.0871 (M+Na)+
5,5'-DiFA C20H18O8 386.1002
20.6 387.1042 (M+H)+,
369.0933 (M-H2O+H)+,
193.0389 (FA-H)+,
409.0876 (M+Na)+,
773.2021 (Mx2-H)+
8-O-4’-DiFA C20H18O8 386.1002
21.3 561.1325 (M-H2O+H)+,
579.1295 (M+H)+,
387.1062 (M+H)+,
369.0822 (M-H2O+H)+,
601.1163 (M+Na)+,
409.1001 (M+Na)+
8,5’-DiFA (BF)
+ Trimer?
C20H18O8
C30H26O12
386.1002
578.1424
23.761 771.1951 (M+H)+,
595.1751 (C31H31O12)+,
367.0766 (DiFA-H)+
Tetramer? C40H34O16 770.1847
Figure 97b: Compounds detected by accurate-mass MS in SECWM (continued).
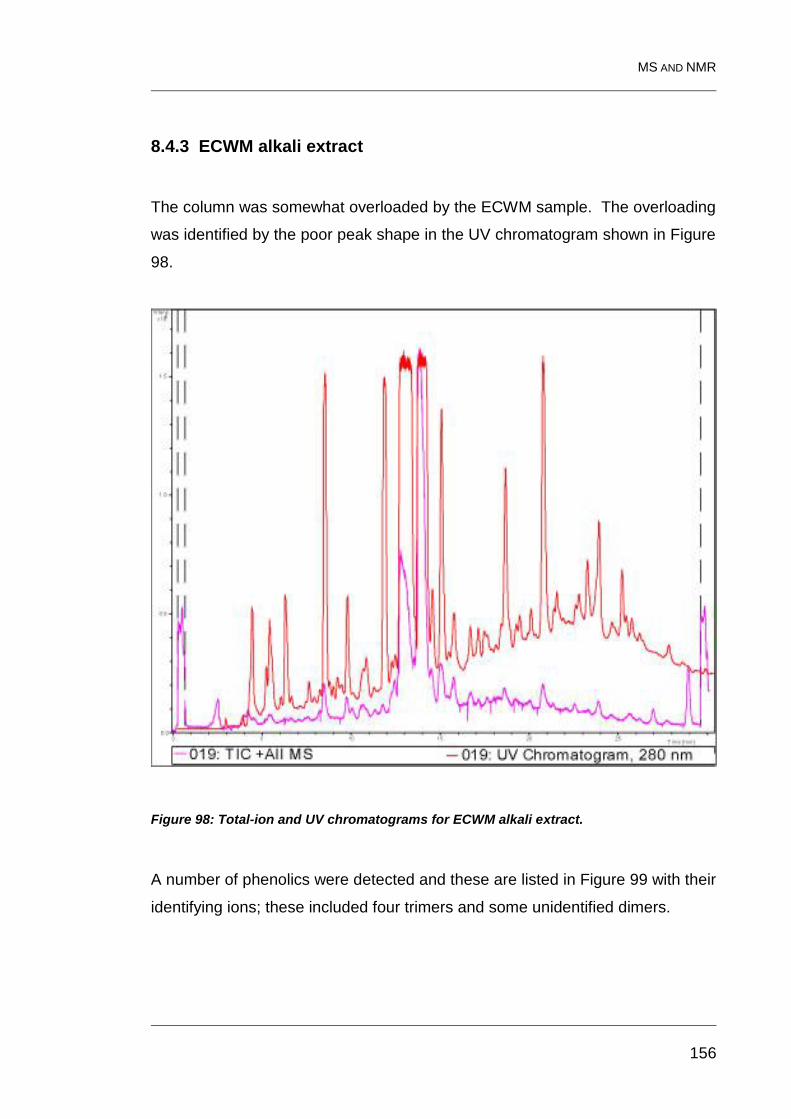
MS AND NMR
156
8.4.3 ECWM alkali extract
The column was somewhat overloaded by the ECWM sample. The overloading
was identified by the poor peak shape in the UV chromatogram shown in Figure
98.
Figure 98: Total-ion and UV chromatograms for ECWM alkali extract.
A number of phenolics were detected and these are listed in Figure 99 with their
identifying ions; these included four trimers and some unidentified dimers.
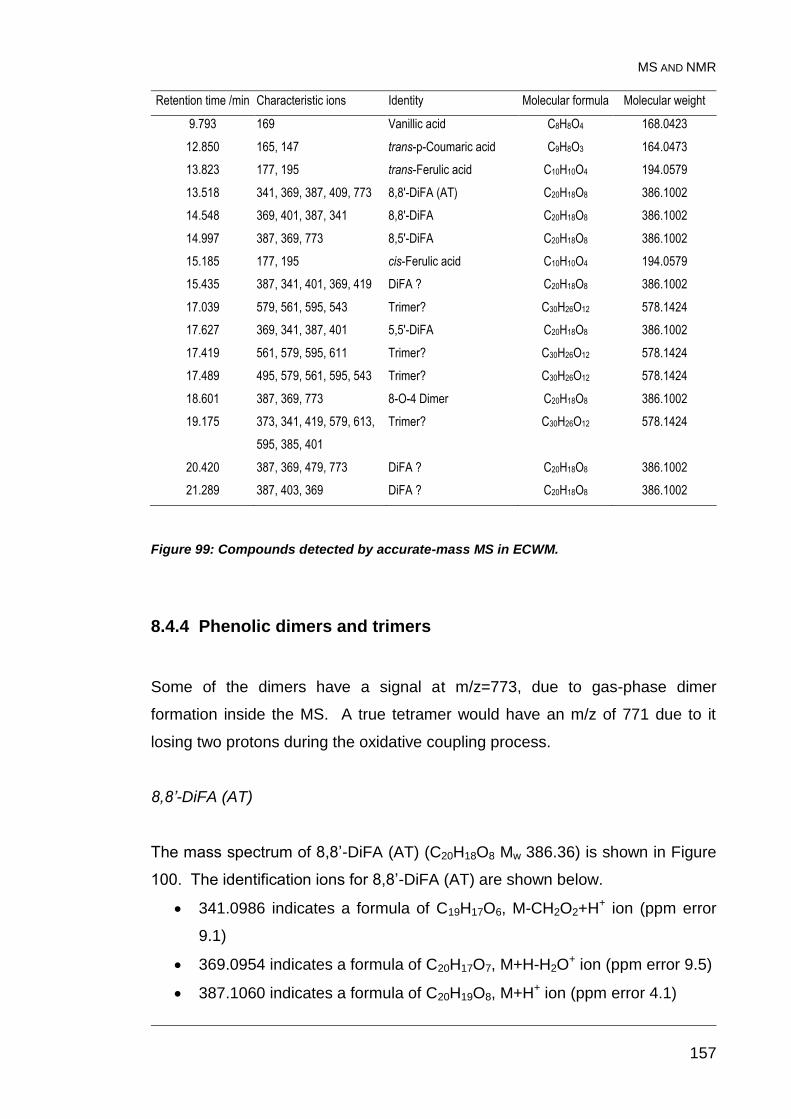
MS AND NMR
157
Retention time /min Characteristic ions Identity Molecular formula Molecular weight
9.793 169 Vanillic acid C8H8O4 168.0423
12.850 165, 147 trans-p-Coumaric acid C9H8O3 164.0473
13.823 177, 195 trans-Ferulic acid C10H10O4 194.0579
13.518 341, 369, 387, 409, 773 8,8'-DiFA (AT) C20H18O8 386.1002
14.548 369, 401, 387, 341 8,8'-DiFA C20H18O8 386.1002
14.997 387, 369, 773 8,5'-DiFA C20H18O8 386.1002
15.185 177, 195 cis-Ferulic acid C10H10O4 194.0579
15.435 387, 341, 401, 369, 419 DiFA ? C20H18O8 386.1002
17.039 579, 561, 595, 543 Trimer? C30H26O12 578.1424
17.627 369, 341, 387, 401 5,5'-DiFA C20H18O8 386.1002
17.419 561, 579, 595, 611 Trimer? C30H26O12 578.1424
17.489 495, 579, 561, 595, 543 Trimer? C30H26O12 578.1424
18.601 387, 369, 773 8-O-4 Dimer C20H18O8 386.1002
19.175 373, 341, 419, 579, 613,
595, 385, 401
Trimer? C30H26O12 578.1424
20.420 387, 369, 479, 773 DiFA ? C20H18O8 386.1002
21.289 387, 403, 369 DiFA ? C20H18O8 386.1002
Figure 99: Compounds detected by accurate-mass MS in ECWM.
8.4.4 Phenolic dimers and trimers
Some of the dimers have a signal at m/z=773, due to gas-phase dimer
formation inside the MS. A true tetramer would have an m/z of 771 due to it
losing two protons during the oxidative coupling process.
8,8’-DiFA (AT)
The mass spectrum of 8,8’-DiFA (AT) (C20H18O8 Mw 386.36) is shown in Figure
100. The identification ions for 8,8’-DiFA (AT) are shown below.
341.0986 indicates a formula of C19H17O6, M-CH2O2+H+ ion (ppm error
9.1)
369.0954 indicates a formula of C20H17O7, M+H-H2O+ ion (ppm error 9.5)
387.1060 indicates a formula of C20H19O8, M+H+ ion (ppm error 4.1)
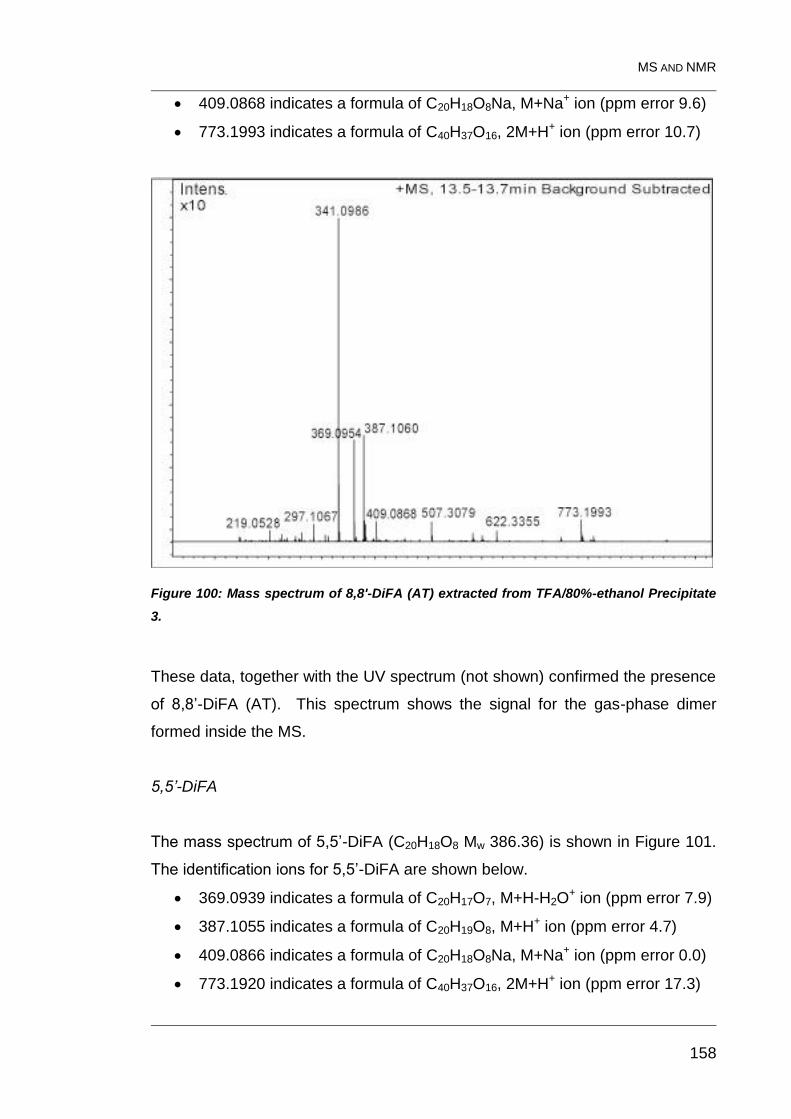
MS AND NMR
158
409.0868 indicates a formula of C20H18O8Na, M+Na+ ion (ppm error 9.6)
773.1993 indicates a formula of C40H37O16, 2M+H+ ion (ppm error 10.7)
Figure 100: Mass spectrum of 8,8'-DiFA (AT) extracted from TFA/80%-ethanol Precipitate
3.
These data, together with the UV spectrum (not shown) confirmed the presence
of 8,8’-DiFA (AT). This spectrum shows the signal for the gas-phase dimer
formed inside the MS.
5,5’-DiFA
The mass spectrum of 5,5’-DiFA (C20H18O8 Mw 386.36) is shown in Figure 101.
The identification ions for 5,5’-DiFA are shown below.
369.0939 indicates a formula of C20H17O7, M+H-H2O+ ion (ppm error 7.9)
387.1055 indicates a formula of C20H19O8, M+H+ ion (ppm error 4.7)
409.0866 indicates a formula of C20H18O8Na, M+Na+ ion (ppm error 0.0)
773.1920 indicates a formula of C40H37O16, 2M+H+ ion (ppm error 17.3)
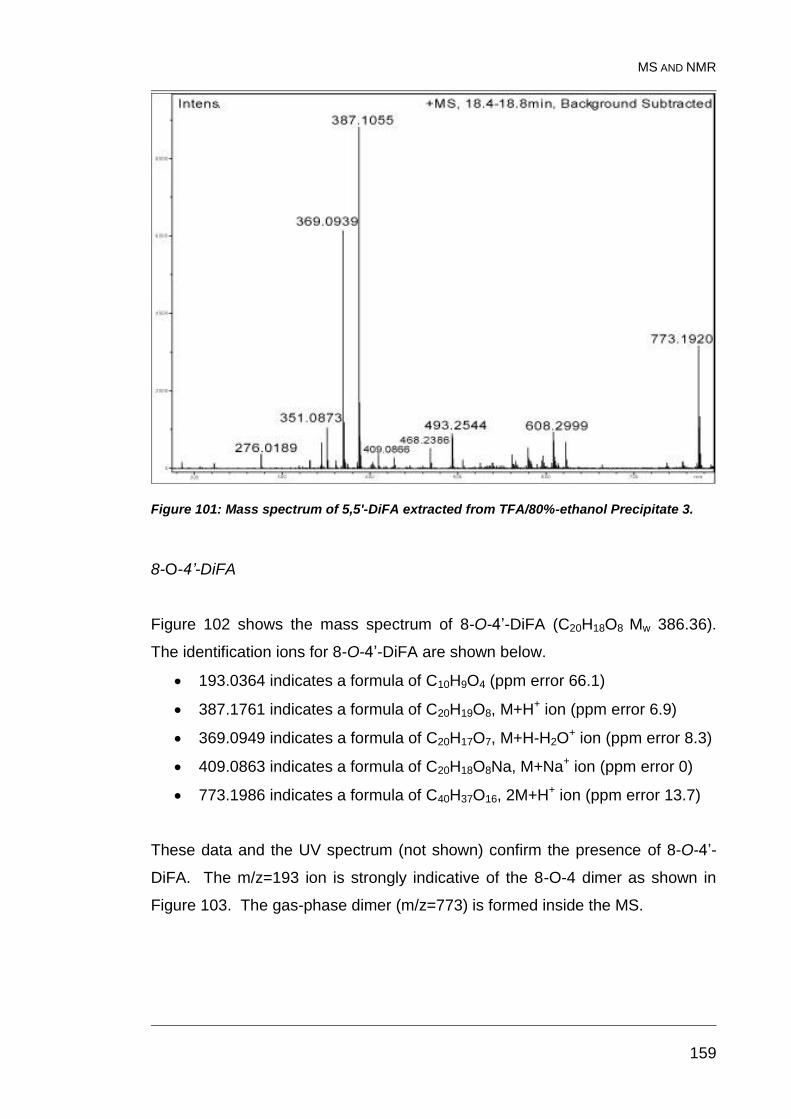
MS AND NMR
159
Figure 101: Mass spectrum of 5,5'-DiFA extracted from TFA/80%-ethanol Precipitate 3.
8-O-4’-DiFA
Figure 102 shows the mass spectrum of 8-O-4’-DiFA (C20H18O8 Mw 386.36).
The identification ions for 8-O-4’-DiFA are shown below.
193.0364 indicates a formula of C10H9O4 (ppm error 66.1)
387.1761 indicates a formula of C20H19O8, M+H+ ion (ppm error 6.9)
369.0949 indicates a formula of C20H17O7, M+H-H2O+ ion (ppm error 8.3)
409.0863 indicates a formula of C20H18O8Na, M+Na+ ion (ppm error 0)
773.1986 indicates a formula of C40H37O16, 2M+H+ ion (ppm error 13.7)
These data and the UV spectrum (not shown) confirm the presence of 8-O-4’-
DiFA. The m/z=193 ion is strongly indicative of the 8-O-4 dimer as shown in
Figure 103. The gas-phase dimer (m/z=773) is formed inside the MS.
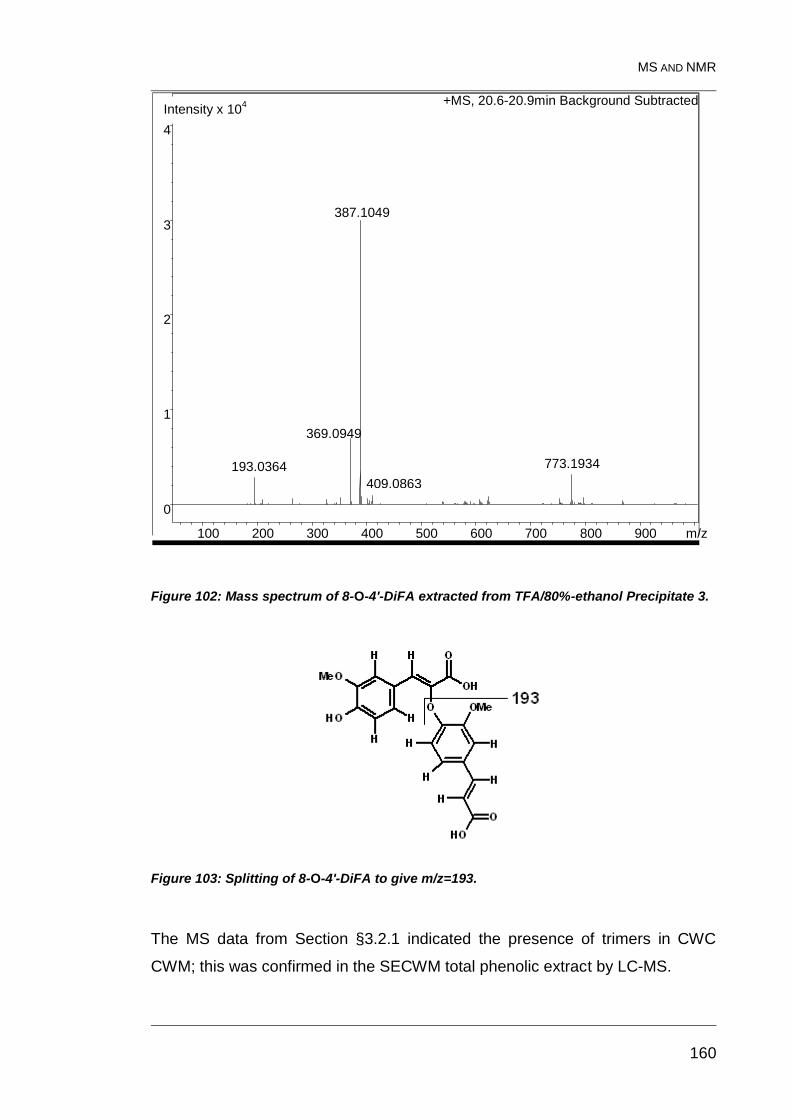
MS AND NMR
160
Figure 102: Mass spectrum of 8-O-4'-DiFA extracted from TFA/80%-ethanol Precipitate 3.
Figure 103: Splitting of 8-O-4'-DiFA to give m/z=193.
The MS data from Section §3.2.1 indicated the presence of trimers in CWC
CWM; this was confirmed in the SECWM total phenolic extract by LC-MS.
193.0364
387.1049
773.1934
+MS, 20.6-20.9min Background Subtracted
0
1
2
3
4
100 200 300 400 500 600 700 800 900 m/z
Intensity x 104
369.0949
409.0863
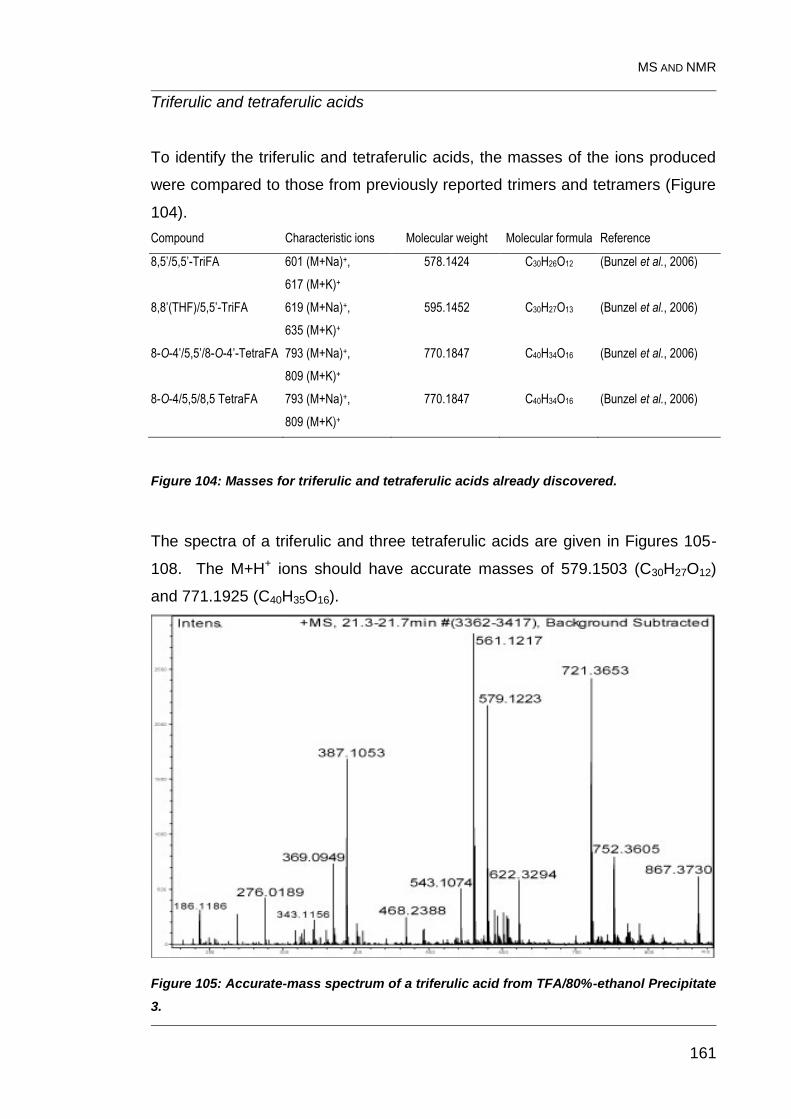
MS AND NMR
161
Triferulic and tetraferulic acids
To identify the triferulic and tetraferulic acids, the masses of the ions produced
were compared to those from previously reported trimers and tetramers (Figure
104).
Compound Characteristic ions Molecular weight Molecular formula Reference
8,5’/5,5’-TriFA 601 (M+Na)+,
617 (M+K)+
578.1424 C30H26O12 (Bunzel et al., 2006)
8,8’(THF)/5,5’-TriFA 619 (M+Na)+,
635 (M+K)+
595.1452 C30H27O13 (Bunzel et al., 2006)
8-O-4’/5,5’/8-O-4’-TetraFA 793 (M+Na)+,
809 (M+K)+
770.1847 C40H34O16 (Bunzel et al., 2006)
8-O-4/5,5/8,5 TetraFA 793 (M+Na)+,
809 (M+K)+
770.1847 C40H34O16 (Bunzel et al., 2006)
Figure 104: Masses for triferulic and tetraferulic acids already discovered.
The spectra of a triferulic and three tetraferulic acids are given in Figures 105-
108. The M+H+ ions should have accurate masses of 579.1503 (C30H27O12)
and 771.1925 (C40H35O16).
Figure 105: Accurate-mass spectrum of a triferulic acid from TFA/80%-ethanol Precipitate
3.
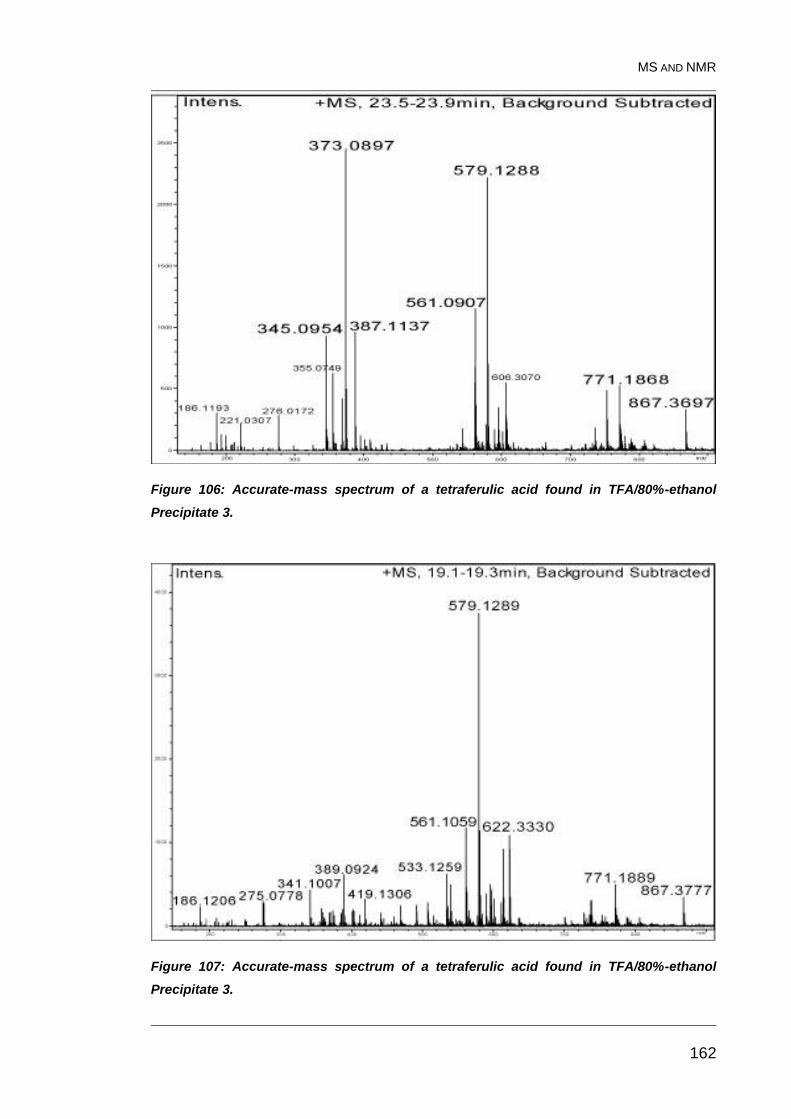
MS AND NMR
162
Figure 106: Accurate-mass spectrum of a tetraferulic acid found in TFA/80%-ethanol
Precipitate 3.
Figure 107: Accurate-mass spectrum of a tetraferulic acid found in TFA/80%-ethanol
Precipitate 3.
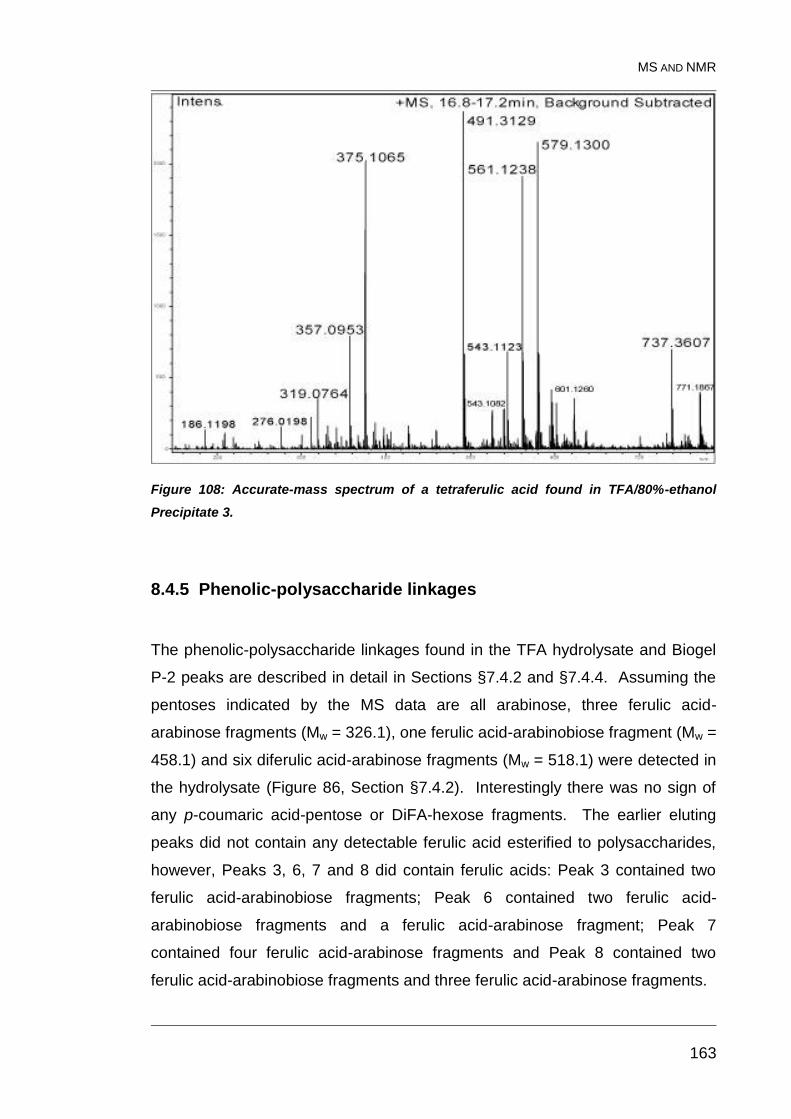
MS AND NMR
163
Figure 108: Accurate-mass spectrum of a tetraferulic acid found in TFA/80%-ethanol
Precipitate 3.
8.4.5 Phenolic-polysaccharide linkages
The phenolic-polysaccharide linkages found in the TFA hydrolysate and Biogel
P-2 peaks are described in detail in Sections §7.4.2 and §7.4.4. Assuming the
pentoses indicated by the MS data are all arabinose, three ferulic acid-
arabinose fragments (Mw = 326.1), one ferulic acid-arabinobiose fragment (Mw =
458.1) and six diferulic acid-arabinose fragments (Mw = 518.1) were detected in
the hydrolysate (Figure 86, Section §7.4.2). Interestingly there was no sign of
any p-coumaric acid-pentose or DiFA-hexose fragments. The earlier eluting
peaks did not contain any detectable ferulic acid esterified to polysaccharides,
however, Peaks 3, 6, 7 and 8 did contain ferulic acids: Peak 3 contained two
ferulic acid-arabinobiose fragments; Peak 6 contained two ferulic acid-
arabinobiose fragments and a ferulic acid-arabinose fragment; Peak 7
contained four ferulic acid-arabinose fragments and Peak 8 contained two
ferulic acid-arabinobiose fragments and three ferulic acid-arabinose fragments.
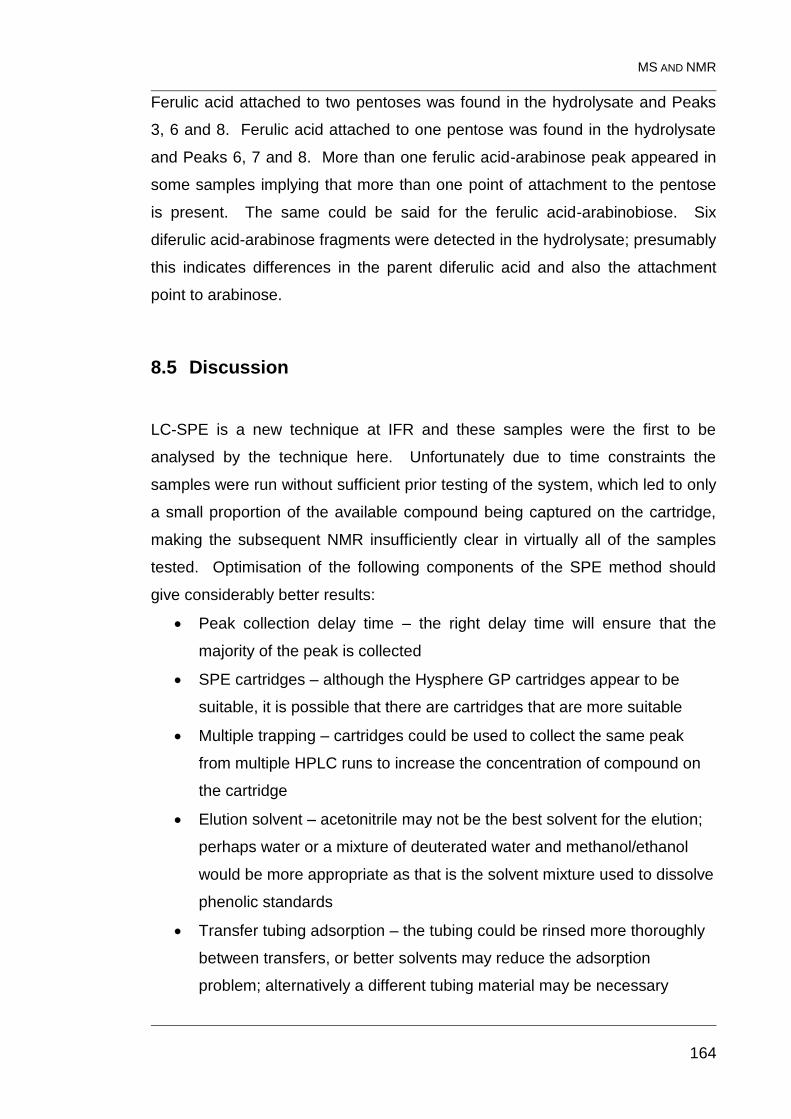
MS AND NMR
164
Ferulic acid attached to two pentoses was found in the hydrolysate and Peaks
3, 6 and 8. Ferulic acid attached to one pentose was found in the hydrolysate
and Peaks 6, 7 and 8. More than one ferulic acid-arabinose peak appeared in
some samples implying that more than one point of attachment to the pentose
is present. The same could be said for the ferulic acid-arabinobiose. Six
diferulic acid-arabinose fragments were detected in the hydrolysate; presumably
this indicates differences in the parent diferulic acid and also the attachment
point to arabinose.
8.5 Discussion
LC-SPE is a new technique at IFR and these samples were the first to be
analysed by the technique here. Unfortunately due to time constraints the
samples were run without sufficient prior testing of the system, which led to only
a small proportion of the available compound being captured on the cartridge,
making the subsequent NMR insufficiently clear in virtually all of the samples
tested. Optimisation of the following components of the SPE method should
give considerably better results:
Peak collection delay time – the right delay time will ensure that the
majority of the peak is collected
SPE cartridges – although the Hysphere GP cartridges appear to be
suitable, it is possible that there are cartridges that are more suitable
Multiple trapping – cartridges could be used to collect the same peak
from multiple HPLC runs to increase the concentration of compound on
the cartridge
Elution solvent – acetonitrile may not be the best solvent for the elution;
perhaps water or a mixture of deuterated water and methanol/ethanol
would be more appropriate as that is the solvent mixture used to dissolve
phenolic standards
Transfer tubing adsorption – the tubing could be rinsed more thoroughly
between transfers, or better solvents may reduce the adsorption
problem; alternatively a different tubing material may be necessary
MS AND NMR
165
Direct transfer to NMR tubes – these samples were not directly
transferred to the NMR tubes as the tubes were not available at the time
of transfer, this should reduce any transfer losses to a minimum
Accurate-mass spectra combined with the UV spectra for the 8-O-4’-DiFA,
5,5’-DiFA and 8,8’-DiFA (AT) has shown that these dimers are present in the
plant cell walls. The analysis has also identified trimers and tetramers of ferulic
acid in CWC cell walls. Ferulic acid-arabinose and ferulic acid-arabinobiose
fragments have been confirmed in the hydrolysate and Biogel P-2 peaks; as
were six diferulic acid-arabinose fragments in the hydrolysate. This confirms
that ferulic and diferulic acids are esterified to the polysaccharides of CWC cell
walls, but they could not be identified due to problems with the solid-phase
extraction procedure. Diferulic acid linkages between polysaccharides were not
implied by these results as no diferulic acid-arabinobiose was detected.
CHAPTER 9
166
9 General Discussion:
The investigation aimed to support the following hypotheses:
The compositions of the cell walls of three different tissues of CWC are
different, reflecting their roles in the plant’s physiology.
Phenolics cross-link polysaccharides in the cell walls of CWC. It was
hoped that the structure of any phenolic-polysaccharide fragments
produced could be elucidated. If one was found to contain 8,8’-DiFA (AT)
it would add weight to the theory that the 8,8’-DiFA (AT) forms the
linkage responsible for the thermal stability of CWC mechanical
properties.
Higher oligomers of ferulic acid are present in a plant that is not a
member of the Poaceae.
The general conclusions for these hypotheses are stated below:
9.1 Cell walls in different tissues of CWC
The data presented in Chapter 3 showed that there were significant differences
between the cell walls of the three different tissues studied (Figure 39, §3.3.1).
The decrease in cellulose in the secondary cell wall indicates lignin is taking
more of a structural role. The non-cellulosic polysaccharides seem to be fairly
consistent between the tissues. The hemicelluloses in CWC parenchyma were
thought to be predominantly arabinoxylans, but in fact it is xyloglucan, with
some arabinoxylan and a small amount of glucomannan. The pectin
component is rhamnogalacturonan I. The hemicelluloses in CWC epidermis
and sub-epidermis are similar, although the proportion of arabinoxylan is
increased in the ECWM.
CWC epidermis had the highest levels of phenolics, p-coumaric acid in
particular; presumably it has an important physiological role protecting cells
against damage by pathogens and/or soil abrasion. The dimers are probably
CHAPTER 9
167
involved in interpolymeric cross-linking, probably of arabinoxylan and/or
xyloglucan. The highest amount of dimers was found in the SECWM; as this is
vascular tissue, perhaps more dimers are necessary to maintain cell adhesion
in order to counteract the additional forces produced by osmotic pressure. The
presence of high amounts of ferulic acid (and other phenolics) may inhibit the
growth of the fungus Fusarium oxysporum (Lattanzio et al., 1994), one of the
known pathogens of CWC. From this information a new model for the structure
of CWC cell walls was put forward (Figure 40, §3.3.2)
9.2 Characterisation of unknown phenolics
A large number of unknown phenolics are present in the cell walls of CWC;
although a thorough survey had not been planned initially, it was thought worth
while in case novel components were identified and therefore could perhaps be
quantified in the same investigation. Although sufficient information was not
available to assign structures to the unknowns, sufficient information was
recorded about each so that should they be identified in the future, retrospective
quantification would be possible. The data are discussed in depth in Chapter 4
and tabulated in Appendix F.
9.3 Cell wall cross-links
The development and evaluation of biochemical and chemical methods for
producing phenolic-polysaccharide fragments is presented in Chapters 6 and 7.
Contamination of Driselase with the phenolics and sugars that were under
investigation prevented its use for producing phenolic-polysaccharide
fragments; so 0.05 M TFA was used instead. The mass-spectrometric data
indicated that there were a range of ferulic acid-polysaccharide linkages
detected in the hydrolysate and in Peaks 3, 6, 7 and 8. There were also six
diferulic acid-arabinose fragments detected in the hydrolysate. Without the help
of NMR identification no conclusions could be made about the exact linkages
CHAPTER 9
168
between (di)ferulic acids and the polysaccharides of CWC cell walls. No
p-coumaric acid-arabinose fragments or ferulic acid-hexose fragments were
detected.
Bunzel et al (2008) have isolated Ara-8,8’-DiFA (AT)-Ara in maize bran
insoluble fibre, proving that it does cross-link polysaccharides. This discovery
lends weight to the argument that 8,8’-DiFA (AT) is instrumental in the
maintenance of cell-cell adhesion put forward by Parker et al (2003). The
amounts of CWM used in these experiments were one or two orders of
magnitude too small for this linkage to be identified, and this is reflected in the
fact that no compounds with masses that matched diferulic acid-arabinobiose
were detected.
9.4 Higher oligomers of ferulic acid
The mass spectrometry results given in Chapter 8 indicate that trimers and
tetramers of ferulic acid are present in CWC cell walls, although which particular
ones has not been identified. Theoretically there should be at least 19 possible
structures (Ralph et al., 2004), and only five have been identified to date
(Bunzel et al., 2005; Bunzel et al., 2006; Funk et al., 2005). As adding each
successive ferulic acid molecule adds to the number of possible structures
available, there may be huge numbers of ferulic acid oligomers present in plant
cell walls.
9.5 Limitations
Production of cell-wall material necessitates the breaking of some bonds and
therefore reduces the amount of information available from this material. The
material extracted from the CWM may not give a true picture of the whole, as
some components may be extracted more easily than others during the
process.
CHAPTER 9
169
The lack of data available on variety, country of origin, growing and storage
conditions for the CWC, it having been bought from retail outlets, negates the
comparison of different batches of CWM. The major exporters are China,
Thailand and Taiwan, and these are therefore the likely countries of origin, but
growing conditions within these countries could vary widely. It would be
expected that variety, growing and storage conditions could have a significant
effect on the cell-wall composition (Lempereur et al., 1997). The best way to
get around this issue would be to obtain CWC direct from growers in China, or
to obtain different varieties, distinguish them genetically, and then grow them
under controlled conditions.
9.6 Future work
There are a number of experiments that need to be done to continue towards
the aim of determining which molecules and/or linkages are responsible for the
crisp texture of Chinese water chestnuts.
9.6.1 Improved TFA hydrolysis methodology
A sequential TFA hydrolysis using increasing concentrations, perhaps 0.01 M,
0.025 M, 0.05M and 0.1 M TFA could be used to produce a less complex
mixture of FA-oligosaccharide fragments at each stage, allowing easier
separation and purification. This would also give some indication of which
linkages are most chemically stable when phenolic linkages are involved.
9.6.2 Degradation of cell wall by purified CWC-specific enzymes
As Fusarium oxysporum (together with Geotrichium, Cerastomella paradoxa
Trichoderma viride, Uromyces sp., Cylindrosporium eleocharidis) (Brecht, 2004)
is one of the few listed pathogens for CWC, purified enzymes derived from its
cultures could be characterised with regard to their activities. These could then
CHAPTER 9
170
be used in two ways: i) to determine which linkages are key to cell-cell adhesion
in CWC by using particular enzyme treatments to produce significant textural
changes in the whole tissue, ii) individually, synergistically and sequentially to
degrade CWC cell walls, to produce phenolic-polysaccharides for further study.
Alternatively, the existing enzyme preparations could be purified to allow
enzymic degradation without contamination of the resulting supernatants.
9.6.3 Improved LC-SPE methodology
Improvement of the LC-SPE methodology, primarily by ensuring the timing of
the peak collection has been optimised, and that the solid-phase cartridge and
elution solvent are the most favourable should ensure that the investigations of
the previous sections could be put to the best possible use. Also, the utilisation
of the multiple-trapping facility should allow sufficient sample for good-quality
NMR analysis.
9.6.4 Stability of phenolic-polysaccharide linkages in alkali
Alkali extraction of phenolics from CWC may be time-dependent, and a full
course of time-course experiments will help to optimise the method for
extracting phenolics and may clarify which diferulic acids are stable in dilute
alkali regardless of time; allowing better agreement between the loss of
particular phenolics and reduction in cell adhesion.
9.6.5 Investigations of CWC leaf-cell walls
Little is known about CWC leaf cell walls, although the leaves of CWC are used
in some cultures for weaving into mats. In fact there are two ecotypes found in
Fiji that show a difference in the toughness of their leaves, one has “soft” leaves
suitable for weaving mats, whilst the other has “hard” leaves which are
CHAPTER 9
171
unsuitable (Klok et al., 2002). The difference between these leaves is
presumably on account of the presence of complete septa in place of the
usually-incomplete septa, due to some genetic abnormality. As there has been
very limited genetic analysis carried out on CWC generally, identifying the
abnormality could present a major challenge. Microscopy pictures of CWC
leaves are in Appendix K.
9.6.6 Completion of CWC cell-wall models
To produce a complete picture of CWC parenchyma cell walls, the protein
content and composition should be studied, as this would give the required
information to determine the presence of extensin. Analysis of the proteins
present would also aid understanding of which other proteins/enzymes are
present in CWC cell walls and which therefore may be involved in
polysaccharide formation, alteration and degradation.
Na2CO3 extraction removes methyl esters and phenolic esters, but not acetyl
esters; therefore both methyl and phenolic esters may be involved in cell
adhesion (Marry et al., 2006). Therefore, the degree of in vivo methylation and
acetylation of the cell-wall polysaccharides of CWC should be measured. An
attempt was made to measure acetylation using a commercial testing kit during
this study, but the results were inconsistent.
As listed in Section §1.3.1, a whole suite of antibodies is available to
characterise cell walls, and some could be chosen to confirm the positions of
the arabinoxylan, rhamnogalacturonan and xyloglucan in the cell walls. They
could also be used to determine if AGP and extensin are present.
For the epidermis and sub-epidermis cell walls, in addition to the analyses listed
above, an analysis of the lignin composition would also be required.
CHAPTER 9
172
9.6.7 Alternative methods of polysaccharide analysis
Other methods for depolymerising polysaccharides exist; in particular one
method from the chemical literature seems to be of interest (Wang et al., 1998).
It involves acetylating the polysaccharides and then selected conformations of
β-D-aldosidic linkages present are oxidised by ozone to form esters. The
polysaccharides are then cleaved by a nucleophile. The reaction is strongly
controlled by stereoelectronic effects and so the reaction rates vary
considerably with conformation, thus allowing specific linkages to be broken in a
way similar to that achievable with enzymes. Although the reference mentioned
uses purified samples of polysaccharide, there seems to be no reason why this
could not be used on plant cell walls (or fractions thereof), bar their solubility in
formamide, which is the suggested solvent for the initial acetylation. Depending
on the susceptibility of phenolic esters to ozone this might lead to larger
oligosaccharide chains linked by diferulic acid bridges being isolated.
9.6.8 Commercial uses for CWC cell-wall information
Fusarium oxysporum enzymes could also be used to break down CWC waste,
such as the leaves (from harvesting) or epidermis (from canning), to produce a
liquid preparation rich in phenolics and oligosaccharides, which may yield useful
components suitable for further processing into high-value products.
Combined harvesting of leaves and corms could produce additional streams of
income for farming communities. However harvesting the leaves would
probably affect the degree to which harvestable corms were produced, as
corms are usually harvested once the leaves have died back; therefore, using
the leaves for weaving and eating the corms may be mutually exclusive
activities.
The unexpected gelling of a few of the solutions during the VICS experiment
could be usefully investigated, as food-based gels have many uses in the food
and pharmaceutical industries. If they do contain relatively high levels of
CHAPTER 9
173
phenolics, however, they could be unpalatable and so unsuitable for food
applications, but this does not preclude other applications.
APPENDICES
174
10 Appendices:
A Solution preparation
0.5% SDS solution:
10 g of sodium dodecyl sulfate (Sigma) and 1.142 g of sodium metabisulfate
(Sigma) made up to 2 L with deionised water, mixed very slowly to prevent
foaming.
1.5% SDS solution:
30 g of sodium dodecyl sulfate (Sigma) and 1.903 g of sodium metabisulfate
(Sigma) made up to 2 L with deionised water, mixed very slowly to prevent
foaming.
KI/I2:
1.5 g of iodine and 0.5 g of potassium iodide made up to 50 ml with deionised
water.
Sulfuric acid reagent (25 mM Na2B4O7.10H2O in 96% H2SO4):
2.385 g Na2B4O7.10H2O made up to 250 ml with 96% H2SO4 (takes at least 1 hr
to dissolve).
50 mM CDTA:
0.48 g of Na2S2O5 and 9.1 g of CDTA (Na+ salt, Sigma) dissolved in 400 ml
deionised water (to give final concentrations of 5 and 50 mM respectively).
NaOH solution (2 M) was added dropwise, bringing the pH back up to 7. As the
pH increased the CDTA dissolved. The solution was then made up to 500 ml
with deionised water.
APPENDICES
175
B HPLC parameters
Instrument conditions
Simple phenolics
Instrument control method
Instrument: Perkin Elmer HPLC-DAD consisting of Quaternary
LC Pump Model 200Q/410 with LC-235 Diode Array Detector and ISS-200
Autosampler
Channel parameters
Data will be collected from channel A
Delay time: 0.00 min
Run time: 30.00 min
Sampling rate: 2.4414pts/s
Channel A Channel B
Signal source LC235C LC235C
Autosampler method
Injection source: Autosampler
Injection volume: 40 µl Flush volume: 1000 µl
Loop size: 150 µl Flush speed: Medium
Fixed mode: Off Flush cycles: 2
Excess volume: 5 µl Air cushion: 5 µl
Sample syringe size: 250 µl Sample speed: Medium
Needle level: 5%
Inject delay time: 0.00 min
APPENDICES
176
Detector parameters
Step Time A (nm) B (nm) BWA (nm) BWB (nm)
1 30.00 280 325 5 5
Min wavelength: 210 nm Spectral threshold: Normal
Spectral acquisition mode: Time Sampling period: 1.6 s
Start time: 0.1 min End time: 30.00 min
Lamp off at end of run: No
Pump parameters
Step Time Flow A B 40-40-20 10% Acetonitrile Curve
0 0.5 1.00 0.0 0.0 10.0 90.0 0.0
1 25.0 1.00 0.0 0.0 75.0 25.0 1.0
2 5.0 1.00 0.0 0.0 100.0 0.0 1.0
3 10.0 1.00 0.0 0.0 10.0 90.0 -3.0
4 2.0 1.00 0.0 0.0 10.0 90.0 0.0
Ready time: 60.0 min Standby time: 15.0 min
Standby flow: 0.1 ml/min Solvent saver: No
Saver Equ. time: 0.0 min Shutdown: No
Min pressure: 200 PSI Max pressure: 3500 PSI
Timed events
There are no timed events in this method
Real-time plot parameters
Pages Offset (mV) Scale (mV)
Channel A 1 -30.000 250.000
APPENDICES
177
Processing parameters
Bunch factor: 5 points
Noise threshold: 24 µV
Area threshold: 122.00 µV
Peak separation criteria
Width ratio: 0.200
Valley-to-peak ratio: 0.010
Exponential skim criteria
Peak height ratio: 5.000
Adjusted height ratio: 4.000
Valley height ratio: 3.000
Baseline timed events
No baseline timed events
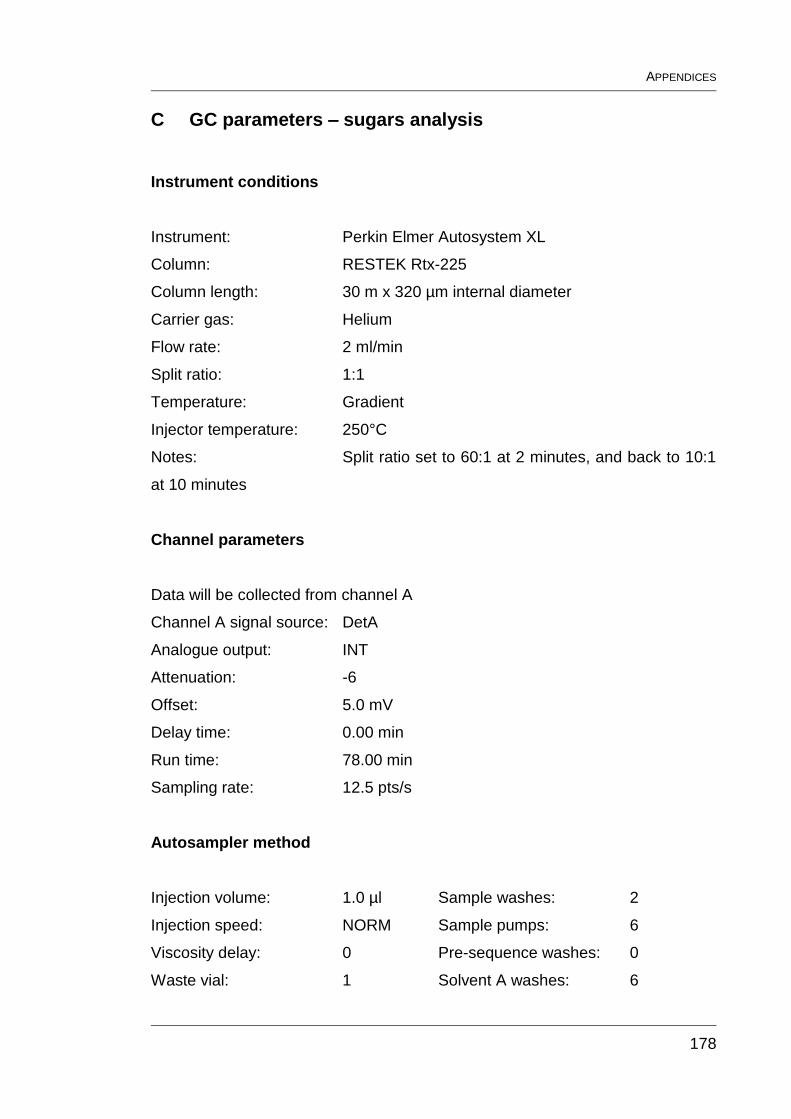
APPENDICES
178
C GC parameters – sugars analysis
Instrument conditions
Instrument: Perkin Elmer Autosystem XL
Column: RESTEK Rtx-225
Column length: 30 m x 320 µm internal diameter
Carrier gas: Helium
Flow rate: 2 ml/min
Split ratio: 1:1
Temperature: Gradient
Injector temperature: 250°C
Notes: Split ratio set to 60:1 at 2 minutes, and back to 10:1
at 10 minutes
Channel parameters
Data will be collected from channel A
Channel A signal source: DetA
Analogue output: INT
Attenuation: -6
Offset: 5.0 mV
Delay time: 0.00 min
Run time: 78.00 min
Sampling rate: 12.5 pts/s
Autosampler method
Injection volume: 1.0 µl Sample washes: 2
Injection speed: NORM Sample pumps: 6
Viscosity delay: 0 Pre-sequence washes: 0
Waste vial: 1 Solvent A washes: 6

APPENDICES
179
Carrier’s parameters
Carrier A control: PFlow – He
Column A length: 30.00m
Column A diameter: 320 µm
Vacuum compensation: OFF
Split control mode: Ratio
Set point: 0.0:1
Initial setpoint: 2.0 ml/min
Initial hold: 999 min
Valve configuration and settings
Valve 1: SPLIT ON
Valves 2-6: NONE
Detector parameters
Detector A: FID Detector B: NONE
Range: 1
Time constant: 200
Autozero: ON
Ref gas flow: 250.0 ml/m
MKUp gas flow 25.0 ml/m
Heated zones
Injector A: PSSI Injector B: NONE
Initial set point: 250°C Injector B setpoint: OFF
Initial hold: 999.00 min
Detector A: 250°C
Detector B: 0°C
Auxiliary (NONE): 0°C
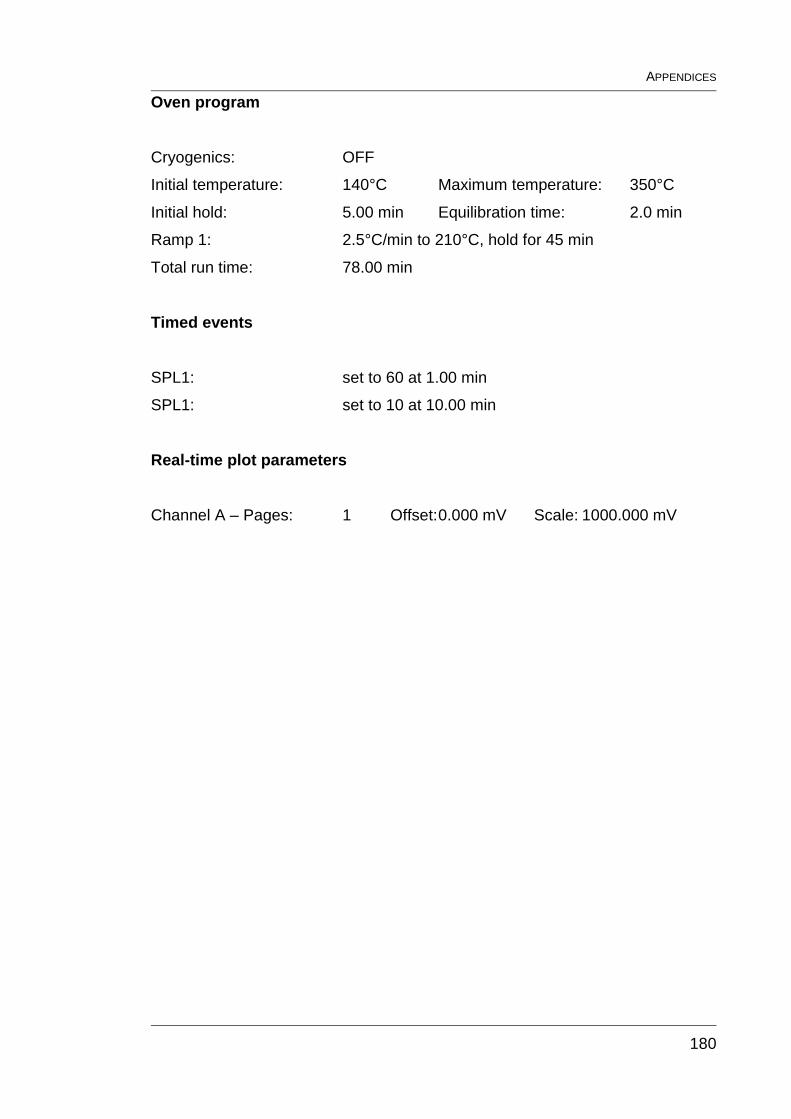
APPENDICES
180
Oven program
Cryogenics: OFF
Initial temperature: 140°C Maximum temperature: 350°C
Initial hold: 5.00 min Equilibration time: 2.0 min
Ramp 1: 2.5°C/min to 210°C, hold for 45 min
Total run time: 78.00 min
Timed events
SPL1: set to 60 at 1.00 min
SPL1: set to 10 at 10.00 min
Real-time plot parameters
Channel A – Pages: 1 Offset: 0.000 mV Scale: 1000.000 mV
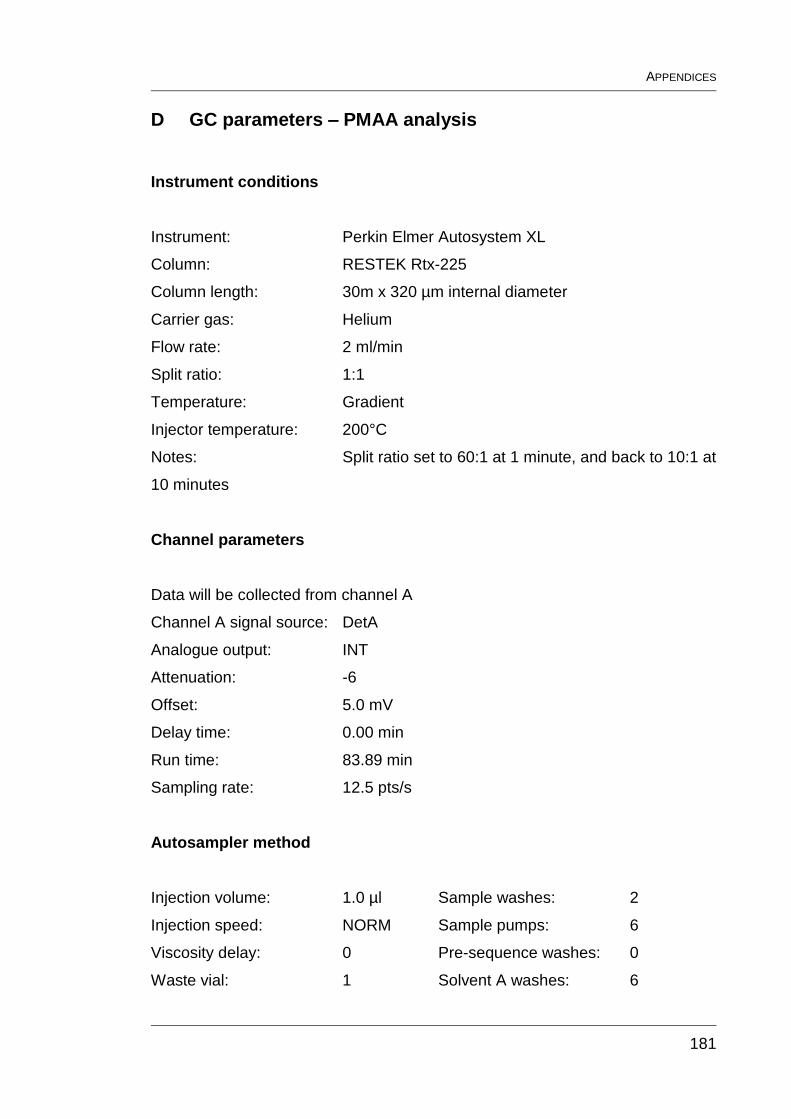
APPENDICES
181
D GC parameters – PMAA analysis
Instrument conditions
Instrument: Perkin Elmer Autosystem XL
Column: RESTEK Rtx-225
Column length: 30m x 320 µm internal diameter
Carrier gas: Helium
Flow rate: 2 ml/min
Split ratio: 1:1
Temperature: Gradient
Injector temperature: 200°C
Notes: Split ratio set to 60:1 at 1 minute, and back to 10:1 at
10 minutes
Channel parameters
Data will be collected from channel A
Channel A signal source: DetA
Analogue output: INT
Attenuation: -6
Offset: 5.0 mV
Delay time: 0.00 min
Run time: 83.89 min
Sampling rate: 12.5 pts/s
Autosampler method
Injection volume: 1.0 µl Sample washes: 2
Injection speed: NORM Sample pumps: 6
Viscosity delay: 0 Pre-sequence washes: 0
Waste vial: 1 Solvent A washes: 6
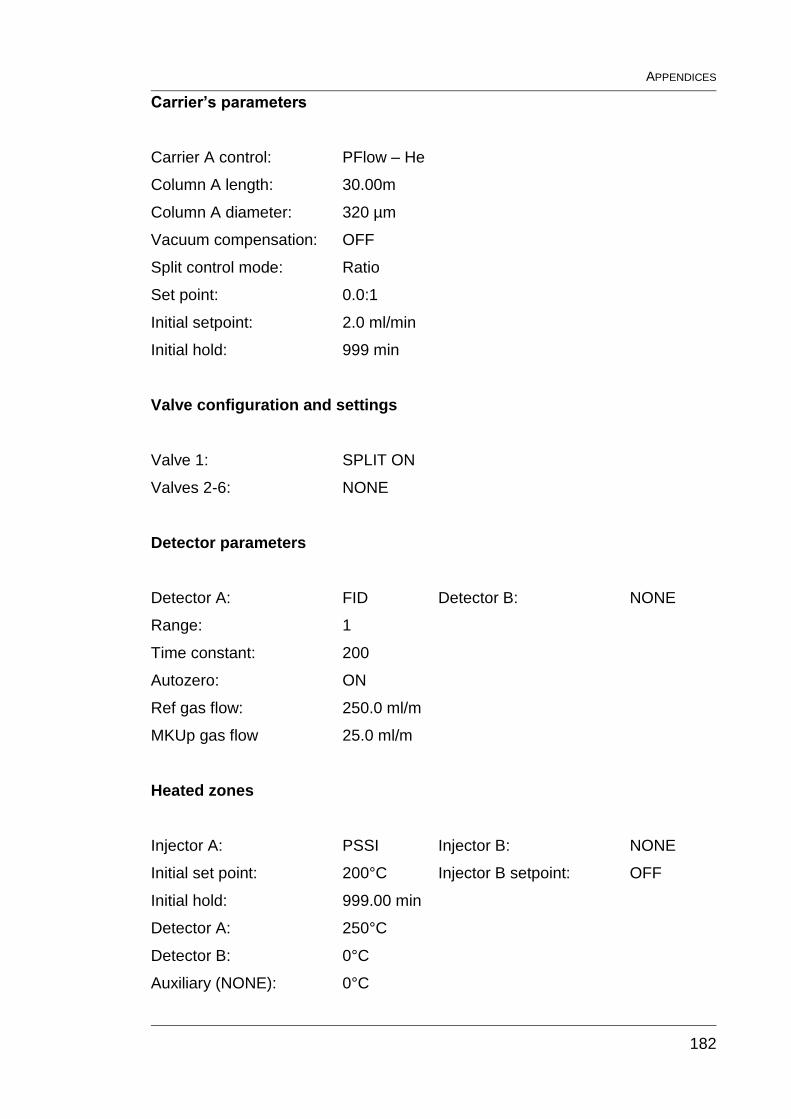
APPENDICES
182
Carrier’s parameters
Carrier A control: PFlow – He
Column A length: 30.00m
Column A diameter: 320 µm
Vacuum compensation: OFF
Split control mode: Ratio
Set point: 0.0:1
Initial setpoint: 2.0 ml/min
Initial hold: 999 min
Valve configuration and settings
Valve 1: SPLIT ON
Valves 2-6: NONE
Detector parameters
Detector A: FID Detector B: NONE
Range: 1
Time constant: 200
Autozero: ON
Ref gas flow: 250.0 ml/m
MKUp gas flow 25.0 ml/m
Heated zones
Injector A: PSSI Injector B: NONE
Initial set point: 200°C Injector B setpoint: OFF
Initial hold: 999.00 min
Detector A: 250°C
Detector B: 0°C
Auxiliary (NONE): 0°C
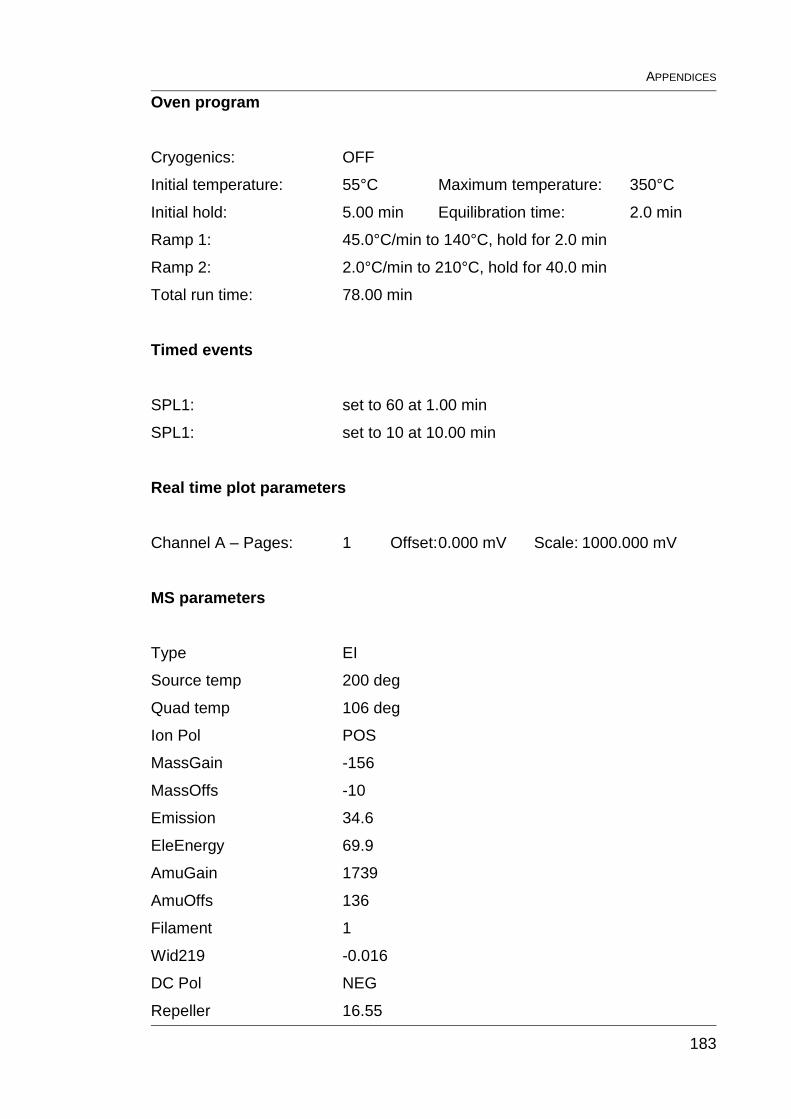
APPENDICES
183
Oven program
Cryogenics: OFF
Initial temperature: 55°C Maximum temperature: 350°C
Initial hold: 5.00 min Equilibration time: 2.0 min
Ramp 1: 45.0°C/min to 140°C, hold for 2.0 min
Ramp 2: 2.0°C/min to 210°C, hold for 40.0 min
Total run time: 78.00 min
Timed events
SPL1: set to 60 at 1.00 min
SPL1: set to 10 at 10.00 min
Real time plot parameters
Channel A – Pages: 1 Offset: 0.000 mV Scale: 1000.000 mV
MS parameters
Type EI
Source temp 200 deg
Quad temp 106 deg
Ion Pol POS
MassGain -156
MassOffs -10
Emission 34.6
EleEnergy 69.9
AmuGain 1739
AmuOffs 136
Filament 1
Wid219 -0.016
DC Pol NEG
Repeller 16.55
APPENDICES
184
IonFocus 90.2
HED ON
EntLens 1.0
EntOffs 18.57
EMVolts 1800
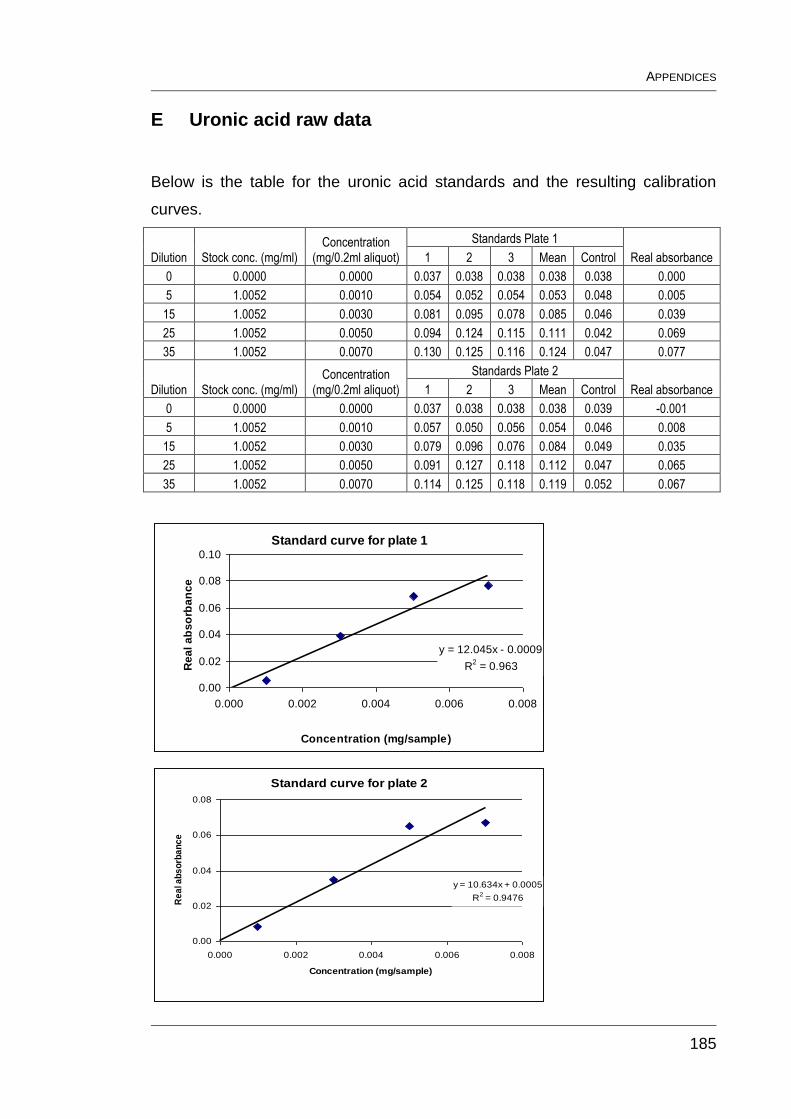
APPENDICES
185
E Uronic acid raw data
Below is the table for the uronic acid standards and the resulting calibration
curves.
Dilution Stock conc. (mg/ml) Concentration
(mg/0.2ml aliquot)
Standards Plate 1
Real absorbance 1 2 3 Mean Control
0 0.0000 0.0000 0.037 0.038 0.038 0.038 0.038 0.000
5 1.0052 0.0010 0.054 0.052 0.054 0.053 0.048 0.005
15 1.0052 0.0030 0.081 0.095 0.078 0.085 0.046 0.039
25 1.0052 0.0050 0.094 0.124 0.115 0.111 0.042 0.069
35 1.0052 0.0070 0.130 0.125 0.116 0.124 0.047 0.077
Dilution Stock conc. (mg/ml) Concentration
(mg/0.2ml aliquot)
Standards Plate 2
Real absorbance 1 2 3 Mean Control
0 0.0000 0.0000 0.037 0.038 0.038 0.038 0.039 -0.001
5 1.0052 0.0010 0.057 0.050 0.056 0.054 0.046 0.008
15 1.0052 0.0030 0.079 0.096 0.076 0.084 0.049 0.035
25 1.0052 0.0050 0.091 0.127 0.118 0.112 0.047 0.065
35 1.0052 0.0070 0.114 0.125 0.118 0.119 0.052 0.067
Standard curve for plate 1
y = 12.045x - 0.0009
R2 = 0.963
0.00
0.02
0.04
0.06
0.08
0.10
0.000 0.002 0.004 0.006 0.008
Concentration (mg/sample)
Re
al
ab
so
rba
nc
e
Standard curve for plate 2
y = 10.634x + 0.0005
R2 = 0.9476
0.00
0.02
0.04
0.06
0.08
0.000 0.002 0.004 0.006 0.008
Concentration (mg/sample)
Re
al a
bs
orb
an
ce
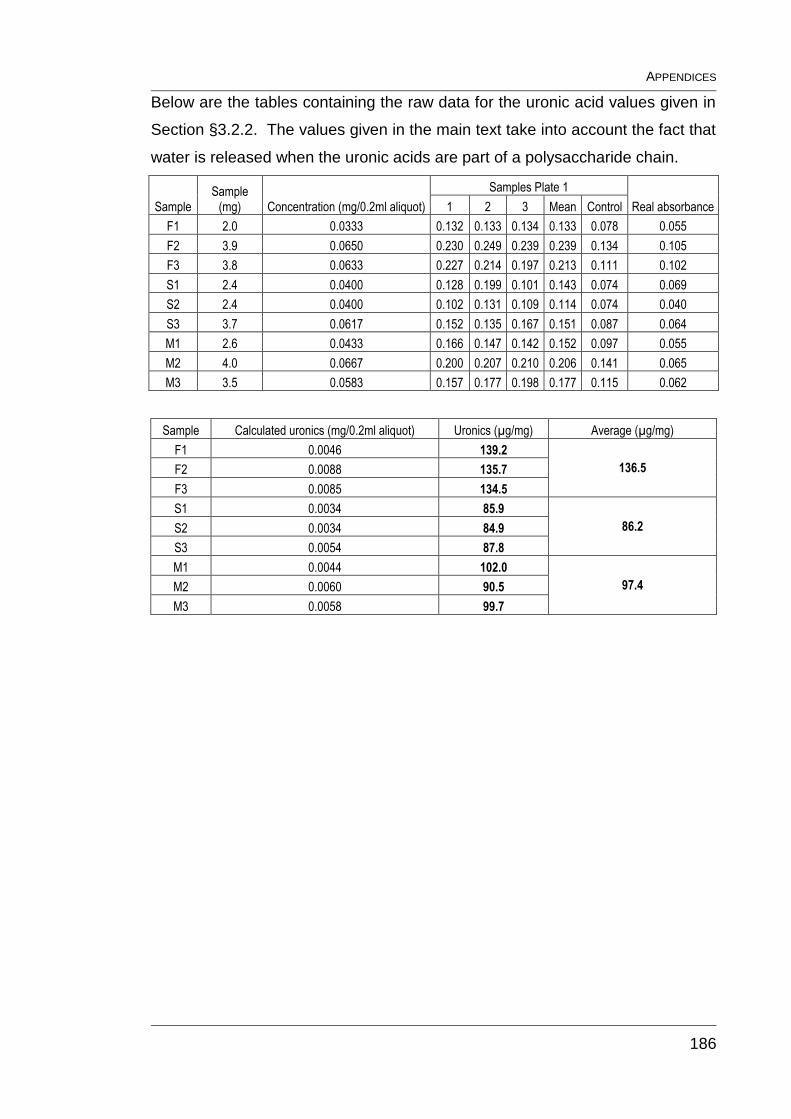
APPENDICES
186
Below are the tables containing the raw data for the uronic acid values given in
Section §3.2.2. The values given in the main text take into account the fact that
water is released when the uronic acids are part of a polysaccharide chain.
Sample Sample
(mg) Concentration (mg/0.2ml aliquot)
Samples Plate 1
Real absorbance 1 2 3 Mean Control
F1 2.0 0.0333 0.132 0.133 0.134 0.133 0.078 0.055
F2 3.9 0.0650 0.230 0.249 0.239 0.239 0.134 0.105
F3 3.8 0.0633 0.227 0.214 0.197 0.213 0.111 0.102
S1 2.4 0.0400 0.128 0.199 0.101 0.143 0.074 0.069
S2 2.4 0.0400 0.102 0.131 0.109 0.114 0.074 0.040
S3 3.7 0.0617 0.152 0.135 0.167 0.151 0.087 0.064
M1 2.6 0.0433 0.166 0.147 0.142 0.152 0.097 0.055
M2 4.0 0.0667 0.200 0.207 0.210 0.206 0.141 0.065
M3 3.5 0.0583 0.157 0.177 0.198 0.177 0.115 0.062
Sample Calculated uronics (mg/0.2ml aliquot) Uronics (µg/mg) Average (µg/mg)
F1 0.0046 139.2
136.5 F2 0.0088 135.7
F3 0.0085 134.5
S1 0.0034 85.9
86.2 S2 0.0034 84.9
S3 0.0054 87.8
M1 0.0044 102.0
97.4 M2 0.0060 90.5
M3 0.0058 99.7
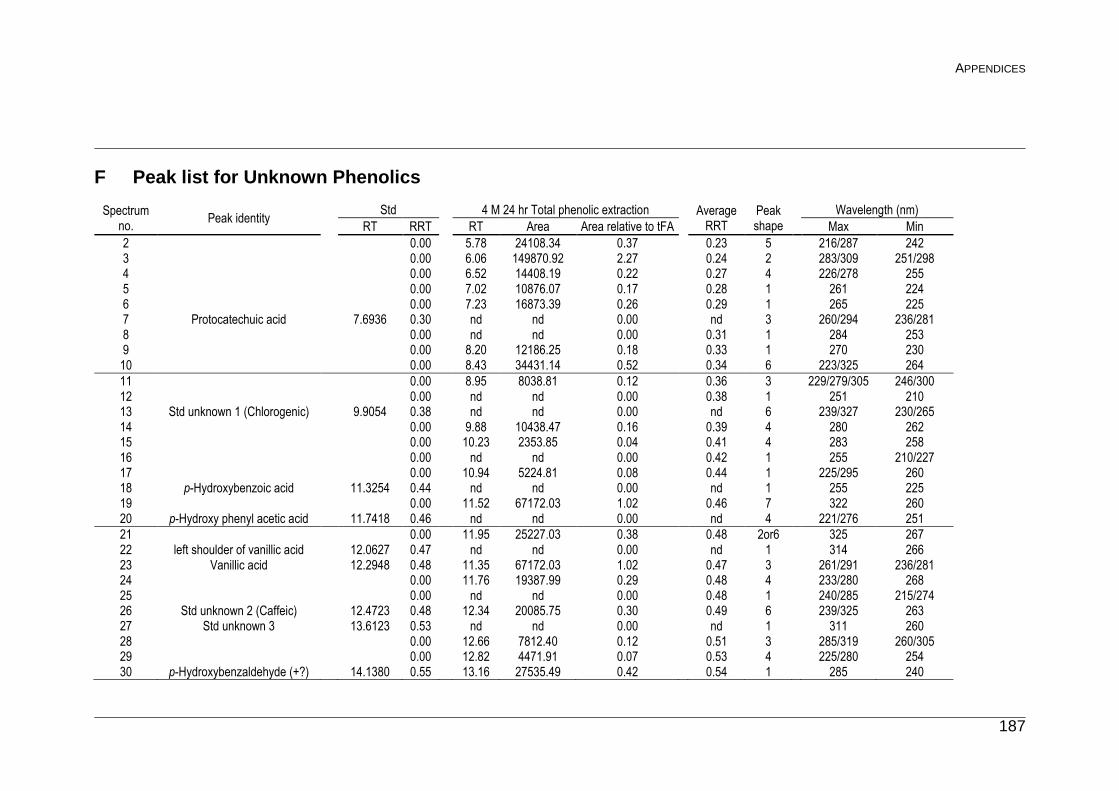
APPENDICES
187
F Peak list for Unknown Phenolics
Spectrum no.
Peak identity Std 4 M 24 hr Total phenolic extraction Average
RRT Peak shape
Wavelength (nm)
RT RRT RT Area Area relative to tFA Max Min
2 0.00 5.78 24108.34 0.37 0.23 5 216/287 242 3 0.00 6.06 149870.92 2.27 0.24 2 283/309 251/298 4 0.00 6.52 14408.19 0.22 0.27 4 226/278 255 5 0.00 7.02 10876.07 0.17 0.28 1 261 224 6 0.00 7.23 16873.39 0.26 0.29 1 265 225 7 Protocatechuic acid 7.6936 0.30 nd nd 0.00 nd 3 260/294 236/281 8 0.00 nd nd 0.00 0.31 1 284 253 9 0.00 8.20 12186.25 0.18 0.33 1 270 230
10 0.00 8.43 34431.14 0.52 0.34 6 223/325 264
11 0.00 8.95 8038.81 0.12 0.36 3 229/279/305 246/300 12 0.00 nd nd 0.00 0.38 1 251 210 13 Std unknown 1 (Chlorogenic) 9.9054 0.38 nd nd 0.00 nd 6 239/327 230/265 14 0.00 9.88 10438.47 0.16 0.39 4 280 262 15 0.00 10.23 2353.85 0.04 0.41 4 283 258 16 0.00 nd nd 0.00 0.42 1 255 210/227 17 0.00 10.94 5224.81 0.08 0.44 1 225/295 260 18 p-Hydroxybenzoic acid 11.3254 0.44 nd nd 0.00 nd 1 255 225 19 0.00 11.52 67172.03 1.02 0.46 7 322 260 20 p-Hydroxy phenyl acetic acid 11.7418 0.46 nd nd 0.00 nd 4 221/276 251
21 0.00 11.95 25227.03 0.38 0.48 2or6 325 267 22 left shoulder of vanillic acid 12.0627 0.47 nd nd 0.00 nd 1 314 266 23 Vanillic acid 12.2948 0.48 11.35 67172.03 1.02 0.47 3 261/291 236/281 24 0.00 11.76 19387.99 0.29 0.48 4 233/280 268 25 0.00 nd nd 0.00 0.48 1 240/285 215/274 26 Std unknown 2 (Caffeic) 12.4723 0.48 12.34 20085.75 0.30 0.49 6 239/325 263 27 Std unknown 3 13.6123 0.53 nd nd 0.00 nd 1 311 260 28 0.00 12.66 7812.40 0.12 0.51 3 285/319 260/305 29 0.00 12.82 4471.91 0.07 0.53 4 225/280 254 30 p-Hydroxybenzaldehyde (+?) 14.1380 0.55 13.16 27535.49 0.42 0.54 1 285 240
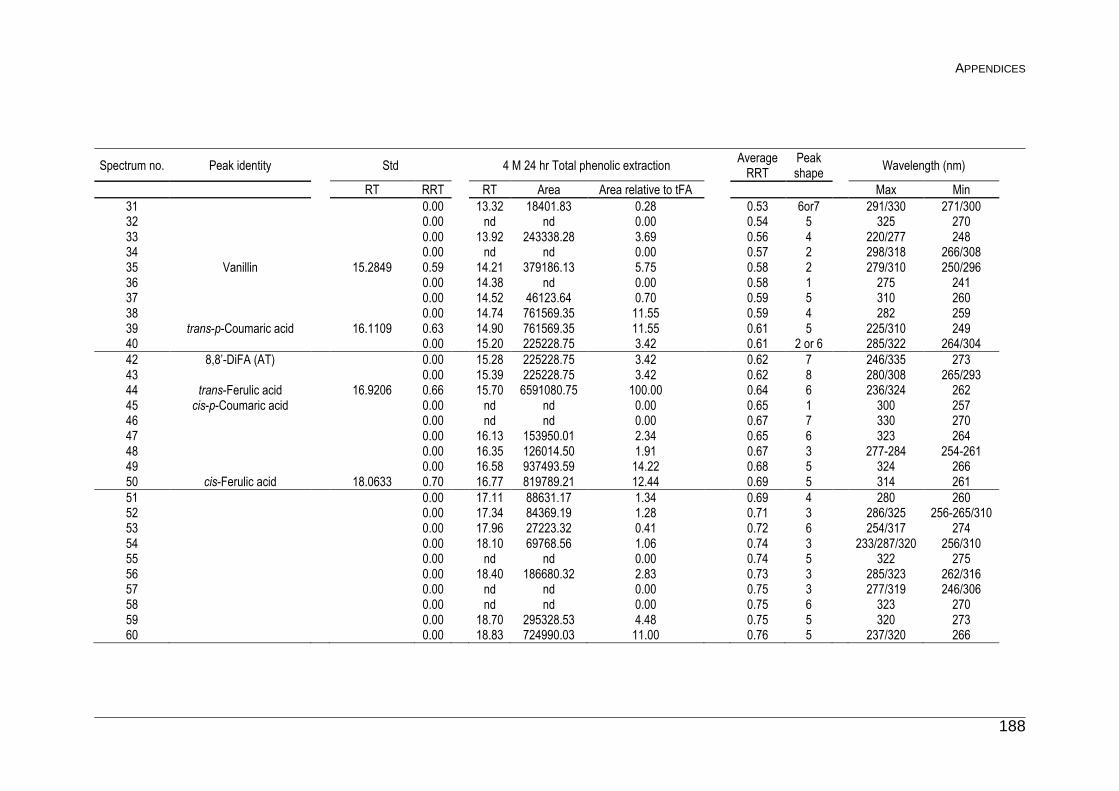
APPENDICES
188
Spectrum no. Peak identity Std 4 M 24 hr Total phenolic extraction Average
RRT Peak shape
Wavelength (nm)
RT RRT RT Area Area relative to tFA Max Min
31 0.00 13.32 18401.83 0.28 0.53 6or7 291/330 271/300 32 0.00 nd nd 0.00 0.54 5 325 270 33 0.00 13.92 243338.28 3.69 0.56 4 220/277 248 34 0.00 nd nd 0.00 0.57 2 298/318 266/308 35 Vanillin 15.2849 0.59 14.21 379186.13 5.75 0.58 2 279/310 250/296 36 0.00 14.38 nd 0.00 0.58 1 275 241 37 0.00 14.52 46123.64 0.70 0.59 5 310 260 38 0.00 14.74 761569.35 11.55 0.59 4 282 259 39 trans-p-Coumaric acid 16.1109 0.63 14.90 761569.35 11.55 0.61 5 225/310 249 40 0.00 15.20 225228.75 3.42 0.61 2 or 6 285/322 264/304
42 8,8’-DiFA (AT) 0.00 15.28 225228.75 3.42 0.62 7 246/335 273 43 0.00 15.39 225228.75 3.42 0.62 8 280/308 265/293 44 trans-Ferulic acid 16.9206 0.66 15.70 6591080.75 100.00 0.64 6 236/324 262 45 cis-p-Coumaric acid 0.00 nd nd 0.00 0.65 1 300 257 46 0.00 nd nd 0.00 0.67 7 330 270 47 0.00 16.13 153950.01 2.34 0.65 6 323 264 48 0.00 16.35 126014.50 1.91 0.67 3 277-284 254-261 49 0.00 16.58 937493.59 14.22 0.68 5 324 266 50 cis-Ferulic acid 18.0633 0.70 16.77 819789.21 12.44 0.69 5 314 261
51 0.00 17.11 88631.17 1.34 0.69 4 280 260 52 0.00 17.34 84369.19 1.28 0.71 3 286/325 256-265/310 53 0.00 17.96 27223.32 0.41 0.72 6 254/317 274 54 0.00 18.10 69768.56 1.06 0.74 3 233/287/320 256/310 55 0.00 nd nd 0.00 0.74 5 322 275 56 0.00 18.40 186680.32 2.83 0.73 3 285/323 262/316 57 0.00 nd nd 0.00 0.75 3 277/319 246/306 58 0.00 nd nd 0.00 0.75 6 323 270 59 0.00 18.70 295328.53 4.48 0.75 5 320 273 60 0.00 18.83 724990.03 11.00 0.76 5 237/320 266
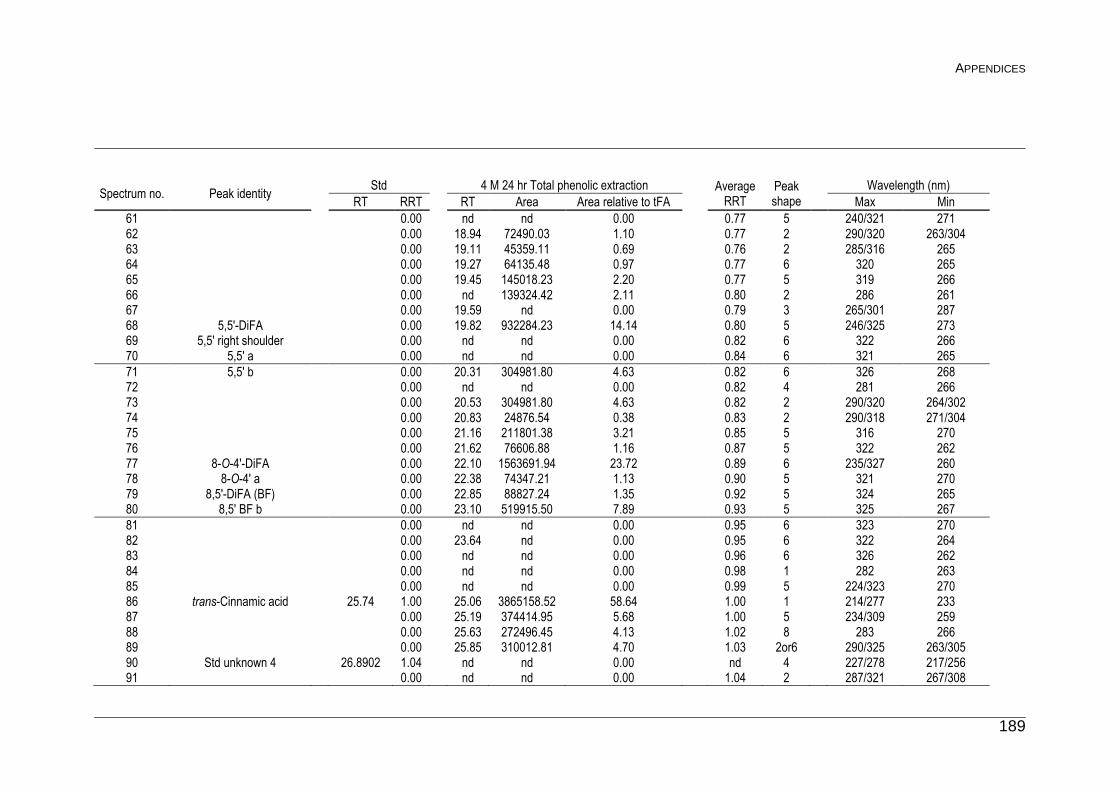
APPENDICES
189
Spectrum no. Peak identity Std 4 M 24 hr Total phenolic extraction Average
RRT Peak shape
Wavelength (nm)
RT RRT RT Area Area relative to tFA Max Min
61 0.00 nd nd 0.00 0.77 5 240/321 271 62 0.00 18.94 72490.03 1.10 0.77 2 290/320 263/304 63 0.00 19.11 45359.11 0.69 0.76 2 285/316 265 64 0.00 19.27 64135.48 0.97 0.77 6 320 265 65 0.00 19.45 145018.23 2.20 0.77 5 319 266 66 0.00 nd 139324.42 2.11 0.80 2 286 261 67 0.00 19.59 nd 0.00 0.79 3 265/301 287 68 5,5'-DiFA 0.00 19.82 932284.23 14.14 0.80 5 246/325 273 69 5,5' right shoulder 0.00 nd nd 0.00 0.82 6 322 266 70 5,5' a 0.00 nd nd 0.00 0.84 6 321 265
71 5,5' b 0.00 20.31 304981.80 4.63 0.82 6 326 268 72 0.00 nd nd 0.00 0.82 4 281 266 73 0.00 20.53 304981.80 4.63 0.82 2 290/320 264/302 74 0.00 20.83 24876.54 0.38 0.83 2 290/318 271/304 75 0.00 21.16 211801.38 3.21 0.85 5 316 270 76 0.00 21.62 76606.88 1.16 0.87 5 322 262 77 8-O-4'-DiFA 0.00 22.10 1563691.94 23.72 0.89 6 235/327 260 78 8-O-4' a 0.00 22.38 74347.21 1.13 0.90 5 321 270 79 8,5'-DiFA (BF) 0.00 22.85 88827.24 1.35 0.92 5 324 265 80 8,5' BF b 0.00 23.10 519915.50 7.89 0.93 5 325 267
81 0.00 nd nd 0.00 0.95 6 323 270 82 0.00 23.64 nd 0.00 0.95 6 322 264 83 0.00 nd nd 0.00 0.96 6 326 262 84 0.00 nd nd 0.00 0.98 1 282 263 85 0.00 nd nd 0.00 0.99 5 224/323 270 86 trans-Cinnamic acid 25.74 1.00 25.06 3865158.52 58.64 1.00 1 214/277 233 87 0.00 25.19 374414.95 5.68 1.00 5 234/309 259 88 0.00 25.63 272496.45 4.13 1.02 8 283 266 89 0.00 25.85 310012.81 4.70 1.03 2or6 290/325 263/305 90 Std unknown 4 26.8902 1.04 nd nd 0.00 nd 4 227/278 217/256 91 0.00 nd nd 0.00 1.04 2 287/321 267/308
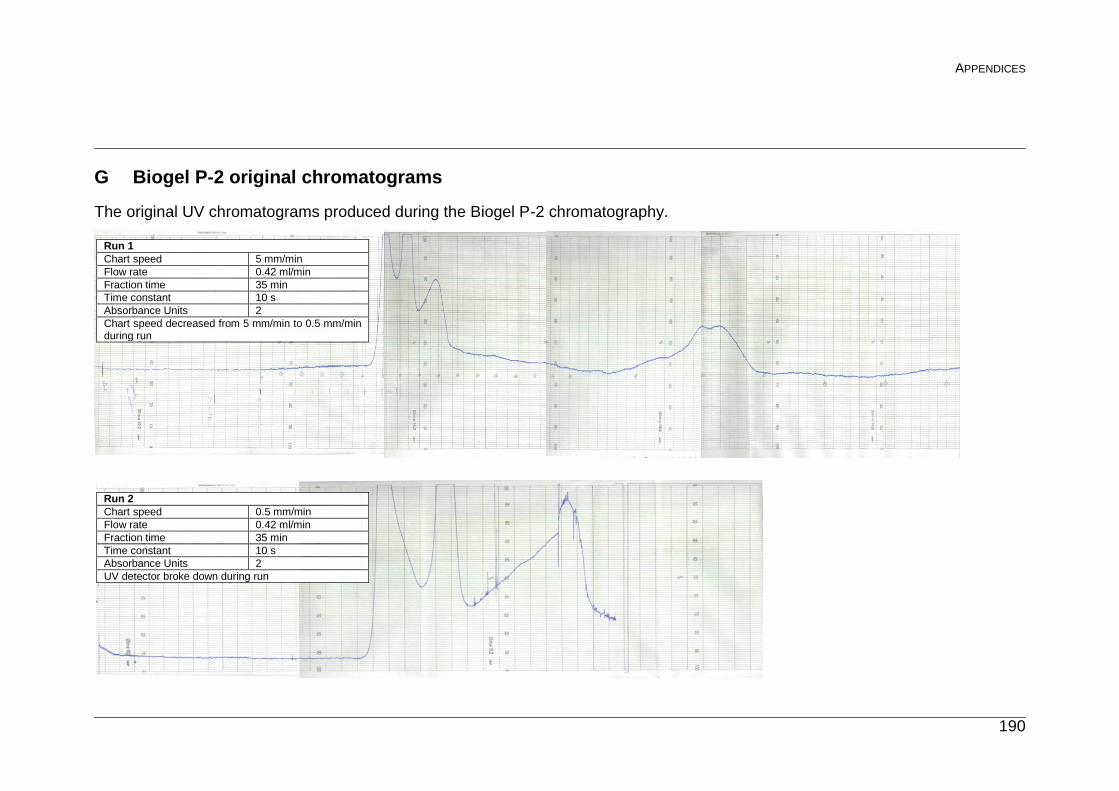
APPENDICES
190
G Biogel P-2 original chromatograms
The original UV chromatograms produced during the Biogel P-2 chromatography.
Run 1
Chart speed 5 mm/min
Flow rate 0.42 ml/min
Fraction time 35 min
Time constant 10 s
Absorbance Units 2
Chart speed decreased from 5 mm/min to 0.5 mm/min during run
Run 2
Chart speed 0.5 mm/min
Flow rate 0.42 ml/min
Fraction time 35 min
Time constant 10 s
Absorbance Units 2
UV detector broke down during run
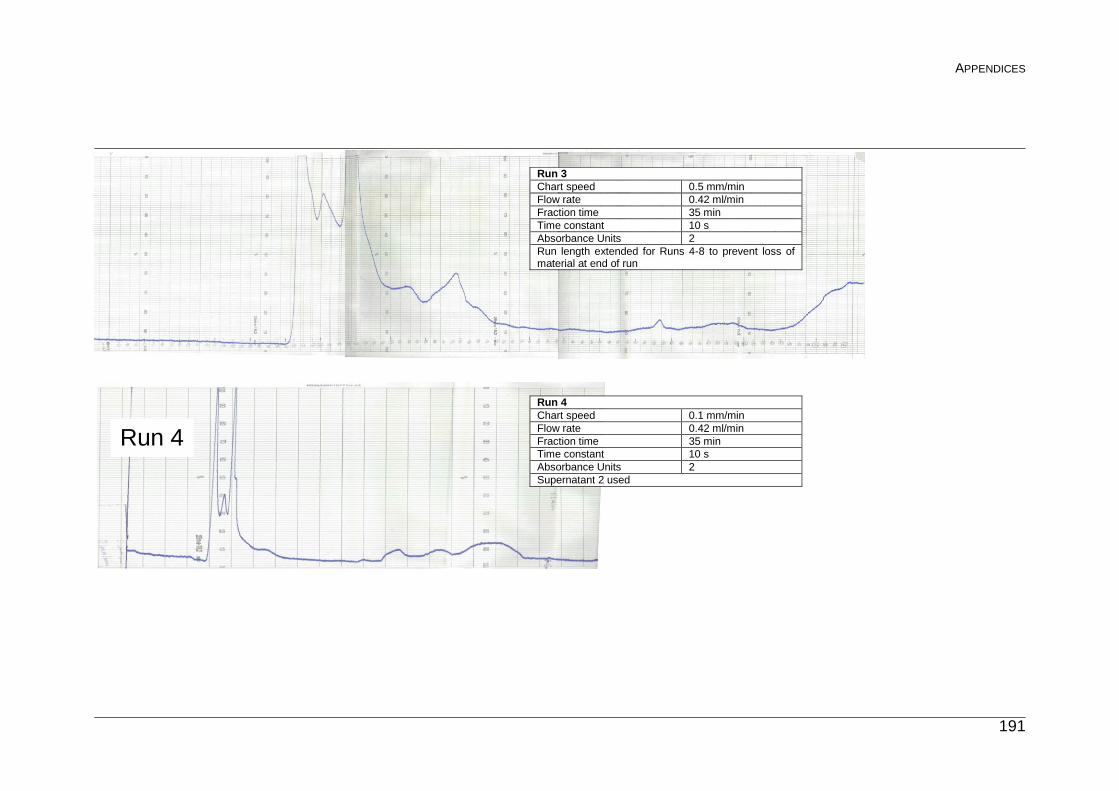
APPENDICES
191
Run 4
Run 3
Chart speed 0.5 mm/min
Flow rate 0.42 ml/min
Fraction time 35 min
Time constant 10 s
Absorbance Units 2
Run length extended for Runs 4-8 to prevent loss of material at end of run
Run 4
Chart speed 0.1 mm/min
Flow rate 0.42 ml/min
Fraction time 35 min
Time constant 10 s
Absorbance Units 2
Supernatant 2 used
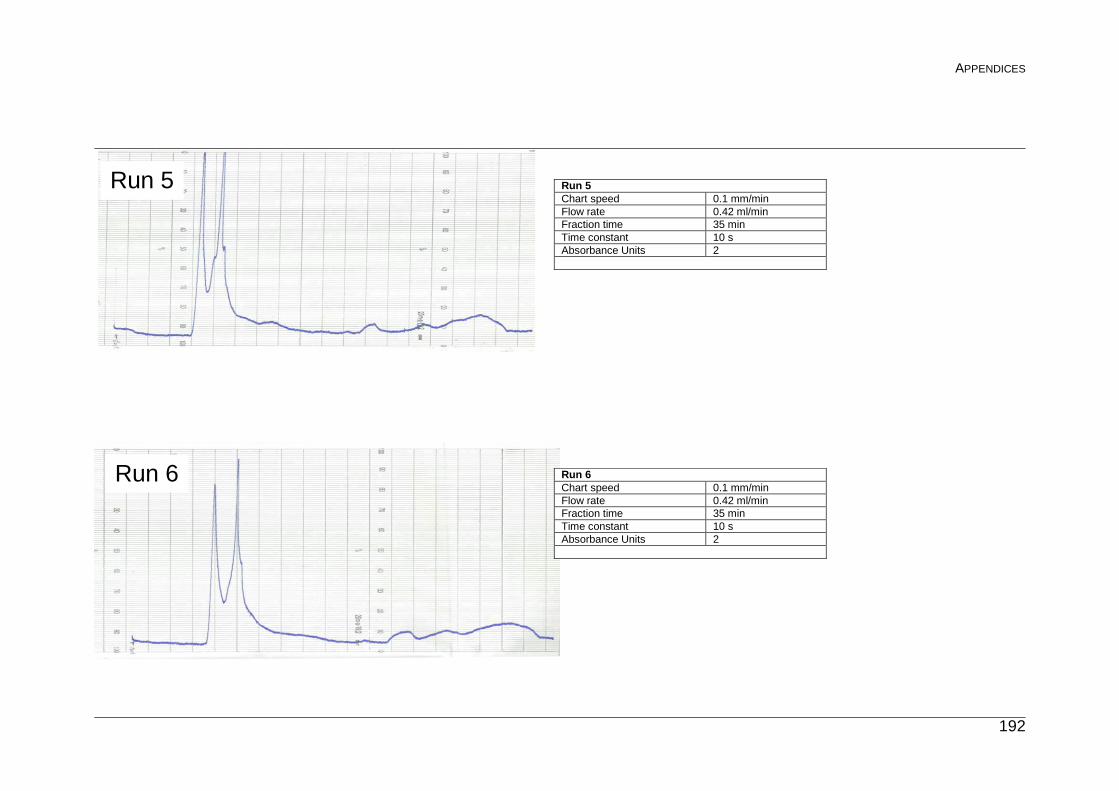
APPENDICES
192
Run 5
Run 6
Run 5
Chart speed 0.1 mm/min
Flow rate 0.42 ml/min
Fraction time 35 min
Time constant 10 s
Absorbance Units 2
Run 6
Chart speed 0.1 mm/min
Flow rate 0.42 ml/min
Fraction time 35 min
Time constant 10 s
Absorbance Units 2
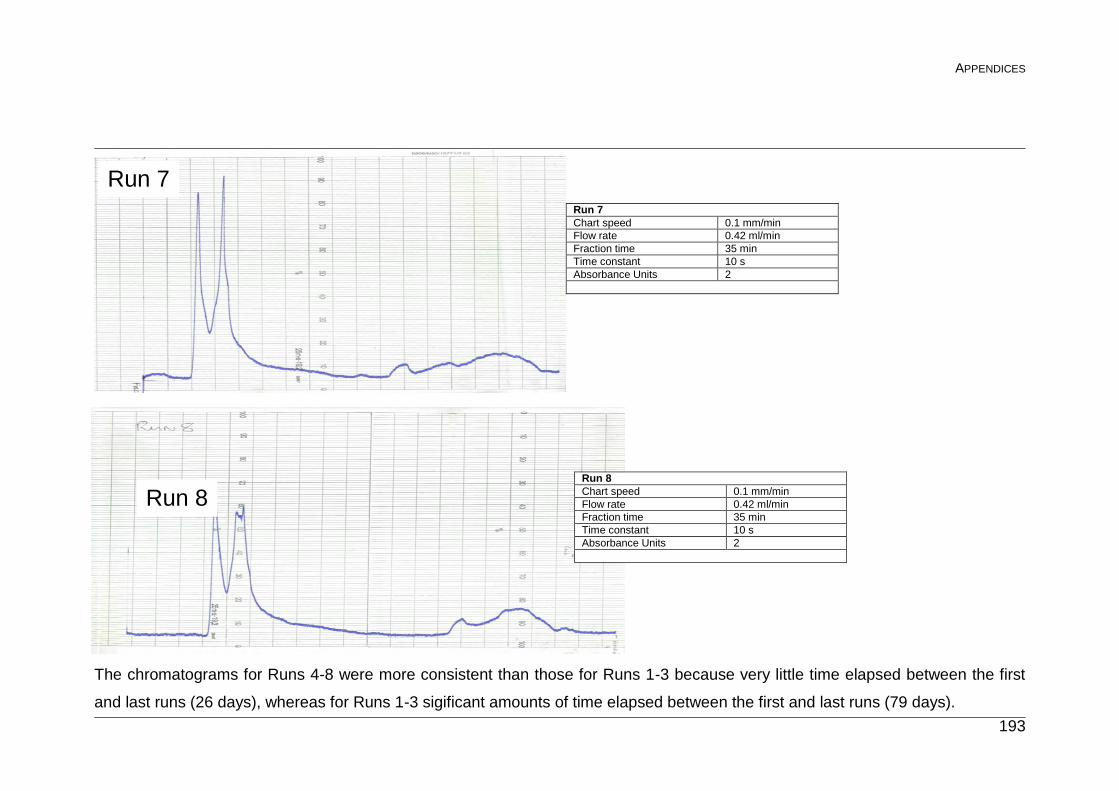
APPENDICES
193
The chromatograms for Runs 4-8 were more consistent than those for Runs 1-3 because very little time elapsed between the first
and last runs (26 days), whereas for Runs 1-3 sigificant amounts of time elapsed between the first and last runs (79 days).
Run 7
Run 8
Run 7
Chart speed 0.1 mm/min
Flow rate 0.42 ml/min
Fraction time 35 min
Time constant 10 s
Absorbance Units 2
Run 8
Chart speed 0.1 mm/min
Flow rate 0.42 ml/min
Fraction time 35 min
Time constant 10 s
Absorbance Units 2
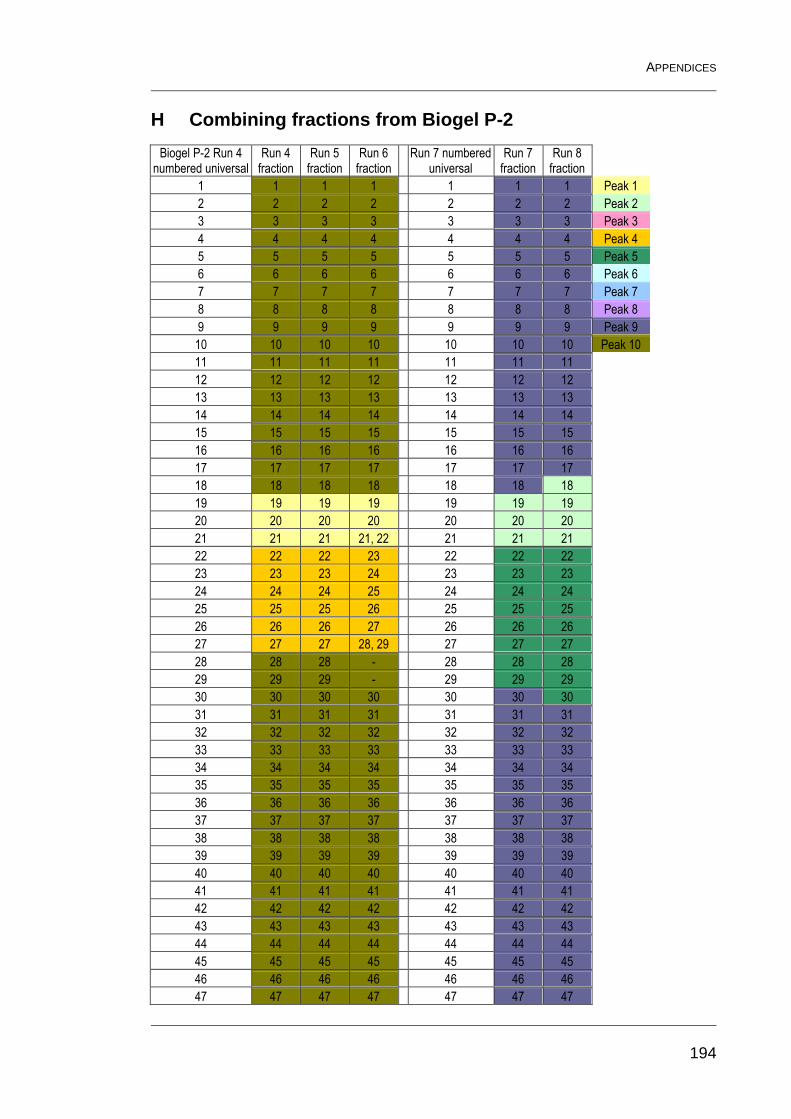
APPENDICES
194
H Combining fractions from Biogel P-2
Biogel P-2 Run 4 numbered universal
Run 4 fraction
Run 5 fraction
Run 6 fraction
Run 7 numbered universal
Run 7 fraction
Run 8 fraction
1 1 1 1 1 1 1 Peak 1
2 2 2 2 2 2 2 Peak 2
3 3 3 3 3 3 3 Peak 3
4 4 4 4 4 4 4 Peak 4
5 5 5 5 5 5 5 Peak 5
6 6 6 6 6 6 6 Peak 6
7 7 7 7 7 7 7 Peak 7
8 8 8 8 8 8 8 Peak 8
9 9 9 9 9 9 9 Peak 9
10 10 10 10 10 10 10 Peak 10
11 11 11 11 11 11 11
12 12 12 12 12 12 12
13 13 13 13 13 13 13
14 14 14 14 14 14 14
15 15 15 15 15 15 15
16 16 16 16 16 16 16
17 17 17 17 17 17 17
18 18 18 18 18 18 18
19 19 19 19 19 19 19
20 20 20 20 20 20 20
21 21 21 21, 22 21 21 21
22 22 22 23 22 22 22
23 23 23 24 23 23 23
24 24 24 25 24 24 24
25 25 25 26 25 25 25
26 26 26 27 26 26 26
27 27 27 28, 29 27 27 27
28 28 28 - 28 28 28
29 29 29 - 29 29 29
30 30 30 30 30 30 30
31 31 31 31 31 31 31
32 32 32 32 32 32 32
33 33 33 33 33 33 33
34 34 34 34 34 34 34
35 35 35 35 35 35 35
36 36 36 36 36 36 36
37 37 37 37 37 37 37
38 38 38 38 38 38 38
39 39 39 39 39 39 39
40 40 40 40 40 40 40
41 41 41 41 41 41 41
42 42 42 42 42 42 42
43 43 43 43 43 43 43
44 44 44 44 44 44 44
45 45 45 45 45 45 45
46 46 46 46 46 46 46
47 47 47 47 47 47 47
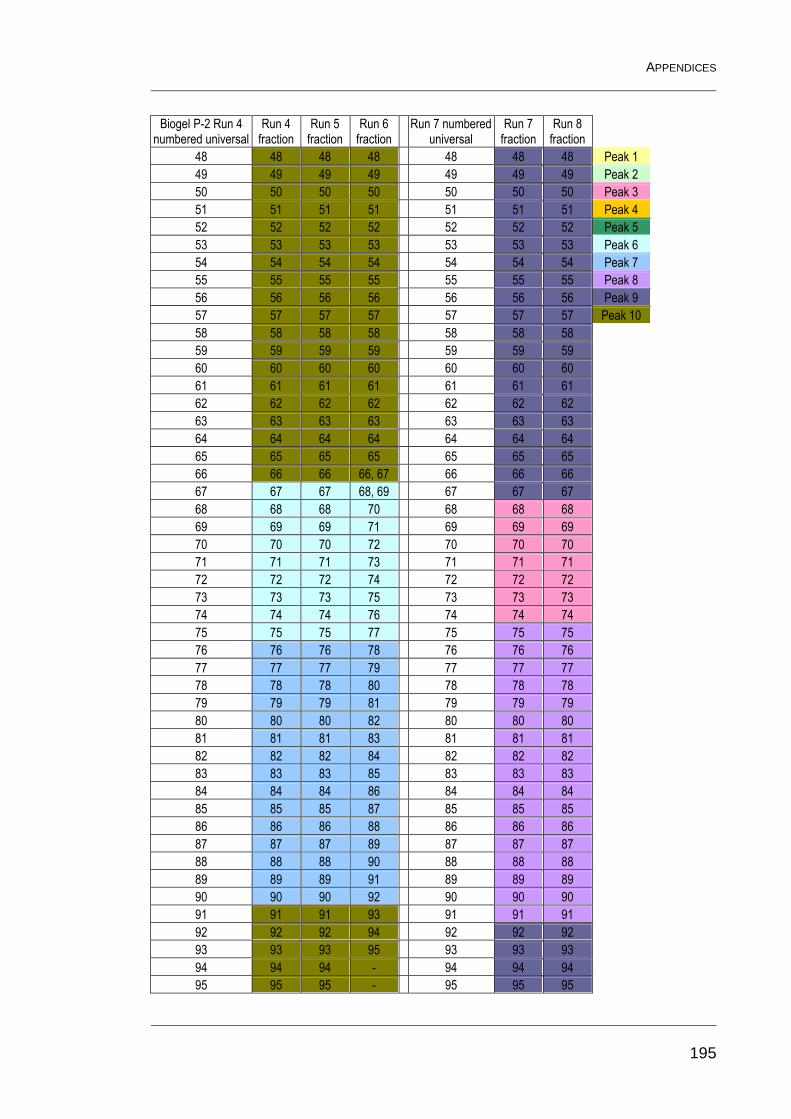
APPENDICES
195
Biogel P-2 Run 4 numbered universal
Run 4 fraction
Run 5 fraction
Run 6 fraction
Run 7 numbered universal
Run 7 fraction
Run 8 fraction
48 48 48 48 48 48 48 Peak 1
49 49 49 49 49 49 49 Peak 2
50 50 50 50 50 50 50 Peak 3
51 51 51 51 51 51 51 Peak 4
52 52 52 52 52 52 52 Peak 5
53 53 53 53 53 53 53 Peak 6
54 54 54 54 54 54 54 Peak 7
55 55 55 55 55 55 55 Peak 8
56 56 56 56 56 56 56 Peak 9
57 57 57 57 57 57 57 Peak 10
58 58 58 58 58 58 58
59 59 59 59 59 59 59
60 60 60 60 60 60 60
61 61 61 61 61 61 61
62 62 62 62 62 62 62
63 63 63 63 63 63 63
64 64 64 64 64 64 64
65 65 65 65 65 65 65
66 66 66 66, 67 66 66 66
67 67 67 68, 69 67 67 67
68 68 68 70 68 68 68
69 69 69 71 69 69 69
70 70 70 72 70 70 70
71 71 71 73 71 71 71
72 72 72 74 72 72 72
73 73 73 75 73 73 73
74 74 74 76 74 74 74
75 75 75 77 75 75 75
76 76 76 78 76 76 76
77 77 77 79 77 77 77
78 78 78 80 78 78 78
79 79 79 81 79 79 79
80 80 80 82 80 80 80
81 81 81 83 81 81 81
82 82 82 84 82 82 82
83 83 83 85 83 83 83
84 84 84 86 84 84 84
85 85 85 87 85 85 85
86 86 86 88 86 86 86
87 87 87 89 87 87 87
88 88 88 90 88 88 88
89 89 89 91 89 89 89
90 90 90 92 90 90 90
91 91 91 93 91 91 91
92 92 92 94 92 92 92
93 93 93 95 93 93 93
94 94 94 - 94 94 94
95 95 95 - 95 95 95
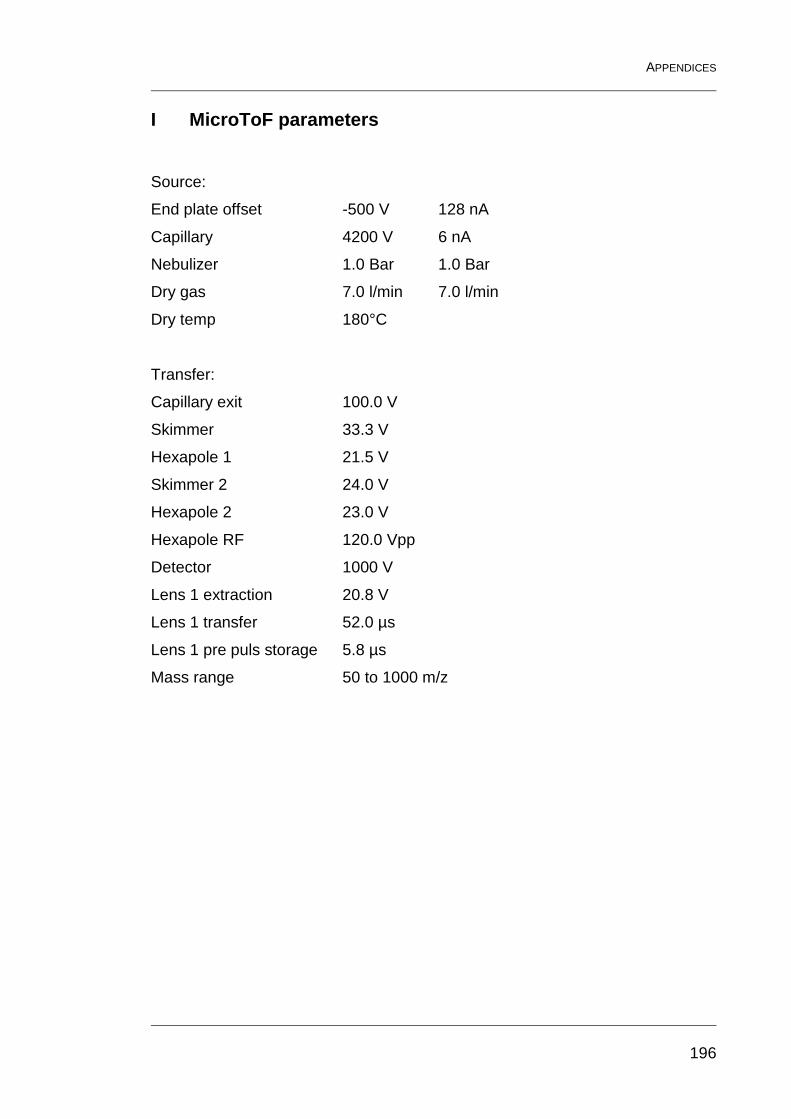
APPENDICES
196
I MicroToF parameters
Source:
End plate offset -500 V 128 nA
Capillary 4200 V 6 nA
Nebulizer 1.0 Bar 1.0 Bar
Dry gas 7.0 l/min 7.0 l/min
Dry temp 180°C
Transfer:
Capillary exit 100.0 V
Skimmer 33.3 V
Hexapole 1 21.5 V
Skimmer 2 24.0 V
Hexapole 2 23.0 V
Hexapole RF 120.0 Vpp
Detector 1000 V
Lens 1 extraction 20.8 V
Lens 1 transfer 52.0 µs
Lens 1 pre puls storage 5.8 µs
Mass range 50 to 1000 m/z
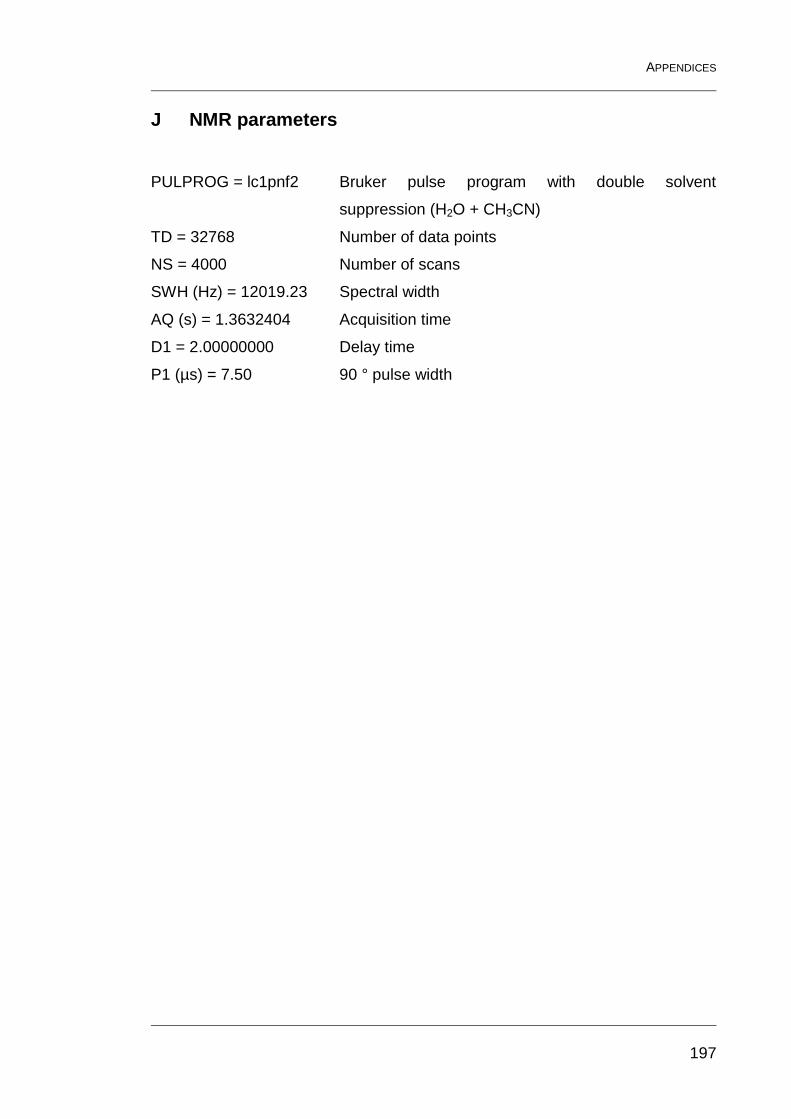
APPENDICES
197
J NMR parameters
PULPROG = lc1pnf2 Bruker pulse program with double solvent
suppression (H2O + CH3CN)
TD = 32768 Number of data points
NS = 4000 Number of scans
SWH (Hz) = 12019.23 Spectral width
AQ (s) = 1.3632404 Acquisition time
D1 = 2.00000000 Delay time
P1 (µs) = 7.50 90 ° pulse width
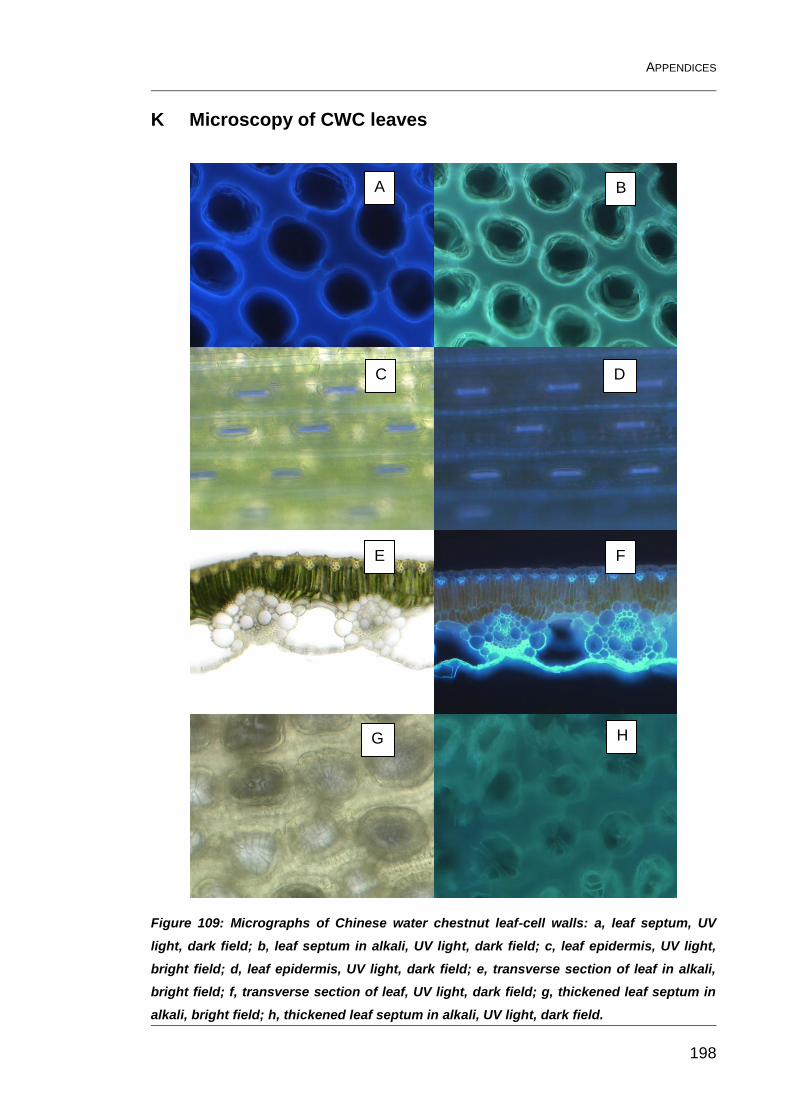
APPENDICES
198
K Microscopy of CWC leaves
Figure 109: Micrographs of Chinese water chestnut leaf-cell walls: a, leaf septum, UV
light, dark field; b, leaf septum in alkali, UV light, dark field; c, leaf epidermis, UV light,
bright field; d, leaf epidermis, UV light, dark field; e, transverse section of leaf in alkali,
bright field; f, transverse section of leaf, UV light, dark field; g, thickened leaf septum in
alkali, bright field; h, thickened leaf septum in alkali, UV light, dark field.
A B
C D
E F
G H
GLOSSARY
199
11 Glossary:
2-DOG: 2-Deoxyglucose
4-O-5’-DiFA: 4-O-5’ diferulic acid
5,5’-DiFA: 5,5’ diferulic acid
8,5’-DiFA: 8,5’ diferulic acid
8,5’-DiFA (BF): 8,5’ diferulic acid (benzofuran form)
8,5’-DiFA (DC): 8,5’ diferulic acid (decarboxylated form)
8,8’-DiFA: 8,8’ diferulic acid
8,8’-DiFA (AT): 8,5’ diferulic acid (aryltetralin form)
8,8’-DiFA (THF): 8,8’ diferulic acid (tetrahydrofuran form)
8-O-4’-DiFA: 8-O-4’ diferulic acid
ACN: Acetonitrile
Ara: Arabinose
CWC: Chinese water chestnut (Eleocharis dulcis)
CWM: Cell wall material
DiFA: Diferulic acid
ECWM: Epidermis cell wall material
EtOH: Ethanol
FAE: Feruloyl esterase
Fuc: Fucose
Gal: Galactose
GalA: Galacturonic acid
GC: Gas chromatography
Glc: Glucose
GlcA: Glucuronic acid
HPLC: High performance liquid chromatography
IDF: Insoluble dietary fibre
LC-MS: Liquid chromatography – mass spectrometry
Man: Mannose
MeOH: Methanol
MWCO: Molecular weight cut off
NMR: Nuclear magnetic resonance
GLOSSARY
200
PCWM: Parenchyma cell wall material
PDA: pH dependent autofluorescence
PGA: Polygalcturonan
PPCO: Polypropylene copolymer
Rha: Rhamnose
SECWM: Secondary epidermis cell wall material
t-: Terminal sugar residue
TetraFA: Tetraferulic acid
TriFA: Triferulic acid
Xyl: Xylose
REFERENCES
201
12 References:
Abdel-Aal, E-S M, Hucl, P, Sosulski, F W, Graf, R, Gillot, C, and Pietrzak, L.
(2001) Screening spring wheat for midge resistance in relation to ferulic
acid content. J Agr Food Chem 49:3559-3566.
Albersheim, P and Anderson, A J. (1971) Host-pathogen interactions. 3.
Proteins from plant cell walls inhibit polygalacturonases secreted by plant
pathogens. P Natl Acad Sci USA 68:1815-1819.
Allerdings, E, Ralph, J, Schatz, P F, Gniechwitz, D, Steinhart, H, and Bunzel, M.
(2005) Isolation and structural identification of diarabinosyl 8-O-4-
dehydrodiferulate from maize bran insoluble fibre. Phytochemistry
66:113-124.
Allerdings, E, Ralph, J, Steinhart, H, and Bunzel, M. (2006) Isolation and
structural identification of complex feruloylated heteroxylan side-chains
from maize bran. Phytochemistry 67:1276-1286.
Andreasen, M F, Kroon, P A, Williamson, G, and Garcia-Conesa, M-T. (2001a)
Esterase activity able to hydrolyze dietary antioxidant hydroxycinnamates
is distributed along the intestine of mammals. J Agr Food Chem 49:5679-
5684.
Andreasen, M F, Kroon, P A, Williamson, G, and Garcia-Conesa, M-T. (2001b)
Intestinal release and uptake of phenolic antioxidant diferulic acids. Free
Radical Bio Med 31:304-314.
Ardiansyah, Shirakawa, H, Koseki, T, Ohinata, K, Hashizume, K, and Komai, M.
(2006) Rice bran fractions improve blood pressure, lipid profile, and
glucose metabolism in stroke-prone spontaneously hypertensive rats. J
Agr Food Chem 54:1914-1920.
Baba, K, Sone, Y, Misaki, A, and Hayashi, T. (1994) Localization of xyloglucan
in the macromolecular complex composed of xyloglucan and cellulose in
pea stems. Plant Cell Physiol 35:439-444.
REFERENCES
202
Bidlack, J, Malone, M, and Benson, R. (1992) Molecular structure and
component integration of secondary cell walls in plants. Proc Okla Acad
Sci 72:51-56.
Blakeney, A B and Stone, B A. (1985) Methylation of carbohydrates with lithium
methylsulphinyl carbanion. Carbohyd Res 140:319-324.
Bonnin, E, Dolo, E, Le Goff, A, and Thibault, J-F. (2002) Characterisation of
pectin subunits released by an optimised combination of enzymes.
Carbohyd Res 337:1687-1696.
Borneman, W S, Hartley, R D, Himmelsbach, D S, and Ljungdahl, L G. (1990)
Assay for trans-para-coumaroyl esterase using a specific substrate from
plant-cell walls. Anal Biochem 190:129-133.
Bounias, M. (1980) N-(1-Naphthyl) ethylene diamine dihydrochloride as a new
reagent for nanomole quantification of sugars on thin-layer plates by a
mathematical calibration process. Anal Biochem 106:291-295.
Brecht, J K. (2004) Waterchestnut in Agriculture handbook number 66: The
commercial storage of fruits, vegetables, and florist and nursery stocks.
Gross, K C, Wang, C Y, and Saltveit, M (Eds.) USDA,
http://www.ba.ars.usda.gov/hb66/141waterchestnut.pdf
Brett, C T and Waldron, K W. (1996) Physiology and biochemistry of plant cell
walls. Chapman & Hall, London, UK. ISBN 0412580608
Bunzel, M, Ralph, J, Marita, J M, and Steinhart, H. (2000) Identification of 4-O-
5'-coupled diferulic acid from insoluble cereal fiber. J Agr Food Chem
48:3166-3169.
Bunzel, M, Allerdings, E, Sinwell, V, Ralph, J, and Steinhart, H. (2002) Cell wall
hydroxycinnamates in wild rice (Zizania aquatica L.) insoluble dietary
fibre. Eur Food Res Technol 214:482-488.
REFERENCES
203
Bunzel, M, Ralph, J, Funk, C, and Steinhart, H. (2003a) Isolation and
identification of a ferulic acid dehydrotrimer from saponified maize bran
insoluble fiber. Eur Food Res Technol 217:128-133.
Bunzel, M, Ralph, J, Kim, H, Lu, F, Ralph, S A, Marita, J M, Hatfield, R D, and
Steinhart, H. (2003b) Sinapate dehydrodimers and sinapate-ferulate
heterodimers in cereal dietary fiber. J Agr Food Chem 51:1427-1434.
Bunzel, M, Ralph, J, and Steinhart, H. (2004) Phenolic compounds as cross-
links of plant derived polysaccharides. Czech J Food Sci 22:64-67.
Bunzel, M, Ralph, J, Funk, C, and Steinhart, H. (2005) Structural elucidation of
new ferulic acid-containing phenolic dimers and trimers isolated from
maize bran. Tetrahedron Lett 46:5845-5850.
Bunzel, M, Ralph, J, Brüning, P, and Steinhart, H. (2006) Structural
identification of dehydrotriferulic and dehydrotetraferulic acids isolated
from insoluble maize fiber. J Agr Food Chem 54:6409-6418.
Bunzel, M, Allerdings, E, Ralph, J, and Steinhart, H. (2008) Cross-linking of
arabinoxylans via 8-8-coupled diferulates as demonstrated by isolation
and identification of diarabinosyl 8-8(cyclic)-dehydrodiferulate from maize
bran. J Cereal Sci 47:29-40.
Burk, D H and Ye, Z-H. (2002) Alteration of oriented deposition of cellulose
microfibrils by mutation of a katanin-like microtubule-severing protein.
The Plant Cell 14:2145-2160.
Carnachan, S M and Harris, P J. (2000) Ferulic acid is bound to the primary cell
walls of all gymnosperm families. Biochem Syst Ecol 28:865-879.
Carpita, N C and Gibeaut, D M. (1993) Structural models of primary-cell walls in
flowering plants - consistency of molecular-structure with the physical-
properties of the walls during growth. Plant Journal 3:1-30.
REFERENCES
204
Carpita, N C, Defernez, M, Findlay, K, Wells, B, Shoue, D A, Catchpole, G,
Wilson, R H, and McCann, M C. (2001) Cell wall architecture of the
elongating maize coleoptile. Plant Physiol 127:551-565.
Chesson, A, Provan, G J, Russell, W R, Scobbie, L, Richardson, A J, and
Stewart, C. (1999) Hydroxycinnamic acids in the digestive tract of
livestock and humans. J Sci Food Agr 79:373-378.
Choudhury, R, Srai, S K, Debnam, E, and Rice-Evans, C A. (1999) Urinary
excretion of hydroxycinnamates and flavonoids after oral and intravenous
administration. Free Radical Bio Med 27:278-286.
Christophoridou, S, Dais, P, Tseng, L-H, and Spraul, M. (2007) Separation and
identification of phenolic compounds in olive oil by coupling high-
performance liquid chromatography with postcolumn solid-phase
extraction to nuclear magnetic resonance spectroscopy (LC-SPE-NMR).
J Agr Food Chem 53:4667-4679.
Clausen, M H, Willats, W G T, and Knox, J P. (2003) Synthetic methyl
hexagalacturonate hapten inhibitors of antihomogalacturonan
monoclonal antibodies LM7, JIM5 and JIM7. Carbohyd Res 338:1797-
1800.
Clausen, M H, Ralet, M C, Willats, W G T, McCartney, L, Marcus, S E, Thibault,
J-F, and Knox, J P. (2004) A monoclonal antibody to feruloylated-(14)-
beta-D-galactan. Planta 219:1036-1041.
Cline, K and Albersheim, P. (1981) Host-pathogen interactions. 17. Hydrolysis
of biologically-active fungal glucans by enzymes isolated from soybean
cells. Plant Physiol 68:221-228.
Coimbra, M A, Rigby, N M, Selvendran, R R, and Waldron, K W. (1995)
Investigation of the occurrence of xylan-xyloglucan complexes in the cell
walls of olive pulp (Olea europaea). Carbohyd Polym 27:277-284.
REFERENCES
205
Colquhoun, I J, Ralet, M C, Thibault, J-F, Faulds, C B, and Williamson, G.
(1994) Structure identification of feruloylated oligosaccharides from
sugar-beet pulp by NMR spectroscopy. Carbohyd Res 263:243-256.
Cosgrove, D J. (1999) Enzymes and other agents that enhance cell wall
extensibility. Ann Rev Plant Physiol Plant Mol Biol 50:391-417.
Cosgrove, D J. (2001) Wall structure and wall loosening. A look backwards and
forwards. Plant Physiol 125:131-134.
Cosgrove, D J. (2005) Growth of the plant cell wall. Nature Reviews 6:850-860.
Crepin, V F, Faulds, C B, and Connerton, I F. (2004) Functional classification of
the microbial feruloyl esterases. Appl Microbiol Biot 63: 647652
Darvill, A G, McNeil, M, and Albersheim, P. (1978) Structure of plant cell walls.
VIII. A new pectic polysaccharide. Plant Physiol 62:418-422.
Darvill, A, McNeil, M, Albersheim, P, and Delmer, D. (1980) The plant cell in the
primary cell walls of flowering plants. In The Biochemistry of Plants: A
comprehensive treatise, Volume 1. Academic Press, New York, USA.
ISBN 0126754047
Deobald, L A and Crawford, D L. (1987) Activities of cellulase and other
extracellular enzymes during lignin solubilization by Streptomyces
viridosporus. Appl Microbiol Biot 26:158-163.
Dubois, M, Gilles, K A, Hamilton, J K, Rebers, P A, and Smith, F. (1956)
Colorimetric method for determination of sugars and related substances.
Anal Chem 28:350-356.
El Modafar, C and El Boustani, E. (2001) Cell wall-bound phenolic acid and
lignin contents in date palm as related to its resistance to Fusarium
oxysporum. Biol Plantarum 44:125-130.
Emons, A M C and Mulder, B M. (2000) How the deposition of cellulose
microfibrils builds cell wall architecture. Trends Plant Sci 5:35-40.
REFERENCES
206
Encina, A and Fry, S C. (2005) Oxidative coupling of a feruloyl-arabinoxylan
trisaccharide (FAXX) in the walls of living maize cells requires
endogenous hydrogen peroxide and is controlled by a low-Mr apoplastic
inhibitor. Planta 223:77-89.
Exarchou, V, Godejohann, M, van Beek, T A, Gerothanassis, I P, and Vervoort,
J. (2003) LC-UV-Solid-Phase-Extraction-NMR-MS combined with a
cryogenic flow probe and its application to the identification of
compounds present in Greek oregano. Anal Chem 75:6288-6294.
Faulds, C B and Williamson, G. (1995) Release of ferulic acid from wheat bran
by a ferulic acid esterase (FAE-III) from Aspergillus niger. Appl Microbiol
Biot 43:1082-1087.
Faulds, C B and Williamson, G. (1999) The role of hydroxycinnamates in the
plant cell wall. J Sci Food Agr 79:393-395.
Femenia, A, Rigby, N M, Selvendran, R R, and Waldron, K W. (1999a)
Investigation of the occurrence of pectic-xylan-xyloglucan complexes in
the cell walls of cauliflower stem tissues. Carbohyd Polym 39:151-164.
Femenia, A, Waldron, K W, Robertson, J A, and Selvendran, R R. (1999b)
Compositional and structural modification of the cell wall of cauliflower
(Brassica oleracea L var botrytis) during tissue development and plant
maturation. Carbohyd Polym 39:101-108.
Ferguson, L R, Fong Lim, I, Pearson, A E, Ralph, J, and Harris, P J. (2003)
Bacterial antimutagenesis by hydroxycinnamic acids from plant cell walls.
Mutat Res 542:49-58.
Fry, S C. (1979) Phenolic components of the primary cell wall and their possible
role in the hormonal regulation of growth. Planta 146:343-351.
Fry, S C. (1982) Phenolic components of the primary cell wall. Biochem J
203:493-504.
REFERENCES
207
Fry, S C. (1983) Feruloylated pectins from the primary cell wall: their structure
and possible functions. Planta 157:111-123.
Fry, S C. (1986) Cross-linking of matrix polymers in the growing cell walls of
angiosperms. Ann Rev Plant Physio 37:165-186.
Fry, S C. (1987) Intracellular feruloylation of pectic polysaccharides. Planta
171:205-211.
Fry, S C. (1988) The Growing Plant Cell Wall: Chemical and metabolic analysis.
Longman Scientific & Technical, Harlow, UK. ISBN 0582018978
Fry, S C. (2003) Primary cell wall metabolism: tracking the careers of wall
polymers in living plant cells. New Phytol 161:641-675.
Fry, S C, Willis, S C, and Paterson, A E J. (2000) Intraprotoplasmic and wall-
localised formation of arabinoxylan-bound diferulates and larger ferulate
coupling-products in maize cell-suspension cultures. Planta 211:679-692.
Funk, C, Ralph, J, Steinhart, H, and Bunzel, M. (2005) Isolation and structural
characterisation of 8-O-4/8-O-4- and 8-8/8-O-4-coupled dehydrotriferulic
acids from maize bran. Phytochemistry 66:363-371.
Funk, C, Braune, A, Grabber, J H, Steinhart, H, and Bunzel, M. (2007)
Moderate ferulate and diferulate levels do not impede maize cell wall
degradation by human intestinal microbiota. J Agr Food Chem 55:2418-
2423.
Garcia-Conesa, M-T, Plumb, G W, Waldron, K W, Ralph, J, and Williamson, G.
(1997) Ferulic acid dehydrodimers from wheat bran: isolation, purification
and antioxidant properties of 8-O-4-diferulic acid. Redox Rep 3:319-323.
Gardner, K H and Blackwell, J. (1974) Structure of native cellulose. Biopolymers
13:1975-2001.
Gardner, S L, Burrell, M M, and Fry, S C. (2002) Screening of Arabidopsis
thaliana stems for variation in cell wall polysaccharides. Phytochemistry
60:241-254.
REFERENCES
208
Geissman, T and Neukom, H. (1971) Vernetzung von Phenolcarbonsäure-
estern von Polysacchariden durch oxydative phenolische Kupplung. Helv
Chim Acta 54:1108-1112.
Grabber, J H, Hatfield, R D, and Ralph, J. (1996) Altering lignin-composition,
structure and cross-linking: Potential impact on cell wall degradation.
Abstr Pap Am Chem S 211:54.
Grabber, J H, Ralph, J, and Hatfield, R D. (2000) Cross-linking of maize walls
by ferulate dimerization and incorporation into lignin. J Agr Food Chem
48:6106-6113.
Gubler, F, Ashford, A E, Bacic, A, Blakeney, A B, and Stone, B A. (1985)
Release of ferulic acid esters from barley aleurone. II. Characterization of
the feruloyl compounds released in response to GA3. Aust J Plant
Physiol 12:307-317.
Guillon, F, Tranquet, O, Quillien, L, Utille, J P, Juan Ordaz Ortiz, J, and
Saulnier, L. (2004) Generation of polyclonal and monoclonal antibodies
against arabinoxylans and their use for immunocytochemical location of
arabinoxylans in cell walls of endosperm wheat. J Cereal Sci 40:167-182.
Gunawardena, A H L A, Greenwood, J S, and Dengler, N G. (2007) Cell wall
degradation and modification during programmed cell death in lace plant,
Aponogeton madagascariensis (Aponogetonaceae). Am J Bot 94:1116-
1128.
Hanley, A B, Russell, W R, and Chesson, A. (1993) Formation of substituted
truxillic and truxinic acids in plant cell walls-a rationale. Phytochemistry
33:957-960.
Harris, P J and Hartley, R D. (1980) Phenolic constituents of the cell walls of
monocotyledons. Biochem Syst Ecol 8:153-160.
Harris, P J, Henry, R J, Blakeney, A B, and Stone, B A. (1984) An improved
procedure for the methylation analysis of oligosaccharides and
polysaccharides. Carbohyd Res 127:59-73.
REFERENCES
209
Hartley, R D and Jones, E C. (1975) Effect of ultraviolet light on substituted
cinnamic acids and the estimation of their cis and trans isomers by gas
chromatography. J Chromatogr 107:213-218.
Hartley, R D and Jones, E C. (1976) Diferulic acid as a component of cell walls
of Lolium multiflorum. Phytochemistry 15:1157-1160.
Hartley, R D and Morrison, W H. (1991) Monomeric and dimeric phenolic acids
released from cell walls of grasses by sequential treatment with sodium
hydroxide. J Sci Food Agr 55:365-375.
Hatfield, R D and Ralph, J. (1999) Modelling the feasibility of intramolecular
dehydrodiferulate formation in grass walls. J Sci Food Agr 79:425-427.
Hoebler, C and Brillouet, J-M. (1984) Purification and properties of an endo-
(1→4)--D-xylanase from Irpex lacteus (Polyporus tulipiferae). Carbohyd
Res 128:141-155.
Huang, D, Ou, B, and Prior, R L. (2005) The chemistry behind antioxidant
capacity essays. J Agr Food Chem 53:1841-1856.
Iiyama, K, Lam, T B T, and Stone, B A. (1990) Phenolic acid bridges between
polysaccharides and lignin in wheat internodes. Phytochemistry 29:733-
737.
Iiyama, K, Lam, T B T, and Stone, B A. (1994) Covalent cross-links in the cell
wall. Plant Physiol 104:315-320.
Ishii, S. (1982) Enzymatic extraction and linkage analysis of pectic
polysaccharides from onion. Phytochemistry 21:778-780.
Ishii, T. (1991) Isolation and characterization of a diferuloyl arabinoxylan
hexasaccharide from bamboo shoot cell-walls. Carbohyd Res 219:15-22.
Ishii, T. (1997) Structure and functions of feruloylated polysaccharides. Plant
Sci 127:111-127.
REFERENCES
210
Ishii, T and Hiroi, T. (1990) Linkage of phenolic acids to cell-wall
polysaccharides of bamboo shoot. Carbohyd Res 206:297-310.
Ishii, T and Tobita, T. (1993) Structural characterization of feruloyl
oligosaccharides from spinach-leaf cell walls. Carbohyd Res 248:179-
190.
Ishii, T, Hiroi, T, and Thomas, J R. (1990) Feruloylated xyloglucan and p-
coumaroyl arabinoxylan oligosaccharides from bamboo shoot cell-walls.
Phytochemistry 29:1999-2003.
Jamet, E, Canut, H, Boudart, G, and Pont-Lezica, R F. (2006) Cell wall proteins:
a new insight through proteomics. Trends Plant Sci 11:33-39.
Jones, L, Seymour, G B, and Knox, J P. (1997) Localization of pectic galactan
in tomato cell walls using a monoclonal antibody specific to (1→4)-beta-
D-galactan. Plant Physiol 113:1405-1412.
Juge, N. (2006) Plant protein inhibitors of cell wall degrading enzymes. Trends
Plant Sci 11:359-367.
Kahnt, G. (1967) Trans-cis-equilibrium of hydroxycinnamic acids during
irradiation of aqueous solutions at different pH. Phytochemistry 6:755-
758.
Kanda, T, Nakakubo, S, Wakabayashi, K, and Nisizawa, K. (1978) Purification
and properties of an exo-cellulase of avicellulase type from a wood-
rotting fungus, Irpex lacteus (Polyporus tulipiferae). J Biochem-Tokyo
84:1217-1226.
Keegstra, K, Talmadge, K W, Bauer, W D, and Albersheim, P. (1973) Structure
of plant-cell walls. 3. Model of walls of suspension-cultured sycamore
cells based on interconnections of macromolecular components. Plant
Physiol 51:188-196.
Kern, S M, Bennett, R N, Needs, P W, Mellon, F A, Kroon, P A, and Garcia-
Conesa, M-T. (2003) Characterization of metabolites of
REFERENCES
211
hydroxycinnamates in the in vitro model of human small intestinal
epithelium caco-2 cells. J Agr Food Chem 51:7884-7891.
Kerr, E M and Fry, S C. (2004) Extracellular cross-linking of xylan and
xyloglucan in maize cell-suspension cultures: the role of oxidative
phenolic coupling. Planta 219:73-83.
Kirby, A R, Gunning, A P, Waldron, K W, Morris, V J, and Ng, A. (1996)
Visualization of plant cell walls by atomic force microscopy. Biophys J
70:1138-1143.
Klok, E J, Wilson, I W, Wilson, D, Chapman, S C, Ewing, R M, Somerville, S C,
Peacock, W J, Dolferus, R, and Dennis, E S. (2002) Expression profile
analysis of the low-oxygen response in Arabidopsis root cultures. The
Plant Cell 14:2481-2494.
Knox, J P, Linstead, P J, Peart, J, Cooper, C, and Roberts, K. (1991)
Developmentally regulated epitopes of cell-surface arabinogalactan
proteins and their relation to root-tissue pattern-formation. Plant J 1:317-
326.
Kremer, C, Pettolino, F, Bacic, A, and Drinnan, A. (2004) Distribution of cell wall
components in Sphagnum hyaline cells and in liverwort and hornwort
elators. Planta 219:1023-1035.
Kroon, P A, Faulds, C B, Ryden, P, Robertson, J A, and Williamson, G. (1997)
Release of covalently bound ferulic acid from fiber in the human colon. J
Agr Food Chem 45:661-667.
Lack, A J and Evans, D E. (2001) Plant Biology. BIOS Scientific Publishers Ltd,
Oxford, UK. ISBN 1859961975
Lamport, D T A, Epstein, L. (1983) A new model for the primary-cell wall based
on a concatenated extensin-cellulose network. In Current Topics in Plant
Biochemistry and Physiology, Volume 2. Randall, D D, Blevins, D G,
Larson, R L, Rapp, B J, (Eds). University of Missouri, Columbia, USA.
REFERENCES
212
Lattanzio, V, De Cicco, V, Di Venere, D, Lima, G, and Salerno, M. (1994)
Antifungal activity of phenolics against fungi commonly found
encountered during storage. Ital J Food Sci 6:23-30.
Lempereur, I, Rouau, X, and Abecassis, J. (1997) Genetic and agronomic
variation in arabinoxylan and ferulic acid contents of durum wheat
(Triticum durum L.) grain and its milling fractions. J Cereal Sci 25:103-
110.
Levigne, S, Thomas, M, Ralet, M C, Quéméner, B C, and Thibault, J-F. (2002)
Determination of the degrees of methylation and acetylation of pectins
using a C18 column and internal standards. Food Hydrocolloid 16:547-
550.
Levigne, S, Ralet, M C, Quéméner, B C, Pollet, B, Lapierre, C, and Thibault, J-
F. (2004a) Isolation from sugar beet cell walls of arabinan
oligosaccharides esterified by two ferulic acid monomers. Plant Physiol
134:1173-1180.
Levigne, S, Ralet, M C, Quéméner, B C, and Thibault, J-F. (2004b) Isolation of
diferulic bridges ester-linked to arabinan in sugar beet cell walls.
Carbohyd Res 339:2315-2319.
Liu, R H. (2004) Potential synergy of phytochemicals in cancer prevention:
mechanism of action. J Nutr 134:3479S-3485S.
Loh, J and Breene, W M. (1981) The thermal fracturability loss of edible plant-
tissue - pattern and within-species variation. J Texture Stud 12:456-471.
Lozovaya, V V, Gorshkova, T A, Yablokova, E V, Rumyantseva, N I, Valieva, A,
Ulanov, A, and Widholm, J M. (1999) Cold alkali can extract phenolic
acids that are ether linked to cell wall components in dicotyledonous
plants (buckwheat, soybean and flax). Phytochemistry 50:395-400.
MacAdam, J W and Grabber, J H. (2002) Relationship of growth cessation with
the formation of diferulate cross-links and p-coumaroylated lignins in tall
fescue leaf blades. Planta 215:785-793.
REFERENCES
213
MacCormick, C A, Harris, J E, Gunning, A P, and Morris, V J. (1993)
Characterization of a variant of the polysaccharide acetan produced by a
mutant of Acetobacter xylinum strain CR1/4. J Appl Bacteriol 74:196-199.
Mandalari, G, Faulds, C B, Sancho, A I, Saija, A, Bisignano, G, LoCurto, R, and
Waldron, K W. (2005) Fractionation and characterisation of
arabinoxylans from brewers' spent grain and wheat bran. J Cereal Sci
42:205-212.
Mankarios, A T, Hall, M A, Jarvis, M C, Threlfall, D R, and Friend, J. (1980) Cell
wall polysaccharides from onions. Phytochemistry 19:1731-1733.
Marry, M, Roberts, K, Jopson, S J, Huxham, I M, Jarvis, M C, Corsar, J,
Robertson, E, and McCann, M C. (2006) Cell-cell adhesion in fresh
sugar-beet root parenchyma requires both pectin esters and calcium
cross-links. Physiol Plantarum 126:243-256.
Massiot, P, Rouau, X, and Thibault, J-F. (1988) Isolation and characterisation of
the cell-wall fibres of carrot. Carbohyd Res 172:217-227.
Masuko, T, Minami, A, Iwasaki, N, Majima, T, Nishimura, S-I, and Lee, Y C.
(2005) Carbohydrate analysis by a phenol-sulfuric acid method in
microplate format. Anal Biochem 339:69-72.
May, C D. (1990) Industrial pectins: Sources, production and applications.
Carbohyd Polym 12:79-99.
May, C D. (2000) Pectins. In Handbook of Hydrocolloids. Phillips, G O and
Williams, P A (Eds.) Woodhead Publishing, Cambridge, UK. ISBN
1855735016
McCann, M C, Wells, B, and Roberts, K. (1990) Direct visualization of cross-
links in the primary plant cell wall. J Cell Sci 96:323-334.
McCann, M C, Wells, B, and Roberts, K. (1992) Complexity in the spatial
localization and length distribution of plant cell-wall matrix
polysaccharides. J Microsc-Oxford 166:123-136.
REFERENCES
214
McCartney, L and Knox, J P. (2002) Regulation of pectic polysaccharide
domains in relation to cell development and cell properties in the pea
testa. J Exp Bot 53:707-713.
McCartney, L, Marcus, S E, and Knox, J P. (2005) Monoclonal antibodies to
plant cell wall xylans and arabinoxylans. J Histochem Cytochem 53:543-
546.
McCleary, B V. (1979) Enzymic hydrolysis, fine structure, and gelling interaction
of legume-seed D-galacto-D-mannans. Carbohyd Res 71:205-230.
McDougall, G J and Fry, S C. (1988) Inhibition of auxin-stimulated growth of
pea stem segments by a specific nonasaccharide of xyloglucan. Planta
175:412-416.
McNeil, M, Albersheim, P, Taiz, L, and Jones, R L. (1975) The structure of plant
cell walls. VII. Barley aleurone cells. Plant Physiol 55:64-68.
McNeil, M, Darvill, A G, Fry, S C, and Albersheim, P. (1984) Structure and
function of the primary cell walls of plants. Anna Rev Biochem 53:625-
663.
Mellon, F A. (2000) Introduction to principles and practice of mass
spectrometry. In Mass Spectrometry of Natural Substances in Food.
RSC, Cambridge, UK. ISBN 0845045716.
Merali, Z, Mayer, M J, Parker, M L, Michael, A J, and Smith, A C. (2007)
Metabolic diversion of the phenylpropanoid pathway causes cell wall and
morphological changes in transgenic tobacco stems. Planta 225:1165-
1178
Micard, V, Grabber, J H, Ralph, J, Renard, C M G C, and Thibault, J-F. (1997a)
Dehydrodiferulic acids from sugar-beet pulp. Phytochemistry 44:1365-
1368.
REFERENCES
215
Micard, V, Renard, C M G C, Colquhoun, I J, and Thibault, J-F. (1997b) End-
products of enzymic saccharification of beet pulp, with a special attention
to feruloylated oligosaccharides. Carbohyd Polym 32:283-292.
Midmore, D. (1997) Chinese waterchestnut. The New Rural Industries: A
Handbook for Farmers and Investors. Available at:
http://www.rirdc.gov.au/pub/handbook/chinwchst.html.
Mort, A J and Lamport, D T A. (1977) Anhydrous hydrogen-fluoride
deglycosylates glycoproteins. Anal Biochem 82:289-309.
Mort, A J, Parker, S, and Kuo, M-S. (1983) Recovery of methylated saccharides
from methylation reaction mixtures using Sep-Pak C18 cartridges. Anal
Biochem 133:380-384.
Mudahar, G S and Jen, J J. (1991) Texture of raw and canned Jicama
(Pachyrhizus tuberosus) and Chinese water chestnut (Eleocharis dulcis).
J Food Sci 56:977-980.
Mueller-Harvey, I, Hartley, R D, Harris, P J, and Curzon, E H. (1986) Linkage of
p-coumaroyl and feruloyl groups to cell-wall polysaccharides of barley
straw. Carbohyd Res 148:71-85.
Myton, K E and Fry, S C. (1994) Intraprotoplasmic feruloylation of arabinoxylans
in Festuca arundinacea cell cultures. Planta 193:326-330.
Nergard, C S, Kiyohara, H, Reynolds, J C, Thomas-Oates, J E, Matsumoto, T,
Yamada, H, Patel, T, Petersen, D, Michaelsen, T E, Diallo, D, and
Paulsen, B S. (2006) Structures and structure-activity relationships of
three mitogenic and complement fixing pectic arabinogalactans from the
malian antiulcer plants Cochlospermum tinctorium A. Rich and Vernonia
kotschyana Sch. Bip. ex Walp. Biomacromolecules 7:71-79.
Ng, A, Parr, A J, Ingham, L M, Rigby, N M, and Waldron, K W. (1998) Cell wall
chemistry of carrots (Daucus carota cv. Amstrong) during maturation and
storage. J Agr Food Chem 46:2933-2939.
REFERENCES
216
Ng, A and Waldron, K W. (2004) Personal communication.
Nunes, F M and Coimbra, M A. (2001) Chemical characterization of the high
molecular weight material extracted with hot water from green and
roasted arabica coffee. J Agr Food Chem 49:1773-1782.
O'Neill, M A and York, W S. (2003) The composition and structure of plant
primary walls. In The Plant Cell Wall. Rose, J K C (Ed.) Blackwell,
Oxford, UK. ISBN 084932811X
Obel, N, Porchia, A C, and Scheller, H V. (2003) Intracellular feruloylation of
arabinoxylan in wheat: evidence for feruloyl-glucose as precursor. Planta
216:620-629.
Ogawa, K, Hayashi, T, and Okamura, K. (1990) Conformational analysis of
xyloglucans. Int J Biol Macromol 12:218-222.
Ojinnaka, C, Jay, A J, Colquhoun, I J, Brownsey, G J, Morris, E R, and Morris,
V J. (1996) Structure and conformation of acetan polysaccharide. Int J
Biol Macromol 19:149-156.
Ooms, J A B, van Gils, G J M, Duinkerken, A R, and Halmingh, O. (2000)
Development and validation of protocols for solid-phase extraction
coupled to LC and LC-MS. American Laboratory News 32:52-57.
Ou, S and Kwok, K C. (2004) Ferulic acid: pharmaceutical functions,
preparation and applications in food. J Sci Food Agr 84:1261-1269.
Oudgenoeg, G, Dirksen, E, Ingemann, S, Hilhorst, R, Gruppen, H, Boeriu, C G,
Piersma, S R, van Berkel, W J H, Laane, C, and Voragen, A G J. (2002)
Horseradish peroxidase-catalyzed oligomerization of ferulic acid on a
template of tyrosine-containing tripeptide. J Biol Chem 24:21332-21340.
Parker, C C. (2000) The (bio)chemistry of cell adhesion in edible plant tissues:
its role in texture. University of East Anglia, UK. PhD Thesis.
Parker, M L and Waldron, K W. (1995) Texture of Chinese water chestnut -
involvement of cell-wall phenolics. J Sci Food Agr 68:337-346.
REFERENCES
217
Parker, M L, Ng, A, Smith, A C, and Waldron, K W. (2000) Esterified phenolics
of the cell walls of chufa (Cyperus esculentus L.) tubers and their role in
texture. J Agr Food Chem 48:6284-6291.
Parker, C C, Parker, M L, Smith, A C, and Waldron, K W. (2001) Pectin
distribution at the surface of potato parenchyma cells in relation to cell-
cell adhesion. J Agr Food Chem 49:4364-4371.
Parker, C C, Parker, M L, Smith, A C, and Waldron, K W. (2003) Thermal
stability of texture in Chinese water chestnut may be dependent on 8,8'-
diferulic acid (aryltetralyn form). J Agr Food Chem 51:2034-2039.
Parr, A J, Waldron, K W, Ng, A, and Parker, M L. (1996) The wall-bound
phenolics of Chinese water chestnut (Eleocharis dulcis). J Sci Food Agr
71:501-507.
Parr, A J, Ng, A, and Waldron, K W. (1997) Ester-linked phenolic components
of carrot cell walls. J Agr Food Chem 45:2468-2471.
Pearce, G, Marchand, P A, Griswold, J, Lewis, N G, and Ryan, C A. (1998)
Accumulation of feruloyltyramine and p-coumaroyltyramine in tomato
leaves in response to wounding. Phytochemistry 47:659-664.
Phillipe, S, Tranquet, O, Utille, J-P, Saulnier, L, and Guillon, F. (2007)
Investigation of ferulate deposition in endosperm cell walls of mature and
developing wheat grains by using a polyclonal antibody. Planta
225:1287-1299.
Ralet, M C, Faulds, C B, Williamson, G, and Thibault, J-F. (1994a) Degradation
of feruloylated oligosaccharides from sugar-beet pulp and wheat bran by
ferulic acid esterases from Aspergillus niger. Carbohyd Res 263:257-
269.
Ralet, M C, Thibault, J-F, Faulds, C B, and Williamson, G. (1994b) Isolation and
purification of feruloylated oligosaccharides from cell-walls of sugar-beet
pulp. Carbohyd Res 263:227-241.
REFERENCES
218
Ralet, M C, André-Leroux, G, Quéméner, B C, and Thibault, J-F. (2005) Sugar
beet (Beta vulgaris) pectins are covalently cross-linked through diferulic
bridges in the cell wall. Phytochemistry 66:2800-2814.
Ralph, J, Helm, R F, and Quideau, S. (1992) Lignin-feruloyl ester cross-links in
grasses. Part 2. Model compound syntheses. J Chem Soc Perk T 1
2971-2980.
Ralph, J, Quideau, S, Grabber, J H, and Hatfield, R D. (1994) Identification and
synthesis of new ferulic acid dehydrodimers present in grass cell walls. J
Chem Soc Perk T 1 3485-3498.
Ralph, J, Hatfield, R D, Grabber, J H, Jung, H, Quideau, S, and Helm, R F.
(1996) Cell wall cross-linking in grasses: the importance of
understanding plant chemistry and biochemistry. USDFRC 1996
Informational conference with dairy and forage industries. Available at:
http://www.dfrc.wisc.edu:16080/Research_Summaries/ind_meet/dfrc1.pd
f.
Ralph, J, Bunzel, M, Marita, J M, Hatfield, R D, Lu, F, Kim, H, Grabber, J H,
Ralph, S A, Jiminez-Monteon, G, and Steinhart, H. (2000) Diferulates
analysis: new diferulates and disinapates in insoluble cereal fibre.
Polyphénols actualités 19:13-17.
Ralph, J, Bunzel, M, Marita, J M, Hatfield, R D, Lu, F, Kim, H, Schatz, P F,
Grabber, J H, and Steinhart, H. (2004) Peroxidase-dependent cross-
linking reactions of p-hydroxycinnamates in plant cell walls.
Phytochemistry Reviews 3:79-96.
Redgewell, R J and Selvendran, R R. (1986) Structural features of cell-wall
polysaccharides of onion Allium cepa. Carbohyd Res 157:183-199.
Renard, C M G C. (2005) Variability in cell wall preparations: quantification and
comparison of common methods. Carbohyd Polym 60:515-522.
REFERENCES
219
Renard, C M G C, Wende, G, and Booth, E J. (1999) Cell wall phenolics and
polysaccharides in different tissues of quinoa (Chenopodium quinoa
Willd). J Sci Food Agr 79:2029-2034.
Renger, A and Steinhart, H. (2000) Ferulic acid dehydrodimers as structural
elements in cereal dietary fibre. Eur Food Res Technol 211:422-428.
Robbins, R J. (2003) Phenolic acids in foods: An overview of analytical
methodology. J Agr Food Chem 51:2866-2887.
Roberts, K. (2001) How the cell wall acquired a cellular context. Plant Physiol
125:127-130.
Rodríguez-Arcos, R C, Smith, A C, and Waldron, K W. (2004) Ferulic acid
crosslinks in asparagus cell walls in relation to texture. J Agr Food Chem
52:4740-4750.
Rombouts, F M and Thibault, J-F. (1986) Enzymic and chemical degradation
and the fine structure of pectins from sugar-beet pulp. Carbohyd Res
154:189-203.
Rouau, X, Cheynier, V, Surget, A, Gloux, D, Barron, C, Meudec, E, Louis-
Montero, J, and Criton, M. (2003) A dehydrotrimer of ferulic acid from
maize bran. Phytochemistry 63:899-903.
Ryden, P and Selvendran, R R. (1990) Cell-wall polysaccharides and
glycoproteins of parenchymatous tissues of runner bean (Phaseolus
coccineus). Biochem J 269:393-402.
Samaj, J, Baluska, F, and Volkmann, D. (1998) Cell-specific expression of two
arabinogalactan protein epitopes recognized by monoclonal antibodies
JIM8 and JIM13 in maize roots. Protoplasma 204:1-12.
Saulnier, L, Vigouroux, J, and Thibault, J-F. (1995) Isolation and partial
characterisation of feruloylated oligosaccharides from maize bran.
Carbohyd Res 272:241-253.
REFERENCES
220
Saulnier, L, Crépeau, M J, Lahaye, M, Thibault, J-F, Garcia-Conesa, M-T,
Kroon, P A, and Williamson, G. (1999) Isolation and structural
determination of two 5,5'-diferuloyl oligosaccharides indicate that maize
heteroxylans are covalently cross-linked by oxidatively coupled ferulates.
Carbohyd Res 320:82-92.
Saulnier, L, Sado, P-E, Branland, G, Charmet, G, and Guillon, F. (2007) Wheat
arabinoxylans: Exploiting variation in amount and composition to develop
enhanced varieties. J Cereal Sci 46:261-281.
Sawardeker, J S, Sloneker, J H, and Jeanes, A. (1965) Quantitative
determination of monosaccharides as their alditol acetates by gas liquid
chromatography. Anal Chem 37:1602-1604.
Seigler, D S. (1998) Plant secondary metabolism. Kluwer Academic Publishers,
Dordrecht, The Netherlands. ISBN 0412019817
Selvendran, R R. (1991) Dietary fibre, chemistry and properties. In
Encyclopedia of Human Biology. Yelles, M (Ed.) Academic Press,
London, UK. ISBN 0122269802
Selvendran, R R and O'Neill, M A. (1987) Isolation and analysis of cell walls
from plant material. In Methods of Biochemical Analysis. Glick, D (Ed.)
John Wiley & Sons, Chichester, UK. ISBN 0471821950
Shahidi, F and Naczk, M. (2004) Phenolics in Food and Nutraceuticals. CRC
Press LLC, Boca Raton, FL, USA. ISBN 1587161389
Sheffield Hallam University, Faculty of Health and Wellbeing Biosciences
Division. (2004) Gas Chromatography. Available at:
http://teaching.shu.ac.uk/hwb/chemistry/tutorials/chrom/gaschrm.htm
Singleton, V L, Othofer, R, and Lamuela-Raventós, R M. (1998) Analysis of total
phenols and other oxidation substrates and antioxidants by means of
Folin-Ciocalteu reagent. Method Enzymol 299:152-178.
REFERENCES
221
Skoog, D A, West, D M, and Holler, F J. (1996) Fundamentals of Analytical
Chemistry. Harcourt College Publishers, Orlando, FL, USA. ISBN
0030059380
Smallwood, M, Beven, A, Donovan, N, Neill, S J, Peart, J, Roberts, K, and
Knox, J P. (1994) Localization of cell-wall proteins in relation to the
developmental anatomy of the carrot root apex. Plant J 5:237-246.
Smallwood, M, Martin, H, and Knox, J P. (1995) An epitope of rice threonine-
rich and hydroxyproline-rich glycoprotein is common to cell-wall and
hydrophobic plasma-membrane glycoproteins. Planta 196:510-522.
Smallwood, M, Yates, E A, Willats, W G T, Martin, H, and Knox, J P. (1996)
Immunochemical comparison of membrane-associated and secreted
arabinogalactan-proteins in rice and carrot. Planta 198:452-459.
Smith, B G and Harris, P J. (1995) Polysaccharide composition of unlignified
cell walls of pineapple [Ananas comosus (L.) Merr.] Fruit. Plant Physiol
107:1399-1409.
Smith, B G and Harris, P J. (2001) Ferulic acid is esterified to
glucuronoarabinoxylans in pineapple cell walls. Phytochemistry 56:513-
519.
Smith, M M and Hartley, R D. (1983) Occurrence and nature of ferulic acid
substitution of cell-wall polysaccharides in graminaceous plants.
Carbohyd Res 118:65-80.
Sridhar, R, Mohanty, S K, and Anjaneyulu, A. (1979) In vivo inactivation of rice
tungro virus by ferulic acid. Phytopathol Z 94:279-281.
Stacey, N J, Roberts, K, and Knox, J P. (1990) Patterns of expression of the
JIM4 arabinogalactan-protein epitope in cell-cultures and during somatic
embryogenesis in Daucus carota L. Planta 180:285-292.
Steffan, W, Kovac, P, Albersheim, P, Darvill, A G, and Hahn, M G. (1995)
Characterization of a monoclonal-antibody that recognizes an
REFERENCES
222
arabinosylated (1→6)-Beta-D-galactan epitope in plant-complex
carbohydrates. Carbohyd Res 275:295-307.
Stone, B A, Evans, N A, Bonig, I, and Clarke, A E. (1984) The application of
Sirofluor, a chemically defined fluorochrome from aniline blue for the
histochemical detection of callose. Protoplasma 122:191-195.
Sun, R-C, Sun, X-F, and Zhang, S-H. (2001) Quantitative determination of
hydroxycinnamic acids in wheat, rice, rye and barley straws, maize
stems, oil palm frond fiber, and fast-growing poplar wood. J Agr Food
Chem 49:5122-5129.
Sweet, D P, Shapiro, R H, and Albersheim, P. (1975) Quantitative analysis by
various g.l.c. response-factor theories for partially methylated and
partially ethylated alditol acetates. Carbohyd Res 40:217-225.
Tahiri, M, Pellerin, P, Tressol, J C, Doco, T, Pepin, D, Rayssiguier, Y, and
Coudray, C. (2000) The rhamnogalacturonan-II dimer decreases
intestinal absorption and tissue accumulation of lead in rats. J Nutr
130:249-253.
Tahiri, M, Tressol, J C, Doco, T, Rayssiguier, Y, and Coudray, C. (2002)
Chronic oral administration of rhamnogalacturonan-II dimer, a pectic
polysaccharide, failed to accelerate body lead detoxification after chronic
lead exposure in rats. Brit J Nutr 87:47-54.
Takeda, T, Furuta, Y, Awano, T, Mizuno, K, Mitsuishi, Y, and Hayashi, T. (2002)
Suppression and acceleration of cell elongation by integration of
xyloglucans in pea stem segments. Proc Natl Acad Sci USA 99:9055-
9060.
Talbott, L D and Ray, P W. (1982) Molecular size and separability features of
pea cell wall polysaccharides. Implication for models of primary wall
structure. Plant Physiol 98:357-368.
Talmadge, K W, Keegstra, K, Bauer, W D, and Albersheim, P. (1973) The
structure of plant cell walls: I. The macromolecular components of the
REFERENCES
223
walls of suspension-cultured sycamore cells with a detailed analysis of
the pectic polysaccharides. Plant Physiol 51:158-173.
Terpstra, A H M, Lapre, J A, de Vries, H T, and Beynen, A C. (2002) The
hypocholesterolemic effect of lemon peels, lemon pectin, and the waste
stream material of lemon peels in hybrid F1B hamsters. Eur J Nutr 41:19-
26.
Theander, O and Westerlund, E A. (1986) Studies on dietary fiber. 3. Improved
procedures for analysis of dietary fiber. J Agr Food Chem 34:330-336.
Thomas, M, Guillemin, F, Guillon, F, and Thibault, J-F. (2003) Pectins in the
fruits of Japanese Quince (Chaenomeles japonica). Carbohyd Polym
53:361-372.
Thompson, J E and Fry, S C. (2000) Evidence for covalent linkage between
xyloglucan and acidic pectins in suspension-cultured rose cells. Planta
211:275-286.
Topakas, E, Vafiadi, C, and Christakopoulos, P. (2007) Microbial production,
characterization and applications of feruloyl esterases. Process Biochem
42:497-509.
Tsumuraya, Y, Mochizucki, N, Hashimoto, Y, and Kovác, P. (2006) Purification
of an exo--(1→3)-D-galactanase of Irpex lacteus (Polyporus tulipiferae)
and its action on arabinogalactan-proteins. J Biol Chem 265:7207-7215.
Valent, B S and Albersheim, P. (1974) The structure of plant cell walls. V. On
the binding of gyloglucan to cellulose fibers. Plant Physiol 54:105-108.
Voragen, A G J, Pilnik, W, Thibault, J-F, Axelos, M A V, and Renard, C M G C.
(1995) Pectins. In Food Polysaccharides and Their Applications.
Stephen, A M (Ed.) Marcel Dekker, New York, USA. ISBN 0824793536
Waldron, K W and Faulds, C B. (2007) Cell wall polysaccharides: composition
and structure. In Introduction to Glycoscience / Synthesis of
Carbohydrates. Kamerling, J P, Boons, G-J, Lee, Y, Suzuki, A,
REFERENCES
224
Taniguchi, N, and Voragen, A G J (Eds.) Elsevier, Oxford, UK. ISBN
9780444527462
Waldron, K W and Selvendran, R R. (1992) Cell-wall changes in immature
asparagus stem tissue after excision. Phytochemistry 31:1931-1940.
Waldron, K W, Parr, A J, Ng, A, and Ralph, J. (1996) Cell wall esterified
phenolic dimers: Identification and quantification by reverse phase high
performance liquid chromatography and diode array detection.
Phytochem Analysis 7:305-312.
Waldron, K W, Smith, A C, Parr, A J, Ng, A, and Parker, M L. (1997) New
approaches to understanding and controlling cell separation in relation to
fruit and vegetable texture. Trends Food Sci Tech 8:213-221.
Wang, Y, Hollingsworth, R I, and Kasper, D L. (1998) Ozonolysis for selectively
depolymerizing polysaccharides containing -D-aldosidic linkages. Proc
Natl Acad Sci USA 95:6584-6589.
Wang, X, Kapoor, V, and Smythe, G A. (2003) Extraction and chromatography-
mass spectrometric analysis of the active principles from selected
Chinese herbs and other medicinal plants. Am J Chinese Med 31:927-
944.
Ward, G, Hadar, Y, Bilkis, I, Konstantinovsky, L, and Dosoretz, C G. (2001)
Initial steps of ferulic acid polymerization by lignin peroxidase. J Biol
Chem 276:18734-18741.
Weber, B, Hoesch, L, and Rast, D M. (1995) Protocatechualdehyde and other
phenols as cell-wall components of grapevine leaves. Phytochemistry
40:433-437.
Wende, G and Fry, S C. (1997) Digestion by fungal glycanases of
arabinoxylans with different feruloylated side-chains. Phytochemistry
45:1123-1129.
REFERENCES
225
Wende, G, Waldron, K W, Smith, A C, and Brett, C T. (1999) Developmental
changes in cell-wall ferulate and dehydrodiferulates in sugar beet.
Phytochemistry 52:819-827.
Wende, G, Waldron, K W, Smith, A C, and Brett, C T. (2000) Tissue-specific
developmental changes in cell-wall ferulate and dehydrodiferulates in
sugar beet. Phytochemistry 55:103-110.
Whitney, S E C, Brigham, J E, Darke, A H, Reid, J S G, and Gidley, M J. (1995)
In vitro assembly of cellulose/xyloglucan networks - ultrastructural and
molecular aspects. Plant J 8:491-504.
Willats, W G T, Marcus, S E, and Knox, J P. (1998) Generation of a monoclonal
antibody specific to (1→5)-alpha-L-arabinan. Carbohyd Res 308:149-
152.
Willats, W G T, Gilmartin, P M, Mikkelsen, J D, and Knox, J P. (1999) Cell wall
antibodies without immunization: generation and use of de-esterified
homogalacturonan block-specific antibodies from a naive phage display
library. Plant J 18:57-65.
Willats, W G T, Limberg, G, Buchholt, H C, van Alebeek, G J, Benen, J,
Christensen, T M I E, Visser, J, Voragen, A g J, Mikkelsen, J D, and
Knox, J P. (2000) Analysis of pectin structure part 2 - Analysis of pectic
epitopes recognised by hybridoma and phage display monoclonal
antibodies using defined oligosaccharides, polysaccharides, and
enzymatic degradation. Carbohyd Res 327:309-320.
Willats, W G T, McCartney, L, Steele-King, C G, Marcus, S E, Mort, A,
Huisman, M, van Alebeek, G J W M, Schols, H A, Voragen, A G J, Le
Goff, A, Bonnin, E, Thibault, J-F, and Knox, J P. (2004) A
xylogalacturonan epitope is specifically associated with plant cell
detachment. Planta 218:673-681.
Yates, E A, Valdor, J F, Haslam, S M, Morris, H R, Dell, A, Mackie, W, and
Knox, J P. (1996) Characterization of carbohydrate structural features
REFERENCES
226
recognized by anti-arabinogalactan-protein monoclonal antibodies.
Glycobiology 6:131-139.
Yu, K W, Kiyohara, H, Matsumoto, T, Yang, H C, and Yamada, H. (2001)
Characterization of pectic polysaccharides having intestinal immune
system modulating activity from rhizomes of Atractylodes lancea DC.
Carbohyd Polym 46:125-134.
Yui, T, Imada, K, Shibuya, N, and Ogawa, K. (1995) Conformation of an
arabinoxylan isolated from the rice endosperm cell wall by X-ray
diffraction and a conformational analysis. Biosci Biotechnol Biochem
59:965-968.