Embed Size (px)
Citation preview
Indian Journal of Plant Sciences ISSN: 2319–3824(Online)
An Open Access, Online International Journal Available at http://www.cibtech.org/jps.htm
2016 Vol.5 (1) January-March, pp.11-26/Rajbhar et al.
Research Article
© Copyright 2014 | Centre for Info Bio Technology (CIBTech) 11
COMPARATIVE ANALYSIS OF EXTRACTION AND ESTIMATION OF
TEA POLYPHENOLS, FLAVONOIDS AND ANTIOXIDANT IN
COMMERCIALLY AVAILABLE TEA POWDERS
*Karishma Rajbhar, Himanshu Dawda and Usha Mukundan
Plant Biotechnology Laboratory, Ramniranjan Jhunjhunwala College, Ghatkopar, Mumbai 400086,
India
Author for Correspondence
ABSTRACT
Particle size, heating time and heating method are important factors affecting the yield of an extraction
process. This study aims to determine the total concentrations of phenolic compounds and flavonoids as
well as their antioxidant activity in 37 samples (12 loose and 25 commercial branded tea powders) by
different extraction methods. Our results show that among the different extraction methods used for
polyphenols and flavonoids, the microwave assisted extraction (MAE) method gives the best results. In 1
min, MAE shows significantly higher extraction than water-bath extraction for 15 min, ultrasound-
assisted extraction for 15 min and brewing extraction for 5 min. Microwave extraction shows high
efficiency in extraction while using a minimum amount of solvent, shorter extraction time, ease of
maintenance of extraction vessels and the enhancement of recovery and repeatability. During the study
we found that extraction of polyphenols and flavonoids from the tea powder has two important limiting
factors which affect its estimation namely, the particle size and the time for which heat is supplied. Tea
powder samples were divided into five classes A, B, C, D and E using different Indian standard sieve
meshes (4mm, 2mm, 1mm and 0.5mm) to vary particle size. The duration and method of supplying heat
were varied. It was generally found that greater the surface area more is the extractability. In case of tea
powder, however, the processes by which the tea sample have been prepared is also significantly affects
the extraction.
Keywords: Tea, Type of Extraction, Polyphenols, Flavonoids, Antioxidant Activity, Particle Size and
Heating Time
INTRODUCTION
Tea, the second most popular beverage after water, is known for its variety of flavours and aromas. It is
prepared from the apical leaves and buds of Camellia sinensis (L.) Kuntze. Tea infusion is widely used as
a medicine by tribal people throughout India and China. It is also extensively used in various indigenous
system of medicine like Ayurveda (Parmar et al., 2012).
Different types of teas, produced using various processes, are known all over the world. Six types of teas
that are most widely known are black (regular), green, yellow, white, oolong and reprocessed tea. The
processing of the six types of teas depends on the physical and biological characteristics of young tea
shoots (Ruan, 2005).
Importance of Polyphenols in Food
Polyphenols, predominantly flavonoids and phenolic acids, that are present in tea in large quantities act as
micronutrients in our diet and contribute significantly to the flavour and health-enhancing properties.
Their importance in the prevention of degenerative diseases is rapidly gaining importance. Plant
polyphenols comprise a great variety of compounds, among which flavonoids and several classes of non-
flavonoids are usually distinguished.
Dietary polyphenols show an enormous assortment of structures, ranging from simple molecules
(monomers and oligomers) to polymers (Lung et al., 2013).
Plant phenolics are increasingly being shown to retard the oxidative degradation of lipids and thereby
improve the quality and nutritional value of food.
Indian Journal of Plant Sciences ISSN: 2319–3824(Online)
An Open Access, Online International Journal Available at http://www.cibtech.org/jps.htm
2016 Vol.5 (1) January-March, pp.11-26/Rajbhar et al.
Research Article
© Copyright 2014 | Centre for Info Bio Technology (CIBTech) 12
The most abundant dietary flavonol, quercetin, is a potent antioxidant because it has the required
structural features for free radical scavenging activity. The consumption of polyphenols may decrease the
occurrence of oxidative-stress related diseases such as cancer, cardiovascular diseases, and aging.
A majority of the antioxidant activity is due to the flavones, isoflavones, flavonoids, anthocyanins,
coumarins lignans, catechins and isocatechins. Antioxidant-based drug formulations are used for the
prevention and treatment of complex diseases like atherosclerosis, stroke, diabetes, Alzheimer’s disease
and cancer.
Flavonoids are known to inhibit or kill many bacterial strains, to inhibit important viral enzymes such as
reverse transcriptase, protease and also to destroy some pathogenic protozoans (El Gharras, 2009;
Manach et al., 2004 & Khalaf et al., 2008).
Different Methods of Extraction
Polyphenols (including aglycones, glycosides, and oligomers) naturally have a strong affinity for water
and tend to dissolve easily in water. They are extracted using water solvents depending on the solubility
of the target polyphenols (Khoddami et al., 2013).
The quality of tea mainly depends on the variety of leaf, growing environment, manufacturing conditions,
leaf appearance, method used for preparation of tea, size of ground tea leaves (tea powder particles) and
infusion preparation.
The quality is determined by liquor brightness, briskness, colour, aroma and flavour. The production of a
majority of branded teas involves the blending of many varieties of tea to maintain quantity, particle size
and the consistency of flavour. Changes in processing variables like, substrates, solutes, time,
temperature, etc. may affect the polyphenols, flavonoids and antioxidant extraction efficiency in plant
(Seetohul et al., 2006).
Most of the current analysis protocols use classic extraction techniques, among which maceration,
Soxhlet and refluxing extractions are the most commonly used. Due to the disadvantages that these
techniques present, there is a need to replace them with other techniques that require less reagents, energy
and time, while exhibiting similar efficiency.
Consequently, techniques such as microwave-assisted extraction (MAE), ultrasound assisted extraction
(UAE) and conventional method of water bath assisted extraction (WAE) and brewing assisted extraction
(BAE) have been implemented (Lung et al., 2013).
MATERIALS AND METHODS
Considering that tea products have different ages and shelf lives, and that specific leaf selection and
processes could differ, the products selected for the study were representatives of commercially available
black and green teas.
A total of 37 tea samples of which 12 were loose tea powder samples while 25 were commercial branded
tea powder samples were used and are listed below (Table 1):
Types and Method of Decoction Preparation
A decoction was made using 0.05 g of tea powder suspended in 5 ml of distilled water prepared in
distilled water.
The material to liquor ratio was maintained at 1:100. Optical density (OD) of the reaction mixtures was
read on Jasco V-530 spectrophotometer.
Chemicals Used
Folin-Ciocalteau reagent, sodium carbonate (Na2CO3), sodium nirite (NaNO2), methanol, sodium
phosphate were obtained from Merck (India).
Gallic acid (monohydrate), rutin trihydrate and quercetin were obtained from HI-Media (India) and
catechin LR (hydrate) from Research-Lab Line Chemical Industries (India);
Ascorbic acid, aluminium chloride (AlCl3), sodium potassium tartarate tetrahydrate and ammonium
molybdate were obtained from LOBA chemie laboratory reagents and fine chemicals.
Indian Journal of Plant Sciences ISSN: 2319–3824(Online)
An Open Access, Online International Journal Available at http://www.cibtech.org/jps.htm
2016 Vol.5 (1) January-March, pp.11-26/Rajbhar et al.
Research Article
© Copyright 2014 | Centre for Info Bio Technology (CIBTech) 13
Table 1: List of Commercial Tea Powder Samples
No. Sample Name Sample Code
1 Girnar Kesari CBTP 1
2 Girnar pure n fresh 5 jumbo brands CBTP 2
3 Girnar royal CBTP 3
4 Golden Earl grey tea CBTP 4
5 Golden Nilgiri tea CBTP 5
6 Golden orange pekoe CBTP 6
7 Lipton Darjeeling tea CBTP 7
8 Lipton green tea CBTP 8
9 Lipton yellow label tea CBTP 9
10 Red label CBTP 10
11 Red label - natural care CBTP 11
12 Reliance premium royal blend tea CBTP 12
13 Reliance select leaf CBTP 13
14 Society tea CBTP 14
15 Taj mahal CBTP 15
16 Tata tea Agni CBTP 16
17 Tata tea -gold CBTP 17
18 Tetley ginger tea CBTP 18
19 Tetley green tea CBTP 19
20 Tulsi green organic tea CBTP 20
21 Twinings assam tea CBTP 21
22 Twinings Darjeeling tea CBTP 22
23 Waghbakri-perfect CBTP 23
24 Chado chamomile whole flower CBTP 24
25 Chado nilgiri CBTP 25
26 Assam CTC LTP 1
27 Darjeeling tea LTP 2
28 Golden CTC/D LTP 3
29 Golden O.P LTP 4
30 Green tea LTP 5
31 Kesari CTC LTP 6
32 Nilgiri CTC LTP 7
33 Royal DUST LTP 8
34 Special BOP LTP 9
35 Special CTC LTP 10
36 Special H. DUST LTP 11
37 Super CTC LTP 12
*It is a simple form of alphabetical nomenclature followed in both commercial and loose tea sample to
facilitate understanding and data tabulation.
Indian Journal of Plant Sciences ISSN: 2319–3824(Online)
An Open Access, Online International Journal Available at http://www.cibtech.org/jps.htm
2016 Vol.5 (1) January-March, pp.11-26/Rajbhar et al.
Research Article
© Copyright 2014 | Centre for Info Bio Technology (CIBTech) 14
Table 2: Method of Decoction Preparation
Type of extraction Instrument Method of Extraction
Brewing Assisted Extraction
(BAE) Electric Kettle
Boiled distilled water from tea kettle was poured on
the tea powder sample and was brewed for 5
minutes
Waterbath Assisted
Extraction (WAE)
Equitron
Waterbath
Tea powder with distilled water was kept in
waterbath for 15 minute at 80°C – 90°C
Microwave Assisted
Extraction (MAE)
LG Microwave
Oven (I- wave)
Tea powder with distilled water was microwaved for
1 minute
Ultrasonicator Assisted
Extraction (UAE) Ultrasonicator
Tea powder with distilled water was kept in
ultrasonicator for 15 min
Determination of Total Phenolic Content
The total phenolic content (TPC) of the tea extracts is determined using the method of Singleton et al.,
(1999) using with slight modifications Folin-Ciocalteau method i.e. in the ratio of 1:1 dilution with
distilled water. Test sample 0.1 ml, .0.8 ml distilled water for dilution; 0.1 ml Folin-ciocalteau (1:1)
reagent are mixed and allowed to stand for 5 min at 37ºC. After 5 min, 3.0 ml of 2% of sodium carbonate
is added. This mixture is incubated for 15 min in 80°C–90°C. After incubation the development of blue
colour is observed. The absorbance of blue colour in different samples is measured at 720 nm for gallic
acid equivalence and 745 nm for catechin equivalence using V-530 Jasco spectrophotometer. The
phenolic content is calculated as gallic acid equivalents GAE/g and CE/g on the basis of standard curve of
gallic acid and catechin. The quantity of polyphenol in 1 g of tea powder sample was calculated
(Singleton, 1999).
Determination of Total Flavonoids Content
The total flavonoids content of tea extract is estimated by slight modification method described
Aluminium chloride method by Zhishen et al. for quercetin equivalents and aluminium chloride method
by Sultana et al. for rutin trihydrate equivalents. Sample 0.1 ml is diluted with methanol 0.9 ml; add 0.5
ml of sodium nitrite NaNO2 solution (10%).
After 5 min, 0.5 ml AlCl3 solution (10%) is added followed by 1.0 ml of NaOH solution (1%) to the
mixture. After incubation of 15 min the mixture is centrifuged at 2500 rpm and absorbance is read at 400
nm. Standard curve of quercetin is prepared and the result is expressed as quercetin equivalents (mg
quercetin/gm) (Sultana et al, 2012).
Rutin trihydrate equivalents are determined using sample 0.1 ml and the volume is made up to 2 ml with
methanol. Then 0.5 ml Na-K tartarate tetrahydrate (0.1 M) is added followed by incubation for 5 min after
which 0.5ml AlCl3 (10%), is added. After incubation of 15 min, the mixture is centrifuged at 2500 rpm
and the absorbance is read at 400 nm. The concentration of flavonoid in the test samples is calculated
from the calibration plot and expressed as mg rutin trihydrate equivalent/g of sample (Khatiwora et al.,
2010).
Total Antioxidant Capacity Assay
The total antioxidant capacities of tea extracts are evaluated by the phosphomolybdenum method,
described by Prieto et al., with some modifications. The sample (0.1ml) is diluted with methanol (0.9 ml)
is combined with reagent solution (0.5 ml of 0.6 M sulphuric acid) followed by incubation for 5 min, the
addition of 4 mM ammonium molybdate (0.6 ml), incubation for 5 min, addition of 28 mM sodium
phosphate (0.9 ml) and incubation for 15 min at 80°C–90°C. After cooling the mixture to room
temperature, the absorbance is measured at 740 nm. The antioxidant capacity of the sample is expressed
as equivalents of ascorbic acid (AAE), utilising a calibration curve of ascorbic acid (Vladimir-Knezevic et
al., 2011).
Indian Journal of Plant Sciences ISSN: 2319–3824(Online)
An Open Access, Online International Journal Available at http://www.cibtech.org/jps.htm
2016 Vol.5 (1) January-March, pp.11-26/Rajbhar et al.
Research Article
© Copyright 2014 | Centre for Info Bio Technology (CIBTech) 15
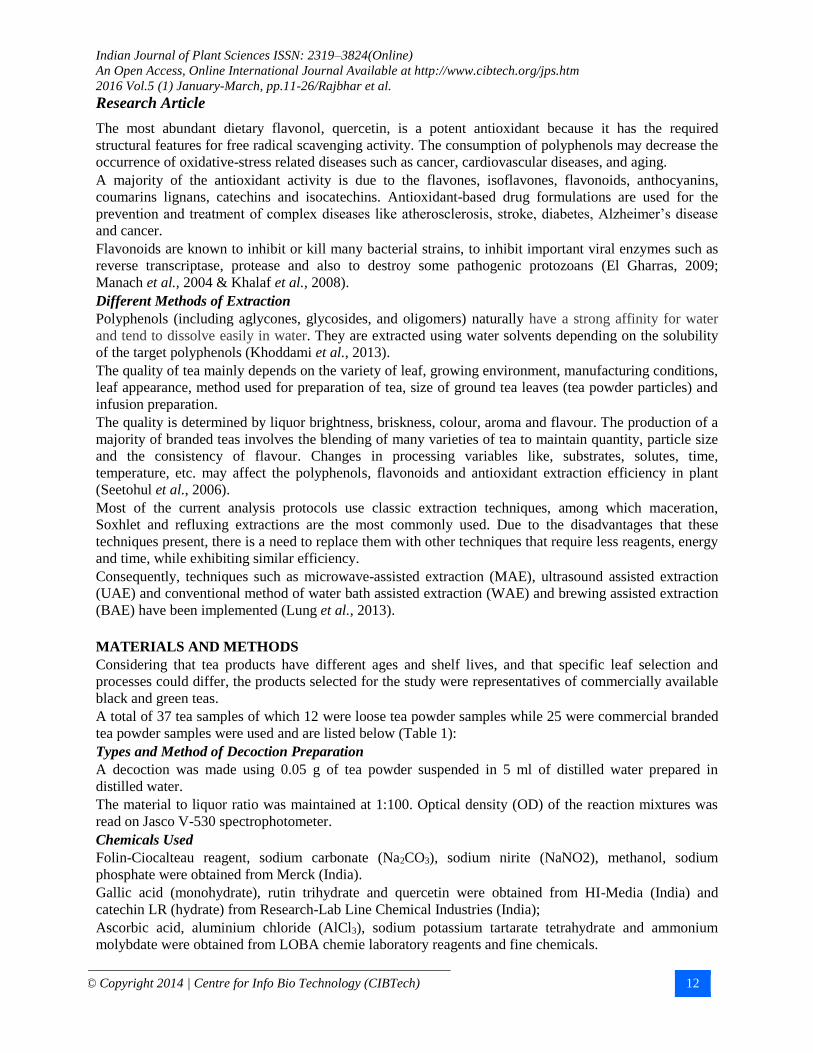
RESULTS AND DISCUSSION
Figure 1: Polyphenols and Flavonoids Extracted by Brewing Assisted Method (BAE) from
Commercial Samples
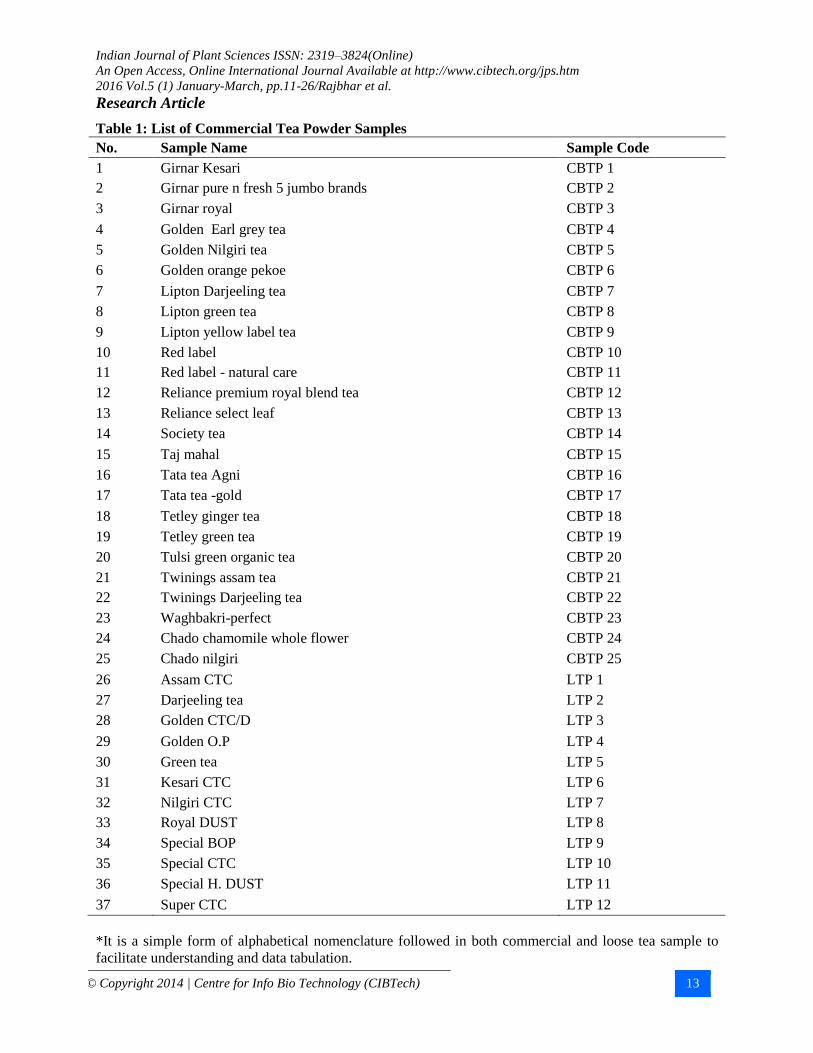
Figure 2: Polyphenols and Flavonoids Extracted by Microwave Assisted Method (MAE) from
Commercial Samples
Indian Journal of Plant Sciences ISSN: 2319–3824(Online)
An Open Access, Online International Journal Available at http://www.cibtech.org/jps.htm
2016 Vol.5 (1) January-March, pp.11-26/Rajbhar et al.
Research Article
© Copyright 2014 | Centre for Info Bio Technology (CIBTech) 16
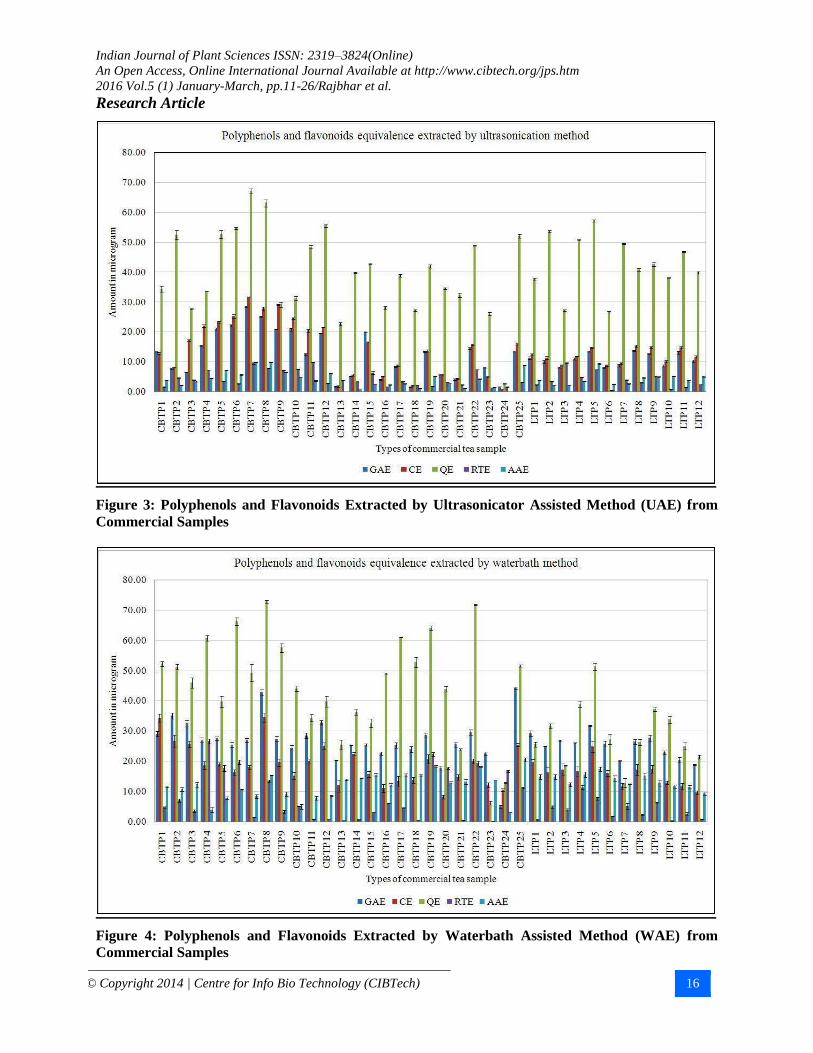
Figure 3: Polyphenols and Flavonoids Extracted by Ultrasonicator Assisted Method (UAE) from
Commercial Samples
Figure 4: Polyphenols and Flavonoids Extracted by Waterbath Assisted Method (WAE) from
Commercial Samples
Indian Journal of Plant Sciences ISSN: 2319–3824(Online)
An Open Access, Online International Journal Available at http://www.cibtech.org/jps.htm
2016 Vol.5 (1) January-March, pp.11-26/Rajbhar et al.
Research Article
© Copyright 2014 | Centre for Info Bio Technology (CIBTech) 17
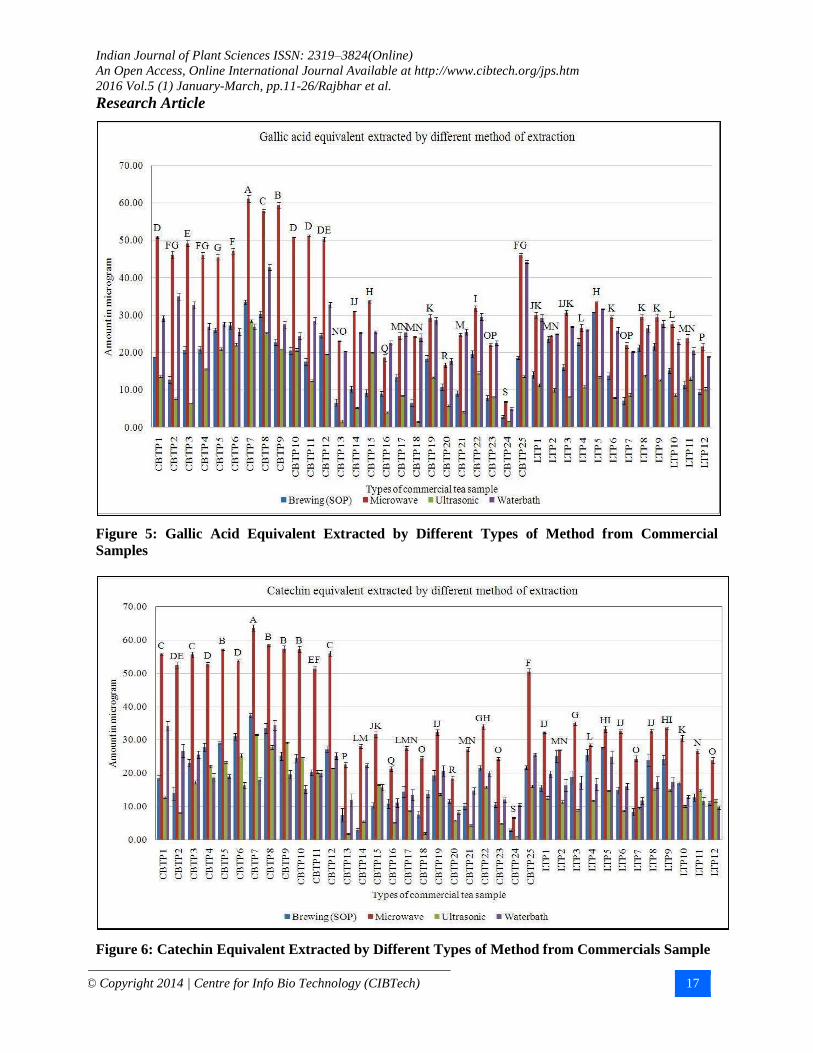
Figure 5: Gallic Acid Equivalent Extracted by Different Types of Method from Commercial
Samples
Figure 6: Catechin Equivalent Extracted by Different Types of Method from Commercials Sample
Indian Journal of Plant Sciences ISSN: 2319–3824(Online)
An Open Access, Online International Journal Available at http://www.cibtech.org/jps.htm
2016 Vol.5 (1) January-March, pp.11-26/Rajbhar et al.
Research Article
© Copyright 2014 | Centre for Info Bio Technology (CIBTech) 18
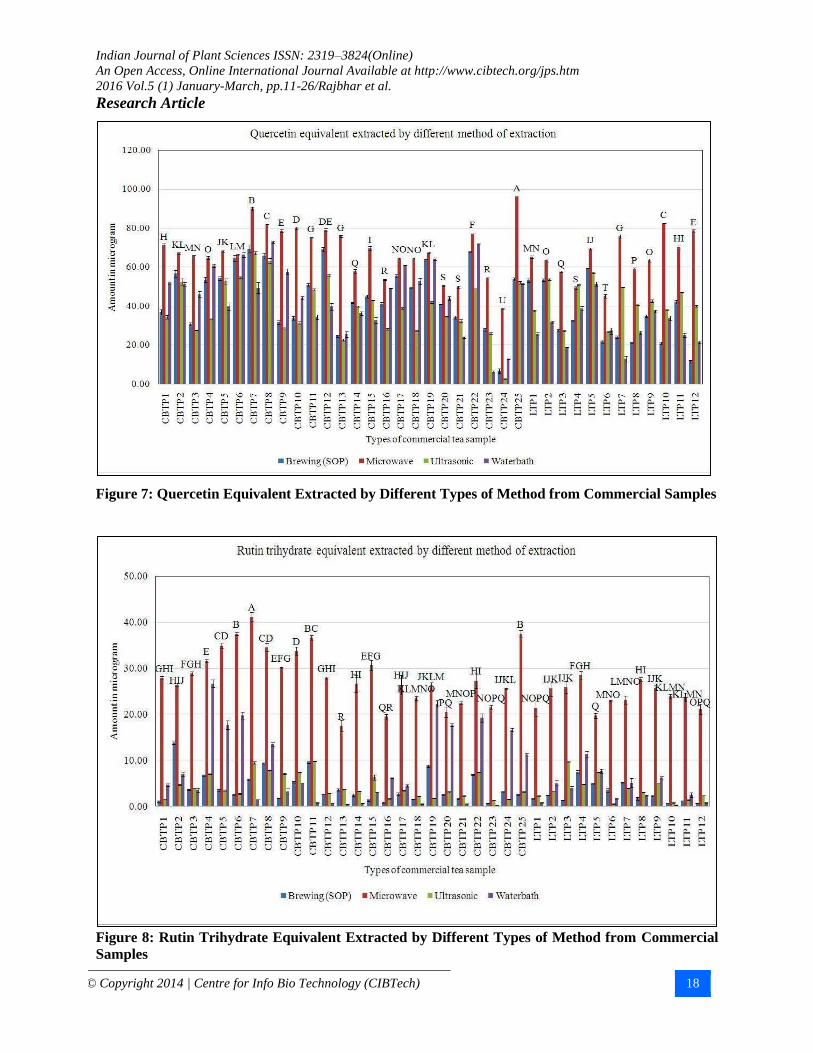
Figure 7: Quercetin Equivalent Extracted by Different Types of Method from Commercial Samples
Figure 8: Rutin Trihydrate Equivalent Extracted by Different Types of Method from Commercial
Samples
Indian Journal of Plant Sciences ISSN: 2319–3824(Online)
An Open Access, Online International Journal Available at http://www.cibtech.org/jps.htm
2016 Vol.5 (1) January-March, pp.11-26/Rajbhar et al.
Research Article
© Copyright 2014 | Centre for Info Bio Technology (CIBTech) 19
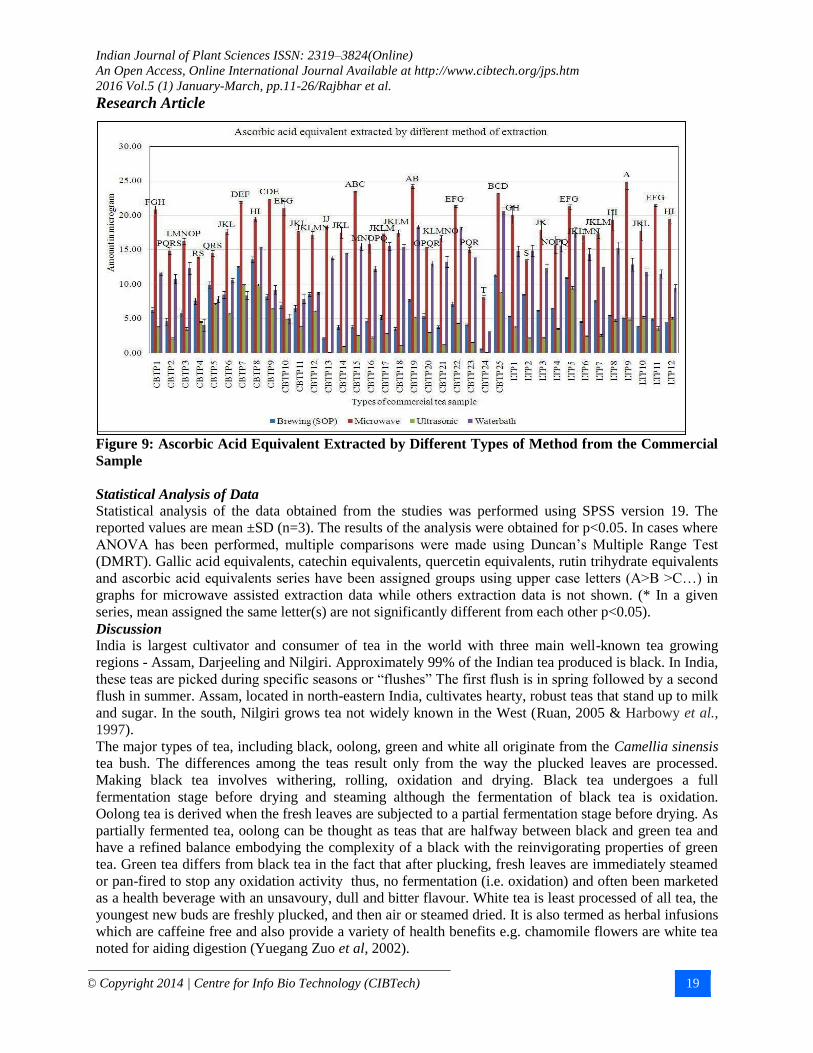
Figure 9: Ascorbic Acid Equivalent Extracted by Different Types of Method from the Commercial
Sample
Statistical Analysis of Data Statistical analysis of the data obtained from the studies was performed using SPSS version 19. The
reported values are mean ±SD (n=3). The results of the analysis were obtained for p<0.05. In cases where
ANOVA has been performed, multiple comparisons were made using Duncan’s Multiple Range Test
(DMRT). Gallic acid equivalents, catechin equivalents, quercetin equivalents, rutin trihydrate equivalents
and ascorbic acid equivalents series have been assigned groups using upper case letters (A>B >C…) in
graphs for microwave assisted extraction data while others extraction data is not shown. (* In a given
series, mean assigned the same letter(s) are not significantly different from each other p<0.05).
Discussion
India is largest cultivator and consumer of tea in the world with three main well-known tea growing
regions - Assam, Darjeeling and Nilgiri. Approximately 99% of the Indian tea produced is black. In India,
these teas are picked during specific seasons or “flushes” The first flush is in spring followed by a second
flush in summer. Assam, located in north-eastern India, cultivates hearty, robust teas that stand up to milk
and sugar. In the south, Nilgiri grows tea not widely known in the West (Ruan, 2005 & Harbowy et al.,
1997).
The major types of tea, including black, oolong, green and white all originate from the Camellia sinensis
tea bush. The differences among the teas result only from the way the plucked leaves are processed.
Making black tea involves withering, rolling, oxidation and drying. Black tea undergoes a full
fermentation stage before drying and steaming although the fermentation of black tea is oxidation.
Oolong tea is derived when the fresh leaves are subjected to a partial fermentation stage before drying. As
partially fermented tea, oolong can be thought as teas that are halfway between black and green tea and
have a refined balance embodying the complexity of a black with the reinvigorating properties of green
tea. Green tea differs from black tea in the fact that after plucking, fresh leaves are immediately steamed
or pan-fired to stop any oxidation activity thus, no fermentation (i.e. oxidation) and often been marketed
as a health beverage with an unsavoury, dull and bitter flavour. White tea is least processed of all tea, the
youngest new buds are freshly plucked, and then air or steamed dried. It is also termed as herbal infusions
which are caffeine free and also provide a variety of health benefits e.g. chamomile flowers are white tea
noted for aiding digestion (Yuegang Zuo et al, 2002).
Indian Journal of Plant Sciences ISSN: 2319–3824(Online)
An Open Access, Online International Journal Available at http://www.cibtech.org/jps.htm
2016 Vol.5 (1) January-March, pp.11-26/Rajbhar et al.
Research Article
© Copyright 2014 | Centre for Info Bio Technology (CIBTech) 20
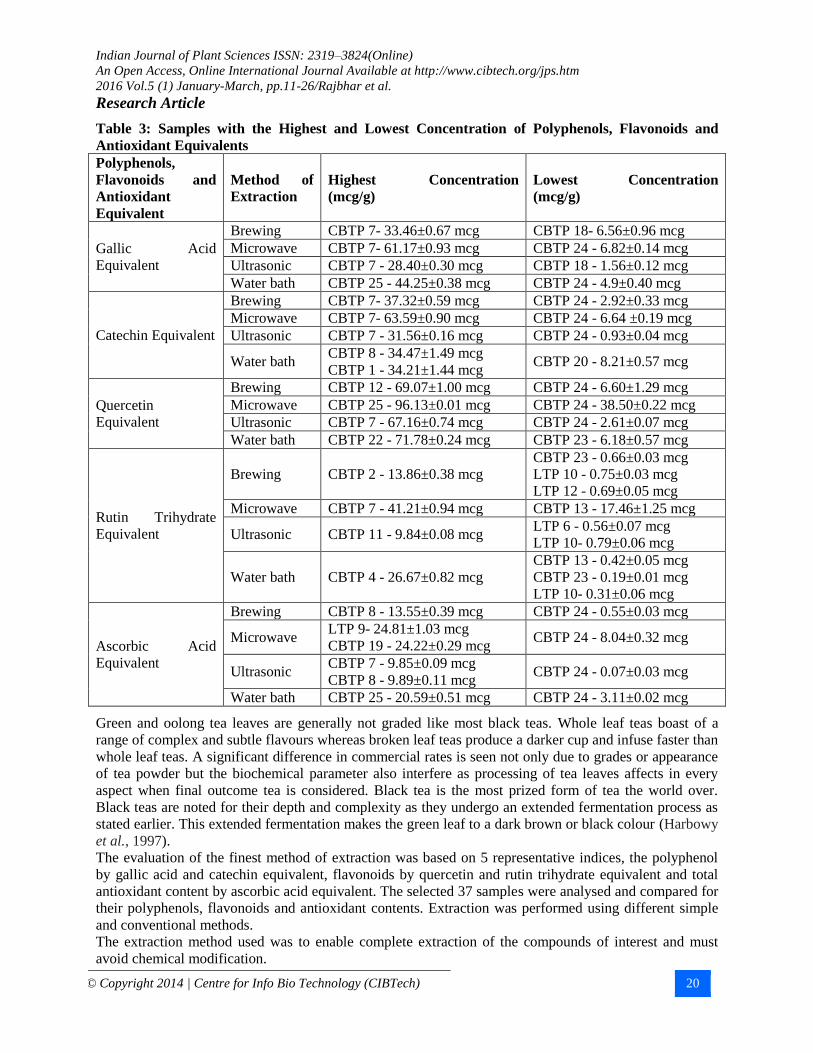
Table 3: Samples with the Highest and Lowest Concentration of Polyphenols, Flavonoids and
Antioxidant Equivalents
Polyphenols,
Flavonoids and
Antioxidant
Equivalent
Method of
Extraction
Highest Concentration
(mcg/g)
Lowest Concentration
(mcg/g)
Gallic Acid
Equivalent
Brewing CBTP 7- 33.46±0.67 mcg CBTP 18- 6.56±0.96 mcg
Microwave CBTP 7- 61.17±0.93 mcg CBTP 24 - 6.82±0.14 mcg
Ultrasonic CBTP 7 - 28.40±0.30 mcg CBTP 18 - 1.56±0.12 mcg
Water bath CBTP 25 - 44.25±0.38 mcg CBTP 24 - 4.9±0.40 mcg
Catechin Equivalent
Brewing CBTP 7- 37.32±0.59 mcg CBTP 24 - 2.92±0.33 mcg
Microwave CBTP 7- 63.59±0.90 mcg CBTP 24 - 6.64 ±0.19 mcg
Ultrasonic CBTP 7 - 31.56±0.16 mcg CBTP 24 - 0.93±0.04 mcg
Water bath CBTP 8 - 34.47±1.49 mcg
CBTP 1 - 34.21±1.44 mcg CBTP 20 - 8.21±0.57 mcg
Quercetin
Equivalent
Brewing CBTP 12 - 69.07±1.00 mcg CBTP 24 - 6.60±1.29 mcg
Microwave CBTP 25 - 96.13±0.01 mcg CBTP 24 - 38.50±0.22 mcg
Ultrasonic CBTP 7 - 67.16±0.74 mcg CBTP 24 - 2.61±0.07 mcg
Water bath CBTP 22 - 71.78±0.24 mcg CBTP 23 - 6.18±0.57 mcg
Rutin Trihydrate
Equivalent
Brewing CBTP 2 - 13.86±0.38 mcg
CBTP 23 - 0.66±0.03 mcg
LTP 10 - 0.75±0.03 mcg
LTP 12 - 0.69±0.05 mcg
Microwave CBTP 7 - 41.21±0.94 mcg CBTP 13 - 17.46±1.25 mcg
Ultrasonic CBTP 11 - 9.84±0.08 mcg LTP 6 - 0.56±0.07 mcg
LTP 10- 0.79±0.06 mcg
Water bath CBTP 4 - 26.67±0.82 mcg
CBTP 13 - 0.42±0.05 mcg
CBTP 23 - 0.19±0.01 mcg
LTP 10- 0.31±0.06 mcg
Ascorbic Acid
Equivalent
Brewing CBTP 8 - 13.55±0.39 mcg CBTP 24 - 0.55±0.03 mcg
Microwave LTP 9- 24.81±1.03 mcg
CBTP 19 - 24.22±0.29 mcg CBTP 24 - 8.04±0.32 mcg
Ultrasonic CBTP 7 - 9.85±0.09 mcg
CBTP 8 - 9.89±0.11 mcg CBTP 24 - 0.07±0.03 mcg
Water bath CBTP 25 - 20.59±0.51 mcg CBTP 24 - 3.11±0.02 mcg
Green and oolong tea leaves are generally not graded like most black teas. Whole leaf teas boast of a
range of complex and subtle flavours whereas broken leaf teas produce a darker cup and infuse faster than
whole leaf teas. A significant difference in commercial rates is seen not only due to grades or appearance
of tea powder but the biochemical parameter also interfere as processing of tea leaves affects in every
aspect when final outcome tea is considered. Black tea is the most prized form of tea the world over.
Black teas are noted for their depth and complexity as they undergo an extended fermentation process as
stated earlier. This extended fermentation makes the green leaf to a dark brown or black colour (Harbowy
et al., 1997).
The evaluation of the finest method of extraction was based on 5 representative indices, the polyphenol
by gallic acid and catechin equivalent, flavonoids by quercetin and rutin trihydrate equivalent and total
antioxidant content by ascorbic acid equivalent. The selected 37 samples were analysed and compared for
their polyphenols, flavonoids and antioxidant contents. Extraction was performed using different simple
and conventional methods.
The extraction method used was to enable complete extraction of the compounds of interest and must
avoid chemical modification.
Indian Journal of Plant Sciences ISSN: 2319–3824(Online)
An Open Access, Online International Journal Available at http://www.cibtech.org/jps.htm
2016 Vol.5 (1) January-March, pp.11-26/Rajbhar et al.
Research Article
© Copyright 2014 | Centre for Info Bio Technology (CIBTech) 21
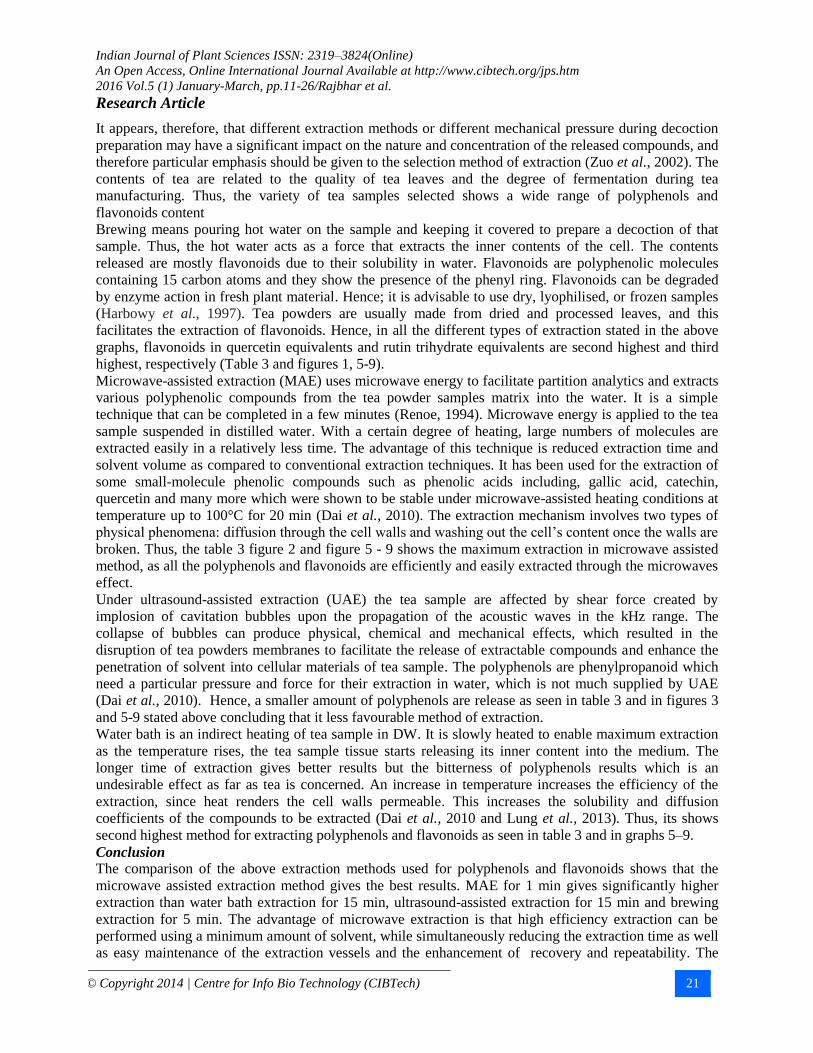
It appears, therefore, that different extraction methods or different mechanical pressure during decoction
preparation may have a significant impact on the nature and concentration of the released compounds, and
therefore particular emphasis should be given to the selection method of extraction (Zuo et al., 2002). The
contents of tea are related to the quality of tea leaves and the degree of fermentation during tea
manufacturing. Thus, the variety of tea samples selected shows a wide range of polyphenols and
flavonoids content
Brewing means pouring hot water on the sample and keeping it covered to prepare a decoction of that
sample. Thus, the hot water acts as a force that extracts the inner contents of the cell. The contents
released are mostly flavonoids due to their solubility in water. Flavonoids are polyphenolic molecules
containing 15 carbon atoms and they show the presence of the phenyl ring. Flavonoids can be degraded
by enzyme action in fresh plant material. Hence; it is advisable to use dry, lyophilised, or frozen samples
(Harbowy et al., 1997). Tea powders are usually made from dried and processed leaves, and this
facilitates the extraction of flavonoids. Hence, in all the different types of extraction stated in the above
graphs, flavonoids in quercetin equivalents and rutin trihydrate equivalents are second highest and third
highest, respectively (Table 3 and figures 1, 5-9).
Microwave-assisted extraction (MAE) uses microwave energy to facilitate partition analytics and extracts
various polyphenolic compounds from the tea powder samples matrix into the water. It is a simple
technique that can be completed in a few minutes (Renoe, 1994). Microwave energy is applied to the tea
sample suspended in distilled water. With a certain degree of heating, large numbers of molecules are
extracted easily in a relatively less time. The advantage of this technique is reduced extraction time and
solvent volume as compared to conventional extraction techniques. It has been used for the extraction of
some small-molecule phenolic compounds such as phenolic acids including, gallic acid, catechin,
quercetin and many more which were shown to be stable under microwave-assisted heating conditions at
temperature up to 100°C for 20 min (Dai et al., 2010). The extraction mechanism involves two types of
physical phenomena: diffusion through the cell walls and washing out the cell’s content once the walls are
broken. Thus, the table 3 figure 2 and figure 5 - 9 shows the maximum extraction in microwave assisted
method, as all the polyphenols and flavonoids are efficiently and easily extracted through the microwaves
effect.
Under ultrasound-assisted extraction (UAE) the tea sample are affected by shear force created by
implosion of cavitation bubbles upon the propagation of the acoustic waves in the kHz range. The
collapse of bubbles can produce physical, chemical and mechanical effects, which resulted in the
disruption of tea powders membranes to facilitate the release of extractable compounds and enhance the
penetration of solvent into cellular materials of tea sample. The polyphenols are phenylpropanoid which
need a particular pressure and force for their extraction in water, which is not much supplied by UAE
(Dai et al., 2010). Hence, a smaller amount of polyphenols are release as seen in table 3 and in figures 3
and 5-9 stated above concluding that it less favourable method of extraction.
Water bath is an indirect heating of tea sample in DW. It is slowly heated to enable maximum extraction
as the temperature rises, the tea sample tissue starts releasing its inner content into the medium. The
longer time of extraction gives better results but the bitterness of polyphenols results which is an
undesirable effect as far as tea is concerned. An increase in temperature increases the efficiency of the
extraction, since heat renders the cell walls permeable. This increases the solubility and diffusion
coefficients of the compounds to be extracted (Dai et al., 2010 and Lung et al., 2013). Thus, its shows
second highest method for extracting polyphenols and flavonoids as seen in table 3 and in graphs 5–9.
Conclusion The comparison of the above extraction methods used for polyphenols and flavonoids shows that the
microwave assisted extraction method gives the best results. MAE for 1 min gives significantly higher
extraction than water bath extraction for 15 min, ultrasound-assisted extraction for 15 min and brewing
extraction for 5 min. The advantage of microwave extraction is that high efficiency extraction can be
performed using a minimum amount of solvent, while simultaneously reducing the extraction time as well
as easy maintenance of the extraction vessels and the enhancement of recovery and repeatability. The
Indian Journal of Plant Sciences ISSN: 2319–3824(Online)
An Open Access, Online International Journal Available at http://www.cibtech.org/jps.htm
2016 Vol.5 (1) January-March, pp.11-26/Rajbhar et al.
Research Article
© Copyright 2014 | Centre for Info Bio Technology (CIBTech) 22
possibility of simultaneous extraction of multiple samples is also higher with MAE, than with other
conventional extraction techniques. The extractions of polyphenols and flavonoids from the tea powder
have a two important limiting factor which affects its estimation. First is the particle size of tea powder
sample and second is time of heat supply which can be studied by kinetics of extraction. Tea powder
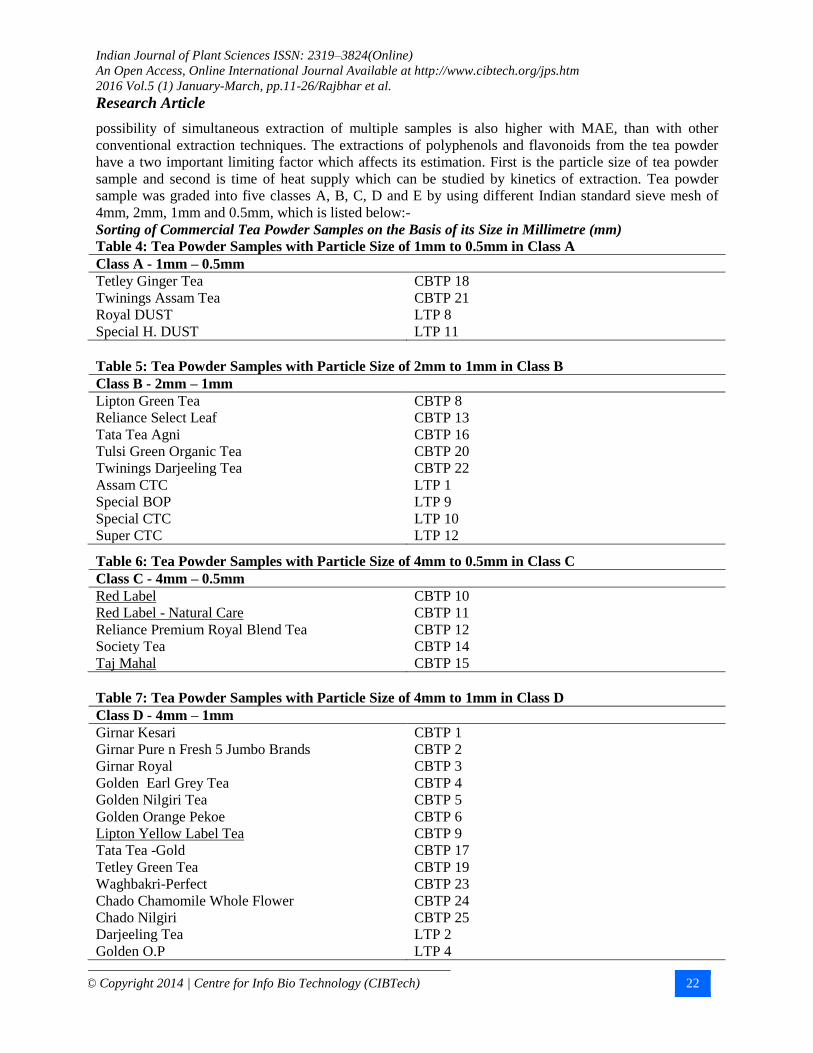
sample was graded into five classes A, B, C, D and E by using different Indian standard sieve mesh of
4mm, 2mm, 1mm and 0.5mm, which is listed below:-
Sorting of Commercial Tea Powder Samples on the Basis of its Size in Millimetre (mm)
Table 4: Tea Powder Samples with Particle Size of 1mm to 0.5mm in Class A
Class A - 1mm – 0.5mm
Tetley Ginger Tea CBTP 18
Twinings Assam Tea CBTP 21
Royal DUST LTP 8
Special H. DUST LTP 11
Table 5: Tea Powder Samples with Particle Size of 2mm to 1mm in Class B
Class B - 2mm – 1mm
Lipton Green Tea CBTP 8
Reliance Select Leaf CBTP 13
Tata Tea Agni CBTP 16
Tulsi Green Organic Tea CBTP 20
Twinings Darjeeling Tea CBTP 22
Assam CTC LTP 1
Special BOP LTP 9
Special CTC LTP 10
Super CTC LTP 12
Table 6: Tea Powder Samples with Particle Size of 4mm to 0.5mm in Class C
Class C - 4mm – 0.5mm
Red Label CBTP 10
Red Label - Natural Care CBTP 11
Reliance Premium Royal Blend Tea CBTP 12
Society Tea CBTP 14
Taj Mahal CBTP 15
Table 7: Tea Powder Samples with Particle Size of 4mm to 1mm in Class D
Class D - 4mm – 1mm
Girnar Kesari CBTP 1
Girnar Pure n Fresh 5 Jumbo Brands CBTP 2
Girnar Royal CBTP 3
Golden Earl Grey Tea CBTP 4
Golden Nilgiri Tea CBTP 5
Golden Orange Pekoe CBTP 6
Lipton Yellow Label Tea CBTP 9
Tata Tea -Gold CBTP 17
Tetley Green Tea CBTP 19
Waghbakri-Perfect CBTP 23
Chado Chamomile Whole Flower CBTP 24
Chado Nilgiri CBTP 25
Darjeeling Tea LTP 2
Golden O.P LTP 4
Indian Journal of Plant Sciences ISSN: 2319–3824(Online)
An Open Access, Online International Journal Available at http://www.cibtech.org/jps.htm
2016 Vol.5 (1) January-March, pp.11-26/Rajbhar et al.
Research Article
© Copyright 2014 | Centre for Info Bio Technology (CIBTech) 23
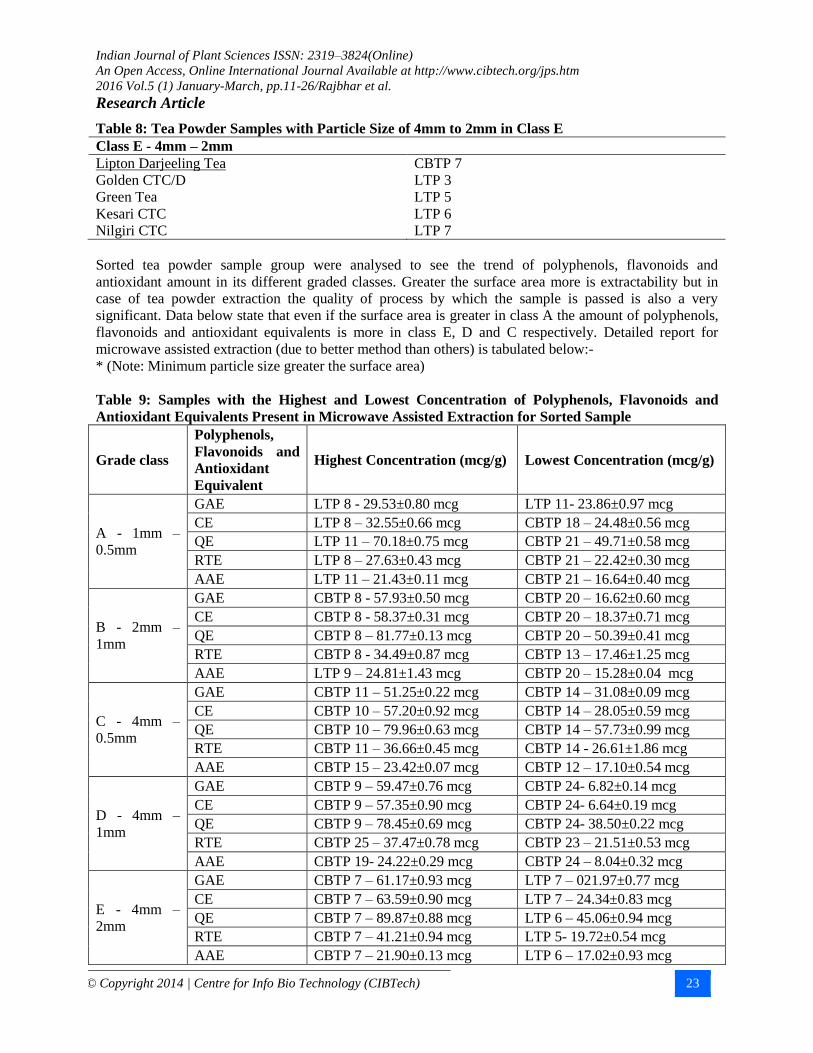
Table 8: Tea Powder Samples with Particle Size of 4mm to 2mm in Class E
Class E - 4mm – 2mm
Lipton Darjeeling Tea CBTP 7
Golden CTC/D LTP 3
Green Tea LTP 5
Kesari CTC LTP 6
Nilgiri CTC LTP 7
Sorted tea powder sample group were analysed to see the trend of polyphenols, flavonoids and
antioxidant amount in its different graded classes. Greater the surface area more is extractability but in
case of tea powder extraction the quality of process by which the sample is passed is also a very
significant. Data below state that even if the surface area is greater in class A the amount of polyphenols,
flavonoids and antioxidant equivalents is more in class E, D and C respectively. Detailed report for
microwave assisted extraction (due to better method than others) is tabulated below:-
* (Note: Minimum particle size greater the surface area)
Table 9: Samples with the Highest and Lowest Concentration of Polyphenols, Flavonoids and
Antioxidant Equivalents Present in Microwave Assisted Extraction for Sorted Sample
Grade class
Polyphenols,
Flavonoids and
Antioxidant
Equivalent
Highest Concentration (mcg/g) Lowest Concentration (mcg/g)
A - 1mm –
0.5mm
GAE LTP 8 - 29.53±0.80 mcg LTP 11- 23.86±0.97 mcg
CE LTP 8 – 32.55±0.66 mcg CBTP 18 – 24.48±0.56 mcg
QE LTP 11 – 70.18±0.75 mcg CBTP 21 – 49.71±0.58 mcg
RTE LTP 8 – 27.63±0.43 mcg CBTP 21 – 22.42±0.30 mcg
AAE LTP 11 – 21.43±0.11 mcg CBTP 21 – 16.64±0.40 mcg
B - 2mm –
1mm
GAE CBTP 8 - 57.93±0.50 mcg CBTP 20 – 16.62±0.60 mcg
CE CBTP 8 - 58.37±0.31 mcg CBTP 20 – 18.37±0.71 mcg
QE CBTP 8 – 81.77±0.13 mcg CBTP 20 – 50.39±0.41 mcg
RTE CBTP 8 - 34.49±0.87 mcg CBTP 13 – 17.46±1.25 mcg
AAE LTP 9 – 24.81±1.43 mcg CBTP 20 – 15.28±0.04 mcg
C - 4mm –
0.5mm
GAE CBTP 11 – 51.25±0.22 mcg CBTP 14 – 31.08±0.09 mcg
CE CBTP 10 – 57.20±0.92 mcg CBTP 14 – 28.05±0.59 mcg
QE CBTP 10 – 79.96±0.63 mcg CBTP 14 – 57.73±0.99 mcg
RTE CBTP 11 – 36.66±0.45 mcg CBTP 14 - 26.61±1.86 mcg
AAE CBTP 15 – 23.42±0.07 mcg CBTP 12 – 17.10±0.54 mcg
D - 4mm –
1mm
GAE CBTP 9 – 59.47±0.76 mcg CBTP 24- 6.82±0.14 mcg
CE CBTP 9 – 57.35±0.90 mcg CBTP 24- 6.64±0.19 mcg
QE CBTP 9 – 78.45±0.69 mcg CBTP 24- 38.50±0.22 mcg
RTE CBTP 25 – 37.47±0.78 mcg CBTP 23 – 21.51±0.53 mcg
AAE CBTP 19- 24.22±0.29 mcg CBTP 24 – 8.04±0.32 mcg
E - 4mm –
2mm
GAE CBTP 7 – 61.17±0.93 mcg LTP 7 – 021.97±0.77 mcg
CE CBTP 7 – 63.59±0.90 mcg LTP 7 – 24.34±0.83 mcg
QE CBTP 7 – 89.87±0.88 mcg LTP 6 – 45.06±0.94 mcg
RTE CBTP 7 – 41.21±0.94 mcg LTP 5- 19.72±0.54 mcg
AAE CBTP 7 – 21.90±0.13 mcg LTP 6 – 17.02±0.93 mcg
Indian Journal of Plant Sciences ISSN: 2319–3824(Online)
An Open Access, Online International Journal Available at http://www.cibtech.org/jps.htm
2016 Vol.5 (1) January-March, pp.11-26/Rajbhar et al.
Research Article
© Copyright 2014 | Centre for Info Bio Technology (CIBTech) 24
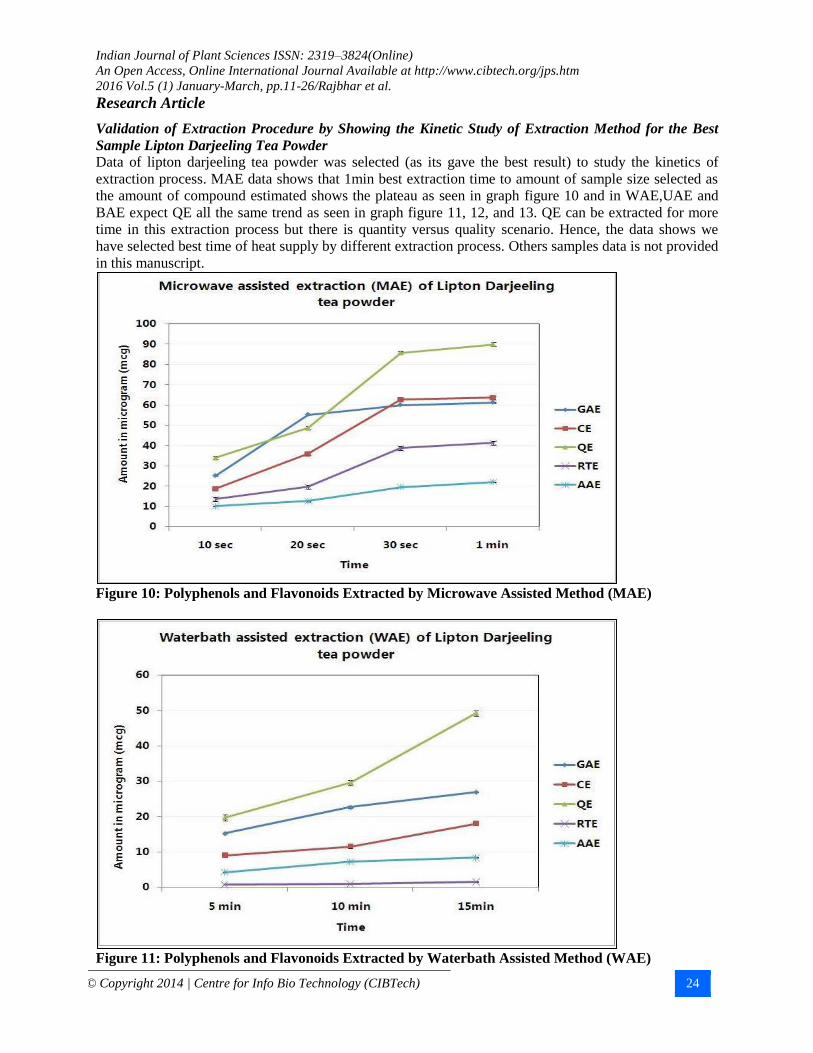
Validation of Extraction Procedure by Showing the Kinetic Study of Extraction Method for the Best
Sample Lipton Darjeeling Tea Powder
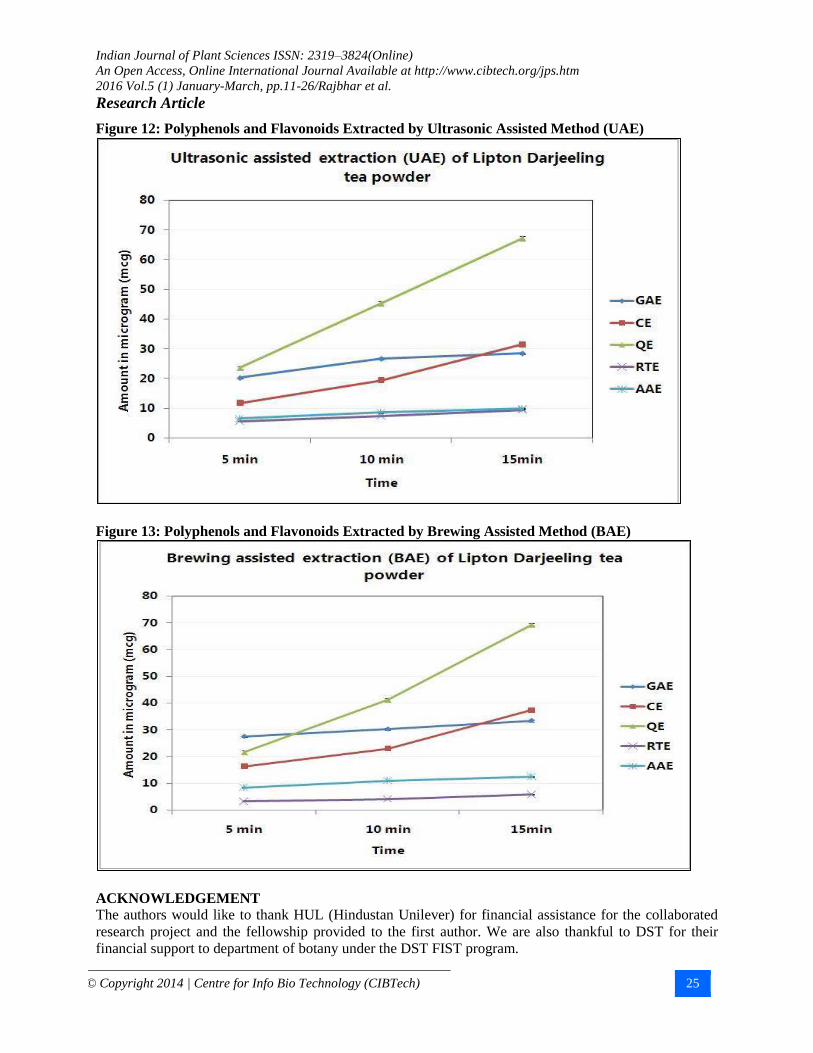
Data of lipton darjeeling tea powder was selected (as its gave the best result) to study the kinetics of
extraction process. MAE data shows that 1min best extraction time to amount of sample size selected as
the amount of compound estimated shows the plateau as seen in graph figure 10 and in WAE,UAE and
BAE expect QE all the same trend as seen in graph figure 11, 12, and 13. QE can be extracted for more
time in this extraction process but there is quantity versus quality scenario. Hence, the data shows we
have selected best time of heat supply by different extraction process. Others samples data is not provided
in this manuscript.
Figure 10: Polyphenols and Flavonoids Extracted by Microwave Assisted Method (MAE)
Figure 11: Polyphenols and Flavonoids Extracted by Waterbath Assisted Method (WAE)
Indian Journal of Plant Sciences ISSN: 2319–3824(Online)
An Open Access, Online International Journal Available at http://www.cibtech.org/jps.htm
2016 Vol.5 (1) January-March, pp.11-26/Rajbhar et al.
Research Article
© Copyright 2014 | Centre for Info Bio Technology (CIBTech) 25
Figure 12: Polyphenols and Flavonoids Extracted by Ultrasonic Assisted Method (UAE)
Figure 13: Polyphenols and Flavonoids Extracted by Brewing Assisted Method (BAE)
ACKNOWLEDGEMENT
The authors would like to thank HUL (Hindustan Unilever) for financial assistance for the collaborated
research project and the fellowship provided to the first author. We are also thankful to DST for their
financial support to department of botany under the DST FIST program.
Indian Journal of Plant Sciences ISSN: 2319–3824(Online)
An Open Access, Online International Journal Available at http://www.cibtech.org/jps.htm
2016 Vol.5 (1) January-March, pp.11-26/Rajbhar et al.
Research Article
© Copyright 2014 | Centre for Info Bio Technology (CIBTech) 26
REFERENCES
Dai J & Mumper RJ (2010). Plant phenolics: extraction, analysis and their antioxidant and anticancer
properties. Molecules 15(10) 7313-7352.
El Gharras H (2009). Polyphenols: food sources, properties and applications–a review. International
Journal of Food Science & Technology 44(12) 2512-2518.
Harbowy ME, Balentine DA, Davies AP & Cai Y (1997). Tea chemistry. Critical Reviews in Plant
Sciences 16(5) 415-480.
Khalaf NA, Shakya AK, Al-Othman A, El-Agbar Z and Farah H (2008). Antioxidant Activity of
Some Common Plants. Turkish Journal of Biology 32 51-55.
Khatiwora E, Adsul VB, Kulkarni MM, Deshpande NR & Kashalkar RV (2001). Spectroscopic
determination of total phenol and flavonoid contents of Ipomoea carnea. International Journal of
Chemtech Research CODEN (USA) 2(3) 1698-1701.
Khoddami A, Wilkes MA & Roberts TH (2013). Techniques for analysis of plant phenolic compounds.
Molecules 18(2) 2328-2375.
Lung I, Soran ML, Stan M, Podar D, Khalifa FK & Elmazny WN (2013). Quantification of Total
Flavonoids and Phenolic Acids from Microwave Irradiated and Non-irradiated Plants. Advances in
Research 1(1) 1-10.
Manach C, Williamson G, Morand C, Scalbert A & Rémésy C (2005). Bioavailability and bioefficacy
of polyphenols in humans. I. Review of 97 bioavailability studies. The American Journal of Clinical
Nutrition 81(1) 230-242.
Nitin Seetohul L, Islam M, O'Hare WT & Ali Z (2006). Discrimination of teas based on total
luminescence spectroscopy and pattern recognition. Journal of the Science of Food and Agriculture
86(13), 2092-2098.
Parmar N, Rawat M and Kumar JV (2012). Camellia sinensis (Green tea): a review. Global Journal of
Pharmacology 6(2) 52-59.
Renoe B (1994). Microwave Assisted Extraction (CEM Corporation, Matthews NC- American
Laboratory) 34-40.
Ruan J (2005). Quality-related constituents in tea (Camellia sinensis (L.) O. Kuntze) as affected by the
form and concentration of nitrogen and the supply of chloride (Doctoral dissertation, Christian-Albrechts
Universität Kiel).
Singleton VL, Orthofer R & Lamuela-Raventos RM (1999). Analysis of total phenols and other
oxidation substrates and antioxidants by means of folin-ciocalteu reagent. Methods in Enzymology 299C
152-178.
Sultana M, Verma PK, Raina R, Prawez S & Dar MA (2012). Quantitative Analysis of Total Phenolic,
Flavonoids and Tannin Contents in Acetone and n-hexane Extracts of Ageratum conyzoides;
International Journal of Chemtech Research CODEN (USA) 4(3) 996-999.
Vladimir-Knežević S, Blažeković B, Bival Štefan M, Alegro A, Kőszegi T & Petrik J (2011). Antioxidant activities and polyphenolic contents of three selected Micromeria species from Croatia.
Molecules 16(2) 1454-1470.
Zuo Y, Chen H & Deng Y (2002). Simultaneous determination of catechins, caffeine and gallic acids in
green, Oolong, black and pu-erh teas using HPLC with a photodiode array detector. Talanta 57(2) 307-
316.