Embed Size (px)
Citation preview
ANALYSIS OF HUNGARIAN HOSPITAL
ANTIBACTERIAL USE FROM DIFFERENT ASPECTS
Ph.D. thesis
Ria Benkı
2009

University of Szeged
Department of Clinical Pharmacy
Ph.D. thesis
ANALYSIS OF HUNGARIAN HOSPITAL ANTIBACTERIAL USE
FROM DIFFERENT ASPECTS
Ria Benkı
Supervisor: Dr. Gyöngyvér Soós, Ph.D.
Szeged 2009
ABBREVIATIONS ARPAC Antibiotic Resistance Prevention and Control project ATC Anatomical Therapeutic Chemical AUC Area under the serum/plasma concentration–time curve BAL Bronchoalveolar lavage CFU Colony forming unit CL Levofloxacin clearance
CLCR Estimated creatinine clearance CLSI Clinical and Laboratory Standards Institute Cmax Maximum serum/plasma drug concentration (peak) CMI Case Mix Index Cmin Minimum serum/plasma drug concentration (though) CPIS Clinical Pulmonary Infection Score DDD Defined Daily Dose DU90% Drug Utilisation 90% segment DURG Drug Utilisation Research Group ESAC European Surveillance of Antimicrobial Consumption f (prefix) Free fraction ICU Intensive Care Unit LOS Length of stay MIC Minimum inhibitory concentration OGYI National Institute of Pharmacy PAE Post antibiotic effect pBAL Protected bronchoalveolar lavage PD Pharmacodynamic PDD Prescribed daily dose PE Pharmacoepidemiology PK Pharmacokinetic PK/PD Pharmacokinetic/pharmacodynamic QEAs Quantitative endotracheal aspirates RDD Recommended daily dose SAPS II score Simplified Acute Physiology Score II SD Standard deviation ss (subscript) At steady-state conditions T Time T1/2β Elimination half-life VAP Ventilator-associated pneumonia Vd Volume of distribution WHO World Health Organization
PUBLICATIONS RELATED TO THE THESIS
Papers
I. R Benko, M Matuz, P Doro, E Hajdu, G Nagy, E Nagy, Gy Soos: [Antibiotic consumption between 1996 and 2003: national survey and international comparison]. Orv Hetil 2006; 147(26): 1215-1222.
II. R Benko, M Matuz, P Doro, R Viola, E Hajdu, DL Monnet, G Soos. Hungarian Hospital Antibiotic Consumption at the regional level, 1996-2005. Infection. 2009; 37(2): 133-137. IF 2006: 2.368
III. R Benko, M Matuz; E Hajdu, Z Peto, A Hegedus, L Bogar, Gy Soos. [The participation of pharmacist in antibiotic related activities of Hungarian hospitals and intensive care units] Acta Pharm Hung [under publication]
IV. R Benko, M Matuz, P Doro, Z Peto, A Molnar, E Hajdu, E Nagy, J Gardi, Gy Soos. Pharmacokinetics and pharmacodynamics of levofloxacin in critically ill patients with ventilator-associated pneumonia. Int J Antimicrob Agents 2007; 30(2):162-168. IF 2006: 2.221
V. R Benko, M Matuz, E Hajdu, P Doro, Z Peto, A Molnar, J Gardi, E Nagy, G Soos: [Assesment of therapeutic efficacy based on levofloxaxcin plasma level measurement in intensive care unit patients] Infektológia és Klinikai Mikrobiológia 2007, 14(3-4): 97-103.
Abstracts
VI. R Benko, M Matuz, P Doro, A Nemeth, Z Peto, E Hajdu, L Bogar, Gy Soos.: Antibiotic related activities in intensive care units and the involvement of hospital pharmacists. 37th European Symposium on Clinical Pharmacy, Dubrovnik, Croatia, 2008 Abs: Pharm World Sci 31 (2): 335-336.
VII. R Benko, M Matuz, P Doro, G Martha, Z Peto, E Hajdu, L Bogar, Gy Soos.: Preliminary results of antibiotic use benchmarking survey in Hungarian ICUs. 37th European Symposium on Clinical Pharmacy, Dubrovnik, Croatia, 2008 Abs: Pharm World Sci 31 (2): 324-324.
VIII. R Benko, M Matuz, E Hajdu, M Dominique, Gy Soos: A magyarországi ambuláns és kórházi antibiotikum felhasználás területi különbségei. Magyar Infektológiai és Klinikai Mikrobiológiai Társaság 36. Kongresszusa. Abs: Infektológia és Klinikai Mikrobiológia XV. 15 Suppl 1. S14, 2008
IX. R Benko, M Matuz, A Hegedus, Z Peto, Gy Soos, L Bogar, E Hajdu: Tények és igények a hazai intenzív osztályok antibiotikum alkalmazásával kapcsolatban. Magyar Aneszteziológiai és Intenzív Terápiás Társaság XXXVI. Kongresszusa, Balatonfüred, 2008 Abs: Aneszteziológia és Intenzív Terápia 38,S1;EA18, 2008
X. R Benko: Levofloxacin plazmaszint mérésen alapuló terápiás hatáselemzés kritikus állapotú betegekben. Magyar Infektológiai és Klinikai Mikrobiológiai Társaság 2007. évi Pályázatának elıadásai és eredményhirdetése, Budapest, 2007
XI. R Benko, M Matuz, E Hajdu, Z Peto, A Molnar, J Gardi, E Nagy, Gy Soos. Pharmacokinetics of intravenous levofloxacin in critically ill patients with ventilator-associated pneumonia 8th Congress of Chemotherapy and Infection&4th European Conference on Viral Diseases, Budapest, 2006
XII. R Benko, M Matuz, P Doro, R Viola, Gy Soos: Hungarian Hospital Antibiotic Consumption. Does It Matter Which Measure? 22nd International Conference on Pharmacoepidemiology &Therapeutic Risk Management, Lisbon, 2006. Abs: Pharmacoepidemiol Drug Saf 15,S1, P614, 2006
XIII. R Benko, M Matuz, E Hajdu, G Nagy, E Nagy, P Doro, A Toth, E Kosik, Gy Soos: Regional differences in hospital and community antibiotic consumption in Hungary, ESCP 5th spring conference on Clinical Pharmacy, Stockholm, Sweden, 2005
TABLE OF CONTENTS
1. INTRODUCTION....................................................................................................................1 2. BACKGROUND ......................................................................................................................3 2.1. Pharmacoepidemiology ........................................................................................................3 2.1.1. The history of drug utilisation studies and the Drug Utilisation Research Group......4 2.1.2. The Anatomical Therapeutic Chemical (ATC) system ..............................................5 2.1.3. Drug utilisation metrics, concept of the defined daily dose........................................5 2.1.4. Antibacterial drug utilisation studies in Hungary .......................................................6 2.2. Optimal antibacterial use: the role of pharmacokinetics and pharmacodynamics..............8 2.2.1. Rationale for optimal dosing.......................................................................................8 2.2.2. The pharmacokinetic/pharmacodynamic (PK/PD) concept........................................8 2.2.3. The pharmacokinetic/pharmacodynamic (PK/PD) indices.........................................9 2.2.4. PK/PD indices determining the efficacy of fluoroquinolones ..................................11 2.2.5. Optimising antibacterial dosing in a clinical setting.................................................11 3. MAIN RESEARCH OBJECTIVES.....................................................................................13 3.1. Drug utilisation studies.......................................................................................................13 3.2. Pharmacokinetic study........................................................................................................13 4. METHODS.............................................................................................................................14 4.1. Drug utilisation studies.......................................................................................................14 4.1.1. National and regional hospital antibiotic consumption ............................................14 4.1.2. Regional variations of hospital antibiotic consumption and its determinants ..........15 4.1.3. Antibiotic related activities in Hungarian adult ICUs and in their parent institute ..16 4.1.4. Antibiotic use in Hungarian adult intensive care units .............................................16 4.2. Pharmacokinetic study........................................................................................................17 4.2.1. Study design and entry criteria .................................................................................17 4.2.2. Drug administration and sample collection ..............................................................17 4.2.3. Pharmacokinetic and statistical analysis...................................................................18 4.2.4. Efficacy assessment ..................................................................................................18 5. RESULTS ...............................................................................................................................20 5.1. Drug utilisation studies.......................................................................................................20 5.1.1. National trends in antibacterial utilisation................................................................20 5.1.2. Regional differences in antibacterial utilisation .......................................................23 5.1.3. Determinants of regional hospital antibacterial use..................................................26 5.1.4. Antibiotic related activities in Hungarian adult ICUs and in their parent institute ..27 5.1.5. Antibiotic use in Hungarian adult intensive care units .............................................30 5.2. Pharmacokinetic study........................................................................................................33 6. DISCUSSION.........................................................................................................................37 6.1. Drug utilisation studies.......................................................................................................37 6.1.1. National trends in antibacterial utilisation................................................................37 6.1.2. Regional differences in antibacterial utilisation and its determinants ......................39 6.1.3. Antibiotic related activities in Hungarian adult ICUs and in their parent institute ..40 6.1.4. Antibiotic use in Hungarian adult intensive care units .............................................42 6.2. Pharmacokinetic study........................................................................................................44 7. SUMMARY ............................................................................................................................47 8. REFERENCES.......................................................................................................................49 9. ACKNOWLEDGEMENTS ..................................................................................................59 10. ANNEX ...................................................................................................................................60 10.1. Definitions of pharmacokinetic and pharmacodynamic parameters..................................60 10.2. Ethical approval of the pharmacokinetic study ..................................................................61 10.3. Publications related to the thesis (papers) .........................................................................62
- 1 -
1. INTRODUCTION
The discovery of antimicrobial agents is considered to be one of the ten great public health
achievements of the twentieth century [1,2]. These agents have played a pivotal role in the
management and control of infectious diseases and in the decrease in infectious disease related
mortalities [1,3]. Initially, antibacterials were seen as truly miraculous drugs and considered the
‘‘panacea’’ of Medicine, but nowadays the evolution of drug-resistant organisms has greatly
impaired their therapeutic efficacy [4-9]. Although antimicrobial resistance has been recognized
since the earliest days of antibiotic therapy (it developed rapidly in some bacteria after the first use
of penicillin), the process has accelerated and compounded during the last two decades and is now
reaching alarming levels in certain pathogens and certain geographical regions [8,10-15].
The causes of antimicrobial resistance are complex and multi-factorial in nature [15,16]. Firstly,
antimicrobial resistance is a naturally occurring biological phenomenon driven by Darwinian
natural selection [17]. Hence it is an inevitable accompaniment of appropriate antibiotic use [18].
However, accumulated evidence points to misuse of antibacterials having further amplified the
emergence and spread of antibacterial resistance [6,16,18-21]. The antimicrobial resistance crisis is
heightened by the concomitant downward trend in the intent of pharmaceutical companies to
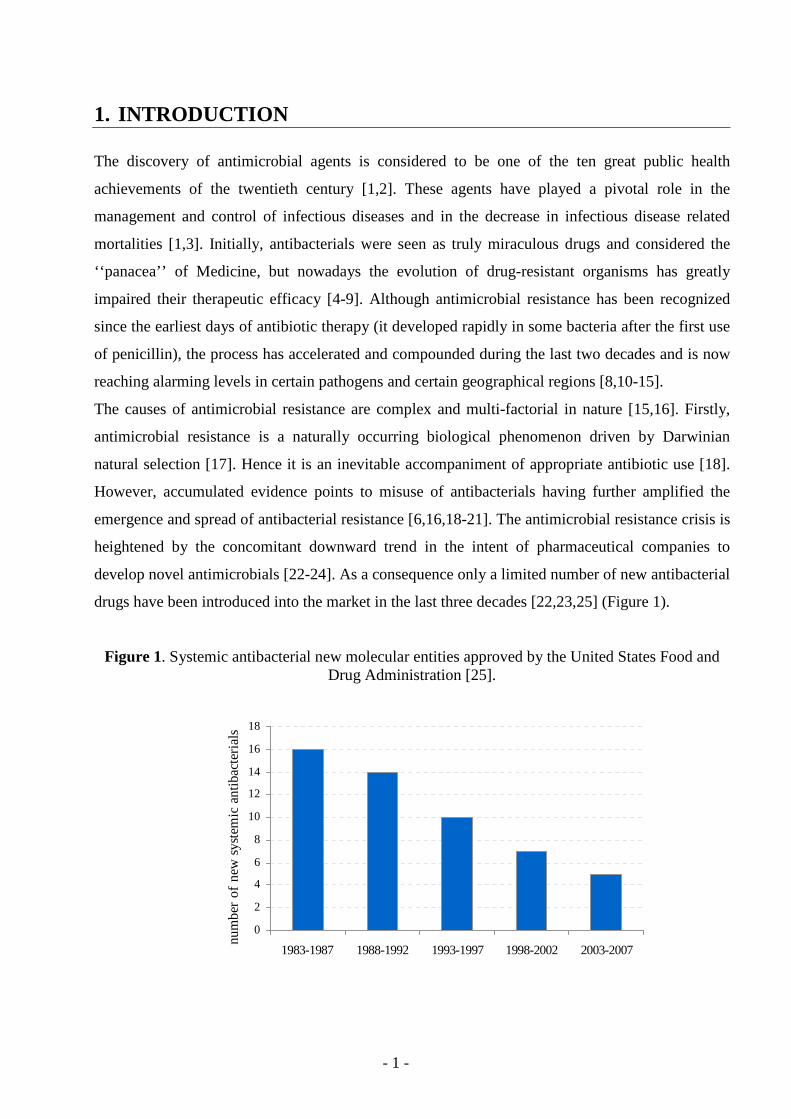
develop novel antimicrobials [22-24]. As a consequence only a limited number of new antibacterial
drugs have been introduced into the market in the last three decades [22,23,25] (Figure 1).
Figure 1. Systemic antibacterial new molecular entities approved by the United States Food and Drug Administration [25].
0
2
4
6
8
10
12
14
16
18
1983-1987 1988-1992 1993-1997 1998-2002 2003-2007
num
ber
of
new
sys
tem
ic a
ntib
acte
rial
s
- 2 -
Antibiotics are one of the most commonly used medicines in hospitals and have substantial share
from the hospitals’ budget [26-36]. As their inappropriate use has both medical (increased risk of
side-effects, therapeutic failure), economic (financial burden) and public health consequences
(selection of resistance) substantial efforts are needed to rationalise their use.
Before designing any interventions aiming to optimise antibiotic use, data collection and
evaluation is needed to identify problematic fields. At international level, the European
Surveillance of Antimicrobial Consumption (ESAC) project is tasked with collecting reliable
antibiotic use data.
The use of drugs could be evaluated not only at general population level but also at individual
patient level. During my Ph.D. work I intended to follow these steps: to apply
pharmacoepidemiologic methods to investigate features and trends of hospital antibacterial
consumption in Hungary and to evaluate the individual antibiotic therapy in critically ill patients by
using the pharmacokinetic/pharmacodynamic concepts.
- 3 -
2. BACKGROUND
2.1. Pharmacoepidemiology
A modern definition of pharmacoepidemiology (PE) is “the study of the utilisation and effects
(beneficial and adverse) of drugs in large numbers of people” [37]. Pharmacoepidemiology as a
post-marketing study is used to assess how drugs function in the ‘real world’: it describes, explains
and forecasts the use and effects of pharmacologic treatments in a defined time, space and
population [38,39]. PE can be viewed as a bridge science, spanning both pharmacology and
epidemiology (i.e. application of epidemiological methods to pharmacological matters) [40].
Traditionally PE has dealt with data from populations, but now it is quite often based on clinical
data acquired via a bedside approach. Thus, pharmacoepidemiology also has much in common
with the discipline of clinical pharmacology [39].
The principal aim of pharmacoepidemiologic research is to enhance the rational and cost-effective
use of medications in the population [37]. PE can be divided into two main fields: one includes
studies of side effects, adverse drug effects, and post marketing studies investigating long-term
effects of specific drugs in a population. The other - drug utilisation studies – was defined by
World Health Organization (WHO) as the marketing, distribution, prescription, and use of drugs in
a society, with special emphasis on the resulting medical, social and economic consequences [41].
More recently, drug utilisation research has been defined as an eclectic collection of descriptive
and analytical methods for the quantification, understanding and evaluation of the process of
prescribing, dispensing and consumption of medicines and for testing of interventions to enhance
the quality of these processes [42]. Practically, drug utilisation studies may provide insights to the
pattern of drug use (e.g. the extent, the trends), can assess the quality of use, identify predictors for
use and generate explanatory hypotheses [37,39].
Collecting data on different aspects of drug use is a prerequisite to be able to initiate a discussion
on rational drug use or to suggest measures to improve it. Ideally, all drug policy decisions should
be based – and regularly re-evaluated– on comprehensive drug utilisation data [43,44]. It is
important to keep in mind that although drug utilisation studies can contribute to rational drug use
by identifying the areas that require attention and action, but in itself, does not necessarily offer the
solutions for the problems [37].
- 4 -
2.1.1. The history of drug utilisation studies and the Drug Utilisation Research Group
The field of drug utilisation research has roots back to the 1960s, when early drug utilisation
studies were performed in Northern Europe and the United Kingdom [45]. During this early work,
international comparisons were impossible, due to the application of different units and methods to
measure drug use. Soon after this pioneering work, at a seminal symposium in Oslo (entitled the
“Consumption of Drugs”, 1969), organized by the WHO Regional Office for Europe, researchers
expressed the need for a common classification system for drugs as well as a technical unit of
comparison in drug utilisation studies [46]. To overcome this difficulty, scientists mainly from
Northern European countries came together in an informal group and developed a new unit of
measurement, initially called the agreed daily dose [47], and later the defined daily dose (DDD)
[48,49]. Another important methodological development was the introduction of the uniform
Anatomical Therapeutic Chemical (ATC) classification system in the mid-1970s [49]. The small
group of scientists active in these areas established the informal Drug Utilisation Research Group
(DURG) in 1976. As the WHO Regional Office for Europe served as its secretariat, this group was
often referred as WHO-DURG for about 20 years.
The first publication applying the ATC/DDD principles appeared in 1975 [47], while from 1981,
the ATC/DDD system was proposed for drug utilisation studies. To maintain and develop the
ATC/DDD system, the WHO Collaborating Centre for Drug Statistics Methodology was
established in 1982 in Oslo [43,49]. In 1996, the WHO realized that the ATC/DDD system should
be implemented and used outside of Europe as well, and the expert panel of WHO International
Working Group for Drug Statistics Methodology was founded to facilitate the globalization of the
ATC/DDD system.
By 1993, the relationship between DURG and WHO has loosened as the later was unable to further
support the DURG with secretarial functions. Therefore in 1994 an independent EuroDURG
(European Drug Utilisation Research Group) interim committee was elected, while in 1996, at a
meeting at Lake Balaton, the EuroDURG was formally established [50,51]. Since the 1996 meeting
at Balatonaliga, there has been EuroDURG meeting practically every year, most of them organised
jointly with the European Association of Clinical Pharmacology and Therapeutics (EACPT) or the
International Society of Pharmacoepidemiology (ISPE).
The contribution of WHO-DURG/EuroDURG and its members to these conferences and drug
utilisation research itself has been substantial [42,52,53].
- 5 -
2.1.2. The Anatomical Therapeutic Chemical (ATC) system
In the ATC classification system, drugs are divided into different groups according to the organ or
system on which they act and their chemical, pharmacological, and therapeutic properties. Drugs
are classified in groups at five different levels where a seven digit code identifies a unique active
agent. The structure of the code is illustrated by the complete classification of levofloxacin:
J Antiinfectives for systemic use (1st level, anatomical main group)
J01 Antibacterials for systemic use (2nd level, therapeutic subgroup)
J01M Quinolone antibacterials (3rd level, pharmacological subgroup)
J01MA Fluoroquinolones (4th level, pharmacological/chemical subgroup)
J01MA12 Levofloxacin (5th level, chemical substance)
Medicinal products are classified in the ATC system according to their main therapeutic indication
of their main active ingredient. An active ingredient can be classified under more than one ATC
codes, if it is marketed in different strength and/or formulation with clearly different therapeutic
uses (e.g. oral and rectal metronidazole: P01AB01; intravenous metronidazole: J01XD01 [37]).
2.1.3. Drug utilisation metrics, concept of the defined daily dose (DDD)
The defined daily dose (DDD) is an internationally accepted technical unit in drug utilisation
studies. It means the assumed average maintenance dose per day for a drug used for its main
indication in adults. It should be emphasized that the DDD does not necessarily correspond to the
recommended-, or actually prescribed daily dose (RDD and PDD) [37].
Drug utilisation figures should ideally be standardized. The DDDs per 1,000 inhabitants and per
day is the most widely used measurement unit, mainly applied for ambulatory care drug
consumption data. When drug use in hospitalised patients is considered, the number of DDDs per
100 patient-days is the WHO recommended technical unit [37], while the number of DDDs per
100 admissions is an optional, complementary unit [54].
Although the DDD per 100 patient-days is the WHO recommended measure of hospital drug use
that allows international comparison [37,55], its limitations should be emphasised. First, different
studies may use different definitions for the length of stay or fail to report the definition (e.g. [56-
66]) which could greatly affect the value of the denominator (i.e. patient-days) and hence the
resulting drug consumption value. Due to this, the applied calculation method (e.g. whether days of
admission and discharge count together as one or two patient-days) should be clearly stated
- 6 -
[67,68]. Secondly, drug utilisation studies rarely assess the precise amount of drug ingested by or
administered to the patients [69,70]. They provide an upper or lower estimation of real drug use,
depending on the data source they are derived from (prescribed quantity, distributed quantity,
dispensed quantity, reimbursed quantity).
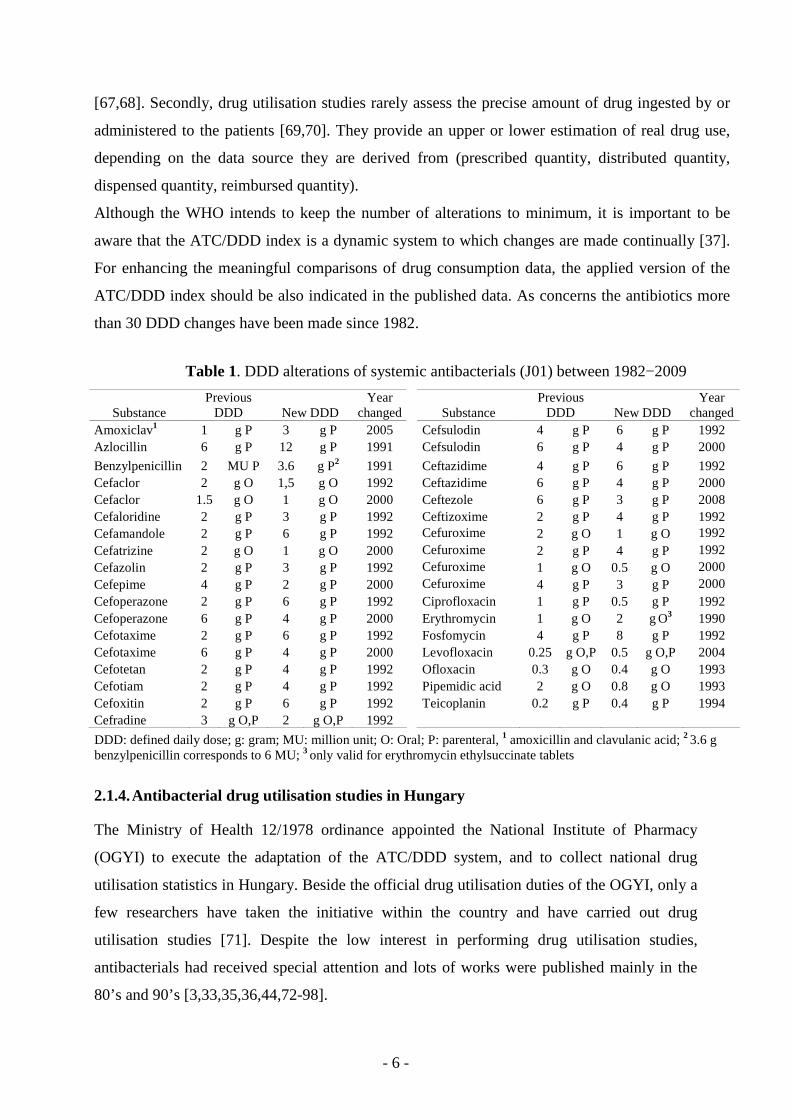
Although the WHO intends to keep the number of alterations to minimum, it is important to be
aware that the ATC/DDD index is a dynamic system to which changes are made continually [37].
For enhancing the meaningful comparisons of drug consumption data, the applied version of the
ATC/DDD index should be also indicated in the published data. As concerns the antibiotics more
than 30 DDD changes have been made since 1982.
Table 1. DDD alterations of systemic antibacterials (J01) between 1982−2009
Substance Previous
DDD New DDD Year
changed Substance Previous
DDD New DDD Year
changed Amoxiclav1 1 g P 3 g P 2005 Cefsulodin 4 g P 6 g P 1992 Azlocillin 6 g P 12 g P 1991 Cefsulodin 6 g P 4 g P 2000
Benzylpenicillin 2 MU P 3.6 g P2 1991 Ceftazidime 4 g P 6 g P 1992 Cefaclor 2 g O 1,5 g O 1992 Ceftazidime 6 g P 4 g P 2000 Cefaclor 1.5 g O 1 g O 2000 Ceftezole 6 g P 3 g P 2008 Cefaloridine 2 g P 3 g P 1992 Ceftizoxime 2 g P 4 g P 1992 Cefamandole 2 g P 6 g P 1992 Cefuroxime 2 g O 1 g O 1992 Cefatrizine 2 g O 1 g O 2000 Cefuroxime 2 g P 4 g P 1992 Cefazolin 2 g P 3 g P 1992 Cefuroxime 1 g O 0.5 g O 2000 Cefepime 4 g P 2 g P 2000 Cefuroxime 4 g P 3 g P 2000 Cefoperazone 2 g P 6 g P 1992 Ciprofloxacin 1 g P 0.5 g P 1992 Cefoperazone 6 g P 4 g P 2000 Erythromycin 1 g O 2 g O3 1990 Cefotaxime 2 g P 6 g P 1992 Fosfomycin 4 g P 8 g P 1992 Cefotaxime 6 g P 4 g P 2000 Levofloxacin 0.25 g O,P 0.5 g O,P 2004 Cefotetan 2 g P 4 g P 1992 Ofloxacin 0.3 g O 0.4 g O 1993 Cefotiam 2 g P 4 g P 1992 Pipemidic acid 2 g O 0.8 g O 1993 Cefoxitin 2 g P 6 g P 1992 Teicoplanin 0.2 g P 0.4 g P 1994 Cefradine 3 g O,P 2 g O,P 1992
DDD: defined daily dose; g: gram; MU: million unit; O: Oral; P: parenteral, 1 amoxicillin and clavulanic acid; 2 3.6 g benzylpenicillin corresponds to 6 MU; 3 only valid for erythromycin ethylsuccinate tablets
2.1.4. Antibacterial drug utilisation studies in Hungary
The Ministry of Health 12/1978 ordinance appointed the National Institute of Pharmacy
(OGYI) to execute the adaptation of the ATC/DDD system, and to collect national drug
utilisation statistics in Hungary. Beside the official drug utilisation duties of the OGYI, only a
few researchers have taken the initiative within the country and have carried out drug
utilisation studies [71]. Despite the low interest in performing drug utilisation studies,
antibacterials had received special attention and lots of works were published mainly in the
80’s and 90’s [3,33,35,36,44,72-98].
- 7 -
Some of these works report antibiotic use in ambulatory care [73,83,91,95,96], some of them
in hospital care [33,35,36,74-82,85,87-90,92,99,100], some works analysed antibiotic use in
both sectors [72,85,86,98] and some of the works reported overall antibiotic use
[3,44,84,93,94,97]. Whilst these are very valuable pioneering pieces of research, some
criticisms may be levelled at them, particularly concerning essential methodological
information. The lack of ATC classification to group antibacterials or simply the lack of clear
defining of agents included in the study as antibacterials [3,33,35,36,44,44,72,74-80,85,87-
93,97,98,100] were general problems. If DDD or its standardized form (e.g. DDD per 100
patient-days) were the measurement units, the information about the used DDD version and/or
the source and calculation method of the denominator (e.g. patient-days) were also lacking in
many cases which might hamper meaningful comparisons [3,36,44,72,73,84,87,88,89,93-
95,98]. There were cases when disclosure of raw data source were incomplete
[36,84,86,88,89,98] and there was also a case when arbitrary own DDDs were defined [77].
Some of these methodological problems were also identified in other European countries
reporting antibacterial use [101].
As concerns antibacterial consumption in the hospital care sector, several published works
reveal very valuable, sophisticated features of antibiotic use (e.g. number of patients receiving
antibiotics, rate of empiric/targeted antibiotic therapy, diagnoses related antibiotic use, etc.)
[33,35,74-76,78-81,87,92,98]. However, the number of works that applied the ATC/DDD
methodology and expressed hospital antibiotic use in DDD or DDD per 100 patient-days is
scarce [36,72,77,88-90]. There has been only one study by Graber which applied the
ATC/DDD methodology and provided national coverage of hospital antibacterial drug use in
Hungary for 1990-1996 [72]. Therefore, the drug utilisation research performed in this thesis
was motivated on the following considerations:
• Systemic antibacterials have a key role among hospital drugs (i.e. frequent prescription
of antibiotics, substantial share from hospital drug budget) [26-36]
• The number of Hungarian studies that use standardized drug consumption units for
hospital antibacterial use is limited [36,72,77,88-90]
• Recent published data on hospital antibacterial use in Hungary is lacking
• In Hungary, the regional distribution of hospital antibiotic use and its possible
determinants have not been studied so far
• Although intensive care units are the epicentres of the hospital antibiotic use, drug
utilisation studies are scarce from Hungary [76,87,89,90,98], and only two of these
from the ‘80s and 90’s applied the ATC/DDD methodology [89,90].
- 8 -
2.2. Optimal antibacterial use: the role of pharmacokinetics and pharmacodynamics
2.2.1. Rationale for optimal dosing
Rational antibiotic therapy through appropriate selection and dosage regimens can be viewed
as a strategy to enhance patient safety by achieving the desired outcome and minimizing the
risk of toxicity. In many infections, the ultimate goal of antibiotic therapy is not simply to
guarantee clinical success but to achieve it through a total bacteriological cure [102,103].
If bacterial eradication does not occur, less susceptible bacteria are likely to head the
recolonization process after discontinuation of therapy and a more resistant population will
become predominant [104]. Since the repeated exposure to suboptimal concentrations of
antibiotics has been found to be the most important risk factor for selection of resistant
bacteria [105-107], the role of appropriate dosing has gained further value. In summary,
optimal dosing regimens of antibiotics will have an impact not only on patients’ outcome and
cost, but it will reduce the risk of resistance development.
2.2.2. The pharmacokinetic/pharmacodynamic (PK/PD) concept
Although soon after the discovery of penicillin, Eagle and co-workers observed the
relationship between the therapeutic efficacy of penicillin and its concentration in the serum
[108-110], this knowledge however was never really implemented in dosing strategies. Only
during the last two decades has renewed interest in this field clarified the importance of
pharmacokinetic and pharmacodynamic to the appropriate dosing of antibiotics. The selected,
most important pharmacokinetic and pharmacodynamic parameters are defined [111-113] and
summarized in the annex (section 10.1. on page 60).
The pharmacokinetic/pharmacodynamic (PK/PD) model is a mathematical concept that links
pharmacokinetics and pharmacodynamics. The goal of this approach is to describe, predict,
and if possible understand the time course of the antibiotic effect as a function of the drug
dosage regimen (Figure 2).
- 9 -
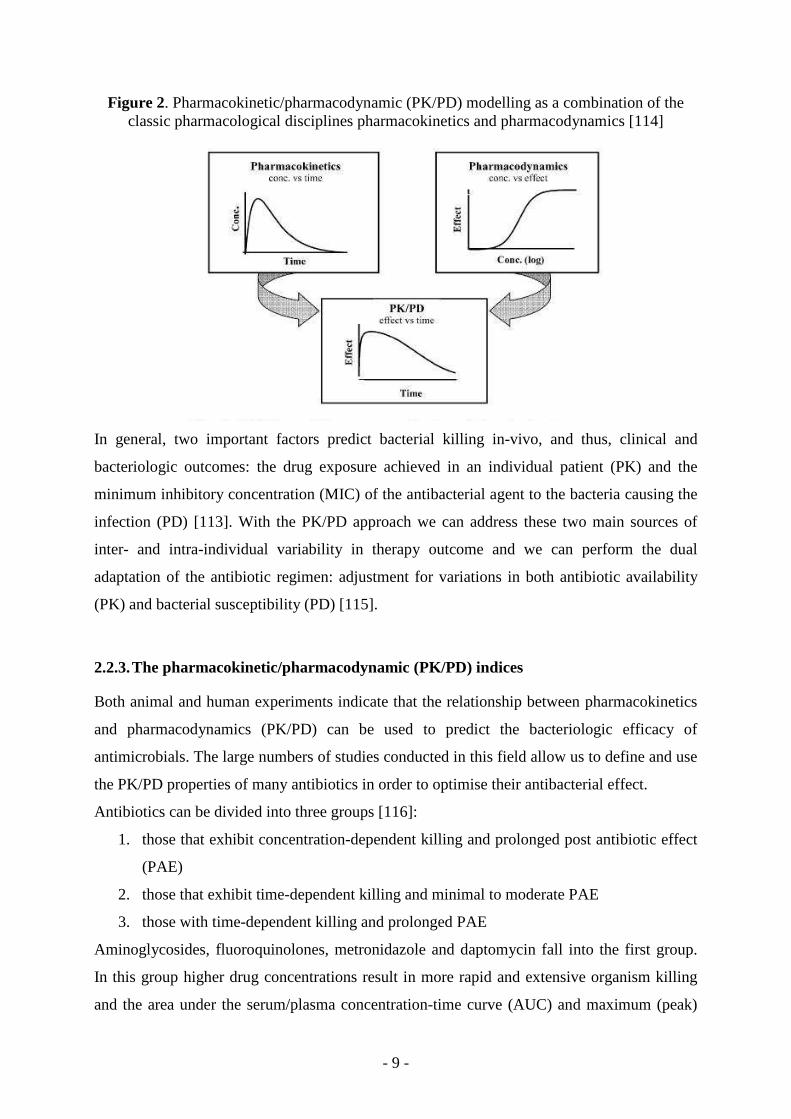
Figure 2. Pharmacokinetic/pharmacodynamic (PK/PD) modelling as a combination of the classic pharmacological disciplines pharmacokinetics and pharmacodynamics [114]
In general, two important factors predict bacterial killing in-vivo, and thus, clinical and
bacteriologic outcomes: the drug exposure achieved in an individual patient (PK) and the
minimum inhibitory concentration (MIC) of the antibacterial agent to the bacteria causing the
infection (PD) [113]. With the PK/PD approach we can address these two main sources of
inter- and intra-individual variability in therapy outcome and we can perform the dual
adaptation of the antibiotic regimen: adjustment for variations in both antibiotic availability
(PK) and bacterial susceptibility (PD) [115].
2.2.3. The pharmacokinetic/pharmacodynamic (PK/PD) indices
Both animal and human experiments indicate that the relationship between pharmacokinetics
and pharmacodynamics (PK/PD) can be used to predict the bacteriologic efficacy of
antimicrobials. The large numbers of studies conducted in this field allow us to define and use
the PK/PD properties of many antibiotics in order to optimise their antibacterial effect.
Antibiotics can be divided into three groups [116]:
1. those that exhibit concentration-dependent killing and prolonged post antibiotic effect
(PAE)
2. those that exhibit time-dependent killing and minimal to moderate PAE
3. those with time-dependent killing and prolonged PAE
Aminoglycosides, fluoroquinolones, metronidazole and daptomycin fall into the first group.
In this group higher drug concentrations result in more rapid and extensive organism killing
and the area under the serum/plasma concentration-time curve (AUC) and maximum (peak)
- 10 -
serum/plasma drug levels (Cmax) in relation to the MIC of the causative pathogen (AUC/MIC
ratio and Cmax/MIC ratio, respectively) are the major PK/PD indices correlating with efficacy.
Beta-lactams are belonging to the second group where extending the duration of exposure
optimizes antimicrobial activity. For this group of antibacterials the time the serum/plasma
concentration of the antibiotic remains above the MIC (T>MIC) is the PK/PD index
determining the in-vivo efficacy.
The third pattern of activity is observed for glycopeptides, linezolid, quinupristin/dalfopristin
and the glycylcyclines. In this case higher antibacterial concentrations do not enhance
organism killing but produce prolonged suppression of organism regrowth. The goal of dosing
with these drugs is to optimize the amount of drug. The AUC/MIC ratio is the index most
closely associated with efficacy.
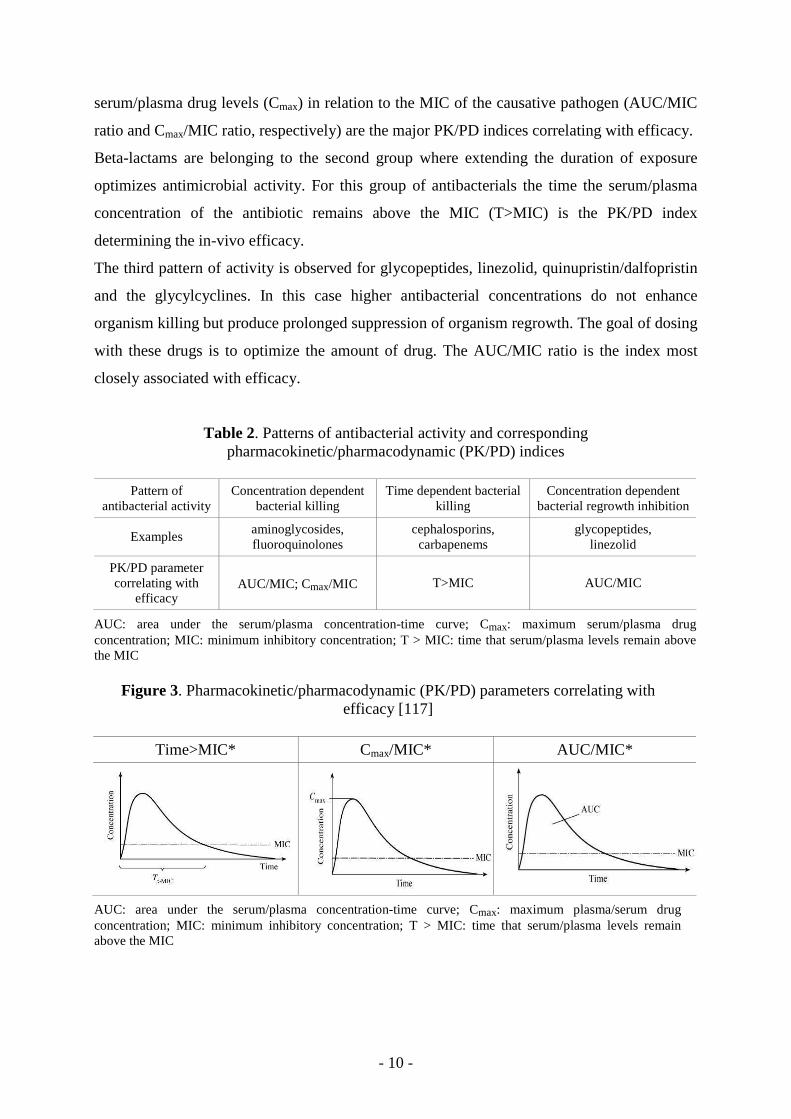
Table 2. Patterns of antibacterial activity and corresponding pharmacokinetic/pharmacodynamic (PK/PD) indices
Pattern of
antibacterial activity Concentration dependent
bacterial killing Time dependent bacterial
killing Concentration dependent
bacterial regrowth inhibition
Examples aminoglycosides, fluoroquinolones
cephalosporins, carbapenems
glycopeptides, linezolid
PK/PD parameter correlating with
efficacy AUC/MIC; Cmax/MIC T>MIC AUC/MIC
AUC: area under the serum/plasma concentration-time curve; Cmax: maximum serum/plasma drug concentration; MIC: minimum inhibitory concentration; T > MIC: time that serum/plasma levels remain above the MIC
Figure 3. Pharmacokinetic/pharmacodynamic (PK/PD) parameters correlating with efficacy [117]
Time>MIC* Cmax/MIC* AUC/MIC*
AUC: area under the serum/plasma concentration-time curve; Cmax: maximum plasma/serum drug concentration; MIC: minimum inhibitory concentration; T > MIC: time that serum/plasma levels remain above the MIC
- 11 -
Before analysing in detail the PK/PD properties of fluoroquinolones it is necessary to note
that only the free or unbound fraction of the drug is responsible for the antibacterial effect
[118,119]. Most clinical pathogens are located extracellularly. If there is no barrier (e.g.
blood brain barrier) to impede drug diffusion, the free antibiotic concentration in the plasma
approximates its free concentration in the extracellular space. Therefore the free drug
concentration in plasma is the best drug-related predictor of clinical success even for tissue
infections [120-124] and it must be considered when examining the relationship between
PK parameters and in-vivo activity [111]. If not the free antibacterial fraction is meant, the
degree of protein binding should be stated in such a way that the concentration of the
unbound fraction of the drug can be readily calculated [111].
2.2.4. Pharmacokinetic/pharmacodynamic (PK/PD) indices determining the efficacy of fluoroquinolones
There is now general consensus that the clinical and microbiological outcomes of
fluoroquinolone treatment are favourable and selection of a mutant subpopulation is
preventable if at least an AUC/MIC≥100–125 and a Cmax/MIC of ~10 are achieved in
Gram-negative infections [125-129]. For Gram-positive pathogens, the minimum required
Cmax/MIC is also 10, whilst there is no complete agreement about the optimum AUC/MIC
target values [125,130,131]. An AUC/MIC of 30–50 is claimed to be optimal in numerous
studies performed mainly in vitro or animal models [132-139]. Other studies conducted on
different patient populations suggested a minimum AUC/MIC of 87–125 to achieve a
favourable outcome and to avoid development of resistance regardless of whether the
organism is Gram-positive or Gram-negative [129,131,140].
In my opinion, these higher PK/PD target values, derived from human studies should be
used when the in-vivo efficacy of fluoroquinolones are considered in patients.
2.2.5. Optimising antibacterial dosing in a clinical setting
The best scenario would be the use of PK parameters directly obtained from the individual
patient and obtain the MIC (PD parameter) of the organism causing the infection. However
in the everyday clinical practise this approach is not feasible. Therefore the PK/PD indices
should be calculated on the basis of local epidemiology (MIC 90 of the suspected organism:
see section 10.1. on page 60 for definition) and pharmacokinetic studies pertaining to the
target population (e.g. ICU patients).
- 12 -
In this thesis, I set out to determine the pharmacokinetic/pharmacodynamic variables of a
fluoroquinolone agent in intensive care unit (ICU) patients with ventilator-associated
pneumonia. The selection of the patient population, the infection type and the evaluated
antibacterial (levofloxacin) were motivated by the following facts:
• Ventilator-associated pneumonia (VAP) is the most frequent intensive care unit
(ICU)-acquired infection, accounting for 30–50% of all ICU infections [141-
143]
• Levofloxacin’s antibacterial spectra covers most of the organisms recovered
from ICU patients, therefore proposed for the treatment of multiple infectious
diseases in this setting [130]
• The number of reported studies on patients with VAP and treated with
levofloxacin is still limited, and only two with very different objectives have
been published so far [144,145]
• Despite the fact that pharmacokinetics of antimicrobial drugs are often altered in
ICU patients [146,147], the number of studies addressing the pharmacokinetics
of levofloxacin in critically ill subjects is low and based on measurements of
total drug levels [144,148-153] or limited to patients with renal replacement
therapy [154-158].
- 13 -
3. MAIN RESEARCH OBJECTIVES
3.1. Drug utilisation studies
1) To analyse the changes in the amount and structure of antibacterial consumption
in the hospital care sector in Hungary between 1996 and 2007.
2) To explore possible regional variations and investigate determinants of
antibiotic consumption in hospital care in Hungary.
3) To show antibiotic related activities in Hungarian adult intensive care units and
in their parent institute and analyse antibiotic use of Hungarian adult intensive
care units (preliminary study).
3.2. Pharmacokinetic study
1) To analyse the pharmacokinetics and pharmacodynamics of levofloxacin in
critically ill patients with ventilator-associated pneumonia.
2) To study the associations between pharmacokinetic and patient-related
parameters.
3) To evaluate the theoretic pharmacokinetic/pharmacodynamic (PK/PD)
appropriateness of different levofloxacin regimens.
- 14 -
4. METHODS
4.1. Drug utilisation studies
Similar to other drug utilisation publications, in the present dissertation the term ‘drug use’,
‘drug utilisation’ and ‘drug consumption’ are synonyms and are used interchangeably. All
statistical analyses in this section were performed with SPSS (version 15). A P value less
than 0.05 was considered as statistically significant.
4.1.1. National and regional hospital antibiotic consumption
Retrospective analysis of distribution data (from wholesalers to hospitals) was performed
on a 12-year period (1996-2007) for systemic antibacterials (i.e. ATC group J01). For the
whole country and for each Hungarian region (county), yearly crude data were kindly
provided by the IMS PharmMIS Consulting Company. This dataset means 100 % hospital
coverage. Hospital consumption includes data from chronic care institutions (e.g.
rehabilitation centres) but does not include data from nursing homes or any use for
outpatients (e.g. hospital’s out-patient departments). Product classification and defined
daily dose (DDD) calculations were performed according to the 2008 version of the WHO
ATC/DDD index [159].
Hospital-specific antibiotics (selected antibiotics mainly used in the hospital sector) were
defined, as previously proposed by the European Surveillance of Antibiotic Consumption
(ESAC) project, as third- and fourth-generation cephalosporins, carbapenems,
monobactams (note: monobactams are not available in the Hungarian market),
aminoglycosides, and glycopeptides [160].
Data on number of patient-days were obtained from the database of the National Health
Fund Administration [161]. In these data the days of admission and discharge are counted
together as one patient-day. Patient-days from chronic care institutions were included in
these data.
National and regional hospital antibiotic consumption was expressed in DDD per
100 patient-days. To enable international benchmarking with the ESAC data in the
discussion we also expressed antibiotic use data in DDD per 1,000 inhabitants and per day.
A linear regression (trend analysis) was set up to investigate the trends in the national
hospital antibiotic utilisation through the study period. Additionally, the top-list of
antibacterials and the number of active agents accounting for 90% of the total hospital
- 15 -
antibacterial use (i.e. DU90% segment) were determined as proposed by Bergman [162].
The DU90% method ranks drugs by volume of DDD and set the cut-off where the
cumulative percentile share of the ranked drugs reaches the 90% of total use.
4.1.2. Regional variations of hospital antibiotic consumption and its determinants
To assess the interregional variation in antibiotic consumption on the above (section 4.1.1)
mentioned dataset, the maximum/minimum (max/min) ratio was calculated. The relative
use of different antibacterial groups, the top-list of antibacterials and the number of active
agents in the DU90% segment was also compared between regions [162]. To investigate
the determinants for regional differences in hospital antibiotic consumption, we applied
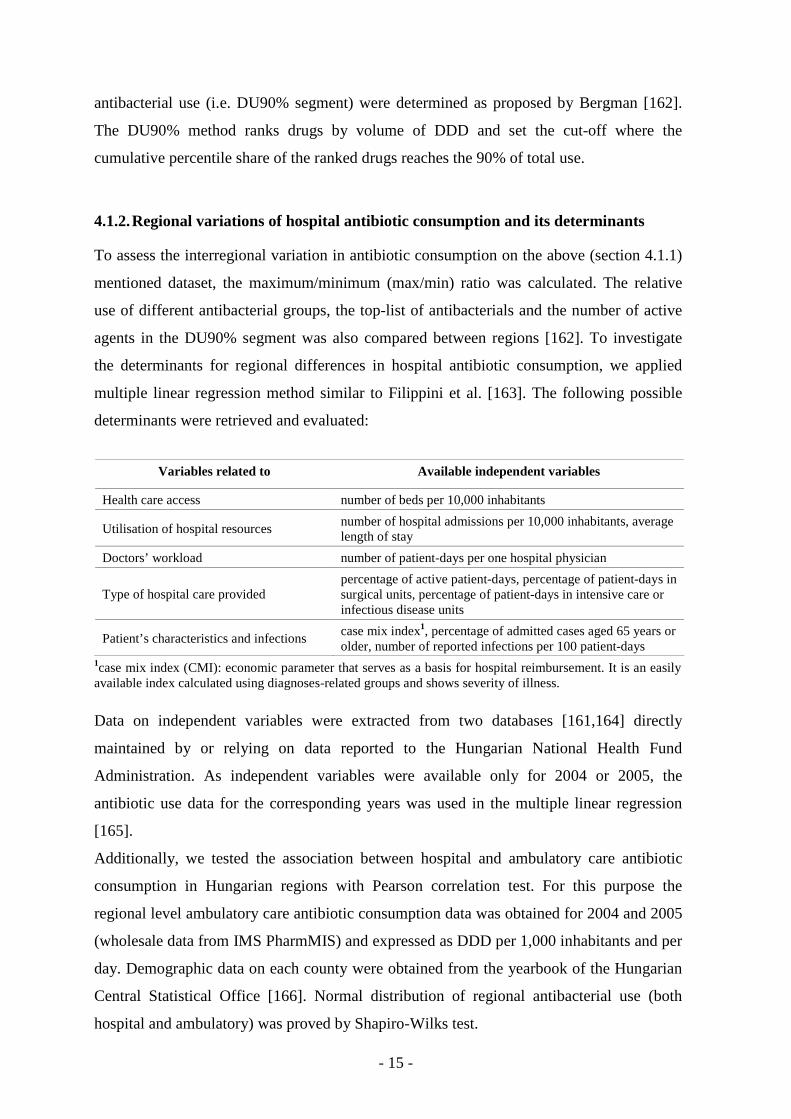
multiple linear regression method similar to Filippini et al. [163]. The following possible
determinants were retrieved and evaluated:
Variables related to Available independent variables
Health care access number of beds per 10,000 inhabitants
Utilisation of hospital resources number of hospital admissions per 10,000 inhabitants, average length of stay
Doctors’ workload number of patient-days per one hospital physician
Type of hospital care provided percentage of active patient-days, percentage of patient-days in surgical units, percentage of patient-days in intensive care or infectious disease units
Patient’s characteristics and infections case mix index1, percentage of admitted cases aged 65 years or older, number of reported infections per 100 patient-days
1case mix index (CMI): economic parameter that serves as a basis for hospital reimbursement. It is an easily available index calculated using diagnoses-related groups and shows severity of illness.
Data on independent variables were extracted from two databases [161,164] directly
maintained by or relying on data reported to the Hungarian National Health Fund
Administration. As independent variables were available only for 2004 or 2005, the
antibiotic use data for the corresponding years was used in the multiple linear regression
[165].
Additionally, we tested the association between hospital and ambulatory care antibiotic
consumption in Hungarian regions with Pearson correlation test. For this purpose the
regional level ambulatory care antibiotic consumption data was obtained for 2004 and 2005
(wholesale data from IMS PharmMIS) and expressed as DDD per 1,000 inhabitants and per
day. Demographic data on each county were obtained from the yearbook of the Hungarian
Central Statistical Office [166]. Normal distribution of regional antibacterial use (both
hospital and ambulatory) was proved by Shapiro-Wilks test.
- 16 -
4.1.3. Antibiotic related activities in Hungarian adult IC Us and in their parent institute
To assess the antibiotic related activities of Hungarian adult intensive care units (ICUs) and
their parent institutes a retrospective questionnaire study was performed. In this dissertation
I focus on answers related to hospital committees, certain elements of antibiotic policies,
antibiotic related educations, surveys on antibiotic use, information sources used to guide
antibiotic therapy and the involvement of hospital pharmacists. (Data on some elements of
antibiotic policy (e.g. existence of restricted antibiotic list) can be found only in the section
(5.1.5) where antibiotic use in Hungarian ICUs is analysed). Data on some unit and patient
characteristics (e.g. type of patients, number of patient-days, case-mix index, etc.) were also
provided in the questionnaire.
Our team (ICU specialists, microbiologist/infectologists; pharmacists) developed and
validated the questions. In the questionnaire development the survey of the ARPAC
(Antibiotic Resistance Prevention and Control) project was used as a template.
Questionnaires were sent both electronically and via normal post to the head of adult
Hungarian ICUs in December 2007.
4.1.4. Antibiotic use in Hungarian adult intensive care units
We intended to collect systemic antibiotic consumption data (i.e. ATC group J01) for those
Hungarian ICUs who sent back the above mentioned (section 4.1.3.) questionnaire.
Hospital pharmacies were contacted and asked to provide package level antibiotic use data
dispensed to their corresponding ICUs during 2006. Crude data was converted into DDDs
[159] and finally expressed as DDD per 100 patient-days (days of admission and discharge
counted together as one patient-day). Hospital specific antibiotics were defined in section
4.1.1., on page 14.
All submitted data on antibiotic use was validated. Outliers and unexpected values were
identified and ICUs, central pharmacy departments or controlling departments were
contacted for clarification.
ICUs were classified to be surgical, medical or interdisciplinary based on the treated patient
types. ICUs were also categorized according to the provided level of care (local, regional,
tertiary care). The relationship between antibiotic use at ICUs and certain elements of
antibiotic policy reported on the questionnaire or other possible influencing factors (e.g.
ICU type, case-mix index) were also examined. To explore differences and relationships
the analysis of variances (ANOVA) with Bonferonni post-hoc test or the Pearson
correlation analysis was performed, as applicable.
- 17 -
4.2. Pharmacokinetic study
4.2.1. Study design and entry criteria
A prospective, open-label study was performed between September 2003 and December
2005 in a 6-bed neurotrauma ICU. The protocol was previously approved by the local
Ethics Committee (section 10.2. on page 61). Fourteen ICU patients, in whom intravenous
levofloxacin therapy was started and the following requirements were fulfilled, were
enrolled:
• over 16 years of age
• suspected ventilator-associated pneumonia (VAP), defined as a Clinical Pulmonary
Infection Score (CPIS) ≥ 6
• informed consent obtained from the closest relative
• the renal function was normal as defined by an estimated creatinine clearance
(CLCR) > 50 mL/min, based on the Cockroft-Gault formula
• presence of intra-arterial and central venous lines in situ
CPIS calculation was different from the original [167] as quantitative culturing was
performed instead of semi-quantitative and were scored as follows: protected
bronchoalveolar lavage (pBAL) ≥ 103 colony forming units (CFU)/mL; quantitative
endotracheal aspirates (QEAs) or bronchoalveolar lavage (BAL) ≥ 105 CFU/mL was
scored with 2 points; in other cases the score was zero. Patients were excluded from the
study if they developed a renal insufficiency with an estimated CLCR of < 50 mL/min, were
on dialysis; or they had received levofloxacin within 2 weeks prior to study recruitment.
4.2.2. Drug administration and sample collection
Levofloxacin (2×500 mg on the first day and 1×500 mg on consecutive days) was
administered as an intravenous infusion for 60 min through a central venous catheter.
Samples for levofloxacin plasma concentration determinations were obtained from an
arterial line under steady-state conditions. Blood samples were collected in heparinized
glass tubes (BD Vacutainer system) before the infusion and 30, 60 min; and 2, 4, 6, 8, 12,
18, and 24 h after the start of the infusion and were promptly separated (centrifugation at
4 ºC). Plasma was transferred to labelled polypropylene test tubes and kept frozen at -70 ºC
until assayed. The concentrations of free levofloxacin in the plasma were determined by
high-pressure liquid chromatography (HPLC) after minor in-house modifications and
validation of a previously developed method [168]. For removing plasma proteins the
- 18 -
thawed samples were transferred to a Centrifree Micropartition Device (Millipore,
Bedford, MA) and centrifuged at 2000g (50 min, 37 ºC). The assay was linear over the
standard curve concentration range from 0.13 to 16.67 mg/L. The levels of precision,
expressed as inter- and intraday coefficients of variation, were < 10%. The lower limits of
detection and quantification were 0.04 mg/L and 0.13 mg/L, respectively.
4.2.3. Pharmacokinetic and statistical analysis
In the present study all pharmacokinetic terms were used in accordance with the updated
terminology [111]. Individual patient plasma concentration−time data were analysed by a
two-compartment open model with first-order elimination, using the WinNonLin software
package (version 5.1, Pharsight Corp., Mountain View, CA, USA). The following
parameters were determined: the elimination half-life (T1/2β), the volume of distribution
(fVd) and the total body levofloxacin clearance (CL). The steady-state area under the free
plasma concentration−time curve over 24 hours (fAUC) determination was based on the
linear trapezoidal rule. The maximum free plasma concentration at steady state (fCmax,ss),
and the minimum free plasma concentration at steady state (fCmin,ss) were observed directly
as the concentrations at the end of the infusion and at 24 h (just before the next dose),
respectively.
Statistical analysis was performed with the SPSS program package. For continuous
variables the normal distribution was tested by the Kolmogorov-Smirnov test. The possible
association between pharmacokinetic (fAUC, fCmax,ss and CL) and different patient
parameters (weight, age, CLCR, SAPS II score, administration of diuretic drugs) were
tested by multiple linear regression. P values below 0.05 were considered statistically
significant.
4.2.4. Efficacy assessment
The pharmacokinetic/pharmacodynamic (PK/PD) appropriateness of levofloxacin therapy
was assessed by calculating the two most relevant PK/PD indices: the fCmax,ss/MIC and the
fAUC/MIC [116,117,125,127,131]. The target values - reported by various studies - for
these PK/PD parameters are discussed in the background section (section 2.2.4.). In this
dissertation I used an AUC/MIC target of 100-125 for both Gram-negatives and Gram-
positives, as these higher PK/PD target values were derived from human studies and they
are more relevant in the context of this dissertation.
- 19 -
As the PK/PD ratios – used as target values in the present study – were set up using total
drug levels [127,129,140], the fCmax,ss and fAUC values were also corrected for protein
binding (assuming 31% bound fraction) in these calculations and were indicated as Cmax,ss
and AUC.
Although only a limited number of patients were enrolled in this study, both clinical and
microbiological outcomes were assessed.
Clinical signs and laboratory data used for setting up diagnosis (incorporated in CPIS
score) were evaluated at the conclusion of the therapy as follows:
• Cure: disappearance of all signs and symptoms related to the infection
• Improvement: a marked reduction in the severity and/or number of signs and
symptoms of infection
• Failure: deterioration or the absence of improvement of the clinical signs.
Microbiological efficacy:
• Eradication: a previously positive culture of a clinical sample became negative and
remained negative upon continued culturing
• Failure: the lack of complete eradication of the original organism
• Superinfection: during or immediately after the end of therapy there was growth of
a new organism that was judged to be causing an infectious process.
Microbiological samples were analysed quantitatively, and cytological inspection was
carried out to reveal the presence of neutrophil granulocytes and intracellular bacteria.
Bacterial isolates were identified on species level using standard methods. Susceptibility to
relevant antibiotics (including levofloxacin) prior to therapy was tested by the disc
diffusion technique according to the standards of the Clinical and Laboratory Standards
Institute (CLSI) [169]. The MICs of the different causative pathogens for levofloxacin
were determined later, by the E-test method (AB Biodisk, Solna, Sweden).
- 20 -
5. RESULTS
5.1. Drug utilisation studies
5.1.1. National trends in antibacterial utilisation
National hospital antibiotic consumption in total number of DDDs has decreased by 27 %
(from 6.16 to 4.48 million DDDs) between 1996 and 2007. As the total number of hospital
patient-days has also decreased by 24 % (from 25.50 million to 19.28 million patient-days)
the standardized consumption unit remained relatively stable during the period 1996-2007
(mean ± standard deviation: 22.0 ± 1.7 DDD per 100 patient-days). In each year hospital-
based antibiotic use accounted for 6.0−8.2 % of the total national consumption. The gradual
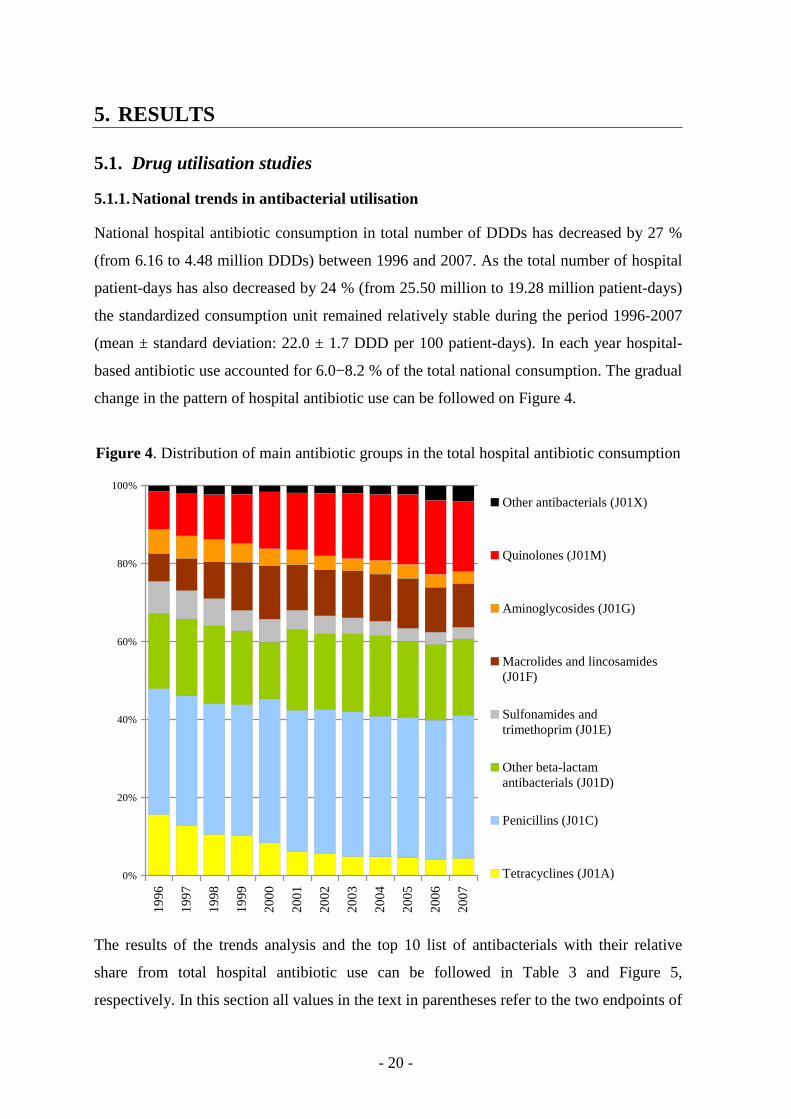
change in the pattern of hospital antibiotic use can be followed on Figure 4.
Figure 4. Distribution of main antibiotic groups in the total hospital antibiotic consumption
0%
20%
40%
60%
80%
100%
19
96
19
97
19
98
19
99
20
00
20
01
20
02
20
03
20
04
20
05
20
06
20
07
Other antibacterials (J01X)
Quinolones (J01M)
Aminoglycosides (J01G)
Macrolides and lincosamides(J01F)
Sulfonamides andtrimethoprim (J01E)
Other beta-lactamantibacterials (J01D)
Penicillins (J01C)
Tetracyclines (J01A)
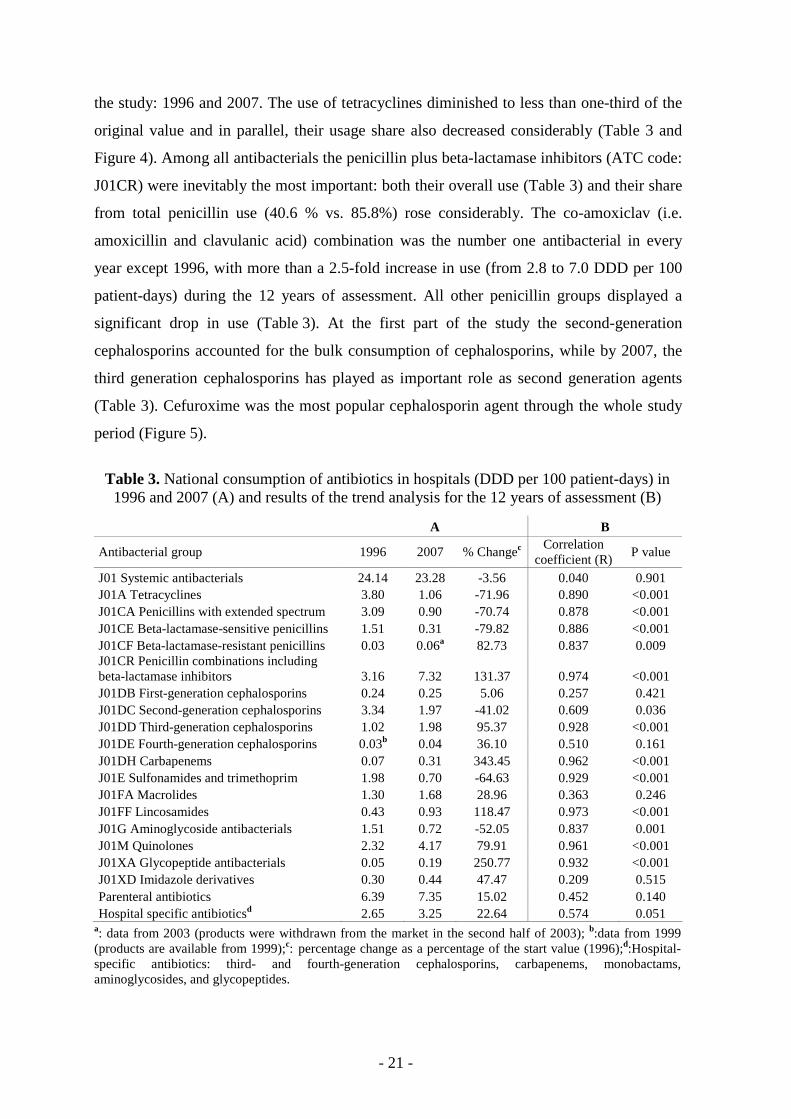
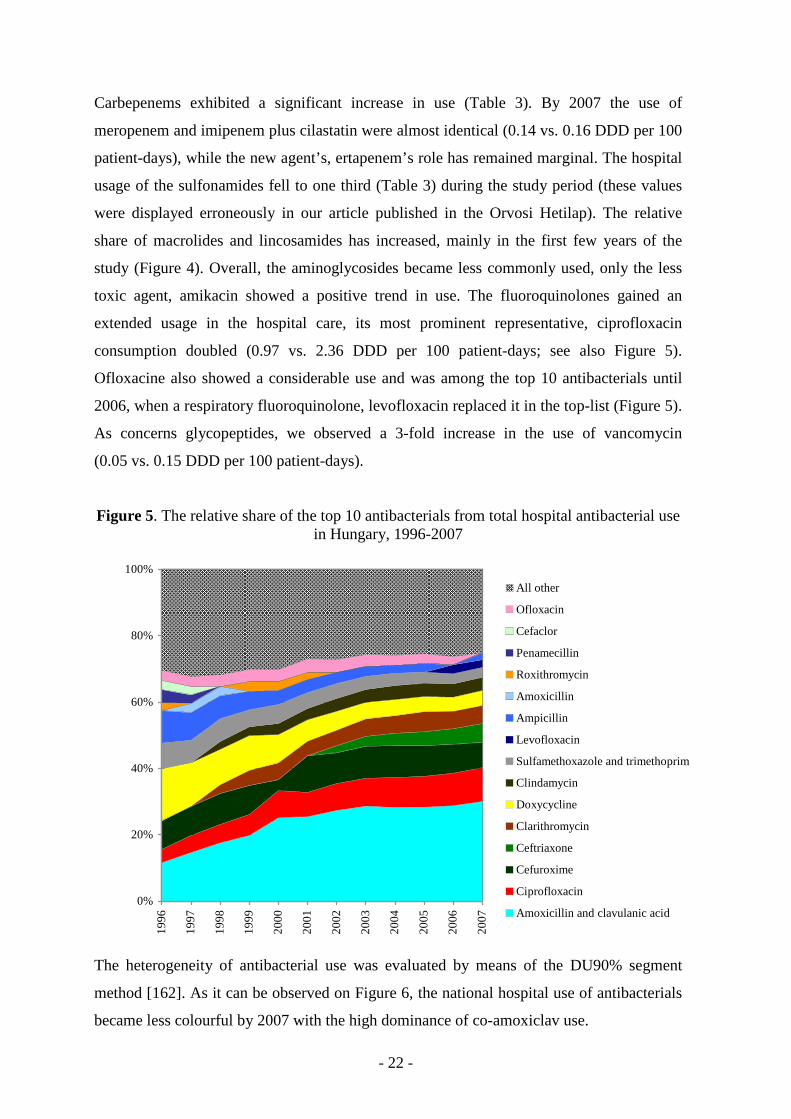
The results of the trends analysis and the top 10 list of antibacterials with their relative
share from total hospital antibiotic use can be followed in Table 3 and Figure 5,
respectively. In this section all values in the text in parentheses refer to the two endpoints of
- 21 -
the study: 1996 and 2007. The use of tetracyclines diminished to less than one-third of the
original value and in parallel, their usage share also decreased considerably (Table 3 and
Figure 4). Among all antibacterials the penicillin plus beta-lactamase inhibitors (ATC code:
J01CR) were inevitably the most important: both their overall use (Table 3) and their share
from total penicillin use (40.6 % vs. 85.8%) rose considerably. The co-amoxiclav (i.e.
amoxicillin and clavulanic acid) combination was the number one antibacterial in every
year except 1996, with more than a 2.5-fold increase in use (from 2.8 to 7.0 DDD per 100
patient-days) during the 12 years of assessment. All other penicillin groups displayed a
significant drop in use (Table 3). At the first part of the study the second-generation
cephalosporins accounted for the bulk consumption of cephalosporins, while by 2007, the
third generation cephalosporins has played as important role as second generation agents
(Table 3). Cefuroxime was the most popular cephalosporin agent through the whole study
period (Figure 5).
Table 3. National consumption of antibiotics in hospitals (DDD per 100 patient-days) in 1996 and 2007 (A) and results of the trend analysis for the 12 years of assessment (B)
A B
Antibacterial group 1996 2007 % Changec Correlation
coefficient (R) P value
J01 Systemic antibacterials 24.14 23.28 -3.56 0.040 0.901 J01A Tetracyclines 3.80 1.06 -71.96 0.890 <0.001 J01CA Penicillins with extended spectrum 3.09 0.90 -70.74 0.878 <0.001 J01CE Beta-lactamase-sensitive penicillins 1.51 0.31 -79.82 0.886 <0.001 J01CF Beta-lactamase-resistant penicillins 0.03 0.06a 82.73 0.837 0.009 J01CR Penicillin combinations including beta-lactamase inhibitors 3.16 7.32 131.37 0.974 <0.001 J01DB First-generation cephalosporins 0.24 0.25 5.06 0.257 0.421 J01DC Second-generation cephalosporins 3.34 1.97 -41.02 0.609 0.036 J01DD Third-generation cephalosporins 1.02 1.98 95.37 0.928 <0.001 J01DE Fourth-generation cephalosporins 0.03b 0.04 36.10 0.510 0.161 J01DH Carbapenems 0.07 0.31 343.45 0.962 <0.001 J01E Sulfonamides and trimethoprim 1.98 0.70 -64.63 0.929 <0.001 J01FA Macrolides 1.30 1.68 28.96 0.363 0.246 J01FF Lincosamides 0.43 0.93 118.47 0.973 <0.001 J01G Aminoglycoside antibacterials 1.51 0.72 -52.05 0.837 0.001 J01M Quinolones 2.32 4.17 79.91 0.961 <0.001 J01XA Glycopeptide antibacterials 0.05 0.19 250.77 0.932 <0.001 J01XD Imidazole derivatives 0.30 0.44 47.47 0.209 0.515 Parenteral antibiotics 6.39 7.35 15.02 0.452 0.140 Hospital specific antibioticsd 2.65 3.25 22.64 0.574 0.051
a: data from 2003 (products were withdrawn from the market in the second half of 2003); b:data from 1999 (products are available from 1999);c: percentage change as a percentage of the start value (1996);d:Hospital-specific antibiotics: third- and fourth-generation cephalosporins, carbapenems, monobactams, aminoglycosides, and glycopeptides.
- 22 -
Carbepenems exhibited a significant increase in use (Table 3). By 2007 the use of
meropenem and imipenem plus cilastatin were almost identical (0.14 vs. 0.16 DDD per 100
patient-days), while the new agent’s, ertapenem’s role has remained marginal. The hospital
usage of the sulfonamides fell to one third (Table 3) during the study period (these values
were displayed erroneously in our article published in the Orvosi Hetilap). The relative
share of macrolides and lincosamides has increased, mainly in the first few years of the
study (Figure 4). Overall, the aminoglycosides became less commonly used, only the less
toxic agent, amikacin showed a positive trend in use. The fluoroquinolones gained an
extended usage in the hospital care, its most prominent representative, ciprofloxacin
consumption doubled (0.97 vs. 2.36 DDD per 100 patient-days; see also Figure 5).
Ofloxacine also showed a considerable use and was among the top 10 antibacterials until
2006, when a respiratory fluoroquinolone, levofloxacin replaced it in the top-list (Figure 5).
As concerns glycopeptides, we observed a 3-fold increase in the use of vancomycin
(0.05 vs. 0.15 DDD per 100 patient-days).
Figure 5. The relative share of the top 10 antibacterials from total hospital antibacterial use in Hungary, 1996-2007
0%
20%
40%
60%
80%
100%
19
96
19
97
19
98
19
99
20
00
20
01
20
02
20
03
20
04
20
05
20
06
20
07
All other
Ofloxacin
Cefaclor
Penamecillin
Roxithromycin
Amoxicillin
Ampicillin
Levofloxacin
Sulfamethoxazole and trimethoprim
Clindamycin
Doxycycline
Clarithromycin
Ceftriaxone
Cefuroxime
Ciprofloxacin
Amoxicillin and clavulanic acid
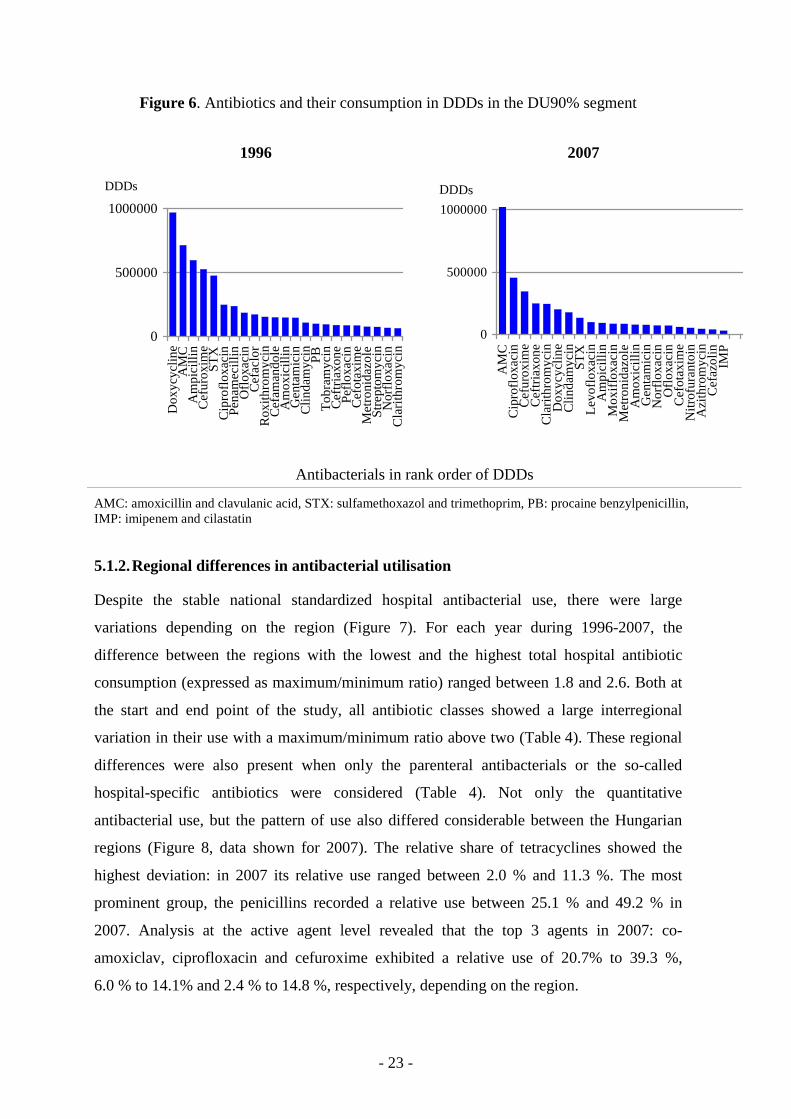
The heterogeneity of antibacterial use was evaluated by means of the DU90% segment
method [162]. As it can be observed on Figure 6, the national hospital use of antibacterials
became less colourful by 2007 with the high dominance of co-amoxiclav use.
- 23 -
Figure 6. Antibiotics and their consumption in DDDs in the DU90% segment
1996 2007
0
500000
1000000
Do
xycy
clin
eA
MC
Am
pic
illin
Ce
furo
xim
eS
TX
Cip
roflo
xaci
nP
en
am
eci
llin
Oflo
xaci
nC
efa
clo
rR
oxi
thro
myc
inC
efa
ma
nd
ole
Am
oxi
cilli
nG
en
tam
icin
Clin
da
myc
inP
BT
ob
ram
ycin
Ce
ftri
axo
ne
Pe
floxa
cin
Ce
fota
xim
eM
etr
on
ida
zole
Str
ep
tom
ycin
No
rflo
xaci
nC
lari
thro
myc
in
DDDs
0
500000
1000000
AM
CC
ipro
floxa
cin
Ce
furo
xim
eC
eft
ria
xon
eC
lari
thro
myc
inD
oxy
cycl
ine
Clin
da
myc
inS
TX
Le
voflo
xaci
nA
mp
icill
inM
oxi
floxa
cin
Me
tro
nid
azo
leA
mo
xici
llin
Ge
nta
mic
inN
orf
loxa
cin
Oflo
xaci
nC
efo
taxi
me
Nitr
ofu
ran
toin
Azi
thro
myc
inC
efa
zolin
IMP
DDDs
Antibacterials in rank order of DDDs
AMC: amoxicillin and clavulanic acid, STX: sulfamethoxazol and trimethoprim, PB: procaine benzylpenicillin, IMP: imipenem and cilastatin
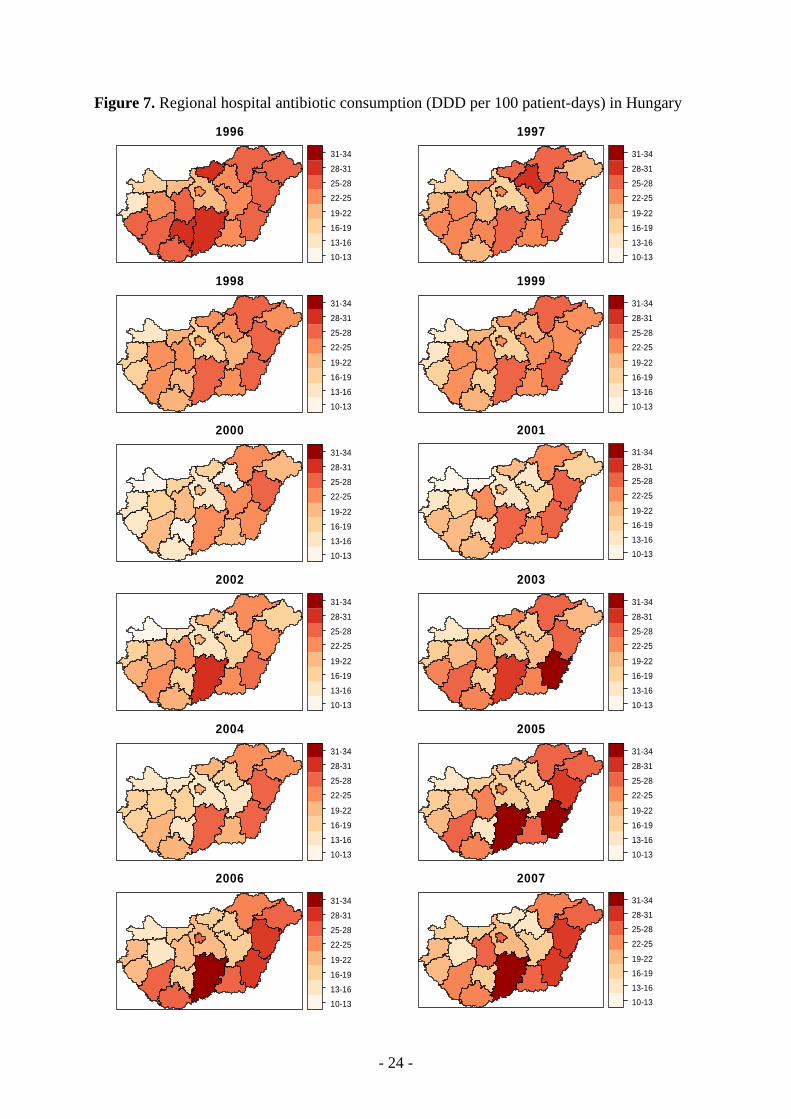
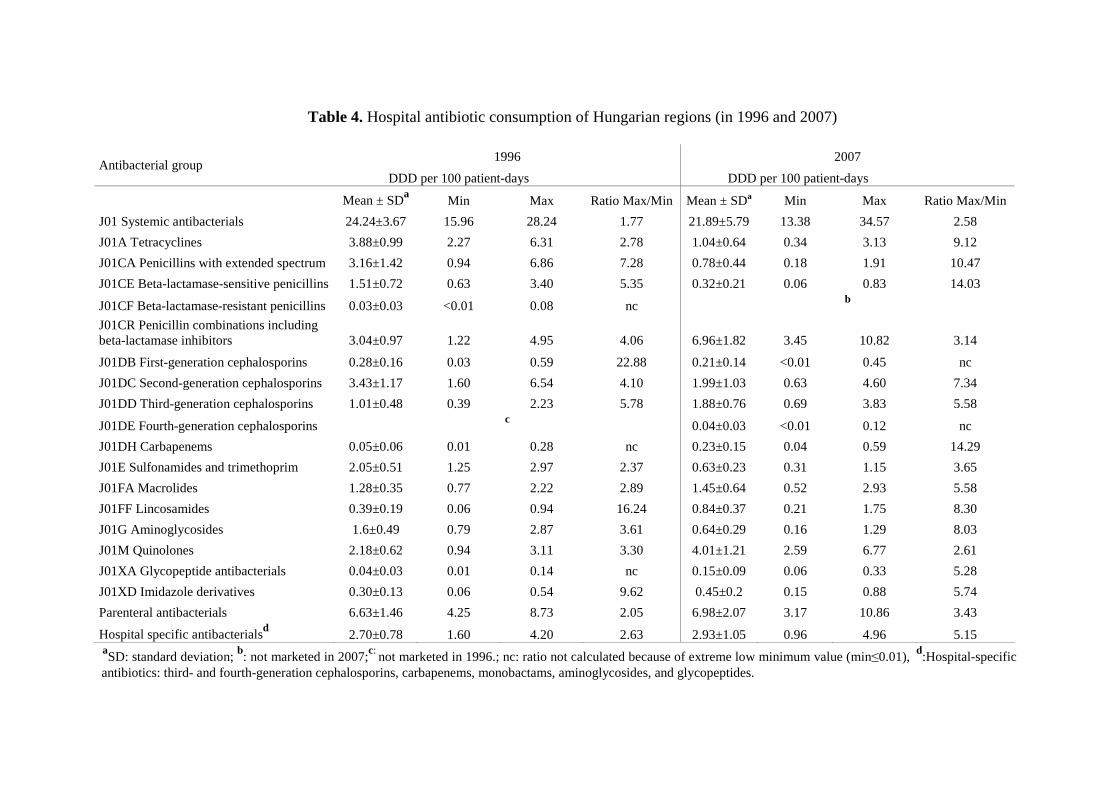
5.1.2. Regional differences in antibacterial utilisation
Despite the stable national standardized hospital antibacterial use, there were large
variations depending on the region (Figure 7). For each year during 1996-2007, the
difference between the regions with the lowest and the highest total hospital antibiotic
consumption (expressed as maximum/minimum ratio) ranged between 1.8 and 2.6. Both at
the start and end point of the study, all antibiotic classes showed a large interregional
variation in their use with a maximum/minimum ratio above two (Table 4). These regional
differences were also present when only the parenteral antibacterials or the so-called
hospital-specific antibiotics were considered (Table 4). Not only the quantitative
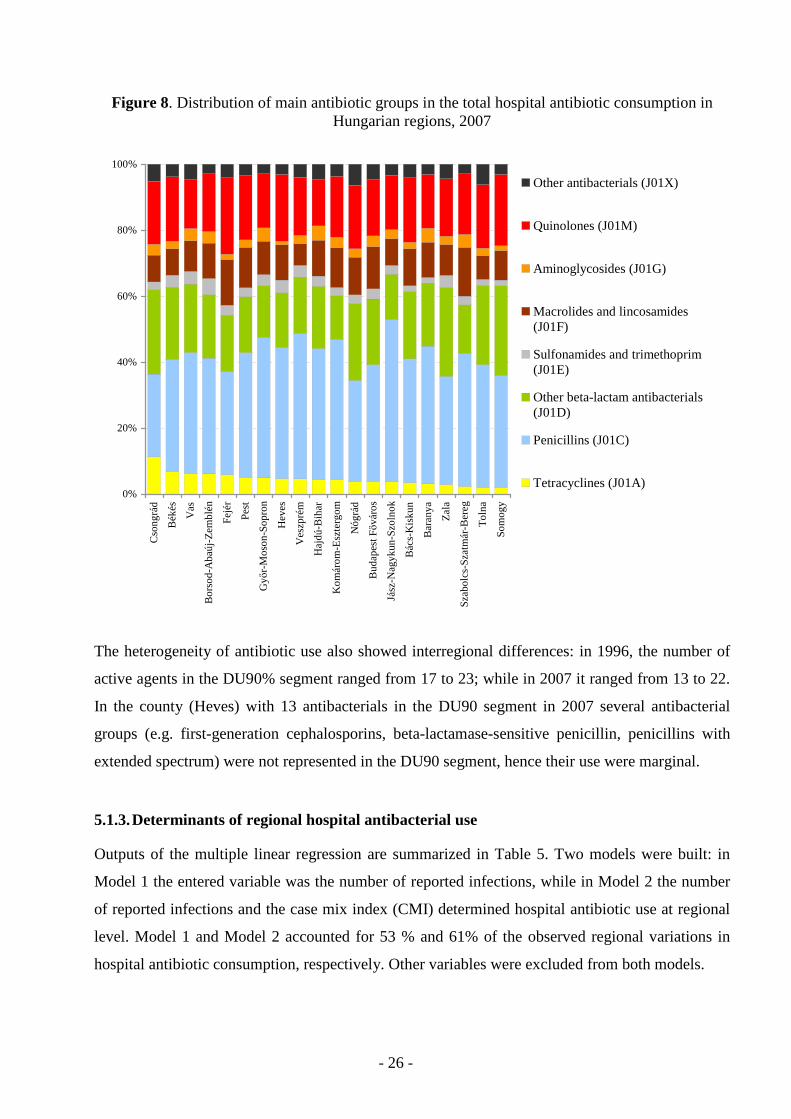
antibacterial use, but the pattern of use also differed considerable between the Hungarian
regions (Figure 8, data shown for 2007). The relative share of tetracyclines showed the
highest deviation: in 2007 its relative use ranged between 2.0 % and 11.3 %. The most
prominent group, the penicillins recorded a relative use between 25.1 % and 49.2 % in
2007. Analysis at the active agent level revealed that the top 3 agents in 2007: co-
amoxiclav, ciprofloxacin and cefuroxime exhibited a relative use of 20.7% to 39.3 %,
6.0 % to 14.1% and 2.4 % to 14.8 %, respectively, depending on the region.
- 24 -
Figure 7. Regional hospital antibiotic consumption (DDD per 100 patient-days) in Hungary
1996
10-13
13-16
16-19
19-22
22-25
25-28
28-31
31-34
1997
10-13
13-16
16-19
19-22
22-25
25-28
28-31
31-34
1998
10-13
13-16
16-19
19-22
22-25
25-28
28-31
31-34
1999
10-13
13-16
16-19
19-22
22-25
25-28
28-31
31-34
2000
10-13
13-16
16-19
19-22
22-25
25-28
28-31
31-34
2001
10-13
13-16
16-19
19-22
22-25
25-28
28-31
31-34
2002
10-13
13-16
16-19
19-22
22-25
25-28
28-31
31-34
2003
10-13
13-16
16-19
19-22
22-25
25-28
28-31
31-34
2004
10-13
13-16
16-19
19-22
22-25
25-28
28-31
31-34
2005
10-13
13-16
16-19
19-22
22-25
25-28
28-31
31-34
2006
10-13
13-16
16-19
19-22
22-25
25-28
28-31
31-34
2007
10-13
13-16
16-19
19-22
22-25
25-28
28-31
31-34
- 25 -
Table 4. Hospital antibiotic consumption of Hungarian regions (in 1996 and 2007)
1996 2007 Antibacterial group
DDD per 100 patient-days DDD per 100 patient-days
Mean ± SDa Min Max Ratio Max/Min Mean ± SDa Min Max Ratio Max/Min
J01 Systemic antibacterials 24.24±3.67 15.96 28.24 1.77 21.89±5.79 13.38 34.57 2.58
J01A Tetracyclines 3.88±0.99 2.27 6.31 2.78 1.04±0.64 0.34 3.13 9.12
J01CA Penicillins with extended spectrum 3.16±1.42 0.94 6.86 7.28 0.78±0.44 0.18 1.91 10.47
J01CE Beta-lactamase-sensitive penicillins 1.51±0.72 0.63 3.40 5.35 0.32±0.21 0.06 0.83 14.03
J01CF Beta-lactamase-resistant penicillins 0.03±0.03 <0.01 0.08 nc b
J01CR Penicillin combinations including beta-lactamase inhibitors 3.04±0.97 1.22 4.95 4.06 6.96±1.82 3.45 10.82 3.14
J01DB First-generation cephalosporins 0.28±0.16 0.03 0.59 22.88 0.21±0.14 <0.01 0.45 nc
J01DC Second-generation cephalosporins 3.43±1.17 1.60 6.54 4.10 1.99±1.03 0.63 4.60 7.34
J01DD Third-generation cephalosporins 1.01±0.48 0.39 2.23 5.78 1.88±0.76 0.69 3.83 5.58
J01DE Fourth-generation cephalosporins c
0.04±0.03 <0.01 0.12 nc
J01DH Carbapenems 0.05±0.06 0.01 0.28 nc 0.23±0.15 0.04 0.59 14.29
J01E Sulfonamides and trimethoprim 2.05±0.51 1.25 2.97 2.37 0.63±0.23 0.31 1.15 3.65
J01FA Macrolides 1.28±0.35 0.77 2.22 2.89 1.45±0.64 0.52 2.93 5.58
J01FF Lincosamides 0.39±0.19 0.06 0.94 16.24 0.84±0.37 0.21 1.75 8.30
J01G Aminoglycosides 1.6±0.49 0.79 2.87 3.61 0.64±0.29 0.16 1.29 8.03
J01M Quinolones 2.18±0.62 0.94 3.11 3.30 4.01±1.21 2.59 6.77 2.61
J01XA Glycopeptide antibacterials 0.04±0.03 0.01 0.14 nc 0.15±0.09 0.06 0.33 5.28
J01XD Imidazole derivatives 0.30±0.13 0.06 0.54 9.62 0.45±0.2 0.15 0.88 5.74
Parenteral antibacterials 6.63±1.46 4.25 8.73 2.05 6.98±2.07 3.17 10.86 3.43
Hospital specific antibacterialsd 2.70±0.78 1.60 4.20 2.63 2.93±1.05 0.96 4.96 5.15 aSD: standard deviation; b: not marketed in 2007;c: not marketed in 1996.; nc: ratio not calculated because of extreme low minimum value (min≤0.01), d:Hospital-specific antibiotics: third- and fourth-generation cephalosporins, carbapenems, monobactams, aminoglycosides, and glycopeptides.
- 26 -
Figure 8. Distribution of main antibiotic groups in the total hospital antibiotic consumption in Hungarian regions, 2007
0%
20%
40%
60%
80%
100%C
son
grá
d
Bé
kés
Va
s
Bo
rso
d-A
ba
új-Z
em
blé
n
Fe
jér
Pe
st
Gy ı
r-M
oso
n-S
op
ron
He
ves
Ve
szp
rém
Ha
jdú
-Bih
ar
Ko
má
rom
-Esz
terg
om
Nó
grá
d
Bu
da
pe
st Fı
váro
s
Jász
-Na
gyk
un
-Szo
lno
k
Bá
cs-K
isku
n
Ba
ran
ya
Za
la
Sza
bo
lcs-
Sza
tmá
r-B
ere
g
To
lna
So
mo
gy
Other antibacterials (J01X)
Quinolones (J01M)
Aminoglycosides (J01G)
Macrolides and lincosamides(J01F)
Sulfonamides and trimethoprim(J01E)
Other beta-lactam antibacterials(J01D)
Penicillins (J01C)
Tetracyclines (J01A)
The heterogeneity of antibiotic use also showed interregional differences: in 1996, the number of
active agents in the DU90% segment ranged from 17 to 23; while in 2007 it ranged from 13 to 22.
In the county (Heves) with 13 antibacterials in the DU90 segment in 2007 several antibacterial
groups (e.g. first-generation cephalosporins, beta-lactamase-sensitive penicillin, penicillins with
extended spectrum) were not represented in the DU90 segment, hence their use were marginal.
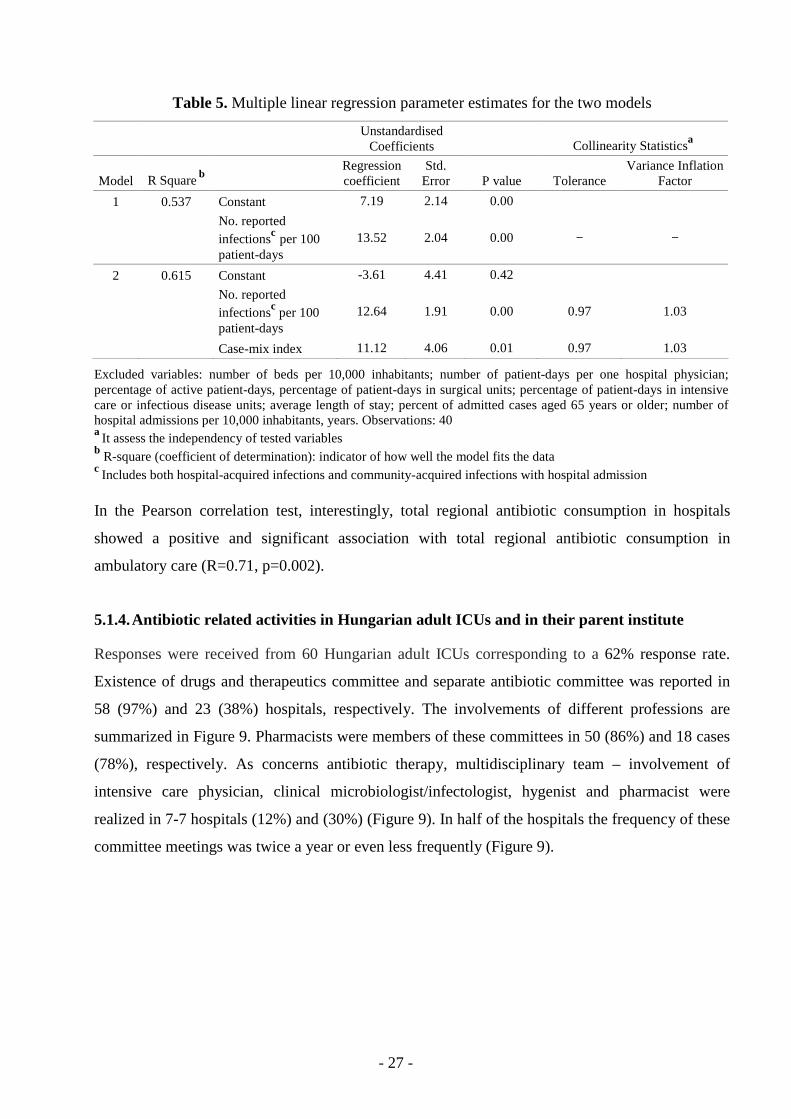
5.1.3. Determinants of regional hospital antibacterial use
Outputs of the multiple linear regression are summarized in Table 5. Two models were built: in
Model 1 the entered variable was the number of reported infections, while in Model 2 the number
of reported infections and the case mix index (CMI) determined hospital antibiotic use at regional
level. Model 1 and Model 2 accounted for 53 % and 61% of the observed regional variations in
hospital antibiotic consumption, respectively. Other variables were excluded from both models.
- 27 -
Table 5. Multiple linear regression parameter estimates for the two models
Unstandardised
Coefficients Collinearity Statisticsa
Model R Square b Regression coefficient
Std. Error P value Tolerance
Variance Inflation Factor
1 0.537 Constant 7.19 2.14 0.00
No. reported infectionsc per 100 patient-days
13.52 2.04 0.00 − −
2 0.615 Constant -3.61 4.41 0.42
No. reported infectionsc per 100 patient-days
12.64 1.91 0.00 0.97 1.03
Case-mix index 11.12 4.06 0.01 0.97 1.03
Excluded variables: number of beds per 10,000 inhabitants; number of patient-days per one hospital physician; percentage of active patient-days, percentage of patient-days in surgical units; percentage of patient-days in intensive care or infectious disease units; average length of stay; percent of admitted cases aged 65 years or older; number of hospital admissions per 10,000 inhabitants, years. Observations: 40 a It assess the independency of tested variables b R-square (coefficient of determination): indicator of how well the model fits the data c Includes both hospital-acquired infections and community-acquired infections with hospital admission In the Pearson correlation test, interestingly, total regional antibiotic consumption in hospitals
showed a positive and significant association with total regional antibiotic consumption in
ambulatory care (R=0.71, p=0.002).
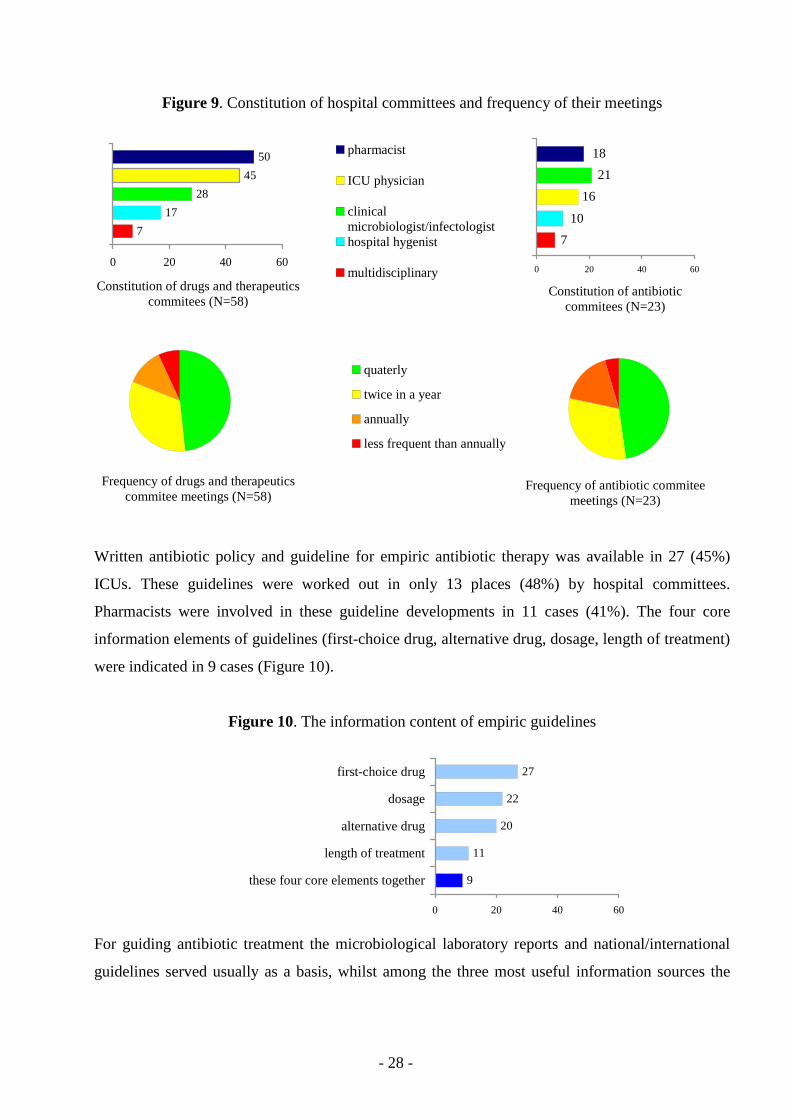
5.1.4. Antibiotic related activities in Hungarian adult IC Us and in their parent institute
Responses were received from 60 Hungarian adult ICUs corresponding to a 62% response rate.
Existence of drugs and therapeutics committee and separate antibiotic committee was reported in
58 (97%) and 23 (38%) hospitals, respectively. The involvements of different professions are
summarized in Figure 9. Pharmacists were members of these committees in 50 (86%) and 18 cases
(78%), respectively. As concerns antibiotic therapy, multidisciplinary team – involvement of
intensive care physician, clinical microbiologist/infectologist, hygenist and pharmacist were
realized in 7-7 hospitals (12%) and (30%) (Figure 9). In half of the hospitals the frequency of these
committee meetings was twice a year or even less frequently (Figure 9).
- 28 -
Figure 9. Constitution of hospital committees and frequency of their meetings
7
17
28
45
50
0 20 40 60
Constitution of drugs and therapeutics commitees (N=58)
pharmacist
ICU physician
clinicalmicrobiologist/infectologisthospital hygenist
multidisciplinary
7
10
16
21
18
0 20 40 60
Constitution of antibiotic commitees (N=23)
Frequency of drugs and therapeutics
commitee meetings (N=58)
quaterly
twice in a year
annually
less frequent than annually
Frequency of antibiotic commitee meetings (N=23)
Written antibiotic policy and guideline for empiric antibiotic therapy was available in 27 (45%)
ICUs. These guidelines were worked out in only 13 places (48%) by hospital committees.
Pharmacists were involved in these guideline developments in 11 cases (41%). The four core
information elements of guidelines (first-choice drug, alternative drug, dosage, length of treatment)
were indicated in 9 cases (Figure 10).
Figure 10. The information content of empiric guidelines
27
22
20
11
9
0 20 40 60
first-choice drug
dosage
alternative drug
length of treatment
these four core elements together
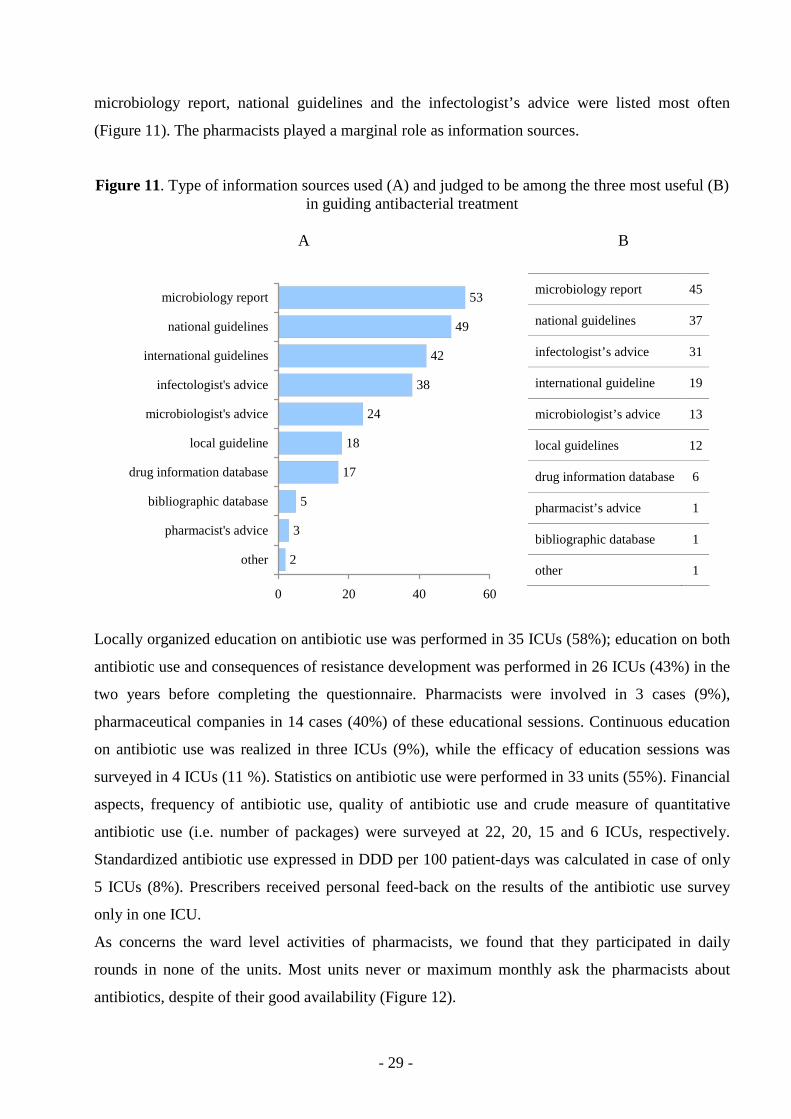
For guiding antibiotic treatment the microbiological laboratory reports and national/international
guidelines served usually as a basis, whilst among the three most useful information sources the
- 29 -
microbiology report, national guidelines and the infectologist’s advice were listed most often
(Figure 11). The pharmacists played a marginal role as information sources.
Figure 11. Type of information sources used (A) and judged to be among the three most useful (B) in guiding antibacterial treatment
A B
53
49
42
38
24
18
17
5
3
2
0 20 40 60
microbiology report
national guidelines
international guidelines
infectologist's advice
microbiologist's advice
local guideline
drug information database
bibliographic database
pharmacist's advice
other
microbiology report 45
national guidelines 37
infectologist’s advice 31
international guideline 19
microbiologist’s advice 13
local guidelines 12
drug information database 6
pharmacist’s advice 1
bibliographic database 1
other 1
Locally organized education on antibiotic use was performed in 35 ICUs (58%); education on both
antibiotic use and consequences of resistance development was performed in 26 ICUs (43%) in the
two years before completing the questionnaire. Pharmacists were involved in 3 cases (9%),
pharmaceutical companies in 14 cases (40%) of these educational sessions. Continuous education
on antibiotic use was realized in three ICUs (9%), while the efficacy of education sessions was
surveyed in 4 ICUs (11 %). Statistics on antibiotic use were performed in 33 units (55%). Financial
aspects, frequency of antibiotic use, quality of antibiotic use and crude measure of quantitative
antibiotic use (i.e. number of packages) were surveyed at 22, 20, 15 and 6 ICUs, respectively.
Standardized antibiotic use expressed in DDD per 100 patient-days was calculated in case of only
5 ICUs (8%). Prescribers received personal feed-back on the results of the antibiotic use survey
only in one ICU.
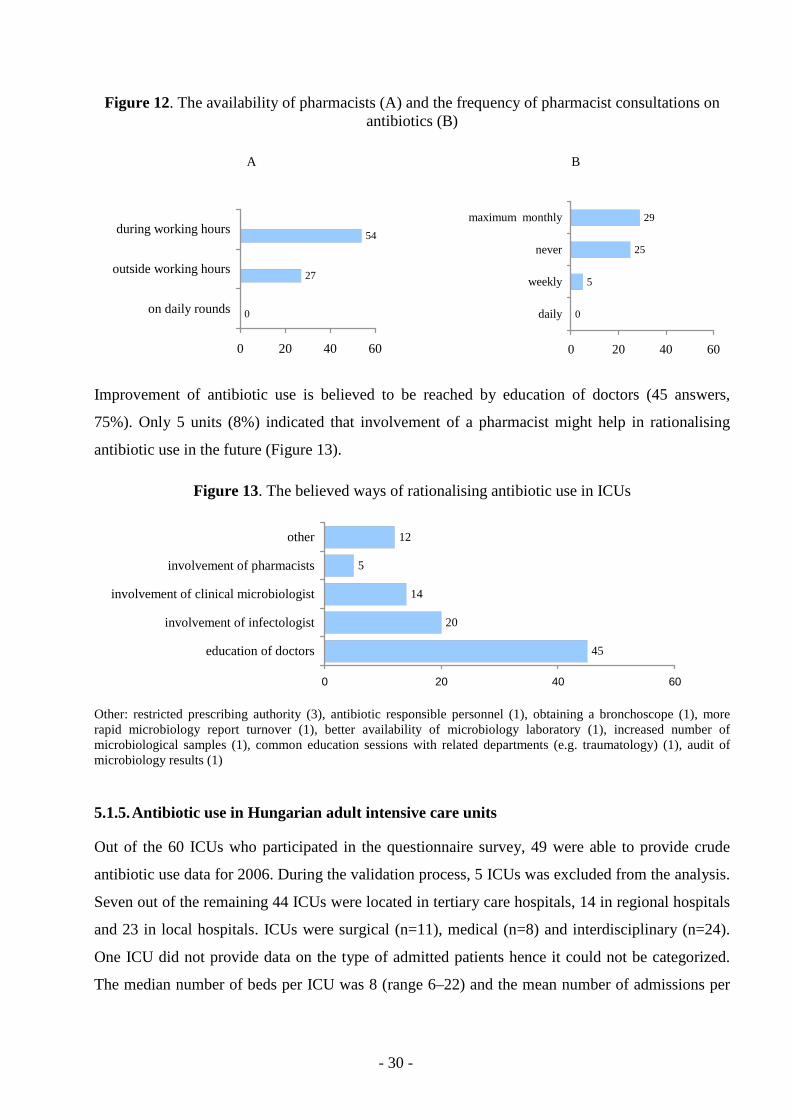
As concerns the ward level activities of pharmacists, we found that they participated in daily
rounds in none of the units. Most units never or maximum monthly ask the pharmacists about
antibiotics, despite of their good availability (Figure 12).
- 30 -
Figure 12. The availability of pharmacists (A) and the frequency of pharmacist consultations on antibiotics (B)
A B
27
54
0
0 20 40 60
on daily rounds
outside working hours
during working hours
0
5
25
29
0 20 40 60
daily
weekly
never
maximum monthly
Improvement of antibiotic use is believed to be reached by education of doctors (45 answers,
75%). Only 5 units (8%) indicated that involvement of a pharmacist might help in rationalising
antibiotic use in the future (Figure 13).
Figure 13. The believed ways of rationalising antibiotic use in ICUs
45
20
14
5
12
0 20 40 60
education of doctors
involvement of infectologist
involvement of clinical microbiologist
involvement of pharmacists
other
Other: restricted prescribing authority (3), antibiotic responsible personnel (1), obtaining a bronchoscope (1), more rapid microbiology report turnover (1), better availability of microbiology laboratory (1), increased number of microbiological samples (1), common education sessions with related departments (e.g. traumatology) (1), audit of microbiology results (1)
5.1.5. Antibiotic use in Hungarian adult intensive care units
Out of the 60 ICUs who participated in the questionnaire survey, 49 were able to provide crude
antibiotic use data for 2006. During the validation process, 5 ICUs was excluded from the analysis.
Seven out of the remaining 44 ICUs were located in tertiary care hospitals, 14 in regional hospitals
and 23 in local hospitals. ICUs were surgical (n=11), medical (n=8) and interdisciplinary (n=24).
One ICU did not provide data on the type of admitted patients hence it could not be categorized.
The median number of beds per ICU was 8 (range 6–22) and the mean number of admissions per
- 31 -
ICU was 445 in 2006. The case mix index ranged between 2.80 and 16.34 with a median of 5.18.
Mean (± standard deviation) length of stay was 5.25±1.74 days.
A total of 92476 DDDs and 95086 patient-days were included in the analysis. Consumption of
systemic antibacterials varied widely, ranging between 27.91 and 167.79 DDD per 100 patient-
days and with a median of 97.66 and mean of 98.69 DDD per 100 patient-days. The proportional
use of parenteral agents at Hungarian ICUs ranged from 46.15 to 98.30 % of total antibacterial use
(average: 81.03%, median: 83.51%). In highest quantities the co-amoxiclav, ciprofloxacin and
moxifloxacin products were used orally. In surgical ICUs slightly higher total antibacterial use and
significantly higher parenteral and hospital specific antibiotic use were detected. Significant
differences in total, parenteral and hospital specific antibiotic use were also found between ICUs
with different category (i.e. level of care; Figure 14.)
Figure 14. Boxplot of antibiotic use stratified by ICU type and ICU category
Medical (N=8)Interdisciplinary (N=24)Surgical (N=11)
Local (N=23)Regional (N=14)Tertiary care (N=7)
050
100
150
200
DD
D p
er 1
00 p
atie
nt-d
ays
P<0.05 P<0.05
050
100
150
200
DD
D p
er 1
00 p
atie
nt-d
ays
P<0.05 P<0.05 P<0.05
Total Parenteral Hospital specific1
Total Parenteral
Hospital specific1
1:Hospital-specific antibiotics: third- and fourth-generation cephalosporins, carbapenems, monobactams, aminoglycosides, and glycopeptides
The mean of overall antibiotic use was highest for penicillins with beta-lactamase inhibitors,
followed by quinolones and third generation cephalosporins (Table 6). Similar ranking were
detected in interdisciplinary and surgical ICUs. In medical ICUs the consumption of quinolones
out-ranged other classes of antibacterials (Table 6). Stratifying by ICU type also showed
differences in the use of second generation cephalosporins and glycopeptides which were used in
higher quantities in surgical ICUs.
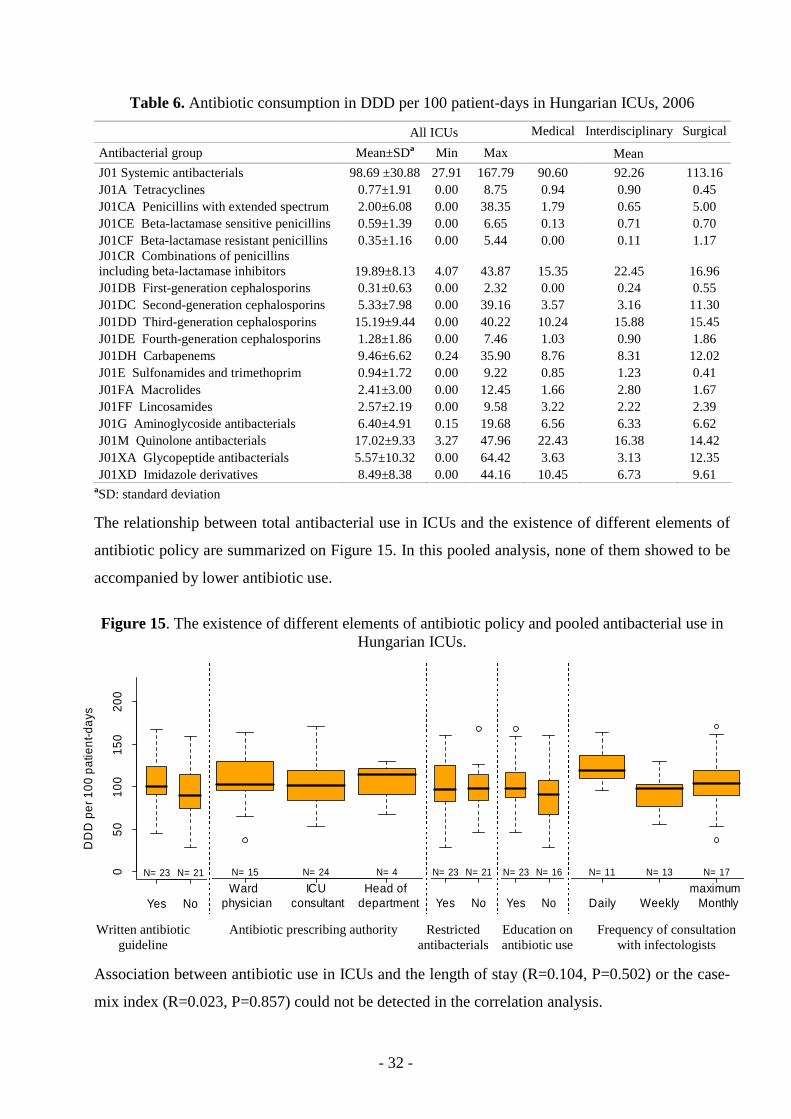
- 32 -
Table 6. Antibiotic consumption in DDD per 100 patient-days in Hungarian ICUs, 2006
All ICUs Medical Interdisciplinary Surgical
Antibacterial group Mean±SDa Min Max Mean
J01 Systemic antibacterials 98.69 ±30.88 27.91 167.79 90.60 92.26 113.16 J01A Tetracyclines 0.77±1.91 0.00 8.75 0.94 0.90 0.45 J01CA Penicillins with extended spectrum 2.00±6.08 0.00 38.35 1.79 0.65 5.00 J01CE Beta-lactamase sensitive penicillins 0.59±1.39 0.00 6.65 0.13 0.71 0.70 J01CF Beta-lactamase resistant penicillins 0.35±1.16 0.00 5.44 0.00 0.11 1.17 J01CR Combinations of penicillins including beta-lactamase inhibitors 19.89±8.13 4.07 43.87 15.35 22.45 16.96 J01DB First-generation cephalosporins 0.31±0.63 0.00 2.32 0.00 0.24 0.55 J01DC Second-generation cephalosporins 5.33±7.98 0.00 39.16 3.57 3.16 11.30 J01DD Third-generation cephalosporins 15.19±9.44 0.00 40.22 10.24 15.88 15.45 J01DE Fourth-generation cephalosporins 1.28±1.86 0.00 7.46 1.03 0.90 1.86 J01DH Carbapenems 9.46±6.62 0.24 35.90 8.76 8.31 12.02 J01E Sulfonamides and trimethoprim 0.94±1.72 0.00 9.22 0.85 1.23 0.41 J01FA Macrolides 2.41±3.00 0.00 12.45 1.66 2.80 1.67 J01FF Lincosamides 2.57±2.19 0.00 9.58 3.22 2.22 2.39 J01G Aminoglycoside antibacterials 6.40±4.91 0.15 19.68 6.56 6.33 6.62 J01M Quinolone antibacterials 17.02±9.33 3.27 47.96 22.43 16.38 14.42 J01XA Glycopeptide antibacterials 5.57±10.32 0.00 64.42 3.63 3.13 12.35 J01XD Imidazole derivatives 8.49±8.38 0.00 44.16 10.45 6.73 9.61
aSD: standard deviation
The relationship between total antibacterial use in ICUs and the existence of different elements of
antibiotic policy are summarized on Figure 15. In this pooled analysis, none of them showed to be
accompanied by lower antibiotic use.
Figure 15. The existence of different elements of antibiotic policy and pooled antibacterial use in Hungarian ICUs.
Yes No
050
100
150
200
DD
D p
er 1
00 p
atie
nt-d
ays
N= 23 N= 21
Ward
physician ICU
consultantHead of
department
N= 15 N= 24 N= 4
Yes No
N= 23 N= 21
Yes No
N= 23 N= 16
Daily Weeklymaximum Monthly
N= 11 N= 13 N= 17
Written antibiotic
guideline Antibiotic prescribing authority Restricted
antibacterials Education on antibiotic use
Frequency of consultation with infectologists
Association between antibiotic use in ICUs and the length of stay (R=0.104, P=0.502) or the case-
mix index (R=0.023, P=0.857) could not be detected in the correlation analysis.
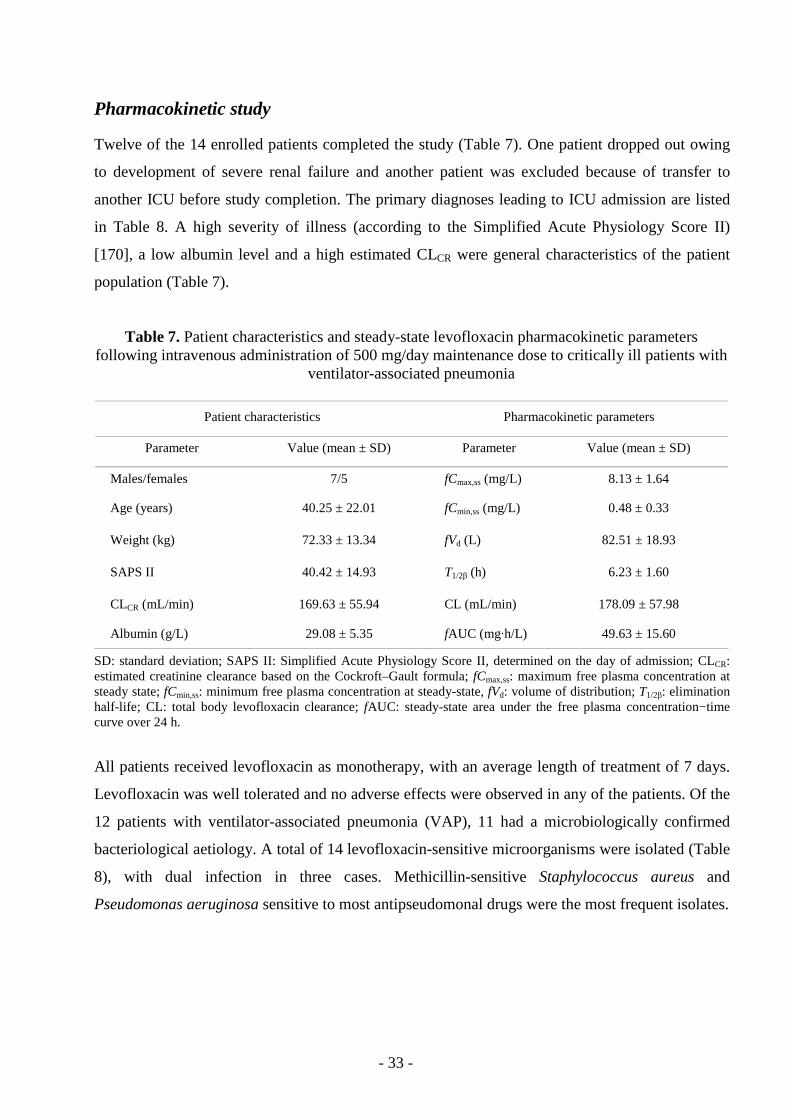
- 33 -
Pharmacokinetic study
Twelve of the 14 enrolled patients completed the study (Table 7). One patient dropped out owing
to development of severe renal failure and another patient was excluded because of transfer to
another ICU before study completion. The primary diagnoses leading to ICU admission are listed
in Table 8. A high severity of illness (according to the Simplified Acute Physiology Score II)
[170], a low albumin level and a high estimated CLCR were general characteristics of the patient
population (Table 7).
Table 7. Patient characteristics and steady-state levofloxacin pharmacokinetic parameters following intravenous administration of 500 mg/day maintenance dose to critically ill patients with
ventilator-associated pneumonia
Patient characteristics Pharmacokinetic parameters
Parameter Value (mean ± SD) Parameter Value (mean ± SD)
Males/females 7/5 fCmax,ss (mg/L) 8.13 ± 1.64
Age (years) 40.25 ± 22.01 fCmin,ss (mg/L) 0.48 ± 0.33
Weight (kg) 72.33 ± 13.34 fVd (L) 82.51 ± 18.93
SAPS II 40.42 ± 14.93 T1/2β (h) 6.23 ± 1.60
CLCR (mL/min) 169.63 ± 55.94 CL (mL/min) 178.09 ± 57.98
Albumin (g/L) 29.08 ± 5.35 fAUC (mg·h/L) 49.63 ± 15.60
SD: standard deviation; SAPS II: Simplified Acute Physiology Score II, determined on the day of admission; CLCR: estimated creatinine clearance based on the Cockroft–Gault formula; fCmax,ss: maximum free plasma concentration at steady state; fCmin,ss: minimum free plasma concentration at steady-state, fVd: volume of distribution; T1/2β: elimination half-life; CL: total body levofloxacin clearance; fAUC: steady-state area under the free plasma concentration−time curve over 24 h.
All patients received levofloxacin as monotherapy, with an average length of treatment of 7 days.
Levofloxacin was well tolerated and no adverse effects were observed in any of the patients. Of the
12 patients with ventilator-associated pneumonia (VAP), 11 had a microbiologically confirmed
bacteriological aetiology. A total of 14 levofloxacin-sensitive microorganisms were isolated (Table
8), with dual infection in three cases. Methicillin-sensitive Staphylococcus aureus and
Pseudomonas aeruginosa sensitive to most antipseudomonal drugs were the most frequent isolates.
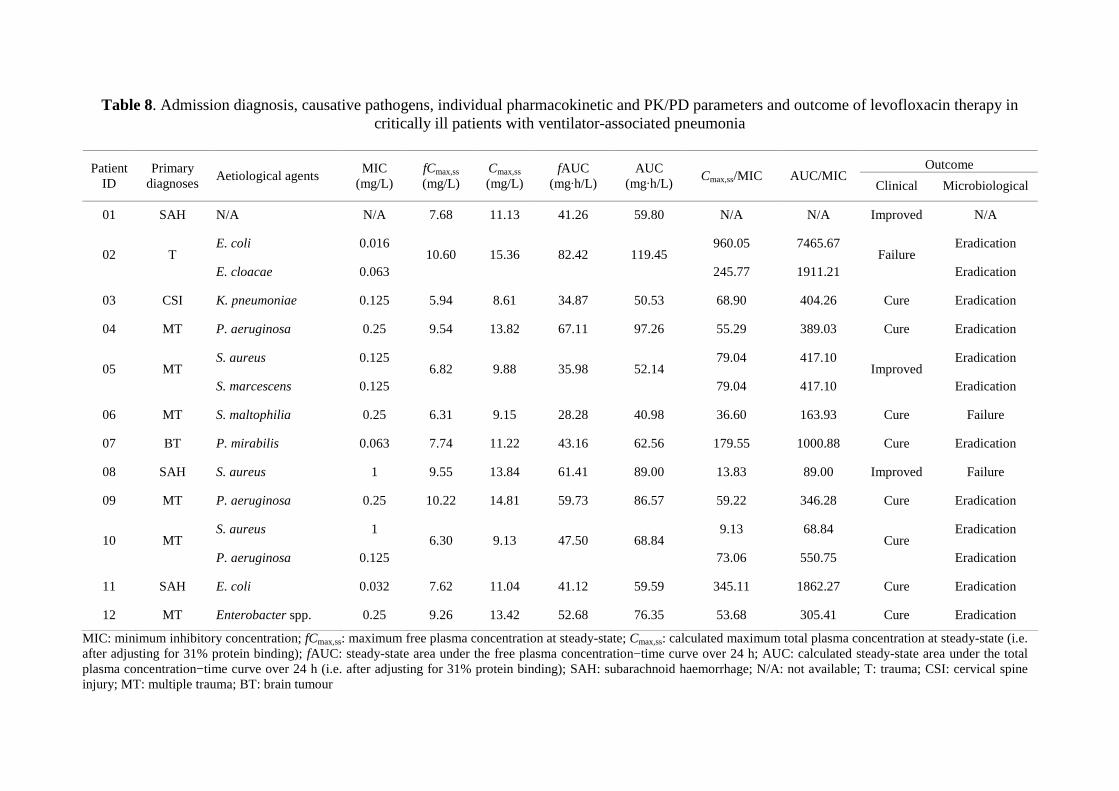
- 34 -
Table 8. Admission diagnosis, causative pathogens, individual pharmacokinetic and PK/PD parameters and outcome of levofloxacin therapy in critically ill patients with ventilator-associated pneumonia
Outcome Patient
ID Primary
diagnoses Aetiological agents
MIC (mg/L)
fCmax,ss (mg/L)
Cmax,ss (mg/L)
fAUC (mg·h/L)
AUC (mg·h/L)
Cmax,ss/MIC AUC/MIC Clinical Microbiological
01 SAH N/A N/A 7.68 11.13 41.26 59.80 N/A N/A Improved N/A
E. coli 0.016 960.05 7465.67 Eradication 02 T
E. cloacae 0.063 10.60 15.36 82.42 119.45
245.77 1911.21 Failure
Eradication
03 CSI K. pneumoniae 0.125 5.94 8.61 34.87 50.53 68.90 404.26 Cure Eradication
04 MT P. aeruginosa 0.25 9.54 13.82 67.11 97.26 55.29 389.03 Cure Eradication
S. aureus 0.125 79.04 417.10 Eradication 05 MT
S. marcescens 0.125 6.82 9.88 35.98 52.14
79.04 417.10 Improved
Eradication
06 MT S. maltophilia 0.25 6.31 9.15 28.28 40.98 36.60 163.93 Cure Failure
07 BT P. mirabilis 0.063 7.74 11.22 43.16 62.56 179.55 1000.88 Cure Eradication
08 SAH S. aureus 1 9.55 13.84 61.41 89.00 13.83 89.00 Improved Failure
09 MT P. aeruginosa 0.25 10.22 14.81 59.73 86.57 59.22 346.28 Cure Eradication
S. aureus 1 9.13 68.84 Eradication 10 MT
P. aeruginosa 0.125 6.30 9.13 47.50 68.84
73.06 550.75 Cure
Eradication
11 SAH E. coli 0.032 7.62 11.04 41.12 59.59 345.11 1862.27 Cure Eradication
12 MT Enterobacter spp. 0.25 9.26 13.42 52.68 76.35 53.68 305.41 Cure Eradication
MIC: minimum inhibitory concentration; fCmax,ss: maximum free plasma concentration at steady-state; Cmax,ss: calculated maximum total plasma concentration at steady-state (i.e. after adjusting for 31% protein binding); fAUC: steady-state area under the free plasma concentration−time curve over 24 h; AUC: calculated steady-state area under the total plasma concentration−time curve over 24 h (i.e. after adjusting for 31% protein binding); SAH: subarachnoid haemorrhage; N/A: not available; T: trauma; CSI: cervical spine injury; MT: multiple trauma; BT: brain tumour
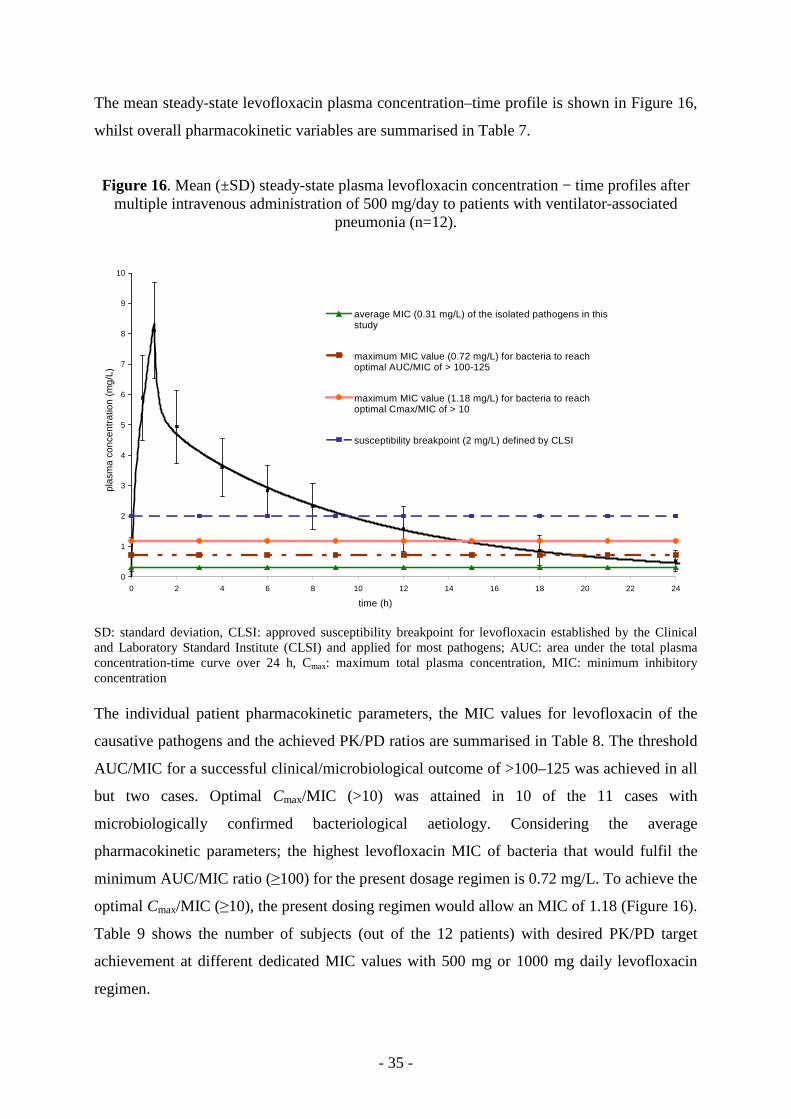
- 35 -
The mean steady-state levofloxacin plasma concentration–time profile is shown in Figure 16,
whilst overall pharmacokinetic variables are summarised in Table 7.
Figure 16. Mean (±SD) steady-state plasma levofloxacin concentration − time profiles after multiple intravenous administration of 500 mg/day to patients with ventilator-associated
pneumonia (n=12).
0
1
2
3
4
5
6
7
8
9
10
0 2 4 6 8 10 12 14 16 18 20 22 24
time (h)
plas
ma
conc
entr
atio
n (m
g/L)
average MIC (0.31 mg/L) of the isolated pathogens in thisstudy
maximum MIC value (0.72 mg/L) for bacteria to reachoptimal AUC/MIC of > 100-125
maximum MIC value (1.18 mg/L) for bacteria to reachoptimal Cmax/MIC of > 10
susceptibility breakpoint (2 mg/L) defined by CLSI
SD: standard deviation, CLSI: approved susceptibility breakpoint for levofloxacin established by the Clinical and Laboratory Standard Institute (CLSI) and applied for most pathogens; AUC: area under the total plasma concentration-time curve over 24 h, Cmax: maximum total plasma concentration, MIC: minimum inhibitory concentration The individual patient pharmacokinetic parameters, the MIC values for levofloxacin of the
causative pathogens and the achieved PK/PD ratios are summarised in Table 8. The threshold
AUC/MIC for a successful clinical/microbiological outcome of >100–125 was achieved in all
but two cases. Optimal Cmax/MIC (>10) was attained in 10 of the 11 cases with
microbiologically confirmed bacteriological aetiology. Considering the average
pharmacokinetic parameters; the highest levofloxacin MIC of bacteria that would fulfil the
minimum AUC/MIC ratio (≥100) for the present dosage regimen is 0.72 mg/L. To achieve the
optimal Cmax/MIC (≥10), the present dosing regimen would allow an MIC of 1.18 (Figure 16).
Table 9 shows the number of subjects (out of the 12 patients) with desired PK/PD target
achievement at different dedicated MIC values with 500 mg or 1000 mg daily levofloxacin
regimen.
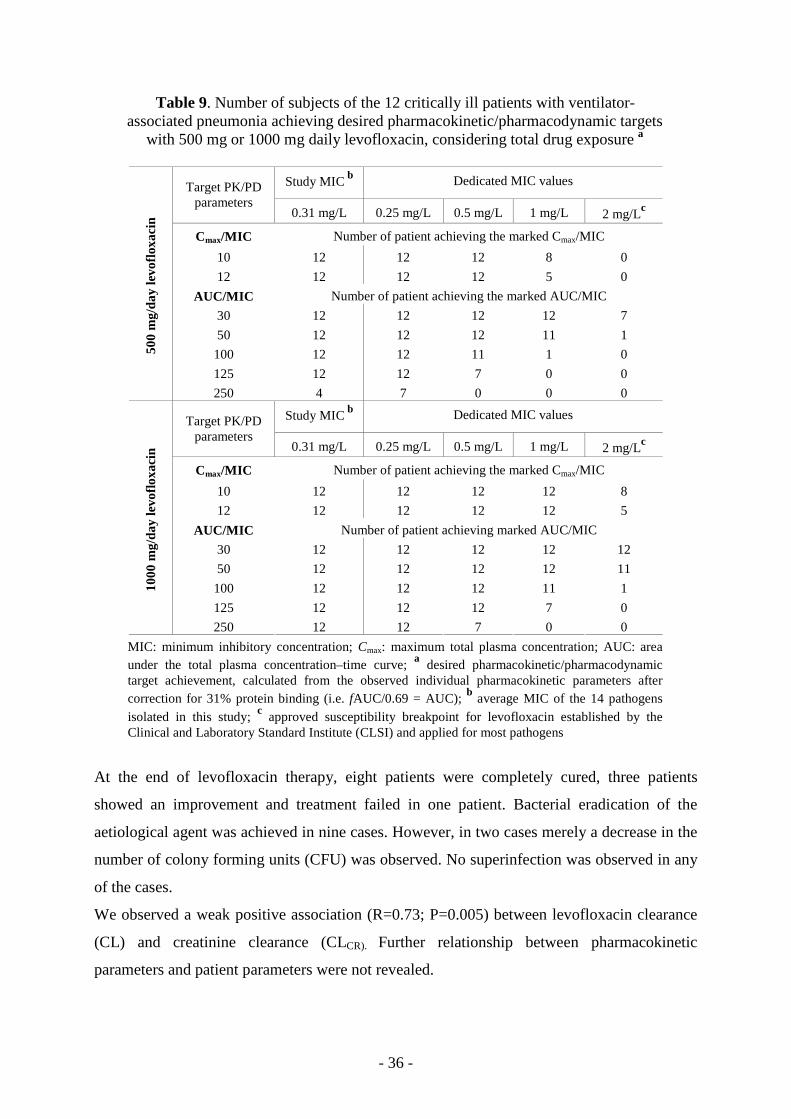
- 36 -
Table 9. Number of subjects of the 12 critically ill patients with ventilator-associated pneumonia achieving desired pharmacokinetic/pharmacodynamic targets
with 500 mg or 1000 mg daily levofloxacin, considering total drug exposure a
Study MIC b Dedicated MIC values Target PK/PD parameters
0.31 mg/L 0.25 mg/L 0.5 mg/L 1 mg/L 2 mg/Lc
Cmax/MIC Number of patient achieving the marked Cmax/MIC
10 12 12 12 8 0
12 12 12 12 5 0
AUC/MIC Number of patient achieving the marked AUC/MIC
30 12 12 12 12 7
50 12 12 12 11 1
100 12 12 11 1 0
125 12 12 7 0 0
500
mg/
day
levo
floxa
cin
250 4 7 0 0 0
Study MIC b Dedicated MIC values Target PK/PD parameters
0.31 mg/L 0.25 mg/L 0.5 mg/L 1 mg/L 2 mg/Lc
Cmax/MIC Number of patient achieving the marked Cmax/MIC
10 12 12 12 12 8
12 12 12 12 12 5
AUC/MIC Number of patient achieving marked AUC/MIC
30 12 12 12 12 12
50 12 12 12 12 11
100 12 12 12 11 1
125 12 12 12 7 0
1000
mg/
day
levo
floxa
cin
250 12 12 7 0 0
MIC: minimum inhibitory concentration; Cmax: maximum total plasma concentration; AUC: area under the total plasma concentration–time curve; a desired pharmacokinetic/pharmacodynamic target achievement, calculated from the observed individual pharmacokinetic parameters after correction for 31% protein binding (i.e. fAUC/0.69 = AUC); b average MIC of the 14 pathogens isolated in this study; c approved susceptibility breakpoint for levofloxacin established by the Clinical and Laboratory Standard Institute (CLSI) and applied for most pathogens
At the end of levofloxacin therapy, eight patients were completely cured, three patients
showed an improvement and treatment failed in one patient. Bacterial eradication of the
aetiological agent was achieved in nine cases. However, in two cases merely a decrease in the
number of colony forming units (CFU) was observed. No superinfection was observed in any
of the cases.
We observed a weak positive association (R=0.73; P=0.005) between levofloxacin clearance
(CL) and creatinine clearance (CLCR). Further relationship between pharmacokinetic
parameters and patient parameters were not revealed.
- 37 -
6. DISCUSSION
6.1. Drug utilisation studies
6.1.1. National trends in antibacterial utilisation
Although some authors have suggested using more than one measurement unit for antibiotic
consumption in hospitals [54,171], we showed in a previous study that hospital antibiotic
consumption expressed in either DDD per 100 patient-days, DDD per 100 admissions, or
DDD per 1,000 inhabitants and per day, were strongly associated both at national and regional
level [172]. Therefore we used only one measurement unit, the WHO recommended DDD per
100 patient-days to present our results. However, as for practical purposes the European
Surveillance of Antimicrobial Consumption (ESAC) project uses the DDD per
1,000 inhabitants and per day to express hospital antibacterial use, we also calculated our data
in DDD per 1,000 inhabitants and per day to enable comparison with ESAC data.
The political change in 1989 proved to be a milestone in the Hungarian antibiotic utilisation.
The antibiotic assortment widened in consequence of the drug import liberalisation, while the
hospital antibiotic consumption decreased between 1990 and 1996 [3]. In our results
standardized total hospital antibiotic consumption in Hungary between 1996 and 2007
remained relatively stable. Some of the changes in the pattern of use were gradually taken
over from the 1990’s: the decrease in the utilisation of the tetracyclines, the beta-lactamase-
sensitive penicillins and the sulfonamide-trimethoprim group, which began after the political
change in 1989 [3] continued until the end of our study period. The significant growth of
fluoroquinolone consumption and of the penicillin and beta-lactamase inhibitor combinations
has been unbroken since 1990.
Data from the ESAC have shown large inter-country variations in hospital antibiotic
consumption and that consumption in Hungary was the third lowest in Europe when
expressed as DDD per 1,000 inhabitants and per day in 2002 [160] and fourth lowest in
2005 [173]. Individual reports [174-182] show that antibiotic consumption in the Hungarian
hospital care is even lower compared to other European countries when expressed in DDD
per 100 patient-days. One characteristic of data on hospital care in Hungary is that it covers a
large number of acute care and chronic care institutions and hospital beds accounting for a
large number of admissions and of patient-days, larger than in other countries [183,184].
Based on data available from the Hungarian National Health Fund Administration database,
approximately 30% of the patient-days included in this study originated from chronic care
- 38 -
institutions [161]. One explanation for the very low national hospital antibiotic consumption –
expressed in DDD per 100 patient-days – could be the large number of patient-days and larger
proportion of chronic care patient-days compared to other European countries.
On the basis of the proportional distribution of antibiotic use, Hungary was a frequent user of
sulfonamides, macrolides and penicillins, and an average user of fluoroquinolones and
tetracyclines compared to other European countries in 2002 [160]. According to the latest
available data from the ESAC database (year 2005) [173], the share of macrolides,
lincosamides and fluoroquinolones from the total hospital antibiotic use in Hungary were
above the European average.
The proportional use within the penicillin group had some special features: the contribution of
the penicillin and beta-lactamase inhibitor group (mainly co-amoxiclav) to the overall hospital
penicillin use was substantial even on an international scale [160,173]. In 2005, within
Europe, only Luxemburg had higher proportional penicillin and beta-lactamase inhibitor
consumption within the penicillin group than Hungary (87% vs. 83 %) [173]. This could be
explained in part by their broad spectrum of activity and consequent extended usage in
empiric antibiotic therapy and the availability of low price generics. Beta-lactamase-sensitive
(J01CE) and beta-lactamase-resistant (J01CF) penicillins (only oxacillin was available in
Hungary) played only a marginal role, in contrast with other European countries where there
was a considerable use (Norway, Sweden, Denmark, Finland) [160,173]. Oxacillin products
have been discontinued to be on the market since the second half of 2003, and this practically
annuled their use: in 2005 only 4 packages of oxacillin injection was used, while from 2006
zero.
When focusing only on hospital-specific antibiotics defined by the ESAC team (see section
4.4.1. on page 14), Hungary was average consumer both in absolute and in relative manner
[160,173,173]. Glycopeptides were used at a lower extent compared to other European
countries, probably because of the relative better Methicillin resistant Staphylococcus aureus
(MRSA) situation in 2002 [11,160], but by 2005 its consumption became average [173].
Monobactams (i.e. aztreonam) have never been marketed in Hungary; hence their use could
not be detected.
- 39 -
As concerns the share of different cephalosporin generations in Hungarian hospitals, the
relative frequency of third-generation cephalosporin use was above the European average in
2005 (37% vs. 27%), whereas the relative use of the first-generation cephalosporins was well
below it (6% vs. 20%). The relative use of second and fourth-generation cephalosporins was
average [173].
Heterogeneous use of antibacterials is desirable to reduce the selection pressure for
antibacterial resistance [185,186]. Unfortunately, as the number of active agents in the
DU90% segment decreased, and the co-amoxiclav combinations highly dominated the
antibacterial use, the national hospital antibacterial use became less diverse by 2007.
6.1.2. Regional differences in antibacterial utilisation and its determinants
Large interregional differences in total hospital antibiotic consumption were found during
1996-2007. In other countries like Germany or Norway significant regional variations in total
hospital antibiotic consumption have not been found, however they used hospital level data
[174,175]. In Hungary, the relative use of different antibiotic classes has also greatly varied
across regions. Such regional variety in prescribing preferences for certain antibiotic classes
has been reported in Germany [174], but not in Norway [175].
As I discussed earlier, the less heterogeneous the antibiotic use is, the more the chance for the
selection of antibacterial resistance [185,186]. In 2007, the heterogeneity of antibiotic use
were also deficient in some regions and parallel the use of some antibacterials (e.g. first-
generation cephalosporins) was almost completely missing. In the multiple linear regression
the number of reported infections had stronger predictive value compared to the case mix
index. However the collective explanatory value of the two independent variables was still
moderate, as could not explain 40 % of the regional differences.
Some authors have reported an association between hospital antibiotic consumption and
special care areas, e.g. intensive care, onco-haematology, infectiology [174,181,187-189]. In
this study, we found no association between hospital antibiotic consumption and the
percentage of patient-days in intensive care or infectious disease units at regional level. The
percentage of patient-days in onco-haematology units in each region could not be obtained.
We recently showed regional variations in antibiotic consumption in the Hungarian
ambulatory care with a West-East gradient [190]. In the present study, we found quite similar
geographical pattern for hospital antibiotic consumption, with a slightly larger difference
between regions with the lowest and the highest antibiotic consumption. We found that
- 40 -
regional hospital antibiotic consumption was associated with regional antibiotic consumption
in ambulatory care. In our previous study, interregional differences in antibiotic consumption
in ambulatory care were associated with socio-economic determinants [190]. As data on the
socio-economic status of admitted patients is not available, we could not investigate this
variable as determinant of hospital antibiotic use. However as poor socio-economic status is
often associated with poor health status [184], − which is incorporated in the case-mix index −
socio-economic status may at least indirectly influence antibiotic use in hospitals.
The major limitation of this study was the lack of hospital level antibiotic consumption data.
Due to confidentiality issues, at present, antibiotic consumption data from individual hospitals
are not publicly available in Hungary. This means that we could not evaluate the effect of
hospital size, hospital type or university affiliation, which explained some of the inter-hospital
differences in antibiotic consumption in other studies [174,175,181]. However, the
standardized distribution of different size and type of hospitals is quite even across Hungary.
Additionally, regions with university centres did not show higher hospital consumption
compared to other regions (see Figure 7). Due to unavailability of data, we were also not able
to test associations between several other possible determinants for hospital antibiotic
consumption (e.g. the number of surgical interventions, the number of infectiologists per
1,000 hospital beds, marketing activity, etc).
6.1.3. Antibiotic related activities in Hungarian adult IC Us and in their parent institute
Growing number of publications assign hospital/clinical pharmacist as a key member of
antibiotic programs that aim to rationalise antibiotic use [191-196]. According to the
consensus conference of the Antibiotic Resistance Prevention and Control (ARPAC)
European project the existence of a drugs and therapeutics or antibiotic committees with the
involvement of a pharmacist would be a minimum requirement [194]. Our results are
concordant with the results of the ARPAC project where 146 (86%) of the participating
hospitals reported the existence of drugs and therapeutics committee with 81% pharmacist
involvement (in Hungary 58 (97%) of the ICUs parent institute have drugs and therapeutics
committee with 86% pharmacist involvement) [197]. Separate antibiotic committees were
present more frequently in the surveyed European hospitals (53% vs. 38 % in Hungary).
Multidisciplinary committees were reported from 51 (30%) of European hospitals compared
to 7 hospitals in our survey (12%) [197]. The meeting frequencies of these hospital
committees were also comparable, most often quarterly meetings were held [197]. While
- 41 -
written guideline for empiric antibiotic therapy was available in 77% of the ARPAC hospitals
and 21% of the ICUs in a Swedish study [198], Hungarian ICUs had this document in 45%.
We also proved that the information content of these guidelines at Hungarian ICUs were
incomplete and only half (13 guideline, 48%) of them were developed by the responsible
hospital committees appointed by the ARPAC project.
Local education on antibiotic use and on the consequences of resistance development were
performed in less than half of the Hungarian ICUs (26 ICU, 43%) contrast to 136 (80%) of
European hospitals [199]. While the participation of hospital/clinical pharmacist in these
educational sessions was rare both in European hospitals (34 hospitals, 20%) and in
Hungarian ICUs (3 ICUs; 9%), the participation rate of pharmaceutical companies were
undesirably high (53 European hospitals 31 % vs. 14 Hungarian ICUs, 40%).
The ARPAC consensus conference recommended the survey of standardized antibiotic use
(expressed in DDD per 100 patient-days) minimum once a year and that the results should be
fed back personally to the prescribers. As the member of the multidisciplinary team the
pharmacist should be the responsible person [194]. However more than half of the Hungarian
intensive care units analysed antibiotic use, mostly these surveys focused on financial aspects.
Standardized antibiotic use was calculated only at five (8%) ICUs and pharmacist were
involved in 3 out of the five cases. In contrast, in Sweden 26 out of 35 ICUs (76%) received
report on antibiotic use at least once a year [198]. It should be noted that in 15 Hungarian
ICUs the quality of antibiotic use (e.g. adherence to guidelines) were also assessed. Only one
ICU reported that the prescribers received personal feed-back on the results of the antibiotic
use survey. Pharmacists were rarely consulted in antibiotic related questions. One possible
explanation is the lack of pharmacist presence in daily rounds. Only 28 European hospitals
(16%) have pharmacist participating in daily rounds, while the presence of pharmacist in
European ICUs is unknown [196]. The active participation of pharmacist in bed-side
consultations could be achieved by specially trained ward pharmacists. The so called
„antibiotic pharmacists” have been practising in the United States since many years, while
among European countries pharmacist − specifically trained in antibiotic therapy − were
educated and employed in the United Kingdom first [200]. Other European countries
including Hungary are far away from this, but as stated in the ARPAC publication
hospital/clinical pharmacist could have a bright future [194]. To be able to achieve this goal,
first the claim for more active pharmacist participation should be established as presently the
Hungarian physicians do not think that the involvement of pharmacists would rationalise
antibiotic use.
- 42 -
Before concluding the results, it should be noted that the ARPAC project surveyed antibiotic
policies and other related aspects of antibiotic use on hospital level, while our questions partly
referred to hospitals, partly to ICUs. However, taking into account the special role of ICUs
within hospitals as concerns antibiotic use, I think that our conclusions are relevant also in
cases where we compared ICUs to European hospitals.
6.1.4. Antibiotic use in Hungarian adult intensive care units
This preliminary analysis on antibiotic use in Hungarian adult ICUs found that antibiotic
consumption varied widely from 27.91 to 167.79 DDD per 100 patient-days. Substantial,
from 3.5 up to 14 fold differences in the total antibiotic use in ICUs were also detected in a
German [201] (45.0 –179.9 DDD per 100 patient-days); Swedish [66] (60.5 – 214.3 DDD
per 100 patient-days) and in a pan European study [60] (34.8 – 499.2 DDD per 100 patient-
days). The median consumption of 98.38 DDD per 100 patient-days and mean consumption
of 102.11 DDD per 100 patient-days in this study are slightly lower than the figures reported
from other European studies [60,61,201].
However like in a few Hungarian ICUs, relatively low mean antibiotic consumptions have
been reported in Swiss ICUs by Loeffler [62] (46.2 and 68.3 DDD per 100 patient-days in the
surgical and medical ICU, respectively). The relatively low antibiotic use in the Swiss ICUs
was ascribed to the strong control efforts, to the close collaboration with the infectious
diseases consulting service and to aggressive diagnostic practices. However, as concluded by
the author, inappropriate antibiotic use might have still occurred in that unit [62].
However, the limitations of the DDD per 100 patient-days method to express antibiotic use
should be borne in mind when comparisons are made.
In our results, the total systemic antibacterial use did not differ considerably in medical,
interdisciplinary and surgical ICUs. This is in line with previous findings which found that
total antibacterial use is not related to ICU type [56,58,59].
Swedish researchers found that antibiotic consumption was higher among ICU patients in
tertiary care centres [69]. Similarly, de With et al. [59] concluded that when comparing the
total use of antibiotics between ICU cohorts, data adjustment is required for ICU category (i.e.
level of care). This finding has been confirmed in our study as tertiary care ICUs had
significantly higher antibacterial use than ICUs located in regional or local hospitals. Other
studies found no significant association between university status and the use of antibacterials
- 43 -
[58,201]. Researchers from Sweden [66,198] reported higher antibiotic use in ICUs as level of
care increased, but it has not reached statistical significance.
Clinicians often justify high antibiotic use in their particular setting with differences in
patients’ morbidities. The case-mix index (CMI) is an easily available economic parameter
calculated using diagnosis-related groups. Recently Kuster et al. [202] found significant
correlation between antibiotic use and CMI across various specialities of a university hospital.
We could not find association between CMI and antibiotic use at ICU level. An ICU study
from Sweden also did not find association between a specific illness severity score
(APACHE II: Acute Physiology and Chronic Health Evaluation II) and antibiotic use [198].
Such a relationship could have been concealed because differences in patient case-mix not
reflected by patient severity scores. However, these results are in agreement with the notion
that factors other than patient-related factors determine the use of antibiotics [203].
As the length of stay is related to the denominator of the formula used to calculate antibiotic
use (DDD per 100 patient-days) its influencing role on total antibiotic use can be expected. It
is claimed that higher patient turnover (i.e. high number of admissions with shorter length of
stay (LOS) may result in higher antibiotic use when expressed as DDD per 100 patient-days
[54,68]. In contrast, in the study of Walther et al. [198] significant positive correlation was
found between antibiotic use at ICUs and average LOS. In our study, antibiotic use in
Hungarian ICUs was irrespective of the length of stay.
In Hungarian ICUs the proportional use of oral agents ranged between 1.70 and 53.85 % of
total antibacterial use. The relative use of oral and parenteral agents in ICUs are scarcely
reported in the literature, only Loeffler et al. reported that oral agents made up 13% and 26%
of total use in a Swiss surgical and medical ICU, respectively [62]. High consumption of oral
antibacterials in some Hungarian ICUs may be a matter of concern because of bioavailability
issues [204-208].
In general, the preferred antibiotic groups in Hungarian ICUs were penicillins with beta-
lactamase inhibitors, quinolones and third-generation cephalosporins. Update from German
ICUs [209] shows that the same antibiotic groups belong to the top three as in Hungary. In
Sweden, cephalosporins (mainly cefuroxime) were the most frequently used class of
antibiotics (26% of median consumption) followed by isoxazolyl penicillins and carbapenems
[66,198], and this has been confirmed by a recent study [61].
As it was previously shown [59] stratification by ICU type is important when the
consumptions of certain antibiotic classes are compared. In our study the use of second
generation cephalosporins and glycopeptides were higher in surgical units. In German
- 44 -
surgical ICUs [58] the use of glycopeptides were also higher compared to other ICU types.
Associations between ICU type and use of macrolides and lincosamides (higher use in
medical ICUs) and imidazoles (higher use in surgical and interdisciplinary ICUs) were also
observed in a previous German work [59]. In Hungarian ICUs the use of lincosamides but not
macrolides was the highest in medical ICUs while the consumption of imidazoles was highest
in medical and surgical ICUs.
Different strategies of antibiotic policy like guideline implementations, education of
physicians, restrictions measures, involvement of infectious disease specialist, etc. have been
shown to decrease the antimicrobial use [57,64,65,187,210-212].
In our study neither elements of antibiotic policy showed lower aggregated antibiotic use in
those ICUs where they were present. Several factors can explain this finding. First,
observations before and after the intervention may need to show its effects on antibiotic use
[192,213]. Secondly, often several strategies are combined in the interventions
[57,65,214,215], while in our study the different approaches to control antimicrobial use were
rarely present simultaneously (e.g. written antibiotic policy and antibacterial restrictions were
present in only 13 ICUs).
6.2. Pharmacokinetic study
This study assessed the pharmacokinetics of levofloxacin based on free drug level
measurements as well as the efficacy of levofloxacin monotherapy in critically ill patients
with ventilator-associated pneumonia (VAP) who had normal renal function. Further
theoretical considerations were also applied to the average pharmacokinetic data to predict
below which MIC values the present dosing regimen would be effective. As only free drug is
active and the unbound state is a prerequisite for tissue distribution [216,217], one strength of
our study is the measurement of free drug levels. According to a recent paper, it is
recommended that all pharmacokinetic/pharmacodynamic (PK/PD) indices should be
referenced to the unbound (free) fraction of the drug [111]. As only free drug is the active
moiety and the MIC is measured in plasma protein-free medium [216-219] these
recommendations appear to be justifiable. In contrast, the optimal PK/PD values appointed by
clinical studies, which were also used as target values in this dissertation, were determined by
using total serum concentrations [127,129,140]. To compare our results with other studies and
with target PK/PD values that are based on total drug levels, despite its pitfalls [125] we were
forced to make adjustments for protein binding.
- 45 -
The pharmacokinetic parameters in this study are in line with the data of Rebuck et al [148].
With a 500 mg daily regimen they obtained an AUC value of 66.1 ± 15.7 mg·h/L (mean ±
standard deviation) compared with our 71.92 ± 22.62 mg·h/L adjusted value (i.e. 49.63/0.69,
considering 31% protein binding). Other studies conducted on ICU patients are in contrast
with our findings, as AUC values of 110 ± 56.48 mg·h/L [151] and 151 mg·h/L (range 137–
174 mg·h/L) [149] were reported with the same levofloxacin regimen. The large discrepancy
compared with the study of Boselli et al. [149] might be explained by the differences in renal
function of the patients (mean CLCR of 63 mL/min [149] vs. 169 mL/min in this study), and
age-related changes in renal function are presumed to be at least partly responsible for these
pharmacokinetic differences (mean age 71 years vs. 40 years). Pharmacokinetic results from
our study also differ from the findings of Pea et al. [144] as they achieved similar AUC values
(AUC = 2 × AUC0–12 = 67.8 ± 20.82 mg·h/L) with a doubled maintenance dose
(2 × 500 mg/day). All these findings might be partially related to different analytical and
methodological procedures and to well known interindividual pharmacokinetic variability
frequently observed in critically ill patients.
In the present study the mean steady-state plasma concentrations were constantly above the
average MIC of the clinical isolates. The individual PK/PD parameters exceeded both
thresholds of clinical/microbiological efficacy (Cmax/MIC > 10 and AUC/MIC > 100–125) in
all but one case. As clinical success (improvement or cure) was attained in all but one case
and bacterial eradication was achieved in 9 of the 11 assessable cases, our data support these
PK/PD considerations. With regard to the high survival rate in this study, it should be noted
that we excluded severe patients with septic shock and those with an estimated
CLCR < 50 mL/min, which limits the generalisation of our results to other critically ill
populations. Also, the high PK/PD indices observed in our study with 500 mg/day
levofloxacin treatment may not always be achieved owing to differences in the susceptibility
patterns (MIC distributions) of pathogens at individual institutions. Typically, pathogens with
marginal susceptibility are staphylococci and pneumococci and the non-fermenters such as
Pseudomonas spp. Special attention should be paid to establish the MIC values of these
pathogens.
As in various ICU studies differences were found in AUC levels, optimal PK/PD indices
could be ensured up to different MIC values (0.66 mg/L [148], 1.10 mg/L [151] and 1.5 mg/L
[149] with a 500 mg/day regimen and 0.68 mg/L with a 2 × 500 mg daily regimen [144] vs.
0.72 mg/L in this study). All of these MIC threshold values are lower than the most widely
- 46 -
used susceptibility breakpoint (2 mg/L) established by the Clinical and Laboratory Standard
Institute (CLSI) [169].
Considerations based on PK/PD indices predict that for optimal antibacterial therapy against
bacteria with an MIC of 2 mg/L, a minimum Cmax,ss of 20 mg/L and a minimum AUC of 200–
250 mg·h/L are required, i.e. approximately three-fold higher for the optimum AUC than is
achievable with the present dosing regimen in critically ill patients with normal renal
function. As at the highest dose (1000 mg/day) that could be safely administered [221] only
bacteria with an MIC of ≤1.5 mg/L predicted to be treated successfully, there is a potential
risk of levofloxacin therapy failure in cases when the bacterium is labelled as being sensitive
(MIC ≤ 2 mg/L) in the microbiology report [144,153,222]. Thus, lowering the susceptibility
breakpoint for levofloxacin is proposed. As a lower clinical MIC breakpoint for levofloxacin
(i.e. 1 mg/L) has already been defined by the European Committee on Antimicrobial
Susceptibility Testing (EUCAST) [223] and has already been decreased for Staphylococcus
aureus by CLSI (i.e. from 2 mg/L to 1 mg/L in 2005), the acceptance and widespread
application of this value should be considered.
In the multiple linear regression analysis the dose-related pharmacokinetic parameters (Cmax,
AUC) that determine therapy outcome did not show relationship with the tested patient
parameters therefore they cannot be predicted from them. These are in line with the findings
of Spanish researchers who found no association between AUC and patient parameters and
found very weak relationship between the Cmax and SAPS II scores or the body weight [151].
- 47 -
7. SUMMARY
In this thesis I set out to provide insights into national and regional hospital antibacterial use
in Hungary. I also intended to assess the antibiotic related activities of Hungarian intensive
care units (ICUs) and their parent hospitals and quantify the antibiotic use in ICUs. Finally, I
aimed to determine the pharmacokinetic/pharmacodynamic (PK/PD) parameters and
appropriateness of levofloxacin therapy in a special patient group.
My main findings are as follows:
• Total hospital antibiotic consumption in Hungary expressed as defined daily dose
(DDD) per 100 patient-days remained relatively stable between 1996 and 2007 and
some of the observed changes in the pattern of consumption are consistent with the
national and international recommendations (e.g. decreased use of tetracyclines,
increased use of respiratory fluoroquinolones). However, the low first-generation
cephalosporin and narrow spectrum penicillin (beta-lactamase-sensitive and beta-
lactamase-resistant penicillins) use as well as the less diverse antibacterial use require
attention. The reason for substantial share of macrolide, lincosamide, fluoroquinolone,
third-generation cephalosporin and penicillin plus beta-lactamase inhibitor
consumption from total hospital antibacterial use should also be addressed in future
pharmacoepidemiologic studies.
• There were constantly large interregional differences in the Hungarian hospital
antibacterial consumption. The pattern and heterogeneity of antibacterial use also
differed considerable between Hungarian regions. The differences in total hospital
antibacterial use were moderately explained by the number of reported infections and
the case mix index (CMI), and surprisingly we observed a positive relationship
between the regional hospital care and ambulatory care antibiotic consumption. All of
these may suggest that other determinants that could not be explored in this
dissertation (e.g. regional prescribing habits or marketing practices) may also
contribute to regional differences. Therefore future studies should aim at collecting
data for each individual hospital, as well as data on other possible determinants for
hospital antibiotic consumption.
• Minimal requirements defined by the Antibiotic Resistance Prevention and Control
(ARPAC) project have not been fulfilled in many aspects: multidisciplinary hospital
- 48 -
committees were not realized, and the activity of these committees in antibiotic
guideline development was not satisfactory. The information content of empiric
antibiotic guidelines was also deficient. Continuous education and calculation of
standardized antibiotic use was rare in Hungarian ICUs. The role of pharmacist
remained marginal in every field. All these findings suggest the need for appointment
of a responsible, multidisciplinary antibiotic management team including a
pharmacist.
• Consumption of systemic antibacterials varied widely (up to six fold) and the
proportional use of oral agents also greatly differed in Hungarian adult intensive care
units (ICUs). It was difficult to explain these differences; the only factor which
showed significant association with total antibacterial use was the ICU category (i.e.
level of care). However in many Hungarian ICUs this was the first time when
antibacterial use was expressed in a standardized consumption unit. The striking
differences in total antibiotic use and high use of oral agents in some ICUs – that
could not be explained satisfactory in this study – may indicate room for
improvement.
• Low dose (500 mg per day maintenance dose) intravenous levofloxacin proved to be
an effective regimen in this limited number of critically ill patients with ventilator-
associated pneumonia (VAP) and predicted to be effective when the minimum
inhibitory concentration (MIC) of the pathogen is below 0.72 mg/L. The target
pharmacokinetic/pharmacodynamic (PK/PD) thresholds of clinical/microbiological
efficacy were exceeded in almost every case. The lack of relationship between Cmax,
AUC and patient parameters do not allow any prediction for these pharmacokinetic
parameters. According to the measured pharmacokinetic parameters, the highest safe
levofloxacin maintenance dose (1 g/day) would ensure optimal PK/PD levels up to a
MIC of 1.5 mg/L, which is lower than the currently used MIC susceptibility
breakpoints for levofloxacin, therefore lowering of MIC susceptibility breakpoints for
levofloxacin should be considered.
In conclusion, the continuous and close monitoring of antibacterial use at national, regional
and local level should be considered as an important public-health priority to find problematic
areas and trends which may require interventions. Also, the determination of optimal dosage
in specific patient populations (i.e. ICU patients) could help in ensuring
clinical/microbiological efficacy.
- 49 -
8. REFERENCES
1. Centers for Disease Control and Prevention. Ten great public health achievements--United States, 1900-1999. MMWR Morb Mortal Wkly Rep 1999; 48 (12):241-243.
2. Wood MJ, Moellering RC, Jr. Microbial resistance: bacteria and more. Clin Infect Dis 2003;36(Suppl 1):S2-3.
3. Graber H. [Antibacterial therapy 2000: balance and perspectives]; Antibakteriális terápia 2000: mérleg és perspektíva. Lege Artis Med 2000; 10(10):748-752.
4. Carmeli Y. Strategies for managing today's infections. Clin Microbiol Infect 2008 ;14 Suppl 3:22-31.
5. Chastre J. Evolving problems with resistant pathogens. Clin Microbiol Infect 2008;14 (Suppl 3):3-14.
6. Heymann DL. Resistance to anti-infective drugs and the threat to public health. Cell 2006;124(4):671-675.
7. Moellering RC,Jr, Graybill JR, McGowan JE,Jr, Corey L, American Society for Microbiology. Antimicrobial resistance prevention initiative--an update: proceedings of an expert panel on resistance. Am J Infect Control 2007; 35(9):S1-23.
8. Tenover FC, Hughes JM. The challenges of emerging infectious diseases: Development and spread of multiply-resistant bacterial pathogens. JAMA 1996; 275(4):300-304.
9. Alanis AJ. Resistance to antibiotics: are we in the post-antibiotic era? Arch Med Res 2005;36(6):697-705.
10. Zhang R, Eggleston K, Rotimi V, Zeckhauser RJ. Antibiotic resistance as a global threat: Evidence from China, Kuwait and the United States. Global Health 2006; 2:6.
11. EARSS Management Team, members of the Advisory Board, and national representatives of EARSS. EARRS Annual Report 2007.
12. Neu HC. The crisis in antibiotic resistance. Science 1992; 257(5073):1064-1073.
13. Schito GC. Is antimicrobial resistance also subject to globalization? Clin Microbiol Infect 2002; 8 Suppl 3:1-8.
14. Hawkey PM. The growing burden of antimicrobial resistance. J Antimicrob Chemother 2008; 62 Suppl 1:i1-9.
15. Ludwig E. [The spread of resistance organisms, as a global problem]; A rezisztens kórokozók terjedése-globális probléma. Infektológia és Klinikai Mikrobiológia 2008; 15(1):1-7.
16. Harbarth S, Samore MH. Antimicrobial resistance determinants and future control. Emerg Infect Dis 2005;11(6):794-801.
17. Wise R. The relentless rise of resistance? J Antimicrob Chemother 2004; 54(2):306-310.
18. Ludwig E. [Current problems of antibacterial therapy]; Az antibakteriális terápia aktuális kérdései. Orv Hetil 1998; 139(37):2179-2184.
19. Guillemot D, Carbon C, Balkau B, Geslin P, Lecoeur H, Vauzelle-Kervroedan F, et al. Low dosage and long treatment duration of beta-lactam: risk factors for carriage of penicillin-resistant Streptococcus pneumoniae. JAMA 1998; 279(5):365-370.
20. Levy SB, Marshall B. Antibacterial resistance worldwide: Causes, challenges and responses. Nat Med 2004; 10(Suppl 12.):S122-129.
21. Levy SB. Antibiotic resistance: Consequences of inaction. Clin Infect Dis 2001; 33(Suppl 3): S124-S129.
22. Norrby SR, Nord CE, Finch R. Lack of development of new antimicrobial drugs: A potential serious threat to public health. Lancet Infect Dis 2005; 5(2):115-119.
23. Spellberg B, Powers JH, Brass EP, Miller LG, Edwards Jr. JE. Trends in antimicrobial drug development: Implications for the future. Clin Infect Dis 2004; 38(9):1279-1286.
24. Talbot GH, Bradley J, Edwards Jr. JE, Gilbert D, Scheid M, Bartlett JG. Bad bugs need drugs: An update on the development pipeline from the Antimicrobial Availability Task Force of the Infectious Diseases Society of America. Clin Infect Dis 2006; 42(5):657-668.
25. Spellberg B, Guidos R, Gilbert D, Bradley J, Boucher HW, Scheld WM, et al. The epidemic of antibiotic-resistant infections: a call to action for the medical community from the Infectious Diseases Society of America. Clin Infect Dis 2008; 46(2):155-164.
26. Shapiro M, Townsend TR, Rosner B, Kass EH. Use of Anti-Microbial Drugs in General Hospitals .2. Analysis of Patterns of use. J Infect Dis 1979; 139(6):698-706.
27. Parret T, Schneider R, Rime B, Saghafi L, Pannatier A, Francioli P. Evaluation of the use of Antibiotics - a Prospective-Study in a University Hospital. Schweiz Med Wochenschr 1993; 123(10):403-413.
- 50 -
28. Antimicrobial expenditures and usage at four university hospitals. Baden-Württemberg Interuniversity Study Group. Infection 2001; 29(3):127-37.
29. McDonald LC, Yu HT, Yin HC, Hsiung CA, Hung CC, Ho M, et al. Correlates of antibiotic use in Taiwan hospitals. Infect Control Hosp Epidemiol 2001; 22(9):565-571.
30. MacDougall C, Polk RE. Variability in rates of use of antibacterials among 130 US hospitals and risk-adjustment models for interhospital comparison. Infect Control Hosp Epidemiol 2008; 29(3):203-211.
31. Trends in Antibacterial Use in US Academic Health Centers 2002 to 2006. Arch Intern Med 2008; 168(20):2254-60.
32. Bugnon-Reber A, de Torrente A, Troillet N, Genne D, ETUDAS group. Antibiotic misuse in medium-sized Swiss hospitals. Swiss MedWkly 2004; 134(33-34):481-485.
33. Troznai T, Laszlo G. [One-year experience with our antimicrobial protocol], Egyéves tapasztalataink antimikróbás protokollunkkal. Orv Hetil 1995;136:798-799.
34. Laszlo G, Kulmann L. [Observations on real drug need of hospitals]; Megfigyelések a kórházi osztályok reális gyógyszerigényérıl. Orv Hetil 1994; 135(38):2095-2098.
35. Almasi A, Horvath E, Kincses L. [Survey of the consumption of antibiotics in an inpatient database which contains 290.508 cases]; Az antibiotikum felhasználás elemzése egy 290.508 esetet tartalmazó fekvıbeteg adatbázisban. Infektológia és Klinikai Mikrobiológia 2004; 11(1):15-20.
36. Bandi D, Kiss B, Somoracz G. Antibiotikum-politika és gazdaságosság. Kórház 1995;2(7/8):33-37.
37. World Health Organization. Introduction to drug utilisation research. 2003.
38. Hartzema AG, Porta M, Tilson HH editors. Pharmacoepidemiology. An Introduction. 3rd edition. Cincinatti: Harvey Whitney Books Company; 1998.
39. Furu K, Reikvam A. Pharmacoepidemiology – a discipline in rapid progress in Norway. Norwegian Journal of Epidemiology 2008; 18(2):126-128.
40. Eggen AE, Straand J. Pharmacoepidemiology – a bridge science. Norwegian Journal of Epidemiology 2001; 11(1):3-4.
41. The selection of essential drugs. Report of a WHO Expert Committee. The Selection of Essential Drugs. Report of a WHO Expert Committee 1977; 615.
42. Wettermark B, Vlahovic-Palcevski V, Salvesen Blix H, Rønning M, Vander Stichele RH. Drug utilization research. In: Hartzema AG, Porta M, Tilson HH, editors. PharmacoEpidemiology, (4th edition), 2005
43. Birkett DJ. The future of ATC/DDD and drug utilisation research.WHO Drug Information 2002;16:238-240.
44. Matejka Z. [Tendencies of drug utilisation in Hungary]; A gyógyszerfelhasználás tendenciái Magyarországon. Gyógyszerészet 1996; 40(12):855-861.
45. Wade OL. Drug utilisation studies: implications for medical care. Plenary lecture. Acta Med Scand Suppl. 1984; 683:7-9.
46. Consumption of Drugs: Report on a Symposium. WHO 1970.
47. Bergman U, Elmes P, Halse M, Halvorsen T, Hood H, Lunde PK, et al. The measurement of drug consumption. Drugs for diabetes in Northern Ireland, Norway and Sweden. Eur J Clin Pharmacol 1975; 8(2):83-89.
48. Bergman U, Grimsson A, Wahba AHW, Westerholm B. Studies in drug utilisation: methods and applications. WHO Regional Publications, European Series No.8. 1979.
49. Bergman U. The history of the Drug Utilisation Research Group in Europe. Pharmacoepidemiol Drug Saf 2006; 15(2):95-98.
50. Schubert I. The founding of the EURO-DURG, the European Drug Utilisation Research Group. Int J Clin Pharmacol Ther 1996; 34(9):410-413.
51. Haaijer-Ruskamp F, Bergman U. Rational drug use in Europe - Challenges for the 21st century. Report from the 1st meeting of EURO DURG, the European Drug Utilisation Research Group. Eur J Clin Pharmacol 1997; 52(Suppl 2):1-8.
52. Gorecka K, Hejdova M, Vander Stitchele RH, Linhartova A, Kucera Z, Zemkova M, et al. Abstracts on drug utilisation research at seven International Conferences on Pharmacoepidemiology (ICPE): 1996-2002. Pharmacoepidemiol Drug Saf 2004; 13(9):621-622.
53. Hoven JL, Haaijer-Ruskamp FM, Vander Stichele RH. Indicators of prescribing quality in drug utilisation research: Report of a European meeting (DURQUIM, 13-15 May 2004). Eur J Clin Pharmacol 2005; 60(11):831-834.
- 51 -
54. Filius PM, Liem TB, van der Linden PD, Janknegt R, Natsch S, Vulto AG, et al. An additional measure for quantifying antibiotic use in hospitals. J Antimicrob Chemother 2005 ; 55(5):805-808.
55. Muller A, Monnet DL, Talon D, Henon T, Bertrand X. Discrepancies between prescribed daily doses and WHO defined daily doses of antibacterials at a university hospital. Br J Clin Pharmacol 2006; 61(5):585-591.
56. Kern WV, de With K, Steib-Bauert M, Fellhauer M, Plangger A, Probst W, et al. Antibiotic use in non-university regional acute care general hospitals in southwestern Germany, 2001-2002. Infection 2005; 33(5-6):333-339.
57. Meyer E, Lapatschek M, Bechtold A, Schwarzkopf G, Gastmeier P, Schwab F. Impact of restriction of third generation cephalosporins on the burden of third generation cephalosporin resistant K. pneumoniae and E. coli in an ICU. Intensive Care Med 2008 Nov 26. [Epub ahead of print]
58. Meyer E, Schwab F, Gastmeier P, Rueden H, Daschner FD. Surveillance of antimicrobial use and antimicrobial resistance in German intensive care units (SARI): a summary of the data from 2001 through 2004. Infection 2006; 34(6):303-309.
59. de With K, Meyer E, Steib-Bauert M, Schwab F, Daschner FD, Kern WV. Antibiotic use in two cohorts of German intensive care units. J Hosp Infect 2006; 64(3):231-237.
60. Hanberger H, Arman D, Gill H, Jindrak V, Kalenic S, Kurcz A, et al. Surveillance of microbial resistance in European Intensive Care Units: a first report from the Care-ICU programme for improved infection control. Intensive Care Med 2009; 35(1):91-100.
61. Hanberger H, Burman LG, Cars O, Erlandsson M, Gill H, Nilsson LE, et al. Low antibiotic resistance rates in Staphylococcus aureus, Escherichia coli and Klebsiella spp but not in Enterobacter spp and Pseudomonas aeruginosa: a prospective observational study in 14 Swedish ICUs over a 5-year period. Acta Anaesthesiol Scand 2007; 51(7):937-941.
62. Loeffler JM, Garbino J, Lew D, Harbarth S, Rohner P. Antibiotic consumption, bacterial resistance and their correlation in a Swiss university hospital and its adult intensive care units. Scand J Infect Dis 2003; 35(11-12):843-850.
63. Meyer E, Jonas D, Schwab F, Rueden H, Gastmeier P, Daschner FD. Design of a surveillance system of antibiotic use and bacterial resistance in German intensive care units (SARI). Infection 2003; 31(4):208-215.
64. Meyer E, Buttler J, Schneider C, Strehl E, Schroeren-Boersch B, Gastmeier P, et al. Modified guidelines impact on antibiotic use and costs: duration of treatment for pneumonia in a neurosurgical ICU is reduced. J Antimicrob Chemother 2007; 59(6):1148-1154.
65. Peto Z, Benko R, Matuz M, Csullog E, Molnar A, Hajdu E. Results of a Local Antibiotic Management Program on Antibiotic Use in a Tertiary Intensive Care Unit in Hungary. Infection 2008; 36(6):560-564.
66. Hanberger H, Erlandsson M, Burman LG, Cars O, Gill H, Lindgren S, et al. High antibiotic susceptibility among bacterial pathogens in Swedish ICUs. Report from a nation-wide surveillance program using TA90 as a novel index of susceptibility. Scand J Infect Dis 2004; 36(1):24-30.
67. Kritsotakis EI, Gikas A. Surveillance of antibiotic use in hospitals: methods, trends and targets. Clin Microbiol Infect 2006;12(8):701-704.
68. Kuster SP, Ruef C, Ledergerber B, Hintermann A, Deplazes C, Neuber L, et al. Quantitative Antibiotic Use in Hospitals: Comparison of Measurements, Literature Review, and Recommendations for a Standard of Reporting. Infection 2008; 36(6):549-559.
69. Erlandsson M, Burman LG, Cars O, Gill H, Nilsson LE, Walther SM, et al. Prescription of antibiotic agents in Swedish intensive care units is empiric and precise. Scand J Infect Dis 2007; 39(1):63-69.
70. de With K, Bergner J, Buhner R, Dorje F, Gonnermann C, Haber M, et al. Antibiotic use in German university hospitals 1998-2000 (Project INTERUNI-II). Int J Antimicrob Agents 2004; 24(3):213-218.
71. Soos G. [Importance of drug utilisation studies as a pharmaceutical tool for the practice of evidence-based medicine]; Gyógyszerutilizációs vizsgálatok jelentısége; a bizonyítékokon alapuló orvoslás gyógyszerészi megvalósításának egyik lehetısége. Acta Pharm Hung 2002; 72(4):252-256.
72. Graber H. [Utilisation of antibiotics in Hungary]; Antibiotikum fogyasztás Magyarországon, Adatok és reflexiók. Lege Artis Med 1997; 7(9):552-556.
73. Vincze Z, Gallik I.[ Analysis of the utilisation of systemic antiinfectives]; Szisztémás antiinfektívumok felhasználásának elemzése. Gyógyszerészet 1996; 40(3):171-179.
74. Ternak G, Almasi I. [Usage of antibiotics in hospitals]; Az antibiotikum-felhasználás szokásainak vizsgálata fekvıbeteg-intézetekben. Orv Hetil 1996; 137(52):2917-2921.
75. Almasi I, Kasza B, Baranyai G, Vesztergombi Z, Ternak G. [Analysis of antibiotic use based on case histories]; Antibiotikum-felhasználás elemzés kórrajzok alapján. Orv Hetil 1996; 137(27):1473-1477.
- 52 -
76. Almasi I, Horvath E, Ternak G. Comparative study of antibiotic use at hospital departments in 7 Hungarian hospitals 1989-1991. Orv Hetil 1995; 136(7):351-355.
77. Almasi I, Horvath E, Ternak G. Comparative study of antibiotic consumption in Hungarian hospitals during 1989-1991; Az antibiotikum fogyasztás összehasonlító vizsgálata magyar kórházakban 1989 és 1991 között. Orv Hetil 1995; 136(5):239-243.
78. Ternak G, Almasi I. [Utilization of antibiotics according to most frequent indications at Hungarian hospitals and results of surveys]; Antibiotikum felhasználás a gyakoribb indikáció területeken magyar kórházakban és a vizsgálatokból levonható következtetések. Orv Hetil 1997; 138(21):1333-1339.
79. Almasi I, Ternak G. [Simple parameters of antibiotic utilisation and diagnostic background of antimicrobial therapy in Hungarian hospitals in 1995]; Az antibiotikum-fogyasztás egyszerőbb paraméterei és a terápia diagnosztikus megalapozottsága a magyar kórházakban 1995-ben. Orv Hetil 1997; 138(8):473-478.
80. Ternak G, Almasi I. Antibiotikum a hazai fekvıbeteg intézetekben: indikáció, preferencia, diagnózis szerinti megoszlás, nozokomiális fertızések. Kórház 1996;3(5):35-40.
81. Dobak A, Filetoth Z, Komivesne T, I., Ringbauer Z, Ruszin A. Az antibiotikum-surveillance tapasztalatai az országos traumatológiai intézetben. Kórház 1999; 6(3):33-36.
82. Ovari A, Imre L. Baktérium-rezisztencia és antibiotikum-felhasználás osztályunkon. Magyar Traumatológia, Ortopédia, Kézsebészet, Plasztikai Sebészet 1996; 39(4):329-335.
83. Ludwig E, Arnold C, Hajnal F, Nagy L, Ilyes I, Kosa K. [Antibiotic use in general practises. Lessons from analysis of 60041 questionnaires]; Antibiotikum alkalmazás a területi gyakorlatban: 60041 kérdıív analízisének tanulságai. Gyógyszereink 2000;50(4):140-145.
84. Ludwig E, Varnai Z, Szekely E, Gyorgy L. [Antibiotic consumption and resistance correlations in Hungary]; Magyarországi antibiotikum felhasználás és rezisztencia viszonyok. Infektológia és Klinikai Mikrobiológia 2004; 11(1): 21-25.
85. Ternak G, Almasi I. [Habits of utilisation antibiotics and their financial consequences]; Antibiotikum felhasználási szokások és a levonható költséghatékonysági tanulságok. Gyógyszerészet 1998; 42(1):39-42.
86. Paal TL, Rab E., Oltvanyi N, Szepezdi Z. [Studies on the utilisation of antibacterial drugs in Hungary]; Az antibakteriális gyógyszerek magyarországi felhasználásának elemzése. Gyógyszereink 1993; 43(6):319-322.
87. Jakics J, Breitner V, Hernadi E, Horvath M, Somoracz G, Szikra L, et al. [Questions concerning the use of antibiotics]; Az antibiotikumok alkalmazásának néhány kérdése. Orv Hetil 1985; 126(14):849-853.
88. Jakics J, Bandi D, Csak E. [Experiment for increasing the effectiveness of antibiotic therapy]; Kísérlet az antibiotikum kezelés hatékonyságának javítására. Orv Hetil 1986; 127(23):1371-1374.
89. Bandi D, Gog B, Kiss B, Somoracz G, Jakics J. [Policy in antibiotics-therapy and its results in our hospital]; Antibiotikumpolitika és eredményei kórházunkban. Gyógyszerészet 1992; 36(8):459-464.
90. Katona Z, Matejka Z, Mikola B.[ Antibacterial treatment in a county hospital]; Antibakteriális kezelés egy megye kórházaiban. Orv Hetil 1987; 128(50):2631-2633.
91. Katona Z. [Antibacterial treatment in the practice of the district physician]; Antibakteriális kezelés a körzetorvoslásban. Orv Hetil 1987;128(27):1403-1410.
92. Kelentey B, Imre G, Poti S, Redl P, Keszthelyi G. [Use of antibiotics at the Department of Oral- and Maxillofacial Surgery of the Debrecen Medical University in the last 10 years (1989-1998)]; Antibiotikum alkalmazás a DOTE Stomatológiai Klinika Szájsebészeti Osztályán az elmúlt 10 év során (1989-1998). Fogorvosi Szemle 2001; 94(2):69-74.
93. Barsony K, Puskas M. Az antibiotikum-felhasználás változása Magyarországon 1990-1996 között I. Gyógyszerpiac 1998; 6(2):28-30.
94. Barsony K, Puskas M. Az antibiotikum-felhasználás változása Magyarországon 1990-1996 között II. Gyógyszerpiac 1998; 6(3):37-42.
95. Feller A. A szisztémás antibiotikumok gyógyszertári forgalmának alakulása Magyarországon 1992- 1996. Gyógyszerpiac 1996; 4:28-33.
96. Matejka Z. A hazai antibiotikum-felhasználás problémái a biztosító szemszögébıl. Gyógyszerpiac 1993; 1(5):20.
97. Pharmafelax Kft. Antibiotikumaink. Gyógyszerpiac 1993; 1(5):28-44.
98. Ternak G. Antibiotikumok felhasználásának epidemiológiai vizsgálata kórházi és járóbeteg, valamint mikrobiológiai antibiotikum-érzékenységi adatok alapján. Infekció & Infekciókontroll 2006; 3(1):6-95.
99. Ternak G, Almasi I. Antibiotikum politika és a gyógyítás szabadsága a "Korlátozások forradalma" idıszakában. Kórház 1997; 4(7/8):40-42.
- 53 -
100. Almasi I, Ternak G. [Practise of perioperative antibiotic prophylaxis in Hungary]; A mőtéti antibiotikum prophylaxis gyakorlata Magyarországon. Gyógyszereink 1998; 48(4):116-122.
101. Ronning M, Blix HS, Strom H, Skovlund E, Andersen M, Stichele RV. Problems in collecting comparable national drug use data in Europe: the example of antibacterials. Eur J Clin Pharmacol 2003; 58(12):843-849.
102. Song JH. Introduction: the goals of antimicrobial therapy. Int J Infect Dis 2003;7 Suppl 1:S1-4.
103. Garau J. Why do we need to eradicate pathogens in respiratory tract infections? Int J Infect Dis 2003; 7 Suppl 1:S5-12.
104. Dagan R, Klugman KP, Craig WA, Baquero F. Evidence to support the rationale that bacterial eradication in respiratory tract infection is an important aim of antimicrobial therapy. J Antimicrob Chemother 2001; 47(2):129-140.
105. Burgess DS. Pharmacodynamic principles of antimicrobial therapy in the prevention of resistance. Chest 1999; 115(Suppl 3):19S-23S.
106. Zhao X, Drlica K. A unified anti-mutant dosing strategy. J Antimicrob Chemother 2008 ; 62(3):434-436.
107. Drlica K. The mutant selection window and antimicrobial resistance. J Antimicrob Chemother 2003; 52(1):11-17.
108. Eagle H, Fleischman R, Levy M. "Continuous" vs. "discontinuous" therapy with penicillin; the effect of the interval between injections on therapeutic efficacy. N Engl J Med 1953;248(12):481-488.
109. Eagle H, Fleischman R, Musselmann AD. The bactericidal action of penicillin in vivo: the participation of the host, and the slow recovery of the surviving organisms. Ann Intern Med 1950; 33(3):544-571.
110. Eagle H, Fleischman R, Musselman AD. Effect of schedule of administration on the therapeutic efficacy of penicillin. Importance of the aggregate time penicillin remains at effectively bactericidal levels. Am J Med 1950; 9(3):280-299.
111. Mouton JW, Dudley MN, Cars O, Derendorf H, Drusano GL. Standardization of pharmacokinetic/pharmacodynamic (PK/PD) terminology for anti-infective drugs: An update. J Antimicrob Chemother 2005; 55(5):601-607.
112. Bauer LA. Applied clinical pharmacokinetics. McGraw-Hill; 2001.
113. Ludwig E. [Antibiotic dosing and clinical efficacy]; antibiotikum adagolás és klinikai hatékonyság. Gyógyszereink 1999; 49(4):81-87.
114. Liu P, Muller M, Derendorf H. Rational dosing of antibiotics: the use of plasma concentrations versus tissue concentrations. Int J Antimicrob Agents 2002; 19(4):285-290.
115. Schentag JJ, Swanson DJ, Smith IL. Dual individualization: Antibiotic dosage calculation from the integration of in-vitro pharmacodynamics and in-vivo pharmacokinetics. J Antimicrob Chemother 1985; 15(Suppl A):47-57.
116. Scaglione F, Paraboni L. Pharmacokinetics/pharmacodynamics of antibacterials in the Intensive Care Unit: setting appropriate dosing regimens. Int J Antimicrob Agents 2008; 32(4):294-301.
117. Barger A, Fuhst C, Wiedemann B. Pharmacological indices in antibiotic therapy. J Antimicrob Chemother 2003; 52(6):893-898.
118. Craig WA, Suh B. Protein binding and the antimicrobial effects: methods for the determination of protein binding. In: Lorian V, editor. Antibiotics in Laboratory Medicine USA: Williams and Wilkins; 1991. p. 367-402.
119. Merrikin DJ, Briant J, Rolinson GN. Effect of protein binding on antibiotic activity in vivo. J Antimicrob Chemother 1983; 11(3):233-238.
120. Nix DE, Goodwin SD, Peloquin CA, Rotella DL, Schentag JJ. Antibiotic tissue penetration and its relevance: impact of tissue penetration on infection response. Antimicrob Agents Chemother1991;35(10):1953-1959.
121. Nix DE, Goodwin SD, Peloquin CA, Rotella DL, Schentag JJ. Antibiotic tissue penetration and its relevance: models of tissue penetration and their meaning. Antimicrob Agents Chemother 1991; 35(10):1947-1952.
122. Schentag JJ. Correlation of pharmacokinetic parameters to efficacy of antibiotics: relationships between serum concentrations, MIC values, and bacterial eradication in patients with gram-negative pneumonia. Scand J Infect Dis Suppl 1990; 74:218-234.
123. Schentag JJ. Clinical significance of antibiotic tissue penetration. Clin Pharmacokinet 1989; 16 Suppl 1:25-31.
- 54 -
124. Cars O. Efficacy of beta-lactam antibiotics: integration of pharmacokinetics and pharmacodynamics. Diagn Microbiol Infect Dis 1997; 27(1-2):29-33.
125. Kiem S, Schentag JJ. Relationship of minimal inhibitory concentration and bactericidal activity to efficacy of antibiotics for treatment of ventilator-associated pneumonia. Semin Respir Crit Care Med 2006; 27(1):51-67.
126. Zelenitsky SA, Harding GKM, Sun S, Ubhi K, Ariano RE. Treatment and outcome of Pseudomonas aeruginosa bacteraemia: An antibiotic pharmacodynamic analysis. J Antimicrob Chemother 2003; 52(4):668-674.
127. Preston SL, Drusano GL, Berman AL, Fowler CL, Chow AT, Dornseif B, et al. Pharmacodynamics of levofloxacin: A new paradigm for early clinical trials. JAMA 1998; 279(2):125-129.
128. Madaras-Kelly KJ, Ostergaard BE, Hovde LB, Rotschafer JC. Twenty-four-hour area under the concentration-time curve/MIC ratio as a generic predictor of fluoroquinolone antimicrobial effect by using three strains of Pseudomonas aeruginosa and an in vitro pharmacodynamic model. Antimicrob Agents Chemother1996; 40(3):627-632.
129. Forrest A, Nix DE, Ballow CH, Goss TF, Birmingham MC, Schentag JJ. Pharmacodynamics of intravenous ciprofloxacin in seriously ill patients. Antimicrob Agents Chemother1993; 37(5):1073-1081.
130. Fish DN. Levofloxacin: Update and perspectives on one of the original 'respiratory quinolones'. Expert Rev Anti Infect Ther 2003; 1(3):371-387.
131. Schentag JJ, Meagher AK, Forrest A. Fluoroquinolone AUIC break points and the link to bacterial killing rates part 2: Human trials. Ann Pharmacother 2003; 37(10):1478-1488.
132. Lister PD. Impact of AUC/MIC ratios on the pharmacodynamics of the des-F(6) quinolone garenoxacin (BMS-284756) is similar to other fluoroquinolones [14]. J Antimicrob Chemother 2003; 51(1):199-202.
133. Lister PD. Pharmacodynamics of gatifloxacin against Streptococcus pneumoniae in an in vitro pharmacokinetic model: Impact of area under the curve/MIC ratios on eradication. Antimicrob Agents Chemother 2002; 46(1):69-74.
134. Ambrose PG, Grasela DM, Grasela TH, Passarell J, Mayer HB, Pierce PF. Pharmacodynamics of fluoroquinolones against Streptococcus pneumoniae in patients with community-acquired respiratory tract infections. Antimicrob Agents Chemother 2001; 45(10):2793-2797.
135. Mattoes HM, Banevicius M, Li D, Turley C, Xuan D, Nightingale CH, et al. Pharmacodynamic assessment of gatifloxacin against Streptococcus pneumoniae. Antimicrob Agents Chemother 2001; 45(7):2092-2097.
136. Lister PD, Sanders CC. Pharmacodynamics of moxifloxacin, levofloxacin and sparfloxacin against Streptococcus pneumoniae. J Antimicrob Chemother 2001; 47(6):811-818.
137. Lacy MK, Lu W, Xu X, Tessier PR, Nicolau DP, Quintiliani R, et al. Pharmacodynamic comparisons of levofloxacin, ciprofloxacin, and ampicillin against Streptococcus pneumoniae in an in vitro model of infection. Antimicrob Agents Chemother 1999; 43(3):672-677.
138. Lister PD, Sanders CC. Pharmacodynamics of levofloxacin and ciprofloxacin against Streptococcus pneumoniae. J Antimicrob Chemother 1999; 43(1):79-86.
139. Wright DH, Brown GH, Peterson ML, Rotschafer JC. Application of fluoroquinolone pharmacodynamics. J Antimicrob Chemother 2000; 46(5):669-683.
140. Drusano GL, Preston SL, Fowler C, Corrado M, Weisinger B, Kahn J. Relationship between fluoroquinolone area under the curve:minimum inhibitory concentration ratio and the probability of eradication of the infecting pathogen, in patients with nosocomial pneumonia. J Infect Dis 2004; 189(9):1590-1597.
141. Vincent JL, Bihari DJ, Suter PM, Bruining HA, White J, Nicolas-Chanoin MH, et al. The prevalence of nosocomial infection in intensive care units in Europe. Results of the European Prevalence of Infection in Intensive Care (EPIC) Study. EPIC International Advisory Committee. JAMA 1995; 274(8):639-644.
142. Esen S, Leblebicioglu H. Prevalence of nosocomial infections at intensive care units in Turkey: a multicentre 1-day point prevalence study. Scand J Infect Dis 2004;36(2):144-148.
143. Richards MJ, Edwards JR, Culver DH, Gaynes RP. Nosocomial infections in medical intensive care units in the United States. National Nosocomial Infections Surveillance System. Crit Care Med 1999;27(5):887-892.
144. Pea F, Di Qual E, Cusenza A, Brollo L, Baldassarre M, Furlanut M. Pharmacokinetics and pharmacodynamics of intravenous levofloxacin in patients with early-onset ventilator-associated pneumonia. Clin Pharmacokinet 2003; 42(6):589-598.
145. Shorr AF, Zadeikis N, Jackson WL, Ramage AS, Wu S-, Tennenberg AM, et al. Levofloxacin for treatment of ventilator-associated pneumonia: A subgroup analysis from a randomized trial. Clin Infect Dis 2005; 40(Suppl):S123-S129.
- 55 -
146. Pea F, Viale P, Furlanut M. Antimicrobial therapy in critically ill patients: A review of pathophysiological conditions responsible for altered disposition and pharmacokinetic variability. Clin Pharmacokinet 2005; 44(10):1009-1034.
147. Dufour G, Montravers P. Pharmacokinetics of antibiotics or antifungal drugs in intensive care units. Curr Infect Dis Rep 2009; 11(1):14-20.
148. Rebuck JA, Fish DN, Abraham E. Pharmacokinetics of intravenous and oral levofloxacin in critically ill adults in a medical intensive care unit. Pharmacotherapy 2002;22(10):1216-1225.
149. Boselli E, Breilh D, Rimmelé T, Djabarouti S, Saux M-, Chassard D, et al. Pharmacokinetics and intrapulmonary diffusion of levofloxacin in critically ill patients with severe community-acquired pneumonia. Crit Care Med 2005; 33(1):104-109.
150. Tayab ZR, Hochhaus G, Kaufmann S, Jager D, Barth J. Do intensive care patients need an individualized dosing regimen for levofloxacin? Int J Clin Pharmacol Ther 2006; 44(6):262-269.
151. Sanchez Navarro A, Colino Gandarillas CI, Alvarez Lerma F, Menacho YA, Dominguez-Gil A. Pharmacokinetics and pharmacodynamics of levofloxacin in intensive care patients. Clin Pharmacokinet 2005; 44(6):627-635.
152. Traunmuller F, Thalhammer-Scherrer R, Locker GJ, Losert H, Schmid R, Staudinger T, et al. Single-dose pharmacokinetics of levofloxacin during continuous veno-venous haemofiltration in critically ill patients. J Antimicrob Chemother 2001; 47(2):229-231.
153. Kiser TH, Hoody DW, Obritsch MD, Wegzyn CO, Bauling PC, Fish DN. Levofloxacin pharmacokinetics and pharmacodynamics in patients with severe burn injury. Antimicrob Agents Chemother 2006; 50(6):1937-1945.
154. Czock D, Husig-Linde C, Langhoff A, Schopke T, Hafer C, de Groot K, et al. Pharmacokinetics of moxifloxacin and levofloxacin in intensive care unit patients who have acute renal failure and undergo extended daily dialysis. Clin J Am Soc Nephrol 2006;1(6):1263-1268.
155. Bellmann R, Egger P, Gritsch W, Bellmann-Weiler R, Joannidis M, Dunzendorfer S, et al. Elimination of levofloxacin in critically ill patients with renal failure: influence of continuous veno-venous hemofiltration. Int J Clin Pharmacol Ther 2002; 40(4):142-149.
156. Guenter SG, Iven H, Boos C, Bruch HP, Muhl E. Pharmacokinetics of levofloxacin during continuous venovenous hemodiafiltration and continuous venovenous hemofiltration in critically ill patients. Pharmacotherapy 2002; 22(2):175-183.
157. Malone RS, Fish DN, Abraham E, Teitelbaum I. Pharmacokinetics of levofloxacin and ciprofloxacin during continuous renal replacement therapy in critically ill patients. Antimicrob Agents Chemother 2001;45(10):2949-2954.
158. Hansen E, Bucher M, Jakob W, Lemberger P, Kees F. Pharmacokinetics of levofloxacin during continuous veno-venous hemofiltration. Intensive Care Med 2001; 27(2):371-375.
159. WHO Collaborating Centre for Drug Statistics Methodology. ATC classification index with DDDs 2008. 2008.
160. Vander Stichele RH, Elseviers MM, Ferech M, Blot S, Goossens H, European Survaillance of Antibiotic Comsuption (ESAC) Project Group. Hospital consumption of antibiotics in 15 European countries: results of the ESAC Retrospective Data Collection (1997-2002). J Antimicrob Chemother 2006; 58(1):159-167.
161. Hungarian National Health Fund Administration, Department of Informatics. Online database; inpatient-statistics. Available at: http://www.gyogyinfok.hu. Last Accesed: Jan, 2009
162. Bergman U, Popa C, Tomson Y, Wettermark B, Einarson TR, Aberg H, et al. Drug utilisation 90%--a simple method for assessing the quality of drug prescribing. Eur J Clin Pharmacol 1998; 54(2):113-118.
163. Filippini M, Masiero G, Moschetti K. Socioeconomic determinants of regional differences in outpatient antibiotic consumption: evidence from Switzerland. Health Policy 2006; 78(1):77-92.
164. National Institute for Strategic Health Research. Health data; Available at: http://www.eski.hu/new3/adatok_en/adatok_alap_en.php. Last accesed: Jan, 2009
165. WHO Collaborating Centre for Drug Statistics Methodology. ATC classification index with DDDs 2005. 2005.
166. Hungarian Central Statistical Office. Statistical Yearbook of Hungary, 2005. Budapest; 2006.
167. Pugin J, Auckenthaler R, Mili N, Janssens J-, Lew PD, Suter PM. Diagnosis of ventilator-associated pneumonia by bacteriologic analysis of bronchoscopic and nonbronchoscopic 'blind' bronchoalveolar lavage fluid. Am Rev Respir Dis 1991; 143(5 I):1121-1129.
- 56 -
168. Liang H, Kays MB, Sowinski KM. Separation of levofloxacin, ciprofloxacin, gatifloxacin, moxifloxacin, trovafloxacin and cinoxacin by high-performance liquid chromatography: Application to levofloxacin determination in human plasma. J Chromatogr B Analyt Technol Biomed Life Sci 2002; 772(1):53-63.
169. Clinical and Laboratory Standard Institute. Performance standards for Antimicrobial Susceptibility Testing. 2008;Eighteenth Informational Supplement M100-S18 Vol.28 Mo. 1.
170. Le Gall J-, Lemeshow S, Saulnier F. A new Simplified Acute Physiology Score (SAPS II) based on a European/North American multicenter study. JAMA 1993;270(24):2957-2963.
171. de With K, Maier L, Steib-Bauert M, Kern P, Kern WV. Trends in antibiotic use at a university hospital: defined or prescribed daily doses? Patient days or admissions as denominator? Infection 2006; 34(2):91-94.
172. Benko R, Matuz M, Doro P, Viola R, Hajdu E, Soos G. Hungarian hospital antibiotic consumption. Does it matter which measure? Pharmacoepidemiol Drug Saf 2006; 15:614.
173. University of Antwerp, European Surveillance of Antimicrobial Consumption. ESAC interactive database. 2005; Available at: http://www.esac.ua.ac.be/main.aspx?c=*ESAC2&n=50083&ct=50080&e=1122, 2009. Last accesed: April, 2009
174. de With K, Steib-Bauert M, Straach P, Kern WV. Is there significant regional variation in hospital antibiotic consumption in Germany? Infection 2006; 34(5):274-277.
175. Blix HS, Hartug S. Hospital usage of antibacterial agents in relation to size and type of hospital and geographical situation. Pharmacoepidemiol Drug Saf 2005; 14(9):647-649.
176. Statens Serum Instutite, National Food Insitute, National Veterinary Institute, Danish Medicines Agency, Ministry of Food Agriculture and Fisheries. DANMAP 2007 - the Danish Integrated Antimicrobial resistance Monitoring and Research Programme: Use of antimicrobial agents and occurrence of antimicrobial resistance in bacteria from food animals, foods and humans in Denmark. Available at: http://www.danmap.org/pdfFiles/Danmap_2007.pdf. Last accesed: March, 2009
177. Statens Serum Instutite, National Food Insitute, National Veterinary Institute, Danish Medicines Agency, Ministry of Food Agriculture and Fisheries. DANMAP 2005 - the Danish Integrated Antimicrobial resistance Monitoring and Research Programme; Use of antimicrobial agents and occurrence of antimicrobial resistance in bacteria from food animals, foods and humans in Denmark. Available at: http://www.danmap.org/pdfFiles/Danmap_2005.pdf. Last accesed: March, 2009
178. Swedish Strategic Programme Against Antibiotic Resistance, Swedish Institute for Infectious Disease Control. SWEDRES 2005. Report on Swedish Antibiotic Utilisation and Resistance in Human Medicine. Available at: http://en.strama.se/dyn//,95,15.html. Last accesed: March, 2009
179. Swedish Strategic Programme Against Antibiotic Resistance, Swedish Institute for Infectious Disease Control. SWEDRES 2007. Report on Swedish Antibiotic Utilisation and Resistance in Human Medicine. Available at: http://en.strama.se/dyn//,95,15.html. Last accesed: March, 2009
180. Muller-Pebody B, Muscat M, Pelle B, Klein BM, Brandt CT, Monnet DL. Increase and change in pattern of hospital antimicrobial use, Denmark, 1997-2001. J Antimicrob Chemother 2004; 54(6):1122-1126.
181. Rogues AM, Placet-Thomazeau B, Parneix P, Vincent I, Ploy MC, Marty N, et al. Use of antibiotics in hospitals in south-western France. J Hosp Infect 2004; 58(3):187-192.
182. Liem TB, Filius FM, van der Linden PD, Janknegt R, Natsch S, Vulto AG. Changes in antibiotic use in Dutch hospitals over a six-year period: 1997 to 2002. Neth J Med 2005 ; 63(9):354-360.
183. World Health Organization Regional Office for Europe. European health for all database (HFA-DB). Available at: http://www.euro.who.int/hfadb. Last accesed: February, 2009
184. Gaál P. Health Care Systems in Transition - Hungary. Available at: http://www.euro.who.int/Document/E84926.pdf. Last accesed: February, 2009
185. Ludwig E. A bakteriális rezisztencia és klinikai következményei. Családorvosi Fórum 2003(2):31-36.
186. Ludwig E. [Increasing antibacterial resistance]; Fokozódó bakteriális rezisztencia: súlyos valódi probléma vagy az újabb és újabb antibiotikumok elıálítását indokoló "slogen". Gyógyszereink 2001; 51(2):60-68.
187. Vlahovic-Palcevski V, Morovic M, Palcevski G. Antibiotic utilisation at the university hospital after introducing an antibiotic policy. Eur J Clin Pharmacol 2000; 56(1):97-101.
188. Fridkin SK, Steward CD, Edwards JR, Pryor ER, McGowan JE,Jr, Archibald LK, et al. Surveillance of antimicrobial use and antimicrobial resistance in United States hospitals: project ICARE phase 2. Project Intensive Care Antimicrobial Resistance Epidemiology (ICARE) hospitals. Clin Infect Dis 1999; 29(2):245-252.
189. Monnet DL, Archibald LK, Phillips L, Tenover FC, McGowan JE,Jr, Gaynes RP. Antimicrobial use and resistance in eight US hospitals: complexities of analysis and modeling. Intensive Care Antimicrobial
- 57 -
Resistance Epidemiology Project and National Nosocomial Infections Surveillance System Hospitals. Infect Control Hosp Epidemiol 1998; 19(6):388-394.
190. Matuz M, Benko R, Doro P, Hajdu E, Nagy G, Nagy E, et al. Regional variations in community consumption of antibiotics in Hungary, 1996-2003. Br J Clin Pharmacol 2006; 61(1):96-100.
191. Dellit TH, Owens RC, McGowan JE Jr, Gerding DN, Weinstein RA, Burke JP, et al. Infectious Diseases Society of America, Society for Healthcare Epidemiology of America. Infectious Diseases Society of America and the Society for Healthcare Epidemiology of America guidelines for developing an institutional program to enhance antimicrobial stewardship. Clin Infect Dis 2007 15; 44(2):159-77.
192. MacDougall C, Polk RE. Antimicrobial stewardship programs in health care systems. Clin Microbiol Rev 2005;18(4):638-656.
193. Von Gunten V, Reymond J-, Beney J. Clinical and economic outcomes of pharmaceutical services related to antibiotic use: A literature review. Pharm World Sci 2007; 29(3):146-163.
194. MacKenzie FM, Struelens MJ, Towner KJ, Gould IM, Goossens H, van der Meer J, et al. Report of the Consensus Conference on Antibiotic Resistance; Prevention and Control (ARPAC). Clin Microbiol Infect 2005; 11(11):938-954.
195. Tonna AP, Stewart D, West B, Gould I, McCaig D. Antimicrobial optimisation in secondary care: the pharmacist as part of a multidisciplinary antimicrobial programme-a literature review. Int J Antimicrob Agents2008; 31(6):511-517.
196. MacKenzie FM, Gould IM, Bruce J, Mollison J, Monnet DL, Krcmery V, et al. The role of microbiology and pharmacy departments in the stewardship of antibiotic prescribing in European hospitals. J Hosp Infect 2007; 65(Suppl. 2):73-81.
197. Gould IM, Meer J, Monnet D, Cookson B, Krcmery V, MacKenzie FM. Antibiotic Stewardship in ARPAC European Hospitals. Available at: www.infectiologie.com/public/congres/2005/CP/cp9-2-gould.pdf. Last accesed: April, 2009
198. Walther SM, Erlandsson M, Burman LG, Cars O, Gill H, Hoffman M, et al. Antibiotic prescription practices, consumption and bacterial resistance in a cross section of swedish intensive care units. Acta Anaesthesiol Scand 2002; 46(9):1075-1081.
199. Meer J. Do education and audit optimise prescribing? ARPAC Consensus Conference handout, Plenary sessions. Amsterdam, 2004
200. Drummond CWE. Resistance is futile - A conference to promote the rational use of antimicrobials in acute hospitals. J Antimicrob Chemother 2006; 57(2):171-175.
201. Meyer E, Schwab F, Schroeren-Boersch B, Ruden H, Gastmeier P. Diversity in antibiotic use in intensive care units in Germany. Dtsch MedWochenschr 2008;133(6):235-240.
202. Kuster SP, Ruef C, Bollinger AK, Ledergerber B, Hintermann A, Deplazes C, et al. Correlation between case mix index and antibiotic use in hospitals. J Antimicrob Chemother 2008;62(4):837-842.
203. Goldmann DA, Weinstein RA, Wenzel RP, Tablan OC, Duma RJ, Gaynes RP, et al. Strategies to Prevent and Control the Emergence and Spread of Antimicrobial-Resistant Microorganisms in Hospitals. A challenge to hospital leadership. JAMA 1996; 17;275(3):234-240.
204. Cunha BA. Oral antibiotic therapy of serious systemic infections. Med Clin North Am 2006; 90(6):1197-1222.
205. Power BM, Forbes AM, van Heerden PV, Ilett KF. Pharmacokinetics of drugs used in critically ill adults. Clin Pharmacokinet 1998; 34(1):25-56.
206. Healy DP, Brodbeck MC, Clendening CE. Ciprofloxacin absorption is impaired in patients given enteral feedings orally and via gastrostomy and jejunostomy tubes. Antimicrob Agents Chemother 1996; 40(1):6-10.
207. Mimoz O, Binter V, Jacolot A, Edouard A, Tod M, Petitjean O, et al. Pharmacokinetics and absolute bioavailability of ciprofloxacin administered through a nasogastric tube with continuous enteral feeding to critically ill patients. Intensive Care Med 1998; 24(10):1047-1051.
208. Pinder M, Bellomo R, Lipman J. Pharmacological principles of antibiotic prescription in the critically ill. Anaesth Intensive Care 2002; 30(2):134-44.
209. Meyer E, Schwab F, Gastmeier P, Rueden H, Jonas D. Antibiotic use in German intensive care units. . Int J Antimicrob Agents 2007; 29(Suppl 2): S299.
210. Lemmen SW, Becker G, Frank U, Daschner FD. Influence of an infectious disease consulting service on quality and costs of antibiotic prescriptions in a university hospital. Scand J Infect Dis 2001; 33(3):219-221.
211. Paterson DL. Restrictive antibiotic policies are appropriate in intensive care units. Crit Care Med 2003; 31(Suppl 1):S25-8.
- 58 -
212. Davey P, Brown E, Fenelon L, Finch R, Gould I, Hartman G, et al. Interventions to improve antibiotic prescribing practices for hospital inpatients. Cochrane Database Syst Rev 2005; (4)(4):CD003543.
213. Ramsay C, Brown E, Hartman G, Davey P. Room for improvement: a systematic review of the quality of evaluations of interventions to improve hospital antibiotic prescribing. J Antimicrob Chemother 2003; 52(5):764-771.
214. van Hees BC, de Ruiter E, Wiltink EH, de Jongh BM, Tersmette M. Optimizing use of ciprofloxacin: a prospective intervention study. J Antimicrob Chemother 2008; 61(1):210-213.
215. Mol PG, Wieringa JE, Nannanpanday PV, Gans RO, Degener JE, Laseur M, et al. Improving compliance with hospital antibiotic guidelines: a time-series intervention analysis. J Antimicrob Chemother 2005; 55(4):550-557.
216. Bergogne-Bérézin E. Clinical role of protein binding of quinolones. Clin Pharmacokinet 2002; 41(10):741-750.
217. Wise R. Protein binding of β-lactams: The effects on activity and pharmacology particularly tissue penetration. II. J Antimicrob Chemother 1983; 12(2):105-118.
218. Theuretzbacher U. Tissue concentrations, Protein binding. Available at: http://www.isap.org/2006/ECCMID-ISAP-Workshop-2006/slides/Theuretzbacher.pdf. Last accesed: February, 2009
219. Sigma-Aldrich. Mueller-Hinton Agar Datasheet. http://www.sigmaaldrich.com/sigma/datasheet/m9552dat.pdf Last accesed: September, 2008
220. Aminimanizani A, Beringer P, Jelliffe R. Comparative pharmacokinetics and pharmacodynamics of the newer fluoroquinolone antibacterials. Clin Pharmacokinet 2001; 40(3):169-187.
221. Noel GJ, Goodman DB, Chien S, Solanki B, Padmanabhan M, Natarajan J. Measuring the Effects of Supratherapeutic Doses of Levofloxacin on Healthy Volunteers Using Four Methods of QT Correction and Periodic and Continuous ECG Recordings J Clin Pharmacol 2004;44(5):464-473.
222. Turnidge J. Pharmacokinetics and pharmacodynamics of fluoroquinolones. Drugs 1999; 58(Suppl 2):29-36.
223. European Committee on Antimicrobial Susceptibility Testing. European antimicrobial breakpoints. Available at: http://www.srga.org/eucastwt/MICTAB/index.html; Last accesed: February, 2009
- 59 -
9. ACKNOWLEDGEMENTS
First of all, I wish to express my sincere gratitude to my supervisor Dr. Gyöngyvér Soós for
her support and guidance of my work. I am thankful for her criticism, encouragement and
numerous advices during my Ph.D. work.
I am indebted to Prof. Dominique Monnet for introducing me to drug utilisation studies and
to Prof. Elisabeth Nagy for providing the possibility and strong support to work in close
collaboration with the Institute of Clinical Microbiology .
Special thanks to Dr. Mária Matuz and Dr. Edit Hajdú , my closest colleagues, co-authors,
and friends for their numberless help and support.
I express my thanks to all my co-authors for their collaboration and help in this work: Prof.
Lajos Bogár, Dr. Péter Doró, Dr. János Gardi, Dr. Ágnes Hegedős, Dr. Anna Molnár,
Dr. Zoltán Petı and Dr. Réka Viola.
Thanks are also due the staff of the Intensive Care Unit at the New Clinic and to the staff of
the Endocrinology Laboratory for their technical assistance and for the friendly work-
atmosphere.
I am grateful the IMS PharmMIS Consulting Company for providing me invaluable data
on antibiotic consumption.
I am deeply grateful to my family for their continuous support and encouragement that I have
received during these years.
- 60 -
10. ANNEX
10.1. Definitions of pharmacokinetic and pharmacodynamic parameters
Pharmacokinetic parameters (in alphabetic order)
AUC [111]: The area under the serum/plasma concentration–time curve at steady-state over 24 h unless otherwise stated. Dimensions: Concentration-time (e.g. mg·h/L or mg·h/mL). Clearance (CL) [112]: The volume of serum or blood completely cleared of the drug per unit time. Dimensions: Volume per time (e.g. ml/min). Elimination half-life: (T1/2β) [112]: The time that it takes for serum concentrations to decrease by half in the elimination phase. Dimension: Time (e.g. h). Peak or Cmax (level, concentration) [111]: the highest concentration reached or estimated in the compartment of reference (in this thesis: serum/plasma). Dimensions: Concentration (e.g. mg/L or mg/mL). Though or Cmin (level, concentration) [111]: the lowest concentration reached or estimated in the compartment of reference (in this thesis: serum/plasma). Dimensions: Concentration (e.g. mg/L or mg/mL). Volume of distribution (Vd) [112]: A hypothetical volume that relates drug serum concentration to the amount of drug in the body. Dimension: Volume (e.g. L or ml) The prefix “f “ refers to the free fraction of the drug, e.g. fAUC indicating that it is the free, unbound fraction of the drug that is meant or used. The subscript “ss” refers to the pharmacokinetic steady state condition, e.g. fCmax,ss is maximum free serum/plasma concentration of the drug estimated or reached under steady-state conditions. Pharmacodynamic parameters (in alphabetic order) In vivo post-antibiotic effect (PAE) [111]: The difference in time for the number of bacteria in a tissue of treated animals versus controls to increase 1 log10 over values when drug concentrations in serum or the infection site fall below the MIC. The in vivo PAE thus includes the effects of sub-MIC concentrations. Dimensions: Time (e.g. h). Minimum inhibitory concentration (MIC) [113]: The lowest concentration of antibiotic sufficient to inhibit bacterial growth when tested in vitro. Dimensions: Concentration (e.g. mg/L or mg/mL). Minimum inhibitory concentration 90 (MIC90) [113]: The lowest concentration of antibiotic required to inhibit the growth of 90% of tested isolates. Dimensions: Concentration (e.g. mg/L or mg/mL).
- 61 -
10.2. Ethical approval of the pharmacokinetic study
- 62 -
10.3. Publications related to the thesis
I. R Benko, M Matuz, P Doro, E Hajdu, G Nagy, E Nagy, Gy Soos: [Antibiotic consumption between 1996 and 2003: national survey and international comparison]. Orv Hetil 2006; 147(26): 1215-1222.
II. R Benko, M Matuz, P Doro, R Viola, E Hajdu, DL Monnet, G Soos. Hungarian Hospital Antibiotic Consumption at the regional level, 1996-2005. Infection. 2009;37(2):133-137.
III. R Benko, M Matuz; E Hajdu, Z Peto, A Hegedus, L Bogar, Gy Soos. [The participation of pharmacist in antibiotic related activities of Hungarian hospitals and intensive care units] Acta Pharm Hung [under publication]
IV. R Benko, M Matuz, P Doro, Z Peto, A Molnar, E Hajdu, E Nagy, J Gardi, Gy Soos. Pharmacokinetics and pharmacodynamics of levofloxacin in critically ill patients with ventilator-associated pneumonia. Int J Antimicrob Agents 2007; 30(2):162-168.
V. R Benko, M Matuz, E Hajdu, P Doro, Z Peto, A Molnar, J Gardi, E Nagy, G Soos: [Assesment of therapeutic efficacy based on levofloxaxcin plasma level measurement in intensive care unit patients] Infektológia és Klinikai Mikrobiológia 2007, 14(3-4): 97-103.


![u-szeged.hudoktori.bibl.u-szeged.hu/10222/1/__ZT_dissertation.pdf · Chapter1 Foreword Thisdoctoralthesiscontainstheresultsofthefollowingfourpapers[FVZ16a,FVZ16b, BFVZ17,FNZ18],eachwrittenwithco-authors](https://img.pdfslide.us/doc/110x75/5f48ffb50ad3bb3a38544621/u-chapter1-foreword-thisdoctoralthesiscontainstheresultsofthefollowingfourpapersfvz16afvz16b.jpg)