Embed Size (px)
Citation preview
1
University of Szeged
Faculty of Pharmacy
Educational program: Pharmaceutical Technology
Head: Prof. Dr. Habil. Piroska Szabó-Révész DSc
Department of Pharmaceutical Technology
Supervisor: Prof. Dr. Habil. Piroska Szabó-Révész DSc
Csaba Mártha
Crystallinity changes of organic materials in pharmaceutical
technology
Final Exam Committee:
Head: Prof. Emer. Dr. István Erős DSc, SZTE Department of Pharmaceutical Technology
Members: Dr. Judit Dredán PhD, SE Institute of Pharmacy
Dr. Róbert Gáspár PhD, SZTE Department of Pharmacodynamics and Biopharmacy
Reviewers Committee:
Head: Prof. Dr. Ferenc Fülöp DSc, academican SZTE Department of Pharmaceutical Chemistry
Reviewers: Dr. Pál Fekete PhD, Meditop Pharmaceutical Ltd.
Dr. Erzsébet Francsics-Czinege PhD, Richter Gedeon Nyrt.
Members: Prof. Dr. Gyöngyvér Soós PhD, SZTE Department of Clinical Pharmacy
Dr. Gerda Szakonyi PhD, SZTE Department of Pharmaceutical Analysis
Szeged
2015

2
1. Introduction
Investigation of the crystal structures of pharmaceutical materials is a continuously
increasing interest. The variety of the order of molecules in the unit cell of an active
pharmaceutical ingredient (API) can result differences in dissolution rate, wettability, solubility
or bioavailability.
Amorphous or glassy materials are in the solid phase, but unlike crystalline ones they lack
long-range order. Their lattice energy is at a minimum level, they will not have a characteristic
melting point (Tm), but they respond to heating from low temperature by softening at a specific
point, which is called the glass transition temperature (Tg). Below Tg amorphous materials are
generally brittle and rigid, while above it they are rubbery or viscous. The amorphous form will
always be thermodynamically unstable and will tend to recrystallize, as demonstrated many
times.
Amorphous form can appear many ways: the material can be amorphized deliberately or it
can accidentally be converted into an amorphous form by a pharmaceutical technique. Three
basic ways have been developed to amorphize the APIs: solvent methods, hot-melt techniques,
and milling. Attention has nowadays started to turn to cases, when the amorphous form is not a
particular aim, but is a result of one of the techniques used during the formulation. For that
methods are made for prediction of the amorphization or glass-forming properties of any given
material. Most authors calculate with the ratio of Tg and Tm. Kerč & Srčič, (1995) classified poor
glass-formers as those with 0.7Tm
Tg; while for good glass-formers is 7.0
Tm
Tg.
When the aim is the preparation of amorphous solid, suitable excipients can be extremely
helpful. Also excipients used in pharmaceutical technology has a high effect on amorphization of
a material, when it is not a desired goal.
The methods for the investigation of amorphous materials are based on the various
physical and physical-chemical properties: as they can differ in appearance, molecular structure,
intra-molecular interactions and hygroscopicity, they can be investigated with a broad number of
devices (XRPD, Thermal analysis methods, vibrational spectroscopy, nuclear magnetic resonance
etc.)
3
2. Aims
In present study, our primary aim was to investigate the changes in crystallinity of selected
materials, which differ in many aspects, especially in glass-forming properties. To achieve this, we
compiled the following steps:
1) to establish the literature background of investigation methods which are suitable to follow
changes in crystallinity of organic materials with small molecular weights,
2) to find an easy and rapid method, that is able to predict the glass-forming properties of given
materials,
3) to select an excipient pair, which are similar chemically, but differ in crystal structure; which are
relatively inexpensive, widely used in pharmaceutics and have different glass-forming properties.
Mannitol and sorbitol turned out to possess these properties,
4) to characterize the change in crystallinity of MX without any excipient and also with polymers
(PEG, PVP) using different investigation methods,
5) to characterize the amorphization tendency of CLP by co-grinding with an inorganic silicon
dioxide (Aerosil 200).
3. Materials and Methods
3.1. Finding the model materials
To choose the most suitable model materials for our study 30 possible materials, commonly
used in pharmaceutics were investigated. Melting points (Tm), glass transition (Tg) and their ratio
were measured with DSC equipment.
Heating was first applied up to slightly over the melting point. This determined the Tm.
After the whole amount of the sample had melted it was cooled down to below the Tg as fast as
the device allowed (approximately 45 °C/sec), measurement was then repeated. If the crystalline
form of the material emerged, it was considered as poor glass-former. If the amorphous form
appeared, the ratio Tg/Tm was calculated and the glass-forming properties were concluded on this
basis. For further investigations, we chose materials from the groups of poor and good glass-
formers. Two similar sugar-alcohols with dissimilar glass-forming properties were also chosen.
3.2. Mannitol and sorbitol
We first investigated the crystallinity changes of β-D-mannitol and D-sorbitol. Both are
widely used in pharmaceutics as sweeteners, bulking agents or moisture stabilizers (Kim et al.,
1998; Maury et al., 2005). Both are stable and inert compounds, properties which make them a
good choice as excipients during tableting, freeze-drying, capsulizing, granulating or grinding.

4
3.3. Meloxicam
Pure crystalline meloxicam (MX) (4-hydroxy-2-methyl-N-(5-methyl-2-thiazolyl)-2H-
benzothiazine-3-carboxamide-1,1-dioxide) was purchased from EGIS Ltd. Budapest, Hungary.
MX is a non-steroidal anti-inflammatory drug that is mainly applied in therapy as an anti-
inflammatory and strong analgetic agent. MX is practically insoluble in water, while it displays a
relatively high permeability through cell membranes. It was chosen as model compound because
it is capable of hydrogen-bond to other materials.
3.4. Clopidogrel bisulphate
Pure polymorphic form II clopidogrel bisulphate (CLP) (methyl (+)-(S)-alpha-(2-
chlorophenyl)-6,7-dihydrothieno[3,2-c]pyridine-5(4H)-acetate sulphate) was obtained from EGIS
Ltd., Budapest, Hungary.
CLP is an oral antiplatelet drug, which is often used in the treatment of coronary artery
disease, peripheral vascular disease and cerebrovascular disease. The amorphous and
polymorphic forms of CLP has been prepared and described in the literature.
3.5. Additives
Polyvinylpyrrolidone (PVP C30, with a molecular weight of 58,000), obtained from BASF
(Ludwigshafen, Germany) and polyethylene glycol (PEG 6,000) from Sigma-Aldrich Chemie
GmbH, (München, Germany), were used as grinding excipients. Aerosil 200 (colloidal SiO2, with
hydrophilic properties) was purchased from Nippon Aerosil Co., Japan.
4. Methods of sample preparation
Physical mixtures of the crystalline sugar-alcohols (mannitol and sorbitol) and stabilizer
polymer additives (PVP C30 and PEG 6,000) were prepared and charged into a hard polyamide
mortar. Equal amounts of agate balls were also placed into the chamber. The mass ratio of the
mixtures was in all cases 1:1. The grinding processes were carried out with a Fritsch -
Pulverisette® planetary ball mill. Mixtures were ground at 120 min on 400 rpm. Samples were
withdrawn for investigation after 20, 40, 60, 80, 100 and 120 min.
Physical mixtures of MX, as API, and the grinding (stabilizer) polymer (PEG 6 000 or
PVP C30) were prepared and charged into the stainless steel jar of a planetary ball mill
containing 10 stainless steel balls (Retsch PM 100, Retsch GmbH & Co., Haan, Germany). The
mass ratios were based on previous work, so as to give nanoparticles (200-600 nm). For the
PVPs, the drug-excipient mass ratio was 1:1, while for the PEGs it was 1:2. Mixtures were
5
ground for 140 min, samples being withdrawn for investigation after 20, 40, 60, 80, 100, 120 and
140 min. During the grinding process, the temperature of the mortar was measured with an
infrared thermometer immediately before sample withdrawal. The temperature of the mortar was
not higher than 56 °C throughout milling.
The co-grinding of the mixture of CLP and Aerosil 200 was performed in a planetary ball
mill (Retsch PM 100, Retsch GmbH & Co., Germany). The mass ratio of CLP and Aerosil 200
was 7:3. This ratio was based on a previous work by our team (Jójárt-Laczkovich, 2011). The
maximum grinding time was 240 min. Samples were withdrawn for investigation after 15, 30, 45,
60, 90, 120, 150, 180 and 240 min.
5. Methods of investigation
5.1. X-ray powder diffraction (XRPD)
XRPD analysis was performed with Bruker D4 and Bruker D8 Advance diffractometer (Bruker
AXS GmbH, Karlsruhe, Germany) systems with Cu K λI radiation (λ = 1.5406 Å). The samples were
scanned at 40 kV and 40 mA from 3° to 40° 2θ, at a scanning speed of 0.05°s-1 and a step size of 0.010°.
All manipulations of diffractograms and the calculation of area under curves were performed with
DIFFRACTplus EVA software.
In the case of MX samples, we used an internal standard method to avoid the problems caused by
the particle size reduction and randomly oriented particles.
5.2. Differential scanning calorimetry (DSC)
DSC data were recorded with a Netzsch STA-409 (Selb, Germany) and a Mettler-Toledo DSC 821e
instruments with intercoolers. 4.5-5.5 mg samples were crimped in aluminium pans with two holes and
were examined in temperature interval 25-200 °C under an argon gas flow at 100-150 ml min-1, at heating
rates of 10 and 20 °C min-1.
5.3. Thermogravimetry (TG)
TG curves were obtained with a TGA/DSC1 (Mettler-Toledo, Switzerland). 4.5-5.5 mg of the
samples were crimped in aluminium pans with two holes and were examined in the temperature interval
25-200 °C. Heating rate was 20 °C min-1.
5.4. Fourier transform infrared (FT IR) spectroscopy
FT IR spectra were recorded with a Bio-Rad Digilab Division FTS-65A/896 FT IR spectrometer
(Bio-Rad Digilab Division FTS-65A/869, Philadelphia, USA) between 4000 and 400 cm−1, at an optical
resolution of 4 cm−1; operating conditions: Harrick’s Meridian SplitPea single reflection, diamond, ATR
6
accessory. Thermo Scientific GRAMS/AI Suite software (Thermo Fisher Sciencific Inc., Waltham, USA)
was used for the spectral analysis.
For FT IR determinations, the ATR method was chosen, because with this there is no need for
sample preparation, such as particle size reduction or KBr tableting, which would expose the samples to
further physical stress.
5.5. Scanning electron microscopy (SEM)
The morphology of the MX particles was examined by SEM (Hitachi S4700, Hitachi Scientific
Ltd., Tokyo, Japan). A sputter coating apparatus (Bio-Rad SC 502, VG Microtech, Uckfield, UK) was
applied to induce electric conductivity on the surface of the samples. The air pressure was 1.3-13.0 mPa.
Briefly, the samples were sputter-coated with gold–palladium under an argon atmosphere, using a gold
sputter module in a high-vacuum evaporator and the samples were examined at 10 kV and 10 μA. MX
particle diameter distributions were obtained by analyzing several SEM images with the ImageJ software
environment.
6. Results
6.1. Investigation of sugar-alcohols
6.1.1. Determination of crystallinity of mannitol
The DSC measurements indicated that the ratio Tg/Tm (K/K) for pure β-D-mannitol (Tg:
285.75 K Tm: 440.05 K) is lower than 0.7, suggesting that this compound has only a low tendency
to exist in amorphous form.
DSC measurements demonstrated that the raw mannitol did not suffer any loss in
crystallinity during the grinding process. The mannitol samples made with polymer additives
behaved similarly to pure mannitol: the amorphous PVP has no peak in the DSC curve, while the
semi-crystalline PEG had a broad melting peak at around 338 K; the mannitol in the mixtures
displayed identical melting action to that without polymers.
XRPD measurements were performed on each of the raw materials and samples (Figure 1).
Amorphous PVP exhibited a halo with no specific peaks in the diffractogram, while PEG, as a
semi-crystalline polymer gave a few broad peaks in the investigated range. Pure mannitol
displayed peaks characteristic of the β-D form.
After 120 min of grinding, the same peaks were found in the curve. No shifts were
observed, no peaks disappeared and no new peaks appeared. The areas under peaks at 9.5-11° 2θ;
13.7-15.5° 2θ and 17.7-19.9 ° 2θ were calculated for each sample that was withdrawn. This
7
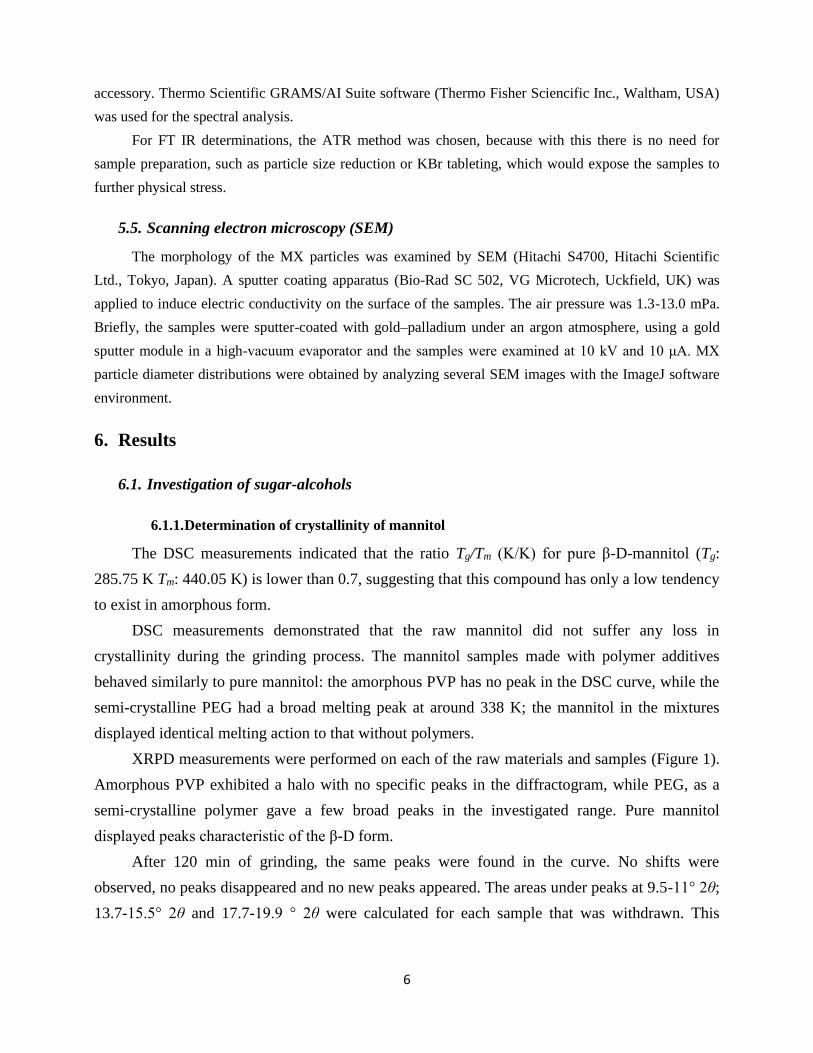
revealed that, although some peaks decreased to an irrelevant extent, no fundamental change in
crystallinity occurred during grinding (Figure 1).
Figure 1 Crystallinity change of mannitol and mannitol ground with polymer additives (PVP and PEG) as a
function of the milling time
Same grinding and investigation method was applied in the presence of the polymer
additives. The samples containing PEG gave the peaks characteristic of mannitol and the broad
peak relating to PEG at around 22-24° 2θ. Crystallinity determination (based on the same peaks
as utilized in the case of raw mannitol) proved that minor amorphization took place after 40 min
of milling. No polymorph transition was observed: no peaks underwent a shift or disappeared and
no new peaks were detected. Slightly different behaviour was observed for the samples
containing PVP. The peaks were specific for mannitol, but the areas under the curves decreased
with increasing grinding duration.
6.1.2. Crystallinity determination of sorbitol
The ratio Tg/Tm (Tg and Tm in K) measured for D-sorbitol was 0.75 (Tg: 273.92 K Tm:
364.55 K), which predicted this material is a good glass-former.
The DSC measurements showed that the sorbitol used was a mixture of the epsilon (Tm:
364.55 K) and gamma (372.05 K) polymorphs. During the grinding process the proportions of the
polymorphs changed. The pure material contained a predominance of the epsilon form. The
milling led to a decrease in the amount of the epsilon form, while the amount of the gamma
polymorph slightly increased (Figure 2). This means that the mechanical energy broke down the
8
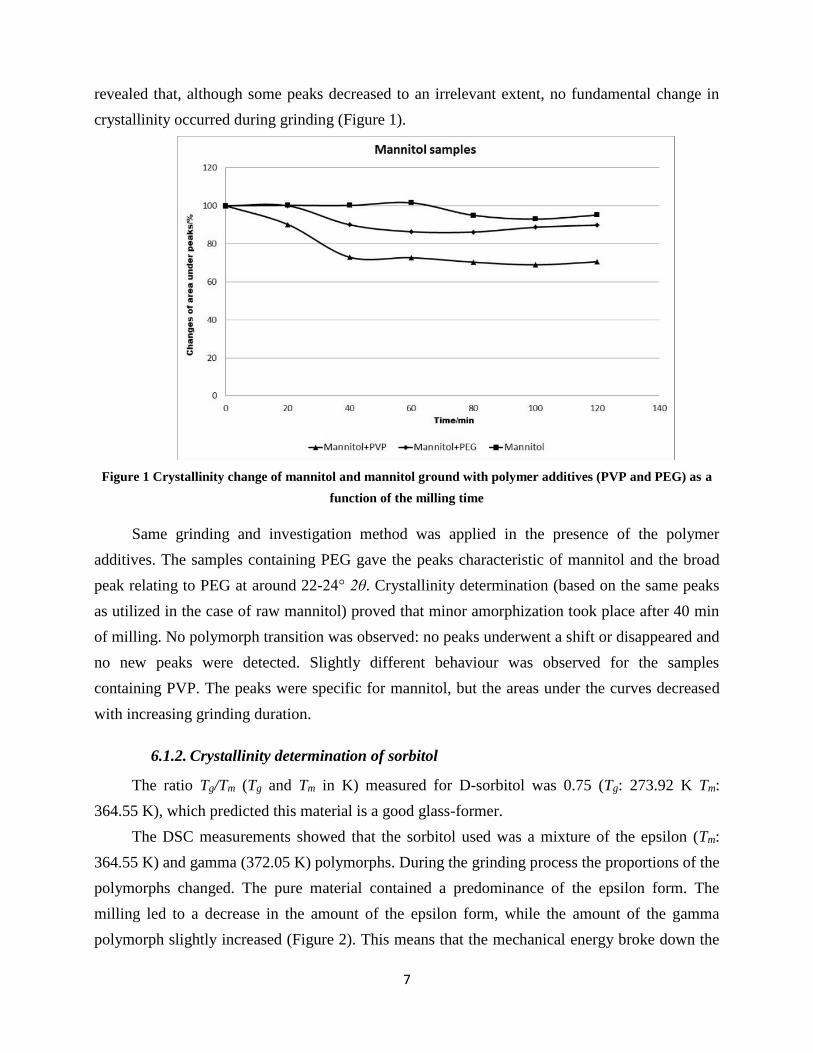
crystal structure of the crystalline epsilon sorbitol. Some of the amorphous material recrystallized
due to the mechanical impact.
Figure 2 DSC curves of pure sorbitol grinding, and sorbitol ground with PVP C30
A similar phenomenon was observed in the DSC curves of sorbitol co-ground with PVP.
The melting point of the sorbitol was lowered by the polymer excipient. Both polymorphs gave
characteristic DSC curve. Similarly as when no additive was present, the epsilon polymorph
amount decreased during the milling. In this case, the content of gamma polymorph also
decreased, as demonstrated by the decrease of the area under the curve. The bulk part of the
system lost its well-defined long-range order of the crystal structure.
The DSC investigation of sorbitol samples containing PEG did not show any significant
change in crystallinity.
To investigate the change in crystallinity of the co-ground sorbitol and to calculate the
extent of amorphization, XRPD method was also carried out on the samples.
The peaks of X-ray diffractograms of pure sorbitol were mostly characteristic of the epsilon
form, though the peaks of the gamma form were also present. During the milling process the
areas under the peaks relating to the epsilon form noticeably decreased with milling time. In
parallel the peaks of the gamma polymorph became slightly larger at a similar rate. A similar
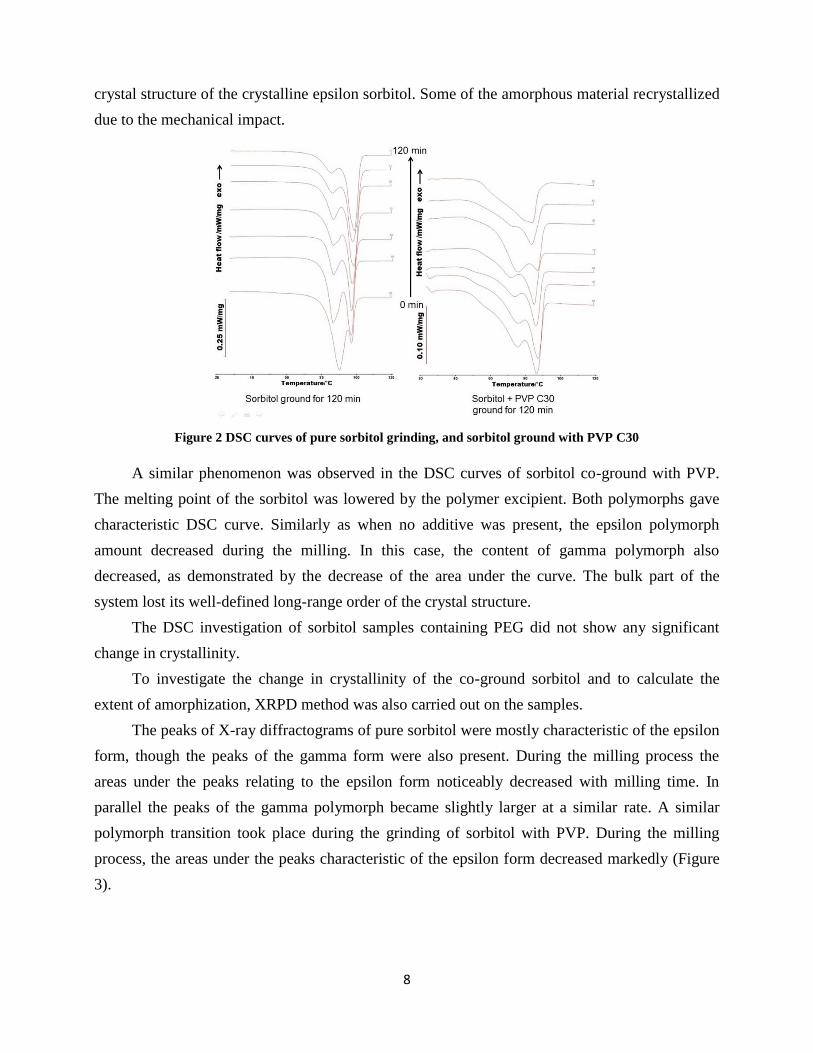
polymorph transition took place during the grinding of sorbitol with PVP. During the milling
process, the areas under the peaks characteristic of the epsilon form decreased markedly (Figure
3).
9
Figure 3 Crystallinity change of sorbitol and sorbitol ground with polymer additives as a function of milling
time.
From the areas under the peaks of the epsilon form at 9.5-11° 2θ, 23.15-24.53° 2θ and 28.2-
29.6° 2θ, the degree of reduction in crystallinity was measured. During the first 40 min, the
system lost about 50% of its well-defined crystal structure. After 40 min there was an apparent
lag phase. At the end of the milling, slightly more than 30% of the sorbitol remained in the
epsilon polymorph form. Most of the remaining 70% had lost its well-defined order of molecular
packing and a minor part had been transformed into the gamma polymorph.
Only the peak at 11.5-12.1° 2θ is clearly related to the gamma form. All the other peaks
were characteristic either of epsilon form or of both polymorphs. This gamma sorbitol peak was
used to evaluate the polymorphic transition. All the changes observed are indicative of a constant
crystallinity decrease as the milling time becomes longer, some of the sorbitol recrystallizing and
changing into the gamma polymorphic form during the process.
The samples containing PEG displayed different behaviour during mechanical activation.
The degree of crystallinity changed by around 100% during the overall procedure.
6.2. Investigation of crystallinity changes of meloxicam
MX was selected as model API because it has only a low tendency to occur in amorphous
phase: Tg/Tm (K/K) is 0.63. The polymers were PVP and PEG.
10
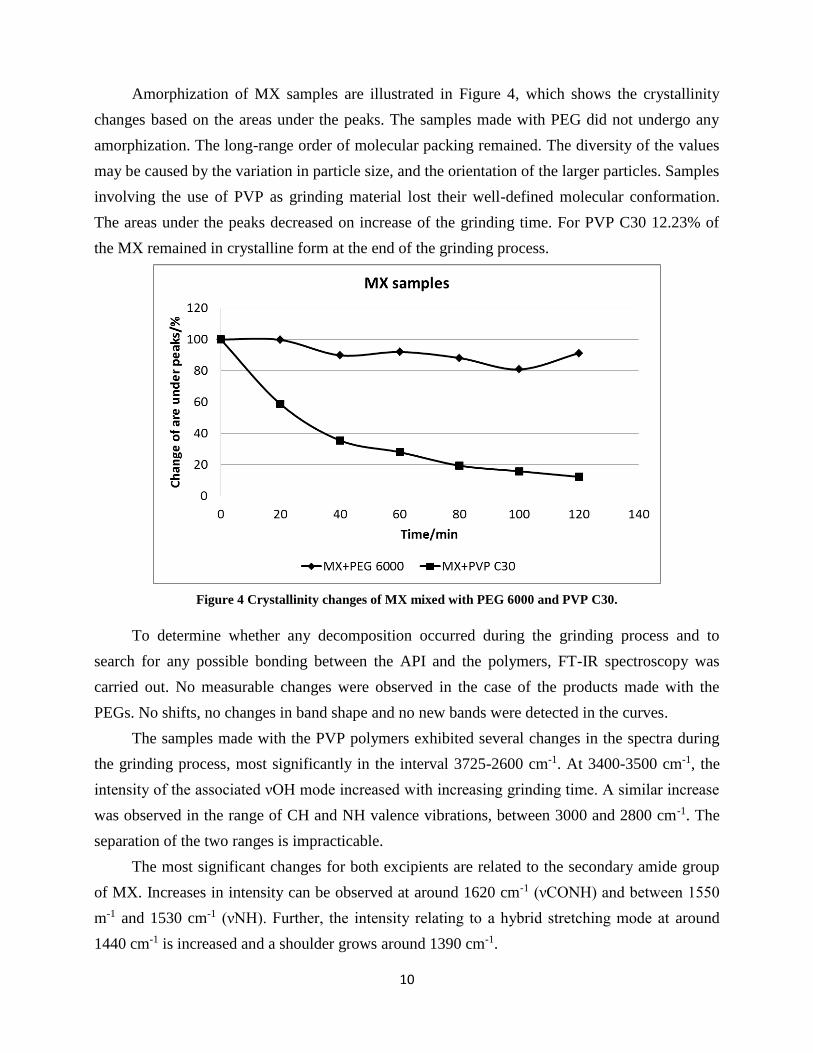
Amorphization of MX samples are illustrated in Figure 4, which shows the crystallinity
changes based on the areas under the peaks. The samples made with PEG did not undergo any
amorphization. The long-range order of molecular packing remained. The diversity of the values
may be caused by the variation in particle size, and the orientation of the larger particles. Samples
involving the use of PVP as grinding material lost their well-defined molecular conformation.
The areas under the peaks decreased on increase of the grinding time. For PVP C30 12.23% of
the MX remained in crystalline form at the end of the grinding process.
Figure 4 Crystallinity changes of MX mixed with PEG 6000 and PVP C30.
To determine whether any decomposition occurred during the grinding process and to
search for any possible bonding between the API and the polymers, FT-IR spectroscopy was
carried out. No measurable changes were observed in the case of the products made with the
PEGs. No shifts, no changes in band shape and no new bands were detected in the curves.
The samples made with the PVP polymers exhibited several changes in the spectra during
the grinding process, most significantly in the interval 3725-2600 cm-1. At 3400-3500 cm-1, the
intensity of the associated νOH mode increased with increasing grinding time. A similar increase
was observed in the range of CH and NH valence vibrations, between 3000 and 2800 cm-1. The
separation of the two ranges is impracticable.
The most significant changes for both excipients are related to the secondary amide group
of MX. Increases in intensity can be observed at around 1620 cm-1 (νCONH) and between 1550
m-1 and 1530 cm-1 (νNH). Further, the intensity relating to a hybrid stretching mode at around
1440 cm-1 is increased and a shoulder grows around 1390 cm-1.
11
All these alterations point to the presence of weak bonding between the carboxyl group of
MX and the polymers, which is able to help the molecules to separate from each other and keep
them in this (not well-defined) conformation.
Based on SEM photos the PEG is locally melted by the impact and friction of the balls in
the mortar. Reduced-sized MX particles can be observed in the melt of the polymer. These
particles are in the nano range.
PVPs are amorphous polymers, and did not melt during the milling process. The
temperature was locally higher than the Tg of the excipients, so the polymers softened and coated
the amorphized MX. These MX particles more or less preserved their contour while they were
decreased to the nano level.
6.3. Investigation of crystallinity change of clopidogrel bisulphate
CLP was chosen as a model API, as it has a relatively high melting point, and did not melt
in the milling chamber and it has a really high tendency to exist in amorphous form. Its Tg/Tm
(K/K) ratio is 0.80. Aerosil 200 was used as carrier because of its amorphous properties.
As thermal analysis techniques are widely used in the characterization of the amorphous
form, the intact CLP, Aerosil 200 and the prepared samples were investigated by DSC. The curve
of the raw CLP gave a characteristic sharp peak at 181.20 °C, corresponding to the melting point
of the material. No other changes were observed on the curve. The Aerosil 200 did not exhibit
any thermal signal.
The curves of the samples indicated the endothermic peak of the melting point of CLP in
each case, except that at 240 min. The area of the peak decreased with increasing grinding time
until it practically disappeared after 240 min of grinding. The peak of the physical mixture was
similar to the peak of the raw CLP, but with a smaller area. This indicates the decreasing
crystallinity of the CLP, which was finally converted into the amorphous phase. The peaks are
shifted slightly to lower temperatures during the grinding while a peak was observed at 80 °C
after 120 min of grinding.
The X-ray pattern of the raw CLP exhibits characteristic high-intensity diffraction peaks,
which demonstrates the crystalline nature of the unprocessed API.
The typical peaks of the CLP emerged clearly in the diffractograms of the ground products.
The intensities of these peaks were lower than those of the peaks for the raw API, corresponding
to the concentrations of the materials in the samples. The amorphous Aerosil 200 did not exhibit
any further reflection. The intensities of these peaks decreased with increasing grinding time and
12
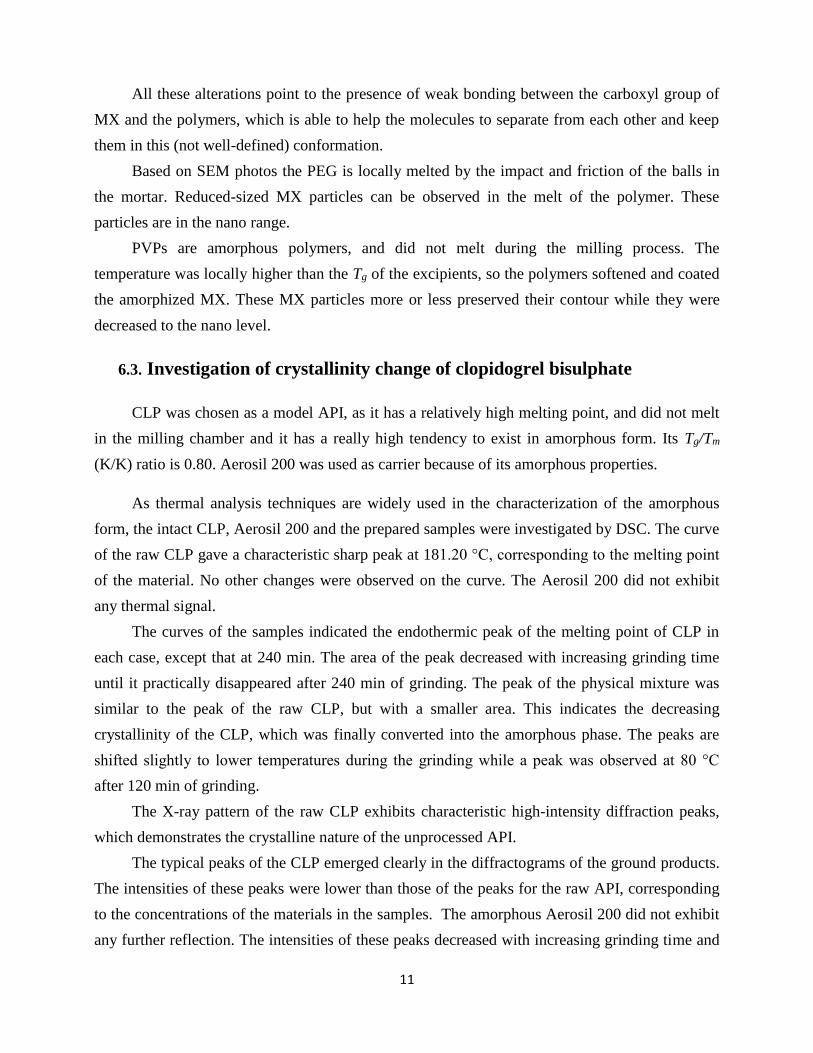
practically disappeared after co-grinding for 240 min. The diffractogram of the last sample
displayed the amorphous halo. During the co-grinding process, no other polymorphic form of the
CLP appeared, no shifting of the peaks occurred, and no any new peaks were observed in the
pattern. Quantification of the crystallinity was also made (Figure 5).
Figure 5 Crystallinity changes during grinding. First function shows the area under the curves decreasing
with increasing grinding time; the second function is the linearization of the first.
The curves of the samples ground for more than 120 min demonstrated an endothermic
peak at 80 °C. The area under this peak increased and sharpened with increasing grinding time.
To identify the source of the peaks, the last sample (ground for 240 min) was investigated by TG
and hot-humidity stage XRPD.
The TG curve revealed that the product was thermodynamically stable and a mass decrease
of only 3.33% was detected up to the melting point of the CLP. At 80 °C, the determination did
not show a salient mass decrease, which means that the peak observed in the DSC pattern did not
involve dissolution or solvent evaporation. Neither was any major decrease observed at 100 °C,
which means that the sample was sufficiently dry.
The last sample (ground for 240 min) was determined by XRPD, using the hot-humidity
chamber. The diffractograms showed an amorphous halo in all three cases, so this peak did not
relate to any change in crystallinity.
FT IR spectroscopy is a suitable method for the investigation of interactions between
pharmaceutical materials and polymers.
FT IR determination showed that the grinding process caused several small changes in the
spectra of the samples. One of the most spectacular changes was seen at 1752 cm-1, the region of
the νC=O valence vibration of CLP. These peaks of the samples ground for more than 120 min
expanded, shifted to lower wavenumbers, and slightly increased in intensity with increase of the
grinding time.
13
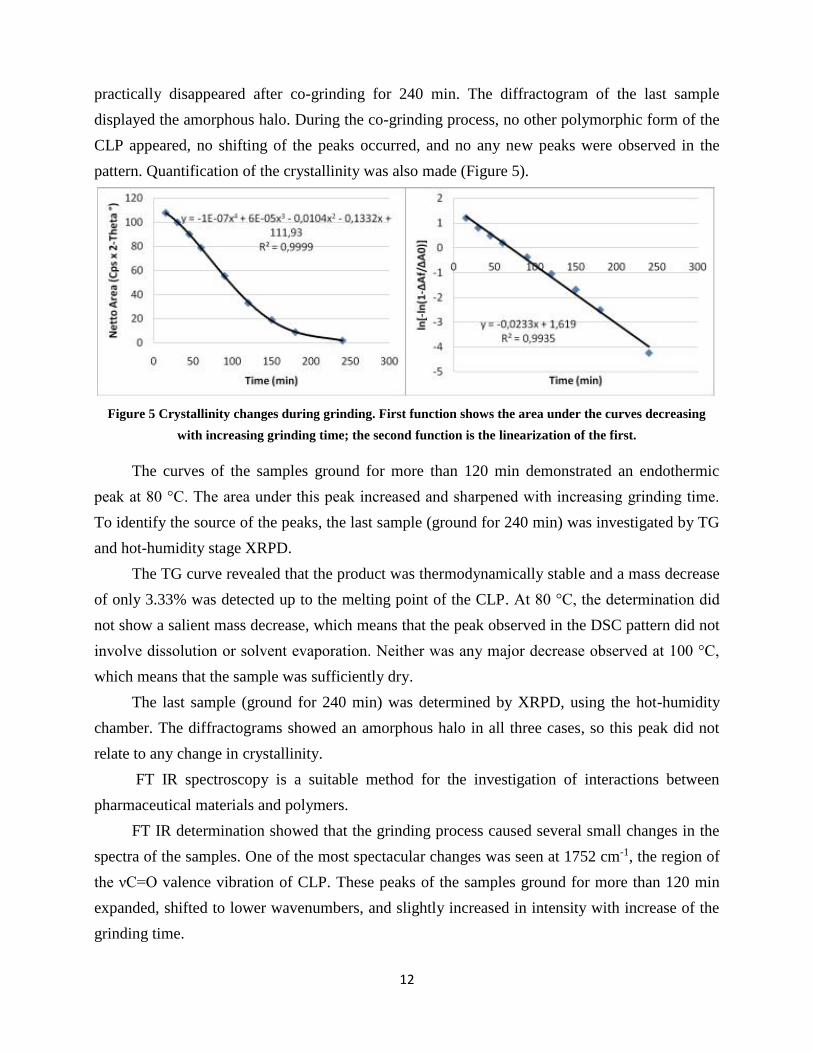
Another change was observed at 865 cm-1 where a band with high intensity started to
decrease after 120 min of grinding, while a double peak at 858 cm-1 and 838 cm-1 fused into one
peak with a higher intensity (Figure 6). These changes proportionally followed the changes at
1752 cm-1. The same phenomenon was observed between 1200 cm-1 and 1135 cm-1: the peak at
1188 cm-1 decrease, while the peak at 1150 cm-1 slightly increased parallel after 120 min of co-
grinding.
Figure 6 Bands of Aerosil 200, CLP and 9 samples ground for from 15 min to 240 min. The area under the
peak at 865 cm-1 decreased after 120 min of grinding, while the double peak at 858 cm-1 and 838 cm-1 fuse into
one peak with a higher intensity.
The described changes can refer to the following processes: the CLP first temporarily melts
forming a molecularly disperse system. After 120 min of grinding, a weak secondary bond
appears between CLP and the silanol groups of the CLP. This bond is strong enough to keep the
CLP in amorphous phase. The work of our team (Jójárt-Laczkovich, 2011), demonstrated that
this secondary bond is a hydrogen-bond.
7. Summary, novelty and practical relevance
1) Our first aim, to establish the literature background of investigation methods which are
suitable to follow changes in crystallinity of organic materials with small molecule weights was
accomplished: all of the widely used investigation methods were learnt and practiced. Those that
were most suitable for our aims were chosen and used.
2) An easy and rapid method, which is able to predict the glass-forming properties of given
materials were applied: DSC method was carried out, with only a small amount of material and
two heatings were needed to determine the glass-forming properties of each material. It was
therefore quite simple to choose between the possible substances: two sugar-alcohols, which are
14
widely used in pharmaceutics, were selected: although they are chemically equivalent, they have
different tendencies to exist in amorphous form. Interesting APIs were investigated: MX,
although considered poor glass-former readily occurs in amorphous form, and CLP with its
relatively high Tg/Tm ratio needed a long-term grinding with Aerosil to amorphize completely.
The method used, which was suitable to decrease the degree of crystallinity of the chosen
materials was relatively cheap. Its most important advantage was it repeatability and feasibility.
3) First, two chemically equivalent sugar-alcohols (mannitol and sorbitol) as model materials
were subjected to milling both alone and in the presence of polymer excipients (PVP C30 and
PEG 6000) to accentuate the differences in behavior of analogous materials. As a poor glass-
former, mannitol did not exhibit any decrease in crystallinity when it was milled alone or together
with PEG. In the presence of PVP, the crystal structure of mannitol was slightly lost. When
ground alone or together with PVP, sorbitol suffered amorphization and it underwent polymorph
transformation when co-ground: the initial, mostly epsilon form was transformed continuously
into the gamma form, while parallel lost more than 70% of its crystallinity. PEG preserved the
well-ordered molecular packing of sorbitol and stabilized the crystal structure so that the sorbitol
could not amorphize. It can be concluded that these sugar alcohols, which have the same
chemical structure, demonstrated different rates of crystallinity loss.
4) A similar effect of polymers was proved by the grinding of MX: the work demonstrated
that the polymers used to reduce the grinding energy during co-grinding to nanoparticles can
decrease the crystallinity of MX. These polymers have different abilities to convert the drug into
amorphous form. XRPD measurements confirmed that the PEG did not have a significant effect
on the crystallinity of MX, while the PVP decreased it drastically. Weak secondary bonding
between MX and the PVPs was found by FT IR. The SEM images confirmed the major particle
size decrease and the differences in crystal behaviour of the samples made with the different
polymers.
5) Raw, crystalline CLP was amorphized by co-grinding. It was found that the crystallinity
decreased sigmoidally with increasing co-grinding time. XRPD and DSC examinations
confirmed that the product had become totally amorphous after a relatively long time, 240 min of
grinding. No polymorphic conversion was observed in the samples. TG proved that no major
mass reduction occurred during the procedure. FT-IR changes indicated the formation of a
secondary bond between CLP and Aerosil 200, which is able to keep the drug in the amorphous
phase.
15
Finally it can be concluded, that so similar molecules as two chemically equivalent sugar-
alcohols can behave completely different on effect of grinding. The study also revealed the
possibility of polymorph transition, which can lead to issues in physical appearance, dissolution
or stability.
It was proven, that organic APIs, which amorphization inclination were predicted as
different, can react similarly to a high energy intake: two material with dissimilar tendency to
present in amorphous form exhibited comparable reaction to the co-grinding process.
Important properties of excipients used as co-grinder additives were revealed too. Some of
the materials can support amorphization by decreasing the energy devoted to grinding or
stabilizing the molded amorphous dispersion. Meanwhile some of them can prevent the API from
crystallinity loss by coating the particles and protect their structure from breaking down.
16
Publications related to the thesis
1. Mártha Csaba, Jójártné Laczkovich Orsolya, Szabóné Révész Piroska: Amorf forma a
gyógyszertechnológiai kutatásokban. Acta Pharmaceutica Hungarica (2011) 81. 37-42.
2. Csaba Mártha, Levente Kürti, Gabriella Farkas, Orsolya Jójárt-Laczkovich, Balázs
Szalontai, Erik Glässer, Mária A. Deli, Piroska Szabó-Révész: Effects of polymers on the
crystallinity of nanonized meloxicam during a co-grinding process. European Polymer
Journal (2013) 49. 2426–2432 (IF: 3.242; citations: 6)
3. Csaba Mártha, Orsolya Jójárt-Laczkovich, Joachim Ulrich, Piroska Szabó-Révész:
Investigation of the crystallinity of sugar alcohols co-ground with polymeric excipients.
Journal of Thermal Analysis and Calorimetry (2013) 115. 2479–2486. (IF: 2.206)
4. Csaba Mártha, Orsolya Jójárt-Laczkovich, Piroska Szabó-Révész: Effect of co-grinding
on crystallinity of clopidogrel bisulphate. Chemical Engineering & Technology (2014)
37/8. 1393–1398 (IF: 2.175)
Presentations related to the thesis
1. Mártha Csaba, Jójártné Laczkovich Orsolya, Ambrus Rita, Szabóné Révész Piroska:
Hatóanyagok amorfizálhatóságának vizsgálata. Congressus Pharmaceuticus Hungaricus
XIV. P-64. 2009. 11. 13-15. Budapest, Magyarország (poszter)
2. Jójárné Laczkovich Orsolya, Mártha Csaba, Szabó-Révész Piroska: Kristályos vagy
amorf? Az amorfizálhatóság vizsgálata. XVI. Országos Gyógyszertechnológiai
Konferencia és VIII. Gyógyszer az Ezredfordulón Konferencia, 2010. 10. 20-22. Siófok,
Magyarország (előadás)
3. Csaba Mártha, Orsolya Jójárt-Laczkovich, Piroska Szabó-Révész: Amorphous form in
pharmaceutical technological research. Pharmaceutical Sciences for the future of
medicines and Young Scientists Meeting P-50. 2011. 07. 13-17. (poszter)
4. Csaba Mártha, Orsolya Jójárt-Laczkovich and Piroska Szabó-Révész: Amorphization of
co-ground clopidogrel hydrogensulphate. 8th World Meeting on Pharmaceutics,
Biopharmaceutics and Pharmaceutical Technology 2012. 03. 19-22. Turkey, Istanbul.
(poszter)
5. Mártha Csaba, Jójárt-Laczkovich Orsolya és Szabó-Révész Piroska: Polimerek
befolyása egy hatóanyag kristályosságára ko-őrlés során. XVII. Országos
Gyógyszertechnológiai Konferencia és IX. Gyógyszer az ezredfordulón konferencia 2012.
09. 27-29. Siófok, Magyarország (előadás)
17
6. Csaba Mártha, Kitti Korcsok, Orsolya Jójárt-Laczkovich and Piroska Szabó-Révész:
Investigation of crystallinity of meloxicam co-ground with PVA. From Medicine to
Bionics – 1st European PhD Conference 2013. 06. 13-15 Budapest, Hungary (poszter)
7. Jójártné Laczkovich Orsolya, Mártha Csaba, Szabóné Révész Piroska: Őrlés hatása a
hatóanyag kristályosságára gyógyszertechnológiai szempontból. Gyógyszerkémiai és
Gyógyszertechnológiai Szimpózium ’13 2013. 09. 30 – 10. 01. — Herceghalom,
Magyarország (előadás)
8. Mártha Csaba, Jójártné Laczkovich Orsolya: Együttőrlés hatása kémiailag hasonló
anyagok kristályosságára XI. Clauder Ottó Emlékverseny 2013. 10. 17-18. Budapest,
Magyarország (előadás)
9. Jójártné Laczkovich Orsolya, Mártha Csaba, Katona Gábor, Szabóné Révész Piroska:
Gyógyszertechnológiai formulálások során alkalmazott cukror, cukoralkoholok
amorfizálódási tulajdonságai MKE Kristályosítási és Gyógyszerformulálási Szakosztály 7.
Kerekasztal Konferencia 2014. 05. 16-17 Szeged Magyarország (előadás)
Other publications and presentations
1. Csaba Mártha, Sai H. S. Boddu, Mariann D. Churchwell: Physical compatibility of
sodium citrate with alcohol and cefepime American Journal of Health-System Pharmacy
2013. 06. 01. 70. 932-937
2. Mártha Csaba, Doró Péter, Mártha Gabriella, Nagy Andrea, Németh Ákos, Soós
Gyöngyvér: Patikaválasztás szempontjai. Congressus Pharmaceuticus Hungaricus XIV.
P-133. 2009. 11. 13-15. Budapest, Magyarország (poszter)