Embed Size (px)
Citation preview
394 J. Opt. Soc. Am. A/Vol. 7, No. 3/March 1990
Phase retrieval in crystallography and optics
R. P. Millane
The Whistler Center for Carbohydrate Research, Smith Hall, Purdue University, West Lafayette, Indiana 47907
Received September 26, 1989; accepted November 20, 1989Phase problems occur in many scientific disciplines, particularly those involving remote sensing using a wave field.Although there has been much interest in phase retrieval in optics and in imaging in general over the past decade,phase retrieval has a much longer history in x-ray crystallography, and a variety of powerful and practicaltechniques have been developed. The nature of crystallography means that crystallographic phase problems aredistinct from those in other imaging contexts, but there are a number of commonalities. Here the principles ofphase retrieval in crystallography are outlined and are compared and contrasted with phase retrieval in generalimaging. Uniqueness results are discussed, but the emphasis is on phase-retrieval algorithms and areas in whichresults in one discipline have, and may, contribute to the other.
1. INTRODUCTION
In several scientific fields, particularly those involving imag-ing with a wave field (e.g., microscopy, radio engineering,astronomy, crystallography), it is necessary or convenient tomeasure the Fourier transform of a quantity of interest rath-er than the quantity itself. Further, it often occurs (if thewavelength of the radiation used is small or if the radiationpasses through a distorting medium, for example) that it isdifficult or impossible to measure the phase of the Fouriertransform accurately. Since the phase must be known if oneis to reconstruct the image straightforwardly by inverse Fou-rier transformation, this constitutes a phase problem.
Practical solutions to the phase problem were first studiedin the context of x-ray crystallography in the 1940's and havesince developed into powerful techniques. These particularmethods apply only to small molecules. A different class oftechniques, applicable to large molecules, was first devel-oped in the mid 1950's. Practical solutions to the phaseproblem in contexts other than crystallography (I will callthis general imaging) began at later dates. Although therewas some discussion in the 1960's of the significance of theloss of phase, it was not until the late 1970's and early 1980'sthat practical methods were developed in general imagingcontexts.
Phase-retrieval theory and algorithms in crystallographyand in general imaging have developed fairly independently.This is probably due to fundamental differences betweenthese two problems that have necessitated different ap-proaches. However, there are a number of commonalities,and the object of this paper is to outline the principles ofcrystallographic phase retrieval to the optics community(noting the similarities and differences with optics), with aview to prompting a flow of ideas between the two disci-plines.
In order to set the scene, the salient aspects of phaseretrieval in general imaging are reviewed in Section 2. InSection 3 I outline the basic theory of x-ray crystallographyin which the phase problem arises. The three differentclasses of crystallographic phase problem are defined in Sec-tion 4. In Sections 5-7 solutions to the phase problem ineach of these classes are outlined. Crystallographic and
optical phase retrieval are compared in Section 8, and con-cluding remarks are made in the final section.
2. PHASE PROBLEM IN GENERAL IMAGING
General-Purpose Results and AlgorithmsConsider an image denoted by f(x), where x is the positionvector in image space. Image space is usually two dimen-sional, although there are cases in which it may be onedimensional (e.g., signal recovery) or more than two dimen-sional (e.g., electron microscopy of thick specimens). TheFourier transform of the image, or the visibility, F(u), isgiven by'
F(u) = J f(x)exp(i2iru - x)dx, (1)
where u is the position vector in Fourier space and theintegral is, implicitly, over all the N-dimensional imagespace. The image is given by the inverse Fourier transformof the visibility, so that
f(x) = | F(u)exp(-i27rx u)du, (2)
and recovery of the image is straightforward (in principle) ifF(u) is measured. A phase problem arises when only theamplitude IF(u)I can be measured. Since the image is givenuniquely by Eq. (2), recovery of the image is equivalent torecovering the phase 0(u), where
F(u) = IF(u)1exp[io(u)]. (3)
As a result of the autocorrelation theorem,' the autocorrela-tion A(x) of the image, where
A(x) = J- f(y)f*(x + y)dy, (4)
can be reconstructed from the magnitude, since IF(u)12 is theFourier transform of A(x).
There are some properties of the image that are irretriev-ably lost when the phase is lost. This is most easily seen bynoting that (x), f(x + 4)exp(i,01), and f*(-x + 2)exp(ik02)
0740-3232/90/030394-18$02.00 © 1990 Optical Society of America
R. P. Millane
Vol. 7, No. 3/March 1990/J. Opt. Soc. Am. A 395
all have the same visibility amplitude IF(u)I, where {l, 6, 01,and '02 are real constants and * denotes complex conjuga-tion.' Hence the absolute position, inversion in the origin,and a constant phase factor of the image are irretrievablylost, although this is usually of little practical significance.
If the image is an arbitrary complex function, the phaseproblem has a multitude of solutions since one can associateany phase function 0(u) with the measured IF(u)I to gener-ate different images. O'Neill and Walther2 and Walther3appear to have been the first to recognize that the problemposed in this way does not correspond to any real physicalsituation. In any practical case, there are constraints on theform of the image. For example, in an optical system theimage has finite support (i.e., the image is nonzero onlywithin a finite region of image space), is square integrable,and usually is nonnegative. In general, applying any phasefunction to the amplitude will produce an image that vio-lates these conditions. The important uniqueness questionis, therefore: Is there more than one phase function thatgives an image that satisfies the given conditions? Walther3showed that in the one-dimensional case there are multiple,but countable, phase functions that lead to images with thecorrect support. He pointed out that nonnegativity couldbe expected to restrict the number of solutions further, al-though to what degree was not clear. He also noted thatextension of these results to two dimensions "will probablybe fraught with difficulties."
Nonuniqueness in one dimension can be demonstrated asfollows. When the one-dimensional Fourier space coordi-nate u = u is generalized to the complex variable w = u + iv,the visibility is given by
F(w) = J f(x)exp(i27rwx)dx, (5)
where x is the single coordinate in image space. Since theimage has compact support and is square integrable, F(w) isan entire function (analytic in the finite complex plane).Hence F(w) can be written as the Hadamard product
F(w) = exp(A + Bw) 17 (1 - /wd), (6)n=1
so that F(w) is completely characterized by its complex zeroswn (and the constants A and B). Defining I(w) =F(w)F*(w*), which is the analytic continuation of IF(u)12since I(u) = IF(u)12, gives
I(w) = exp[2 Re(A) + 2 Re(B)z] 11 (1 - w/wd)(I - W/wn*),n=l
(7)
where Re denotes the real part, so that the zeros of I(w) arewn and wn*. From I(w), obtained by analytic continuationof IF(u)12, one cannot determine which of wn or wn*, for eachpair of zeros, corresponds to a zero of F(w). For a continu-ous image, the zeros tend toward the real axis as lul -> , sothat only a finite number (related to the noise level) havesignificant imaginary parts. The complex-conjugate ambi-guity therefore applies effectively to a finite number, M, say,of the zeros. Hence there are 2M-1 solutions to the phaseproblem, as interchanging all the zeros gives f*(-x) ratherthan f(x). Each of the resulting images has the same sup-port.3
The quite different situation in two dimensions appears tohave been noted first by Bruck and Sodin.4 In two (or more)dimensions the Hadamard factorization [Eq. (6)] is general-ly not possible, and the nonuniqueness argument evapo-rates. It appears therefore that the ambiguity, if any, issubstantially reduced over that for the one-dimensionalcase. Support for this result was obtained by Fienup,5 usingiterative two-dimensional phase-retrieval algorithms. Hedescribed as "dramatic" his observation that test imagesreconstructed uniquely, independently of the image used tostart the iterative procedure.
Uniqueness of the phase problem in two dimensions forpositive real images was intimated by Bates6 in 1982 and,more convincingly, in 1984,7 using arguments from samplingtheory. Uniqueness for general complex two-dimensionalimages was shown by Barakat and Newsam8 in 1984 in thesense that "multiplicity [of solutions] is pathologically rare,"using the theory of functions of two complex variables.Uniqueness was demonstrated, in a more practical sense, byLane et al.9 and by Izraelevitz and Lim,'0 using the conceptof zero sheets, and their arguments were incorporated intoreconstruction algorithms. (These concepts have also beenstudied by other researchers in the context of multidimen-sional signal processing."",12) In two dimensions, the visibil-ity F(u) = F(ul, u2) can be analytically continued into aspace with two complex dimensions, denoted by F(w) =F(w,, w2) = F(ul, v1, u2, v2), where the notation is obvious.F(w) therefore exists and is analytic within this four-dimen-sional space. Considering w1, say, fixed, F(wl, w2) has pointzeros in the w2 complex plane. As w, is varied, these zerosmigrate along smooth two-dimensional surfaces (zerosheets) in the four-dimensional space, since F(w) is analyt-ic.8-10 The Hadamard product in two dimensions almostalways has a single factor, so that these sheets actually forma single sheet. This means that the point zeros cannot betreated (and flipped) independently as in the one-dimen-sional case. Only in special cases (that occur with probabili-ty zero in practice) do the zeros form more than one sheet.Since IF(w) 2 has two factors, it contains two zero sheets, onecorresponding to F(w) and one to F*(w*). Although two-dimensional surfaces in a four-dimensional space almostnever intersect, these two surfaces, being interdependent,intersect wherever w = w*, i.e., wherever one of them crossesthe real axis. Since the visibility is an entire function, conti-nuity of the first derivative can be applied to distinguishbetween the two zero sheets at these points. Algorithmshave been devised and implemented 9"10 to separate the zerosheets and reconstruct the image. However, these algo-rithms have been applied only to simulated data with smallimages, since they are sensitive to noise and computationallyintensive. It is worth noting that the concept of zero sheetshas led to profound results concerning blind deconvolu-tion.3
Although the results described above are useful in demon-strating uniqueness, almost all practical phase-recovery al-gorithms effective for general images in which there is nophase information and the data are contaminated with noiseare based on Fienup's modifications' 4 of the Gerchberg-Saxton algorithm.' 5 These algorithms start with a randomimage fo(x) and update it in an iterative fashion. At the nthiteration, a modified image fn'(x) is calculated by cyclingthrough Fourier space, using the procedure
R. P. Millane
396 J. Opt. Soc. Am. A/Vol. 7, No. 3/March 1990
fn'(x) = S '[F(u)exp(i argJS[fV(x)]})], (8)
where 71-1 denotes the Fourier-transform operation andargf-j denotes the phase. The updated image f,+,(x) can beformed in different ways to formulate different algorithms,the most straightforward being error reduction,' 4 for which
f nl(x) = f n'(X) if x Q
= 0 otherwise, (9)
where Q denotes the set of points x where f'(x) satisfies theimage constraints. The error-reduction algorithm oftenconverges slowly, and the hybrid input-output algorithm,' 4
defined by
fn+,(x) = f"'(x)
=f(x) -yf'(x)
if xe Q
otherwise, (10)
where -y is a constant (typically between 0.5 and 1.0), calledthe feedback parameter, is usually more effective. Variouspractical considerations have to be considered when one isusing these algorithms, and the reader is referred to therelevant references." 14"16-18 Phase-retrieval algorithms ofthis type can also be implemented by using generalized pro-jections, and the reader is referred to Ref. 19 for details onthis topic.
Positivity is usually an important constraint in the appli-cation of iterative methods. If the image is complex, thenreconstruction is more difficult, and a much tighter supportconstraint is needed. 20 2
1 This is discussed further in Sec-tion 8.
Another image-restoration technique that has been ap-plied to phase retrieval is the maximum-entropy meth-od.22-24 This is a general method for producing an imagefrom limited and noisy data. Basically, it is a model fittingprocedure that seeks to recover an image that is consistentwith given constraints (extent, positivity, measured Fourieramplitude, etc.) while maximizing an entropy functionalsuch as-s f(x) ln[f(x)]dx. The rationale for this method isthat such an image contains minimal information consistentwith the data. This method has been applied to phaseretrieval and (particularly) to spectral extrapolation (super-resolution). Although there appear to have been some suc-cessful applications, when and how the method should beapplied in specific situations is still poorly understood. Themaximum-entropy method is not discussed further here,and the reader is referred to Refs. 22-24 for more informa-tion.
Speckle ImagingThe phase-retrieval techniques described above are generalpurpose in the sense that they can be applied in any situa-tion when the Fourier modulus is measured. One area inwhich phase retrieval has been intensively studied and uti-lized is optical (and radio) astronomical imaging, in whichthe phase is perturbed by propagation of the radiationthrough the turbulent atmosphere. The particular charac-teristics of this situation have resulted in a number of specialtechniques for estimating the phase, most of which fall intothe class of speckle imaging. In view of the importance ofthese techniques, and because of some relationships to crys-tallographic techniques, their salient points are outlinedhere (see Refs. 25 and 26 for reviews).
If an object is viewed through the atmosphere (or anydistorting medium) and the distortion introduced by themedium is severe, the resolution is limited by the mediumrather than by the imaging instrument (telescope). Howev-er, Labeyrie2 7 showed that diffraction-limited (by the tele-scope) resolution (but not images) can be achieved by appro-priate processing of short-exposure (-10 msec, i.e., less thanthe fluctuation time of the atmosphere) speckle images.The advantage of the presence of the fluctuating atmo-sphere is that one can obtain a set of these speckle images,denoted by sm(x), each of which is distorted by independentmanifestations of the atmosphere but all obeying the samestatistics. Labeyrie recognized that an ensemble average(denoted by ( )) of the intensities of visibilities Sm(U)12 of aset of speckle images is related to the (diffraction-limited)visibility intensity IF(u)12 by
(ISm(U)12) = IF(u)J2( H(U)I2)' (11)
where (Hm(u)J2) is called the speckle transfer function.The speckle transfer function can be estimated by perform-ing the same processing when viewing an unresolvable(point) object, and IF(u)12 can be obtained from Eq. (11) byinverse filtering. This is called speckle interferometry andeliminates the decrease in resolution that is due to the turbu-lent atmosphere. The phase of F(u) can then be retrievedby using Fienup's algorithms. However, the speckle imagesthemselves contain some phase information, and speckleimaging is concerned with using these images to reconstructthe object (or phase) directly.
If the object contains two components, one of which isunresolvable, then, under some circumstances, the methodof speckle holography2 8 can be used to reconstruct the im-age. The image can be written as
f(x) = (x) + g(x), (12)
where 6(x) is the Dirac delta function, so that the autocorre-lation, determined from the visibility intensity, is given by
A(x) = 6(x) + g(x) + g*(-x) + g(x) E3 g(x), (13)
where O denotes correlation. If the separation between thereference (x) and the remaining image g(x) is greater thanthe width (extent) of g(x), then the terms in Eq. (13) aredistinct, allowing g(x), or g*(-x), to be identified. If thereference object is sufficiently brighter than the unknownobject, then the autocorrelation term in Eq. (13) is muchsmaller than g(x), and the separation condition can be re-laxed to the reference not lying within the unknown object.A similar approach is described by Liu and Lohmann2 9 inwhich the object is made up of a number of distinct featuresthat are separated from one another by at least twice thediameter of the seeing disk (the Airy disk for the atmo-sphere).
Another method for reconstructing the phases is de-scribed by Knox and Thompson,30 in which the cross corre-lation of each speckle image is computed so that
(Sm*(U)Sm(U + a)) = F*(u)F(u + a)(Hm*(u)Hm(u + a)).
(14)
An estimate of (Hm*(u)Hm( + )) is obtained by perform-ing the same processing on a point object, and F*(u)F(u + a)is recovered by inverse filtering. For u = 0, this gives
R. P. Millane
Vol. 7, No. 3/March 1990/J. Opt. Soc. Am. A 397
F*(O)F(a), which gives the phase of F(a) since the phase ofF(O) is zero. Furthermore, for u = a we have F*(a)F(2a),which gives the phase of F(2a). Hence arg[F(na)] can bedetermined recursively for all integer n. By choosing differ-ent values of a it is possible to build up the phases of F(u) ona grid in Fourier space. Using these phases with the ampli-tudes from speckle interferometry allows the image to bereconstructed. Bootstrapping the phases in this way is errorsensitive but can be stabilized by using least-squares tech-niques.31 Optimum values for a are chosen based on experi-ence. Error sensitivity probably limits the application ofthis technique. The Knox-Thompson technique is some-what akin to the method of closure phase used in radioastronomy.32
Lynds, Worden, and Harvey33 (LWH) realized that itmight be possible to form a useful image by superimposingthe brighter speckles within a speckle image. Their tech-nique can be described as follows: The amplitudes amj andpositions xmj of the peaks in the mth speckle image that areabove a threshold value are used to generate a speckle maskMm(x), given by
AMWx) = E amjb(x - xmi). (15)
The image is formed by correlating the mth speckle maskwith the mth speckle image (this has the effect of superim-posing the bright speckles) and averaging over the speckleimages, giving
fLWH(X) = (Sm(X) $m(X)). (16)
This technique is difficult to apply to weak images andworks best for images containing a strong unresolved compo-nent.2 4 The shift-and-add (saa) method' 4 is a special case ofthe LWH approach more suitable for faint images in whichone chooses only the brightest point (with position xm) ineach speckle image, shifts this point to the origin of imagespace, and then averages over the speckle images, giving
fsaa(x) = (sm(x - Xm)). (17)
A promising method of phase retrieval from speckle im-ages is the triple-correlation or bispectrum method.34 Thisis also called the speckle-masking method, not to be con-fused with the use of a speckle mask described above. Thetriple correlation (x1, x2) and the bispectrum P(ul, u2) aredefined by
x, x2) = J f(x)f(x + x,)f(x + x2)dx (18)
and
P(u,, u2) = F(u,)F(u2 )F(-u1 - 2 ), (19)
respectively, where (xl, x2) and P(ul, u2 ) form a Fourier-transform pair. In the context of speckle imaging, thespeckle bispectrum Sm(ul, u2) is related to the image bispec-trum by
(m(Ul, U2)) = P(u, u2)(17(ul, U2)), (20)
where (1(u1, u2)) is the bispectral speckle transfer functionthat can be estimated by applying the same processing to anunresolvable object, allowing P(ul, u2) to be calculated by
inverse filtering. The bispectral speckle transfer function ispositive under fairly wide conditions363 7 so that the phase ofthe object bispectrum equals that of the image bispectrum.The remarkable property of the bispectrum is that the phaseof the F(u) can be calculated recursively from the phase ofP(u,, U2). This is illustrated in the sampled one-dimension-al case, for which Eq. (19) becomes
(21)
Denoting the phases of the visibility and the bispectrum by¢n and q1Im, respectively, replacing by n - m, and using Eq.(21) show that
¢n = Okm + n-m On-rm- (22)
For m = 1, Eq. (22) may be used recursively to find all the Oknsince 00 and Oi can be assigned arbitrarily. Furthermore,the procedure may be repeated with different values of m toobtain independent estimates of On, which can be averaged,making the procedure much less sensitive to noise. Theexponential factors exp(io) are usually averaged as a conve-nient means of accounting for the phases' being modulo 27r,so the averaged phases are given by
nl2
exp(ikn) = (2/n) > exp[i(Om + n-m - q'n-m,m)]. (23)m=l
Note that the estimates of On are averaged before the value isused in the estimates of kn+i, minimizing the noise sensitiv-ity. This recursive algorithm can be extended straightfor-wardly to the two-dimensional case,36 although its applica-tion is hampered by the large computational cost of comput-ing the average bispectrum, which is a four-dimensionalfunction. This technique can be viewed as a generalizationof the Knox-Thompson procedure.
3. PHASE PROBLEM IN CRYSTALLOGRAPHY
X-ray crystallography is a technique for determining thestructures of molecules. By structure is meant the positionof each atom in the molecule. For an introduction to x-raycrystallography, the reader is referred to Ref. 38. Because ofthe short wavelength of x rays (1 A), molecules cannot beimaged directly. The diffraction pattern formed by the xrays scattered from a sample is therefore measured, and thedata are processed numerically to determine the structure.Since a single molecule is extremely small, it is necessary touse a crystalline sample, which contains many moleculesidentically oriented and regularly spaced, to obtain measur-able diffracted amplitudes. The scattering of the x rays bythe sample is weak, so that the Born approximation appliesand the scattered field is accurately approximated as theFourier transform of the electron density f(X) in the crystal.Under normal circumstances, therefore, f(x) > 0. Only theintensity of the diffracted x rays can be measured, and so aphase problem arises. The differences between the crystal-lographic phase problem and that described in Section 2arise from the crystalline nature of the sample.
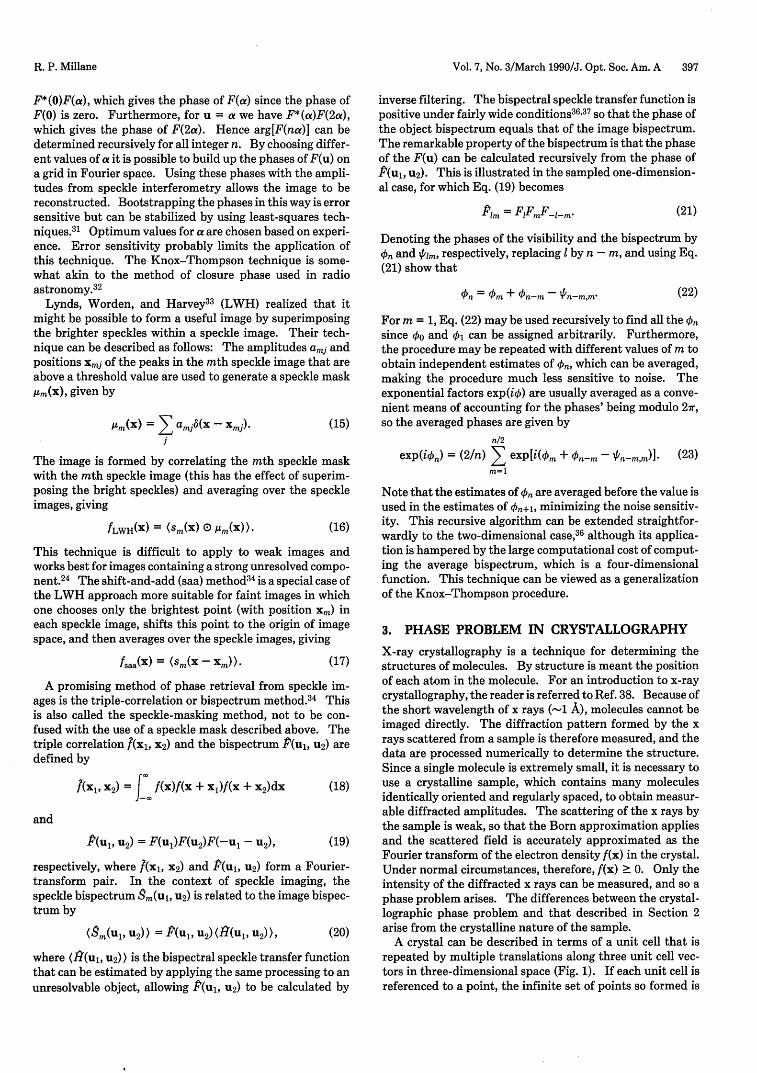
A crystal can be described in terms of a unit cell that isrepeated by multiple translations along three unit cell vec-tors in three-dimensional space (Fig. 1). If each unit cell isreferenced to a point, the infinite set of points so formed is
R. P. Millane
Pi = FIF.F-I-m.
398 J. Opt. Soc. Am. A/Vol. 7, No. 3/March 1990
Fig. 1. The unit cell (thick lines)crystal.
and the lattice (circles) in a
called the lattice. The electron density in the crystal cantherefore be written as
(x) = e(x) 0 eW(x) = e(x) 0 6(x - x"), (24)n=--
where 0 denotes convolution, e(x) is the lattice, the xn arethe lattice points, and e(x) denotes the electron density in asingle unit cell (and zero elsewhere). There are differenttypes of lattice, but, for ease of exposition, I will limit thediscussion here to primitive orthorhombic lattices in whichthe unit cell vectors are mutually orthogonal and there is onemolecule per unit cell. Equation (24) can then be written as
f(x, y, z) = e(x, y, z) 0 6(x - ma)6(y - nb)b(z -pc),m,n,p= -
(25)
where x = (x, y, z) and a, b, and c are the lengths of the unitcell vectors. The unit cell may have internal symmetriescalled space group symmetry, but, to avoid technical detailsnot important in this paper, I will consider a unit cell with nosymmetry. This is called space group P1. The unit cellcontains N, say, atoms, so that the electron density in theunit cell is given by
N
e(x, y, z) = Z en(x -Xn Y-Yn, Z -Z) (26)n=l
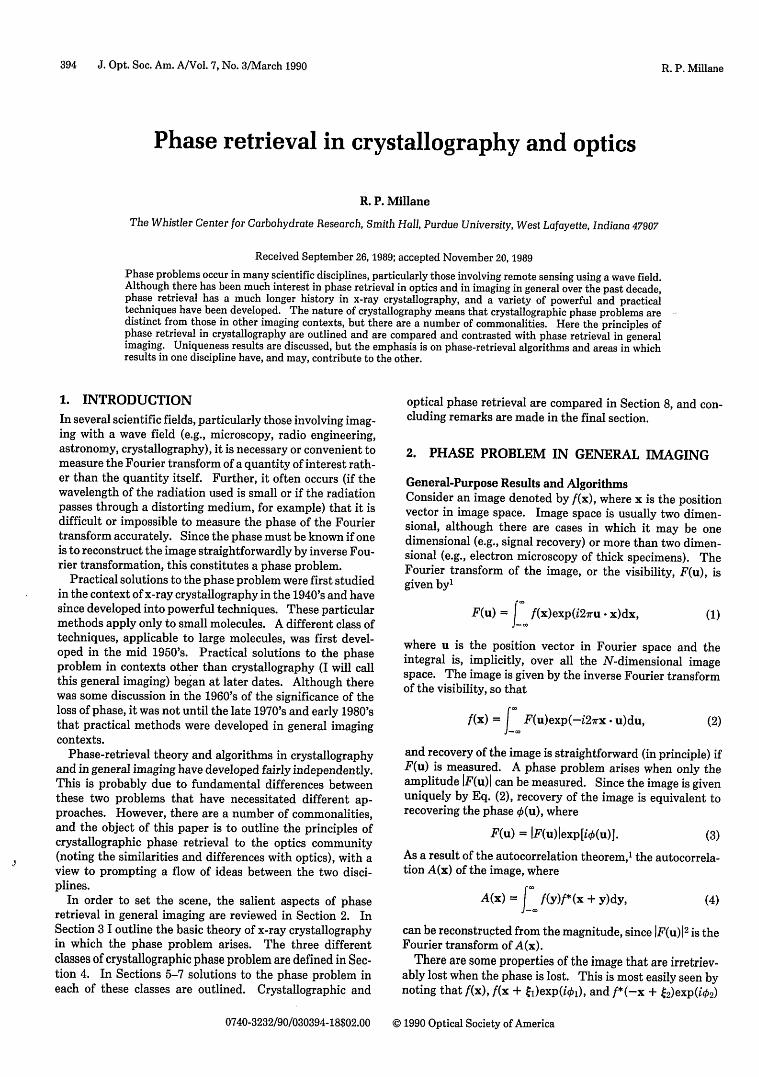
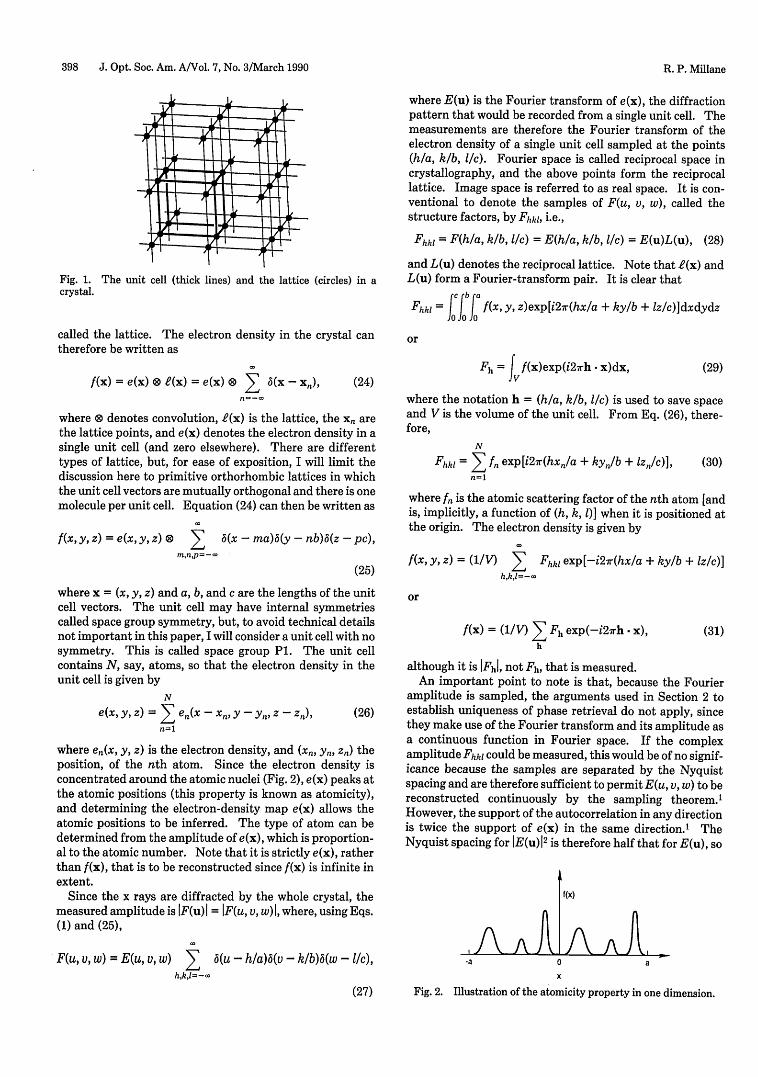
where en(x, y, z) is the electron density, and (n, Yn, Zn) theposition, of the nth atom. Since the electron density isconcentrated around the atomic nuclei (Fig. 2), e(x) peaks atthe atomic positions (this property is known as atomicity),and determining the electron-density map e(x) allows theatomic positions to be inferred. The type of atom can bedetermined from the amplitude of e(x), which is proportion-al to the atomic number. Note that it is strictly e(x), ratherthan f(x), that is to be reconstructed since f(x) is infinite inextent.
Since the x rays are diffracted by the whole crystal, themeasured amplitude is IF(u)I = IF(u, v, w)I, where, using Eqs.(1) and (25),
F(u, v, w) = E(u, v, w) (u - h/a)6(v - k/b)6(w - l/c),h,k,l=-(
(27)
where E(u) is the Fourier transform of e(x), the diffractionpattern that would be recorded from a single unit cell. Themeasurements are therefore the Fourier transform of theelectron density of a single unit cell sampled at the points(h/a, k/b, I/c). Fourier space is called reciprocal space incrystallography, and the above points form the reciprocallattice. Image space is referred to as real space. It is con-ventional to denote the samples of F(u, v, w), called thestructure factors, by Fhkl, i.e.,
Fhk1 = F(h/a, k/b, I/c) = E(h/a, k/b, I/c) = E(u)L(u), (28)
and L(u) denotes the reciprocal lattice. Note that e(x) andL(u) form a Fourier-transform pair. It is clear that
c b aFhk1 = J coJb f(x, y, z)exp[i2r(hx/a + ky/b + z/c)]dxdydz
or
Fh = | f(x)exp(i27rh x)dx, (29)
where the notation h = (h/a, k/b, I/c) is used to save spaceand V is the volume of the unit cell. From Eq. (26), there-fore,
N
Fhk1 = sE f& exp[i27r(hx/a + ky/b + z/c)],n=l
(30)
where fn is the atomic scattering factor of the nth atom [andis, implicitly, a function of (h, k, )] when it is positioned atthe origin. The electron density is given by
(x, y, z) = (1/V) 1 Fhkl exp[-i27r(hx/a + ky/b + Iz/c)]hokl=-r
or
f(x) = (1/V) Z Fh exp(-i2irh x),h
(31)
although it is IFhl, not Fh, that is measured.An important point to note is that, because the Fourier
amplitude is sampled, the arguments used in Section 2 toestablish uniqueness of phase retrieval do not apply, sincethey make use of the Fourier transform and its amplitude asa continuous function in Fourier space. If the complexamplitude Fhkl could be measured, this would be of no signif-icance because the samples are separated by the Nyquistspacing and are therefore sufficient to permit E(u, v, w) to bereconstructed continuously by the sampling theorem.'However, the support of the autocorrelation in any directionis twice the support of e(x) in the same direction.' TheNyquist spacing for E(u)12 is therefore half that for E(u), so
A a A
f(x)
A AI,a
Fig. 2. Illustration of the atomicity property in one dimension.
Bb
R. P. Millane
Vol. 7, No. 3/March 1990/J. Opt. Soc. Am. A 399
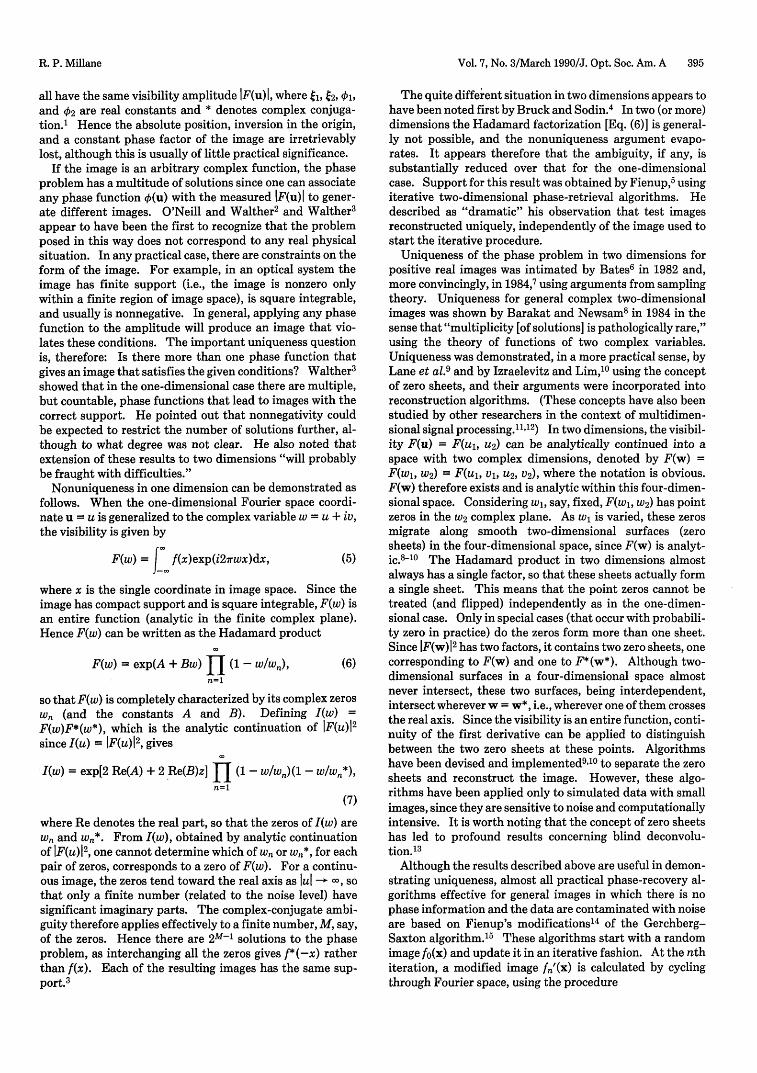
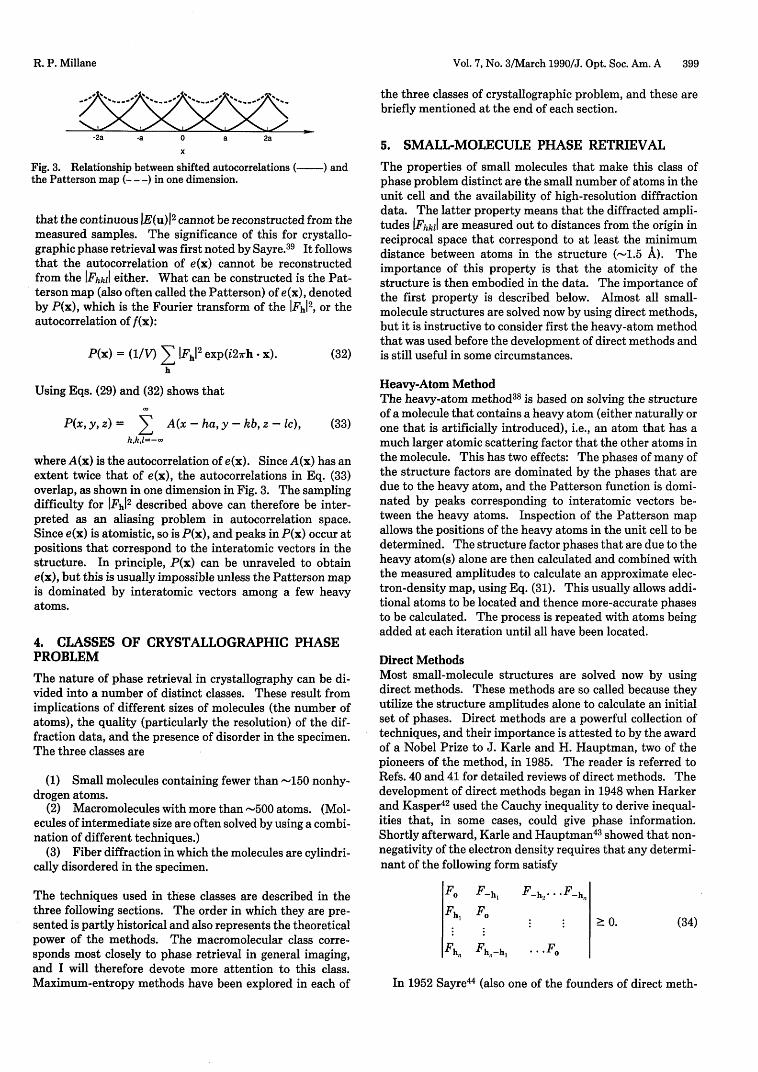
-2a -a 0 a 2a
X
Fig. 3. Relationship between shifted autocorrelations ( ) andthe Patterson map (- -- ) in one dimension.
that the continuous IE(u)12 cannot be reconstructed from themeasured samples. The significance of this for crystallo-graphic phase retrieval was first noted by Sayre.39 It followsthat the autocorrelation of e(x) cannot be reconstructedfrom the IFhkl either. What can be constructed is the Pat-terson map (also often called the Patterson) of e(x), denotedby P(x), which is the Fourier transform of the Fh2, or theautocorrelation of f(x):
P(x) = (1/V) E 'Fhl' exp(i2irh * x). (32)h
Using Eqs. (29) and (32) shows that
P(x, y, ) = > A(x-ha, y-kb, z-ic), (33)h,k,l=--
where A(x) is the autocorrelation of e(x). Since A(x) has anextent twice that of e(x), the autocorrelations in Eq. (33)overlap, as shown in one dimension in Fig. 3. The samplingdifficulty for Fh2 described above can therefore be inter-preted as an aliasing problem in autocorrelation space.Since e(x) is atomistic, so is P(x), and peaks in P(x) occur atpositions that correspond to the interatomic vectors in thestructure. In principle, P(x) can be unraveled to obtaine(x), but this is usually impossible unless the Patterson mapis dominated by interatomic vectors among a few heavyatoms.
4. CLASSES OF CRYSTALLOGRAPHIC PHASEPROBLEM
The nature of phase retrieval in crystallography can be di-vided into a number of distinct classes. These result fromimplications of different sizes of molecules (the number ofatoms), the quality (particularly the resolution) of the dif-fraction data, and the presence of disorder in the specimen.The three classes are
(1) Small molecules containing fewer than -150 nonhy-drogen atoms.
(2) Macromolecules with more than -500 atoms. (Mol-ecules of intermediate size are often solved by using a combi-nation of different techniques.)
(3) Fiber diffraction in which the molecules are cylindri-cally disordered in the specimen.
The techniques used in these classes are described in thethree following sections. The order in which they are pre-sented is partly historical and also represents the theoreticalpower of the methods. The macromolecular class corre-sponds most closely to phase retrieval in general imaging,and I will therefore devote more attention to this class.Maximum-entropy methods have been explored in each of
the three classes of crystallographic problem, and these arebriefly mentioned at the end of each section.
5. SMALL-MOLECULE PHASE RETRIEVAL
The properties of small molecules that make this class ofphase problem distinct are the small number of atoms in theunit cell and the availability of high-resolution diffractiondata. The latter property means that the diffracted ampli-tudes IFhkl are measured out to distances from the origin inreciprocal space that correspond to at least the minimumdistance between atoms in the structure (1.5 A). Theimportance of this property is that the atomicity of thestructure is then embodied in the data. The importance ofthe first property is described below. Almost all small-molecule structures are solved now by using direct methods,but it is instructive to consider first the heavy-atom methodthat was used before the development of direct methods andis still useful in some circumstances.
Heavy-Atom MethodThe heavy-atom method38 is based on solving the structureof a molecule that contains a heavy atom (either naturally orone that is artificially introduced), i.e., an atom that has amuch larger atomic scattering factor that the other atoms inthe molecule. This has two effects: The phases of many ofthe structure factors are dominated by the phases that aredue to the heavy atom, and the Patterson function is domi-nated by peaks corresponding to interatomic vectors be-tween the heavy atoms. Inspection of the Patterson mapallows the positions of the heavy atoms in the unit cell to bedetermined. The structure factor phases that are due to theheavy atom(s) alone are then calculated and combined withthe measured amplitudes to calculate an approximate elec-tron-density map, using Eq. (31). This usually allows addi-tional atoms to be located and thence more-accurate phasesto be calculated. The process is repeated with atoms beingadded at each iteration until all have been located.
Direct MethodsMost small-molecule structures are solved now by usingdirect methods. These methods are so called because theyutilize the structure amplitudes alone to calculate an initialset of phases. Direct methods are a powerful collection oftechniques, and their importance is attested to by the awardof a Nobel Prize to J. Karle and H. Hauptman, two of thepioneers of the method, in 1985. The reader is referred toRefs. 40 and 41 for detailed reviews of direct methods. Thedevelopment of direct methods began in 1948 when Harkerand Kasper42 used the Cauchy inequality to derive inequal-ities that, in some cases, could give phase information.Shortly afterward, Karle and Hauptman4 3 showed that non-negativity of the electron density requires that any determi-nant of the following form satisfy
F. F-h, F-h,- . . .F-h,
Fh, F. > 0.
Fh Fh,-h, ... F.
(34)
In 1952 Sayre44 (also one of the founders of direct meth-
R. P. Millane
400 J. Opt. Soc. Am. A/Vol. 7, No. 3/March 1990
ods) showed that for a structure containing identical resolv-able atoms,
Fh = h E FkFh-k,k
(35)
where Oh can be determined from the atomic scattering fac-tors and the sum is over all values of k. Sayre's equationrepresents the first time that the atomicity property wasutilized and is beautiful in its simplicity. Despite the re-quirement of identical atoms, Eq. (35) is often approximate-ly satisfied for structures containing different types of atom.Sayre's equation is used in direct methods to assess thereliability of phase relationships.
Expanding the third-order determinant [relation (34)]shows that
Fh' < (1 + F2h)/2, (36)
which are known as sigma-one relationships. They some-times, but not often, allow the phase of F2h to be determinedfrom the magnitudes only. Utilizing the third-order deter-minant again and considering structure factors of unusuallylarge magnitude show that
wh ip FkFh-khFhipe
which implies that
'Oh -'Ok + Oh-k' (38)
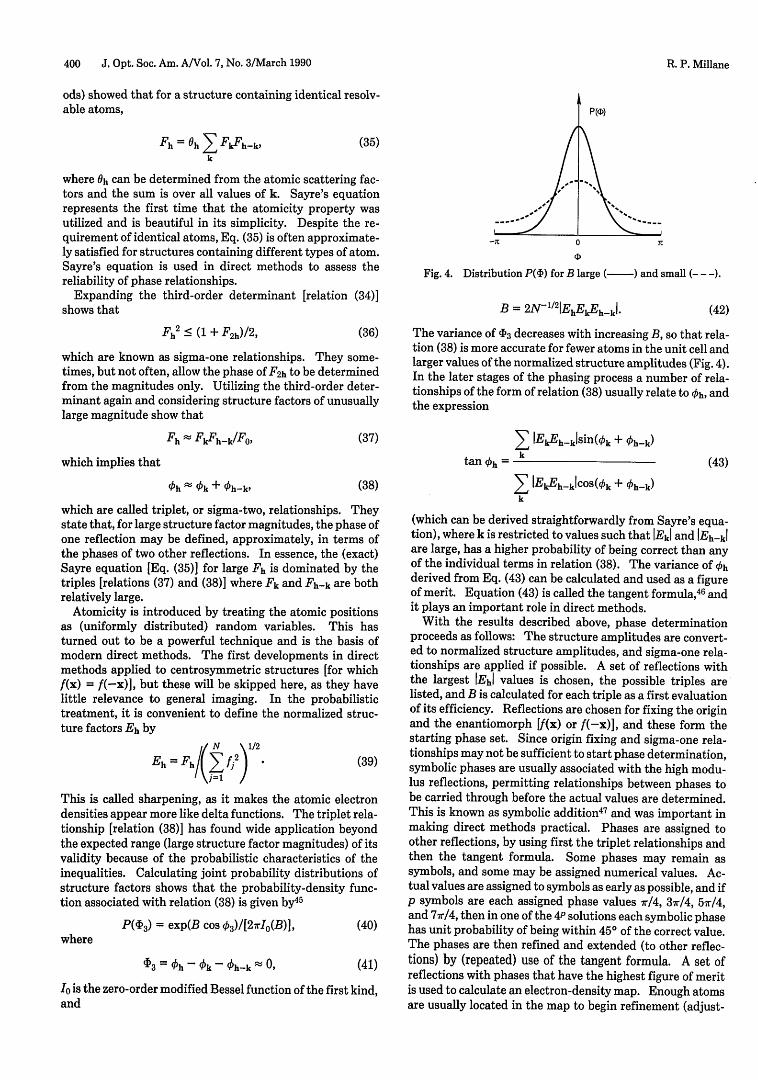
P(o)
_-I 0 I
Fig. 4. Distribution P(4) for B large ( ) and small (- - -).
B = 2N-"2IEhEkEh-k. (42)
The variance of '3 decreases with increasing B, so that rela-tion (38) is more accurate for fewer atoms in the unit cell andlarger values of the normalized structure amplitudes (Fig. 4).In the later stages of the phasing process a number of rela-tionships of the form of relation (38) usually relate to 'Oh, andthe expression
E' EAE-klsin(¢bk + 'kh-k)
tan ¢h = (43)
E, 1EkEh-k1COS(Pk + Oh-k)
which are called triplet, or sigma-two, relationships. Theystate that, for large structure factor magnitudes, the phase ofone reflection may be defined, approximately, in terms ofthe phases of two other reflections. In essence, the (exact)Sayre equation [Eq. (35)] for large Fh is dominated by thetriples [relations (37) and (38)] where Fk and Fh-k are bothrelatively large.
Atomicity is introduced by treating the atomic positionsas (uniformly distributed) random variables. This hasturned out to be a powerful technique and is the basis ofmodern direct methods. The first developments in directmethods applied to centrosymmetric structures [for whichf(x) = f(-x)], but these will be skipped here, as they havelittle relevance to general imaging. In the probabilistictreatment, it is convenient to define the normalized struc-ture factors Eh by
//N \1/2Eh = Fh/(1 fj2) (39)
This is called sharpening, as it makes the atomic electrondensities appear more like delta functions. The triplet rela-tionship [relation (38)] has found wide application beyondthe expected range (large structure factor magnitudes) of itsvalidity because of the probabilistic characteristics of theinequalities. Calculating joint probability distributions ofstructure factors shows that the probability-density func-tion associated with relation (38) is given by45
P( 3) = exp(B cos 03)/[2rIo(B)], (40)where
'3 =_ h ¢ Ok h-k 0, (41)
Io is the zero-order modified Bessel function of the first kind,and
(which can be derived straightforwardly from Sayre's equa-tion), where k is restricted to values such that Ek and IEh-k1are large, has a higher probability of being correct than anyof the individual terms in relation (38). The variance of hderived from Eq. (43) can be calculated and used as a figureof merit. Equation (43) is called the tangent formula,4 6 andit plays an important role in direct methods.
With the results described above, phase determinationproceeds as follows: The structure amplitudes are convert-ed to normalized structure amplitudes, and sigma-one rela-tionships are applied if possible. A set of reflections withthe largest Ehl values is chosen, the possible triples arelisted, and B is calculated for each triple as a first evaluationof its efficiency. Reflections are chosen for fixing the originand the enantiomorph [(x) or f(-x)], and these form thestarting phase set. Since origin fixing and sigma-one rela-tionships may not be sufficient to start phase determination,symbolic phases are usually associated with the high modu-lus reflections, permitting relationships between phases tobe carried through before the actual values are determined.This is known as symbolic addition4 7 and was important inmaking direct methods practical. Phases are assigned toother reflections, by using first the triplet relationships andthen the tangent formula. Some phases may remain assymbols, and some may be assigned numerical values. Ac-tual values are assigned to symbols as early as possible, and ifp symbols are each assigned phase values r/4, 3r/4, 57r/4,and 77r/4, then in one of the 4P solutions each symbolic phasehas unit probability of being within 450 of the correct value.The phases are then refined and extended (to other reflec-tions) by (repeated) use of the tangent formula. A set ofreflections with phases that have the highest figure of meritis used to calculate an electron-density map. Enough atomsare usually located in the map to begin refinement (adjust-
R. P. Millane
Vol. 7, No. 3/March 1990/J. Opt. Soc. Am. A 401
ment of the atomic positions to optimize the agreementbetween the measured amplitudes and those calculated froma model) of the structure. Usually at least a fragment of thestructure is visible, and this may be used to calculate a set ofstructure factors. The phases of the large structure factorsare taken as correct and tangent formula refinement andextension repeated. Repeated application usually results ina recognizable electron-density map. Difference Fouriersynthesis,38 in which the coefficients Fh in Eq. (31) are re-placed by the differences between the measured and calcu-lated (from the estimated structure) structure amplitudestogether with the calculated phases, is useful. Maps calcu-lated in this way show (approximately) the differences be-tween the current model and the actual structure-i.e., theerrors in the model. These methods are integrated into aprogram package called MULTAN (the multiple-tangent-for-mula method). 4 8 A weighted tangent formula is often usedin which the terms in Eq. (43) are weighted, depending onthe estimated reliability of the phases they contain.4 9
An interesting random approach has proved powerful andhas been incorporated into a program called RANTAN (ran-dom MULTAN). In this method, a large starting set is taken,and, for each trial, random phases are assigned to the reflec-tions and refined by using the weighted-tangent formulauntil good figures of merit are obtained. This often pro-duces a high-quality electron-density map faster than MUL-
TAN can.Many refinements and new techniques have been incorpo-
rated into direct methods or are currently under investiga-tion, and I will not attempt to cover them here. They in-clude the use of higher-order invariants (such as quartetsand quintets) and use of the neighborhood principle50 andfurther applications of the Sayre equation51 and Karle-Hauptman determinants.
Direct methods are shown by Bricogne52 to bear a closerelationship to a maximum-entropy formulation. He showsthat a scheme that involves updating a (nonuniform) priordistribution of atoms as phase determination proceeds canbe formulated as a maximum-entropy problem. This is apotentially powerful approach to extending the scope ofdirect methods (to larger molecules), although more study isrequired to assess this potential. He also shows that thisformalism is related to the "maximum determinant meth-od," 53 which is a probabilistic result involving the Karle-Hauptman determinants [Eq. (34)].
6. MACROMOLECULAR PHASE RETRIEVAL
Macromolecular crystallography deals with determining thestructures of molecules that contain more than 500 at-oms.5 4 The term protein crystallography is synonymouswith macromolecular crystallography since most of thestructures determined have been proteins, although themethods have also been applied to nucleic acids and to pro-tein-nucleic acid complexes including a number of viruses.Phase retrieval in macromolecular crystallography is quitedifferent from that for small molecules. Direct methods arenot effective for two reasons: First, and more significantly,the large number of atoms results in the variances of thephase probabilities being so large that the phase-predictingpower is negligible. Second, diffraction data are usuallymeasurable only to moderate resolution (2-3 A), so thatthe atomicity property, on which direct methods are based,
is not reflected in the data. All procedures used in macro-molecular crystallography therefore utilize some ancilliaryinformation that allows approximate initial phases to becalculated. This information is obtained with a variety ofexperimental techniques or by using a known similar struc-ture. The initial phases are then refined and extended byusing a number of algorithms. I briefly describe here theexperimental procedures used to determine initial phasesand the phase-refinement and -extension algorithms.
Isomorphous ReplacementThe method of isomorphous replacement was first used inthe 1950's55 and is still central to the analysis of macromole-cules as a means of obtaining initial phase information. Anisomorphous derivative of the crystal is prepared in which aheavy atom is attached to the macromolecule. The heavyatom introduces measurable changes in the diffraction pat-tern, and diffraction data are collected from both the nativecrystal and the derivative. If Fh, FhD, and FhH are the struc-ture factors for the native, the derivative, and the heavyatom, respectively, then
FD= h + Fh, (44)
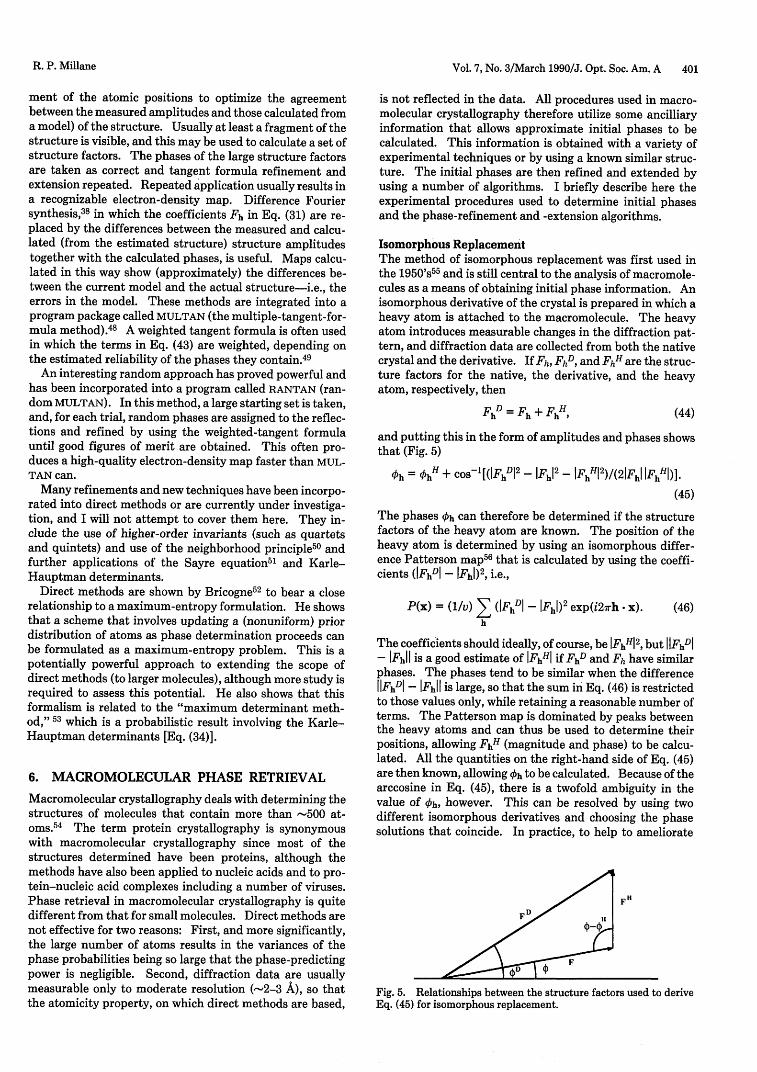
and putting this in the form of amplitudes and phases showsthat (Fig. 5)
'Oh = ,hH + COSl[(FhD2- Fh' - FhHl)/(2Fhj lFhHI)].
(45)
The phases 'h can therefore be determined if the structurefactors of the heavy atom are known. The position of theheavy atom is determined by using an isomorphous differ-ence Patterson map56 that is calculated by using the coeffi-cients (FhD - Fhj)2, i.e.,
P(x) = (1/v) (hD - lFhl)2 exp(i27rh x).h
(46)
The coefficients should ideally, of course, be IFhH2, but IlFhDI- Fhl is a good estimate of IFhHI if FhD and Fh have similarphases. The phases tend to be similar when the differenceJlFhDI - Fhl is large, so that the sum in Eq. (46) is restrictedto those values only, while retaining a reasonable number ofterms. The Patterson map is dominated by peaks betweenthe heavy atoms and can thus be used to determine theirpositions, allowing FhH (magnitude and phase) to be calcu-lated. All the quantities on the right-hand side of Eq. (45)are then known, allowing 'Oh to be calculated. Because of thearccosine in Eq. (45), there is a twofold ambiguity in thevalue of 'h, however. This can be resolved by using twodifferent isomorphous derivatives and choosing the phasesolutions that coincide. In practice, to help to ameliorate
FH
F
Fig. 5. Relationships between the structure factors used to deriveEq. (45) for isomorphous replacement.
R. P. Millane
402 J. Opt. Soc. Am. A/Vol. 7, No. 3/March 1990
the effects of noise a number of different isomorphous deriv-atives are used, and this is called multiple isomorphous re-placement (MIR). The approximate phases so obtained arecombined in an optimum manner (as described below) andused to calculate an electron-density map. The phases areoften reasonably accurate to -3-A resolution, and the result-ing map is often interpretable, i.e., the chemical structure ofthe macromolecule (which is usually known) can be rational-ized with the electron-density distribution. The knownchemical structure is then built into the map (using comput-er graphics and special-purpose software) to obtain an ap-proximate three-dimensional model. The model is refinedby adjusting it to optimize the agreement between the mea-sured and calculated amplitudes (as well as optimizing thestereochemistry) by using, for example, conjugate gradientalgorithms.5 7 Difference Fourier synthesis is also used dur-ing refinement to detect errors in the model.
If it is possible experimentally to obtain only a singleisomorphous derivative, then it may be possible to calculatea useful (but noisy) electron-density map by using coeffi-cients IFhI[exp(ih') + exp(ikh")I in Eq. (31), where Oh' and'h" are the two phase solutions obtained from Eq. (45). Amap calculated in this way usually has some correct featuresthat are due to the correct phases and a noisy backgroundthat is due to the incorrect phases. Such a map may beinterpretable or may be good enough to begin density modi-fication (described below) with. This is called single iso-morphous replacement (SIR), the obvious advantage beingthat, if it is successful, the amount of experimental work willbe substantially reduced.
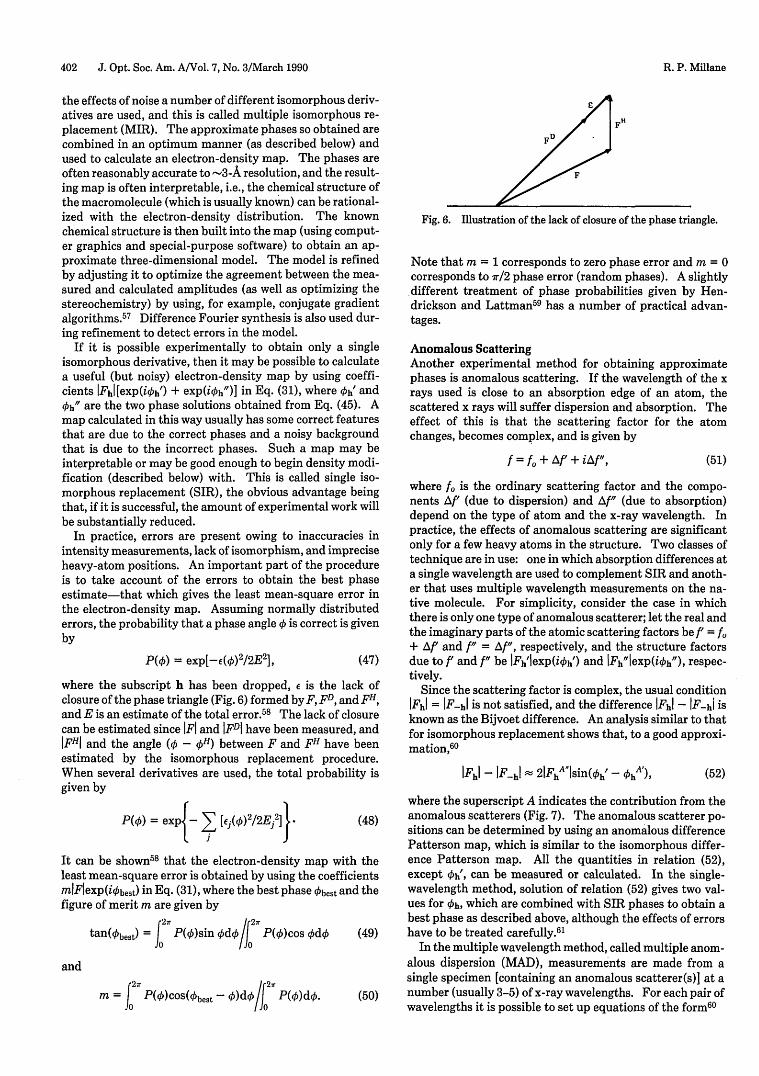
In practice, errors are present owing to inaccuracies inintensity measurements, lack of isomorphism, and impreciseheavy-atom positions. An important part of the procedureis to take account of the errors to obtain the best phaseestimate-that which gives the least mean-square error inthe electron-density map. Assuming normally distributederrors, the probability that a phase angle 4 is correct is givenby
P(O) = exp[-e(O)2 /2E2], (47)
where the subscript h has been dropped, is the lack ofclosure of the phase triangle (Fig. 6) formed by F FD, and FH,and E is an estimate of the total error.5 8 The lack of closurecan be estimated since IFI and IFDI have been measured, andFHI and the angle (O - OH) between F and FH have been
estimated by the isomorphous replacement procedure.When several derivatives are used, the total probability isgiven by
P() = exp{-E [fj(O)2/2Ej2]} (48)
It can be shown5 8 that the electron-density map with theleast mean-square error is obtained by using the coefficientsmlFlexp(ifbest) in Eq. (31), where the best phase kbest and thefigure of merit m are given by
tan(best) = P(4)sin Odo/J P(O)cos OdO (49)
and
m = J: P(O)cos(kbest - 0)d50/J P(O)dk. (50)
FH
FD
Fig. 6. Illustration of the lack of closure of the phase triangle.
Note that m = 1 corresponds to zero phase error and m = 0corresponds to r/2 phase error (random phases). A slightlydifferent treatment of phase probabilities given by Hen-drickson and Lattman5 9 has a number of practical advan-tages.
Anomalous ScatteringAnother experimental method for obtaining approximatephases is anomalous scattering. If the wavelength of the xrays used is close to an absorption edge of an atom, thescattered x rays will suffer dispersion and absorption. Theeffect of this is that the scattering factor for the atomchanges, becomes complex, and is given by
f=fo+ Af+iAf-, (51)
where fo is the ordinary scattering factor and the compo-nents Af' (due to dispersion) and A" (due to absorption)depend on the type of atom and the x-ray wavelength. Inpractice, the effects of anomalous scattering are significantonly for a few heavy atoms in the structure. Two classes oftechnique are in use: one in which absorption differences ata single wavelength are used to complement SIR and anoth-er that uses multiple wavelength measurements on the na-tive molecule. For simplicity, consider the case in whichthere is only one type of anomalous scatterer; let the real andthe imaginary parts of the atomic scattering factors be f' = fo+ Af' and f' = Af", respectively, and the structure factorsdue to f' and f" be lWh'lexp(ifh') and Ih"exp(ih"), respec-tively.
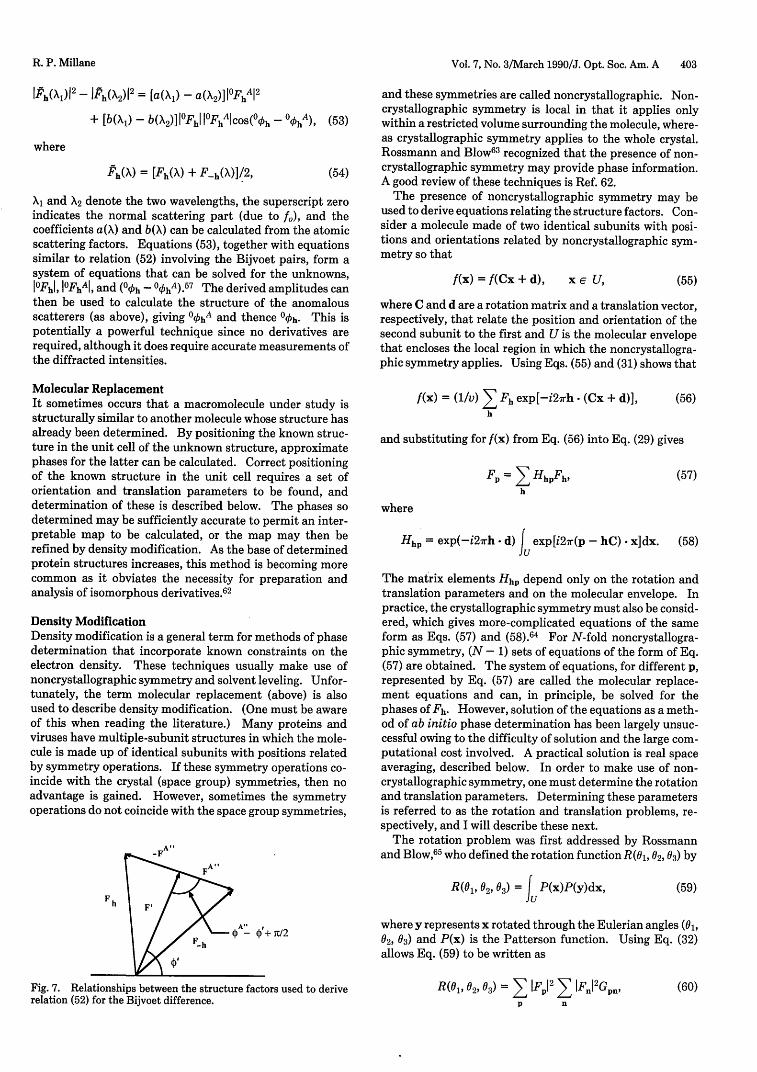
Since the scattering factor is complex, the usual conditionFhi = IF-hI is not satisfied, and the difference IFhi - IF-hi isknown as the Bijvoet difference. An analysis similar to thatfor isomorphous replacement shows that, to a good approxi-mation,6 0
IFhI - IF-hI 2IFhAIsin(Oh Oh ), (52)
where the superscript A indicates the contribution from theanomalous scatterers (Fig. 7). The anomalous scatterer po-sitions can be determined by using an anomalous differencePatterson map, which is similar to the isomorphous differ-ence Patterson map. All the quantities in relation (52),except Okh', can be measured or calculated. In the single-wavelength method, solution of relation (52) gives two val-ues for Oh, which are combined with SIR phases to obtain abest phase as described above, although the effects of errorshave to be treated carefully.6'
In the multiple wavelength method, called multiple anom-alous dispersion (MAD), measurements are made from asingle specimen [containing an anomalous scatterer(s)] at anumber (usually 3-5) of x-ray wavelengths. For each pair ofwavelengths it is possible to set up equations of the form60
R. P. Millane
Vol. 7, No. 3/March 1990/J. Opt. Soc. Am. A 403
Ih(Xl)l Ih(X 2 )1 = [a(, 1 ) - a(X2 )]IOFhA 2
+ [b(Xl) - b(X2 )]IFhl IFhA Icos(Oh -°0h h), (53)
where
Fh(X) = [Fh(X) + Fh(X)]/2, (54)
Xi and X2 denote the two wavelengths, the superscript zeroindicates the normal scattering part (due to f), and thecoefficients a(X) and b(X) can be calculated from the atomicscattering factors. Equations (53), together with equationssimilar to relation (52) involving the Bijvoet pairs, form asystem of equations that can be solved for the unknowns,JFhI, IOFhAI, and (0h - 00hA).5 7 The derived amplitudes canthen be used to calculate the structure of the anomalousscatterers (as above), giving O0hA and thence 0 0kh. This ispotentially a powerful technique since no derivatives arerequired, although it does require accurate measurements ofthe diffracted intensities.
Molecular ReplacementIt sometimes occurs that a macromolecule under study isstructurally similar to another molecule whose structure hasalready been determined. By positioning the known struc-ture in the unit cell of the unknown structure, approximatephases for the latter can be calculated. Correct positioningof the known structure in the unit cell requires a set oforientation and translation parameters to be found, anddetermination of these is described below. The phases sodetermined may be sufficiently accurate to permit an inter-pretable map to be calculated, or the map may then berefined by density modification. As the base of determinedprotein structures increases, this method is becoming morecommon as it obviates the necessity for preparation andanalysis of isomorphous derivatives.6 2
Density ModificationDensity modification is a general term for methods of phasedetermination that incorporate known constraints on theelectron density. These techniques usually make use ofnoncrystallographic symmetry and solvent leveling. Unfor-tunately, the term molecular replacement (above) is alsoused to describe density modification. (One must be awareof this when reading the literature.) Many proteins andviruses have multiple-subunit structures in which the mole-cule is made up of identical subunits with positions relatedby symmetry operations. If these symmetry operations co-incide with the crystal (space group) symmetries, then noadvantage is gained. However, sometimes the symmetryoperations do not coincide with the space group symmetries,
A"
FA
F hA"-h 4'+ 7c2
Fig. 7. Relationships between the structure factors used to deriverelation (52) for the Bijvoet difference.
and these symmetries are called noncrystallographic. Non-crystallographic symmetry is local in that it applies onlywithin a restricted volume surrounding the molecule, where-as crystallographic symmetry applies to the whole crystal.Rossmann and Blow63 recognized that the presence of non-crystallographic symmetry may provide phase information.A good review of these techniques is Ref. 62.
The presence of noncrystallographic symmetry may beused to derive equations relating the structure factors. Con-sider a molecule made of two identical subunits with posi-tions and orientations related by noncrystallographic sym-metry so that
f(x) = f(Cx + d), x U (55)
where C and d are a rotation matrix and a translation vector,respectively, that relate the position and orientation of thesecond subunit to the first and U is the molecular envelopethat encloses the local region in which the noncrystallogra-phic symmetry applies. Using Eqs. (55) and (31) shows that
f(x) = (1/v) E Fh exp[-i2irh (Cx + d)],h
(56)
and substituting for f(x) from Eq. (56) into Eq. (29) gives
(57)Fp = E HhpFh,
h
where
Hhp = exp(-i2lrh d) J exp[i27r(p - hC) * xjdx. (58)
The matrix elements Hhp depend only on the rotation andtranslation parameters and on the molecular envelope. Inpractice, the crystallographic symmetry must also be consid-ered, which gives more-complicated equations of the sameform as Eqs. (57) and (58).64 For N-fold noncrystallogra-phic symmetry, (N - 1) sets of equations of the form of Eq.(57) are obtained. The system of equations, for different p,represented by Eq. (57) are called the molecular replace-ment equations and can, in principle, be solved for thephases of Fh. However, solution of the equations as a meth-od of ab initio phase determination has been largely unsuc-cessful owing to the difficulty of solution and the large com-putational cost involved. A practical solution is real spaceaveraging, described below. In order to make use of non-crystallographic symmetry, one must determine the rotationand translation parameters. Determining these parametersis referred to as the rotation and translation problems, re-spectively, and I will describe these next.
The rotation problem was first addressed by Rossmannand Blow, 65 who defined the rotation function R(01 , 02, 03) by
R(01, 02, 03) = P(x)P(y)dx, (59)
where y represents x rotated through the Eulerian angles (01,02, 03) and P(x) is the Patterson function. Using Eq. (32)allows Eq. (59) to be written as
R(01, 02, 03) = E IFPI2 E IF' 2G~,P n
(60)
R. P. Millane
404 J. Opt. Soc. Am. A/Vol. 7, No. 3/March 1990
Gpn = Ju exp[i2Ir(n + pC) x]dx (61)
and the matrix C represents the rotation defined by (01, 02,
03). The rotation function can therefore be calculated fromthe measured amplitudes by using Eqs. (60) and (61). Com-putation of the rotation function is considerably acceleratedby expanding the Patterson functions in spherical harmon-ics.66 The Patterson function rotated relative to itself givesa maximum overlap of the interatomic vectors when onesubunit has the same orientation as another subunit. Hencethe rotation function has peaks in directions (, 02, 03) corre-sponding to the relative orientations of subunits and is usedto determine the rotation components of the noncrystallo-graphic symmetry.
Once the rotation part of the noncrystallographic symme-try is determined, the translation part needs to be found.The translation problem is less tractable than the rotationproblem and has been discussed by a number of authors.6 2
In the special case that the noncrystallographic rotation istwofold, the translation vector can be determined by using atranslation function similar in form to the rotation functionexcept that the Patterson functions are translated ratherthan rotated.6 2 If a related structure is known (as in appli-cations of molecular replacement), then various translationfunctions may be used.6 2 Alternatively, possible molecularpositions may be assessed by examining their effects on theagreement between calculated and measured structure am-plitudes and/or by packing considerations (usually somemolecular positions may be excluded because they wouldinvolve interpenetration of adjacent molecules). If approxi-mate, low-resolution phases are available (from isomor-phous replacement, for example), inspection of a calculatedelectron-density map may be sufficient to position the mole-cule. The translation problem can often be solved by usinga combination of these techniques.
Although solution of the molecular replacement equationshas not been practical, so called (electron) density modifica-tion (also called real-space molecular replacement)6 2 hasproved to be a powerful technique and has been an essentialpart of some high-resolution protein and, particularly, virusstructure determinations. The procedure involves iteratingbetween real space and Fourier space, enforcing structuralinformation (noncrystallographic symmetry, for example) inreal space, and ensuring consistency with the measured am-plitudes in reciprocal space. Density modification seeks torefine and extend the phases rather than to attempt ab initiophase determination.
The reader probably has recognized that this procedurehas the flavor of the (Fienup) iterative phase-retrieval algo-rithms described in Section 2. The constraints typicallyavailable in real space are noncrystallographic symmetry(equivalence of subunits), the molecular envelope (a form ofsupport constraint), and positivity of the electron density.Reciprocal space constraints are the measured structure am-plitudes. An outline of the density modification procedureis as follows:
1. Calculate approximate low-resolution phases, usingMIR, SIR, anomalous scattering, from a related structure, orsome combination of these.
2. Determine the noncrystallographic symmetry param-
eters (using the rotation and translation functions) and anapproximate envelope from inspection of a low-resolutionelectron-density map derived from the phases from step 1.
3. Calculate an electron-density map, using the currentphases and weighted measured amplitudes.
4. Enforce real-space constraints by
(a) Setting the electron density in each subunit to theaverage value over all the subunits.
(b) Setting the electron density outside the envelopeto zero or to the average solvent value (this is called solventleveling).
(c) Setting any negative electron density values to zeroor to the average solvent value.
5. Calculate a new set of phases, and synthesize themwith the isomorphous replacement phases to obtain a newcombined best phase.
6. Return to step 3.
This procedure is iterated until there is little change in thephases. The progress of refinement is monitored by exam-ining the agreement between the calculated and measuredstructure amplitudes; failure of an agreement index to attaina reasonable value indicates that the phases are not improv-ing sufficiently. The success of phase refinement dependson the accuracy of the structure amplitude measurementsand the starting phases, on the degree of noncrystallographicsymmetry, and on the molecular envelope fractional volume(U/V). If a molecule has noncrystallographic symmetry,then the phases obtained by isomorphous replacement donot need to be so accurate, since they can be refined to moreaccurate values with this procedure. This eases the amountof experimental work required and has been used particular-ly successfully to refine SIR phases. It can be shown thatthis procedure is equivalent to iterative solution of the mo-lecular replacement equations. 6 26 7
Once the phases have converged, higher-resolution reflec-tions can be phased by phase extension, which is most effec-tively performed by adding reflections in a spherical shell inreciprocal space of thickness equal to a few reciprocal latticepoints. The current amplitudes and calculated phases arethen used to repeat the above procedure from step 3, tophase the shell of reflections added. Once this procedurehas converged, another shell of reflections is added. Theextension is continued until poor agreement between thecalculated and measured amplitudes indicates that the accu-racy of the high-resolution data is deteriorating. In prac-tice, there are always regions of reciprocal space where thestructure amplitudes cannot be measured, and it is impor-tant to use the current calculated amplitudes (rather thanexcluding the reflections) to stabilize and accelerate conver-gence. Phase determination is complete if the phases can beextended to high enough resolution for the electron-densitymap to be interpretable. A model is then built into theelectron-density map and the model refined as describedabove in the subsection on isomorphous replacement.
Maximum entropy has been explored in macromolecularphase retrieval as a means of improving the quality andresolution of electron-density maps and of incorporating avariety of different types of data.6 8 A few applications havebeen reported6 9 in which the phases have been determined
R. P. Millane
Vol. 7, No. 3/March 1990/J. Opt. Soc. Am. A 405
and the resolution extended. Although there appear to beimprovements in these maps, more study is needed to assessthe value of these methods.
7. PHASE RETRIEVAL IN FIBERDIFFRACTION
Certain molecules, such as polymers and macromoleculesmade up of units that aggregate with helix symmetry, do notform regular three-dimensional crystals as described in Sec-tion 3 and are therefore not amenable to conventional crys-tallographic analysis. However, these molecules can oftenbe prepared as fibers in which their long axes are approxi-mately parallel, but the molecules are subject to randomrotation about their long axes, and structure determinationis possible by using x-ray diffraction from such specimens.7 0
The techniques used are called fiber diffraction and can beconsidered a variation of traditional crystallography. Fiberdiffraction was used in determining the double-helix struc-ture of DNA in the 1950's.
Since the molecules are randomly rotated, it is convenientto use cylindrical coordinates (r, , z) and (R, V/, Z) in realand reciprocal space, respectively. Fibrous molecules al-ways display helix symmetry in which a subunit is repeatedindefinitely by helix symmetry operations. The helix sym-metry is denoted by u, which means that there are u sub-units in v turns of the helix.70 The z axis is defined ascoinciding with the helix axis, and the helix pitch is P, so thatthe repeat distance c = vP. In cylindrical coordinates, theFourier transform of a single molecule is given by70
FP(R, 4O = F(R, P, i/c) = E E f1n(27Rr)exp~i[n( + /2)i n
- nj + 27rlzj/c]1, (62)
which is restricted to layer planes z = I/c, where I is aninteger, J is the nth-order Bessel function of the first kind,and (rj, 0j, zj) are the coordinates of the jth atom in onesubunit. The sum is over all integers n, but the helix sym-metry results in all terms other than those satisfying thehelix selection rule = um + vn, where m is any integer,being equal to zero. The random rotation of the moleculesresults in cylindrical averaging of the diffraction pattern sothat the quantity measured is I(R), given by
2,rI(R) = (1/27r) f IFI(R, 0O12d d1VI (63)
where indexes the layer lines. Making use of Eq. (62)shows that Eq. (63) can be put in the form
I(R) = E IGn(R)12, (64)n
where
Gni(R) = E fJJn(27rRrj)exp[i(-n4 + 2rlzj/c)]. (65)j
The corresponding inverse transform for reconstructing theelectron density f(r, X, z) is given by
f(r, , z) = (1/c) E E gn(r)exp[i(n - 2irlz/c)], (66)1 n
where
gnl(r) = J Gn1 (R)Jn(27rRr)2irRdR, (67)
so that it can be determined from the Gn0 (R). Hence thephase problem is much more difficult than in conventionalcrystallography since it involves separating out the individ-ual IGn(R)2 terms in Eq. (64) from the measurements M1(R)as well as determining the phase of each Gn(R).
It is important to note that, although the index n in Eq.(64) ranges over an infinite set, the behavior of the Besselfunctions near the origin ensures that only a finite number,N, say, are significant in practice. N depends on u and onthe maximum values of rj (i.e., the molecular radius) and R.7
1
The implications of this for the phase problem have beendiscussed by Makowski,71 and, from the discussion above, itmeans that 2N values [the real and the imaginary parts ofeach Gn(R)] need to be determined for each measurement ofIl(R). Typical values for N are between 3 and 8.
The method of isomorphous replacement described inSection 6 has been modified for application to fiber diffrac-tion.7 2 73 In principle, 2N derivatives are needed to separateand phase the Gn(R), although it can be difficult to obtainthis many derivatives in practice. Let GnD and GnH be theGn for the derivative and the heavy atom alone, respectively,so that
GnD = Gn + GnH = (An + iBn) + (AnH + iBnH), (68)
where the An and Bn are real and the dependence on I and Rhas been dropped to simplify the notation. The measuredintensities I and ID are therefore given by
I = E (An2 + Bn2) (69)
and
ID = 1 [(An + AnH)2 + (Bn + BnH)2].
n
(70)
The positions of the heavy atoms cannot be determined byPatterson methods in fiber diffraction, but they can be lo-cated by using the diffraction data for small R where onlyone Gn term contributes, 7 2 so that AnH and BnH can be calcu-lated. Since I and ID are measured, Eqs. (69) and (70) forma system of quadratic equations in the 2N unknowns An andBn. This system can be solved by a minimization procedurethat finds, in addition to the global minimum, the localminima as well.73 An advantage of the diffraction data'sbeing available continuously in R, rather than only at thereciprocal lattice points as in conventional crystallography,is that a reliable most-probable phase, rather than the bestphase described in Section 6, can be determined. This isdone by using the continuity of Gn(R) as a function of R; i.e.,since the diffracting particle has a finite diameter, Gn(R) isband limited so that its rate of change with R is restricted bya maximum value. The most probable phase of Gni(R) istraced in the complex plane as a function of R. If the change
R. P. Millane
406 J. Opt. Soc. Am. A/Vol. 7, No. 3/March 1990
from one sample of R to the next exceeds the maximumvalue allowed, then the local minima described above aresearched to find one that does not exceed the maximumchange. 72 This allows some of the false solutions, which aredue to noise, to be detected and corrected. If fewer than 2Nderivatives are available, but there are small deviations fromthe ideal helix symmetry, a phenomenon called layer-linesplitting can be used to help to determine the ratios of theIGn1(R)12 terms in Eq. (64).74
Once the G01(R) terms have been separated and phased,an electron-density map can be calculated by using Eqs. (66)and (67). The phases can then be refined with solventleveling7 l as described in Section 6. If the map is interpret-able, an atomic model can be fitted and refined.7 5 Othertechniques such as the use of a limited number of deriva-tives76 and difference Fourier synthesis7 7 have been adaptedfor use in fiber diffraction.
Low-resolution fiber diffraction structures have also beendetermined without any explicit starting phases (from iso-morphous replacement) by using a density modification pro-cedure in which solvent leveling and enhancement of large-scale features known to exist (from other independent infor-mation) in the structure are applied in alternate cycles.78
Solvent leveling is more powerful in fiber diffraction than inconventional crystallography, as I describe in Section 8. Ifsuch a procedure converges to the same structure for a widevariety of starting models, one can be reasonably confidentthat the final structure is correct. Without more-explicitphase information, this procedure is useful only at low reso-lution.
The types of specimen described above are called noncrys-talline because there is no crystallinity in a plane normal tothe helix axis. Many polymers form polycrystalline fibers inwhich the molecules organize laterally into microcrystallites,each of which is a small three-dimensional crystal, the crys-tallites being randomly rotated.7 07 9 In this case, therefore,the diffraction pattern is the cylindrically averaged sampledtransform, so that, when the measurements are denoted byHi,
Hi = E iFhkl, (71)
where the sum is over the reciprocal lattice points (h, k, 1)that have the same cylindrical radius R. Many polymerswith smaller subunits crystallize in this manner, and, withthe addition of stereochemical information, the number ofdegrees of freedom in a structural model can often be re-duced substantially. This allows various atomic models tobe constructed and refined against the diffraction data andstereochemical constraints by using, for example, a least-squares procedure. 80 The incorrect optimized models canoften be detected by using various figures of merit, indicat-ing which is the correct solution. In this method, the initialatomic model effectively provides approximate phases.This technique has, in fact, been used to solve most polymerstructures, as it avoids the quite difficult and time-consum-ing preparation and analysis of derivatives.7 9 81 82 It is noteffective, however, with larger structures (that have manydegrees of freedom), for which phase estimates must beobtained with the methods described above before an atomicmodel can be constructed.
The maximum-entropy method has been applied to onefiber diffraction problem to obtain the most nearly uniformmap of a helical virus consistent with model information andmedium resolution diffraction data.83 It is not clear, howev-er, whether this analysis produced a reliable map.
8. COMPARISON OF OPTICAL ANDCRYSTALLOGRAPHIC PHASE RETRIEVAL
Fundamental DifferencesThere are, of course, many obvious common aspects of phaseretrieval in crystallography and optics simply because one isdealing with a phase problem in both cases. I will summa-rize here the fundamental differences between the two casesand their implications.
The main differences between these two applications ofphase retrieval arise because of the undersampling of thecontinuous intensity in crystallography compared with op-tics. The most important effect of this is on uniqueness.The uniqueness results in general imaging are based on theavailability of the continuous transform. Note that thisdoes not mean that the intensity must be measured continu-ously but only that the measured samples are sufficient, inprinciple, to reconstruct it. Since this is not the case incrystallography, phase retrieval is nonunique here in gener-al. The success of direct methods in crystallography, how-ever, provides strong evidence for uniqueness when atomic-ity is present and the number of atoms is small. Atomicitytherefore appears to be a strong a priori constraint and to bemore effective than positivity. Apart from arguments basedon overdetermination (the ratio of the number of measuredstructure amplitudes to the number of unknown atomic po-sitions is large), however, there is no definitive proof ofuniqueness.
The macromolecular phase problem is nonunique, sinceatomicity is not in effect, unless other constraints, such asnoncrystallographic symmetry, are present. In this case,therefore, one needs additional experimental information toestimate phases.
There are also implications of the crystallographic case'sbeing three, rather than two, dimensional. In the optical(continuous) case, increasing the dimensionality increasesthe number of constraints on the intensity. The result isthat the one-dimensional problem is nonunique (underde-termined), the two-dimensional problem is unique (but notoverdetermined), and the three-dimensional case is overde-termined by a factor of 2.84 In the crystallographic case, theproblem is underdetermined by a factor of 2 from the pointof view that each magnitude must be supplemented by itsphase for the electron density to be reconstructed. Howev-er, if the additional information is in the form of additionalamplitudes (from structural redundancy, for example), thenit is more underdetermined. The sample spacing is twicethe Nyquist spacing for each dimension, which leads to aneightfold reduction in the sampling density (in three dimen-sions). Considering the twofold overdetermination in thecontinuous case, the crystallographic problem is thereforeunderdetermined by a factor of 4.85 The effects of otherstructural constraints in crystallography have been dis-cussed.86 These arguments are based on analyticity of thetransform and do not take account of positivity, which would
R. P. Millane
Vol. 7, No. 3/March 1990/J. Opt. Soc. Am. A 407
be expected to increase overdeterminacy or uniqueness.Unfortunately, although conditions for image positivity inFourier space can be formulated as positivity of the Karle-Hamptman determinants [relation (34)], for example, it isdifficult to formalize the effect of positivity on uniqueness.Positivity is not, in principle, necessary for uniqueness,87 butit is important in practice since successful reconstruction ofgeneral complex images requires a tight support.
Support constraints in crystallography (solvent leveling)are not so effective as in general imaging owing to the period-ic image or, equivalently, to the undersampling of the con-tinuous transform. A measure of the effectiveness of a sup-port constraint in general imaging is the ratio of the area ofthe autocorrelation support to the area of the image support,which is equal to 4. In crystallography, an equivalent mea-sure is the ratio of the unit cell volume to the envelopevolume (V/U), which is typically between 1 and 2 and thencenot so effective.85 8 6
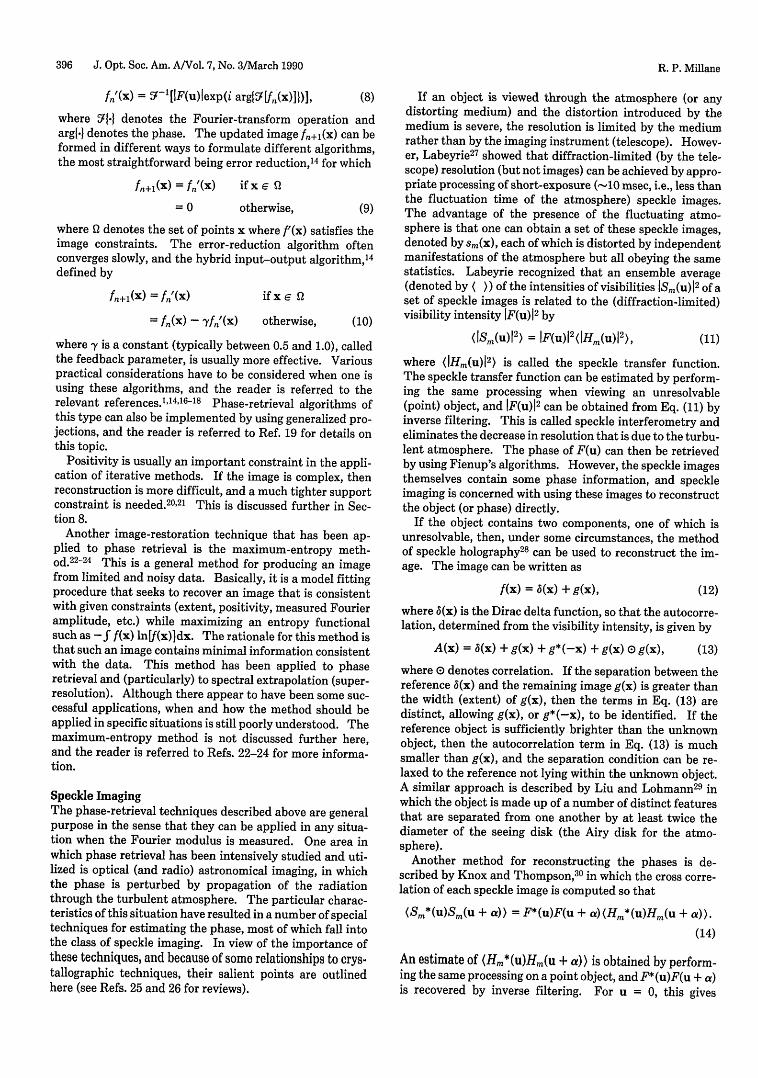
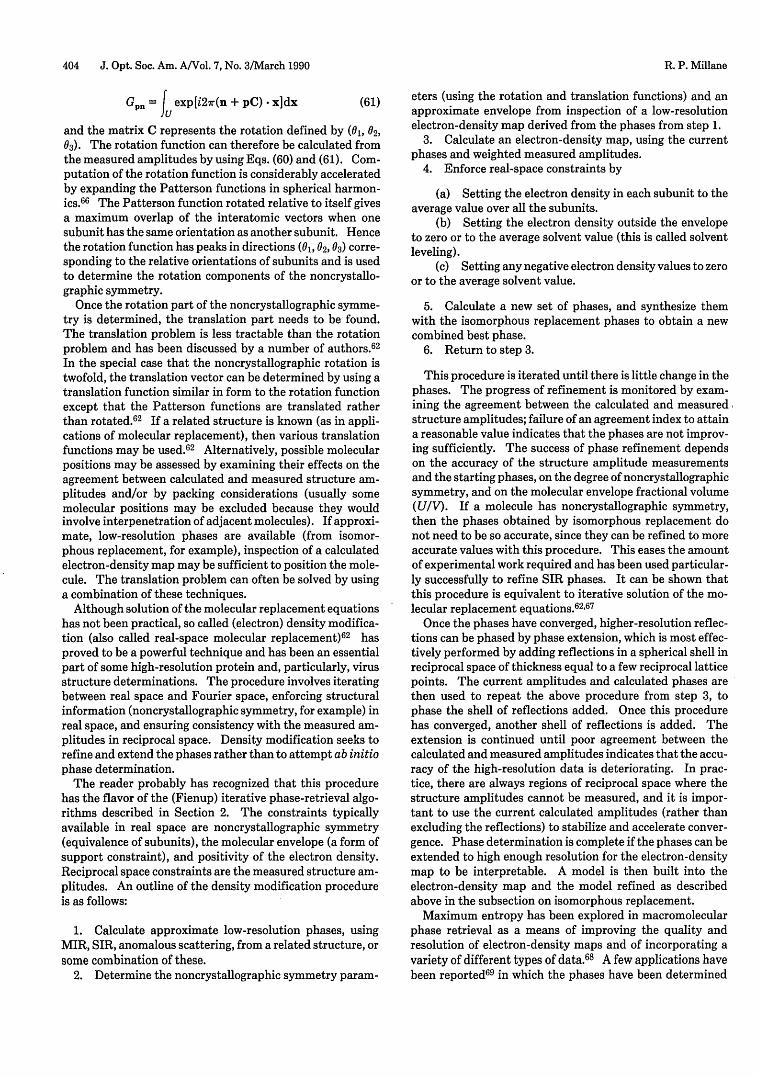
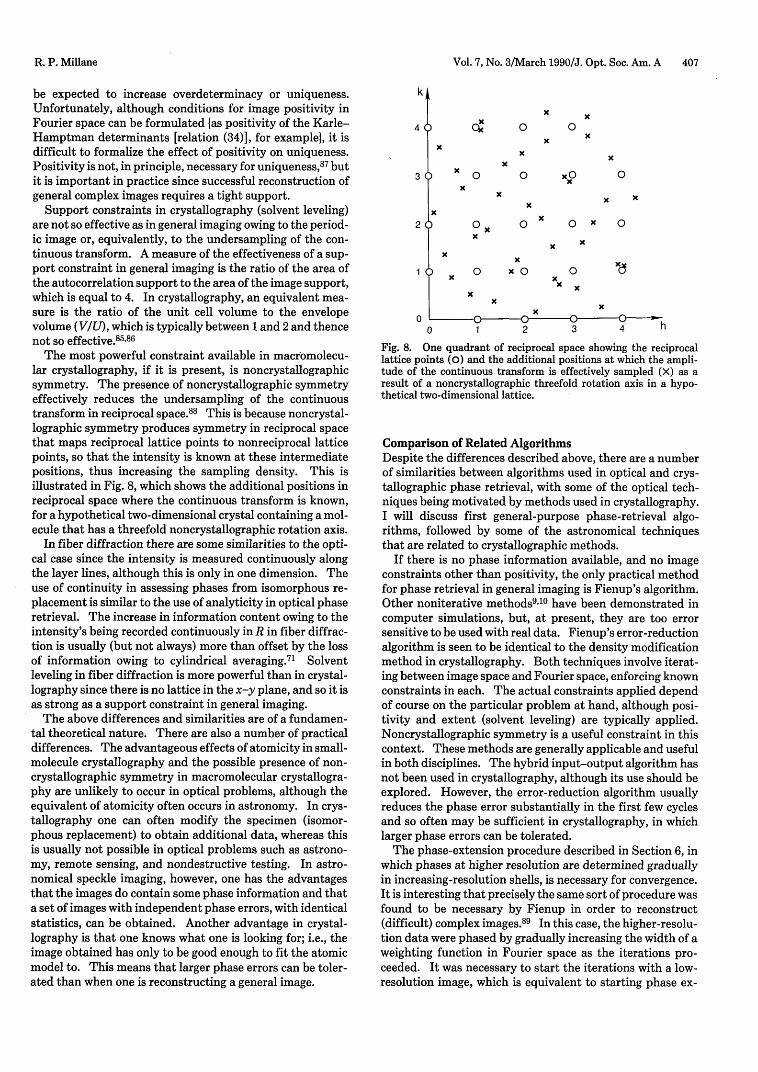
The most powerful constraint available in macromolecu-lar crystallography, if it is present, is noncrystallographicsymmetry. The presence of noncrystallographic symmetryeffectively reduces the undersampling of the continuoustransform in reciprocal space.8 8 This is because noncrystal-lographic symmetry produces symmetry in reciprocal spacethat maps reciprocal lattice points to nonreciprocal latticepoints, so that the intensity is known at these intermediatepositions, thus increasing the sampling density. This isillustrated in Fig. 8, which shows the additional positions inreciprocal space where the continuous transform is known,for a hypothetical two-dimensional crystal containing a mol-ecule that has a threefold noncrystallographic rotation axis.
In fiber diffraction there are some similarities to the opti-cal case since the intensity is measured continuously alongthe layer lines, although this is only in one dimension. Theuse of continuity in assessing phases from isomorphous re-placement is similar to the use of analyticity in optical phaseretrieval. The increase in information content owing to theintensity's being recorded continuously in R in fiber diffrac-tion is usually (but not always) more than offset by the lossof information owing to cylindrical averaging.7 ' Solventleveling in fiber diffraction is more powerful than in crystal-lography since there is no lattice in the x-y plane, and so it isas strong as a support constraint in general imaging.
The above differences and similarities are of a fundamen-tal theoretical nature. There are also a number of practicaldifferences. The advantageous effects of atomicity in small-molecule crystallography and the possible presence of non-crystallographic symmetry in macromolecular crystallogra-phy are unlikely to occur in optical problems, although theequivalent of atomicity often occurs in astronomy. In crys-tallography one can often modify the specimen (isomor-phous replacement) to obtain additional data, whereas thisis usually not possible in optical problems such as astrono-my, remote sensing, and nondestructive testing. In astro-nomical speckle imaging, however, one has the advantagesthat the images do contain some phase information and thata set of images with independent phase errors, with identicalstatistics, can be obtained. Another advantage in crystal-lography is that one knows what one is looking for; i.e., theimage obtained has only to be good enough to fit the atomicmodel to. This means that larger phase errors can be toler-ated than when one is reconstructing a general image.
k
4'1X
0~
3 x X 0
X
2? 0XK
x
x
x
0
0 K
x
x x
O 0x x
x x
o xo 0K
0 K X 0
KK Xcx x (x
K
So x oX
: or To eX
K
h0 1 2 3
Fig. 8. One quadrant of reciprocal space showing the reciprocallattice points (0) and the additional positions at which the ampli-tude of the continuous transform is effectively sampled (X) as aresult of a noncrystallographic threefold rotation axis in a hypo-thetical two-dimensional lattice.
Comparison of Related AlgorithmsDespite the differences described above, there are a numberof similarities between algorithms used in optical and crys-tallographic phase retrieval, with some of the optical tech-niques being motivated by methods used in crystallography.I will discuss first general-purpose phase-retrieval algo-rithms, followed by some of the astronomical techniquesthat are related to crystallographic methods.
If there is no phase information available, and no imageconstraints other than positivity, the only practical methodfor phase retrieval in general imaging is Fienup's algorithm.Other noniterative methods9"10 have been demonstrated incomputer simulations, but, at present, they are too errorsensitive to be used with real data. Fienup's error-reductionalgorithm is seen to be identical to the density modificationmethod in crystallography. Both techniques involve iterat-ing between image space and Fourier space, enforcing knownconstraints in each. The actual constraints applied dependof course on the particular problem at hand, although posi-tivity and extent (solvent leveling) are typically applied.Noncrystallographic symmetry is a useful constraint in thiscontext. These methods are generally applicable and usefulin both disciplines. The hybrid input-output algorithm hasnot been used in crystallography, although its use should beexplored. However, the error-reduction algorithm usuallyreduces the phase error substantially in the first few cyclesand so often may be sufficient in crystallography, in whichlarger phase errors can be tolerated.
The phase-extension procedure described in Section 6, inwhich phases at higher resolution are determined graduallyin increasing-resolution shells, is necessary for convergence.It is interesting that precisely the same sort of procedure wasfound to be necessary by Fienup in order to reconstruct(difficult) complex images.89 In this case, the higher-resolu-tion data were phased by gradually increasing the width of aweighting function in Fourier space as the iterations pro-ceeded. It was necessary to start the iterations with a low-resolution image, which is equivalent to starting phase ex-
R. P. Millane
408 J. Opt. Soc. Am. A/Vol. 7, No. 3/March 1990
tension in crystallography with the low-resolution isomor-phous phases. McCallum and Bates90 show that a similartechnique can be used to accelerate convergence of Fienup'salgorithm and is particularly effective for complex images.This also has some aspects in common with direct methods,in which the phases of a few reflections are propagated to alarger set, the phases of all reflections determined so far,being improved at each stage.
Baldwin and Warner9 l describe the reconstruction of im-ages of compact sources from amplitude-only radio astro-nomical interferometry measurements, which is motivatedby crystallographic analogies. They begin by determiningthe sources by unraveling the autocorrelation, which isequivalent to solving a structure by inspection of the Patter-son map. This is successful for either a simple image or onedominated by a few strong sources. Once the strong sourceshave been located, the remainder are located by using whatare equivalent to difference Fourier maps in crystallogra-phy, to show sources that have been missed. The image isbuilt up, using a sequence of such maps in which sources areadded at each stage until all have been found.
As described above, although positivity is a common con-straint in image space it is difficult to incorporate into Fouri-er space. The Karle-Hauptman determinants [relation(34)] do this, although in a somewhat complicated way. Fol-lowing Karle and Hauptman, Cocke9 2 has used Cauchy'sinequality to derive an optimized constraint on the Fouriermagnitudes that ensures image positivity. This allows thepositivity of the image to checked in Fourier space. A proce-dure that could be used to reduce negativity in the image,directly in Fourier space, would have obvious advantages.
Speckle holography is a simple idea that is clearly analo-gous to the heavy-atom method described in Section 5.
Both the Knox-Thompson and the triple-correlationphase-retrieval procedures described in Section 2 appear tobe related to aspects of direct methods in crystallography.In each of these methods the phases are propagated from asmall set of reflections to a much larger set. Although thecorrespondence is not exact, there are similarities betweenthe phase-propagation equations in both Knox-Thompsonand triple-correlation processing, and the triplet relation-ships (38) in direct methods. Referring to the description,following Eq. (14), of phase propagation in Knox-Thompsonprocessing, denoting the phase of F(u) and F* (u)F(u + a) byIU and kw respectively, and letting v = u + a allows thephase propagation to be written as
X= 'O + A (72)
which bears a striking resemblance to relation (38). Turn-ing now to bispectral processing, the phase-propagation Eq.(22) also resembles relation (38). This is not to say that thetwo situations are the same; the equations are different, andthey arise from different causes: positivity and atomicity inone case and the fact that the cross correlation or bispectralphase is available as data in the other. It is interesting,however, that despite this the forms of the phase-propaga-tion equations are quite similar. Phase propagation similarto this has been proposed in general imaging, but the phasesthus produced are not particularly accurate.6 7
Granrath9 3 has outlined an interesting proposal for usingobject positivity, in the form of Karle-Hauptman inequal-ities, to reduce the computational load in bispectral process-
ing. Expanding the third-order Karle-Hauptman determi-nant [relation (34)] allows constraints to be placed on thephases of factors of the bispectrum Eq. (19) that depend onthe parameter a, given by
a = [IF(ul + U2 )12 + IF(u1)12 + IF(U2)2 -
X [21F(u, + U2)I IF(u,)I IF(U2)I] (73)
and that depend only on the magnitudes [that have beennormalized by F(O)]. The strength of the constraint de-pends on a, which therefore affects the variance of the bi-spectral phase. Granrath describes using the variances toassess the signal-to-noise ratio of the bispectral transferfunction (although the bispectral transfer function is ideallypositive, positivity is expected to be violated in practice witha finite number of specklegrams) at different locations in thebispectrum. This assessment may allow a small region ofthe bispectrum to be selected where the signal-to-noise ratiois high and the bispectrum to be calculated in this regiononly, for the purposes of phase determination, substantiallyreducing the amount of computation required.
Although in astronomical imaging one does not have theluxury of being able to modify the object as in crystallogra-phy, Rogers9 4 has pointed out that, if the field contains avariable star, then there is an automatic modification in theobject. One can then apply processing similar to that inisomorphous replacement to restrict the possible phase val-ues. Let the image be given by
f(x, t) = a(t) 6(x) + g(x), (74)
where a(t) denotes the time-dependent amplitude of thevariable star and g(x) the remainder of the image. If mea-surements are made at two times, t, and t2 , in the cycle of thevariable star (maximum and minimum brightness) and theautocorrelations calculated and subtracted, then
A(x, t1) - A(x, t2) = [a 2(tl) - a(t 2)]6(x)
+ [a(tl) - a(t2 )][g(x) + g*((-x)] . (75)
This allows the image plus its inverse to be reconstructed, aconsiderable simplification over the autocorrelation. Thisis a form of speckle holography in which the autocorrelationterm g(x) E0 g(x) is subtracted out, and the components g(x)and g*(-x) are then distinct under less restrictive separa-tion conditions.95 This situation is analogous to SIR, inwhich the twofold ambiguity in the phase corresponds to thesuperposition of the image and its inverse.
Another astronomical technique that makes use of partic-ular properties of the object is differential speckle interfer-ometry, in which spectral variations across the object areused to obtain subdiffraction-limited resolution.96 97
Potential Crossdisciplinary ApplicationsThose working in a variety of imaging areas may see applica-tions of some of the crystallographic algorithms described inthis review to specific problems. I will therefore only out-line here a few general areas in which applications of cross-disciplinary techniques may be useful.
The success of direct methods in crystallography indicatesthat it may be fruitful to explore adaptations to reconstruct-ing general images (in astronomy, for example) that consistof sharp, isolated features. Modifications that incorporate
R. P. Millane
Vol. 7, No. 3/March 1990/J. Opt. Soc. Am. A 409
the higher sampling density in imaging problems into thesemethods should further increase their power. It may also beuseful to explore weighting schemes along the lines of thosedescribed in Section 6 to treat errors in the data in an opti-mum way. This could lead to an increase in the convergencerate of iterative algorithms.
On the crystallographic side, the use of Fienup's algo-rithms that incorporate negative feedback should be ex-plored in density modification. This may assist conver-gence in difficult cases when there are minimal constraints(noncrystallographic symmetry, for example) in real space.
9. CONCLUDING REMARKS
Although crystallographic and optical phase problems havemany characteristics in common, the presence of a crystal-line lattice and the ability to modify the specimen in crystal-lography have led to the development of distinct techniquesfor phase retrieval. However, as has been shown here, de-spite these differences there are a number of commonalitiesin techniques. There is a continual need for investigators inone field to monitor advances in the other in case theseprompt new applications.
Recent uniqueness results in optical phase retrieval aresignificant in that they lend confidence to results obtainedfrom empirically inspired algorithms. More research isneeded to understand uniqueness properties of crystallo-graphic phase problems, however. The effects of atomicityand positivity on uniqueness or well-posedness in particularare not well understood. Iterative algorithms are widelyapplicable and can accommodate a variety of types of apriori information but are computationally intensive, andone always has to be concerned about convergence. If all theconstraints could be mapped into one (image or Fourier)space, substantial computational savings could obviously bemade. Direct methods in crystallography and algorithmsbased on zero sheets in optics do this, but more work isneeded to make the latter less noise sensitive. More study isneeded on methods of this type in general. It is to be expect-ed that methods will be developed (as in speckle imaging)that take advantage of the special characteristics of particu-lar problems leading to powerful, but restricted, algorithms.It is interesting that algorithms for general (less con-strained) problems in both disciplines are iterative, whereasthose that apply to more-restricted problems, again in bothdisciplines, involve similar bootstrapping procedures (thatare noniterative) from a small initial phase set.
ACKNOWLEDGMENTS
My interest in phase retrieval has come about through inter-actions with many people. I am particularly grateful toRichard Bates of the University of Canterbury, New Zea-land, through my association with whom I first became in-terested in the phase problem, as well as Richard Fright andRichard Lane with whom I had numerous discussions. Ialso benefitted from many discussions with members (pastand present) of the molecular structure group at PurdueUniversity and with other members of the crystallographicand fiber diffraction communities, including David Sayre.The reviewers offered many suggestions that substantiallyimproved an earlier version of this paper. I am grateful to
Jim Fienup for encouraging me to prepare this review for thefeature issue of the Journal of the Optical Society of Ameri-ca A. Finally, I thank the National Science Foundation forsupport (contract DMB-8606942), Deb Zerth for word pro-cessing, and Mark O'Neil for preparing some of the figures.
REFERENCES
1. R. H. T. Bates and M. J. McDonnell, Image Restoration andReconstruction (Oxford U. Press, Oxford, 1986).
2. E. L. O'Neill and A. Walther, "The question of phase in imageformation," Opt. Acta 10, 33-40 (1963).
3. A. Walther, "The question of phase retrieval in optics," Opt.Acta 10, 41-49 (1963).
4. Y. M. Bruck and L. G. Sodin, "On the ambiguity of the imagereconstruction problem," Opt. Commun. 30, 304-308 (1979).
5. J. R. Fienup, "Reconstruction of an object from the modulus ofits Fourier transform," Opt. Lett. 3, 27-29 (1978).
6. R. H. T. Bates, "Fourier phase problems are uniquely solvablein more than one dimension. I: Underlying theory," Optik 61,247-262 (1982).
7. R. H. T. Bates, "Uniqueness of solutions to two-dimensionalFourier phase problems of localized and positive images," Com-put. Vision Graph. Image Process. 25, 205-217 (1984).
8. R. Barakat and G. Newsam, "Necessary conditions for a uniquesolution to two-dimensional phase recovery," J. Math. Phys. 25,3190-3193 (1984).
9. R. G. Lane, W. R. Fright, and R. H. T. Bates, "Direct phaseretrieval," IEEE Trans. Acoust. Speech Signal Process. ASSP-35, 520-525 (1987).
10. D. Izraelevitz and J. S. Lim, "A new direct algorithm for imagereconstruction from Fourier transform magnitude," IEEETrans. Acoust. Speech Signal Process. ASSP-35, 511-519(1987).
11. M. H. Hayes, "The reconstruction of a multidimensional se-quence from the phase or magnitude of its Fourier transform,"IEEE Trans. Acoust. Speech Signal Process. ASSP-30, 140-154(1982).
12. J. L. C. Sanz and T. S. Huang, "On the stability and sensitivityof multidimensional signal reconstruction from Fourier trans-form magnitude," IEEE Trans. Acoust. Speech Signal Process.ASSP-30, 997-1004 (1985).
13. R. G. Lane and R. H. T. Bates, "Automatic multidimensionaldeconvolution," J. Opt. Soc. Am. A 4, 180-188 (1987).
14. J. R. Fienup, "Phase retrieval algorithms: a comparison,"Appl. Opt. 21, 2758-2769 (1982).
15. R. W. Gerchberg and W. 0. Saxton, "A practical algorithm forthe determination of phase from image and diffraction planepictures," Optik 35, 237-246 (1972).
16. R. H. T. Bates and W. R. Fright, "Composite two-dimensionalphase restoration procedure," J. Opt. Soc. Am. 73, 358-365(1983).
17. R. H. T. Bates and D. Mnyama, "The status of practical Fourierphase retrieval," in Advances in Electronics and ElectronPhysics, P. W. Hawkes, ed. (Academic, New York, 1986), Vol.67, pp. 1-64.
18. J. R. Fienup and C. C. Wackerman, "Phase-retrieval stagnationproblems and solutions," J. Opt. Soc. Am. A 3, 1897-1907(1986).
19. A. Levi and H. Stark, "Restoration from phase and magnitudeby generalized projections," in Image Recovery: Theory andApplications, H. Stark, ed. (Academic, New York, 1987), pp.277-320.
20. R. G. Lane, "Recovery of complex images from Fourier magni-tude," Opt. Commun. 63, 6-10 (1987).
21. J. R. Fienup, "Reconstruction of a complex-valued object fromthe modulus at its Fourier transform using a support con-straint," J. Opt. Soc. Am. A 4, 118-123 (1987).
22. R. Nityananda and R. Narayan, "Maximum entropy image re-construction-a practical non-information-theoretic ap-proach," J. Astrophys. Astron. 3, 419-450 (1982).
23. B. R. Frieden, "Unified theory for estimating frequency-of-occurence laws and optical objects," J. Opt. Soc. Am. 73, 927-938 (1983).
R. P. Millane
410 J. Opt. Soc. Am. A/Vol. 7, No. 3/March 1990
24. X. Zhuang, E. Ostevold, and R. M. Haralick, "The principle ofmaximum entropy in image recovery," in Image Recovery:Theory and Application, H. Stark, ed. (Academic, New York,1987), pp. 157-193.
25. R. H. T. Bates, "Astronomical speckle imaging," Phys. Rep. 90,203-297 (1982).
26. J. C. Dainty and J. R. Fienup, "Phase retrieval and image recon-struction for astronomy," in Image Recovery: Theory and Ap-plication, H. Stark, ed. (Academic, New York, 1987), pp. 231-275.
27. A. Labeyrie, "Attainment of diffraction limited resolution inlarge telescopes by Fourier analyzing speckle patterns in starimages," Astron. Astrophys. 6, 85-87 (1970).
28. R. H. T. Bates and P. T. Gough, "Speckle interferometry givesholograms of multiple star systems," Astron. Astrophys. 22,319-320 (1973).
29. C. Y. C. Liu and A. W. Lohmann, "High resolution image forma-tion through the turbulent atmosphere," Opt. Commun. 8,372-377 (1973).
30. K. T. Knox and B. J. Thompson, "Recovery of images fromatmospherically degraded short-exposure photographs," As-trophys. J. Lett. 193, L45-L48 (1974).
31. B. R. Hunt, "Matrix formulation of the reconstruction of phasevalues from phase differences,' J. Opt. Soc. Am. 69, 393-399(1979).
32. A. C. S. Readhead and P. N. Wilkinson, "The mapping of com-pact radio sources from VLBI data," Astrophys. J. 223, 25-36(1978).
33. C. R. Lynds, S. P. Worden, and J. W. Harvey, "Digital imagereconstruction applied to Alpha Orionis," Astrophys. J. 207,174-180 (1976).
34. R. H. T. Bates and F. M. Cady, "Towards true imaging bywideband speckle interferometry," Opt. Commun. 32, 365-369(1980).
35. G. Weigelt and B. Wirnitzer, "Image reconstruction by thespeckle masking method," Opt. Lett. 8, 389-391 (1983).
36. A. W. Lohmann, G. Weigelt, and B. Wirnitzer, "Speckle mask-ing in astronomy: triple correlation theory and applications,"Appl. Opt. 22, 4028-4037 (1983).
37. R. H. T. Bates, "Aspects of the Erlangen-bispectrum," Optik 76,23-26 (1987).
38. G. H. Stout and L. H. Jensen, X-Ray Structure Determination(Wiley, New York, 1989).
39. D. Sayre, "Some implications of a theorem due to Shannon,"Acta Crystallogr. 5, 843 (1952).
40. C. Giacovazzo, Direct Methods in Crystallography (Academic,New York, 1980).
41. M. M. Woolfson, "Direct methods-from birth to maturity,"Acta Crystallogr. A43, 593-612 (1987).
42. D. Harker and J. S. Kasper, "Phases of Fourier coefficientsdirectly from crystal diffraction data," Acta Crystallogr. 1, 70-75 (1948).
43. J. Karle and H. Hauptman, "The phases and magnitudes of thestructure factors," Acta Crystallogr. 3, 181-187 (1950).
44. D. Sayre, "The squaring method: a new method for phasedetermination," Acta Crystallogr. 5, 60-65 (1952).
45. W. Cochran, "Relations between the phases of structure fac-tors," Acta Crystallogr. 8, 473-478 (1955).
46. J. Karle and H. Hauptman, "A theory of phase determinationfor the four types of non-centrosymmetric space groups 1P222,2P22, 3P12, 3P22," Acta Crystallogr. 9, 635-651 (1956).
47. I. L. Karle and J. Karle, "An application of the symbolic addi-tion method to the structure of L-arginine dihydrate," ActaCrystallogr. 17,835-841 (1964).
48. G. Germain, P. Main, and M. M. Woolfson, "On the applicationof phase relationships to complex structures. II. Getting agood start," Acta Crystallogr. B26, 274-285 (1970).
49. S. E. Hull and M. J. Irwin, "On the application of phase relation-ships to complex structures. XIV. The additional use of sta-tistical information in tangent-formula refinement," Acta Crys-tallogr. A34, 863-870 (1978).
50. A. Fortier and H. Hauptman, "Sextets in P1: the joint proba-bility distribution of thirty-one structure factors," Acta Crys-tallogr. A33, 694-696 (1977).
51. T. Debaerdemaeker, C. Tate, and M. M. Woolfson, "On theapplication of phase relationships to complex structures.
XXIV. The Sayre tangent formula," Acta Crystallogr. A41,286-290 (1985).
52. G. Bricogne, "Maximum entropy and the foundations of directmethods," Acta Crystallogr. A40, 410-445 (1984).
53. G. Tsoucaris, "A new method for phase determination. The'maximum determinant rule,"' Acta Crystallogr. A26, 492-499(1970).
54. T. L. Blundell and L. N. Johnson, Protein Crystallography(Academic, New York, 1978).
55. D. W. Green, V. M. Ingram, and M. F. Perutz, "The structure ofhaemoglobin IV. Sign determination by the isomorphous re-placement method," Proc. R. Soc. London Ser. A 255, 287-307(1954).
56. D. M. Blow, "The structure of haemoglobin VII. Determina-tion of phase angles in the non-centrosymmetric [100] zone,"Proc. R. Soc. London Ser. A 247, 302-336 (1958).
57. W. A. Hendrickson and J. H. Konnert, "Incorporation of stereo-chemical information into crystallographic refinement," inComputing in Crystallography, R. Diamond, S. Ramaseshan,and K. Venkatesan, eds. (Indian Academy of Science, Banga-lore, 1980), pp. 13.01-13.26.
58. D. M. Blow and F. H. C. Crick, "The treatment of errors in theisomorphous replacement method," Acta Crystallogr. 12, 794-802 (1959).
59. W. A. Hendrickson and E. E. Lattman, "Representation ofphase probability distributions for simplified combination ofindependent phase information," Acta Crystallogr. B26, 136-143 (1970).
60. W. A. Hendrickson, J. L. Smith, and S. Sheriff, "Direct phasedetermination based on anomalous scattering," Meth. Enzy-mol. 115, 41-55 (1985).
61. B. W. Mathews, "The extension of the isomorphous replace-ment method to include anomalous scattering measurements,"Acta Crystallogr. 20, 82-86 (1966).
62. P. Argos and M. G. Rossman, "Molecular replacement method,"in Theory and Practice of Direct Methods in Crystallography,M. F. C. Ladd and R. A. Palmer, eds. (Plenum, New York, 1980),pp. 361-417.
63. M. G. Rossmann and D. M. Blow, "The determination of phasesby the conditions of non-crystallographic symmetry," ActaCrystallogr. 16, 39-44 (1963).
64. P. Main and M. G. Rossmann, "Relationships among structurefactors due to identical molecules in different crystallographicenvironments," Acta Crystallogr. 21, 67-72 (1966).
65. M. G. Rossmann and D. M. Blow, "The detection of sub-unitswithin the crystallographic asymmetric unit," Acta Crystallogr.15, 24-31 (1962).
66. R. A. Crowther, "Fast rotation function," in The MdlecularReplacement Method, M. G. Rossmann, ed. (Gordon & Breach,New York, 1972), pp. 173-178.
67. G. Bricogne, "Geometric sources of redundancy in intensitydata and their use for phase determination," Acta Crystallogr.A30, 395-405 (1974).
68. A. K. Livesey and J. Skilling, "Maximum entropy theory," ActaCrystallogr. A41, 113-122 (1985).
69. S. W. Wilkins and D. Stuart, "Statistical geometry. IV. Maxi-mum-entropy-based extension of multiple isomorphouslyphased x-ray data to 4 A resolution for a-lactalbumin," ActaCrystallogr. A42, 197-202 (1986).
70. R. P. Millane, "Structure determination by x-ray fiber diffrac-tion," in Crystallographic Computing 4: Techniques and NewTechnologies, N. W. Isaacs and M. R. Taylor, eds. (Oxford U.Press, Oxford, 1988), pp. 169-186.
71. L. Makowski, "The use of continuous diffraction data as a phaseconstraint. II. Application to fiber diffraction data," J. Appl.Crystallogr. 15, 546-557 (1982).
72. K. C. Holmes, G. J. Stubbs, E. Mandelkow, and U. Gallwitz,"Structure of tobacco mosaic virus at 6.7 A resolution," Nature(London) 254, 192-196 (1975).
73. G. J. Stubbs and R. Diamond, "The phase problem for cylindri-cally averaged diffraction patterns. Solution by isomorphousreplacement and application to tobacco mosaic virus," ActaCrystallogr. A31, 709-718 (1975).
74. G. Stubbs and L. Makowski, "Coordinated use of isomorphousreplacement and layer-line splitting in the phasing of fiber dif-fraction data," Acta Crystallogr. A38, 417-425 (1982).
R. P. Millane
Vol. 7, No. 3/March 1990/J. Opt. Soc. Am. A 411
75. K. Namba, R Pattanayek, and G. Stubbs, "Visualization ofprotein-nucleic acid interactions in a virus: refined structure ofintact tobacco mosaic virus at 2.9 A resolution by x-ray fiberdiffraction," J. Mol. Biol. 208, 307-325 (1989).
76. K. Namba and G. Stubbs, "Isomorphous replacement in fiberdiffraction using limited numbers of heavy-atom derivatives,"Acta Crystallogr. A43, 64-69 (1987).
77. K. Namba and G. Stubbs, "Difference Fourier synthesis in fiberdiffraction," Acta Crystallogr. A43, 533-539 (1987).
78. L. Makowski, D. L. D. Caspar, and D. A. Marvin, "Filamentousbacteriophage Pfl structure determined at 7 A resolution byrefinement of models for the a-helical subunit," J. Mol. Biol.140, 149-181 (1980).
79. S. Arnott, "Twenty years hard labor as a fiber diffractionist," inFiber Diffraction Methods, A. D. French and K. H. Gardner,eds., ACS Symp. Ser. 131, 1-30 (1980).
80. P. J. C. Smith and S. Arnott, "LALS: a linked-atom least-squares reciprocal space refinement system incorporating ste-reochemical restraints to supplement sparse diffraction data,"Acta Crystallogr. A34, 3-11 (1978).
81. R. P. Millane, "X-ray fiber diffraction studies of polysaccharidestructures," in Computer Modeling of Carbohydrates, A. D.French and J. W. Brady, eds., ACS Symp. Ser. (to be published).
82. R. P. Millane, A. K. Mitra, and S. Arnott, "Chondroitin 4-sulfate: comparison of the structures of the potassium andsodium salts," J. Mol. Biol. 169, 903-920 (1983).
83. D. A. Marvin, R. K. Bryan, and C. Nave, "Pfl Inovirus. Elec-tron density distribution calculated by a maximum entropyalgorithm from native fiber diffraction data to 3 A resolutionand single isomorphous replacement data to 5 A resolution," J.Mol. Biol. 193, 315-343 (1987).
84. R. P. Millane, "Redundancy in multi-dimensional phase re-trieval and blind deconvolution," submitted to IEEE Trans.Acoust. Speech Signal Process.
85. R. P. Millane, "The effect of structural redundancy on unique-ness of the macromolecular crystallographic phase problem,"submitted to Acta Crystallogr. A.
86. E. Arnold and M. G. Rossman, "Effect of errors, redundancy,and solvent content in the molecular replacement procedure forthe structure determination of biological macromolecules,"Proc. Natl. Acad. Sci. USA 83, 5489-5493 (1986).
87. R. P. Millane, "Positivity and uniqueness in phase retrieval andblind deconvolution," submitted to Opt. Commun.
88. R. P. Millane, R. H. T. Bates, W. R. Fright, and W. A. Norton,"Towards direct phase retrieval in macromolecular crystallog-raphy," Biophys. J. 49, 60-62 (1986).
89. J. R. Fienup and A. M. Kowalczyk, "Phase retrieval for a com-plex-valued object using a low resolution image," in Digest ofTopical Meeting on Signal Recovery and Synthesis III (OpticalSociety of America, Washington, D.C., 1989), pp. 142-145.
90. B. C. McCallum and R. H. T. Bates, "Towards a strategy forautomatic phase retrieval from noisy Fourier intensities," J.Mod. Opt. 36, 619-648 (1989).
91. J. E. Baldwin and P. J. Warner, "Phaseless aperture synthesis,"Mon. Not. R. Astron. Soc. 182, 411-422 (1978).
92. J. W. Cocke, "The Cauchy/Schwarz inequality as a constraint inpower spectrum/autocorrelation analysis and image reconstruc-tion," in Speckle, H. H. Arsenault, ed., Proc. Soc. Photo-Opt.Instrum. Eng. 556, 46-49 (1985).
93. D. J. Granrath, "A positivity-based constraint on the phasevariance of bispectral coefficients," Opt. Commun. 67, 107-111(1988).
94. G. L. Rogers, "The stellar interferometry of a star cluster with aprominent variable," Opt. Commun. 30, 1-4 (1979).
95. R. P. Millane, "Speckle holography with a variable reference,"submitted to Appl. Opt.
96. J. M. Beckers, "Differential speckle interferometry," Opt. Acta29, 361-362 (1982).
97. C. Aime, S. Kadiri, F. Martin, R. Petrov, and G. Ricort, "Mea-surement of submilliarcsecond speckle displacements using across spectrum analysis technique. Test on atmospheric dis-persion," Astron. Astrophys. 134, 354-359 (1984).
R. P. Millane