Embed Size (px)
Citation preview
GLOBE® 2014 pH Protocol - 1 Hydrosphere
Learning Activities
Appendix
Welcom
eIntroduction
ProtocolspH Protocol
PurposeTo measure the pH of water
OverviewStudents will use either a pH meter or pH paper to measure the pH of water. If using the pH meter, the meter needs to be calibrated with buffer solutions that have pH values of 4, 7, and 10.
Student OutcomesStudents will learn to,
- use either a pH meter or pH paper;- understand the differences among
acid, basic and neutral pH values;- examine reasons for changes in the
pH of a water body;- communicate project results with other
GLOBE schools;- collaborate with other GLOBE
schools (within your country or other countries); and
- share observations by submitting data to the GLOBE science data archive.
Science ConceptsEarth and Space Science
Earth materials are solid rocks, soils, water and the atmosphere.
Water is a solvent.Each element moves among different
reservoirs (biosphere, lithosphere, atmosphere, hydrosphere).
Physical SciencesObjects have observable properties.
Life SciencesOrganisms can only survive in
environments where their needs are met.
Earth has many different environments that support different combinations of organisms.
Organisms change the environment in which they live.
Humans can change natural environments.
All organisms must be able to obtain and use resources while living in a
constantly changing environment.
Scientific Inquiry AbilitiesUse a chemical test strip or pH meter to
measure pH.Identify answerable questions.Design and conduct scientific
investigations.Use appropriate mathematics to analyze
data.Develop descriptions and explanations
using evidence.Recognize and analyze alternative
explanations.Communicate procedures and
explanations.Time10 minutes
LevelAll
FrequencyWeekly
Materials and ToolsFor measuring pH with pH paper: - Hydrosphere Investigation Data
Sheet - Using pH Paper (Electrical
Conductivity Greater Than 200mS/cm) Field Guide OR Using pH Paper (Electrical Conductivity Less Than 200mS/cm) Field Guide
- pH paper - 50-mL or 100-mL beaker - Latex glovesFor measuring pH with the pH meter: - Hydrosphere Investigation Data
Sheet - Using a pH Meter (Electrical
Conductivity Greater Than 200mS/cm) Field Guide OR Using a pH Meter (Electrical Conductivity Less Than 200mS/cm) Field Guide
- pH meter - Distilled water - Clean paper towel or soft tissue
GLOBE® 2014 pH Protocol - 2 Hydrosphere
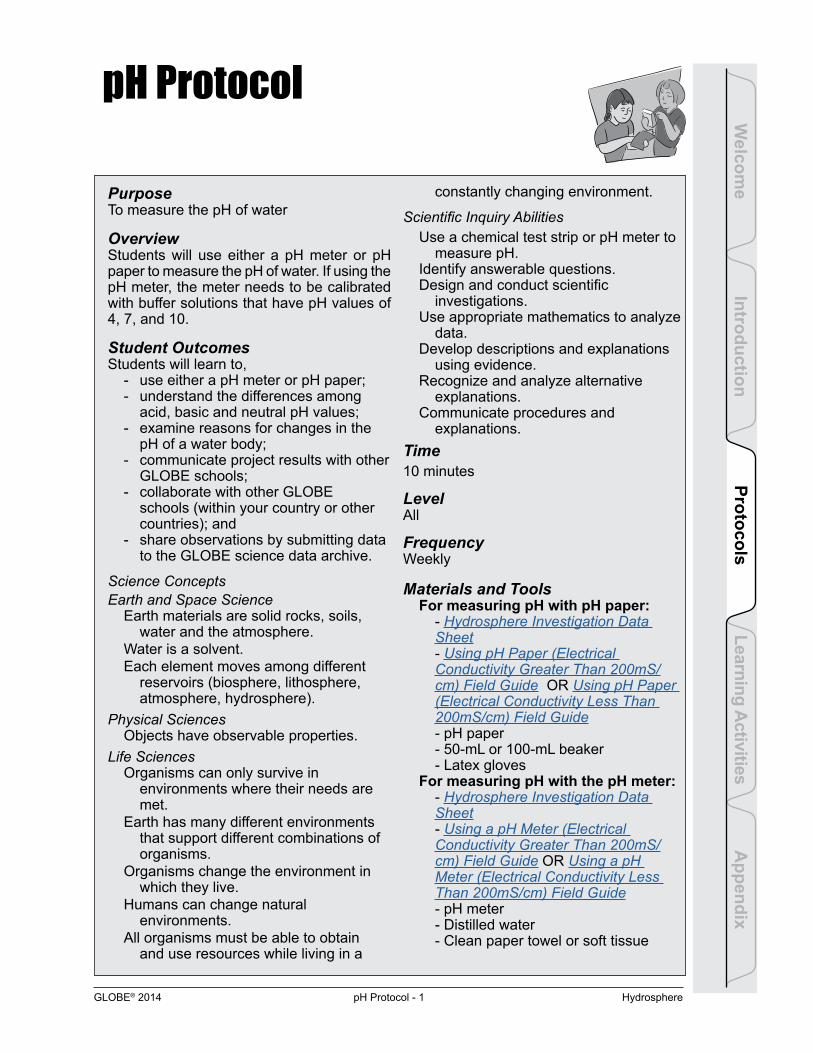
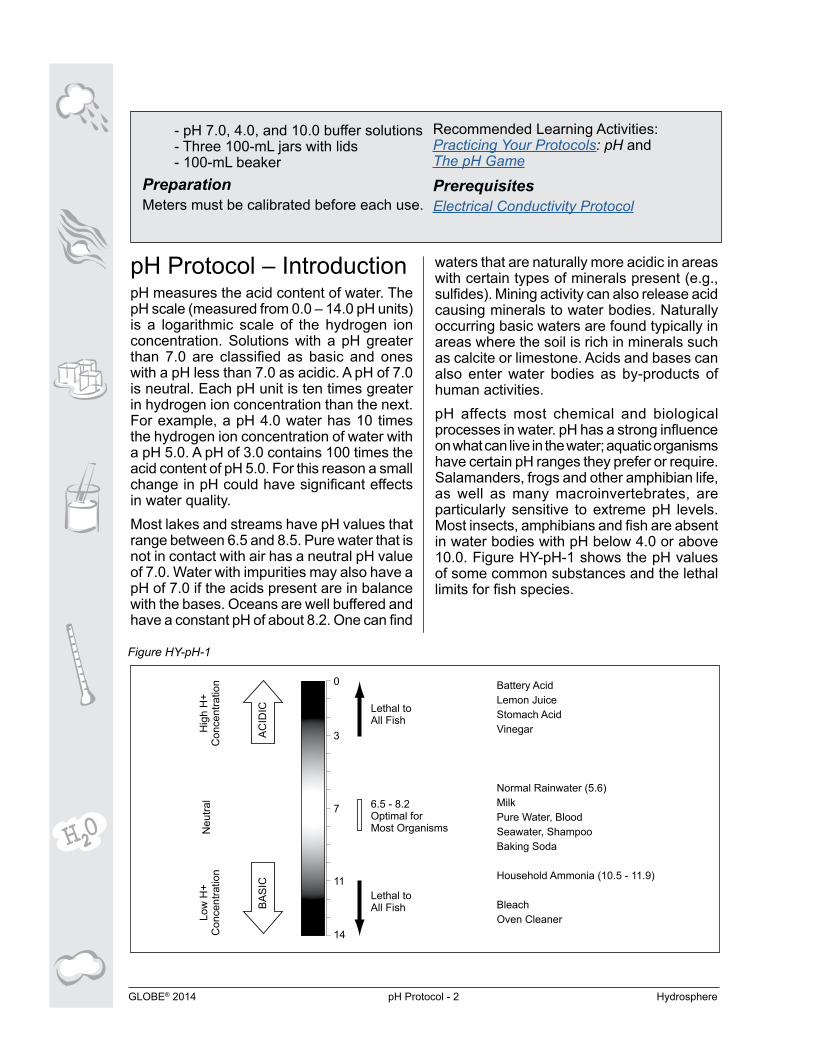
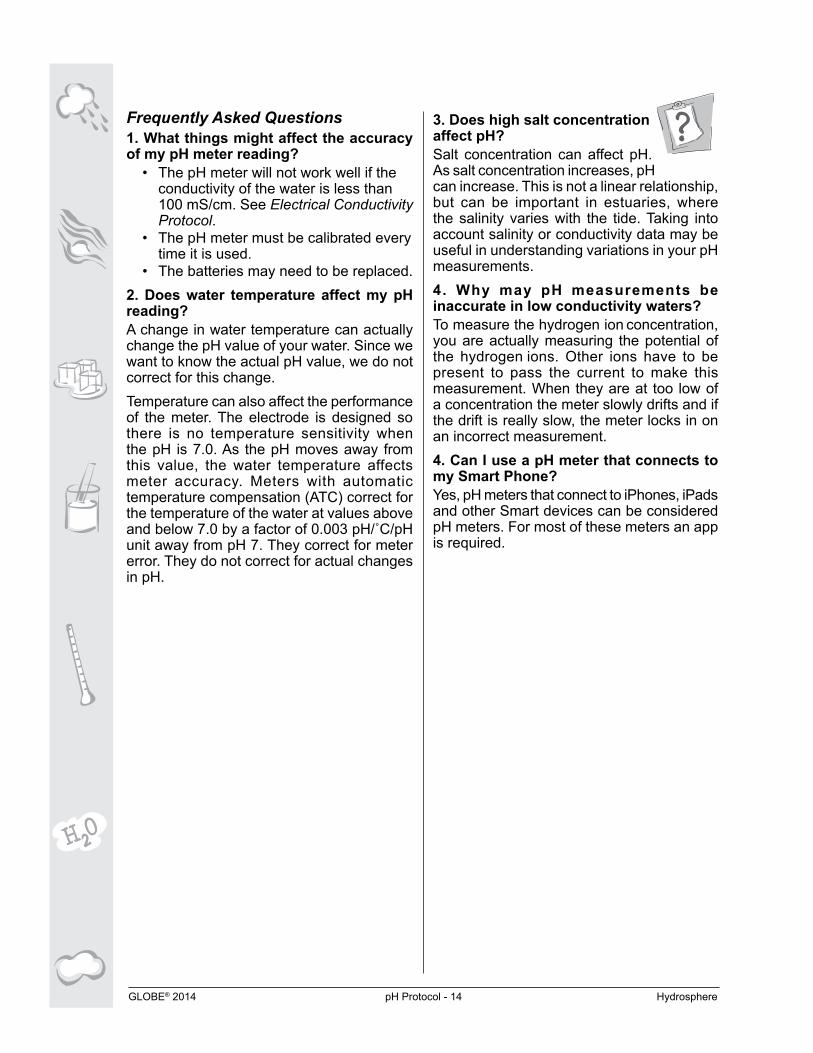
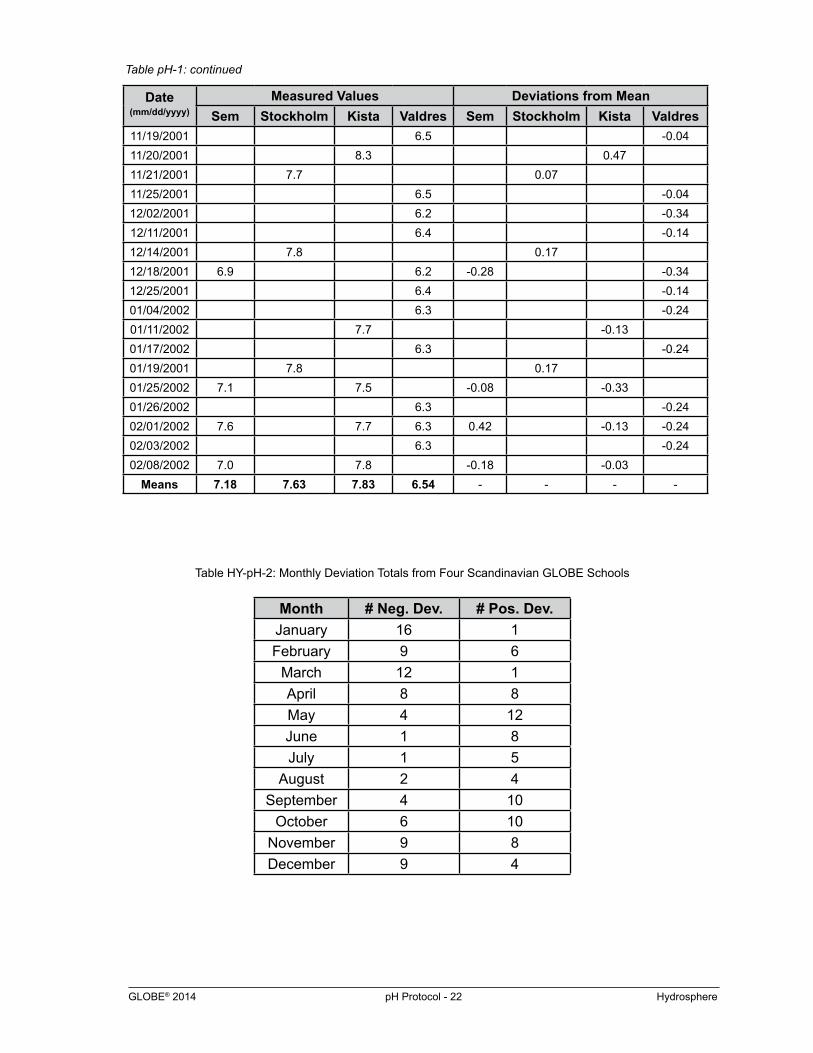
pH Protocol – IntroductionpH measures the acid content of water. The pH scale (measured from 0.0 – 14.0 pH units) is a logarithmic scale of the hydrogen ion concentration. Solutions with a pH greater than 7.0 are classified as basic and ones with a pH less than 7.0 as acidic. A pH of 7.0 is neutral. Each pH unit is ten times greater in hydrogen ion concentration than the next. For example, a pH 4.0 water has 10 times the hydrogen ion concentration of water with a pH 5.0. A pH of 3.0 contains 100 times the acid content of pH 5.0. For this reason a small change in pH could have significant effects in water quality.Most lakes and streams have pH values that range between 6.5 and 8.5. Pure water that is not in contact with air has a neutral pH value of 7.0. Water with impurities may also have a pH of 7.0 if the acids present are in balance with the bases. Oceans are well buffered and have a constant pH of about 8.2. One can find
0
3
7
11
14
Lethal toAll Fish
Battery AcidLemon JuiceStomach AcidVinegar
Normal Rainwater (5.6)MilkPure Water, BloodSeawater, ShampooBaking Soda
Household Ammonia (10.5 - 11.9)
BleachOven Cleaner
6.5 - 8.2Optimal forMost Organisms
Lethal toAll Fish
Low
H+
Con
cent
ratio
nH
igh
H+
Con
cent
ratio
n
AC
IDIC
BA
SIC
Neu
tral
Figure HY-pH-1
- pH 7.0, 4.0, and 10.0 buffer solutions - Three 100-mL jars with lids - 100-mL beaker
PreparationMeters must be calibrated before each use.
Recommended Learning Activities: Practicing Your Protocols: pH and The pH Game
PrerequisitesElectrical Conductivity Protocol
waters that are naturally more acidic in areas with certain types of minerals present (e.g., sulfides). Mining activity can also release acid causing minerals to water bodies. Naturally occurring basic waters are found typically in areas where the soil is rich in minerals such as calcite or limestone. Acids and bases can also enter water bodies as by-products of human activities.pH affects most chemical and biological processes in water. pH has a strong influence on what can live in the water; aquatic organisms have certain pH ranges they prefer or require. Salamanders, frogs and other amphibian life, as well as many macroinvertebrates, are particularly sensitive to extreme pH levels. Most insects, amphibians and fish are absent in water bodies with pH below 4.0 or above 10.0. Figure HY-pH-1 shows the pH values of some common substances and the lethal limits for fish species.
GLOBE® 2014 pH Protocol - 3 Hydrosphere
Learning Activities
Appendix
Welcom
eIntroduction
Protocols
Teacher SupportSpecial Note on Electrical ConductivityThe accuracy of pH papers and pH meters depends on the electrical conductivity of the water. The electrical conductivity of the water needs to be at least 200 mS/cm for the paper and pH meter to measure accurately. Oceans and brackish waters have conductivity values much higher than 200 mS/cm. If you are not sure if the fresh water at your Hydrosphere Study Site has a conductivity value high enough for the measurement technique (paper or meter), measure the electrical conductivity before taking your pH measurements. After you know the electrical conductivity value of the water, use the appropriate pH field guide. There are four field guides to choose from:
• Using pH paper with water that has an electrical conductivity greater than 200 mS/cm.
• Using pH paper with water that has an electrical conductivity less than 200 mS/cm.
• Using a pH meter with water that has an electrical conductivity greater than 200 mS/cm.
• Using a pH meter with water that has an electrical conductivity less than 200 mS/cm.
If you do not have an electrical conductivity meter and you would like to measure the pH, you run the risk of the data not being accurate, and so it is highly recommended that you take electrical conductivity measurements. If your water has a low transparency (lots of dissolved solids), it is likely that the water has a conductivity value greater than 200 mS/cm. If you are close to the source of the water (for example, snow melt or high elevations), then you can add a small amount of salt as indicated in the pH paper and meter field guides for conductivity values less than 200 mS/cm.
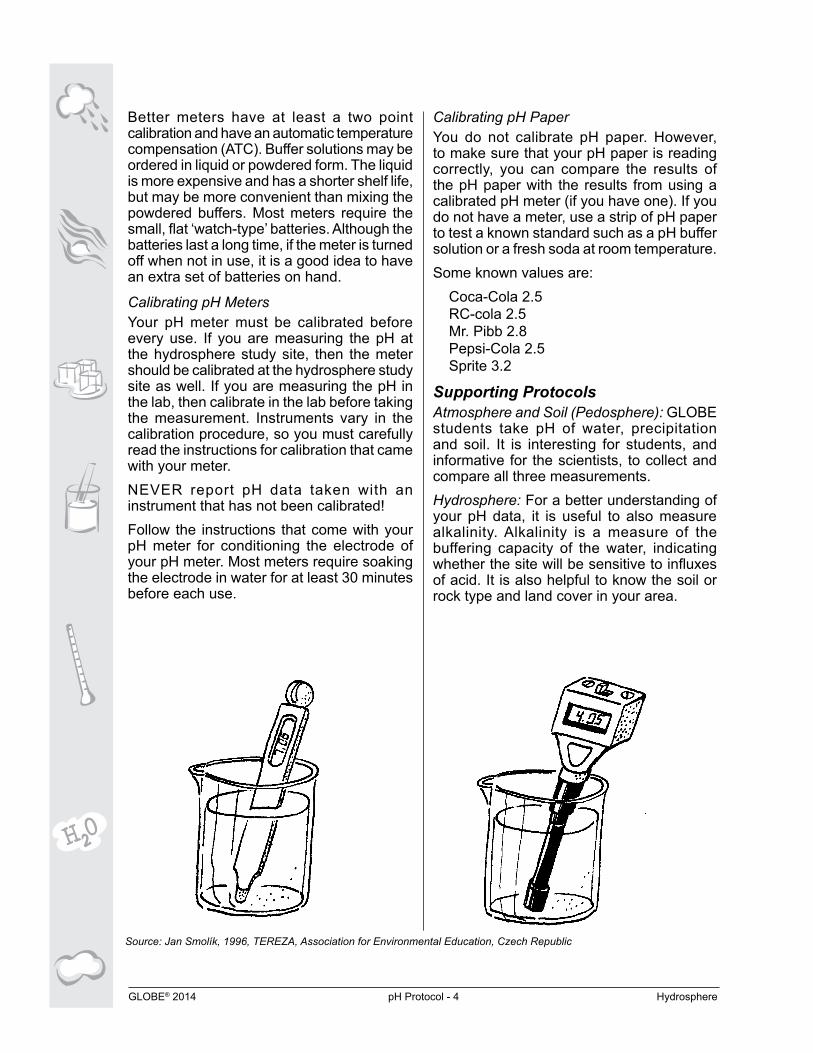
Advance PreparationYounger students may have difficulty with the concept of acid and bases. But they will be familiar with the characteristic taste of acids such as lemon juice and vinegar and of bases such as milk and soap. Use The pH Game
Learning Activity to introduce your students to the concept of pH. To insure accuracy of the pH data in fresh water, it is necessary to take an electrical conductivity measurement beforehand. Have your students review the Electrical Conductivity Protocol.Some meters require preparation before they are used
Measurement ProcedureThe Field Guide you use depends on the electrical conductivity of water and whether you are using a pH meter or pH paper. If you know that the water at your hydrosphere study site has a high electrical conductivity, then it is not necessary to measure the electrical conductivity before the pH. If you are not sure, do the electrical conductivity measurement before the pH measurement. You may need to take a sample of water back to the lab to get the temperature of the water between 10˚C and 20˚C (see Electrical Conductivity Protocol).
Paper vs. Meter: Which instrument should you use?There are two methods of measuring pH in GLOBE. The advantages and disadvantages of the methods are,pH paper
Advantages- easy for young children to use- does not need calibrationDisadvantages- resolution is not as good as meters
(reads in 0.5 pH unit increments) - it is not temperature compensated.
If you are buying pH paper for use in collecting GLOBE data, pay special attention to the quality of paper you choose. pH meter
Advantages- measures to 0.1 pH units.- may be temperature compensatedNote: Avoid using meters with a one
point calibration.Disadvantages- the meter must be calibrated with buffer
solutions before each use.- more expensive than pH paper.- performance deteriorates over time.
GLOBE® 2014 pH Protocol - 4 Hydrosphere
Better meters have at least a two point calibration and have an automatic temperature compensation (ATC). Buffer solutions may be ordered in liquid or powdered form. The liquid is more expensive and has a shorter shelf life, but may be more convenient than mixing the powdered buffers. Most meters require the small, flat ‘watch-type’ batteries. Although the batteries last a long time, if the meter is turned off when not in use, it is a good idea to have an extra set of batteries on hand.
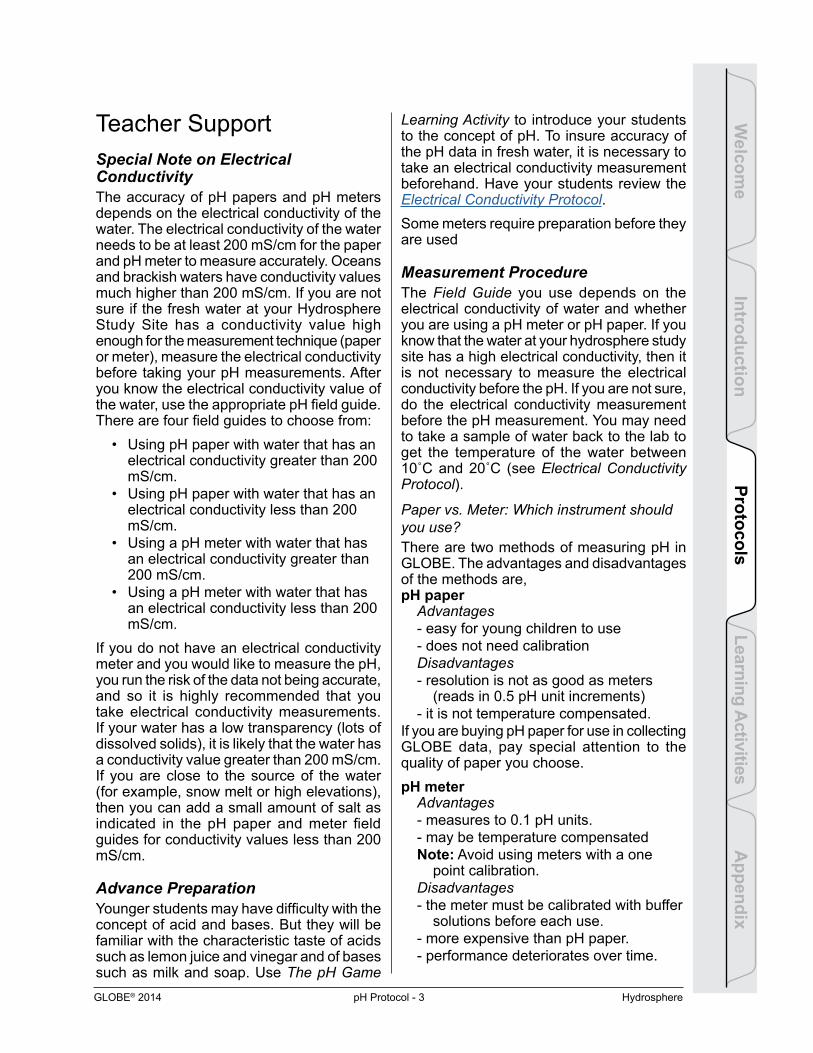
Calibrating pH MetersYour pH meter must be calibrated before every use. If you are measuring the pH at the hydrosphere study site, then the meter should be calibrated at the hydrosphere study site as well. If you are measuring the pH in the lab, then calibrate in the lab before taking the measurement. Instruments vary in the calibration procedure, so you must carefully read the instructions for calibration that came with your meter.NEVER report pH data taken with an instrument that has not been calibrated!Follow the instructions that come with your pH meter for conditioning the electrode of your pH meter. Most meters require soaking the electrode in water for at least 30 minutes before each use.
Calibrating pH PaperYou do not calibrate pH paper. However, to make sure that your pH paper is reading correctly, you can compare the results of the pH paper with the results from using a calibrated pH meter (if you have one). If you do not have a meter, use a strip of pH paper to test a known standard such as a pH buffer solution or a fresh soda at room temperature.Some known values are:
Coca-Cola 2.5RC-cola 2.5Mr. Pibb 2.8Pepsi-Cola 2.5Sprite 3.2
Supporting ProtocolsAtmosphere and Soil (Pedosphere): GLOBE students take pH of water, precipitation and soil. It is interesting for students, and informative for the scientists, to collect and compare all three measurements.Hydrosphere: For a better understanding of your pH data, it is useful to also measure alkalinity. Alkalinity is a measure of the buffering capacity of the water, indicating whether the site will be sensitive to influxes of acid. It is also helpful to know the soil or rock type and land cover in your area.
Source: Jan Smolík, 1996, TEREZA, Association for Environmental Education, Czech Republic
GLOBE® 2014 pH Protocol - 5 Hydrosphere
GLOBE® 2014 pH Protocol - 6 Hydrosphere
Safety Precautions
Students should wear gloves when handling water that may contain potentially harmful substances such as bacteria or industrial waste.
Instrument MaintenancepH paperThe pH paper should be stored in its own box in a dry place. It should not be stored in too hot or wet environments. Discard the paper if it gets wet or damp during storage.
pH meter1. pH meters require meticulous care in
order to maintain their accuracy and lifespan. Consult your manual for maintenance and storage instructions specific to your meter.
2. Make sure to condition your meter according to the manufacturer’s directions but do not store the instrument standing in water.
3. Turn it off when not in use.4. Replace cap after use to protect the
electrode.5. Do not submerge the whole instrument
in water during use. Only the tip of the instrument, where the electrode is located, should be placed under water.
6. Do not drop or handle roughly. Store in a safe place.
7. The meter has started to deteriorate if it will not keep its calibration. Some meters will regain functionality if “shocked” according to manufacturers instructions. If “shocking” doesn’t work, or if you meter cannot be “shocked”, it will need to be replaced.
pH buffer solutions1. Pre-mixed, unused solutions can be
stored for one year as long as they have not been contaminated. Keep them in a tightly capped bottle.
2. Buffer solutions that use a powder mixed with distilled water may be stored for one month in a tightly capped bottle after mixing.
Questions for Further InvestigationWhat changes in your watershed could have an affect on the pH reading at your water site?How do the pH values at your site compare with values from other sites within your watershed?What animals and plants would live in your water at the current pH reading? Are there animals and plants that would not live here?How might your alkalinity measurement help you to understand your pH measurement?How does the pH of your water compare to the pH of the soil and rainfall near your school?
GLOBE® 2014 pH Protocol - 7 Hydrosphere
Using pH Paper (Electrical Conductivity Greater than 200 mS/cm)Field Guide
TaskMeasure the pH of your water sample using pH paper.
What You Need
o Hydrosphere Investigation Data Sheet o Latex gloves
o pH paper o Pen or pencil
o 100-mL beaker
In the Field1. Fill in the top part of your Hydrosphere Investigation Data Sheet.
2. In the pH section of the Data Sheet, check the box next to ‘pH paper’.
3. Put on latex gloves.
4. Rinse the beaker with sample water three times.
5. Fill the beaker halfway with sample water.
6. Follow the instructions that come with your paper for testing the pH of the sample.
7. Record your pH on the Data Sheet as Observer 1.
8. Repeat steps 4-6 using new water samples and new pieces of paper. Record the data on the Data Sheet as Observer 2 and Observer 3.
9. Find the average of the three observations.
10. Check to make sure that each observation is within 1.0 pH units of the average. If they are not within 1.0 units of the average, repeat the measurements. If your measurements are still not within 1.0 pH units of the average, discuss possible problems with your teacher.
11. Discard used pH paper and gloves in a waste container. Rinse the beaker with distilled water.
GLOBE® 2014 pH Protocol - 8 Hydrosphere
Using pH Paper (Electrical Conductivity Less than 200 mS/cm)Field Guide
* A note regarding salt crystals. Crystal of about 0.5 – 2.0 mm in diameter are much easier to work with than the very finely ground “table salt” used is some countries. In North America, the larger salt crystals are often marketed as “sea salt”.
TaskTo use pH paper to measure the pH of your fresh water sample with electrical conductivity values less than 200 mS/cm
What You Needo Hydrosphere Investigation Data Sheet o Clean paper towel or soft tissueo Electrical Conductivity Protocol Field Guide o Latex gloveso Tweezers o pH paper o Salt crystals* or table salt o Stirring rod or spoono Electrical conductivity tester o Thermometero Two 100-mL beaker or cups o Pen or pencil
In the Field1. Fill in the top part of your Hydrosphere Investigation Data Sheet. In the pH section of the
sheet, check the box next to ‘pH paper’.2. Put on latex gloves.3. Rinse tweezers in sample water and dry with paper towel.4. Rinse two beakers or cups with sample water three times.5. Fill one beaker or cup with about 50 mL of sample water6. Using the tweezers, place one crystal of salt in the sample water. (If you do not have salt
crystals, fill this letter O with table salt and pour that into the sample water).7. Stir thoroughly with stirring rod or spoon.8. Measure the electrical conductivity of the treated sample water using the Electrical
Conductivity Protocol. a. If the electrical conductivity is at least 200 mS/cm, record value on Data Sheet. Go to
step 9. b. If the electrical conductivity is still less than 200 mS/cm, go to step 6 and repeat until
you get a value that is at least 200 mS/cm. Record conductivity value on Data Sheet.9. Follow the instructions that come with your paper for testing the pH of the sample.
10. Record your pH on the Data Sheet as Observer 1.11. Repeat steps 3-9 using new water samples and new pieces of paper. Record the data on
the Data Sheet as Observer 2 and Observer 3.12. Find the average of the three observations.13. Check to make sure that each observation is within 1.0 pH units of the average. If they
are not within 1.0 units of the average, repeat the measurements. If your measurements are still not within 1.0 pH units of the average, discuss possible problems with your teacher.
14. Discard used pH paper and gloves in a waste container. Rinse the beaker with distilled water.
GLOBE® 2014 pH Protocol - 9 Hydrosphere
Learning Activities
Appendix
Welcom
eIntroduction
Protocols
Frequently Asked Questions1. Why could I not find a color match with the pH paper?The conductivity of your water might be low (see Electrical Conductivity Protocol). The pH paper takes longer to react with the water if the conductivity is less than 400 microSiemens/cm (mS/cm). If your water has a conductivity of less than 300 mS/cm, some pH paper does not work well. Another reason you may have problems is if your pH paper is old or has not been stored properly.
2. What do I do if the pH seems to be between two color matches on the box?Report the match that is the closest. This is the reason we have three students do the protocol. Taking the average of the three readings gives a more accurate measurement.
GLOBE® 2014 pH Protocol - 10 Hydrosphere
TaskMeasure the pH of your water sample using a pH meter.
What You Need
o Hydrosphere Investigation Data Sheet o Distilled water in wash bottle
o pH meter o Clean paper towel or soft tissueo 100-mL beaker o Latex gloveso 25 mL of pH 7.0 buffer solution in a jar o Pen or pencil with a lid - this jar should be labeled pH 7.0
o 25 mL of pH 4.0 buffer solution in a jar with a lid - this jar should be labeled pH 4.0
o 25 mL of pH 10.0 buffer solution in a jar with a lid - this jar should be labeled pH 10.0 Note: Each jar should have an opening large enough to immerse the pH meter
In the Field1. Fill in the top portion of the Hydrosphere Investigation Data Sheet. Check pH meter as
your instrument.
2. Put on the latex gloves.
3. Remove the cap from the meter that covers the electrode (the glass bulb on the pH meter).
4. Rinse the electrode on the meter and the area around it with distilled water in the wash bottle. Blot the meter dry with a clean paper towel or tissue. Note: Do not rub the electrode or touch it with your fingers.
5. Rinse the electrode with distilled water and blot dry again.
6. Calibrate the pH meter according to the manufacturer’s directions.
7. Rinse a 100-mL beaker three times with sample water.
8. Pour 50 mL of sample water into the 100-mL beaker.
9. Put the electrode part of the meter into the water.
10. Stir once with meter. Do not let the meter touch the bottom or sides of the beaker. Wait for one minute. If the pH meter is still changing numbers, wait another minute.
Using a pH Meter (Electrical Conductivity Greater than 200 mS/cm)Field Guide
GLOBE® 2014 pH Protocol - 11 Hydrosphere
11. Record the pH value on the Data Sheet under Observer 1.
12. Repeat steps 3-10 twice using new water samples. You do NOT need to calibrate the pH meter again. Record conductivity and pH values on Data Sheet as Observer 2 and Observer 3.
13. Check to see if each of the three observations is within 0.2 of the average. If all three are within 0.2, record the average on the Data Sheet. If all three observations are not within 0.2, repeat the measurements.
14. Calculate the average of the three observations and record on the Data Sheet.
15. Rinse the electrode with distilled water and blot dry. Turn off the meter. Put on the cap to protect the electrode.
16. If you cannot get all three measurements within 0.2 of one another, talk to your teacher about possible problems.
Using a pH Meter: (Electrical Conductivity Greater than 200 mS/cm) - Page 2
GLOBE® 2014 pH Protocol - 12 Hydrosphere
TaskTo use a pH meter to measure the pH of your fresh water sample with electrical conductivity values less than 200 mS/cm
What You Needo Hydrosphere Investigation Data Sheet
o Electrical Conductivity Protocol Field Guide o pH meter
o Electrical conductivity tester
o Two 100-mL beaker
o 25 mL of pH 7.0 buffer solution in a jar with a lid - this jar should be labeled “pH 7.0”
o 25 mL of pH 4.0 buffer solution in a jar with a lid - this jar should be labeled “pH 4.0”
o 25 mL of pH 10.0 buffer solution in a jar with a lid - this jar should be labeled “pH 10.0” Note: Each jar should have an opening large enough to immerse the pH meter
In the Field1. Fill in the top part of your Hydrosphere Investigation Data Sheet. In the pH section of
the sheet, check the box next to ‘pH meter’.
2. Put on latex gloves.
3. Rinse tweezers in sample water and dry with paper towel.
4. Rinse two beakers or cups with sample water three times.
5. Fill one beaker or cup with about 100 mL of sample water
6. Using the tweezers, place one crystal of salt in the sample water. (If you do not have salt crystals, fill this letter O with table salt and pour that into the sample water).
7. Stir thoroughly with stirring rod or spoon.
8. Measure the electrical conductivity of the treated sample water using the Electrical Conductivity Protocol.
* A note regarding salt crystals. Crystal of about 0.5 – 2.0 mm in diameter are much easier to work with than the very finely ground “table salt” used is some countries. In North America, the larger salt crystals are often marketed as “sea salt”.
Using a pH Meter (Electrical Conductivity Less than 200 mS/cm)Field Guide
o Standard solution for electrical conductivity tester o Distilled water in wash bottle
o Clean paper towel or soft tissue
o Latex gloves
o Salt crystals* or table salt
o Tweezers
o Stirring rod or spoon
o Thermometer
o Pen or pencil
GLOBE® 2014 pH Protocol - 13 Hydrosphere
a. If the electrical conductivity is at least 200 mS/cm, record value on the Data Sheet. Go to step 9.
b. If the electrical conductivity is still less than 200 mS/cm, go to step 6 and repeat until you get a value that is at least 200 mS/cm.
9. Remove the cap from the meter that covers the electrode (the glass bulb on the pH meter).
10. Rinse the electrode on the meter and the area around it with distilled water from the rinse bottle. Blot the meter dry with a clean paper towel. Note: Do not rub the electrode or touch it with your fingers.
11. Rinse the electrode with distilled water and blot dry again.
12. Calibrate the pH meter according to the manufacturer’s directions.
13. Put the electrode part of the pH meter into the treated sample water.
14. Stir once with meter. Do not let the meter touch the bottom or sides of the beaker. Wait for one minute. If the pH meter is still changing numbers, wait another minute.
15. Record the pH value on the Data Sheet under Observer 1.
16. Repeat steps 3-14 using new water samples. You do NOT need to calibrate the pH meter again. Record conductivity and pH values on Data Sheet as Observer 2 and Observer 3.
17. Check to see if each of the three observations is within 0.2 of the average. If all three are within 0.2, record the average on the Data Sheet. If all three observations are not within 0.2, repeat the measurements.
18. Calculate the average of the three observations and record on the Data Sheet.
19. Rinse the electrode with distilled water and blot dry. Turn off the meter. Put on the cap to protect the electrode.
20. If you cannot get all three measurements within 0.2 of one another, talk to your teacher about possible problems.
Using a pH Meter: (Electrical Conductivity Less than 200 mS/cm) - Page 2
GLOBE® 2014 pH Protocol - 14 Hydrosphere
Frequently Asked Questions1. What things might affect the accuracy of my pH meter reading?
• The pH meter will not work well if the conductivity of the water is less than 100 mS/cm. See Electrical Conductivity Protocol.
• The pH meter must be calibrated every time it is used.
• The batteries may need to be replaced.2. Does water temperature affect my pH reading?A change in water temperature can actually change the pH value of your water. Since we want to know the actual pH value, we do not correct for this change. Temperature can also affect the performance of the meter. The electrode is designed so there is no temperature sensitivity when the pH is 7.0. As the pH moves away from this value, the water temperature affects meter accuracy. Meters with automatic temperature compensation (ATC) correct for the temperature of the water at values above and below 7.0 by a factor of 0.003 pH/˚C/pH unit away from pH 7. They correct for meter error. They do not correct for actual changes in pH.
3. Does high salt concentration affect pH?Salt concentration can affect pH. As salt concentration increases, pH can increase. This is not a linear relationship, but can be important in estuaries, where the salinity varies with the tide. Taking into account salinity or conductivity data may be useful in understanding variations in your pH measurements.4. Why may pH measurements be inaccurate in low conductivity waters?To measure the hydrogen ion concentration, you are actually measuring the potential of the hydrogen ions. Other ions have to be present to pass the current to make this measurement. When they are at too low of a concentration the meter slowly drifts and if the drift is really slow, the meter locks in on an incorrect measurement. 4. Can I use a pH meter that connects to my Smart Phone?Yes, pH meters that connect to iPhones, iPads and other Smart devices can be considered pH meters. For most of these meters an app is required.
GLOBE® 2014 pH Protocol - 15 Hydrosphere
Learning Activities
Appendix
Welcom
eIntroduction
Protocols
pH Protocol – Looking at the DataAre the data reasonable?The pH values for your water site will depend on the geology of your area, soil and vegetation of your watershed, and other inputs into your water body. Where air masses come from may affect the pH of the water. Many water bodies are slightly acidic, with values ranging from 5.0 to 7.0. Areas with deposits of limestone or other calcium carbonate rock forms may be more basic, with values from 7.0 to 9.0. Oceans are well buffered and have a constant pH of about 8.2.When examining the pH data in the GLOBE database, it is important to keep in mind the different instruments that students may be using. Elementary schools using pH paper may seem to have pH data that appear more variable. Their data may vary by a whole or one half pH unit on a weekly basis since the paper only measures in whole or half units.
What do scientists look for in the data?Since most organisms are sensitive to changes in water pH, scientists monitor unusual decreases or increases in the pH of water bodies. pH does not normally change a great deal, although you may find some seasonal trends due to changes in temperature, rainfall patterns, or land cover. Alkalinity is a buffer against acid influx into a water body. A sudden decrease in pH should correspond with decreasing alkalinity. Waters with higher alkalinity should show less pH drop after an addition of acid, like acid rain.
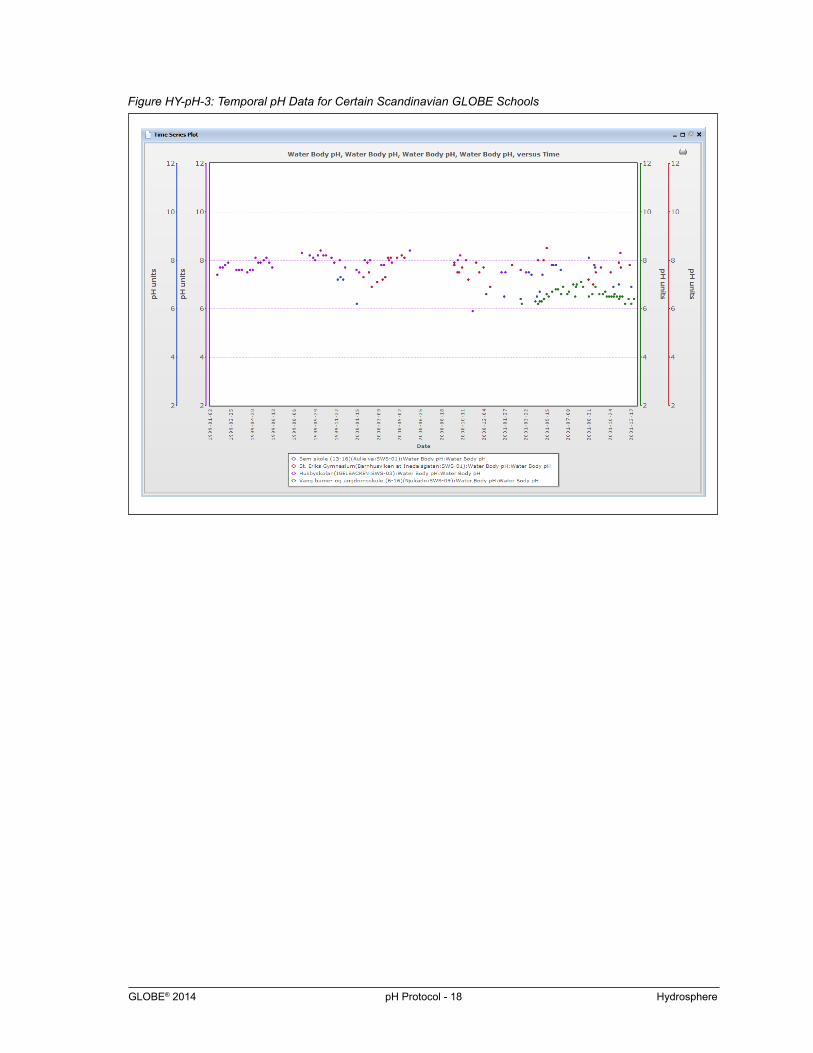
Example of a Student Research ProjectForming a HypothesisA student is examining the pH of streams and lakes in Europe. He knows that much of the acidity in the water comes from acid rain. The acid rain deposition may be unevenly distributed throughout the year due to seasonally varying amounts of precipitation, as well as differences in the prevailing wind direction. He hypothesizes that annual trends might be present in the pH data for certain
water bodies in Europe.
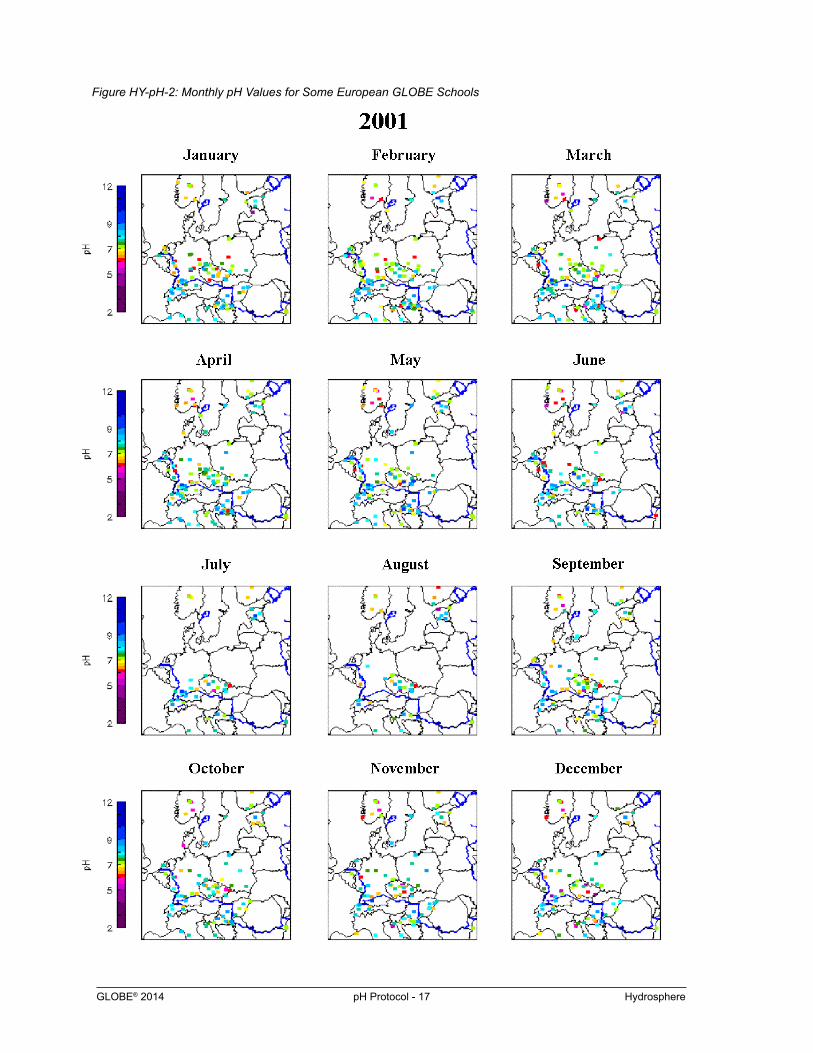
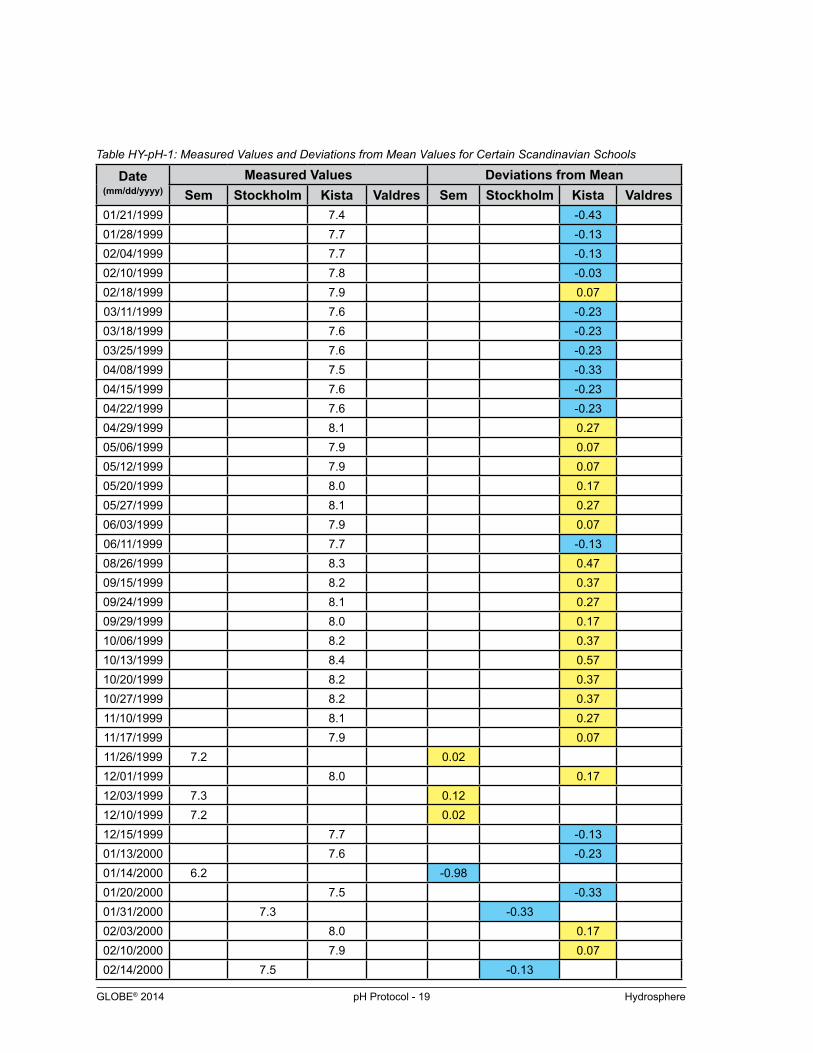
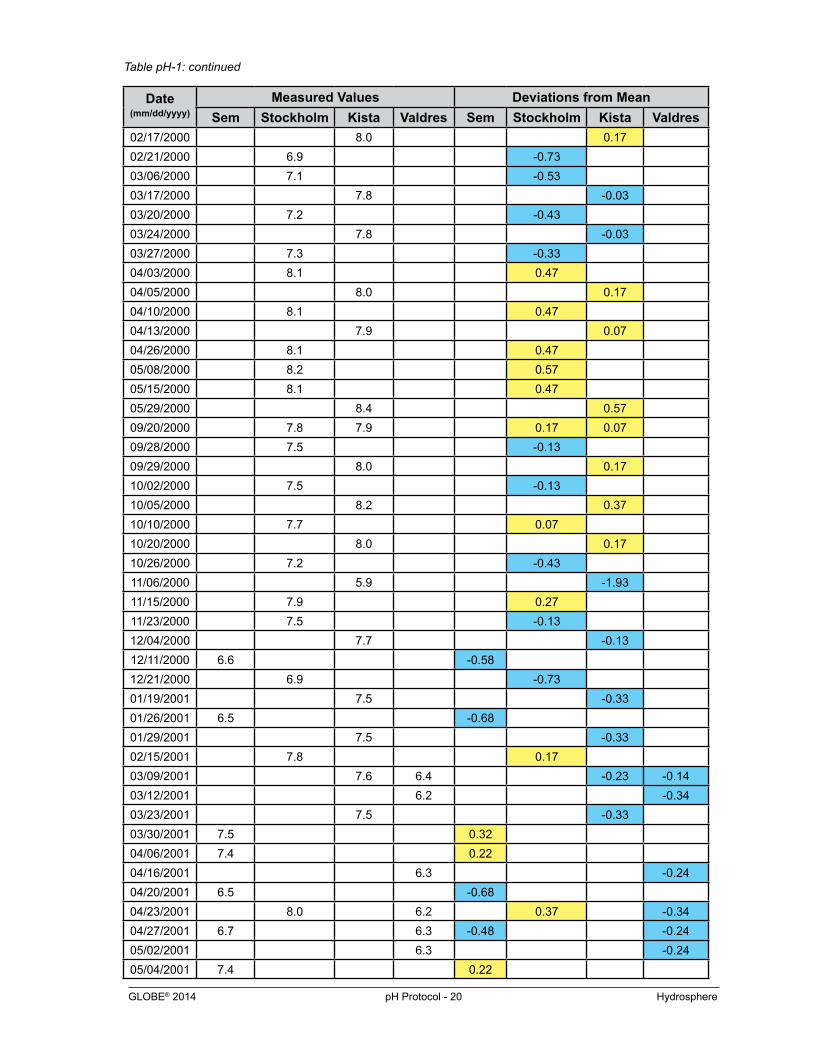
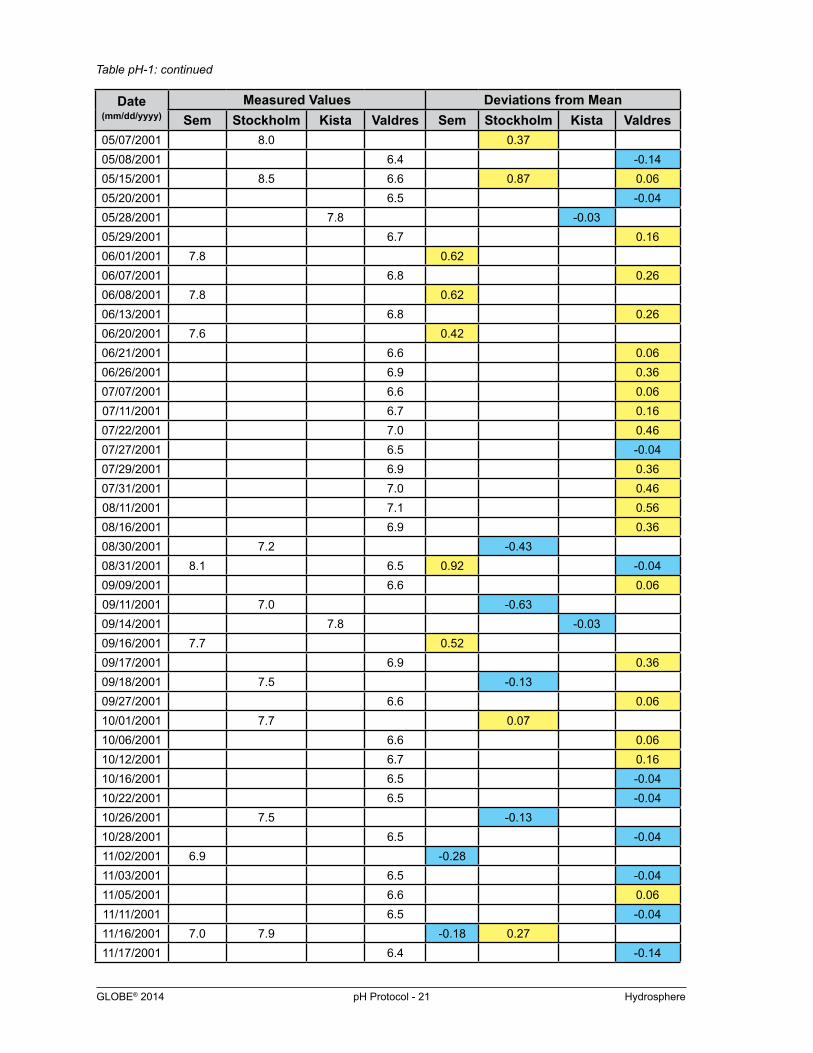
Collecting and Analyzing DataHis first task is to locate an area that it likely to be susceptible to acid precipitation. After researching the topic, the student discovers that the northwestern part of Europe receives the most acid rain for this continent. This is most likely to be an area that the water in lakes and streams is already fairly acidic.He starts by examining the GLOBE map for Europe. He makes maps showing the monthly averages for pH over this region for each month out of the year 2001 (Figure HY-pH-1). He notices that certain schools in Scandinavia appear to show what might be considered an annual trend in pH. He then looks at the Scandinavian schools independently by plotting GLOBE graphs for each school. He chooses four schools that appear to show the strongest trend in pH. The schools chosen are: Husbyskolan in Kista, Sweden; St. Eriks Gymnasium, in Stockholm, Sweden; Sem skole (13-16) in Sem, Norway; and Vang barne- og ungdomsskule (6-16) in Valdres, Norway. The pH plots for these schools from 1999 to 2002 are shown in Figure HY-pH-2. It appears from these graphs that the pH values are higher in the summer and lower in the winter for the chosen sites.In order to examine this more carefully, the student downloads the data from these graphs into a spreadsheet (Table HY-pH-1, column 1-5). He then calculates the average pH for the year for each school . He then creates a column (Table HY-pH-1, last row) for each school that shows deviations for each data point from the calculated averages:Deviation = Observed pH – average pHThe student then counts the number of positive and negative deviations for each month from the data obtained and records them in Table HY-pH-2.By viewing the data in this manner the student is able to see that the months December through March show more negative deviations than positive deviations. Negative deviations are below the average while positive deviations are above the average. So between December and March, the pH was generally below the average pH value. The months May through October show more
GLOBE® 2014 pH Protocol - 16 Hydrosphere
positive deviations from the average than negative deviations, which indicates that they were higher in pH than the average value. The months April and November have equal and near equal positive and negative deviations.He concludes that in Scandinavia, the cooler months show pH values below average and the summer months show pH values above average. Therefore, the student’s hypothesis was correct: an annual trend in pH can be detected in northern European GLOBE schools.
Future WorkThe student would like to investigate further and find out if these findings can be explained by rainfall patterns and precipitation pH values for this part of Europe.
GLOBE® 2014 pH Protocol - 17 Hydrosphere
Figure HY-pH-2: Monthly pH Values for Some European GLOBE Schools
GLOBE® 2014 pH Protocol - 18 Hydrosphere
Figure HY-pH-3: Temporal pH Data for Certain Scandinavian GLOBE Schools
GLOBE® 2014 pH Protocol - 19 Hydrosphere
Table HY-pH-1: Measured Values and Deviations from Mean Values for Certain Scandinavian Schools
Date (mm/dd/yyyy)
Measured Values Deviations from MeanSem Stockholm Kista Valdres Sem Stockholm Kista Valdres
01/21/1999 7.4 -0.4301/28/1999 7.7 -0.1302/04/1999 7.7 -0.1302/10/1999 7.8 -0.0302/18/1999 7.9 0.0703/11/1999 7.6 -0.2303/18/1999 7.6 -0.2303/25/1999 7.6 -0.2304/08/1999 7.5 -0.3304/15/1999 7.6 -0.2304/22/1999 7.6 -0.2304/29/1999 8.1 0.2705/06/1999 7.9 0.0705/12/1999 7.9 0.0705/20/1999 8.0 0.1705/27/1999 8.1 0.2706/03/1999 7.9 0.0706/11/1999 7.7 -0.1308/26/1999 8.3 0.4709/15/1999 8.2 0.3709/24/1999 8.1 0.2709/29/1999 8.0 0.1710/06/1999 8.2 0.3710/13/1999 8.4 0.5710/20/1999 8.2 0.3710/27/1999 8.2 0.3711/10/1999 8.1 0.2711/17/1999 7.9 0.0711/26/1999 7.2 0.0212/01/1999 8.0 0.1712/03/1999 7.3 0.1212/10/1999 7.2 0.0212/15/1999 7.7 -0.1301/13/2000 7.6 -0.2301/14/2000 6.2 -0.9801/20/2000 7.5 -0.3301/31/2000 7.3 -0.3302/03/2000 8.0 0.1702/10/2000 7.9 0.0702/14/2000 7.5 -0.13
GLOBE® 2014 pH Protocol - 20 Hydrosphere
Date (mm/dd/yyyy)
Measured Values Deviations from MeanSem Stockholm Kista Valdres Sem Stockholm Kista Valdres
02/17/2000 8.0 0.1702/21/2000 6.9 -0.7303/06/2000 7.1 -0.5303/17/2000 7.8 -0.0303/20/2000 7.2 -0.4303/24/2000 7.8 -0.0303/27/2000 7.3 -0.3304/03/2000 8.1 0.4704/05/2000 8.0 0.1704/10/2000 8.1 0.4704/13/2000 7.9 0.0704/26/2000 8.1 0.4705/08/2000 8.2 0.5705/15/2000 8.1 0.4705/29/2000 8.4 0.5709/20/2000 7.8 7.9 0.17 0.0709/28/2000 7.5 -0.1309/29/2000 8.0 0.1710/02/2000 7.5 -0.1310/05/2000 8.2 0.3710/10/2000 7.7 0.0710/20/2000 8.0 0.1710/26/2000 7.2 -0.4311/06/2000 5.9 -1.9311/15/2000 7.9 0.2711/23/2000 7.5 -0.1312/04/2000 7.7 -0.1312/11/2000 6.6 -0.5812/21/2000 6.9 -0.7301/19/2001 7.5 -0.3301/26/2001 6.5 -0.6801/29/2001 7.5 -0.3302/15/2001 7.8 0.1703/09/2001 7.6 6.4 -0.23 -0.1403/12/2001 6.2 -0.3403/23/2001 7.5 -0.3303/30/2001 7.5 0.3204/06/2001 7.4 0.2204/16/2001 6.3 -0.2404/20/2001 6.5 -0.6804/23/2001 8.0 6.2 0.37 -0.3404/27/2001 6.7 6.3 -0.48 -0.2405/02/2001 6.3 -0.2405/04/2001 7.4 0.22
Table pH-1: continued
GLOBE® 2014 pH Protocol - 21 Hydrosphere
Date (mm/dd/yyyy)
Measured Values Deviations from MeanSem Stockholm Kista Valdres Sem Stockholm Kista Valdres
05/07/2001 8.0 0.3705/08/2001 6.4 -0.1405/15/2001 8.5 6.6 0.87 0.0605/20/2001 6.5 -0.0405/28/2001 7.8 -0.0305/29/2001 6.7 0.1606/01/2001 7.8 0.6206/07/2001 6.8 0.2606/08/2001 7.8 0.6206/13/2001 6.8 0.2606/20/2001 7.6 0.4206/21/2001 6.6 0.0606/26/2001 6.9 0.3607/07/2001 6.6 0.0607/11/2001 6.7 0.1607/22/2001 7.0 0.4607/27/2001 6.5 -0.0407/29/2001 6.9 0.3607/31/2001 7.0 0.4608/11/2001 7.1 0.5608/16/2001 6.9 0.3608/30/2001 7.2 -0.4308/31/2001 8.1 6.5 0.92 -0.0409/09/2001 6.6 0.0609/11/2001 7.0 -0.6309/14/2001 7.8 -0.0309/16/2001 7.7 0.5209/17/2001 6.9 0.3609/18/2001 7.5 -0.1309/27/2001 6.6 0.0610/01/2001 7.7 0.0710/06/2001 6.6 0.0610/12/2001 6.7 0.1610/16/2001 6.5 -0.0410/22/2001 6.5 -0.0410/26/2001 7.5 -0.1310/28/2001 6.5 -0.0411/02/2001 6.9 -0.2811/03/2001 6.5 -0.0411/05/2001 6.6 0.0611/11/2001 6.5 -0.0411/16/2001 7.0 7.9 -0.18 0.2711/17/2001 6.4 -0.14
Table pH-1: continued
GLOBE® 2014 pH Protocol - 22 Hydrosphere
Date (mm/dd/yyyy)
Measured Values Deviations from MeanSem Stockholm Kista Valdres Sem Stockholm Kista Valdres
11/19/2001 6.5 -0.0411/20/2001 8.3 0.4711/21/2001 7.7 0.0711/25/2001 6.5 -0.0412/02/2001 6.2 -0.3412/11/2001 6.4 -0.1412/14/2001 7.8 0.1712/18/2001 6.9 6.2 -0.28 -0.3412/25/2001 6.4 -0.1401/04/2002 6.3 -0.2401/11/2002 7.7 -0.1301/17/2002 6.3 -0.2401/19/2001 7.8 0.1701/25/2002 7.1 7.5 -0.08 -0.3301/26/2002 6.3 -0.2402/01/2002 7.6 7.7 6.3 0.42 -0.13 -0.2402/03/2002 6.3 -0.2402/08/2002 7.0 7.8 -0.18 -0.03
Means 7.18 7.63 7.83 6.54 - - - -
Table HY-pH-2: Monthly Deviation Totals from Four Scandinavian GLOBE Schools
Month # Neg. Dev. # Pos. Dev.January 16 1February 9 6
March 12 1April 8 8May 4 12June 1 8July 1 5
August 2 4September 4 10
October 6 10November 9 8December 9 4
Table pH-1: continued


![A Protocol to Characterize pH Sensing …web.mit.edu/bazant/www/papers/pdf/Ghoneim_2019_Small... · 2019. 12. 18. · Soren Sorenson introduced the term “pH” in 1909[1] to denote](https://img.pdfslide.us/doc/110x75/6065fc6e0014ba0e951769f0/a-protocol-to-characterize-ph-sensing-webmitedubazantwwwpaperspdfghoneim2019small.jpg)