Embed Size (px)
Citation preview

GLOBE® 2014 Nitrate Protocol - 1 Hydrosphere
Learning Activities
Appendix
Welcom
eIntroduction
ProtocolsNitrate ProtocolPurposeTo measure the nitrate-nitrogen (NO3-N) of water
OverviewStudents will use a nitrate kit to measure the nitrate-nitrogen in the water at their hydrosphere study site. The exact procedure depends on the instructions in the nitrate kit used.
Student OutcomesStudents will learn to:
- use a nitrate kit;- examine reasons for changes in the
nitrate of a water body;- communicate project results with other
GLOBE schools;- collaborate with other GLOBE schools
(within your country or other countries); and
- share observations by submitting data to the GLOBE science data archive.
Science Concepts Earth and Space Science
Each element moves among different reservoirs (biosphere, lithosphere, atmosphere, hydrosphere).
Earth materials are solid rocks, soils, water and the atmosphere.
Water is a solvent.Physical Sciences
Objects have observable properties.Life Sciences
Organisms can only survive in environments where their needs are met.
Earth has many different environments that support different combinations of organisms.
Organisms change the environment in which they live.
Humans can change natural environments.All organisms must be able to obtain
and use resources while living in a constantly changing environment.
Scientific Inquiry AbilitiesUse a chemical test kit to measure nitrates.Identify answerable questions.Design and conduct scientific
investigations.Use appropriate mathematics to analyze
data.
Develop descriptions and explanations using evidence.
Recognize and analyze alternative explanations.
Communicate procedures and explanations.
Time20 minutes for nitrate testQuality Control Procedure: 20 minutes
LevelMiddle and Advanced
FrequencyWeeklyQuality control every 6 months
Materials and ToolsNitrate Test Kit (if you have salt or
brackish water, be sure to use an appropriate test kit)
Nitrate Protocol Field GuideHydrosphere Investigation Quality
Control Data SheetHydrosphere Investigation Data SheetClock or watchLatex glovesGogglesSurgical mask (if using powdered reagents)Distilled waterFor Quality Control Procedure, the
above plus: - Quality Control Procedure Field
Guide - Quality Control Procedure Data
Sheet - Making the 2 ppm Nitrate Standard
Lab Guide (option 1, option 2) - Standard nitrate solution (1000 mg/L
nitrate-nitrogen) - Equipment depends on how the
standard is made (see Making the 2 ppm Nitrate Standard Lab Guide)
PreparationSuggested activity: Practicing Your Protocols, Nitrate Protocol PrerequisitesDiscussion of the differences among nitrate, nitrate-nitrogen, and nitriteDiscussion of safety procedures when using chemical test kits.

GLOBE® 2014 Nitrate Protocol - 2 Hydrosphere
Nitrate Protocol – IntroductionNitrogen can have many chemical forms in water bodies Nitrogen can be found as dissolved molecular nitrogen (N2), as organic compounds (both dissolved and particulate), and as numerous inorganic forms such as ammonium (NH4
+), nitrite (NO2-) and nitrate
(NO3-). Nitrate (NO3
-) is usually the most important inorganic form of nitrogen because it is an essential nutrient for the growth and reproduction of many algae and other aquatic plants. Nitrite (NO2
-) is usually found only in waters with low dissolved oxygen levels, called suboxic waters.Scientists often call nitrogen a “limiting nutrient” because in low amounts, plants use up all the available nitrogen in the water and cannot grow or reproduce anymore. So, it “limits” the amount of plants in the water. Many plants that use nitrogen are microscopic algae, or phytoplankton. Additional amounts of nitrogen added to the water may allow the plants to grow and reproduce more.The nitrate form of nitrogen found in natural waters comes from the atmosphere in rain, snow, fog or dry deposition by wind, from groundwater inputs, and from surface and below surface run-off that flows off and through surrounding land cover and soils. As well, the decay of plant or animal matter in soil or sediments creates nitrates. Human activities can greatly affect the amounts of nitrate in water bodies.When an excess amount of a limiting nutrient such as nitrogen is added to a lake or stream the water becomes highly productive. This may cause tremendous growth of algae and other plants. This process of enriching the water is called eutrophication. The resulting excess plant growth can cause taste and odor problems in lakes used for drinking water or can cause nuisance problems for users of the water body.Although plants and algae add valuable oxygen to the water, overgrowth can potentially lead to reduced light levels in the water body. As plants and algae die and decay, bacteria multiply and use the dissolved oxygen in the water. The amount of available dissolved
oxygen in the water may become very low and harm fish and other aquatic animals.
Teacher SupportUnderstanding the Chemistry of the Nitrate KitsNitrate (NO3
-) is very difficult to measure directly, whereas nitrite (NO2
-) is easier to measure. So, in order to measure nitrate (NO3
-
) nitrate kits convert the nitrate (NO3-) in the
water sample to nitrite (NO2–). As explained
in the instructions for the nitrate kits, you will add a chemical (such as cadmium) to the water sample, and this will change the nitrate (NO3
-) in the water to nitrite (NO2-). A second
chemical is then added to the water sample and reacts with the nitrite (NO2
-) to cause a color change. The resulting color change of the water sample is proportional to the amount of nitrite in the sample.The measurement in the nitrate kits gives the combined concentration of nitrite (if present) and nitrate (remember the nitrate, NO3
-, has been converted to nitrite, NO2
-). In the 1997 Teacher’s Guide, we asked you to measure both the nitrite (NO2
-) and the combined nitrate and nitrite forms (the procedure described above). We are now only asking you to report the combined nitrate and nitrite forms. If the water at your site has very low dissolved oxygen levels, we encourage you to measure the nitrite (NO2
-) amount. To measure nitrite (NO2
-), you do not add the first chemical (such as cadmium). Instead, you only add the second chemical that reacts with the nitrite (NO2
-) to cause a color change. The instructions in the nitrate kit should explain what to do. See Figure HY-NI-1.The chemical reaction that causes nitrate (NO3
-) to change to nitrite (NO2-) is called an
oxidation – reduction reaction. These types of reactions are very common and involve the exchange of electrons from one molecule to another molecule. Often, the kits will say that they use a cadmium reduction method. This means that the cadmium has removed electrons from nitrate (NO3
-) to form nitrite (NO2
-).The hydrosphere investigation team tested kits that use either cadmium or zinc as a

GLOBE® 2014 Nitrate Protocol - 3 Hydrosphere
Learning Activities
Appendix
Welcom
eIntroduction
Protocols
reduction element. Cadmium-based kits provide a finer resolution of 0.1 or 0.2 ppm. In other words, the value you measure will have an accuracy of 0.2 ppm. The zinc-based kits that have been tested generally have a coarser resolution of 0.25 ppm. Cadmium, however, is a carcinogen and may not be allowed or recommended by your school. The kits are designed to minimize exposure to cadmium or zinc. Please check your school policy before ordering these kits. We are watching for kits to be developed using different chemistry.For GLOBE, concentrations of nitrate are expressed as the amount of elemental nitrogen in the form of nitrate. Concentrations are expressed as nitrate-nitrogen (NO3
--N) in milligrams per liter.Milligrams per liter (mg/L) is the same as parts per million (ppm). For example, a concentration would be reported as 14 g of nitrogen per mole of NO3
- and not as grams of NO3
- (which would be 62 g per mole (NO3-). It
might be useful to review the Periodic Chart of chemical elements. The weight of nitrogen is 14 g and that of NO3
- is 62 g (O = 16 g). The nitrate kits are designed to measure nitrate-nitrogen and we ask you to report nitrate
values in the form of nitrate-nitrogen as well.For your own exercise, you can convert mg/L nitrate-nitrogen to mg/L nitrate. Simply multiply your measured value by 4.4. This value is the ratio of nitrate/nitrogen molecular weights (62g/14g). For example, say you measured 10 mg/L NO3
-N. Multiplying 10 by 4.4 gives you 44 mg/L NO3
-.
Measurement Procedure• Most natural waters have nitrate levels
under 1.0 mg/L nitrate-nitrogen, but concentrations over 10 mg/L nitrate-nitrogen are found in some areas. If your kit has a low range (0-1 ppm) and a high range (1-10 ppm), most likely you will only use the low range test. If you are not sure what the nitrate levels are, first use the low range. Students should note the range of their test in their metadata. Values above 10 ppm NO3
--N may be rejected unless a school indicates that their results are valid above this level.
• If your kit measures nitrate-nitrogen (NO3
--N), you do NOT multiply the value you measure by 4.4. Report the value directly from the kit.
Water Sample
+ 1st Reagent
+ 2nd Reagent
NitratesMeasuring (Nitrate + Nitrite)
Step 1. The 1st reagent converts nitrate to nitrite.
Step 2. The 2nd reagent reacts with nitrite and creates color. By measuring the color intensity the amount of (nitrate + nitrite) is determined.
The color intensity is proportional to the amount of nitrite in the sample.
(NO3-–N + NO2
-–N)
(NO3-–N + NO2
-–N)
Nitrate (NO3-–N)
Nitrite (NO2-–N)
(Nitrate + Nitrite)
Note: If you want to measure the amounts of nitrite-nitrogen (NO2-–N) only, then do Step 2. Skip Step 1.
Figure HY-NI-1

GLOBE® 2014 Nitrate Protocol - 4 Hydrosphere
• If the nitrate kit requires you to shake the sample, it is important to shake for the exact time stated in the instructions. Use a watch or clock to measure the time. Have one student shake while another watches the time.
• Do not report any value if the water was not tested for nitrate. A value of 0.0 ppm indicates that the water was tested and no nitrate was detected.
• If there are low values of dissolved oxygen (e.g., less than 3.0 mg/L) and you have detected amounts of nitrate-nitrogen (NO3
--N), you may want to measure the amounts of nitrite-nitrogen (NO2
--N).• If your site has brackish or salt water,
you need to make sure that you have a kit that can be used in brackish or salt water. If you already have a kit, look at the instructions in the nitrate kit. Some kits cannot be used in brackish and salt water.
Quality Control ProcedureTo perform the quality control procedure, you need to buy a standard nitrate-nitrogen. You can use either a liquid standard solution or a dry stock standard solution. The liquid standard you buy has a high concentration of NO3
--N (1000 ppm ). The lab guide explains how to dilute the standard to 2 ppm. Students can then measure the concentration of the NO3
--N in the standard and compare their result to the expected standard value of 2 ppm.The Making the Nitrate Standard Lab Guide provides two options for making the 2 ppm nitrate-nitrogen standard. Option 2 uses less stock solution and has less wastage but requires more skill to make.After your students have completed the quality control procedure using the 2 ppm standard, discard the remaining unused 2 ppm and 100 ppm standards. The standard nitrate solution should be made fresh each time quality control procedures are done.Lastly, the Making the 1000 ppm Stock Standard Nitrate-Nitrogen Solution Lab Guide shows you how to make the concentrated 1000 ppm standard from potassium nitrate (KNO3). This method is recommended only if you have a chemistry lab.
Supporting ProtocolsHydrosphere: Students may explore re la t ionsh ips among t ransparency, temperature and dissolved oxygen and the amount of nitrates in the water.Biosphere: Examining the types of land cover in the watershed may help to explain patterns you find in your water body.Atmosphere: The amount of precipitation will affect the amount of runoff and the nutrients that are carried in the runoff.
Safety Procedures1. Students should wear gloves when
handling chemicals and the water sample.
2. Students should wear goggles when working with chemicals. They should also wear surgical masks when opening powdered reagents.
3. School authorities should be consulted on the proper disposal of used chemicals.
Instrument Maintenance• All chemicals should be kept tightly
capped and away from direct heat. Replace chemicals after one year.
• Glassware in the kit should be rinsed with distilled water before storing.
• Perform the quality control procedure with the kit every 6 months to insure that chemicals are still good.
Questions for Further InvestigationWhy do you think there may be a seasonal pattern in nitrate data?Is there a relationship between the amount of nitrate at your site and the type of land cover in your watershed?Does temperature affect the amount of nitrate in water?Is there are relationship between the types of soil in the watershed and the amount of nitrate in the water body?

GLOBE® 2014 Nitrate Protocol - 5 Hydrosphere
Making the 2 ppm Nitrate StandardOption 1 Lab Guide
TaskMake the nitrate-nitrogen standard for the quality control procedure using 5 mL stock nitrate-nitrogen solution.
What You Needo Standard nitrate-nitrogen solution (1000 ppm)
o 100-mL beaker (or larger)
o 100-mL graduated cylinder
o 500-mL beaker or flask
o 500-mL graduated cylinder
o Latex gloves
In the Lab1. Put on gloves and goggles
2. Rinse a 100 mL cylinder and 100 mL beaker with distilled water. Dry.
3. Using a pipette (if possible), measure 5 mL of the 1000 stock nitrate solution into the 100-mL graduate cylinder. Dilute with distilled water to 50 mL.
4. Pour into a 100 mL beaker and mix (swirl or use clean stirring rod). Label this 100-ppm nitrate standard.
5. Rinse 100-mL graduated cylinder with distilled water.
6. Measure out 10 mL of the 100 ppm nitrate standard using the 100-mL graduated cylinder. Pour into 500 mL flask or beaker. Measure out 490 mL of distilled water in the 500 mL graduate cylinder. Add to the 500 mL flask or beaker.
7. Carefully swirl the solution to mix. Pour into a bottle with a lid and label as 2.0 ppm nitrate-nitrogen standard.
o Goggles
o Pipette
o Stirring rod (optional)
o Distilled water
o 250-mL bottle or jar with lid
GLOBE® 2014 Nitrate Protocol - 6 Hydrosphere
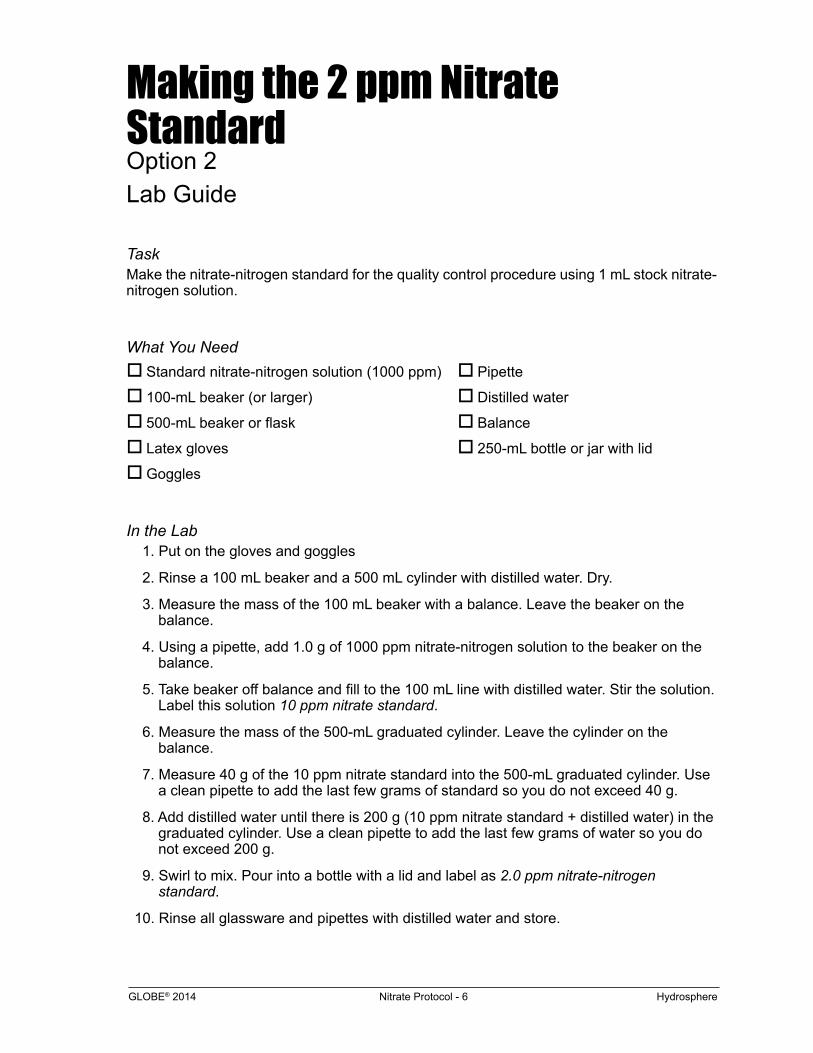
Making the 2 ppm Nitrate StandardOption 2 Lab Guide
TaskMake the nitrate-nitrogen standard for the quality control procedure using 1 mL stock nitrate-nitrogen solution.
What You Needo Standard nitrate-nitrogen solution (1000 ppm)
o 100-mL beaker (or larger)
o 500-mL beaker or flask
o Latex gloves
o Goggles
In the Lab1. Put on the gloves and goggles
2. Rinse a 100 mL beaker and a 500 mL cylinder with distilled water. Dry.
3. Measure the mass of the 100 mL beaker with a balance. Leave the beaker on the balance.
4. Using a pipette, add 1.0 g of 1000 ppm nitrate-nitrogen solution to the beaker on the balance.
5. Take beaker off balance and fill to the 100 mL line with distilled water. Stir the solution. Label this solution 10 ppm nitrate standard.
6. Measure the mass of the 500-mL graduated cylinder. Leave the cylinder on the balance.
7. Measure 40 g of the 10 ppm nitrate standard into the 500-mL graduated cylinder. Use a clean pipette to add the last few grams of standard so you do not exceed 40 g.
8. Add distilled water until there is 200 g (10 ppm nitrate standard + distilled water) in the graduated cylinder. Use a clean pipette to add the last few grams of water so you do not exceed 200 g.
9. Swirl to mix. Pour into a bottle with a lid and label as 2.0 ppm nitrate-nitrogen standard.
10. Rinse all glassware and pipettes with distilled water and store.
o Pipette
o Distilled water
o Balance
o 250-mL bottle or jar with lid

GLOBE® 2014 Nitrate Protocol - 7 Hydrosphere
Making the 1000 ppm Nitrate StandardLab Guide
TaskMake the 1000 ppm stock nitrate-nitrogen standard for the quality control procedure using KNO3 (potassium nitrate).
What You Needo Potassium nitrate (KNO3)
o Distilled water
o Drying oven
o 500-mL graduated cylinder
o Latex gloves
In the Lab1. Put on gloves and goggles
2. Dry KNO3 (potassium nitrate) in an oven for 24 hours at 105 degrees C.
3. Measure 3.6 g of KNO3
4. Dissolve 3.6 g of KNO3 in 100 mL of distilled water.
5. Pour solution into a 500 mL graduated cylinder. Fill cylinder to the 500 mL line with distilled water.
6. Carefully swirl to mix. (Do not shake).
7. Pour into a jar and label as 1000 mg/L nitrate-nitrogen solution. Put the date on the label.
8. The stock nitrate solution can be preserved for up to six months using chloroform (CHCl3). To preserve a stock nitrate standard add 1 mL of chloroform to 500 mL of stock nitrate solution.
Note: To calculate nitrate-nitrogen (KNO3--N), take into account the molecular composition of
KNO3 (the ratio of the molecular weight of N to KNO3 is 0.138): 7200 mg/L KNO3 x 0.138 = 1000 mg/L nitrate nitrogen solution.
o 500-mL bottle or jar with lid
o Balance
o Chloroform (optional)
o Goggles

GLOBE® 2014 Nitrate Protocol - 8 Hydrosphere
Nitrate Quality Control Procedure
TaskCheck the accuracy of the nitrate test kit.
What You Needo Nitrate Test Kit
o Hydrosphere Investigation Quality Control Data Sheet
o 2 ppm Nitrate standard
o Latex gloves
o Clock or watch
In the Lab1. Fill out the top portion of the Hydrosphere Investigation Quality Control Data Sheet. In
the Nitrate section fill in the name of the kit manufacturer and model.
2. Put on gloves and goggles.
3. Follow the directions in the nitrate test kit to measure the nitrate-nitrogen in the 2 ppm standard. If your test kit has directions for both a Low Range (0-1) and High Range (0-10) test, use the High Range directions for the calibration. Use the standard where it says ‘sample water’. If using powdered reagents, use the surgical mask when opening these products. Use clock or watch to measure the time if your kit requires you to shake your sample.
4. Match the color of the treated sample water with a color in the test kit. Record the value as ppm nitrate-nitrogen for the matching color on the Hydrosphere Investigation Quality Control Data Sheet. Note: If you are not sure about the best matching color ask other students for their opinions.
5. Repeat steps 3 and 4 with fresh water samples. You will have a total of three nitrate-nitrogen measurements.
5. Calculate the average of the three measurements.
6. If your measurement is not + or – 1 ppm (high range) of the standard, repeat the measurement. If your measurement is still not within range, talk with your teacher about possible problems.
7. Put used chemicals in a waste container. Rinse glassware with distilled water. Cap all chemicals tightly.
o Goggles
o Distilled water
o Surgical mask (if using powdered reagents)
o Chemical waste bottle

GLOBE® 2014 Nitrate Protocol - 9 Hydrosphere
Nitrate ProtocolField Guide
TaskMeasure the nitrate in your water sample.
What You Needo Hydrosphere Investigation Data Sheet
o Nitrate test kit
o Latex gloves
o Clock or watch
In the Field1. Fill out the top portion of your Hydrosphere Investigation Data Sheet. In the Nitrate
section fill in the kit manufacturer and model.
2. Put on gloves and goggles.
3. Follow the instructions in your kit to measure the nitrate nitrogen. You should use the Low Range Test (0 – 1 mg/L) unless previous results indicate that your site typically has greater than 1 mg/L nitrate nitrogen. If using powdered reagents, use the surgical mask when opening these products. Use clock or watch to measure the time if your kit requires you to shake your sample.
4. Match the color of the treated sample water with a color in the test kit. Record the value as ppm nitrate-nitrogen for the matching color. Have two other students match a color with the treated sample water for a total of three observations. Record all three nitrate-nitrogen values on the Data Sheet.
5. Calculate the average of the three measurements.
6. Check to see if each of the three measurements is within 0.1 ppm of the average (or within 1.0 ppm of the average if using the high range test). If they are, record the average on the Data Sheet. If they are not, read the color measurements again (Note: do not read again if it has been more than 5 minutes). Calculate a new average. If the measurements are still not within range discuss possible problems with your teacher.
o Goggles
o Distilled water
o Surgical mask (if using powdered reagents)
o Chemical waste bottle

GLOBE® 2014 Nitrate Protocol - 10 Hydrosphere
Frequently Asked Questions1. Is it okay for my water to have a nitrate measurement of 0?Yes, a 0 ppm value indicates that the amount of nitrate (if any) in the water is below the detection limit (usually 0.1 ppm N-NO3) of the nitrate kit you are using. Many water bodies may have 0 ppm N-NO3 most of the year.2. What happens if my water turns a different color, instead of pink, during the testing process?You probably cannot use the kit you are currently using.
3. Is it okay for nitrate values to fluctuate a lot in a short period of time?Yes, after precipitation events run-off from surrounding land cover and soils containing nitrates can go into a stream, lake, or estuary and cause the nitrate levels to rise. After the storm or snow melt, the levels may decline.5. Is it OK to use a zinc-based nitrate kit?Yes. While the cadmium-based kits give more accurate values in the low nitrate waters, we realize that school regulations do not allow some GLOBE schools to use the cadmium-based kits. If this is the situation at your school, use the zinc-based kits. Please designate on the site definition page the type of kit you are using.

GLOBE® 2014 Nitrate Protocol - 11 Hydrosphere
Learning Activities
Appendix
Welcom
eIntroduction
Protocols
Nitrate Protocol – Looking at the DataAre the data reasonable?Nitrate values generally range from 0.0 to 10.0 ppm. A value of 0.0 ppm is possible and should be reported. Repeated values of 0.0 ppm (as seen in Figure HY-NI-2) are not unusual. It is possible to have values above 10.0 ppm. However, the website may reject these values as part of the quality control features. Please recheck values above 10.0 ppm to make sure that you are certain they are correct. If correct, contact a local water quality expert.
Figure HY-NI-2
What do scientists look for in the data?The levels of nitrate can affect the ecology of the water body as well as affect how humans use the water. Scientists monitor nitrate in drinking water for public safety. Different countries have different standards of nitrate allowable in the drinking water. Scientists and resource managers also monitor water sites for high nitrate levels that might lead to eutrophication of the water body. High levels of nitrate may eventually lead to low levels of oxygen, which may then lead to harm to aquatic animals such as fish kills. Phosphate can be a common cause of eutrophication in water bodies, particularly in freshwater lakes and pondsSites often have seasonal fluctuations (see Figure HY-NI-3). Scientists commonly look at atmosphere, land cover, soil data, and human activities to find relationships with seasonal nitrate amounts.

GLOBE® 2014 Nitrate Protocol - 12 Hydrosphere
Examples of Student Research Investigation
Investigation #1Forming a HypothesisStudents are examining the nitrate data collected at the Warta River by the Complex of Schools C. K. Norwida in Czestochowa, Poland over a period of three years (Figure HY-NI-4). Some of the students think they see an annual cycle, with higher values in the middle of the year, and lower values in winter. Not all the students are convinced because there is a lot of scatter in the data. However, they all agree to hypothesize that nitrate levels in Warta River have an annual cycle.
Collecting and Analyzing DataThe students begin by creating a table of the the monthly average nitrate-nitrogen data (calculated from the data in the GLOBE science database). They make one row for each month and one column for each year (shown in Table HY-NI-1). After this they calculate the monthly average for all years shown in the last column to the right.The students then create a chart plotting the monthly averaged nitrate-nitrogen on from
the table (Figure HY-NI-5). This makes an annual pattern seem more apparent. The students then plot the monthly data using a different symbol for each year and a line to show the average data (Figure HY-NI-6). It is now much easier to see the annual cycle. Average nitrate-nitrogen is lowest (~2 ppm) from January to March and highest (~7 ppm) from May to August. Intermediate values (~4 ppm) are measured between September and December. For most of the months, the nitrate for any given year is within ±2 ppm NO3
- N of the average, except for June and November.
Communicating ResultsThe students write a report and present their results to their class.
Future ResearchThis site has an annual cycle for nitrate-nitrogen, but the students are not sure why. They decide to get precipitation data for the area and see when the rainiest months are. Will they coincide with months with the highest nitrate levels?
Figure HY-NI-3
GLOBE® 2014 Nitrate Protocol - 13 Hydrosphere
Learning Activities
Appendix
Welcom
eIntroduction
Protocols
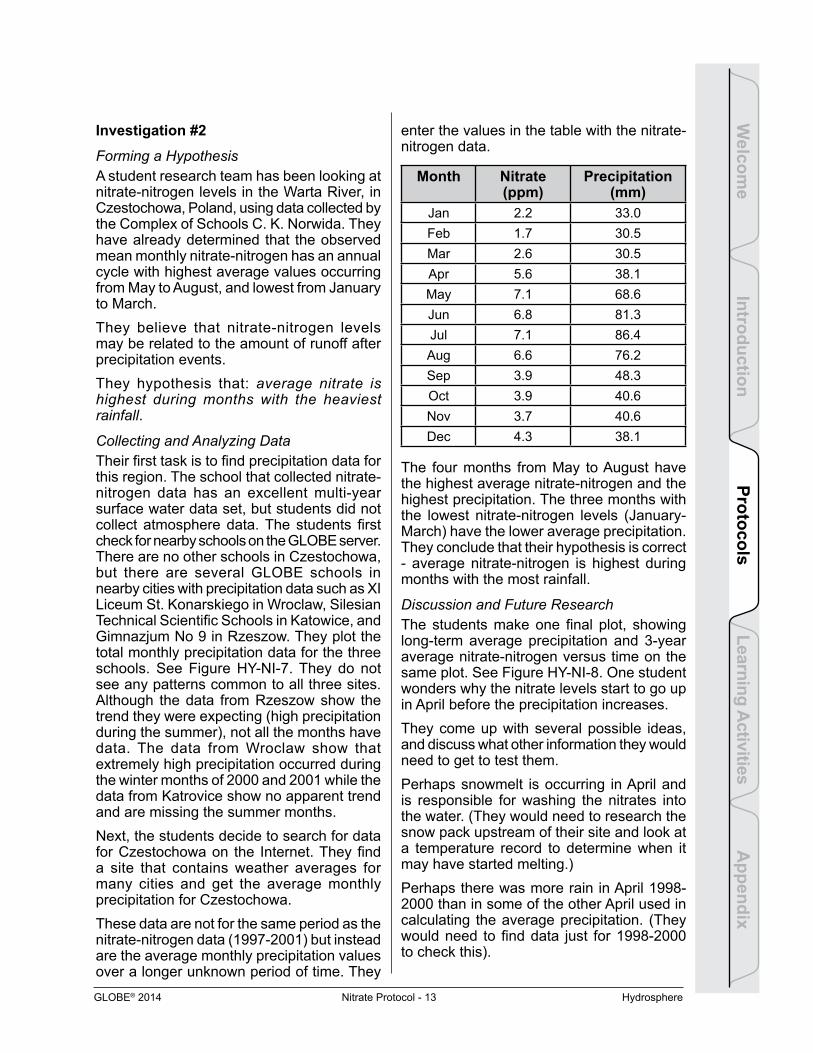
enter the values in the table with the nitrate-nitrogen data.
Month Nitrate (ppm)
Precipitation (mm)
Jan 2.2 33.0Feb 1.7 30.5Mar 2.6 30.5Apr 5.6 38.1May 7.1 68.6Jun 6.8 81.3Jul 7.1 86.4Aug 6.6 76.2Sep 3.9 48.3Oct 3.9 40.6Nov 3.7 40.6Dec 4.3 38.1
The four months from May to August have the highest average nitrate-nitrogen and the highest precipitation. The three months with the lowest nitrate-nitrogen levels (January-March) have the lower average precipitation. They conclude that their hypothesis is correct - average nitrate-nitrogen is highest during months with the most rainfall.
Discussion and Future ResearchThe students make one final plot, showing long-term average precipitation and 3-year average nitrate-nitrogen versus time on the same plot. See Figure HY-NI-8. One student wonders why the nitrate levels start to go up in April before the precipitation increases.They come up with several possible ideas, and discuss what other information they would need to get to test them.Perhaps snowmelt is occurring in April and is responsible for washing the nitrates into the water. (They would need to research the snow pack upstream of their site and look at a temperature record to determine when it may have started melting.)Perhaps there was more rain in April 1998-2000 than in some of the other April used in calculating the average precipitation. (They would need to find data just for 1998-2000 to check this).
Investigation #2
Forming a HypothesisA student research team has been looking at nitrate-nitrogen levels in the Warta River, in Czestochowa, Poland, using data collected by the Complex of Schools C. K. Norwida. They have already determined that the observed mean monthly nitrate-nitrogen has an annual cycle with highest average values occurring from May to August, and lowest from January to March.They believe that nitrate-nitrogen levels may be related to the amount of runoff after precipitation events.They hypothesis that: average nitrate is highest during months with the heaviest rainfall.
Collecting and Analyzing DataTheir first task is to find precipitation data for this region. The school that collected nitrate-nitrogen data has an excellent multi-year surface water data set, but students did not collect atmosphere data. The students first check for nearby schools on the GLOBE server. There are no other schools in Czestochowa, but there are several GLOBE schools in nearby cities with precipitation data such as XI Liceum St. Konarskiego in Wroclaw, Silesian Technical Scientific Schools in Katowice, and Gimnazjum No 9 in Rzeszow. They plot the total monthly precipitation data for the three schools. See Figure HY-NI-7. They do not see any patterns common to all three sites. Although the data from Rzeszow show the trend they were expecting (high precipitation during the summer), not all the months have data. The data from Wroclaw show that extremely high precipitation occurred during the winter months of 2000 and 2001 while the data from Katrovice show no apparent trend and are missing the summer months.Next, the students decide to search for data for Czestochowa on the Internet. They find a site that contains weather averages for many cities and get the average monthly precipitation for Czestochowa.These data are not for the same period as the nitrate-nitrogen data (1997-2001) but instead are the average monthly precipitation values over a longer unknown period of time. They

GLOBE® 2014 Nitrate Protocol - 14 Hydrosphere
Perhaps agriculturalists start fertilizing heavily in April. (They would need to determine when fertilizing starts upstream and what is in the fertilizers.)
Communicating ResultsThe students write a report and present their results to their class. They ask their teacher to submit their report to the GLOBE website.
Figure HY-NI-4

GLOBE® 2014 Nitrate Protocol - 15 Hydrosphere
Figure HY-NI-5
Average Monthly Nitrate at Warta River (ppm)Month 1998 1999 2000 2001 Average
Jan 0.1 3.2 3.3 2.2Feb 0.0 3.3 1.8 1.7Mar 1.5 2.4 3.9 2.6Apr 6.0 5.8 5.0 5.6May 6.3 8.4 6.5 7.1Jun 10.0 4.7 5.6 6.8Jul 6.8 7.3 7.1Aug 6.5 6.6 6.6Sep 4.3 3.5 3.9Oct 4.0 3.3 4.5 3.9Nov 1.4 3.5 6.3 3.7Dec 3.9 3.3 5.8 4.3
Table HY-NI-1

GLOBE® 2014 Nitrate Protocol - 16 Hydrosphere
Figure HY-NI-7
Figure HY-NI-6

GLOBE® 2014 Nitrate Protocol - 17 Hydrosphere
Figure HY-NI-8