Embed Size (px)
Citation preview
P O S I V A O Y
FI -27160 OLKILUOTO, F INLAND
Tel +358-2-8372 31
Fax +358-2-8372 3709
Seppo Gehör
Au l i s Kärk i
Markku Paananen
June 2007
Work ing Repor t 2007 -47
Petrology, Petrophysics and FractureMineralogy of the Drill Core Sample
OL-KR22 and OL-KR22B
June 2007
Base maps: ©National Land Survey, permission 41/MYY/07
Working Reports contain information on work in progress
or pending completion.
The conclusions and viewpoints presented in the report
are those of author(s) and do not necessarily
coincide with those of Posiva.
Seppo Gehör
Au l i s Kärk i
K iv i t i e to Oy
Markku Paananen
Geo log ica l Su rvey o f F in l and
Work ing Report 2007 -47
Petrology, Petrophysics and FractureMineralogy of the Drill Core Sample
OL-KR22 and OL-KR22B
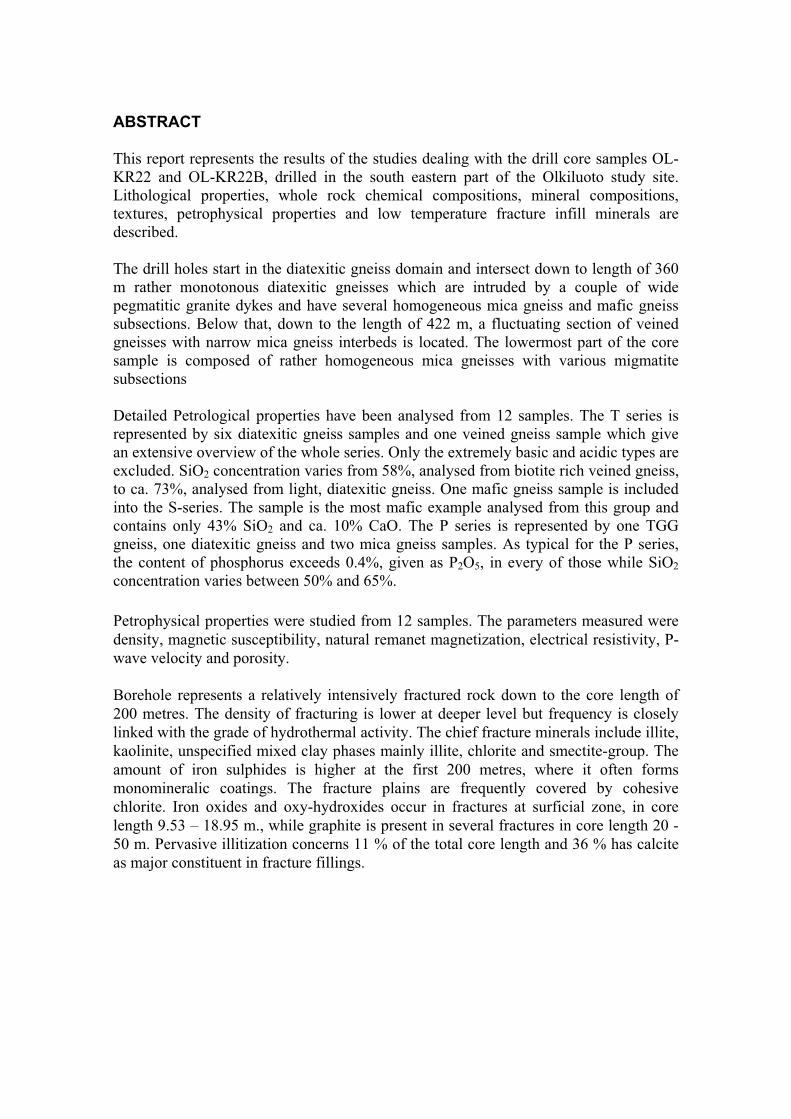
ABSTRACT
This report represents the results of the studies dealing with the drill core samples OL-
KR22 and OL-KR22B, drilled in the south eastern part of the Olkiluoto study site.
Lithological properties, whole rock chemical compositions, mineral compositions,
textures, petrophysical properties and low temperature fracture infill minerals are
described.
The drill holes start in the diatexitic gneiss domain and intersect down to length of 360
m rather monotonous diatexitic gneisses which are intruded by a couple of wide
pegmatitic granite dykes and have several homogeneous mica gneiss and mafic gneiss
subsections. Below that, down to the length of 422 m, a fluctuating section of veined
gneisses with narrow mica gneiss interbeds is located. The lowermost part of the core
sample is composed of rather homogeneous mica gneisses with various migmatite
subsections
Detailed Petrological properties have been analysed from 12 samples. The T series is
represented by six diatexitic gneiss samples and one veined gneiss sample which give
an extensive overview of the whole series. Only the extremely basic and acidic types are
excluded. SiO2 concentration varies from 58%, analysed from biotite rich veined gneiss,
to ca. 73%, analysed from light, diatexitic gneiss. One mafic gneiss sample is included
into the S-series. The sample is the most mafic example analysed from this group and
contains only 43% SiO2 and ca. 10% CaO. The P series is represented by one TGG
gneiss, one diatexitic gneiss and two mica gneiss samples. As typical for the P series,
the content of phosphorus exceeds 0.4%, given as P2O5, in every of those while SiO2
concentration varies between 50% and 65%.
Petrophysical properties were studied from 12 samples. The parameters measured were
density, magnetic susceptibility, natural remanet magnetization, electrical resistivity, P-
wave velocity and porosity.
Borehole represents a relatively intensively fractured rock down to the core length of
200 metres. The density of fracturing is lower at deeper level but frequency is closely
linked with the grade of hydrothermal activity. The chief fracture minerals include illite,
kaolinite, unspecified mixed clay phases mainly illite, chlorite and smectite-group. The
amount of iron sulphides is higher at the first 200 metres, where it often forms
monomineralic coatings. The fracture plains are frequently covered by cohesive
chlorite. Iron oxides and oxy-hydroxides occur in fractures at surficial zone, in core
length 9.53 – 18.95 m., while graphite is present in several fractures in core length 20 -
50 m. Pervasive illitization concerns 11 % of the total core length and 36 % has calcite
as major constituent in fracture fillings.
Kairanäytteen OL-KR22 JA OL-KR22B petrologia, petrofysiikka ja rakomineralogia
TIIVISTELMÄ
Tässä raportissa esitetään kairausnäytteitä OL-KR22 ja OL-KR22B koskevien
tutkimusten tulokset. Kyseiset kairanreiät on tehty Olkiluodon tutkimusalueen kaakkois-
osaan. Raportissa esitetään kairausnäytteen litologiaa sekä valittujen näytteiden koko-
kiven kemiallista koostumusta, mineraalikoostumusta, tekstuuria ja petrofysikaalisia
ominaisuuksia käsittelevien tutkimusten tulokset. Samoin kuvataan matalan lämpötilan
raontäytemineraalit
Kairanreikä alkaa diateksiittisesta gneissijaksosta ja leikkaa aina 360 m:n pituudelle
saakka varsin monotonisia diateksiittisia gneissejä, joita leikkaa pari leveää pegma-
tiittista graniittijuonta ja joissa on muutamia homogeenisia kiillegneisseistä ja mafisista
gneisseistä koostuvia välikerroksia. Tämän alapuolella jatkuu aina 422 m:n kairaus-
pituudelle saakka suonigneissijakso, jossa on kapeita kiillegneissivälikerroksia.
Yksityiskohtaiset petrologiset ominaisuudet on analysoitu 12 näytteestä. T-sarjaa edus-
taa kuusi diateksiittista gneissinäytettä ja yksi suonigneissinäyte. Ainoastaan äärim-
mäisen emäksiset ja happmat muunnokset puuttuvat tästä joukosta, jonka jäsenten SiO2
vaihtelevat biotiittia paljon sisältävästä suonigneissistä analysoidusta 58 %:sta vaalean
diateksiittisen gneissin 73 %:iin. Yksi mafinen gneissinäyte lukeutuu S-sarjaan. Se
edustaa tämän ryhmän emäksisintä muunnosta ja sisältää SiO22:ta vain 43% mutta
CaO:a siinä on noin 10%. P-sarjasta on valittu tutkittavaksi yksi TGG-gneissi, yksi
diateksiittinen gneissi ja kaksi kiillegneissinäytettä. P-sarjalle tyypilliseen tapaan
näytteiden fosforipitoisuus ylittää 0,4 % ilmoitettuna P2O5:na ja SiO2–pitoisuus
vaihtelee välillä 50 % ja 65 %.
Petrofysikaaliset ominaisuudet on määritetty 12 näytteestä. Mitatut parametrit ovat
tiheys, magneettinen suskebtibiliteetti, luonnollinen remanentti magnetoituma, sähkö-
vastus, P-aallon nopeus ja huokoisuus.
Kairausnäytteen OL-KR22 rakotiheys on keskimäärin 3,8 rakoa/metri. Rakoilu on
voimakkaampaa 200 metrin kairauspituudelle saakka, jota syvempänä rakoilu keskittyy
hydrotermisen muuttumisen läpikäyneisiin vyöhykkeisiin ja muihin rikkonaisuus-
vyöhykkeisiin. Näissä vyöhykkeissä rakotäytteinä esiintyy illiittiä, kaoliniittia, erikseen
määrittelemättömiä useamman savispesieksen muodostamia savisseostäytteitä (pää-
asiassa illiitti, kloriitti ja smektiitti-ryhmä), rautasulfideja ja kalsiittia. Kloriitti muodos-
taa tyypillisesti rakojen pinnoille kiinteän katteen, joka on usein alustana muille
rakotäytteille. Rautaoksideja ja –oksihydroksideja esiintyy useissa raoissa kairaus-
pituusvälillä 9,53-18,95 m ja grafiittia välillä 20-50 m. Kairauslävistyksestä on 11 %
läpikotaisesti illiittiytynyttä. Kalsiittivaltaisia täyteseurantoja esiintyy 36 %:ssa kairaus-
näytteen koko pituudesta.
1
TABLE OF CONTENTS
ABSTRACT
TIIVISTELMÄ
1 INTRODUCTION .................................................................................................... 2 1.1 Location and General Geology of Olkiluoto .................................................... 2 1.2 Boreholes and Drill Core Samples OL-KR22 and OL-KR22B......................... 5 1.3 The aim of this study and research methods .................................................. 5 1.4 Research Activities ......................................................................................... 6
2 PETROLOGY...................................................................................................... 8 2.1 Lithology.......................................................................................................... 8 2.2 Whole Rock Chemistry ................................................................................. 13 2.3 Petrography .................................................................................................. 19
3 PETROPHYSICS.............................................................................................. 22 3.1 Density and magnetic properties .................................................................. 23 3.2 Electrical properties and porosity.................................................................. 24 3.3 P-wave velocity ............................................................................................. 25
4 FRACTURE MINERALOGY ............................................................................. 26 4.1 Fracture fillings at the major pervasive alteration zones............................... 26 4.2 Fracture fillings outside the pervasively altered zones.................................. 29 4.3 Iron-oxides and oxy-hydroxides in fracture assemblages............................. 32 4.4 Relationship between fracture filling data and calvanic connection measurements .............................................................................................. 32
5 SUMMARY........................................................................................................ 34
REFERENCES ............................................................................................................. 37
APPENDICES............................................................................................................... 38
2
1 INTRODUCTION
According to the Nuclear Energy Act, all nuclear waste generated in Finland must be
handled, stored and permanently disposed of in Finland. The two nuclear power
companies, Teollisuuden Voima Oy and Fortum Power and Heat Oy, are responsible for
the safe management of the waste. The power companies have established a joint
company, Posiva Oy, to implement the disposal programme for spent fuel, whilst other
nuclear wastes are handled and disposed of by the power companies themselves.
The plans for the disposal of spent fuel are based on the KBS-3 concept, which was
originally developed by the Swedish SKB. The spent fuel elements will be encapsulated
in metal canisters and emplaced at a depth of several hundreds of meters.
At present Posiva has started the construction of an underground rock characterisation
facility at Olkiluoto. The plan is that, on the basis of underground investigations and
other work, Posiva will submit an application for a construction licence for the disposal
facility in the early 2010s, with the aim of starting disposal operations in 2020.
As a part of these investigations, Posiva Oy continues detailed bedrock studies to get a
more comprehensive conception of lithology and bedrock structure of the study site. As
a part of that work, this report summarises the results obtained from petrological and
petrophysical studies and fracture mineral loggings of drill cores OL-KR22 and OL-
KR22B.
1.1 Location and General Geology of Olkiluoto
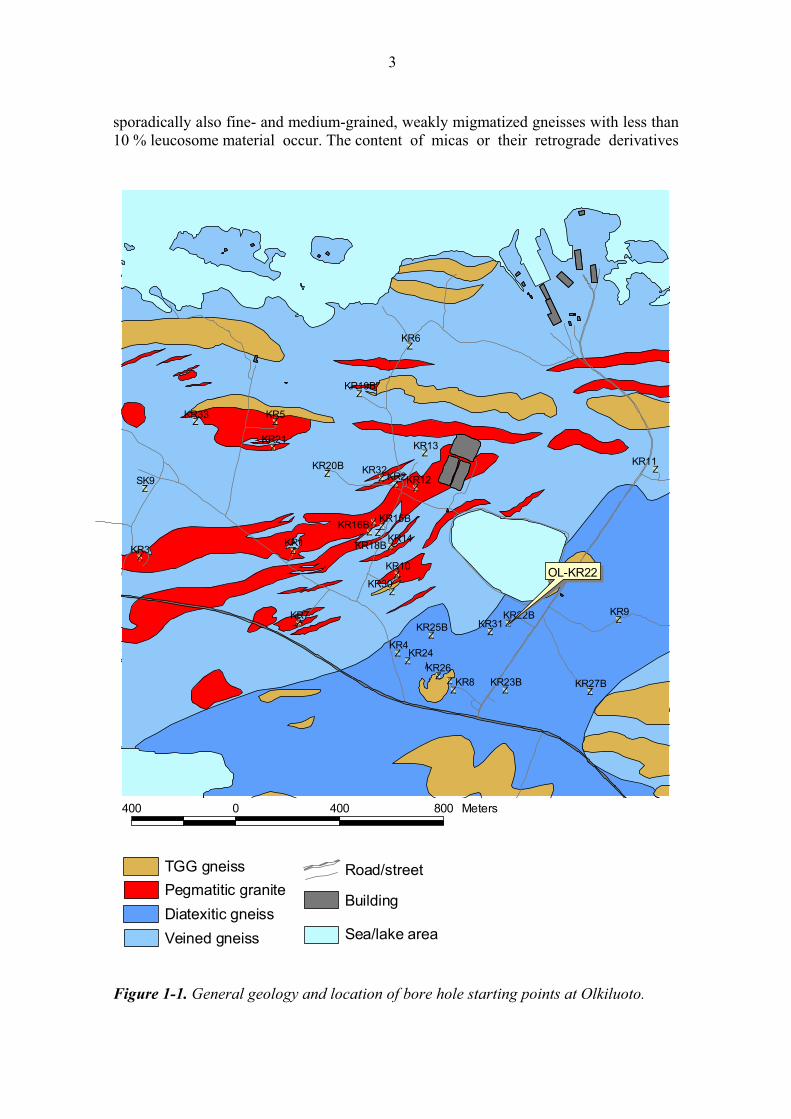
The Olkiluoto site is located in the SW Finland, western part of the Eurajoki municipal
and belongs to the Paleoproterozoic Svecofennian domain ca. 1900 - 1800 million years
in age (Korsman et al. 1997, Suominen et al. 1997, Veräjämäki 1998, ). The bedrock is
composed for the most part of various, high grade metamorphic supracrustal rocks (Fig.
1-1), the source materials of which are various epi- and pyroclastic sediments. In
addition, leucocratic pegmatites have been met frequently and also some narrow mafic
dykes cut the bedrock of Olkiluoto. The practice of naming the rock types follows the
orders of Posiva Oy (Mattila 2006).
On the basis of the texture, migmatite structure and major mineral composition, the
rocks of Olkiluoto fall into four main classes: 1) gneisses, 2) migmatitic gneisses, 3)
TGG gneisses, and 4) pegmatitic granites (Kärki & Paulamäki 2006). In addition,
narrow diabase dykes have been met sporadically.
Subdivision of the gneissic rocks has to be based on modal mineral composition. Mica
gneisses, mica bearing quartz gneisses and hornblende or pyroxene bearing mafic
gneisses are often banded but rather homogeneous types have also been met. Quartz
gneisses are fine-grained, often homogeneous and typically poorly foliated rocks that
contain more than 60% quartz and feldspars but 20% micas at most. They may contain
some amphibole or pyroxene and garnet porphyroblasts are also typical for one
subgroup. Mica rich metapelites are in most cases intensively migmatitized but
3
sporadically also fine- and medium-grained, weakly migmatized gneisses with less than
10 % leucosome material occur. The content of micas or their retrograde derivatives
Veined gneiss
Diatexitic gneiss
Pegmatitic granite
TGG gneiss
Sea/lake area
Building
Road/street
OL-KR8
N
400 0 400 800 Meters
$Z
$Z
$Z
$Z
$Z
$Z
$Z
$Z
$Z
$Z
$Z
$Z
$Z
$Z
$Z$Z$Z$Z
$Z
$Z
$Z
$Z
$Z
$Z
$Z
$Z
$Z$Z
$Z
$Z
$Z
$Z
$Z
KR1
KR2
KR3
KR4
KR5
KR6
KR7
KR8
KR9
SK9
KR10
KR11
KR12
KR13
KR14
KR21
KR24
KR26
KR30
KR31
KR32
KR33
KR15BKR16B
KR18B
KR19B
KR20B
KR22B
KR23B
KR25B
KR27B
OL-KR22
Figure 1-1. General geology and location of bore hole starting points at Olkiluoto.
4
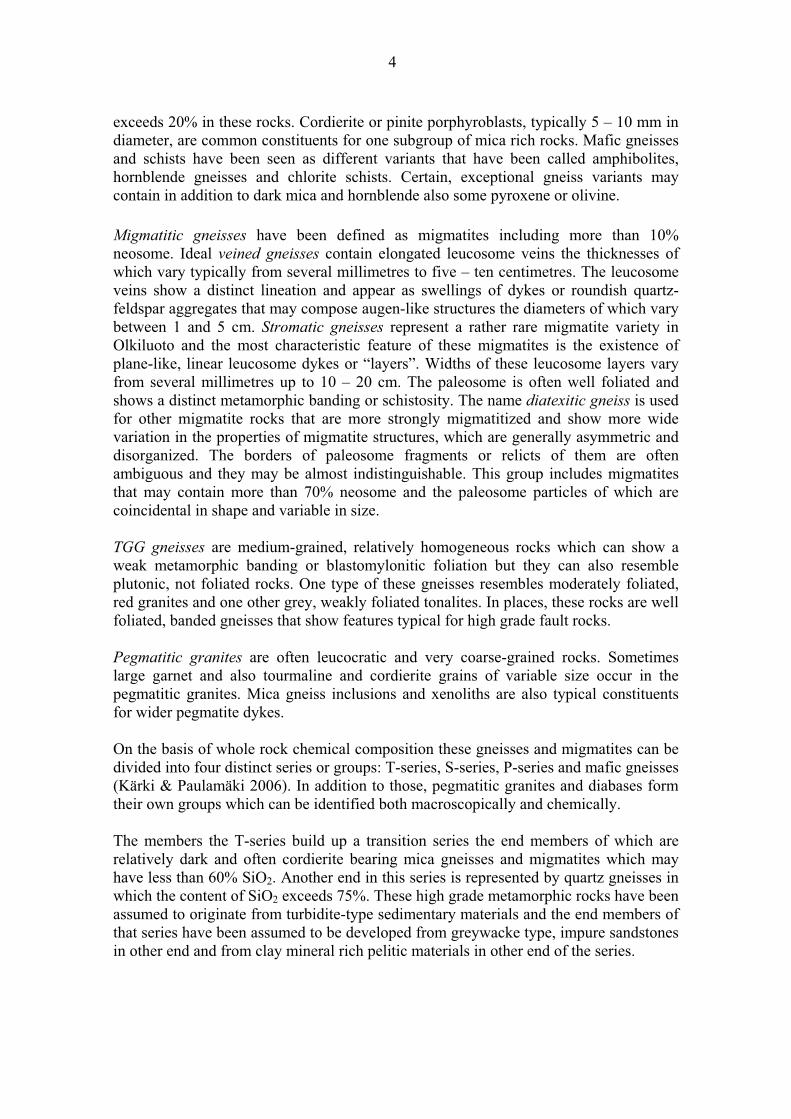
exceeds 20% in these rocks. Cordierite or pinite porphyroblasts, typically 5 – 10 mm in
diameter, are common constituents for one subgroup of mica rich rocks. Mafic gneisses
and schists have been seen as different variants that have been called amphibolites,
hornblende gneisses and chlorite schists. Certain, exceptional gneiss variants may
contain in addition to dark mica and hornblende also some pyroxene or olivine.
Migmatitic gneisses have been defined as migmatites including more than 10%
neosome. Ideal veined gneisses contain elongated leucosome veins the thicknesses of
which vary typically from several millimetres to five – ten centimetres. The leucosome
veins show a distinct lineation and appear as swellings of dykes or roundish quartz-
feldspar aggregates that may compose augen-like structures the diameters of which vary
between 1 and 5 cm. Stromatic gneisses represent a rather rare migmatite variety in
Olkiluoto and the most characteristic feature of these migmatites is the existence of
plane-like, linear leucosome dykes or “layers”. Widths of these leucosome layers vary
from several millimetres up to 10 – 20 cm. The paleosome is often well foliated and
shows a distinct metamorphic banding or schistosity. The name diatexitic gneiss is used
for other migmatite rocks that are more strongly migmatitized and show more wide
variation in the properties of migmatite structures, which are generally asymmetric and
disorganized. The borders of paleosome fragments or relicts of them are often
ambiguous and they may be almost indistinguishable. This group includes migmatites
that may contain more than 70% neosome and the paleosome particles of which are
coincidental in shape and variable in size.
TGG gneisses are medium-grained, relatively homogeneous rocks which can show a
weak metamorphic banding or blastomylonitic foliation but they can also resemble
plutonic, not foliated rocks. One type of these gneisses resembles moderately foliated,
red granites and one other grey, weakly foliated tonalites. In places, these rocks are well
foliated, banded gneisses that show features typical for high grade fault rocks.
Pegmatitic granites are often leucocratic and very coarse-grained rocks. Sometimes
large garnet and also tourmaline and cordierite grains of variable size occur in the
pegmatitic granites. Mica gneiss inclusions and xenoliths are also typical constituents
for wider pegmatite dykes.
On the basis of whole rock chemical composition these gneisses and migmatites can be
divided into four distinct series or groups: T-series, S-series, P-series and mafic gneisses
(Kärki & Paulamäki 2006). In addition to those, pegmatitic granites and diabases form
their own groups which can be identified both macroscopically and chemically.
The members the T-series build up a transition series the end members of which are
relatively dark and often cordierite bearing mica gneisses and migmatites which may
have less than 60% SiO2. Another end in this series is represented by quartz gneisses in
which the content of SiO2 exceeds 75%. These high grade metamorphic rocks have been
assumed to originate from turbidite-type sedimentary materials and the end members of
that series have been assumed to be developed from greywacke type, impure sandstones
in other end and from clay mineral rich pelitic materials in other end of the series.
5
The members of the S-series have been assumed to originate from calcareous
sedimentary materials or affected by some other processes that produced the final,
skarn-type formations. The most essential difference between the members of the S-
series and other groups is in the high calcium (>2% CaO) concentration of the S-type
rocks. Relatively low contents of alkalis and high contents of manganese are also
typical for this series. Various quartz gneisses, mica gneisses and mafic gneisses
constitute the most typical members of the S series while migmatitic rocks are
infrequent.
The P-series deviates from the others due to high contents of phosphorus. P2O5 content
that exceeds 0.3% is characteristic for the members of the P-series whereas the other
common supracrustal rock types in Olkiluoto contain typically less than 0.2% P2O5.
Another characteristic feature for the members of the P-series is the comparatively high
concentration of calcium which falls between the concentration levels of the T- and S-
series. Mafic gneisses, mica gneisses, various migmatites and TGG gneisses are the
most characteristic rock types of the P series. SiO2 content of the mafic P-type gneisses
varies between 42 and 52%, in the mica gneisses and migmatites it is limited between
55 and 65% and in the P-type TGG gneisses the variation is more wide the
concentrations falling between 52 and 71%.
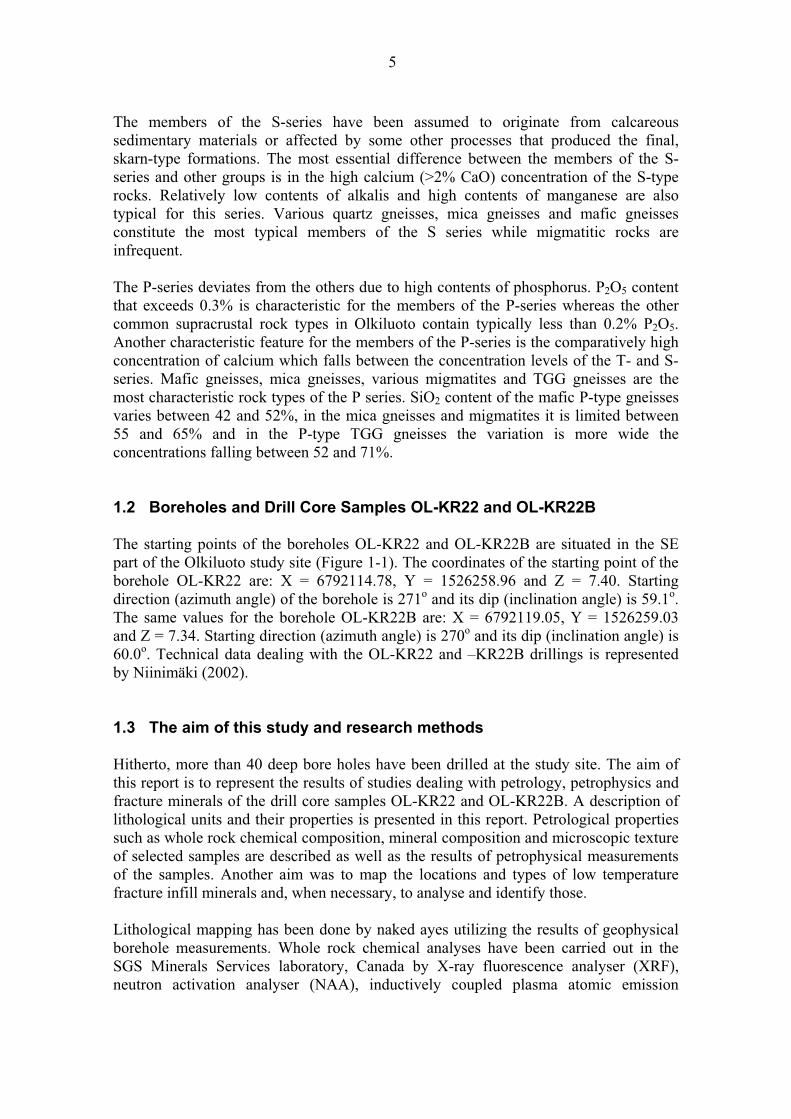
1.2 Boreholes and Drill Core Samples OL-KR22 and OL-KR22B
The starting points of the boreholes OL-KR22 and OL-KR22B are situated in the SE
part of the Olkiluoto study site (Figure 1-1). The coordinates of the starting point of the
borehole OL-KR22 are: X = 6792114.78, Y = 1526258.96 and Z = 7.40. Starting
direction (azimuth angle) of the borehole is 271o and its dip (inclination angle) is 59.1
o.
The same values for the borehole OL-KR22B are: X = 6792119.05, Y = 1526259.03
and Z = 7.34. Starting direction (azimuth angle) is 270o and its dip (inclination angle) is
60.0o. Technical data dealing with the OL-KR22 and –KR22B drillings is represented
by Niinimäki (2002).
1.3 The aim of this study and research methods
Hitherto, more than 40 deep bore holes have been drilled at the study site. The aim of
this report is to represent the results of studies dealing with petrology, petrophysics and
fracture minerals of the drill core samples OL-KR22 and OL-KR22B. A description of
lithological units and their properties is presented in this report. Petrological properties
such as whole rock chemical composition, mineral composition and microscopic texture
of selected samples are described as well as the results of petrophysical measurements
of the samples. Another aim was to map the locations and types of low temperature
fracture infill minerals and, when necessary, to analyse and identify those.
Lithological mapping has been done by naked ayes utilizing the results of geophysical
borehole measurements. Whole rock chemical analyses have been carried out in the
SGS Minerals Services laboratory, Canada by X-ray fluorescence analyser (XRF),
neutron activation analyser (NAA), inductively coupled plasma atomic emission
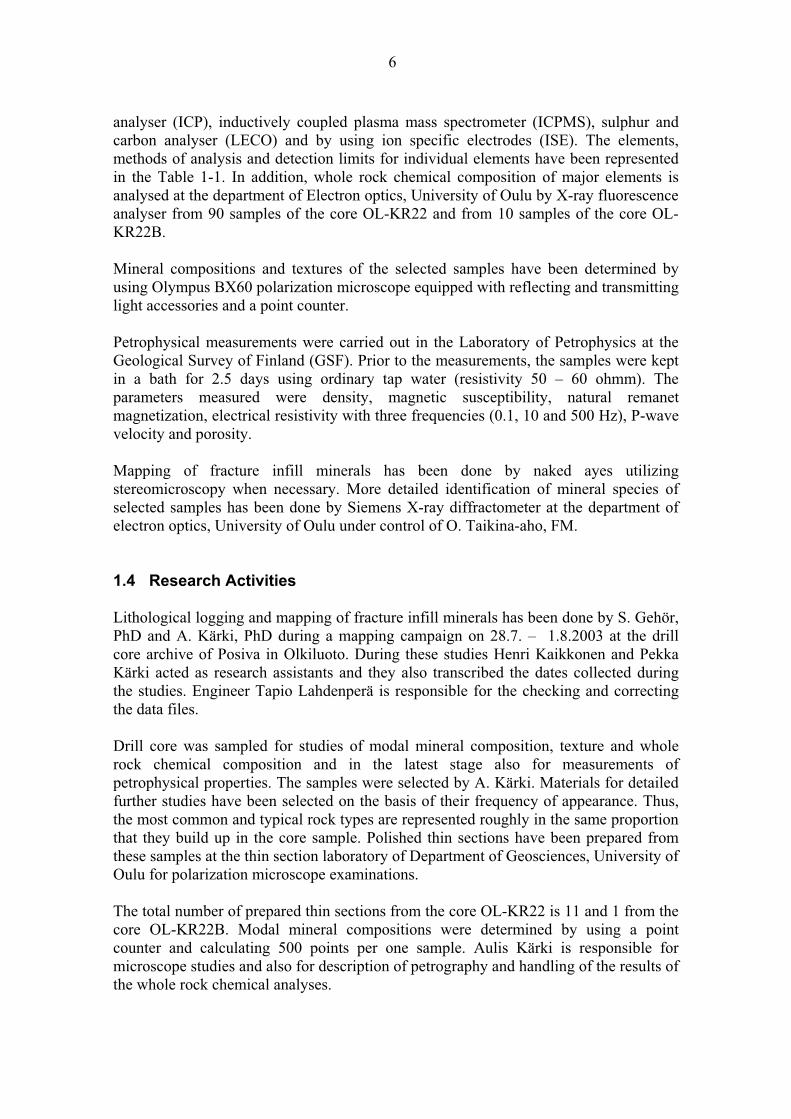
6
analyser (ICP), inductively coupled plasma mass spectrometer (ICPMS), sulphur and
carbon analyser (LECO) and by using ion specific electrodes (ISE). The elements,
methods of analysis and detection limits for individual elements have been represented
in the Table 1-1. In addition, whole rock chemical composition of major elements is
analysed at the department of Electron optics, University of Oulu by X-ray fluorescence
analyser from 90 samples of the core OL-KR22 and from 10 samples of the core OL-
KR22B.
Mineral compositions and textures of the selected samples have been determined by
using Olympus BX60 polarization microscope equipped with reflecting and transmitting
light accessories and a point counter.
Petrophysical measurements were carried out in the Laboratory of Petrophysics at the
Geological Survey of Finland (GSF). Prior to the measurements, the samples were kept
in a bath for 2.5 days using ordinary tap water (resistivity 50 – 60 ohmm). The
parameters measured were density, magnetic susceptibility, natural remanet
magnetization, electrical resistivity with three frequencies (0.1, 10 and 500 Hz), P-wave
velocity and porosity.
Mapping of fracture infill minerals has been done by naked ayes utilizing
stereomicroscopy when necessary. More detailed identification of mineral species of
selected samples has been done by Siemens X-ray diffractometer at the department of
electron optics, University of Oulu under control of O. Taikina-aho, FM.
1.4 Research Activities
Lithological logging and mapping of fracture infill minerals has been done by S. Gehör,
PhD and A. Kärki, PhD during a mapping campaign on 28.7. – 1.8.2003 at the drill
core archive of Posiva in Olkiluoto. During these studies Henri Kaikkonen and Pekka
Kärki acted as research assistants and they also transcribed the dates collected during
the studies. Engineer Tapio Lahdenperä is responsible for the checking and correcting
the data files.
Drill core was sampled for studies of modal mineral composition, texture and whole
rock chemical composition and in the latest stage also for measurements of
petrophysical properties. The samples were selected by A. Kärki. Materials for detailed
further studies have been selected on the basis of their frequency of appearance. Thus,
the most common and typical rock types are represented roughly in the same proportion
that they build up in the core sample. Polished thin sections have been prepared from
these samples at the thin section laboratory of Department of Geosciences, University of
Oulu for polarization microscope examinations.
The total number of prepared thin sections from the core OL-KR22 is 11 and 1 from the
core OL-KR22B. Modal mineral compositions were determined by using a point
counter and calculating 500 points per one sample. Aulis Kärki is responsible for
microscope studies and also for description of petrography and handling of the results of
the whole rock chemical analyses.
7
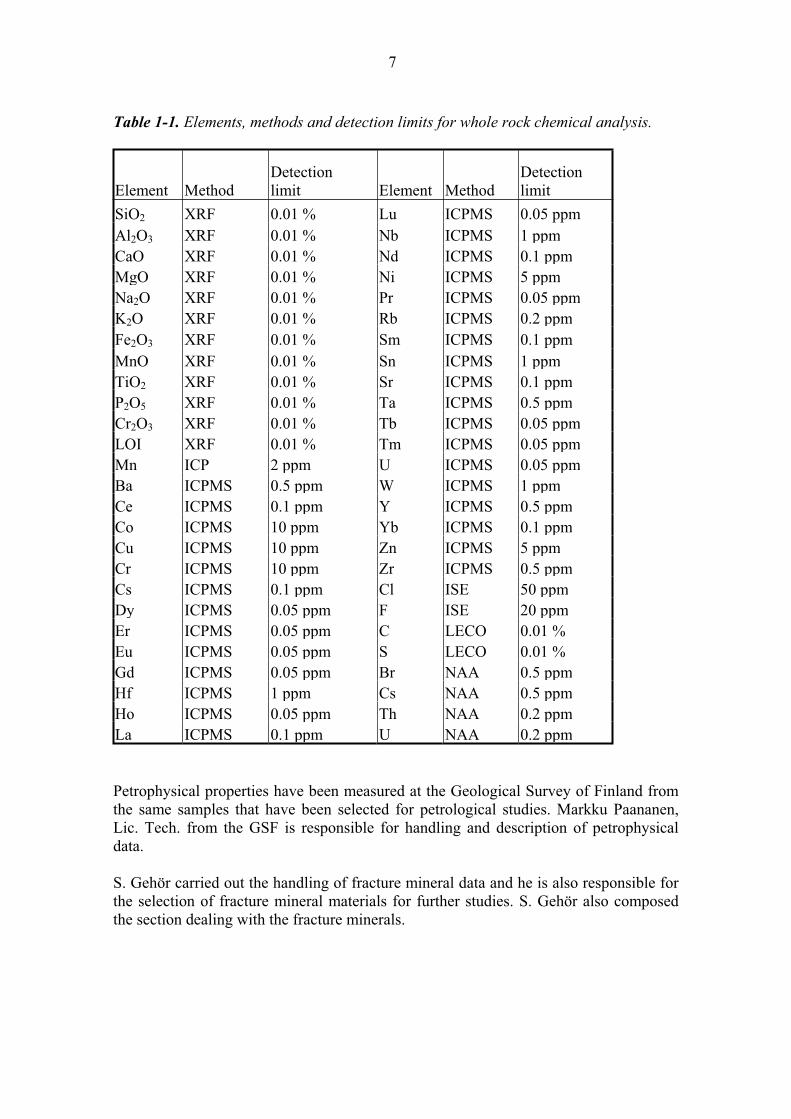
Table 1-1. Elements, methods and detection limits for whole rock chemical analysis.
Element Method
Detection
limit Element Method
Detection
limit
SiO2 XRF 0.01 % Lu ICPMS 0.05 ppm
Al2O3 XRF 0.01 % Nb ICPMS 1 ppm
CaO XRF 0.01 % Nd ICPMS 0.1 ppm
MgO XRF 0.01 % Ni ICPMS 5 ppm
Na2O XRF 0.01 % Pr ICPMS 0.05 ppm
K2O XRF 0.01 % Rb ICPMS 0.2 ppm
Fe2O3 XRF 0.01 % Sm ICPMS 0.1 ppm
MnO XRF 0.01 % Sn ICPMS 1 ppm
TiO2 XRF 0.01 % Sr ICPMS 0.1 ppm
P2O5 XRF 0.01 % Ta ICPMS 0.5 ppm
Cr2O3 XRF 0.01 % Tb ICPMS 0.05 ppm
LOI XRF 0.01 % Tm ICPMS 0.05 ppm
Mn ICP 2 ppm U ICPMS 0.05 ppm
Ba ICPMS 0.5 ppm W ICPMS 1 ppm
Ce ICPMS 0.1 ppm Y ICPMS 0.5 ppm
Co ICPMS 10 ppm Yb ICPMS 0.1 ppm
Cu ICPMS 10 ppm Zn ICPMS 5 ppm
Cr ICPMS 10 ppm Zr ICPMS 0.5 ppm
Cs ICPMS 0.1 ppm Cl ISE 50 ppm
Dy ICPMS 0.05 ppm F ISE 20 ppm
Er ICPMS 0.05 ppm C LECO 0.01 %
Eu ICPMS 0.05 ppm S LECO 0.01 %
Gd ICPMS 0.05 ppm Br NAA 0.5 ppm
Hf ICPMS 1 ppm Cs NAA 0.5 ppm
Ho ICPMS 0.05 ppm Th NAA 0.2 ppm
La ICPMS 0.1 ppm U NAA 0.2 ppm
Petrophysical properties have been measured at the Geological Survey of Finland from
the same samples that have been selected for petrological studies. Markku Paananen,
Lic. Tech. from the GSF is responsible for handling and description of petrophysical
data.
S. Gehör carried out the handling of fracture mineral data and he is also responsible for
the selection of fracture mineral materials for further studies. S. Gehör also composed
the section dealing with the fracture minerals.
8
2 PETROLOGY
The practice for naming (Mattila 2006) and lithological classification proposed by Kärki
and Paulamäki (2006) has been utilized in the description and grouping of lithological
units. More detailed classification has to be based on the evaluation of whole rock
chemical composition or modal mineral composition and that is not possible without
information based on the accurate results of instrumental analysis.
2.1 Lithology
The drill holes intersect down to length of 360 m a rather monotonous diatexitic gneiss
unit which is intruded by a couple of rather wide pegmatitic granite dykes and has
several homogeneous mica gneiss and mafic gneiss subsections. Below that, down to
the drilling length of 422 m a fluctuating section of veined gneisses with narrow mica
gneiss interbeds is located. The lowermost part of the core sample is composed of rather
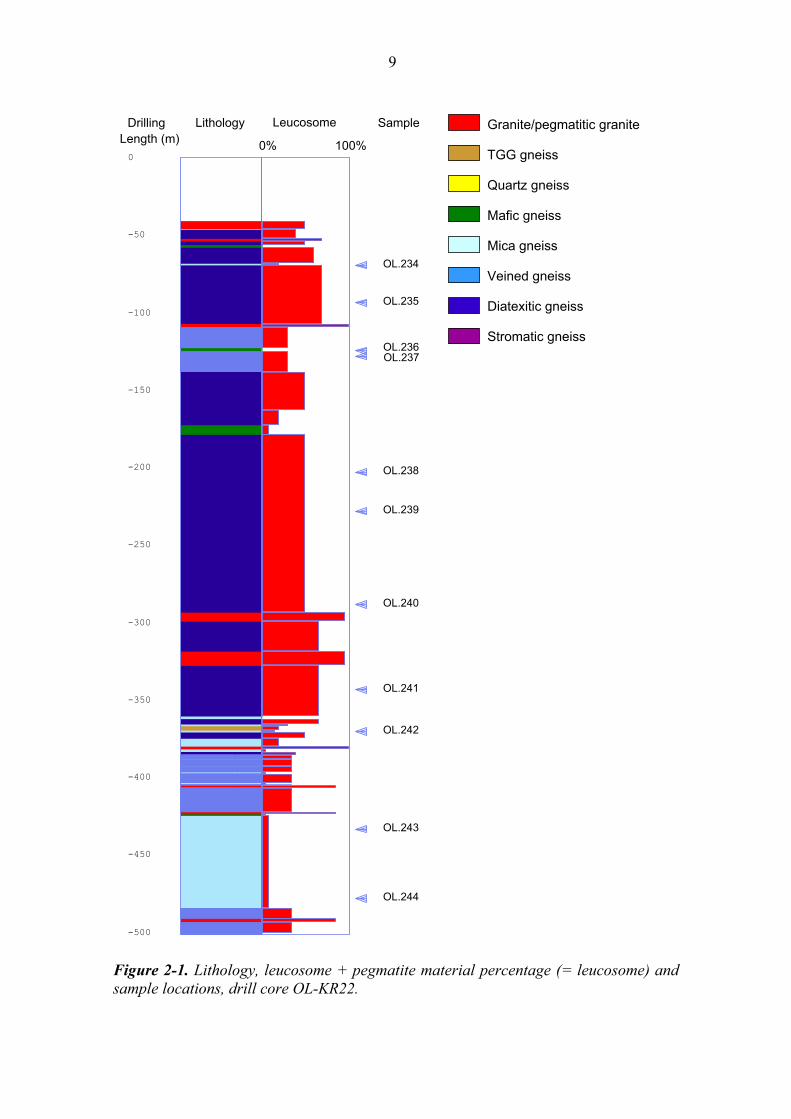
homogeneous mica gneisses with various migmatite subsections (Figure 2-1). A more
detailed description of lithological units is presented in the Tables 2-1 and 2-2.
Table 2-1. Lithology of the drill core sample OL-KR22.
Drilling
length (m) Lithology
40.66 – 46.00 PEGMATITIC GRANITE – DIATEXITIC GNEISS mixture which is
irregular, breccia-like for a part and in which the components fluctuate
randomly. The proportion of granitoids material is 50% in average.
46.00 – 46.27 Crushed migmatite.
46.27 – 52.20 VEINED GNEISS – DIATEXITIC GNEISS mixture. Veined gneisses
with a large proportion of leucosome dominate in the upper part of the
section but in the deeper part the rock changes to breccia-like rock
which is subsequently crushed. The rock contains ca. 40% leucosome.
52.20 – 53.60 PEGMATITIC GRANITE which is, for a part, leucocratic and coarse-
grained pegmatite but for a part it is build of irregular, brecciated
mixture of gneisses and pegmatites. Gneiss blocks compose ca. 30%
of the whole rock volume.
53.60 – 56.35 DIATEXITIC GNEISS – QUARTZ GNEISS – PEGMATITIC
GRANITE mixture in which various components of different sizes
and shapes fluctuate randomly. The rock mixture has features of
intrusive breccia and is strongly altered in the whole section. The
proportion of granitoid component is ca. 50%.
56.35 – 58.15 MAFIC GNEISS or fine-grained and relatively homogeneous
amphibolite which seems to be strongly chloritized and saussuritized.
9
0
-50
-100
-150
-200
-250
-300
-350
-400
-450
-500
OL.234
OL.235
OL.236OL.237
OL.238
OL.239
OL.240
OL.241
OL.242
OL.243
OL.244
Drilling Lithology Sample Leucosome
0% 100%Length (m)
Figure 2-1. Lithology, leucosome + pegmatite material percentage (= leucosome) and
sample locations, drill core OL-KR22.
Granite/pegmatitic granite
TGG gneiss
Quartz gneiss
Mafic gneiss
Mica gneiss
Veined gneiss
Diatexitic gneiss
Stromatic gneiss
10
58.15 – 67.90 DIATEXITIC GNEISS which, for a part, resembles the veined
gneisses but, for a part, is a totally irregular diatexite in which the
proportion of leucosome is ca. 60%.
67.90 – 69.22 QUARTZ GNEISS – MICA GNEISS mixture in which the gneisses
are homogeneous, weakly foliated and contain ca. 20% leucosome.
Granite pegmatites intersect the gneisses as 10 – 20 cm wide and
randomly situated dykes.
69.22 – 107.00 DIATEXITIC GNEISS which contains cordierite and high proportion,
close to 70% leucosome and pegmatite dykes. A small part of
paleosome is composed of quartz gneiss and those sections are close
to free of leucosome while typical, biotite rich sections are strongly
migmatitized and also intruded by 20 – 80 cm wide pegmatitic dykes.
107.00 – 109.25 PEGMATITIC GRANITE which is coarse-grained, leucocratic and
epidotized in places but rather free of gneiss inclusions.
109.25 - 122.80 VEINED GNEISS in which the leucosome veins are 1 – 3 cm in width
and in addition to that, the rock is intruded by 10 – 60 cm wide
pegmatite dykes. The paleosome is medium-grained and shows a
distinct metamorphic banding.
122.80 - 125.05 MAFIC GNEISS (amphibolite/chlorite schist) which is homogeneous
and fine to medium-grained.
125.05 - 138.20 VEINED GNEISS in which leucosomes are 1 – 3 cm wide veins and,
in addition to those, the rock is intruded by 10 – 60 cm wide pegmatite
dykes. The paleosome is medium-grained and shows a distinct
metamorphic banding.
138.20 - 162.98 DIATEXITIC GNEISS in which the migmatite structure is highly
variable. A part of the section resembles vein migmatites but mostly it
is composed of irregular diatexite in which gneiss inclusions of
various sizes are typical.
162.98 - 172.40 DIATEXITIC GNEISS – MICA GNEISS mixture the paleosome of
varies from homogeneous quartz gneisses to banded mica gneisses. In
the upper part of the section, until the drilling length of 165.70 m the
proportion of leucosome is large but from that point onward
leucosome composes 20% of the rock volume and its type of
occurrence is highly variable.
172.40 - 178.55 MAFIC GNEISS (amphibolite) which is fine- or medium-grained,
rather homogeneous and, in particular in the end of the section,
contains ca 10% pegmatitic granite veins which are 20 – 50 cm in
thickness.
11
178.55 – 293.40 DIATEXITIC GNEISS which resembles veined gneisses, for a part,
but mostly it is coarse-grained and the contacts between leucosome
and paleosome are diffuse and irregular. At the drilling length of 220
m the rock transforms to TGG gneiss-like, more homogeneous gneiss
type and at the drilling length of 235 m again to diatexite which
contains vein migmatite-like subsections. The proportion of
leucosome is 50% in average.
293.40 – 299.00 PEGMATITIC GRANITE which is coarse grained and contains dark
grains with diameter ranging from 5 to 10 mm. The pegmatite
contains ca. 5% small gneiss inclusions and biotite schlieren.
299.00 – 318.40 DIATEXITIC GNEISS which is medium-grained and contains 60 -
70% leucosome in average.
318.40 – 327.75 PEGMATITIC GRANITE which is coarse-grained, leucocratic and
contains randomly situated, 5 – 10 cm wide mica schlieren ca. 5%.
327.75 – 360.20 DIATEXITIC GNEISS the paleosome of which is medium-grained.
The leucosome is porphyritic for a part and composes 60-70% of the
rock volume. In addition, the migmatite is intruded by 20 – 80 cm
wide pegmatitic granite dykes.
360.20 – 362.10 MICA GNEISS which is medium-grained, homogeneous and, for a
part, amphibole bearing. The gneiss contains 1 – 2% leucosome.
362.10 – 365.30 DIATEXITIC GNEISS in which the proportion of leucosome is ca.
65%.
365.30 – 366.85 MICA GNEISS which is fine- or medium-grained and contains ca.
30% leucosome.
366.85 – 369.25 TGG GNEISS which is medium-grained, weakly banded and contains
ca. 20% leucosome-like dykes.
369.25 – 370.50 MICA GNEISS which is medium-grained and homogeneous.
370.50 – 374.95 DIATEXITIC GNEISS in which one, 0.5 m wide homogeneous mica
gneiss layer occur and which is intruded by 15 – 60 cm wide
pegmatite dykes.
374.95 – 379.90 MICA GNEISS which is medium-grained, homogeneous and contains
ca. 10% leucosome. In addition, the rock is intruded by several, rather
wide pegmatitic granite dykes.
379.90 – 381.30 PEGMATITIC GRANITE which is free of inclusions.
12
381.30 – 383.25 MICA GNEISS which is medium-grained and homogeneous. The
rock contains ca. 5% leucosome and narrow pegmatite dykes situated
randomly in the section.
383.25 – 385.40 DIATEXITIC GNEISS which contains 40% leucosome.
385.40 – 385.85 MAFIC GNEISS.
385.85 – 405.30 VEINED GNEISS in which the paleosome is mostly medium-grained
and biotite bearing but in subsections 388.00 m – 388.50 m, 392.20 m
– 392.90 m, 396.30 m – 397.40 m and 403.40 m – 404.20 m the
paleosome is homogeneous and medium-grained mica gneiss or mafic
gneiss. In the vein migmatite average proportion of leucosome is 35%.
405.30 – 406.50 PEGMATITIC GRANITE.
406.50 – 422.50 VEINED GNEISS in which subsections of irregular diatexites and
homogeneous mica gneiss occur. The average proportion of
leucosome is 35%.
422.50 – 423.30 PEGMATITIC GRANITE.
423.30 – 424.50 MAFIC GNEISS – MICA GNEISS mixture in which the proportion
of leucosome is 5%.
424.50 – 483.96 MICA GNEISS – DIATEXITIC GNEISS mixture which contains
10 – 30% leucosome in average and, in general, the rock is relatively
homogeneous but intruded by 5 – 30 cm wide pegmatitic granite
dykes.
483.96 – 490.90 VEINED GNEISS which, in places, has typical veined structure but
resembles in places irregular diatexites and elsewhere homogeneous
mica gneisses. The average proportion of leucosome is 35%.
490.90 – 493.20 PEGMATITIC GRANITE which is coarse-grained and leucocratic.
493.20 – 500.47 VEINED GNEISS.
Table 2-2. Lithology of the drill core sample OL-KR22B.
Drilling
length (m) Lithology
8.15 – 20.75 DIATEXITIC GNEISS which is pervasively strongly altered, reddish
and hematite bearing for a part and greenish for a part. The proportion
of leucosome is 70 – 80%.
13
20.75 – 27.80 DIATEXITIC GNEISS in which the migmatite structure and
leucosome bodies are totally irregular and the contacts between
different components are diffuse. The subsection from 24.60 m to
25.25 m is composed of homogeneous, fine-grained mafic gneiss in
which narrow breccia zones, 5 – 10 cm in thickness, occur. The
proportion of leucosome is large, 70 – 80%.
27.80 – 32.50 TGG GNEISS which is medium-grained and relatively weakly
oriented. The rock contains ca. 10% leucosome.
32.50 – 45.55 DIATEXITIC GNEISS in which narrow subsections of veined
gneisses occur. The most part of the section is composed of irregular
diatexite in which the proportion of leucosome is 70 - 80%.
2.2 Whole Rock Chemistry
Whole rock chemical composition is analysed from 12 samples. Seven of those are
migmatites of the T series, four are gneisses and migmatites of the P series and one is
mafic, S-type gneiss. The numerical results of the whole rock chemical analyses are
represented in the Appendix 1. In addition, 100 XRF major element analyses were made
from samples that were taken by 5 m average interval from the core sample. The results
of these analyses are given in the Appendix 2. The aim of these extra analyses was to
clarify the ideas of distribution and proportions of members of various rock series (T, S
and P series).
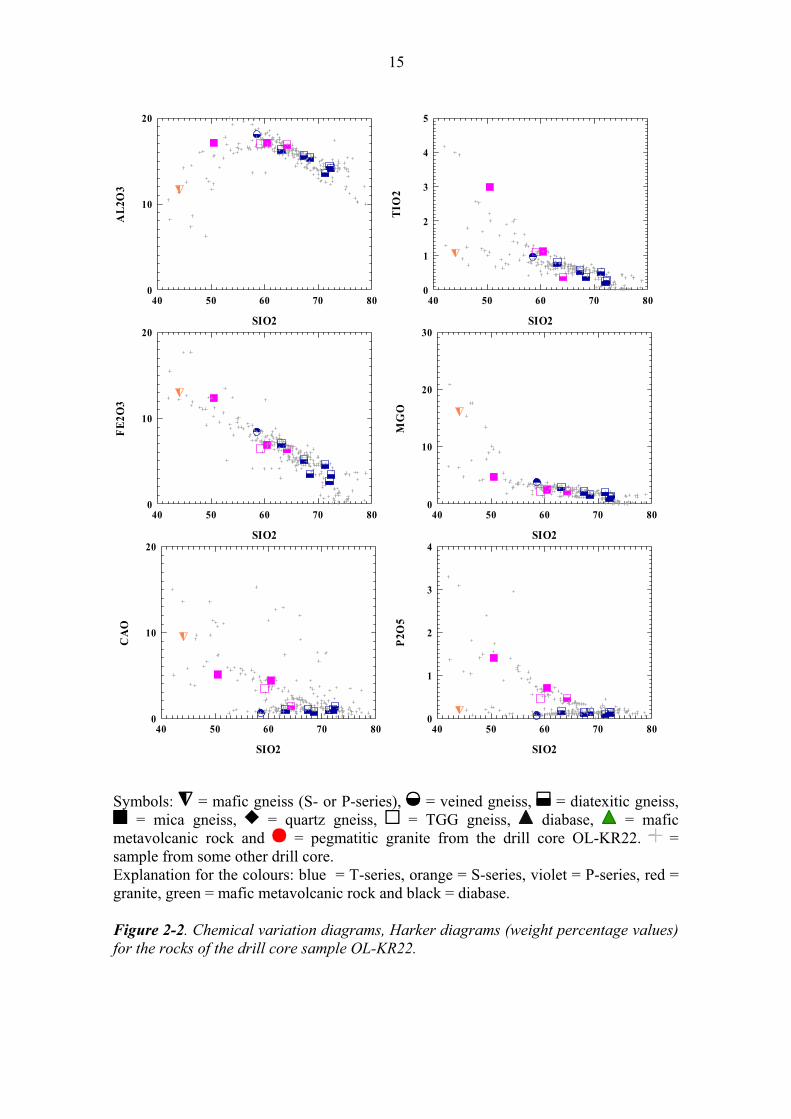
The T series is represented by six diatexitic gneiss samples and one veined gneiss
sample which give an extensive overview of the whole series. Only the extremely basic
and acidic types are excluded. SiO2 concentration varies from 58% analysed from a
biotite rich veined gneiss to ca. 73% analysed from a light diatexitic gneiss (Fig. 2.2).
Following the increase in silicity the content of TiO2 decreases from 1% to 0.2%, Al2O3
from 18% to 14%, Fe2O3 from 8% to 2% and MgO from 4% to 1% in various migmatite
samples. The contents of CaO and Na2O seem to have increasing trends. CaO
concentration increases from 0.5% to 1.5% and Na2O from 1.5% to 3.5% while SiO2
increases from 58% to 72% (Appendix1).
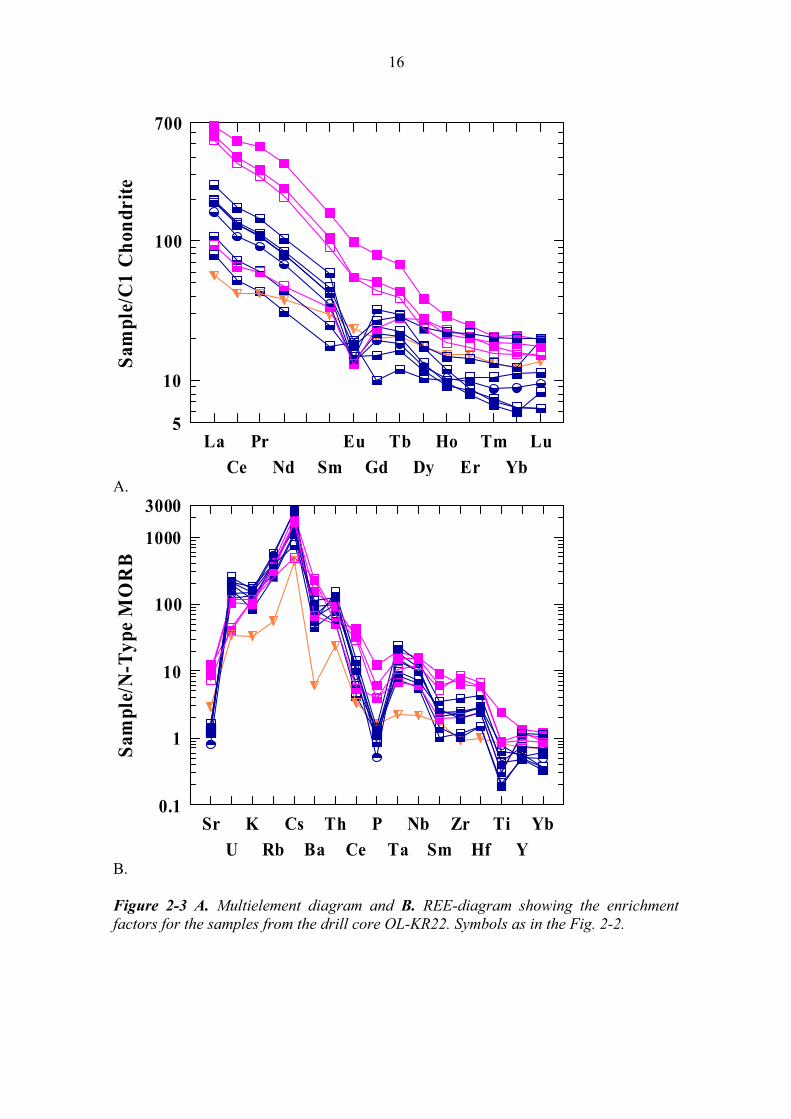
Trace element concentrations and element ratios are in the most cases quite typical for
the T series (Fig. 2.3). The only exception can be seen in the REE diagram which
depicts the sample OL.235. In that the REE concentrations are systematically lower
than in other samples and it also shows a negative Eu anomaly. However, the other trace
element concentrations are strictly in the anticipated numbers. Only the contents of Th,
Ce and Sm are in the sample 235 a little lower than typical numbers (Fig. 2.3).
One mafic gneiss sample is included into the S-series. The sample is the most mafic
example analysed from this group. It contains SiO2 only 43% and CaO ca. 10% and, in
other respects, it is a typical mafic gneiss of the S series including 12% Al2O3, 13%
Fe2O3 and 16% MgO. The contents of alkalis are low, below 1% both Na2O and K2O.
14
The REE and other trace element concentrations are typical for mafic S-type gneisses
but deviate slightly from the other groups. The gently dipping REE diagram and total
lack of europium anomaly (Fig. 2.3) demonstrate this difference.
The P series is represented by one TGG gneiss, one diatexitic gneiss and two mica
gneiss samples. Content of phosphorus exceeds 0.4%, given as P2O5, in every of those.
The content of aluminium is constantly ca. 17% despite of the change in silicity (Fig. 2-
2). The other major element concentrations show a clear decreasing trend which is
directly controlled by the increase in silicity (Fig. 2-2). Migmatites are not numerous in
the P series and only four samples of those are of diatexitic type. Major element
concentrations in those as well as in the sample analysed now fall to the numbers typical
for the P-type gneisses (Fig. 2-2). The concentration of potassium is the only exception
and K2O concentration which exceeds 3% (Appendix 1) is similar to that of the P type
TGG gneisses. Equally, the contents of light REE´s (Fig. 2-3) are lower and end
element ratios different (gently dipping REE pattern) from those typical for less
migmatitic members of the P series. Anyhow, the other trace element concentrations do
not deviate remarkably from typical concentrations (Fig. 2-3).
15
40 50 60 70 800
10
20
SIO2
AL
2O
3
40 50 60 70 800
1
2
3
4
5
SIO2
TIO
2
40 50 60 70 800
10
20
SIO2
FE
2O
3
40 50 60 70 800
10
20
30
SIO2
MG
O
40 50 60 70 800
10
20
SIO2
CA
O
40 50 60 70 800
1
2
3
4
SIO2
P2
O5
Symbols: = mafic gneiss (S- or P-series), = veined gneiss, = diatexitic gneiss,
= mica gneiss, = quartz gneiss, = TGG gneiss, diabase, = mafic
metavolcanic rock and = pegmatitic granite from the drill core OL-KR22. =
sample from some other drill core.
Explanation for the colours: blue = T-series, orange = S-series, violet = P-series, red =
granite, green = mafic metavolcanic rock and black = diabase.
Figure 2-2. Chemical variation diagrams, Harker diagrams (weight percentage values)
for the rocks of the drill core sample OL-KR22.
16
5
10
100
700
La
Ce
Pr
Nd Sm
Eu
Gd
Tb
Dy
Ho
Er
Tm
Yb
Lu
Sa
mp
le/C
1 C
ho
nd
rit
e
A.
0.1
1
10
100
1000
3000
Sr
U
K
Rb
Cs
Ba
Th
Ce
P
Ta
Nb
Sm
Zr
Hf
Ti
Y
Yb
Sa
mp
le/N
-Ty
pe
MO
RB
B.
Figure 2-3 A. Multielement diagram and B. REE-diagram showing the enrichment
factors for the samples from the drill core OL-KR22. Symbols as in the Fig. 2-2.
17
The TGG gneiss sample contains less than 60% SiO2 and thus it belongs to the
subgroup of less silicic variants in the P series. P2O5 concentration is ca.0.45% and CaO
concentration exceeds 3% which are typical numbers for the P type gneisses. Similarly,
the high content of aluminium and moderate contents of titanium and iron (Fig. 2-2) are
typical in that sequence. The REE pattern is identical to that of the mica gneiss sample
and the same similarity is visible in the other trace element concentrations (Fig. 2-3).
The samples 234 and 242 represent both extremities in the sequence of the P type mica
gneisses. SiO2 concentration of the former is ca. 50% and of the latter ca. 60%. P2O5
concentration decreases from 1.4% to 0.7% and CaO from 5% close to 4% as silicity
increases (Fig. 2-2). Other major element concentrations are strictly in the anticipated
numbers, too. REE patterns (Fig. 2-3) are typical for the P series and the REE
concentrations are systematically higher in the less silicic sample than in the silicic one.
The other trace element concentrations are also typical for the P series (Fig. 2-3) even
though the silicic sample is enriched in U, Th and Zr in comparison to the less silicic
one.
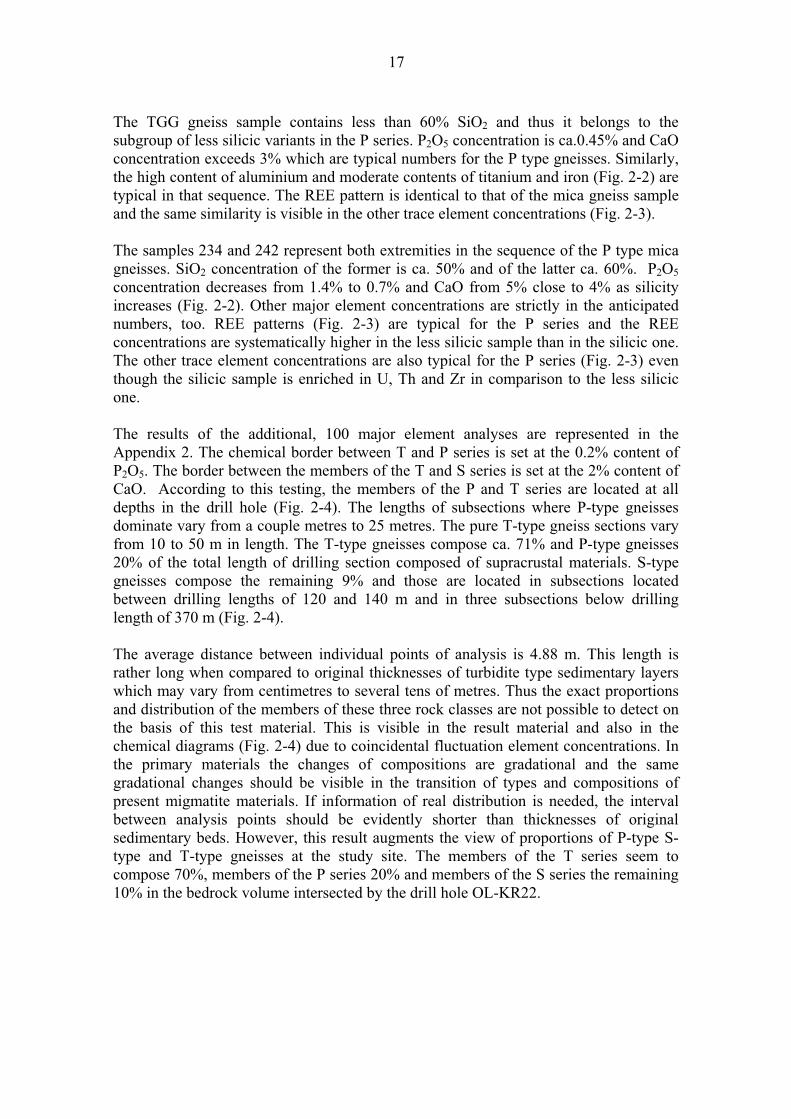
The results of the additional, 100 major element analyses are represented in the
Appendix 2. The chemical border between T and P series is set at the 0.2% content of
P2O5. The border between the members of the T and S series is set at the 2% content of
CaO. According to this testing, the members of the P and T series are located at all
depths in the drill hole (Fig. 2-4). The lengths of subsections where P-type gneisses
dominate vary from a couple metres to 25 metres. The pure T-type gneiss sections vary
from 10 to 50 m in length. The T-type gneisses compose ca. 71% and P-type gneisses
20% of the total length of drilling section composed of supracrustal materials. S-type
gneisses compose the remaining 9% and those are located in subsections located
between drilling lengths of 120 and 140 m and in three subsections below drilling
length of 370 m (Fig. 2-4).
The average distance between individual points of analysis is 4.88 m. This length is
rather long when compared to original thicknesses of turbidite type sedimentary layers
which may vary from centimetres to several tens of metres. Thus the exact proportions
and distribution of the members of these three rock classes are not possible to detect on
the basis of this test material. This is visible in the result material and also in the
chemical diagrams (Fig. 2-4) due to coincidental fluctuation element concentrations. In
the primary materials the changes of compositions are gradational and the same
gradational changes should be visible in the transition of types and compositions of
present migmatite materials. If information of real distribution is needed, the interval
between analysis points should be evidently shorter than thicknesses of original
sedimentary beds. However, this result augments the view of proportions of P-type S-
type and T-type gneisses at the study site. The members of the T series seem to
compose 70%, members of the P series 20% and members of the S series the remaining
10% in the bedrock volume intersected by the drill hole OL-KR22.
18
0
-50
-100
-150
-200
-250
-300
-350
-400
-450
-500
Length(m) Litho Leuc Ser P2O5 CaO SiO2 MgO FeO
Figure 2-1. Lithology (Litho, explanations as in the Fig. 2-1), Leuc = leucosome +
pegmatite material percentage, scale 0 – 100%, rock series; blue = T series, green = S-
series, green = S-series and certain element concentrations, drill core OL-KR22. Scales
of element concentration diagrams: P2O5 = 0 – 2%, CaO = 0 – 16%, SiO2 = 0 - 100%,
MgO = 0 – 20% and FeO = 0 – 20%..
19
2.3 Petrography
The drill core KR22 is represented by 12 samples of which 8 belong to the T series, 1 to
the S series and four to the P series. Modal mineral compositions of these samples are
represented in the Appendix 3.
T- Series
The diatexitic T-type gneisses are represented by six samples, 235, 237, 238, 239, 240,
241 and 244, which belong to the more acidic half of the whole series. SiO2 varies
between 63 and 73% in these diatexites. The content of quartz varies between 27% and
43%, content of plagioclase between 11% and 27% and K-feldspar typically between 11
and 25%. The proportion of biotite or total number of biotite and chlorite, if the latter is
present, varies between 10 and 25%. In general, more silicic varieties are richer in felsic
minerals and poorer in mafic ones, but the ratio is not linear and distinct. Cordierite has
been present in every sample but now it is pinitic for the most part. Sillimanite belongs
to the assemblage as a minor component. The samples 235 and 244 contain hematite
and pyrite as the only opaques while the others include pyrrhotite, pyrite and
chalcopyrite with certain rare phases of sulphide minerals.
The diatexitic gneisses are rather coarse-grained and poorly foliated. Features of rough
metamorphic banding can be imagined but the dark bands are more or less irregular, 2 –
4 mm wide zones into which the mafic minerals are concentrated. Preferred orientation
of micas within these zones is not always well developed and the mica scales are 1 – 2
mm long, at most. Leucocratic parts in the diatexites are medium-grained and
granoblastic. Diameters of typical feldspar and quartz grains are ca. 2 mm and they
compose totally irregular shaped, often roundish grains which have somehow
interfingered contacts bulged against to each other. The diatexitic samples demonstrate
a moderate degree of alteration by containing totally pinitized cordierite, slightly
chloritized biotite and partially saussuritized plagioclase.
The veined gneiss sample (230) of the T series is less silicic than any of the diatexites.
SiO2 concentration of 59% is rather low number among the whole T series, too. The
gneiss is evidently darker and contains ca. 40% biotite. Quartz content is 22%,
plagioclase 12% and K-feldspar 10% which are typical concentrations for this kind of
T-type rocks. 10% content of pinite and small amount of sillimanite are also typical
numbers. Similarly, a small content of pyrrhotite, chalcopyrite and hematite is typical
for this rock type. The veined gneiss is relatively coarse-grained and metamorphic
banding in the paleosome of it is well developed. Mica scales are approximately 1 mm
long and perfectly concentrated into the dark bands which are 2 -3 mm wide. Dark
bands are wavy and border the leucocratic parts or veins. Leucocratic veins are medium-
grained and granoblastic. Feldspar and quartz grains are irregular shaped and their
diameter is 1 mm, in average. The veined gneiss sample demonstrates moderate degree
of alteration like the diatexitic samples of this series.
20
S-series
The Mafic S-type gneiss (236) is the only representative in this category. It is composed
near to completely of hornblende the proportion of which is 82%. Biotite composes
10% and chlorite 5%. In addition, the sample contains only a trace amount of
plagioclase and apatite. Opaque minerals count 0.6% of the rock volume and magnetite,
pyrite, pyrrhotite and chalcopyrite are the most common species.
The mafic gneiss is medium-grained with average diameter of amphibole grains close to
2 mm. Due to large proportion of amphibole the gneiss should have nematoblastic
texture but the amphibole grains are roundish and their contacts are interfingered with
each other. Thus, the texture resembles granoblastic texture of felsic, medium-grained
gneisses. The gneiss is not foliated and no indication of preferred orientation of any
mineral is detectable. Mica and chlorite scales are located randomly into the amphibole
mass and also their orientation is random. Amphibole of the rock does not show any
features of secondary alteration but biotite is chloritized for a part.
P-series
The P series is represented by one diatexitic gneiss sample, two mica gneisses and one
TGG gneiss sample.
The T-type diatexitic gneiss (sample 243) belongs to an infrequent subgroup in the P
series as the total number of samples studied in detail from this category is only 5. The
sample studied now includes 64% SiO2 and is the most silicic variety analyzed until
now. Quartz content of 36%, plagioclase of 11%, K-feldspar of 19% and biotite of 5%
are not anomalous numbers for the P-type migmatites. On the contrary, rather high
content of muscovite (8%) is not very typical but within the leucosome material it has
been seen also earlier. Similarly, high content of cordierite is atypical for P-type rocks
but in migmatitic varieties that species has been detected also in the other samples.
Typical opaques are pyrrhotite, hematite and chalcopyrite.
This gneiss is medium-grained, granoblastic and the paleosome of it is not evidently
foliated. Quartz, feldspar and primary cordierite grains are equidimensional and more or
less roundish. Mafic minerals are concentrated into the mass that may borders 5 – 10
mm wide, roundish quartz-feldspar aggregates or patches making the whole structure
similar to certain porphyry-like rocks elsewhere in the study area. The sample shows
features of moderate degree of alteration. Cordierite is totally pinitized, plagioclase is
slightly saussuritized but the other minerals are rather fresh.
The mica gneisses of the P series selected for the detailed studies represent both ends in
that sequence. The sample 234 includes SiO2 only 50.5% which is the lowest number
analyzed and the other sample (242) contains 60.5% SiO2 which is one of the highest
values in this category. Quartz contents are 26% and 30%, plagioclase contents 27%
and 36%, and biotite contents 36% and 28% in the less silicic and more silicic sample,
respectively. Rather high content of apatite, ca. 2% is typical for this kind of rocks in
the P series. Similarly the total lack of K-feldspar is typical for non-migmatitic
21
members of this sequence. Opaques compose of magnetite, ilmenite, pyrrhotite, pyrite
and chalcopyrite.
The mica gneisses are fine-grained and poorly foliated. The mica scales are 0.5 mm
long in average and their orientation is random. Quartz and plagioclase grains are
equidimensional, often somehow roundish and their average diameter is 0.5 mm.
Orientation of mica scales is random and the scales are surrounded by granoblastic
quartz-feldspar mass making the whole structure resemble the granoblastic structure of
mica bearing quartzites. Features of weak foliation and metamorphic banding can be
imagined but those are not obvious. The degree of secondary alteration of these samples
is low as only a small part of biotite is chloritized and plagioclase is slightly pigmented
by fine-grained saussurite.
The P-type TGG gneiss sample (245) includes 59% SiO2 and thus it belongs to the less
silicic half in the sequence. Quartz content of 14% is typical value for this type rocks.
27% content of plagioclase and 5% both K-feldspar and biotite are low numbers for this
sequence but those will be explained by high contents of chlorite (15%) and saussurite
(30%). A couple percent content of apatite and sphene are typical for this kind of TGG
gneisses. Similarly, pyrrhotite, pyrite and chalcopyrite are typical sulphide phases.
The gneiss is granoblastic and medium-grained. Quartz-feldspar aggregates with
diameters varying from 5 to 10 mm are typical elements for these gneisses. These
aggregates or patches are situated into a more mafic “groundmass” which contains most
part of the micas. Typical diameters of roundish felsic mineral grains vary between 1
and 2 mm while the biotite scales are 0.5 mm long, at most. Segregation of mafic and
felsic minerals is not perfect and the foliation is poorly developed. This increases
markedly the isotropy of physical properties of these rocks. The sample studied here
shows features of strong secondary alteration. Large part of biotite is chloritized and
plagioclase is almost pervasively pigmented by microcrystalline saussurite. The
saussurite proportion of 30% is exceptional large.
22
3 PETROPHYSICS
For the petrophysical measurements, the samples were sawn flat, the length of the
samples being typically 5 – 6 cm. The measurements were carried out in the Laboratory
of Petrophysics at the Geological Survey of Finland. Prior to the measurements, the
samples were kept in a bath for 2.5 days using ordinary tap water (resistivity 50 – 60
ohmm). The parameters measured were density, magnetic susceptibility, natural
remanet magnetization and its orientation, electrical resistivity with three frequencies
(0.1, 10 and 500 Hz), P-wave velocity and porosity.
Densities were determined by weighing the samples in air and water and by calculating
the dry bulk density. The reading accuracy of the balance used is 0.01 g and the
repeatability for average-size (200 cm3) hand specimens is 2 kg/m
3.
Porosities were determined by the water saturation method: the water-saturated samples
were weighed before and after drying in an oven (three days in 105 C). The reading
accuracy of the balance used for porosity measurements is 0.01 g. The effective porosity
is calculated as follows:
P=100 · (Mwa - Mda)/ (Mwa - Mww) (1)
where Mda = weight of dry sample, weighing in air
Mwa = weight of water-saturated sample, weighing in air
Mww = weight of water-saturated sample, weighing in water
P = porosity.
The magnetic susceptibility was measured with low-frequency (1025 Hz) AC-bridges,
which are composed of two coils and two resistors. Standard error of the mean for
repeated measurements is c. 10·10-6
SI.
The remanent magnetization was measured with fluxgate magnetometers inside
magnetic shielding. For repeated measurements, the standard error of the mean is c.
10·10-3
A/m.
The specific resistivity was determined by a galvanic method using the MAFRIP
equipment, constructed at the Geological Survey of Finland. Used frequencies were 0.1,
10 and 500 Hz, allowing also the determination of induced polarization (IP). The
measuring error is less than 2 % within the resistivity range of 0.1 – 100000 ohmm.
To determine the P-wave velocity, the length of the sample and the propagation time
through the sample must be known. An electronic pulse was produced by a pulse-
generator, and the propagation time was measured using echo-sounding elements and an
oscilloscope.
The petrophysical parameters measured are presented in a table in the Appendix 4.
23
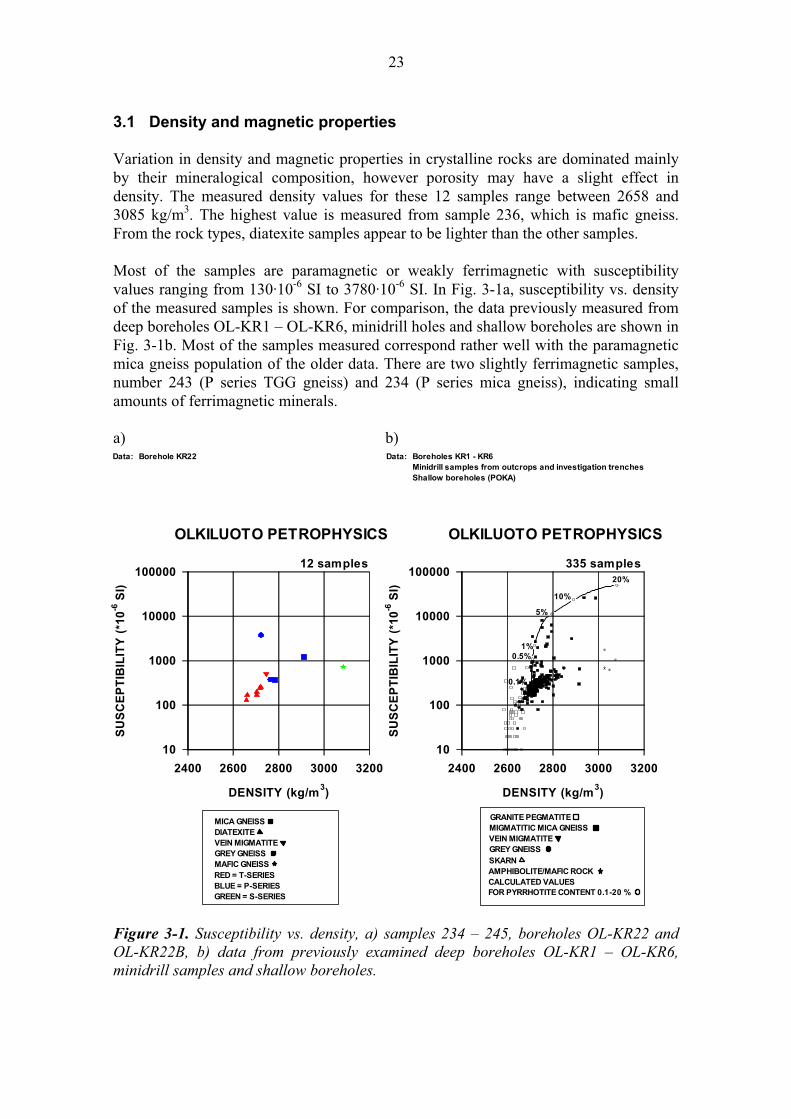
3.1 Density and magnetic properties
Variation in density and magnetic properties in crystalline rocks are dominated mainly
by their mineralogical composition, however porosity may have a slight effect in
density. The measured density values for these 12 samples range between 2658 and
3085 kg/m3. The highest value is measured from sample 236, which is mafic gneiss.
From the rock types, diatexite samples appear to be lighter than the other samples.
Most of the samples are paramagnetic or weakly ferrimagnetic with susceptibility
values ranging from 130·10-6
SI to 3780·10-6
SI. In Fig. 3-1a, susceptibility vs. density
of the measured samples is shown. For comparison, the data previously measured from
deep boreholes OL-KR1 – OL-KR6, minidrill holes and shallow boreholes are shown in
Fig. 3-1b. Most of the samples measured correspond rather well with the paramagnetic
mica gneiss population of the older data. There are two slightly ferrimagnetic samples,
number 243 (P series TGG gneiss) and 234 (P series mica gneiss), indicating small
amounts of ferrimagnetic minerals.
a) b)
Figure 3-1. Susceptibility vs. density, a) samples 234 – 245, boreholes OL-KR22 and
OL-KR22B, b) data from previously examined deep boreholes OL-KR1 – OL-KR6,
minidrill samples and shallow boreholes.
2400 2600 2800 3000 3200
DENSITY (kg/m3)
10
100
1000
10000
100000
SU
SC
EP
TIB
ILIT
Y (
*10
-6 S
I)
12 samples
OLKILUOTO PETROPHYSICS
VEIN MIGMATITE GREY GNEISS MAFIC GNEISS
Data: Borehole KR22
BLUE = P-SERIESRED = T-SERIES
GREEN = S-SERIES
DIATEXITE MICA GNEISS
2400 2600 2800 3000 3200
DENSITY (kg/m3)
10
100
1000
10000
100000
SU
SC
EP
TIB
ILIT
Y (
*10
-6 S
I)
335 samples
OLKILUOTO PETROPHYSICS
GRANITE PEGMATITE MIGMATITIC MICA GNEISS
GREY GNEISS
AMPHIBOLITE/MAFIC ROCK
FOR PYRRHOTITE CONTENT 0.1-20 %
0.1%
0.5%1%
5%
10%
20%
SKARN
VEIN MIGMATITE
Data: Boreholes KR1 - KR6Minidrill samples from outcrops and investigation trenchesShallow boreholes (POKA)
CALCULATED VALUES
24
Since the samples are mainly paramagnetic (susceptibility < 1000·10-6
SI), they usually
do not carry significant remanent magnetization. The measured remanence values are
typically below 50 mA/m, being below the practical detection limit of the measuring
device. However, there are two clearly higher remanence values, 410 and 2080 mA/m,
related to previously described ferrimagnetic samples 243 and 234. The determined
orientations of the remanent magnetization for these samples are 108.4 /60.3 and
213.2 /55.7 (declination/inclination).
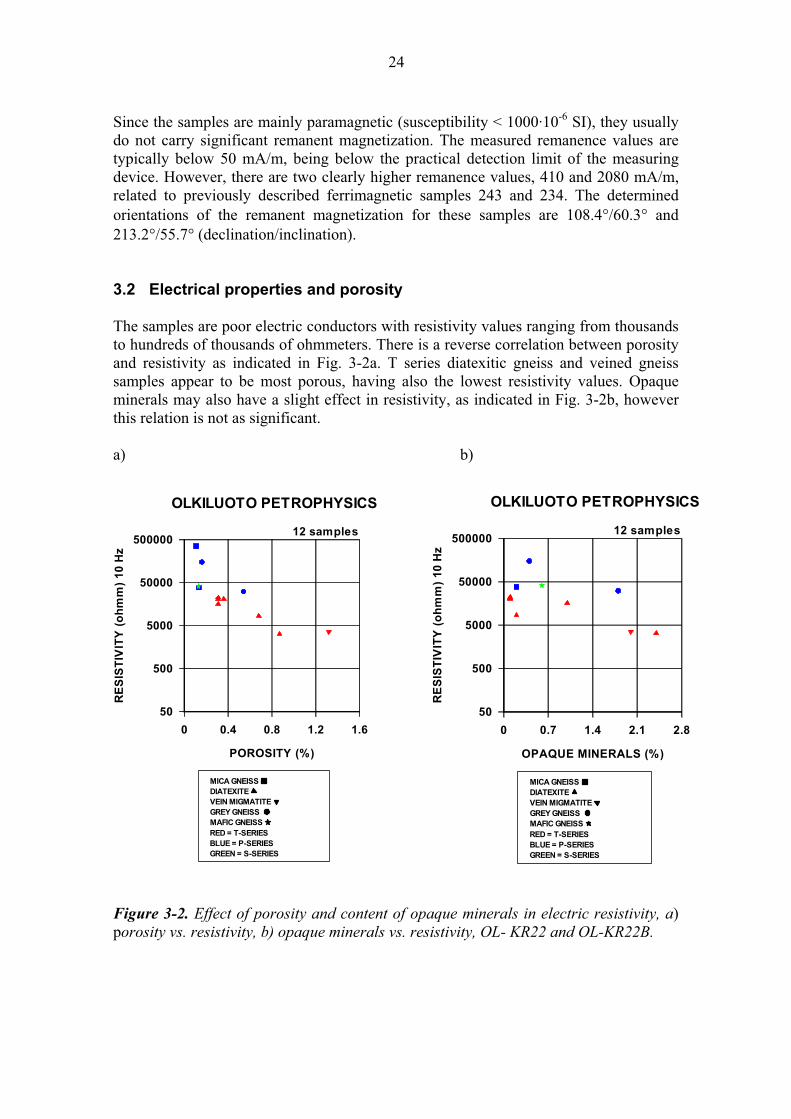
3.2 Electrical properties and porosity
The samples are poor electric conductors with resistivity values ranging from thousands
to hundreds of thousands of ohmmeters. There is a reverse correlation between porosity
and resistivity as indicated in Fig. 3-2a. T series diatexitic gneiss and veined gneiss
samples appear to be most porous, having also the lowest resistivity values. Opaque
minerals may also have a slight effect in resistivity, as indicated in Fig. 3-2b, however
this relation is not as significant.
a) b)
Figure 3-2. Effect of porosity and content of opaque minerals in electric resistivity, a)
porosity vs. resistivity, b) opaque minerals vs. resistivity, OL- KR22 and OL-KR22B.
0 0.4 0.8 1.2 1.6
POROSITY (%)
50
500
5000
50000
500000
RE
SIS
TIV
ITY
(o
hm
m)
10
Hz
12 samples
OLKILUOTO PETROPHYSICS
VEIN MIGMATITE GREY GNEISS MAFIC GNEISS
BLUE = P-SERIESRED = T-SERIES
GREEN = S-SERIES
DIATEXITE MICA GNEISS
0 0.7 1.4 2.1 2.8
OPAQUE MINERALS (%)
50
500
5000
50000
500000
RE
SIS
TIV
ITY
(o
hm
m)
10
Hz
12 samples
OLKILUOTO PETROPHYSICS
VEIN MIGMATITE GREY GNEISS MAFIC GNEISS
BLUE = P-SERIESRED = T-SERIES
GREEN = S-SERIES
DIATEXITE MICA GNEISS
25
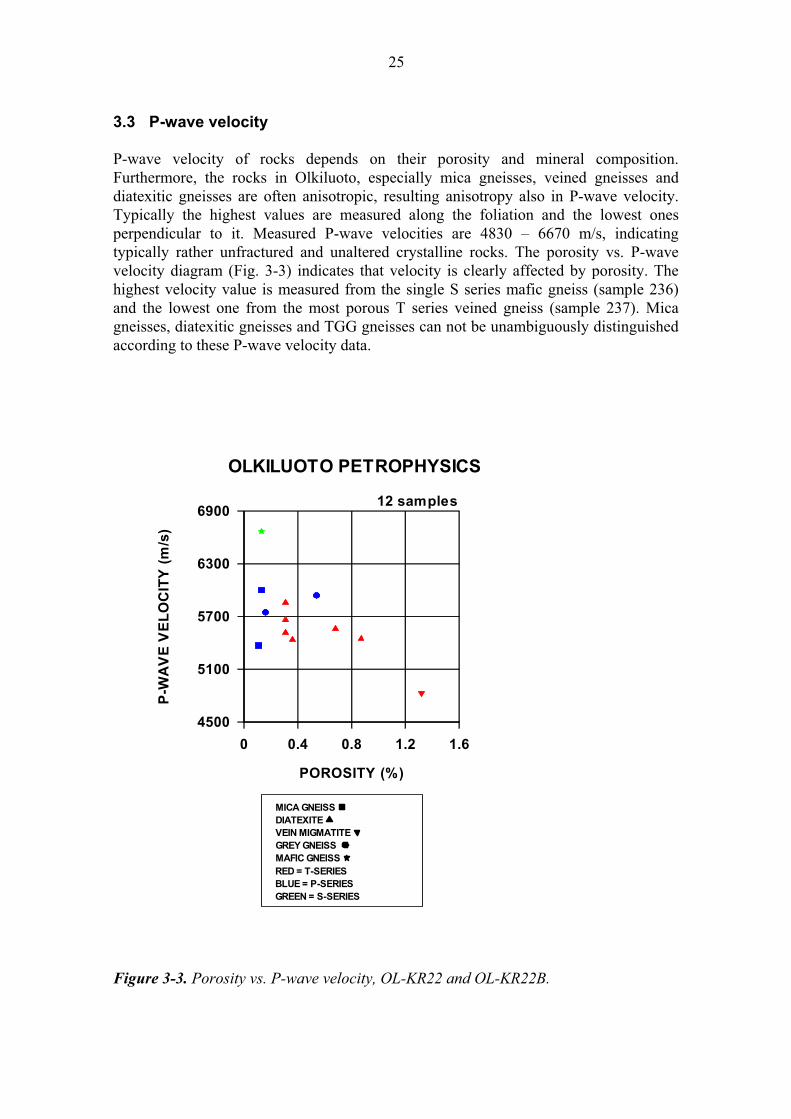
3.3 P-wave velocity
P-wave velocity of rocks depends on their porosity and mineral composition.
Furthermore, the rocks in Olkiluoto, especially mica gneisses, veined gneisses and
diatexitic gneisses are often anisotropic, resulting anisotropy also in P-wave velocity.
Typically the highest values are measured along the foliation and the lowest ones
perpendicular to it. Measured P-wave velocities are 4830 – 6670 m/s, indicating
typically rather unfractured and unaltered crystalline rocks. The porosity vs. P-wave
velocity diagram (Fig. 3-3) indicates that velocity is clearly affected by porosity. The
highest velocity value is measured from the single S series mafic gneiss (sample 236)
and the lowest one from the most porous T series veined gneiss (sample 237). Mica
gneisses, diatexitic gneisses and TGG gneisses can not be unambiguously distinguished
according to these P-wave velocity data.
Figure 3-3. Porosity vs. P-wave velocity, OL-KR22 and OL-KR22B.
0 0.4 0.8 1.2 1.6
POROSITY (%)
4500
5100
5700
6300
6900
P-W
AV
E V
EL
OC
ITY
(m
/s)
12 samples
OLKILUOTO PETROPHYSICS
VEIN MIGMATITE GREY GNEISS MAFIC GNEISS
BLUE = P-SERIESRED = T-SERIES
GREEN = S-SERIES
DIATEXITE MICA GNEISS
26
4 FRACTURE MINERALOGY
The account on fracture mineralogy of drill core OL-KR22 aims to following targets:
1. Determinate the position and character of all the open fractures in drill core
sample
2. Produce geological classification of the fracture types
3. Make macroscopic identification of fracture filling phases
4. Visually estimate of filling thicknesses of the open fractures
5. Approximation the percentage that the fracture mineral phase coats of the
fracture plain area.
6. Characterize the occurrence of cohesive/semi cohesive fracture mineral phases
on the fracture plains (cf. chlorite, sericite, graphite, quartz) and the corroded
surfaces
7. Make observations of obvious water flow on the fracture plain
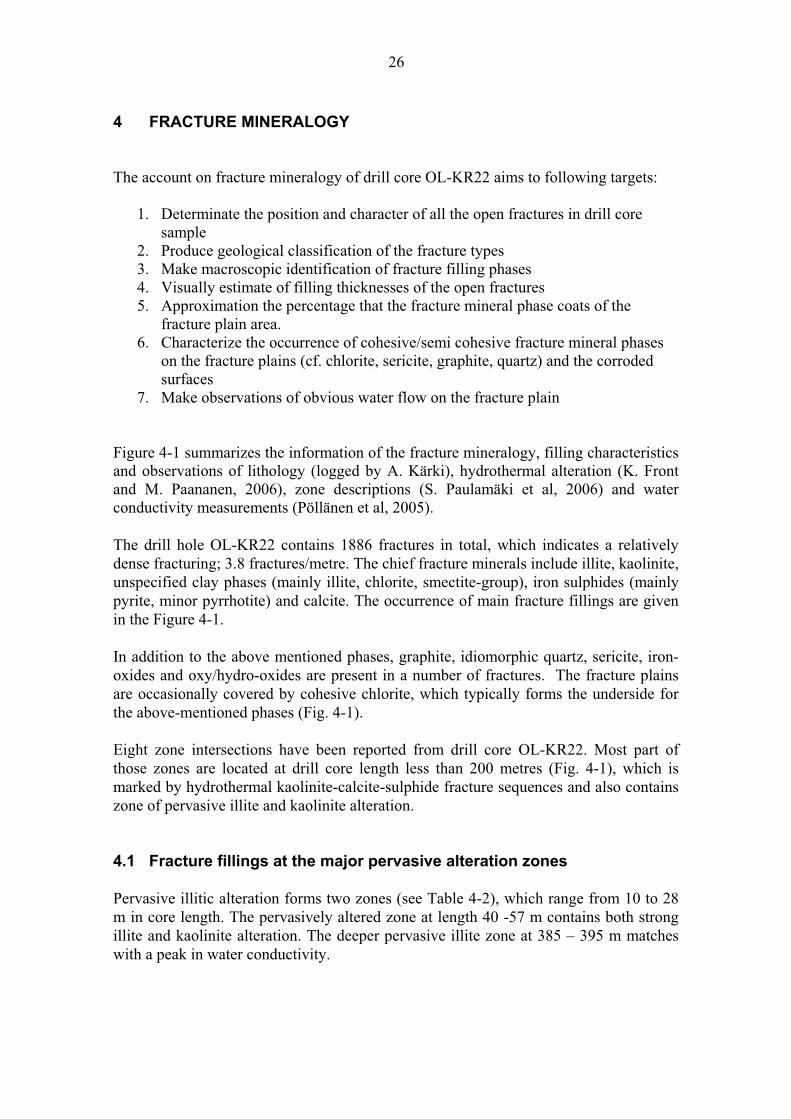
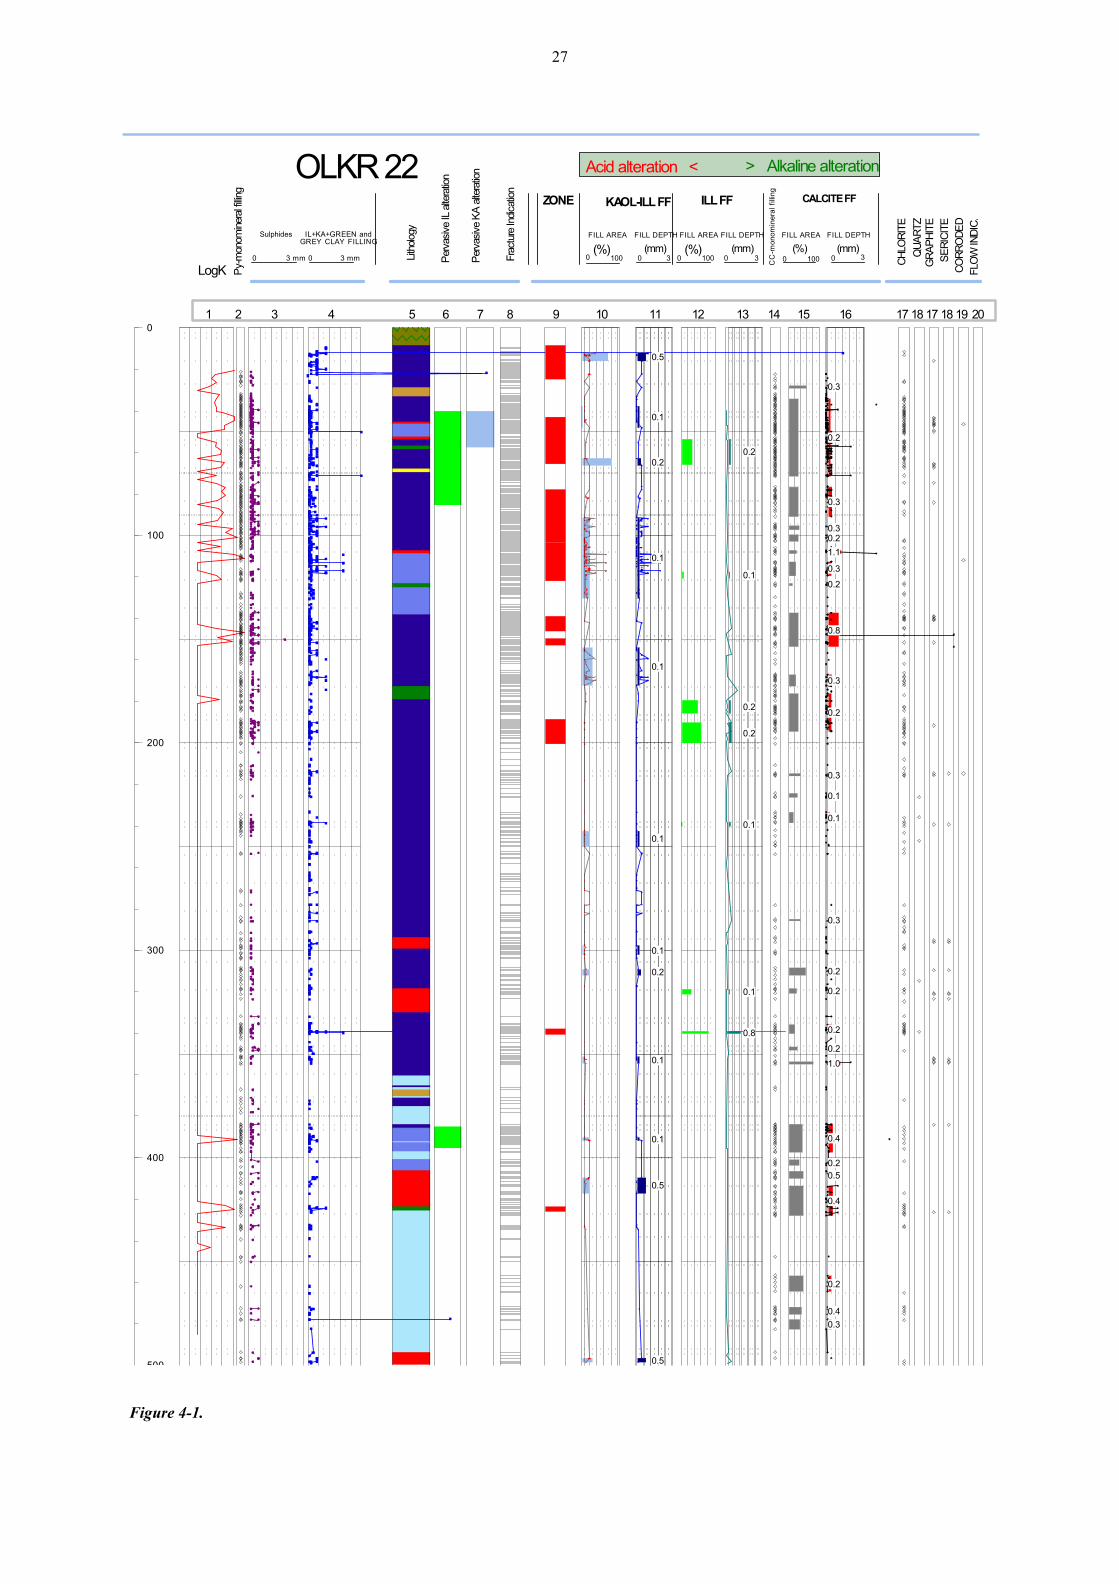
Figure 4-1 summarizes the information of the fracture mineralogy, filling characteristics
and observations of lithology (logged by A. Kärki), hydrothermal alteration (K. Front
and M. Paananen, 2006), zone descriptions (S. Paulamäki et al, 2006) and water
conductivity measurements (Pöllänen et al, 2005).
The drill hole OL-KR22 contains 1886 fractures in total, which indicates a relatively
dense fracturing; 3.8 fractures/metre. The chief fracture minerals include illite, kaolinite,
unspecified clay phases (mainly illite, chlorite, smectite-group), iron sulphides (mainly
pyrite, minor pyrrhotite) and calcite. The occurrence of main fracture fillings are given
in the Figure 4-1.
In addition to the above mentioned phases, graphite, idiomorphic quartz, sericite, iron-
oxides and oxy/hydro-oxides are present in a number of fractures. The fracture plains
are occasionally covered by cohesive chlorite, which typically forms the underside for
the above-mentioned phases (Fig. 4-1).
Eight zone intersections have been reported from drill core OL-KR22. Most part of
those zones are located at drill core length less than 200 metres (Fig. 4-1), which is
marked by hydrothermal kaolinite-calcite-sulphide fracture sequences and also contains
zone of pervasive illite and kaolinite alteration.
4.1 Fracture fillings at the major pervasive alteration zones
Pervasive illitic alteration forms two zones (see Table 4-2), which range from 10 to 28
m in core length. The pervasively altered zone at length 40 -57 m contains both strong
illite and kaolinite alteration. The deeper pervasive illite zone at 385 – 395 m matches
with a peak in water conductivity.
27
0
100
200
300
400
500
FILL DEPTHFILL AREA
KAOL-ILL FF
(%)
ILL FF
FILL AREA
(mm)0100
(%)
Sulphides
CALCITE FF
LogK0 0 3 mm Q
UA
RTZ
GR
AP
HIT
E
SE
RIC
ITE
CO
RR
OD
ED
CH
LOR
ITE
0030 3 3(mm)
3 mm 1000
CC
-mo
no
min
era
l fi
lling
Py-
mon
omin
eral
fillin
g
OLKR 22
1 2 3 4 5 6 7 8 9 10 11 12 13 16 17 18 17
Fra
ctur
e In
dica
tion
IL+KA+GREEN and
Acid alteration < > Alkaline alteration
(mm)1000
(%)
18
FILL AREA FILL DEPTHGREY CLAY FILLING
FLO
W IN
DIC
.
FILL DEPTH
Per
vasi
ve K
A a
ltera
tion
Per
vasi
ve IL
alte
ratio
n
14 15 19
Lith
olog
y
20
ZONE
0.2
0.1
0.2
0.2
0.1
0.1
0.8
0.5
0.1
0.2
0.1
0.1
0.1
0.1
0.2
0.1
0.1
0.5
0.5
0.3
0.2
0.3
0.30.2
1.1
0.3
0.2
0.8
0.3
0.2
0.3
0.1
0.1
0.3
0.2
0.2
0.2
0.2
1.0
0.4
0.2
0.5
0.4
0.2
0.4
0.3
Figure 4-1.
28
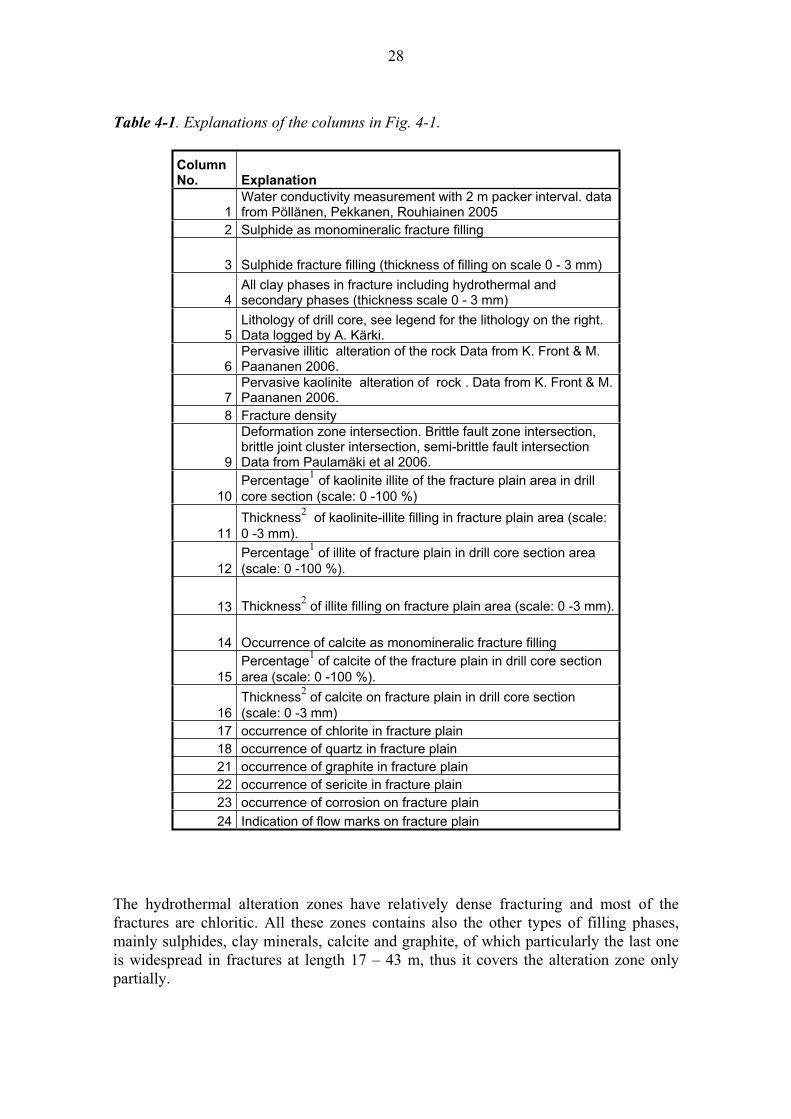
Table 4-1. Explanations of the columns in Fig. 4-1.
The hydrothermal alteration zones have relatively dense fracturing and most of the
fractures are chloritic. All these zones contains also the other types of filling phases,
mainly sulphides, clay minerals, calcite and graphite, of which particularly the last one
is widespread in fractures at length 17 – 43 m, thus it covers the alteration zone only
partially.
Column No. Explanation
1Water conductivity measurement with 2 m packer interval. data from Pöllänen, Pekkanen, Rouhiainen 2005
2 Sulphide as monomineralic fracture filling
3 Sulphide fracture filling (thickness of filling on scale 0 - 3 mm)
4All clay phases in fracture including hydrothermal and secondary phases (thickness scale 0 - 3 mm)
5Lithology of drill core, see legend for the lithology on the right. Data logged by A. Kärki.
6Pervasive illitic alteration of the rock Data from K. Front & M. Paananen 2006.
7Pervasive kaolinite alteration of rock . Data from K. Front & M. Paananen 2006.
8 Fracture density
9
Deformation zone intersection. Brittle fault zone intersection, brittle joint cluster intersection, semi-brittle fault intersection Data from Paulamäki et al 2006.
10Percentage
1of kaolinite illite of the fracture plain area in drill
core section (scale: 0 -100 %)
11Thickness
2 of kaolinite-illite filling in fracture plain area (scale:
0 -3 mm).
12Percentage
1 of illite of fracture plain in drill core section area
(scale: 0 -100 %).
13 Thickness2 of illite filling on fracture plain area (scale: 0 -3 mm).
14 Occurrence of calcite as monomineralic fracture filling
15Percentage
1 of calcite of the fracture plain in drill core section
area (scale: 0 -100 %).
16Thickness
2 of calcite on fracture plain in drill core section
(scale: 0 -3 mm)
17 occurrence of chlorite in fracture plain
18 occurrence of quartz in fracture plain
21 occurrence of graphite in fracture plain
22 occurrence of sericite in fracture plain
23 occurrence of corrosion on fracture plain
24 Indication of flow marks on fracture plain
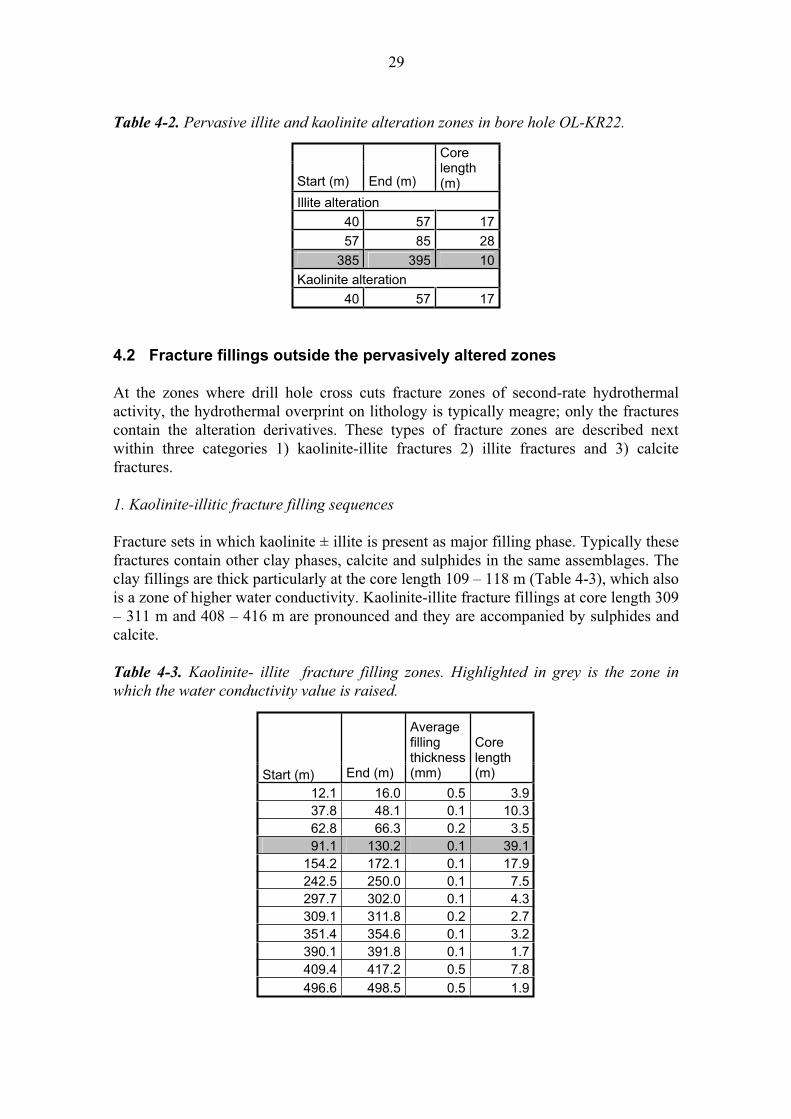
29
Table 4-2. Pervasive illite and kaolinite alteration zones in bore hole OL-KR22.
Start (m) End (m)
Core length(m)
Illite alteration
40 57 17
57 85 28
385 395 10
Kaolinite alteration
40 57 17
4.2 Fracture fillings outside the pervasively altered zones
At the zones where drill hole cross cuts fracture zones of second-rate hydrothermal
activity, the hydrothermal overprint on lithology is typically meagre; only the fractures
contain the alteration derivatives. These types of fracture zones are described next
within three categories 1) kaolinite-illite fractures 2) illite fractures and 3) calcite
fractures.
1. Kaolinite-illitic fracture filling sequences
Fracture sets in which kaolinite ± illite is present as major filling phase. Typically these
fractures contain other clay phases, calcite and sulphides in the same assemblages. The
clay fillings are thick particularly at the core length 109 – 118 m (Table 4-3), which also
is a zone of higher water conductivity. Kaolinite-illite fracture fillings at core length 309
– 311 m and 408 – 416 m are pronounced and they are accompanied by sulphides and
calcite.
Table 4-3. Kaolinite- illite fracture filling zones. Highlighted in grey is the zone in
which the water conductivity value is raised.
Start (m) End (m)
Averagefillingthickness (mm)
Core length(m)
12.1 16.0 0.5 3.937.8 48.1 0.1 10.362.8 66.3 0.2 3.591.1 130.2 0.1 39.1
154.2 172.1 0.1 17.9242.5 250.0 0.1 7.5297.7 302.0 0.1 4.3309.1 311.8 0.2 2.7351.4 354.6 0.1 3.2390.1 391.8 0.1 1.7409.4 417.2 0.5 7.8
496.6 498.5 0.5 1.9
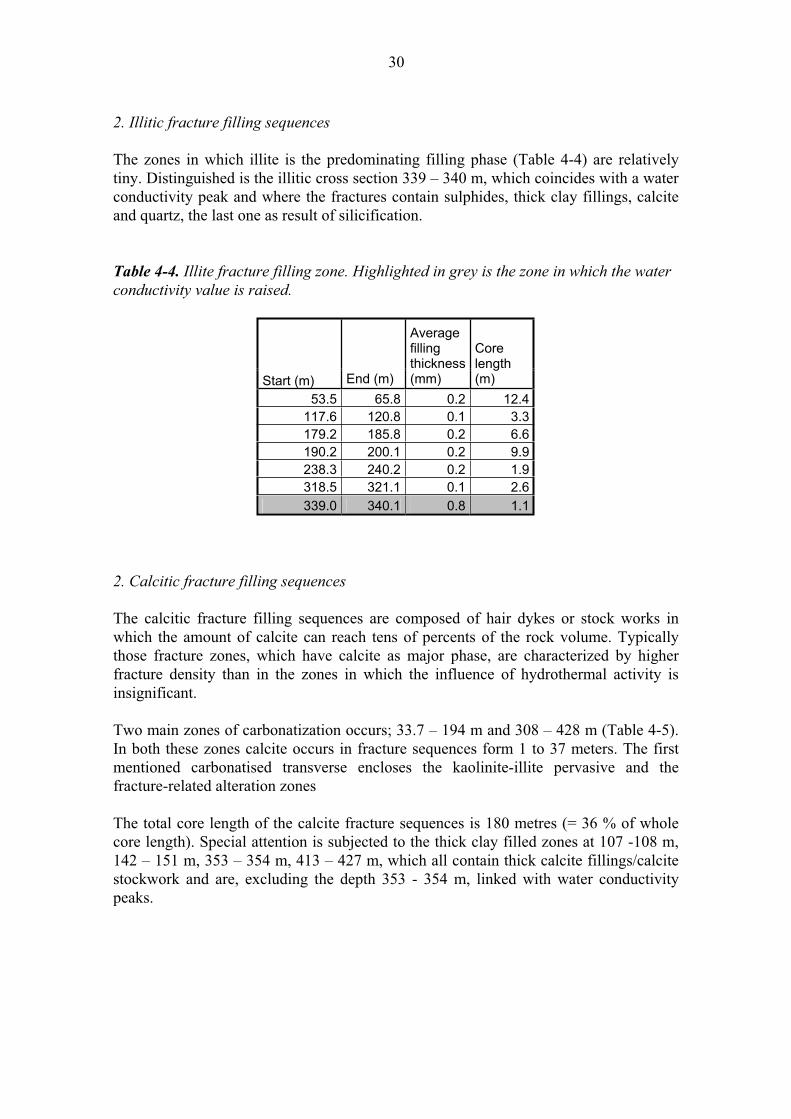
30
2. Illitic fracture filling sequences
The zones in which illite is the predominating filling phase (Table 4-4) are relatively
tiny. Distinguished is the illitic cross section 339 – 340 m, which coincides with a water
conductivity peak and where the fractures contain sulphides, thick clay fillings, calcite
and quartz, the last one as result of silicification.
Table 4-4. Illite fracture filling zone. Highlighted in grey is the zone in which the water
conductivity value is raised.
Start (m) End (m)
Averagefillingthickness (mm)
Core length(m)
53.5 65.8 0.2 12.4117.6 120.8 0.1 3.3179.2 185.8 0.2 6.6190.2 200.1 0.2 9.9238.3 240.2 0.2 1.9318.5 321.1 0.1 2.6
339.0 340.1 0.8 1.1
2. Calcitic fracture filling sequences
The calcitic fracture filling sequences are composed of hair dykes or stock works in
which the amount of calcite can reach tens of percents of the rock volume. Typically
those fracture zones, which have calcite as major phase, are characterized by higher
fracture density than in the zones in which the influence of hydrothermal activity is
insignificant.
Two main zones of carbonatization occurs; 33.7 – 194 m and 308 – 428 m (Table 4-5).
In both these zones calcite occurs in fracture sequences form 1 to 37 meters. The first
mentioned carbonatised transverse encloses the kaolinite-illite pervasive and the
fracture-related alteration zones
The total core length of the calcite fracture sequences is 180 metres (= 36 % of whole
core length). Special attention is subjected to the thick clay filled zones at 107 -108 m,
142 – 151 m, 353 – 354 m, 413 – 427 m, which all contain thick calcite fillings/calcite
stockwork and are, excluding the depth 353 - 354 m, linked with water conductivity
peaks.
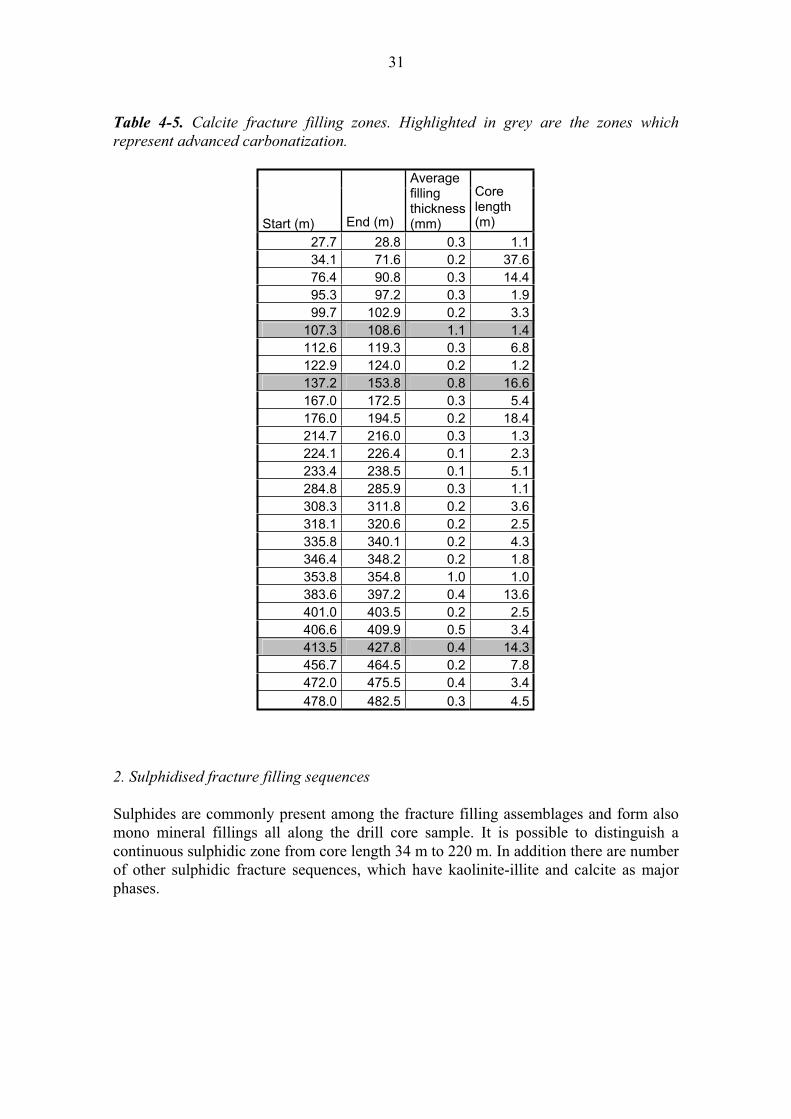
31
Table 4-5. Calcite fracture filling zones. Highlighted in grey are the zones which
represent advanced carbonatization.
Start (m) End (m)
Averagefillingthickness (mm)
Core length(m)
27.7 28.8 0.3 1.134.1 71.6 0.2 37.676.4 90.8 0.3 14.495.3 97.2 0.3 1.999.7 102.9 0.2 3.3
107.3 108.6 1.1 1.4112.6 119.3 0.3 6.8122.9 124.0 0.2 1.2137.2 153.8 0.8 16.6167.0 172.5 0.3 5.4176.0 194.5 0.2 18.4214.7 216.0 0.3 1.3224.1 226.4 0.1 2.3233.4 238.5 0.1 5.1284.8 285.9 0.3 1.1308.3 311.8 0.2 3.6318.1 320.6 0.2 2.5335.8 340.1 0.2 4.3346.4 348.2 0.2 1.8353.8 354.8 1.0 1.0383.6 397.2 0.4 13.6401.0 403.5 0.2 2.5406.6 409.9 0.5 3.4413.5 427.8 0.4 14.3456.7 464.5 0.2 7.8472.0 475.5 0.4 3.4
478.0 482.5 0.3 4.5
2. Sulphidised fracture filling sequences
Sulphides are commonly present among the fracture filling assemblages and form also
mono mineral fillings all along the drill core sample. It is possible to distinguish a
continuous sulphidic zone from core length 34 m to 220 m. In addition there are number
of other sulphidic fracture sequences, which have kaolinite-illite and calcite as major
phases.
32
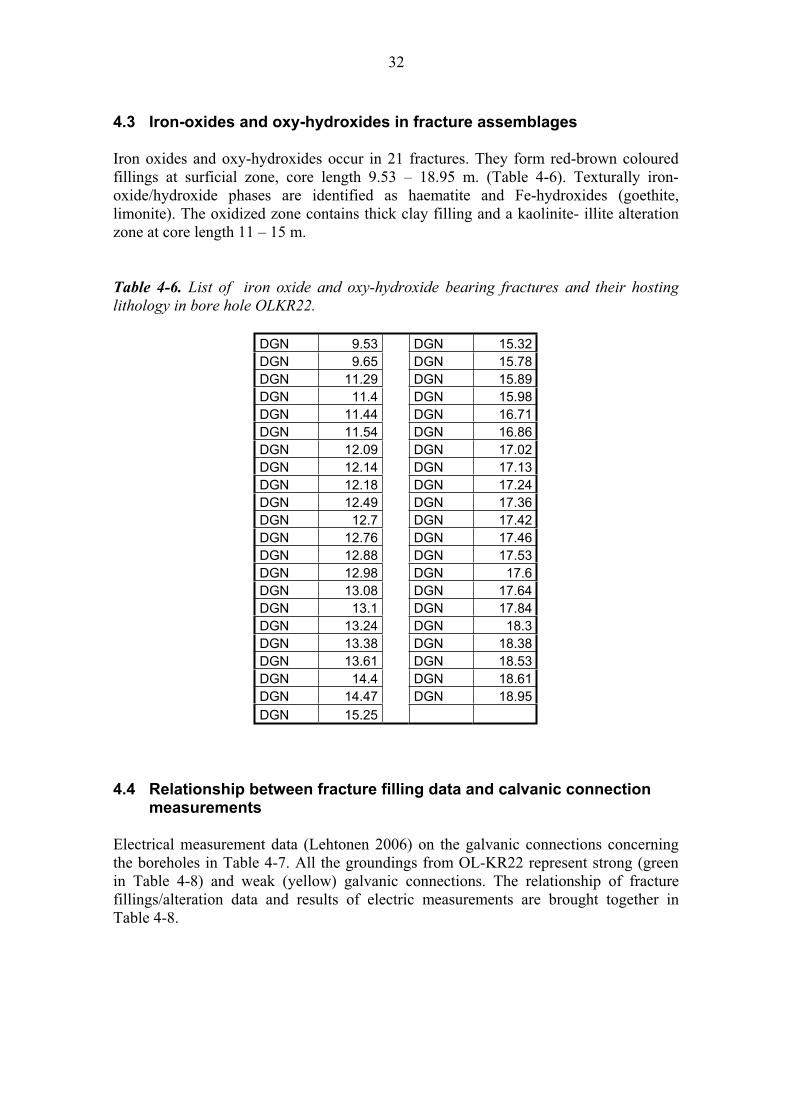
4.3 Iron-oxides and oxy-hydroxides in fracture assemblages
Iron oxides and oxy-hydroxides occur in 21 fractures. They form red-brown coloured
fillings at surficial zone, core length 9.53 – 18.95 m. (Table 4-6). Texturally iron-
oxide/hydroxide phases are identified as haematite and Fe-hydroxides (goethite,
limonite). The oxidized zone contains thick clay filling and a kaolinite- illite alteration
zone at core length 11 – 15 m.
Table 4-6. List of iron oxide and oxy-hydroxide bearing fractures and their hosting
lithology in bore hole OLKR22.
DGN 9.53 DGN 15.32DGN 9.65 DGN 15.78DGN 11.29 DGN 15.89DGN 11.4 DGN 15.98DGN 11.44 DGN 16.71DGN 11.54 DGN 16.86DGN 12.09 DGN 17.02DGN 12.14 DGN 17.13DGN 12.18 DGN 17.24DGN 12.49 DGN 17.36DGN 12.7 DGN 17.42DGN 12.76 DGN 17.46DGN 12.88 DGN 17.53DGN 12.98 DGN 17.6DGN 13.08 DGN 17.64DGN 13.1 DGN 17.84DGN 13.24 DGN 18.3DGN 13.38 DGN 18.38DGN 13.61 DGN 18.53DGN 14.4 DGN 18.61DGN 14.47 DGN 18.95
DGN 15.25
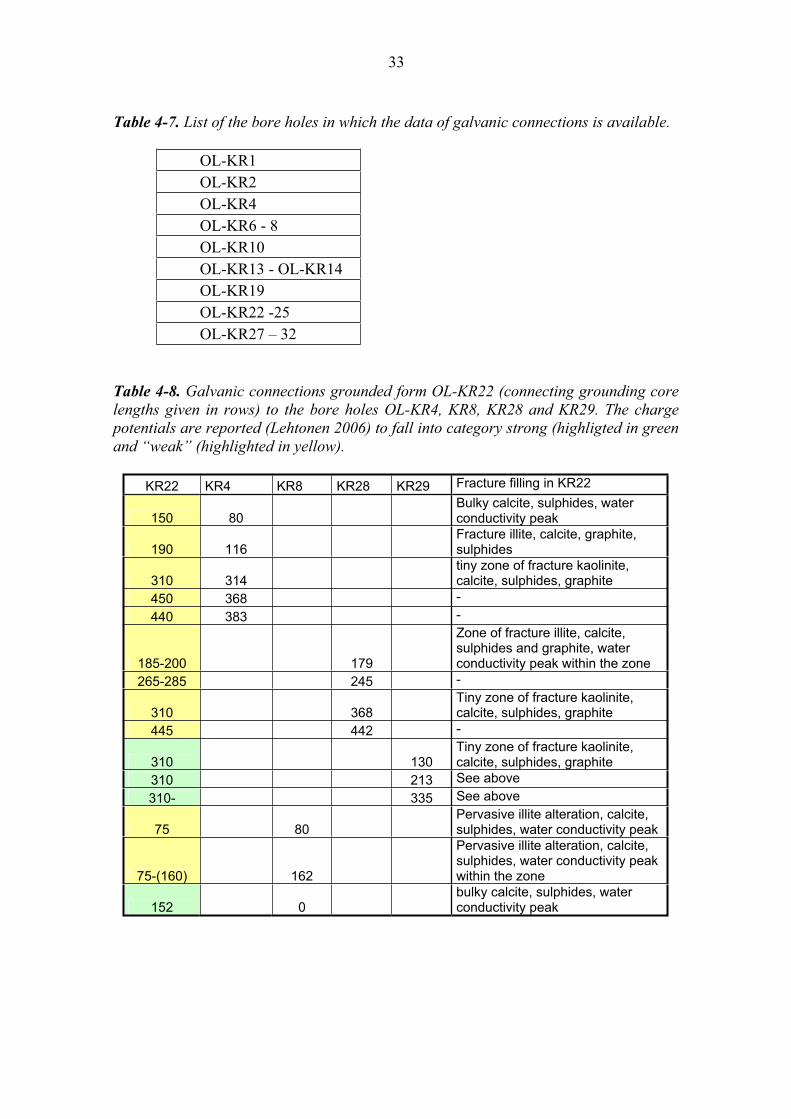
4.4 Relationship between fracture filling data and calvanic connection measurements
Electrical measurement data (Lehtonen 2006) on the galvanic connections concerning
the boreholes in Table 4-7. All the groundings from OL-KR22 represent strong (green
in Table 4-8) and weak (yellow) galvanic connections. The relationship of fracture
fillings/alteration data and results of electric measurements are brought together in
Table 4-8.
33
Table 4-7. List of the bore holes in which the data of galvanic connections is available.
OL-KR1
OL-KR2
OL-KR4
OL-KR6 - 8
OL-KR10
OL-KR13 - OL-KR14
OL-KR19
OL-KR22 -25
OL-KR27 – 32
Table 4-8. Galvanic connections grounded form OL-KR22 (connecting grounding core
lengths given in rows) to the bore holes OL-KR4, KR8, KR28 and KR29. The charge
potentials are reported (Lehtonen 2006) to fall into category strong (highligted in green
and “weak” (highlighted in yellow).
KR22 KR4 KR8 KR28 KR29 Fracture filling in KR22
150 80 Bulky calcite, sulphides, water conductivity peak
190 116 Fracture illite, calcite, graphite, sulphides
310 314 tiny zone of fracture kaolinite, calcite, sulphides, graphite
450 368 -
440 383 -
185-200 179
Zone of fracture illite, calcite, sulphides and graphite, water conductivity peak within the zone
265-285 245 -
310 368 Tiny zone of fracture kaolinite, calcite, sulphides, graphite
445 442 -
310 130 Tiny zone of fracture kaolinite, calcite, sulphides, graphite
310 213 See above
310- 335 See above
75 80 Pervasive illite alteration, calcite, sulphides, water conductivity peak
75-(160) 162
Pervasive illite alteration, calcite, sulphides, water conductivity peak within the zone
152 0 bulky calcite, sulphides, water conductivity peak
34
5 SUMMARY
The boreholes OL-KR22 and –KR22B start in the central part of the Olkiluoto study
area from the wide migmatite unit dominated by diatexitic gneisses. The drill holes
intersect down to the drilling length of 360 m a rather monotonous diatexitic gneisses
which are intruded by a couple of wide pegmatitic dykes and have several homogeneous
mica gneiss and mafic gneiss interbeds. Below those, down to the drilling length of 422
m a fluctuating section of veined gneisses with narrow mica gneiss interbeds is located.
The lowermost part of the core sample is composed of rather homogeneous mica
gneisses with various migmatite subsections.
Whole rock chemical composition is analysed in detail from12 samples. Seven of those
are migmatites of the T series, four are gneisses and migmatites of the P series and one
is mafic, S-type gneiss. The T type diatexitic gneiss and veined gneiss samples give an
extensive overview of the whole series. SiO2 concentration varies from 58% analysed
from a biotite rich veined gneiss to ca. 73% analysed from a leucocratic diatexitic
gneiss. The silicity controls directly the other major element concentrations as typical
for the T series. One mafic gneiss sample is a member of the S-series and the most
mafic variant analysed from this category. It contains only 43% SiO2 and ca. 10% CaO
but, in other respects, it is typical mafic gneiss of the S series. The P series is
represented by TGG gneiss, diatexitic gneiss and mica gneiss samples. Content of
phosphorus exceeds 0.4%, given as P2O5, in every of those. The content of aluminium is
constantly ca. 17% despite of the change in silicity or migmatite structure but the other
major element concentrations show a clear decreasing trend which is directly controlled
by the increase in silicity. Migmatites are not numerous in the P series but their major
element concentrations fall systematically to the same numbers which are typical for the
P-type gneisses. The P-type TGG gneiss sample contains less than 60% SiO2 and thus it
belongs to the subgroup of less silicic variants of the series. P2O5 concentration is
ca.0.45% and CaO concentration exceeds 3% which are typical numbers for these
gneisses. The mica gneiss samples studied in detail represent both extremities in this
subsequence of the P series. SiO2 concentration of the former is ca. 50% and of the
latter ca. 60. P2O5 concentration decreases from 1.4% to 0.7% and CaO from 5% close
to 4% as silicity increases and also the other major element concentrations are strictly in
anticipated numbers.
The additional XRF major element analyses were made from samples that were taken
by 5 m average interval from this core. The aim of these analyses was to clarify the
distribution and proportions if individual rock series. The chemical border between T
and P series is set at the 0.2% content of P2O5. The border between the members of the
T and S series is set at the 2% content of CaO. According to this test the members of
the P and T series are located at all depths in the drill hole. The members of the T series
seem to compose 70%, the members of the P series 20% and the members of the S
series the remaining 10% of the bedrock volume intersected by the drill hole OL-KR22.
However, the 5 m sample interval has proved to be too coarse in determination of
borders between primary sections of original rock layers or sequences of individual rock
series.
35
The diatexitic T-type gneisses belong to the more acidic half of the series as SiO2 varies
between 63 and 73% and the content of quartz between 27% and 43%, content of
plagioclase between 11% and 27% and K-feldspar between 11 and 25%. The proportion
of biotite or total number of biotite and chlorite, if the latter is present, varies between
10 and 25%. Cordierite has been present in the every sample but now it is pinitic for the
most part, and sillimanite belongs to the assemblage as a minor component. The
diatexitic gneisses are rather coarse-grained and poorly foliated. Features of rough
metamorphic banding can be imagined but the dark bands are more or less irregular, 2 –
4 mm wide zones into which the mafic minerals are concentrated. The veined gneiss of
the T series is less silicic than any of the diatexites and SiO2 content of 59% is rather
low number among the whole T series, too. The gneiss is evidently darker and contains
ca. 40% biotite. Quartz content is 22%, plagioclase 12% and K-feldspar 10%. The10%
content of pinite and small amount of sillimanite are also typical. The sample is
relatively coarse-grained and metamorphic banding in the paleosome of the rock is well
developed. Dark bands are wavy and border the leucocratic parts or veins.
The mafic S-type gneiss is composed near to completely of hornblende the proportion
of which is 82%. Biotite content is 10% and chlorite 5%. In addition, the sample
contains only a trace amount of plagioclase and apatite. The mafic gneiss is medium-
grained with average diameter of amphibole grains close to 2 mm. The amphibole
grains are roundish and the texture resembles granoblastic texture of felsic, medium-
grained gneisses.
The P-type diatexitic gneiss belongs to an infrequent subgroup of migmatites. The
gneiss includes 64% SiO2 and is the most silicic variety in its category. Quartz content
of 36%, plagioclase of 11%, K-feldspar of 19% and biotite of 5% are not anomalous
numbers for the P-type migmatites but high content of muscovite (8%) is not typical.
This diatexite is medium-grained, granoblastic and not evidently foliated. Mafic
minerals are concentrated into material which borders 5 – 10 mm wide, roundish quartz-
feldspar aggregates making the whole structure similar to certain porphyry-like rocks.
The Mica gneisses of the P series represent both extremes in the sequence as the other
includes SiO2 only 50.5% and the other 60.5%. Quartz contents are 26% and 30%,
plagioclase contents 27% and 36%, and biotite contents 36% and 28% in the less silicic
and more silicic sample, respectively. Rather high content of apatite is typical likewise
the total lack of K-feldspar. The mica gneisses are fine-grained and poorly foliated.
Features of a weak metamorphic banding can be imagined. The P-type TGG gneiss
includes 59% SiO2 and thus it belongs to the less silicic type in the sequence. Quartz
content of 14% is typical value for this kind of rocks. Low contents of plagioclase and
both K-feldspar and biotite will be explained by high contents of chlorite and saussurite.
A couple percent of apatite and sphene belong to these rocks. The gneiss is granoblastic
and medium-grained. Quartz-feldspar aggregates with diameters varying from 5 to 10
mm are typical elements for that. These aggregates or patches are surrounded by a more
mafic “groundmass” which contains the most part of micas but the foliation of this mica
bearing material is poorly developed.
Petrophysical properties were measured from 12 samples. Their measured density
values range between 2658 and 3085 kg/m3. The highest value is measured from the
36
sample 236, which is mafic gneiss. From the rock types, diatexite samples appear to be
lighter than the other samples.
Most of the samples are paramagnetic or weakly ferrimagnetic with susceptibility
values ranging from 130·10-6
SI to 3780·10-6
SI. Most of the samples measured
correspond rather well with the paramagnetic gneiss population of the older data. There
are two slightly ferrimagnetic samples, (one P type TGG gneiss and one P-type mica
gneiss), indicating small amounts of ferrimagnetic minerals. The measured remanence
values are typically below 50 mA/m, being below the practical detection limit of the
measuring device. However, there are two clearly higher remanence values, 410 and
2080 mA/m, related to previously described ferrimagnetic samples.
The samples are poor electric conductors with resistivity values ranging from thousands
to hundreds of thousands of ohmmeters. There is a reverse correlation between porosity
and resistivity. T-type diatexite and veined gneiss samples appear to be most porous,
having also the lowest resistivity values. Opaque minerals may also have a slight effect
in resistivity, however this relation is not as significant.
Measured P-wave velocities are 4830 – 6670 m/s, indicating typically rather unfractured
and unaltered crystalline rocks. The porosity vs. P-wave velocity diagram indicates that
velocity is clearly affected by porosity. The highest velocity value is measured from a
single S-type mafic gneiss and the lowest one from the most porous veined gneiss of the
T series. Mica gneisses, diatexites and TGG gneisses can not be unambiguously
distinguished according to the P-wave velocity data.
The drill hole OL-KR22 has relatively dense fracturing; 3.8 fractures/metre. Pervasive
illitization concerns 11 % of the total core length and 36 % of the bore hole length has
calcite as major constituent in fracture fillings. The chief fracture minerals include illite,
kaolinite, unspecified clay phases, iron sulphides and calcite. Sulphides occur in fracture
plains all along the drill core, but at the core length interval 34 – 220 m its occurrence is
more intense. Graphite occurs abundantly in a sequence at the core length 20 - 50 m,
and sporadically all along the drill core. Idiomorphic quartz and sericite are present in a
number of fractures. Iron-oxides and oxy/hydro-oxides are met in few fractures at core
length 9.53 – 18.95 m. The fracture plains are occasionally covered by cohesive
chlorite, which typically forms the underside for the other filling phases.
The frequency of fracturing is clearly higher at the first 200 meters of the core length.
This depth interval contains zone intersections, pervasive illite and kaolinite alteration
zones and abundant calcite.
At the upper 200 m of the core length the water conductivity peaks join with the
hydrothermal zones and at this interval the calcitic fracture filling sequences are
indicators for the increased water conductivity. Especially the thick clay filled zones at
107 -108 m, 142 – 151 m, 353 – 354 m, 413 – 427 m contain thick calcite
fillings/calcite stockworks.
37
REFERENCES
Front, K. & Paananen, M. 2006. Hydrothermal alteration at Olkiluoto: mapping of drill
core samples. Working Report 2006-59. Posiva Oy, Olkiluoto.
Gehör, S., Kärki, A., Määttä, T., Suoperä, S. & Taikina-aho, O., 1996. Eurajoen
Olkiluodon kairausnäytteiden petrologia ja matalan lämpötilan rakomineraalit.
Työraportti PATU-96-42. Posiva Oy, Helsinki.
Korsman, K., Koistinen, T., Kohonen, J., Wennerström, M, Ekdahl, E., Honkamo, M,
Idman H. & Pekkala, Y. (editors) 1997. Suomen kallioperäkartta -Berggrundskarta över
Finland -Bedrock map of Finland 1: 1 000 000. Geologian tutkimuskeskus, Espoo,
Finland.
Kärki, A. & Paulamäki, S. 2006. Petrology of Olkiluoto. Posiva 2006-2. Posiva Oy,
Olkiluoto, 77 p.
Lehtonen, T. 2006. Visualization and Interpretation of the Year 2004 Mise-a-la-Masse
Survey Data at Olkiluoto Site. Working Report 2006-08. Posiva Oy, Olkiluoto.
Mattila, J. 2006. A System of Nomenclature for Rocks in Olkiluoto. Working report
2006-32. Posiva Oy, Olkiluoto. 16 p.
Niinimäki, R. 2002. Core drilling of deep borehole OL-KR22 at Olkiluoto in Eurajoki
2002. Working Report 2002-59. Posiva Oy, Olkiluoto. 199 p.
Paulamäki, S., Paananen, M., Gehör, S., Kärki, A., Front, K., Aaltonen, I., Ahokas, T.,
Kemppainen, K., Mattila, J. & Wikström, L. 2006. Geological model of the Olkiluoto
site, version 0. Working Report 2006-37. Posiva Oy, Olkiluoto.
Pöllänen, J., Pekkanen, J., Rouhiainen, P. 2005. Difference flow and electric
conductivity measurements at the Olkiluoto site in Eurajoki, boreholes KR19 – KR28,
KR19B, KR20B, KR22B, KR23B, KR27B and KR28B. Working report 2005-52.
Posiva Oy, Olkiluoto.
Suominen, V. 1991. The chronostratigraphy of southwestern Finland with special
reference to Postjotnian and Subjotnian diabases. Geological Survey of Finland Bulletin
356, 100 p.
Suominen, V., Fagerström, P. & Torssonen, M. 1997. Pre-Quaternary rocks of the
Rauma map-sheet area (in Finnish with an English summary). Geological Survey of
Finland, Geological Map of Finland 1:100 000, Explanation to the maps of Pre-
Quaternary rocks, Sheet 1132, 54 p.
Veräjämäki, A. 1998. Pre-Quaternary rocks of the Kokemäki map-sheet area (in Finnish
with an English summary). Geological Survey of Finland, Geological Map of Finland
1:100 000, Explanation to the maps of Pre-Quaternary rocks, Sheet 1134, 51 p.
38
APPENDICES
Appendix 1.
File KR22_APP1 in the disk enclosed. The Appendix contains the results of whole rock
chemical analyses.
Appendix 2.
File KR22_APP2 in the disk enclosed. The Appendix contains the results of whole rock
XRF analyses.
Appendix 3.
File KR22_APP3 in the disk enclosed. The Appendix contains the results of modal
mineral composition analyses.
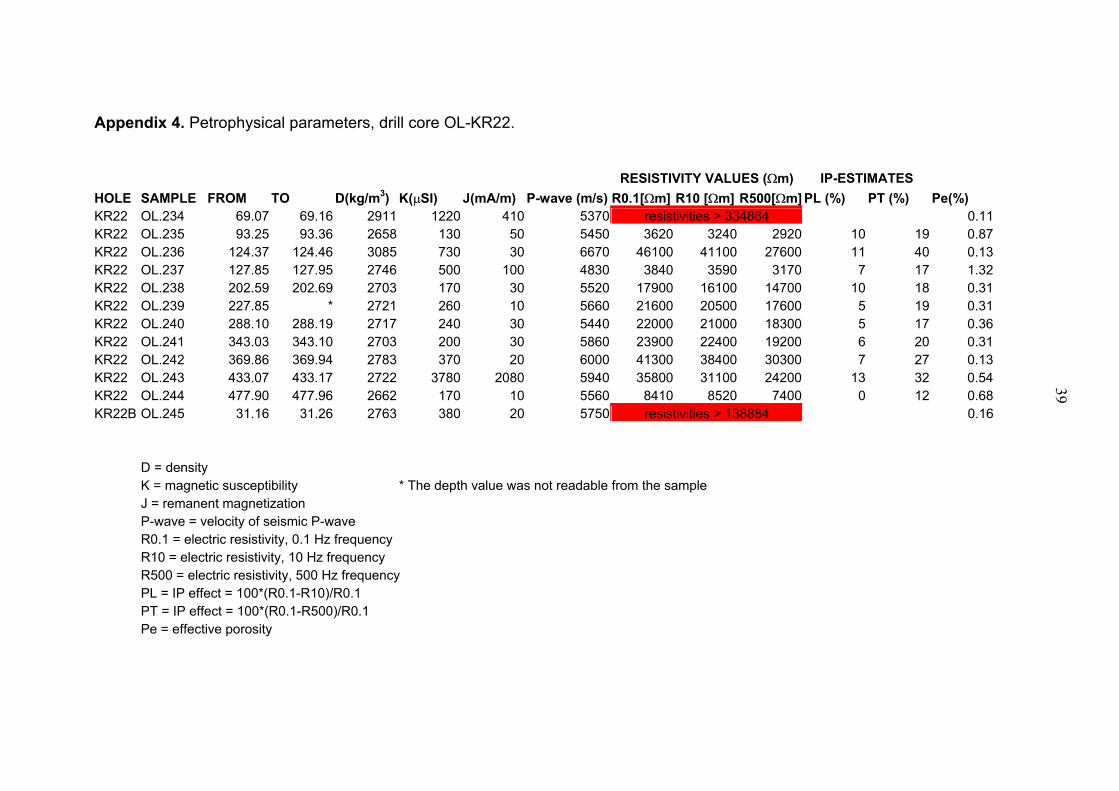
Appendix 4. Petrophysical parameters, drill core OL-KR22.
RESISTIVITY VALUES ( m) IP-ESTIMATES
HOLE SAMPLE FROM TO D(kg/m3) K( SI) J(mA/m) P-wave (m/s) R0.1[ m] R10 [ m] R500[ m] PL (%) PT (%) Pe(%) KR22 OL.234 69.07 69.16 2911 1220 410 5370 resistivities > 334864 0.11
KR22 OL.235 93.25 93.36 2658 130 50 5450 3620 3240 2920 10 19 0.87
KR22 OL.236 124.37 124.46 3085 730 30 6670 46100 41100 27600 11 40 0.13
KR22 OL.237 127.85 127.95 2746 500 100 4830 3840 3590 3170 7 17 1.32
KR22 OL.238 202.59 202.69 2703 170 30 5520 17900 16100 14700 10 18 0.31
KR22 OL.239 227.85 * 2721 260 10 5660 21600 20500 17600 5 19 0.31
KR22 OL.240 288.10 288.19 2717 240 30 5440 22000 21000 18300 5 17 0.36
KR22 OL.241 343.03 343.10 2703 200 30 5860 23900 22400 19200 6 20 0.31
KR22 OL.242 369.86 369.94 2783 370 20 6000 41300 38400 30300 7 27 0.13
KR22 OL.243 433.07 433.17 2722 3780 2080 5940 35800 31100 24200 13 32 0.54
KR22 OL.244 477.90 477.96 2662 170 10 5560 8410 8520 7400 0 12 0.68
KR22B OL.245 31.16 31.26 2763 380 20 5750 resistivities > 138884 0.16
D = density
K = magnetic susceptibility * The depth value was not readable from the sample
J = remanent magnetization
P-wave = velocity of seismic P-wave
R0.1 = electric resistivity, 0.1 Hz frequency
R10 = electric resistivity, 10 Hz frequency
R500 = electric resistivity, 500 Hz frequency
PL = IP effect = 100*(R0.1-R10)/R0.1
PT = IP effect = 100*(R0.1-R500)/R0.1
Pe = effective porosity
39