Embed Size (px)
Citation preview

PETER KOCH
ABSTRACT. Wood and bark £rom 72 trees of Pinus glabf'Q Walt. were evaluated with aPerJdn-Elmer DSC-1B scanning calorimeter; a total of 6,696 observations was made in thetemperature range 60 to 140°C. The samples were £rom Louisiana, Mississippi, and Alabama- the major commercial range of the species.
For wood representative of the trees, specific heat = 0.2651 + 0.001004 (temperature indegrees C.); heartwood appeared to have a higher specific heat than sapwood; latewood hada higher speclBc heat than earlywood. While latewood specific heat had a positive linearrelationship with temperature, earlywood specific heat was a function of temperature andtemperature squared, so that the curve was convex upward. Wood of maximum specific heatwas latewood from trees in the eastern part of the major range, taken £rom the heartwood closeto ground level.
For bark representative of the trees, specific heat = 0.3322 - 0.0002582 (temperature indegrees C.) + 0.000005137 (temperature squared); this curve is concave upward. Bark ofmaximum speclBc heat was from the tops of fast-grown trees in the southern part of the range.With all other factors fixed, speclBc heat of bark was negatively related to number of annualrings at the point of sampling.
T HE FO~T PRODUCIS UTn.IZAnON RESEARCH
PROjEcr in Alexandria, La., is engaged in asystematic evaluation of southern pine woodas an industrial raw material. The specificheat of wood - that is, the heat capacity ofa given mass of wood compared to the heatcapacity of the same mass of water at 15°C. -is a fundamental thermal property and there-fore of interest. Heat capacity of a materialmay be expressed as the number of caloriesrequired to raise 1 gram 1°C. in temperature.Because heat capacity of water at 15°C. is 1
calorie per gram per degree C., heat capacitand specific heat are numerically equal.
The design of this study was influenced btwo factors. First was the knowledge th~prior workers had reported mean specific he~of large specimens averaged over rather widtemperature ranges. Second, availability (the relatively new scanning calorimeter peJmitted evaluation of very small specimens (to 20 milligrams) at precise temperatureSince southern pine wood varies in many (its properties, it was thought probable thlsmall variations also exist in the specific helof wood and bark.
In recognition of the problems faced by pr.vious workers, the purpose of the present r.search was to study variation exhaustive]within a single species. Spruce pine ( Pintgiab1"a Walt.) was selected because it iscompact population and therefore easi
sampled.
The author is Chief Wood Scientist. Southern ForestExperiment Station, USDA Forest Service, Alexandria,La. This paper was presented at Session 1 - Anatomyand Fundamental ~es - of the 22nd AnnualMeeting of the Forest Products Research Society,June 24, 1968, in Washingto~ D. C., and was re-ceived for publication in September 1968.
2(WOOD SCIENCE Vol.l,No.4

heat (~) over an interval from starting tem-perature ( To) to endpoint temperature (T 1 ) .his equation is more properly expressed:
C; = 0..266 + 0.(KX)58 (To + TJ)
In Kiel in 1896, B. Volbehr wrote an un-published doctoral thesis titled, "Swelling ofWood Fibers"!. He proposed an expressiOn forthe mean specific heat of wood over the rangefrom zero to l00°C. with moisture content inthe range from zero to 27 percent:
c. = 0.2590 + O.(XXXJ75m +O.lXXm5T J + O.lm>l5mT J
whel'e ~ = mean speci&c heat over therange in question
m = moisture content as a percent-age of OVeDdry weight, e.g., at~ percent moisture content, m= ~.
T J = endpoint temperature, with start-ing temperature at zeroO C.
With m equal to zero, and in terms of truespeci&c heat at a particular temperature (T)in the range from zero to l00°C.:
Cp = 0..2500 + 0.001.2107'
The speci6c objectives were:1) To determine, for the major range of the
species, the average specific heats for barkand wood, the averages to be stratified intothree age classes and two growth rates.
2) To measure the variation in speci6c heatas a function of temperature in the rangefrom 00 to 140°C. (140 to 284°F.).
3) To determine the variation in the speci&cheat of earlywood, latewood, and bark,with height in the tree, years from the pith,latitude and longitude, and specific gr~vityof specimens.
4) To compare the specific heats of sapwoodand heartwood.
5) To determine, by regression relationships,which location in the tree provides themost accurate sampling point for predict-ing the tree average.
6) To develop regression relationships forpredicting tree-average values from sam-ples taken approximately 1 foot aboveground level.
An additional aim was to review compre-hensively the literature pertinent to moist aswell as dry wood and bark, even though theresearch was restricted to dry material.
The report printed here is highly con-densed. For those researchers who desire toinvestigate the subject further, the full litera-ture review, explicit procedure, detailed re-sults, and error analysis are available from theauthor.
The Literature in Brief
Specific Heat of Dry Wood
Dunlap (1912) is the major reference onthe subject. With a modmcation of Bunsen'sice calorimeter he measured the specific heatof small cylinders of ovendry wood. The speci-mens weighed about 6 grams and were 1.7centimeters in diameter and 3 to 9 centi-meters in length.
From a total of 110 evaluations on 00species ranging in speci8c gravity from 0.23to 1.10, he determined that the true specificheat (Cp ) of wood varies with temperaturein the range from 7.«0° C. to approximately112°C., and that the relationship is expressedby a straight line: true specific heat = Cp =0.266 + 0.OOI16T, where T is in degrees C.Because Dunlap was measuring mean specific
This equation is similar in slope to Dunlap'sequation for essentially the same temperaturerange, but has a slightly lower intercept.
Koljo (1950) reported the specific heat ofdry wood to be 0.t}S.) at zeroO C.
While Dunlap reported no differencesamong species, Geiger (1942) observed thatovendry spruce had a mean speci6c heat of0.323 (compared to 0.351 for beech) whencooled over the interval from 50 to -9S°C.Narayanamurti and Jain (1958) evaluatedovendry wood of nine Indian species at 18°C.and found a range of values from 0.310 tc0.413.
Speci6c Heat of Wet Wood
Moist wood has a higher specific heat thaI:the relative proportions of wood and wateJwould suggest (Byram et al., 1~2).
Kelsey and Clarke (1956), in experiment!on k1inki pine ( Araucarla klinkii Lauterb.)
'Original DOt seen. Infonnation is from Beall (1968and Narayanamurti and Jain (1958).
APRIL 196~~

Petit and discussed its inapplicability to wood.based material. Following a review of themore modem Debye theory, they used Dun-lap's data and their own experimental data toestimate the atomic heat capacity at constantvolume (equal to the specific heat at constantvolume x atomic weight) of wood and moistparticleboard. Both curves are functions oftemperature. In the range zero to 100°C.,their curve for dry wood falls very close toexperimentally determined values for graphite.Moist particleboard was shown to have aslightly higher atomic heat capacity at CQn-stant volume.
Reifsnyder et al. ( 1967 ) evaluated thespecific heat of ovendry bark from 90-year-oldlongleaf, 70-year-old shortleaf, and 4O-year-old red pine trees. At OO°C., the variation be-twe~n trees was significant, but not the varia-tion between species:
TotalNumber samples
Species Specific heat of trees per species-0.303 5 20.322 5 20.323 4 15
Longleaf pineShortleaf pineRed pine
Average of55 samples 0.316
Specific Heat of Wet Bark
Martin (1963) measured the elevation ofspecific heat- above that suggeSted by asimple mixture of water and bark - for barkat 27 percent moisture content and 56°C. Hereported a value of 0.083 calorie per gramof ovendry bark per degree C. The elevationof specific heat had a positive linear relation-ship to moisture content between zero and 27percent. Above 27 percent moisture contentthe value was constant at 0.083.
General Theory
Ward and Skaar (1963), in a study ofthe specific heat of moist particleboard, ex-amined the 1819 empirical law of Dulong and
~ ~ ~~&~~.
~ F~ ,.
, " ,'"( / ~..~ .~
-1-Tf-";6"~~ . -
Procedure
A stratified random Sanlple of 72 sprucepine trees was cut in the area encompassingthe major range of the species. Tree variableswere:1) Geographic location: four areas (Fig. 1).2) Age of tree: 15, 30, or 45 years.3) Rings per inch 1 foot above ground: either
less than six or more than six.4) Replications of trees: three.
The 72 trees were felled and cross-sectionaldisks were removed at 8-foot intervals begin-ning at 1 foot above ground level and endingat a 4-inch top. These disks provided woodand bark representative of each entire tree.
Three of the disks per tree - those takenat 1 foot above ground, at a 4-inch top, andhalfway between - also provided wood andbark for analysis of within-tree variability:1) Height above ground: at the three posi-
tions represen~ by the disks.2) Radial position in the stem: 1/6,3/6, and
5/6 of the annual rings from the pith(Fig. 2).
3) Cell type: earlywood and latewood.Thus, the six-factor experiment required
1,296 solid-woOd specimens: (four locations)(three age classes) (two growth .rates) (threereplications of trees) (three heights) ( threeradial positions) (two cell types). For eachspecimen, distance from the pith was recordedin both rings and inches; distance above theground was measured in feet. These 1,296solid specimens will hereafter be referred toas point wood. They were comprised of 18specimens from each of the 72 trees ( threedisks per tree x six specimens per disk, as
APRIL 196~~
II
/JjFIgure 2. - Aver8ge v81ue for specific he8t of b8rkof each disk W8S determined from bark stripped froma 2100 segment of the three disks t8ken from the top,bottom, and approximate midpoints of each bole.Identity of b8rk from each disk W8S m8lntalned. Spe-cific heat of e8rlywood and 18tewood W8S measuredat sample points 1, 2, and 3 - i.e., six specimens
per disk.
'I-;
.il~I
explained in Fig. 2). Half were latewood andhalf earlywood.
In addition, three other sets of sampleswere drawn:
T,.ee wood: 300 wood ~ens preparedfrom pairs of opposed 3O-degree wedges takenfrom disks at 8-foot intervals to a 4-inch top.The average value for each of the 72 trees wasderived from five replications. Wedges weremilled and screened to facilitate preparationof representative specimens.
T,.ee bafOk: 300 bark specimens prepared(by milling and screening) from wedgestaken at 8-foot intervals to a 4-inch top. Theaverage value for each of the 72 trees wasderived from five replications.
Disk ba,.k: 216 milled bark specimens, onefrom each of the three disks taken at top, bot-tom, and midpoint of each of the 72 trees.
Because each of the 2,2-'32 samples wasevaluated at three temperatures, a total of6,696 observations was made.
The drying procedure for specimens had tobe such that there would be no appreciableweight change (::t:O.OO milligram) during thetotal calorimeter scan. Wood specimens weredried for 8 hours in a vacuum oven at 103°C.Bark speciIJlens were dried on the calori.meterat 152°C. Each specimen was weighed after
as well as before it was run, and the averag'weight was used in calcula~g the specifiheat.
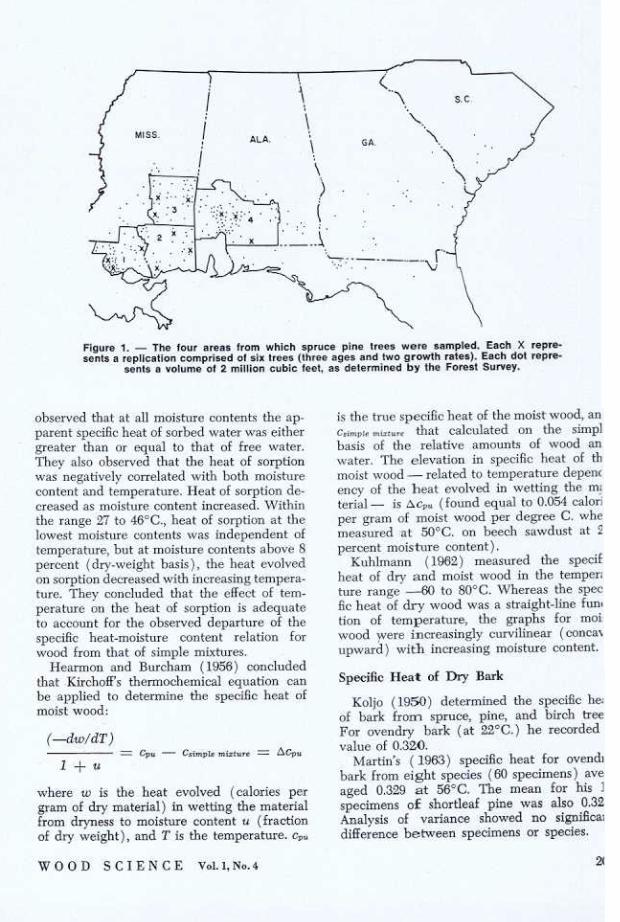
Scanning CalorimeterThe instrument employed for evaluation 0
specific heat was the Perkin-Elmer DSC-IJ.differential scanning calorimeter (Fig. 3).
In this calorimeter, specimen and referencmaterial are subjected to increasing (or dEcreasing) temperature at a closely controllerate. A monitoring system detects any diHeJence between specimen and reference tenperature and simultaneously changes thamount of heat supplied to either specimen (reference in order to maintain both at thsame temperature.
The instrument's actual measurement is n<the difference in temperature between specmen and reference; this always remains ve~small. Instead, the measurement is the diffeence in electrical power required to maintaispecimen and reference at the desired tenperature. Thermal lags are minimized by wof very small specimens.
Because the recorder is arranged with diferential energy as the ordinate and tin(hence temperature when programmed tospecific rate of temperature rise) as tI
Figure 3. - Perkin-Eimer DSC-1B differential scanning calorimeter. Extreme upper left: valveto control purging nitrogen. Left: Temperature indicator and scan control. Center: Sensinghead In which specimen and reference were subjected to Increasing temperature at a closelycontrolled rate. Right: Chart to record the difference In electrical power required to maintainthe specimen, 8S comp8red to the reference, 8t 8 programmed rate of temperature rile (Inthis case 10°C. per minute). G1888 app8ratus on back of t8bl. provided check on nitrogen
now r8te.
WOOD SCIENCE Vol. I, No.4

abscissa, the ordinate readout is directly pro-portional to dH / dt; where H is heat and t istime.
In this study, the thermal quantity of in-terest is dH/dT; where T is temperature. For1 gram of material, dH / dT is the specific heat( Cp) in calories per gram per degree C.
Typically, specific heat is a slowly varyingfunction of temperature.The readout
dB
dT
dT
dt
dH
dt= CpT
clT0 -=c.°
dt-
dT Figure 4.-View down Into the nitrogen purged sen-sing head (top removed). Specimen end referencepans are under the two dome-shaped covers. Eechpen rests on Its individual heating element. Thepans and covers were matched by weight. Weight-matching equalizes differential displacement due tothe mcp effect. The purpose of the domes was tomaintain relatively constant radiation end convec-tion behavior, and to minimize the effect of sample
placement in the holder.
= T = the scanning rate - forwheredt
example, 1/6°C. per second.
After the instrument had been calibrated,empty sample pans with lids were placed inboth specimen and reference holders. Domedcovers then were carefully placed over thelidded pans (Fig. 4). The temperature wasdialed to 5(}°C. and held constant until thepen reached equilibrium and drew a Bat linefor at least half a minute. Scanning was thenbegun at the rate of 10°C. per minute andallowed to continue for 2 minutes. When thetemperature reached 70°C., the scan wasstopped and the pen again allowed to reachequilibrium and run Bat for at least half aminute. This procedure was repeated for scansfrom 90 to 110°C. and 130 to 15(}°C. Thenthe temperature was dialed down to 5(}°C. andthe blank pan removed. The head was cooledwith a hand blower until temperature controlwas regained. A sapphire standard was nextput in the sample pan, the lid dropped inplace but not crimped, and the sapphire runin the same manner as the blank. From thesetwo runs a constant was computed to be usedin determining the actual specific heat of thewood and bark specimens. The wood or barkspecimens, which weighed between 5 and 2Cmilligrams, then replaced the sapphire stand.ard. The specific heat was calculated at thE
The ordinate displacement is proportional
to T Cpm, where m is the mass of the specimenin grams.
Essentials of the measurement proceduremay be described briefly.
The sample pans were of aluminum, ap-proximately 0.25 inch in diameter and Q.05inch deep. Each pan had a Hat aluminum lid,which fitted inside the pan directly on thesample. Cleaned pans and lids were weight-matched before loading. Pans could be sealed( not hermetically) with a crimping device,and powdered specimens (tree wood and allbark samples) were crimped to prevent spill-age. Specimens of solid wood taken from the1,296 sample points were merely deposited inthe pans and the lids placed on top.
Table 1. - SPECIFIC HEAT OF OVENDRY SPRUCEPINE WOOD.
Specific heat of tree wood at60°C. 100°C. 140°C.Stratification of trees
15-Y8.r-old treesSlow-grownFast-grown
30-year-old treesSlow-grownFaet-grown
45-year-old treesSlow-grownFast-grown
0.3670.3629
0.4086.3993
0.3268.3212
.3242
.3263.3655.3676
.4038
.4084
.3874
.3870.4062.4055
.3253.3263
APRIL 196~~

where K is the calibration oonstant. Thus,
for sapphire y' = KTCp' m',and for the wood or .bark sample y = KTCpm,
ym'(4'therefore Cp
y'mBecause a single sapphire standard oj
known specific heat and mass was used durin~the entire experiment, the equation abovtwas simplified to:
yCp = (constant).
midpoints of the three scans, i.e., at 00, 100,and 140°C.
The temperature program is not sbictlylinear over the whole range of interest. Thus,the ordinate calibration constant is, to somedegree, a function of temperature. The use ofa standard run under the same conditions asthe unknown specimen eliminates this error.Since the specific heat of synthetic sapphirehas been determined to five significant figuresin the range zero to 1,'ll'X)°K. by Ginnings andFurukawa (1953), and since sapphire couldbe obtained as small disks exactly fitting asample pan, it was an excellent material for astandard.
In Figure 5, the baseline ABC is the scanmade with empty sample pans and covers inboth specimen and reference holders. Thecurve AEC is the scan of a sapphire disk usedin an illustrative Cp determination. At anypoint in dynamic equilibrium on the curve,
the ordinate deftection y is equal to KT Cpm,
[
H.384MG
.4.92 MGWOOD
cA
y'mThe principal source of error in the de
termination of specific heat by this method i:uncertainty about the location of the nospecimen baseline. Baseline error was reduce<by scanning over a short interval (20°C.) an(by replicating the observations. Errors alsloccurred in measurements of the ordinate an(in weight deterDlinations. The manufactureclaims that, with good experimental teclJnique, Cp may be routinely measured to withiJ::!:2 percent without replication. Runs witJone sapphire disk as the known material an.another as the unknown appeared to contin:this claim. Many of the errors occurred raIldomly, and for the study as a whole it appealthat individual values are, at best, accuratto three significant figures, e.g., 0.332. Becausobservations were numerous, averages arpossibly accurate to four places, e.g., 0.33~and are so recorded. Computer determinatioof standard errors applicable to specific curvErequired retention of additional places, as itdicated by the equations printed in the RtsuIts section of the text. Equations in tbAbstract and the Discussion-Summary sectiohave been rounded to four significant place
ResmtsTree Wood and Species Average Valu~
The grand mean of specific heat at ea<temperature was:
Temperature-- ( °C. ) Specific he~ of tree wac
BASI
IIIIIIIIIII~~~IIIIIIIto 100 IC
TE.. "C
Figure 5. - Typic:al calorimeler plots for spruce pinewood in Ihe range 90 10 110.C.; scanning rale, 10.C.per minute; full-scale chari deflection, 2 millicalorle.per second; chari speed, 1 Inch per mlnle. Delermln.-
lion made aI100.C.
0.3250.3662.4053
60100140
WOOD SCIENCE Vol... No.4

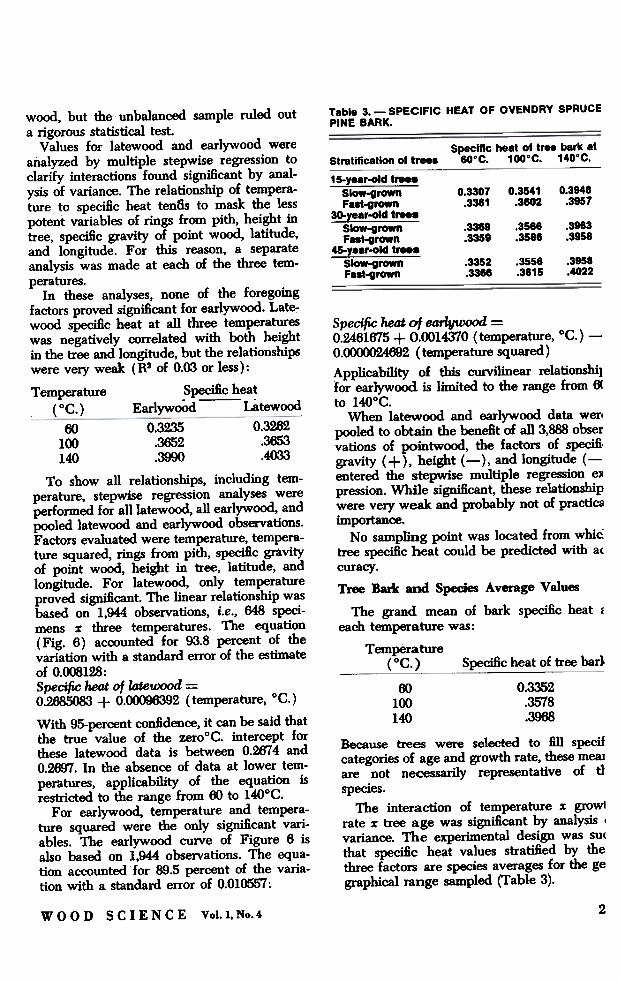
Table 3. - SPECIFIC HEAT OF OVENDRY SPRUCEPINE BARK.
Specific he8t of tree b8rk 8t60.C. 100.C. 140.C.Stratification 01 trees
15-year-old treesSlow-grownFast.grown
30-year-old t...SIow-grownFast-grown
45-year-old treeeSlow-grownFast-grown
0.3948.3957
0.3307.3361
0.3541.3602
.3568
.3588.3963.3958
.3369
.3359
.3958
.4022.3352.3388
.3556.3615
wood, but the unbalanced sample ruled outa rigorous statistical test.
Values for latewood and earlywood wereanalyzed by multiple stepwise regression toclarify interactions found significant by anal-ysis of variance. The relationship of tempera-ture to specific heat ten8s to mask the lesspotent variables of rings from pith, hei~t intree, specific gravity of point wood, latitude,and longitude. For this reason, a separateanalysis was made at each of the three tem-peratures.
In these analyses, none of the foregoingfactors proved significant for earlywood. Late-wood specific heat at all three temperatureswas negatively correlated with both heightin the tree and longitude, but the relationshipswere very weak (RS of 0.03 or less):
Temperature S~c heat( °C. ) E~lywOOd - Latewood
Specific heat. of earlywood =0.2461615 + 0.0014370 (temperature, °C.) -0.<XXXX>24692 (temperature squared)Applicability of this curvilinear relationshilfor earlywood is limited to the range from ~to 140°C.
When latewood and earlywood data wertpooled to obtain the benefit of all 3,888 observations of pointwood, the factors of speci:6,gravity (+), height (-), and longitude (-entered the stepwise multiple regression expression. While significant, these relationshipwere very weak and probably not of practics
importance.No sampling point was located from whiC:
tree specific heat could be predicted with a<
curacy.Tree Bark and Species Average Values
The grand mean of bark specific heat Eeach temperature was:
Temperature( °C. ) Specific heat of tree bar}
0.3352.3578.3968
00100140
Because b"ees were selected to fill speclfcategories of age and growth rate, these meware not necessarily representative of tlspecies.
The interaction of temperature x growirate x tree age was significant by analysis ,variance. The experimental design was su(that specific heat values stratified by thethree factors are species averages for the gegraphical range sampled (Table 3).
00 0.3235 0.3~100 .3652 .3653140 .3~ .4033
To show all relationships, including tem-perature. stepwise regression analyses wereperformed for alllatewooo. all earlywood. andpooled latewood and earlywood observations.Factors evaluated were temperature. tempera-ture squared. rings from pith. specific gravityof point wood. height in tree, latitude. andlongitude. For latewood. only temperatureproved signi6cant. The linear relationship wasbased on 1.944 observations, i.e., 648 speci-mens x three temperatures. The equation( Fig. 6) accounted for 93.8 percent of thevariation with a standard error of the estimateof 0.008128:Speci(lc heat of latewood =0.2685083 + 0.~92 (temperature. °C.)With 95-percent confidence. it can be said thatthe true value of the zerooC. intercept forthese latewood data is between 0.2674 and0.2007. In the absence of data at lower tem-perlitures. applicability of the equation isrestricted to the range £rom 00 to 140°C.
For earlywood. temperature and tempera-ture squared were the only signi6cant vari-ables. The earlywood curve of Figure 6 isalso based on 1.944 observations. The equa-tion accounted lor 89.5 percent of the varia-tion with a standard error of 0.010557:
2WOOD SCIENCE Vol.I,No.4


straight line fell very close to the zerooC. in-tercepts which Volbehr, Dunlap (1912), andKoljo ( 1950) determined for other speciesafter observations from zero to l00°C:
Intercept at O°C.Specific heat
at lOO°C.
O. 3800.382
Volbehr 0.2.500Dunlap .266Koljo .~Koch (spruce
pine tree wood) .2651 .3655
Specific heat of disk bark = 0.4291753 -0.<XX>4518 (temperature, degrees C.) +0.cxxxm9 (height, feet) -0.0001022 (age of disk, years) -0.0026718 (latitude, degrees) +0.00000595704 (temperature squared) +0.0062364 (growth rate, inches of dia. per year)
Figure 8 shows the individual effects of thesignificant factors. The plots for each factorwere made by holding all other variables con-stant at their average values.
No sampling point was found from whichtree bark specific heat could be predicted with
accuracy.The slope of the line, however, was consider-ably less than that observed by either Dunlap 01V olbehr. These data lend support to the posi-tion of Geiger (1942) and of Narayanamurti andJain (1958) that specific heat may vary amon@tree species. The differences observed in ~experiment between heartwood and sapwoodand between earlywood and latewood, als(suggest that there may be differences amon~
species.The relationships indicated that the ma.
terial of maximum specific heat was latewoo<from trees in the eastern part of the majoJrange, taken from the heartwood zone clostto ground level. Presumably the observecvariability in specific heat with position iItree and geographic location is mainly a resuIt of variability in the proportions of cellulose, lignin, and extractives comprising thcwood.
Discussion and SummaryA few new relationships were observed in
this study. The conclusions stated below areapplicable to ovendry spruce pine from themajor geographic range (Fig. 1) and for ma-terial evaluated at temperatures between 00and 140°C.
Wood1) For wood representative of the troos,
specific heat = 0.2651 + 0.001004 (tem-perature in degrees C.). Species valuesstratified by tree age and growth rate wereestablished (Table 1).
2) Heartwood appeared to have a higherspecific heat than sapwood.
3) Latewood had a higher specific heat thanearlywood (Fig. 6).
4) Latewood specific heat had a weak nega-tive correlation with height above groundand with longitude.
5) While latewood specific heat had a posi-tive linear relationship with temperature,earlywood specific heat was a function oftemperature and temperature squared(Fig. 6). The curve was convex upward.
6) Specific heat of pooled earlywood and late-wood had a weak positive correlation with
specific gravity.7) No sampling point was located from which
specific heat for wood of the entire treecould be predicted with accuracy.
For tree wood at the intensity of samplingstated (300 samples, i.e., 72 trees replicatedfive times), in the range 00 to 140°C., thespecific heat of spruce pine wood was validlyexpressed as a straight-line function of tem-perature only. The zero°C. intercept of this
Bark1) For bark representative of the tree~
specific heat = 0.3322 - 0.(xx)2582 (temperature in degrees C.) + 0.~1'.r( temperature squared). Species value~stratified by tree age and growth ratEwere established (Table 3).
2) Specific heat of bark was a function 0temperature and temperature square(Figs. 1 and 8). The curve was concavupward.
3) Specific heat of disk bark was positive}correlated with height above ground an,negatively correlated with disk age anlatitude (Fig. 8).
4) Bark from fast-grown trees had bighEspecific heat than bark from slow-growtrees (Figs. 1 and 8).
21WOOD SCIENCE Vol. I, No.4

related with number of annual rings at thepoint of sampling. It is probable that the ob-served variability in specific heat with posi-tion, location, and growth rate reflects a posi-tive correlation between specific heat and theratio of phloem to rytidome in bark.
5) No sampling point was located from whichspecific heat of tree bark could be pre-dicted with accuracy.
Much prior research on the speci8c heat ofovendry bark has been concerned with tem-peratures below the range M to 140°C. How-ever, a few values for MoC. are available forcomparison:
Specific heatSpecies at ~oC.
Reumyder et OZ. (1fNJ7) longleaf O.~Reifmyder et al. (1fNJ7) shortleaf .322Martin (1963) 10blolly.3m
(at 56°C.)Koch (tree baric) spruce pine .3352
Although the wood of spruce pine treesevidently bas lower speci&c heat than woodof some other species, these data suggest thatbaric may be comparatively high in specificheat. The major diHerence between the speci-6c heat of baric and wood was found to bein the temperature relationship. The barkcurve was a function of temperature and tem-perature squared and was concave upward(Figs. 7 and 8). while the curve for wood wasa straight line or convex upward (Fig. 6).
Otherwise the values for tree wood and treebaric were quite simi1ar:
Temperature(OC.)
Specific heatTree wood Tree bark
- - -~ o.~ 0.3352
100 .3662 .3578140 .4003 .3968
For spruce pine disk bark in the range from00 to 140°C., the relationships indicated thatbark of maximum specific heat was from thetops of fast-grown trees in the southern partof the major range. With all other factors&xed, speci6c heat of bark was negatively cor-
LiterabueCited
BEALL, F. C. 1968. Specisc heat of wood-furtherreIearcb required to obtain meaDingfu1 data. USDAFor. Serv. Res. Note FPL-OI84, 8 pp. For. Prod.Lab., M~ Wfs.
BYRAM, G. M., F. M. SAva, W. L. FoN, AND R. K.ARNOLD. 1952. Thermal properties of forest fuels.USDA For. Serv. Div. F~ Res. Interim Tech. Rep.AFSWP-4O4, 34 IIp.
DmfLAp, F. 1912. The speci& heat of wood. USDAFor. Prod. Lab., For. Serv. FPL. Ser. Bull. 110,28 pp. Madison, Wis.
G..,u, F. 1942. About the cooling aM the specificheat of dry aIMi ~ wood. Holz als Rob- uodWerbtoft' 5:14:8-152-
GINNINCS, D. C., AND G. T. FuRUKAWA. 19S3. Heatcapacity standards for the range 14 to 1200" K.Jour. Amer. Cbem. Soc. 7S:522-S27.
HBABMON, R. F. S., AND J. N. BUIK:RAW. 1956. Thespeci& beat aIMi beat of wetting of ~. a.em.aM h¥I., No. 31, pp. m7~.
Ka..aY, K. E., AND L. N. CLARKE. 19S6. The heat ofM)rptIon of water by ~. Aust. J. Appl. Scl.7:160-175.
KOI.]o, B. 1950. SQDethjng about the heat pbeoomenaof woods aOO trees. FMStwissenscbaftliches Cen-tralblatt 69:538-SS1.
KUInoYANN, G. 1962. Investigation of the thermalproperties of wood aM putideboard in relation tomoisture content aM tempentme in the hygro-soopic range. Holz als Roh- unci Werbtoft' 20:259-270.
MARTIN, R. E. 1963. Thermal properties of bark. For.Prod. Jour. 13( 10) :419-426.
NA.BA.TANAMmm. D., AND N. C. JAIN. 1958. A mteon the spedIc beat of wood. Curr. Sd.27:97.
RSInNYDEI\, W. E., L. P. HDRINcoroN, AND K. W.SPALT. 1967. 'Thermophylical properties of bark ofahortleaf, longleaf, aM red pine. Yale Forest. Bull.70, 41 pp.
WAllO, R. J., AND C. SKAA.B. 1963. Spedic beat aOOconductivity of particleboud as functions of tem-perature. For. Prod. Jour. 13( 1) :31-38.
APRIL 196~214