Embed Size (px)
Citation preview

Personal PortfoliosConservative TaxableDecember 31, 2017
*Inception date of portfolio with current investment mandate. Portfolio existed from April 2006 through April 2009 under different investment mandate. The holdings supplied are a complete list as of 12/31/2017. These may change prior to investment and are subject to change at any time. Allocations may not add to totals due to rounding of asset class and fund allocation percentages. Beta: A measure of a portfolio’s sensitivity to market movements, measured against the S&P 500. Yield: The income return on an investment, such as the interest or dividends received from holding a particular security.
This report is exclusively for one-on-one use only with investors. Not for redistribution. BrinkerCapital.com // 800.333.4573
Portfolio overviewn Wealth preservation
n Strategic target of 20% growth assets and 80% stable assets
n Suitable for investors with a timeframe of 3+ years
Key statisticsInception date April 2009*
Number of holdings 19
Portfolio turnover (12 month) --
Yield 1.80%
Internal expense ratio 0.33%
Beta vs. S&P 500 (5 year) 0.22
Investment minimum $500,000
About Brinker CapitalSince 1987, our purpose has been to integrate the idea of diversification through multi-asset class investing with a disciplined investment approach. By continually enhancing and applying these principles, we strive to deliver better outcomes for investors.
Portfolio management teamAndrew Rosenberger, CFA, Senior Investment Managern 13 years industry experiencen B.S. Pennsylvania State University
Asset class breakdownWeight
n Domestic Equity 17%n International Equity 3%n Fixed Income 65%n Global Credit 5%n Absolute Return 8%n Real Assets 3%
Portfolio holdings Range WeightDomestic Equity (0%-30%) 17.07%AIA - Global Equity 11.53%SPDR S&P 500 4.48%Driehaus Micro Cap Growth 1.07%International Equity (5%-20%) 2.80%Vanguard Emerging Markets ETF 1.61%iShares MSCI India 0.60%Wasatch International Opportunities 0.59%Fixed Income (50%-100%) 64.51%SPDR Nuveen Barclays Capital ST Muni ETF 24.93%SPDR Nuveen Barclays Municipal Bond ETF 21.35%SPDR DoubleLine Total Return ETF 9.61%PIMCO Enhanced Short Maturity Active ETF 6.56%Cash 2.06%Global Credit (0%-25%) 5.02%SPDR Barclays High Yield Bond 2.87%DoubleLine Low Duration Emerging Markets 2.14%Absolute Return (0%-30%) 8.08%Driehaus Active Income 3.74%JPMorgan Strategic Income Opportunities 2.42%William Blair Macro Allocation 1.92%Real Assets (0%-15%) 2.53%JPMorgan Alerian MLP ETN 1.15%Victory Global Natural Resources 0.87%iShares US Real Estate ETF 0.50%
This report is exclusively for one-on-one use only with investors. Not for redistribution. BrinkerCapital.com // 800.333.4573FS_PP_CON_T1
Growth of $100,000 since inception
Mar-09 May-11 Aug-13 Oct-15 Dec-17$50,000
$100,000
$150,000
$200,000
$250,000
$300,000
$350,000
$400,000
$450,000Ending valuesas of December 31, 2017
Strategy $155,811
Russell 3000 $408,130
ACWI ex US $256,657
Barclays Muni $152,140
HFRX $124,147
Annualized performance (trailing as of quarter-end)QTD YTD 1 Year 3 Year 5 Year 10 Year Since Inc.
Strategy 1.33% 7.11% 7.11% 3.03% 3.44% -- 5.20%Russell 3000 6.34% 21.13% 21.13% 11.12% 15.58% -- 17.44%ACWI ex US 5.06% 27.77% 27.77% 8.33% 7.28% -- 11.37%Barclays Muni 0.75% 5.45% 5.45% 2.98% 3.02% -- 4.91%HFRX 1.50% 5.99% 5.99% 1.54% 2.12% -- 2.50%
Standard deviation1 Year 3 Year 5 Year Since Inc.1.21% 2.85% 2.97% 3.42%3.68% 10.09% 9.67% 12.68%3.74% 11.88% 11.42% 15.91%2.17% 3.30% 3.49% 3.84%1.13% 3.51% 3.37% 3.99%
Calendar year performance2010 2011 2012 2013 2014 2015 2016 2017
Strategy 4.90% 3.52% 7.65% 4.45% 3.66% 0.34% 1.76% 7.11%Russell 3000 16.93% 1.03% 16.42% 33.55% 12.56% 0.48% 12.74% 21.13%ACWI ex US 11.60% -13.33% 17.39% 15.78% -3.44% -5.25% 5.01% 27.77%Barclays Muni 2.38% 10.70% 6.78% -2.55% 9.05% 3.30% 0.25% 5.45%HFRX 5.19% -8.87% 3.51% 6.72% -0.58% -3.64% 2.50% 5.99%
The above chart reflects a hypothetical $100,000 investment made at inception with no additional trading and all dividends reinvested. The product changed its investment mandate in April 2009. Past performance is no guarantee of future results or trends. The performance returns for Investment Strategies included in the Unified Managed Account (“UMA”) Program are based upon monthly composite returns of accounts that were open and invested in the recommended InvestmentStrategy for the entire month. The composite excludes accounts that: (i) had a contribution or withdrawal during a month greater than 10% of the market value of the account, (ii) had more than 3% in cash during the month, (iii) had client specified investment restrictions or (iv) utilized a customized tax transition investment approach. Detailed information regarding the Investment Strategy composite is available upon request. The composite returns are based on actual market values and are weighted accordingly. All calculations reflect the deduction of the internal management fees and expenses of any mutual funds or ETFs included in the accounts. Generally, a higher percentage of smaller UMA accounts will be invested in funds rather than allocated to separate account managers in order to obtain greater diversification among asset classes and investment styles. Since Brinker Capital retains full discretion to add or replace managers and funds in which the account is invested and to change the allocation among such managers and/or funds, the historical performance of the recommended Investment Strategy may reflect the performance of managers and funds which are no longer included in the recommended Investment Strategy. Furthermore, past performance of the managers and funds included in the recommended Investment Strategy is not a guarantee of future results or trends.
Standard Deviation: A statistical measure of volatility indicates the “risk” associated with a return series. The lower the number the less volatility.Returns are calculated gross (before the deduction) of advisory fees payable to Brinker Capital and any other expenses for services not covered by the advisory fee including administrative costs, which would reduce your return. Brinker Capital’s fee does not include the internal management fees and operating expenses of mutual funds in which a client’s account is invested, which are reflected in the performance information contained herein. Brinker Capital’s fees are disclosed in Part 2A of its Form ADV. The net effect of the deduction of Brinker Capital’s fees on annualized performance, including the compounded effect over time, is determined by the relative size of the fee and the account’s investment performance. The chart to the right depicts the effect of a 1% management fee on the growth of one dollar over a ten year period at 10% (9% after fees), 5% (4% after fees) and 3% (2% after fees) assumed rates of return. Looked at another way, $10,000.00 invested at 10% for ten years would grow to $25,937.42; at 9% it would grow to $23,673.64.
As a strategist, Brinker Capital creates and updates a model portfolio utilizing various mutual funds, exchange traded funds or stocks and delivers the model portfolio to platforms for implementation. Your account may not contain certain securities due to their availability and substitute securities will be selected at Brinker Capital’s discretion. All investments involve risk including loss of principal. Foreign securities involve additional risks, including foreign currency changes, political risks, foreigntaxes, and different methods of accounting and financial reporting. Fixed income investments are subject to interest rate and credit risks. Alternative investment strategies are speculative, not suitable for all clients, and intended for experienced and sophisticated investors who are willing to bear the high economic risks of the investment. Mutual fund and exchange traded fund (ETF) performance information is based upon published performance of the mutual funds or ETFs, which must be calculated by the funds in accordance with rules and regulations promulgated by the Securities and Exchange Commission.
Indices: Figures for the indices reflect the reinvestment of dividends but do not reflect any management fees, transaction costs or expenses, which would reduce returns. Indices are unmanaged and an investor cannot invest directly in an index. Russell 3000: A market capitalization weighted equity index maintained by the Russell Investment Group that seeks to be a benchmark of the entire U.S. stock market. This index encompasses the 3,000 largest U.S.-traded stocks, in which the underlying companies are all incorporated in the U.S. MSCI All Country World Index Ex USA: A market-capitalization-weighted index maintained by MSCI Inc. anddesigned to provide a broad measure of stock performance throughout the world, with the exception of U.S.-based companies. The MSCI All Country World Index Ex-U.S. includes both developed and emerging markets. Bloomberg Barclays U.S. Aggregate: A market capitalization-weighted index, maintained by Bloomberg Barclays, and is often used to represent investment grade bonds being traded in United States. HFRX Global Hedge Fund Index (USD): An asset weighted index comprised of all eligible hedge fund strategies, designed to be representative of the overall composition of the hedge fund universe.
Year 1 2 3 4 5 6 7 8 9 1010% 1.10 1.21 1.33 1.46 1.61 1.77 1.95 2.14 2.36 2.599% 1.09 1.19 1.30 1.41 1.54 1.68 1.83 1.99 2.17 2.375% 1.05 1.10 1.16 1.22 1.28 1.34 1.41 1.48 1.55 1.634% 1.04 1.08 1.12 1.17 1.22 1.27 1.32 1.37 1.42 1.483% 1.03 1.06 1.09 1.13 1.16 1.19 1.23 1.27 1.30 1.342% 1.02 1.04 1.06 1.08 1.10 1.13 1.15 1.17 1.20 1.22

Personal PortfoliosModerately Conservative TaxableDecember 31, 2017
*Inception date of portfolio with current investment mandate. Portfolio existed from April 2006 through April 2009 under different investment mandate. The holdings supplied are a complete list as of 12/31/2017. These may change prior to investment and are subject to change at any time. Allocations may not add to totals due to rounding of asset class and fund allocation percentages. Beta: A measure of a portfolio’s sensitivity to market movements, measured against the S&P 500. Yield: The income return on an investment, such as the interest or dividends received from holding a particular security.
This report is exclusively for one-on-one use only with investors. Not for redistribution. BrinkerCapital.com // 800.333.4573
Portfolio overviewn Long-term growth of capital with modest level
of volatility
n Strategic target of 40% growth assets and 60% stable assets
n 5+ year investment time horizon
Key statisticsInception date April 2009*
Number of holdings 23
Portfolio turnover (12 month) --
Yield 1.66%
Internal expense ratio 0.32%
Beta vs. S&P 500 (5 year) 0.42
Investment minimum $500,000
About Brinker CapitalSince 1987, our purpose has been to integrate the idea of diversification through multi-asset class investing with a disciplined investment approach. By continually enhancing and applying these principles, we strive to deliver better outcomes for investors.
Portfolio management teamAndrew Rosenberger, CFA, Senior Investment Managern 13 years industry experiencen B.S. Pennsylvania State University
Asset class breakdownWeight
n Domestic Equity 30%n International Equity 6%n Fixed Income 47%n Global Credit 5%n Absolute Return 8%n Real Assets 4%
Portfolio holdings Range WeightDomestic Equity (13%-45%) 30.48%AIA - Global Equity 11.30%SPDR S&P 500 4.53%Strategas Policy Opportunities 4.23%Vanguard Total Stock Market ETF 4.23%RiverNorth - Domestic Equity 4.06%Driehaus Micro Cap Growth 2.13%International Equity (5%-25%) 6.34%Vanguard Total International Stock ETF 2.24%Vanguard Emerging Markets ETF 2.04%Wasatch International Opportunities 1.22%iShares MSCI India 0.84%Fixed Income (30%-90%) 47.37%SPDR Nuveen Barclays Capital ST Muni ETF 19.28%SPDR Nuveen Barclays Municipal Bond ETF 16.16%SPDR DoubleLine Total Return ETF 7.25%PIMCO Enhanced Short Maturity Active ETF 3.43%Cash 1.25%Global Credit (0%-25%) 4.62%SPDR Barclays High Yield Bond 2.65%DoubleLine Low Duration Emerging Markets 1.97%Absolute Return (0%-30%) 7.55%Driehaus Active Income 3.55%JPMorgan Strategic Income Opportunities 2.01%William Blair Macro Allocation 1.99%Real Assets (0%-15%) 3.64%JPMorgan Alerian MLP ETN 1.57%Victory Global Natural Resources 1.29%iShares US Real Estate ETF 0.78%

This report is exclusively for one-on-one use only with investors. Not for redistribution. BrinkerCapital.com // 800.333.4573FS_PP_MOD_CON_T2
Growth of $100,000 since inception
Mar-09 May-11 Aug-13 Oct-15 Dec-17$50,000
$100,000
$150,000
$200,000
$250,000
$300,000
$350,000
$400,000
$450,000Ending valuesas of December 31, 2017
Strategy $187,408
Russell 3000 $408,130
ACWI ex US $256,657
Barclays Muni $152,140
HFRX $124,147
Annualized performance (trailing as of quarter-end)QTD YTD 1 Year 3 Year 5 Year 10 Year Since Inc.
Strategy 2.36% 10.19% 10.19% 4.36% 5.50% -- 7.44%Russell 3000 6.34% 21.13% 21.13% 11.12% 15.58% -- 17.44%ACWI ex US 5.06% 27.77% 27.77% 8.33% 7.28% -- 11.37%Barclays Muni 0.75% 5.45% 5.45% 2.98% 3.02% -- 4.91%HFRX 1.50% 5.99% 5.99% 1.54% 2.12% -- 2.50%
Standard deviation1 Year 3 Year 5 Year Since Inc.1.25% 4.35% 4.37% 5.48%3.68% 10.09% 9.67% 12.68%3.74% 11.88% 11.42% 15.91%2.17% 3.30% 3.49% 3.84%1.13% 3.51% 3.37% 3.99%
Calendar year performance2010 2011 2012 2013 2014 2015 2016 2017
Strategy 7.43% 1.07% 9.29% 10.45% 4.12% -0.36% 3.51% 10.19%Russell 3000 16.93% 1.03% 16.42% 33.55% 12.56% 0.48% 12.74% 21.13%ACWI ex US 11.60% -13.33% 17.39% 15.78% -3.44% -5.25% 5.01% 27.77%Barclays Muni 2.38% 10.70% 6.78% -2.55% 9.05% 3.30% 0.25% 5.45%HFRX 5.19% -8.87% 3.51% 6.72% -0.58% -3.64% 2.50% 5.99%
The above chart reflects a hypothetical $100,000 investment made at inception with no additional trading and all dividends reinvested. The product changed its investment mandate in April 2009. Past performance is no guarantee of future results or trends. The performance returns for Investment Strategies included in the Unified Managed Account (“UMA”) Program are based upon monthly composite returns of accounts that were open and invested in the recommended InvestmentStrategy for the entire month. The composite excludes accounts that: (i) had a contribution or withdrawal during a month greater than 10% of the market value of the account, (ii) had more than 3% in cash during the month, (iii) had client specified investment restrictions or (iv) utilized a customized tax transition investment approach. Detailed information regarding the Investment Strategy composite is available upon request. The composite returns are based on actual market values and are weighted accordingly. All calculations reflect the deduction of the internal management fees and expenses of any mutual funds or ETFs included in the accounts. Generally, a higher percentage of smaller UMA accounts will be invested in funds rather than allocated to separate account managers in order to obtain greater diversification among asset classes and investment styles. Since Brinker Capital retains full discretion to add or replace managers and funds in which the account is invested and to change the allocation among such managers and/or funds, the historical performance of the recommended Investment Strategy may reflect the performance of managers and funds which are no longer included in the recommended Investment Strategy. Furthermore, past performance of the managers and funds included in the recommended Investment Strategy is not a guarantee of future results or trends.
Standard Deviation: A statistical measure of volatility indicates the “risk” associated with a return series. The lower the number the less volatility.Returns are calculated gross (before the deduction) of advisory fees payable to Brinker Capital and any other expenses for services not covered by the advisory fee including administrative costs, which would reduce your return. Brinker Capital’s fee does not include the internal management fees and operating expenses of mutual funds in which a client’s account is invested, which are reflected in the performance information contained herein. Brinker Capital’s fees are disclosed in Part 2A of its Form ADV. The net effect of the deduction of Brinker Capital’s fees on annualized performance, including the compounded effect over time, is determined by the relative size of the fee and the account’s investment performance. The chart to the right depicts the effect of a 1% management fee on the growth of one dollar over a ten year period at 10% (9% after fees), 5% (4% after fees) and 3% (2% after fees) assumed rates of return. Looked at another way, $10,000.00 invested at 10% for ten years would grow to $25,937.42; at 9% it would grow to $23,673.64.
As a strategist, Brinker Capital creates and updates a model portfolio utilizing various mutual funds, exchange traded funds or stocks and delivers the model portfolio to platforms for implementation. Your account may not contain certain securities due to their availability and substitute securities will be selected at Brinker Capital’s discretion. All investments involve risk including loss of principal. Foreign securities involve additional risks, including foreign currency changes, political risks, foreigntaxes, and different methods of accounting and financial reporting. Fixed income investments are subject to interest rate and credit risks. Alternative investment strategies are speculative, not suitable for all clients, and intended for experienced and sophisticated investors who are willing to bear the high economic risks of the investment. Mutual fund and exchange traded fund (ETF) performance information is based upon published performance of the mutual funds or ETFs, which must be calculated by the funds in accordance with rules and regulations promulgated by the Securities and Exchange Commission.
Indices: Figures for the indices reflect the reinvestment of dividends but do not reflect any management fees, transaction costs or expenses, which would reduce returns. Indices are unmanaged and an investor cannot invest directly in an index. Russell 3000: A market capitalization weighted equity index maintained by the Russell Investment Group that seeks to be a benchmark of the entire U.S. stock market. This index encompasses the 3,000 largest U.S.-traded stocks, in which the underlying companies are all incorporated in the U.S. MSCI All Country World Index Ex USA: A market-capitalization-weighted index maintained by MSCI Inc. anddesigned to provide a broad measure of stock performance throughout the world, with the exception of U.S.-based companies. The MSCI All Country World Index Ex-U.S. includes both developed and emerging markets. Bloomberg Barclays U.S. Aggregate: A market capitalization-weighted index, maintained by Bloomberg Barclays, and is often used to represent investment grade bonds being traded in United States. HFRX Global Hedge Fund Index (USD): An asset weighted index comprised of all eligible hedge fund strategies, designed to be representative of the overall composition of the hedge fund universe.
Year 1 2 3 4 5 6 7 8 9 1010% 1.10 1.21 1.33 1.46 1.61 1.77 1.95 2.14 2.36 2.599% 1.09 1.19 1.30 1.41 1.54 1.68 1.83 1.99 2.17 2.375% 1.05 1.10 1.16 1.22 1.28 1.34 1.41 1.48 1.55 1.634% 1.04 1.08 1.12 1.17 1.22 1.27 1.32 1.37 1.42 1.483% 1.03 1.06 1.09 1.13 1.16 1.19 1.23 1.27 1.30 1.342% 1.02 1.04 1.06 1.08 1.10 1.13 1.15 1.17 1.20 1.22

Personal PortfoliosModerate TaxableDecember 31, 2017
*Inception date of portfolio with current investment mandate. Portfolio existed from April 2006 through April 2009 under different investment mandate. The holdings supplied are a complete list as of 12/31/2017. These may change prior to investment and are subject to change at any time. Allocations may not add to totals due to rounding of asset class and fund allocation percentages. Beta: A measure of a portfolio’s sensitivity to market movements, measured against the S&P 500. Yield: The income return on an investment, such as the interest or dividends received from holding a particular security.
This report is exclusively for one-on-one use only with investors. Not for redistribution. BrinkerCapital.com // 800.333.4573
Portfolio overviewn Long-term growth of capital with moderate
volatility
n Strategic target of 60% growth assets and 40% stable assets
n 5+ year investment time horizon
Key statisticsInception date April 2009*
Number of holdings 26
Portfolio turnover (12 month) --
Yield 1.30%
Internal expense ratio 0.27%
Beta vs. S&P 500 (5 year) 0.58
Investment minimum $500,000
About Brinker CapitalSince 1987, our purpose has been to integrate the idea of diversification through multi-asset class investing with a disciplined investment approach. By continually enhancing and applying these principles, we strive to deliver better outcomes for investors.
Portfolio management teamAndrew Rosenberger, CFA, Senior Investment Managern 13 years industry experiencen B.S. Pennsylvania State University
Asset class breakdownWeight
n Domestic Equity 46%n International Equity 12%n Fixed Income 27%n Global Credit 4%n Absolute Return 6%n Real Assets 4%
Portfolio holdings Range WeightDomestic Equity (25%-60%) 46.36%AIA - Global Equity 14.63%Vanguard Total Stock Market ETF 6.77%Strategas Policy Opportunities 5.56%Fort Washington Large Cap Focused Equity 5.12%RiverNorth - Domestic Equity 4.42%SPDR S&P 500 3.66%Driehaus Micro Cap Growth 2.94%Financial Select Sector SPDR ETF 2.00%SPDR Technology Sector 1.26%International Equity (7%-35%) 12.04%Karpus International Equity 4.42%Vanguard Emerging Markets ETF 2.49%Vanguard Total International Stock ETF 1.83%iShares MSCI India 1.66%Wasatch International Opportunities 1.63%Fixed Income (10%-60%) 27.36%SPDR Nuveen Barclays Capital ST Muni ETF 11.89%SPDR Nuveen Barclays Municipal Bond ETF 10.25%SPDR DoubleLine Total Return ETF 3.21%Cash 2.00%Global Credit (0%-20%) 3.79%SPDR Barclays High Yield Bond 2.29%DoubleLine Low Duration Emerging Markets 1.51%Absolute Return (0%-30%) 6.30%Driehaus Active Income 3.07%William Blair Macro Allocation 1.85%JPMorgan Strategic Income Opportunities 1.38%Real Assets (0%-15%) 4.15%JPMorgan Alerian MLP ETN 1.64%Victory Global Natural Resources 1.57%iShares US Real Estate ETF 0.93%

This report is exclusively for one-on-one use only with investors. Not for redistribution. BrinkerCapital.com // 800.333.4573FS_PP_MOD_T2
Growth of $100,000 since inception
Mar-09 May-11 Aug-13 Oct-15 Dec-17$50,000
$100,000
$150,000
$200,000
$250,000
$300,000
$350,000
$400,000
$450,000Ending valuesas of December 31, 2017
Strategy $224,713
Russell 3000 $408,130
ACWI ex US $256,657
Barclays Muni $152,140
HFRX $124,147
Annualized performance (trailing as of quarter-end)QTD YTD 1 Year 3 Year 5 Year 10 Year Since Inc.
Strategy 3.64% 14.37% 14.37% 6.02% 7.51% -- 9.69%Russell 3000 6.34% 21.13% 21.13% 11.12% 15.58% -- 17.44%ACWI ex US 5.06% 27.77% 27.77% 8.33% 7.28% -- 11.37%Barclays Muni 0.75% 5.45% 5.45% 2.98% 3.02% -- 4.91%HFRX 1.50% 5.99% 5.99% 1.54% 2.12% -- 2.50%
Standard deviation1 Year 3 Year 5 Year Since Inc.1.64% 5.93% 5.83% 7.80%3.68% 10.09% 9.67% 12.68%3.74% 11.88% 11.42% 15.91%2.17% 3.30% 3.49% 3.84%1.13% 3.51% 3.37% 3.99%
Calendar year performance2010 2011 2012 2013 2014 2015 2016 2017
Strategy 10.07% -1.40% 11.06% 15.54% 4.30% -0.55% 4.78% 14.37%Russell 3000 16.93% 1.03% 16.42% 33.55% 12.56% 0.48% 12.74% 21.13%ACWI ex US 11.60% -13.33% 17.39% 15.78% -3.44% -5.25% 5.01% 27.77%Barclays Muni 2.38% 10.70% 6.78% -2.55% 9.05% 3.30% 0.25% 5.45%HFRX 5.19% -8.87% 3.51% 6.72% -0.58% -3.64% 2.50% 5.99%
The above chart reflects a hypothetical $100,000 investment made at inception with no additional trading and all dividends reinvested. The product changed its investment mandate in April 2009. Past performance is no guarantee of future results or trends. The performance returns for Investment Strategies included in the Unified Managed Account (“UMA”) Program are based upon monthly composite returns of accounts that were open and invested in the recommended InvestmentStrategy for the entire month. The composite excludes accounts that: (i) had a contribution or withdrawal during a month greater than 10% of the market value of the account, (ii) had more than 3% in cash during the month, (iii) had client specified investment restrictions or (iv) utilized a customized tax transition investment approach. Detailed information regarding the Investment Strategy composite is available upon request. The composite returns are based on actual market values and are weighted accordingly. All calculations reflect the deduction of the internal management fees and expenses of any mutual funds or ETFs included in the accounts. Generally, a higher percentage of smaller UMA accounts will be invested in funds rather than allocated to separate account managers in order to obtain greater diversification among asset classes and investment styles. Since Brinker Capital retains full discretion to add or replace managers and funds in which the account is invested and to change the allocation among such managers and/or funds, the historical performance of the recommended Investment Strategy may reflect the performance of managers and funds which are no longer included in the recommended Investment Strategy. Furthermore, past performance of the managers and funds included in the recommended Investment Strategy is not a guarantee of future results or trends.
Standard Deviation: A statistical measure of volatility indicates the “risk” associated with a return series. The lower the number the less volatility.Returns are calculated gross (before the deduction) of advisory fees payable to Brinker Capital and any other expenses for services not covered by the advisory fee including administrative costs, which would reduce your return. Brinker Capital’s fee does not include the internal management fees and operating expenses of mutual funds in which a client’s account is invested, which are reflected in the performance information contained herein. Brinker Capital’s fees are disclosed in Part 2A of its Form ADV. The net effect of the deduction of Brinker Capital’s fees on annualized performance, including the compounded effect over time, is determined by the relative size of the fee and the account’s investment performance. The chart to the right depicts the effect of a 1% management fee on the growth of one dollar over a ten year period at 10% (9% after fees), 5% (4% after fees) and 3% (2% after fees) assumed rates of return. Looked at another way, $10,000.00 invested at 10% for ten years would grow to $25,937.42; at 9% it would grow to $23,673.64.
As a strategist, Brinker Capital creates and updates a model portfolio utilizing various mutual funds, exchange traded funds or stocks and delivers the model portfolio to platforms for implementation. Your account may not contain certain securities due to their availability and substitute securities will be selected at Brinker Capital’s discretion. All investments involve risk including loss of principal. Foreign securities involve additional risks, including foreign currency changes, political risks, foreigntaxes, and different methods of accounting and financial reporting. Fixed income investments are subject to interest rate and credit risks. Alternative investment strategies are speculative, not suitable for all clients, and intended for experienced and sophisticated investors who are willing to bear the high economic risks of the investment. Mutual fund and exchange traded fund (ETF) performance information is based upon published performance of the mutual funds or ETFs, which must be calculated by the funds in accordance with rules and regulations promulgated by the Securities and Exchange Commission.
Indices: Figures for the indices reflect the reinvestment of dividends but do not reflect any management fees, transaction costs or expenses, which would reduce returns. Indices are unmanaged and an investor cannot invest directly in an index. Russell 3000: A market capitalization weighted equity index maintained by the Russell Investment Group that seeks to be a benchmark of the entire U.S. stock market. This index encompasses the 3,000 largest U.S.-traded stocks, in which the underlying companies are all incorporated in the U.S. MSCI All Country World Index Ex USA: A market-capitalization-weighted index maintained by MSCI Inc. anddesigned to provide a broad measure of stock performance throughout the world, with the exception of U.S.-based companies. The MSCI All Country World Index Ex-U.S. includes both developed and emerging markets. Bloomberg Barclays U.S. Aggregate: A market capitalization-weighted index, maintained by Bloomberg Barclays, and is often used to represent investment grade bonds being traded in United States. HFRX Global Hedge Fund Index (USD): An asset weighted index comprised of all eligible hedge fund strategies, designed to be representative of the overall composition of the hedge fund universe.
Year 1 2 3 4 5 6 7 8 9 1010% 1.10 1.21 1.33 1.46 1.61 1.77 1.95 2.14 2.36 2.599% 1.09 1.19 1.30 1.41 1.54 1.68 1.83 1.99 2.17 2.375% 1.05 1.10 1.16 1.22 1.28 1.34 1.41 1.48 1.55 1.634% 1.04 1.08 1.12 1.17 1.22 1.27 1.32 1.37 1.42 1.483% 1.03 1.06 1.09 1.13 1.16 1.19 1.23 1.27 1.30 1.342% 1.02 1.04 1.06 1.08 1.10 1.13 1.15 1.17 1.20 1.22
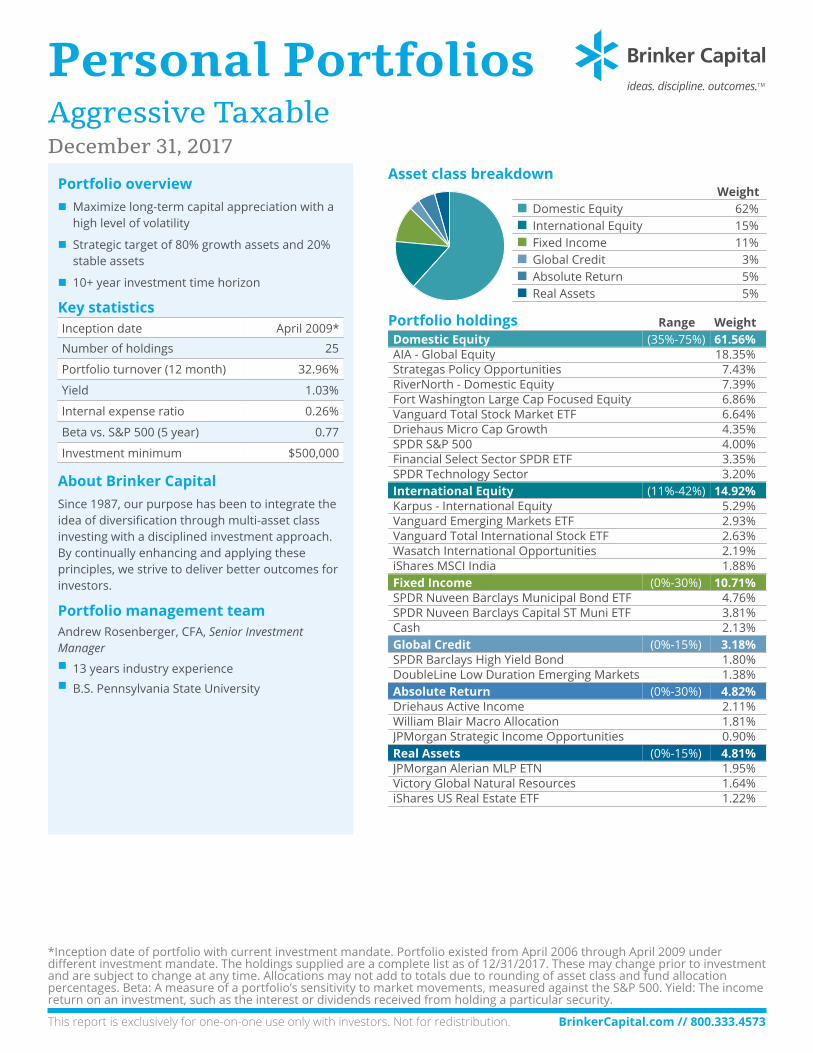
Personal PortfoliosAggressive TaxableDecember 31, 2017
*Inception date of portfolio with current investment mandate. Portfolio existed from April 2006 through April 2009 under different investment mandate. The holdings supplied are a complete list as of 12/31/2017. These may change prior to investment and are subject to change at any time. Allocations may not add to totals due to rounding of asset class and fund allocation percentages. Beta: A measure of a portfolio’s sensitivity to market movements, measured against the S&P 500. Yield: The income return on an investment, such as the interest or dividends received from holding a particular security.
This report is exclusively for one-on-one use only with investors. Not for redistribution. BrinkerCapital.com // 800.333.4573
Portfolio overviewn Maximize long-term capital appreciation with a
high level of volatility
n Strategic target of 80% growth assets and 20% stable assets
n 10+ year investment time horizon
Key statisticsInception date April 2009*
Number of holdings 25
Portfolio turnover (12 month) 32.96%
Yield 1.03%
Internal expense ratio 0.26%
Beta vs. S&P 500 (5 year) 0.77
Investment minimum $500,000
About Brinker CapitalSince 1987, our purpose has been to integrate the idea of diversification through multi-asset class investing with a disciplined investment approach. By continually enhancing and applying these principles, we strive to deliver better outcomes for investors.
Portfolio management teamAndrew Rosenberger, CFA, Senior Investment Managern 13 years industry experiencen B.S. Pennsylvania State University
Asset class breakdownWeight
n Domestic Equity 62%n International Equity 15%n Fixed Income 11%n Global Credit 3%n Absolute Return 5%n Real Assets 5%
Portfolio holdings Range WeightDomestic Equity (35%-75%) 61.56%AIA - Global Equity 18.35%Strategas Policy Opportunities 7.43%RiverNorth - Domestic Equity 7.39%Fort Washington Large Cap Focused Equity 6.86%Vanguard Total Stock Market ETF 6.64%Driehaus Micro Cap Growth 4.35%SPDR S&P 500 4.00%Financial Select Sector SPDR ETF 3.35%SPDR Technology Sector 3.20%International Equity (11%-42%) 14.92%Karpus - International Equity 5.29%Vanguard Emerging Markets ETF 2.93%Vanguard Total International Stock ETF 2.63%Wasatch International Opportunities 2.19%iShares MSCI India 1.88%Fixed Income (0%-30%) 10.71%SPDR Nuveen Barclays Municipal Bond ETF 4.76%SPDR Nuveen Barclays Capital ST Muni ETF 3.81%Cash 2.13%Global Credit (0%-15%) 3.18%SPDR Barclays High Yield Bond 1.80%DoubleLine Low Duration Emerging Markets 1.38%Absolute Return (0%-30%) 4.82%Driehaus Active Income 2.11%William Blair Macro Allocation 1.81%JPMorgan Strategic Income Opportunities 0.90%Real Assets (0%-15%) 4.81%JPMorgan Alerian MLP ETN 1.95%Victory Global Natural Resources 1.64%iShares US Real Estate ETF 1.22%

This report is exclusively for one-on-one use only with investors. Not for redistribution. BrinkerCapital.com // 800.333.4573FS_PP_AGG_T2
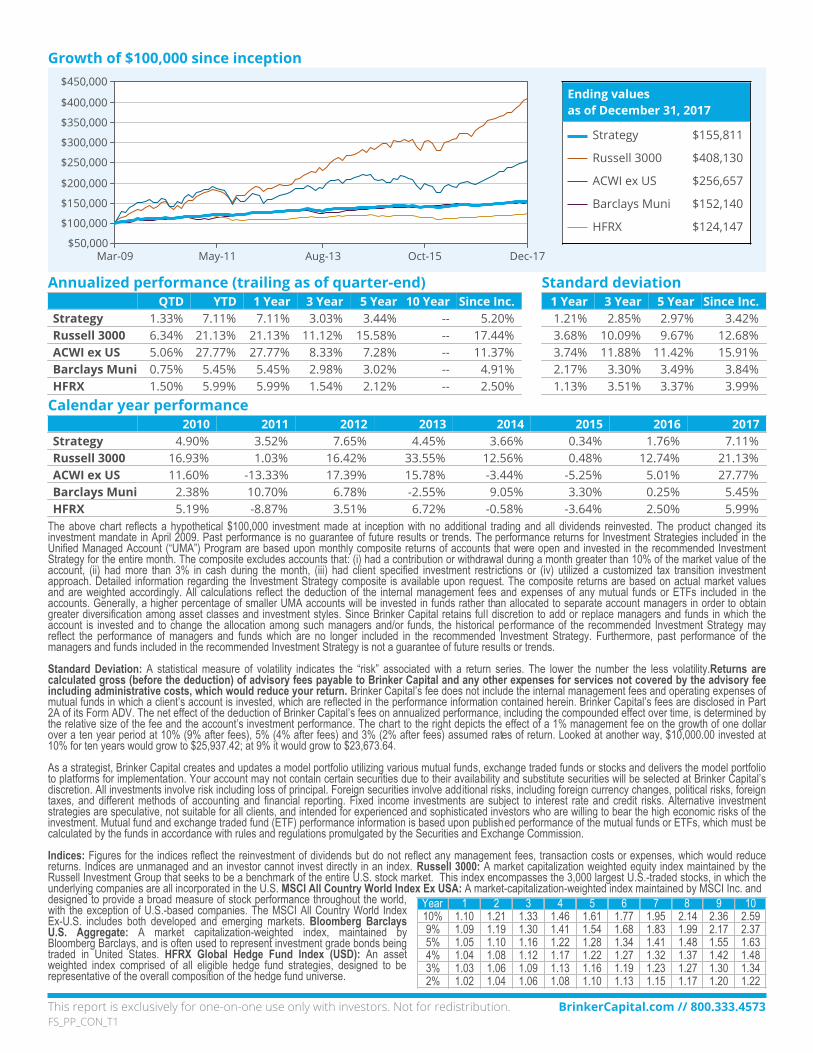
Growth of $100,000 since inception
Mar-09 May-11 Aug-13 Oct-15 Dec-17$50,000
$100,000
$150,000
$200,000
$250,000
$300,000
$350,000
$400,000
$450,000Ending valuesas of December 31, 2017
Strategy $272,851
Russell 3000 $408,130
ACWI ex US $256,657
Barclays Muni $152,140
HFRX $124,147
Annualized performance (trailing as of quarter-end)QTD YTD 1 Year 3 Year 5 Year 10 Year Since Inc.
Strategy 4.77% 18.62% 18.62% 7.73% 9.83% -- 12.16%Russell 3000 6.34% 21.13% 21.13% 11.12% 15.58% -- 17.44%ACWI ex US 5.06% 27.77% 27.77% 8.33% 7.28% -- 11.37%Barclays Muni 0.75% 5.45% 5.45% 2.98% 3.02% -- 4.91%HFRX 1.50% 5.99% 5.99% 1.54% 2.12% -- 2.50%
Standard deviation1 Year 3 Year 5 Year Since Inc.2.06% 7.72% 7.54% 10.20%3.68% 10.09% 9.67% 12.68%3.74% 11.88% 11.42% 15.91%2.17% 3.30% 3.49% 3.84%1.13% 3.51% 3.37% 3.99%
Calendar year performance2010 2011 2012 2013 2014 2015 2016 2017
Strategy 12.67% -3.55% 13.38% 21.47% 5.23% -1.49% 6.99% 18.62%Russell 3000 16.93% 1.03% 16.42% 33.55% 12.56% 0.48% 12.74% 21.13%ACWI ex US 11.60% -13.33% 17.39% 15.78% -3.44% -5.25% 5.01% 27.77%Barclays Muni 2.38% 10.70% 6.78% -2.55% 9.05% 3.30% 0.25% 5.45%HFRX 5.19% -8.87% 3.51% 6.72% -0.58% -3.64% 2.50% 5.99%
The above chart reflects a hypothetical $100,000 investment made at inception with no additional trading and all dividends reinvested. The product changed its investment mandate in April 2009. Past performance is no guarantee of future results or trends. The performance returns for Investment Strategies included in the Unified Managed Account (“UMA”) Program are based upon monthly composite returns of accounts that were open and invested in the recommended InvestmentStrategy for the entire month. The composite excludes accounts that: (i) had a contribution or withdrawal during a month greater than 10% of the market value of the account, (ii) had more than 3% in cash during the month, (iii) had client specified investment restrictions or (iv) utilized a customized tax transition investment approach. Detailed information regarding the Investment Strategy composite is available upon request. The composite returns are based on actual market values and are weighted accordingly. All calculations reflect the deduction of the internal management fees and expenses of any mutual funds or ETFs included in the accounts. Generally, a higher percentage of smaller UMA accounts will be invested in funds rather than allocated to separate account managers in order to obtain greater diversification among asset classes and investment styles. Since Brinker Capital retains full discretion to add or replace managers and funds in which the account is invested and to change the allocation among such managers and/or funds, the historical performance of the recommended Investment Strategy may reflect the performance of managers and funds which are no longer included in the recommended Investment Strategy. Furthermore, past performance of the managers and funds included in the recommended Investment Strategy is not a guarantee of future results or trends.
Standard Deviation: A statistical measure of volatility indicates the “risk” associated with a return series. The lower the number the less volatility.Returns are calculated gross (before the deduction) of advisory fees payable to Brinker Capital and any other expenses for services not covered by the advisory fee including administrative costs, which would reduce your return. Brinker Capital’s fee does not include the internal management fees and operating expenses of mutual funds in which a client’s account is invested, which are reflected in the performance information contained herein. Brinker Capital’s fees are disclosed in Part 2A of its Form ADV. The net effect of the deduction of Brinker Capital’s fees on annualized performance, including the compounded effect over time, is determined by the relative size of the fee and the account’s investment performance. The chart to the right depicts the effect of a 1% management fee on the growth of one dollar over a ten year period at 10% (9% after fees), 5% (4% after fees) and 3% (2% after fees) assumed rates of return. Looked at another way, $10,000.00 invested at 10% for ten years would grow to $25,937.42; at 9% it would grow to $23,673.64.
As a strategist, Brinker Capital creates and updates a model portfolio utilizing various mutual funds, exchange traded funds or stocks and delivers the model portfolio to platforms for implementation. Your account may not contain certain securities due to their availability and substitute securities will be selected at Brinker Capital’s discretion. All investments involve risk including loss of principal. Foreign securities involve additional risks, including foreign currency changes, political risks, foreigntaxes, and different methods of accounting and financial reporting. Fixed income investments are subject to interest rate and credit risks. Alternative investment strategies are speculative, not suitable for all clients, and intended for experienced and sophisticated investors who are willing to bear the high economic risks of the investment. Mutual fund and exchange traded fund (ETF) performance information is based upon published performance of the mutual funds or ETFs, which must be calculated by the funds in accordance with rules and regulations promulgated by the Securities and Exchange Commission.
Indices: Figures for the indices reflect the reinvestment of dividends but do not reflect any management fees, transaction costs or expenses, which would reduce returns. Indices are unmanaged and an investor cannot invest directly in an index. Russell 3000: A market capitalization weighted equity index maintained by the Russell Investment Group that seeks to be a benchmark of the entire U.S. stock market. This index encompasses the 3,000 largest U.S.-traded stocks, in which the underlying companies are all incorporated in the U.S. MSCI All Country World Index Ex USA: A market-capitalization-weighted index maintained by MSCI Inc. anddesigned to provide a broad measure of stock performance throughout the world, with the exception of U.S.-based companies. The MSCI All Country World Index Ex-U.S. includes both developed and emerging markets. Bloomberg Barclays U.S. Aggregate: A market capitalization-weighted index, maintained by Bloomberg Barclays, and is often used to represent investment grade bonds being traded in United States. HFRX Global Hedge Fund Index (USD): An asset weighted index comprised of all eligible hedge fund strategies, designed to be representative of the overall composition of the hedge fund universe.
Year 1 2 3 4 5 6 7 8 9 1010% 1.10 1.21 1.33 1.46 1.61 1.77 1.95 2.14 2.36 2.599% 1.09 1.19 1.30 1.41 1.54 1.68 1.83 1.99 2.17 2.375% 1.05 1.10 1.16 1.22 1.28 1.34 1.41 1.48 1.55 1.634% 1.04 1.08 1.12 1.17 1.22 1.27 1.32 1.37 1.42 1.483% 1.03 1.06 1.09 1.13 1.16 1.19 1.23 1.27 1.30 1.342% 1.02 1.04 1.06 1.08 1.10 1.13 1.15 1.17 1.20 1.22

Personal PortfoliosAggressive Equity TaxableDecember 31, 2017
*Inception date of portfolio with current investment mandate. Portfolio existed from April 2006 through April 2009 under different investment mandate. The holdings supplied are a complete list as of 12/31/2017. These may change prior to investment and are subject to change at any time. Allocations may not add to totals due to rounding of asset class and fund allocation percentages. Beta: A measure of a portfolio’s sensitivity to market movements, measured against the S&P 500. Yield: The income return on an investment, such as the interest or dividends received from holding a particular security.
This report is exclusively for one-on-one use only with investors. Not for redistribution. BrinkerCapital.com // 800.333.4573
Portfolio overviewn Maximize long-term capital appreciation with a
high level of volatility
n Fully allocated to growth assets
n 10+ year investment time horizon
Key statisticsInception date April 2009*
Number of holdings 17
Portfolio turnover (12 month) 34.78%
Yield 0.90%
Internal expense ratio 0.23%
Beta vs. S&P 500 (5 year) 0.90
Investment minimum $500,000
About Brinker CapitalSince 1987, our purpose has been to integrate the idea of diversification through multi-asset class investing with a disciplined investment approach. By continually enhancing and applying these principles, we strive to deliver better outcomes for investors.
Portfolio management teamAndrew Rosenberger, CFA, Senior Investment Managern 13 years industry experiencen B.S. Pennsylvania State University
Asset class breakdownWeight
n Domestic Equity 73%n International Equity 19%n Fixed Income 2%n Real Assets 6%
Portfolio holdings Range WeightDomestic Equity (55%-85%) 73.29%AIA - Global Equity 24.17%Strategas Policy Opportunities 8.75%RiverNorth - Domestic Equity 8.72%Fort Washington Large Cap Focused Equity 8.02%SPDR Technology Sector 5.21%Financial Select Sector SPDR ETF 4.87%Driehaus Micro Cap Growth 4.78%Vanguard Total Stock Market ETF 4.40%SPDR S&P 500 4.39%International Equity (15%-50%) 18.98%Vanguard Total International Stock ETF 9.95%Vanguard Emerging Markets ETF 3.44%Wasatch International Opportunities 2.83%iShares MSCI India 2.76%Fixed Income (0%-10%) 1.96%Cash 1.96%Real Assets (0%-15%) 5.77%JPMorgan Alerian MLP ETN 2.37%Victory Global Natural Resources 1.87%iShares US Real Estate ETF 1.53%

This report is exclusively for one-on-one use only with investors. Not for redistribution. BrinkerCapital.com // 800.333.4573FS_PP_AGG_EQ_T2
Growth of $100,000 since inception
Mar-09 May-11 Aug-13 Oct-15 Dec-17$50,000
$100,000
$150,000
$200,000
$250,000
$300,000
$350,000
$400,000
$450,000Ending valuesas of December 31, 2017
Strategy $320,835
Russell 3000 $408,130
ACWI ex US $256,657
Barclays Muni $152,140
HFRX $124,147
Annualized performance (trailing as of quarter-end)QTD YTD 1 Year 3 Year 5 Year 10 Year Since Inc.
Strategy 5.75% 22.31% 22.31% 9.72% 11.88% -- 14.25%Russell 3000 6.34% 21.13% 21.13% 11.12% 15.58% -- 17.44%ACWI ex US 5.06% 27.77% 27.77% 8.33% 7.28% -- 11.37%Barclays Muni 0.75% 5.45% 5.45% 2.98% 3.02% -- 4.91%HFRX 1.50% 5.99% 5.99% 1.54% 2.12% -- 2.50%
Standard deviation1 Year 3 Year 5 Year Since Inc.2.44% 9.13% 8.79% 12.35%3.68% 10.09% 9.67% 12.68%3.74% 11.88% 11.42% 15.91%2.17% 3.30% 3.49% 3.84%1.13% 3.51% 3.37% 3.99%
Calendar year performance2010 2011 2012 2013 2014 2015 2016 2017
Strategy 14.63% -5.03% 15.25% 25.26% 5.93% -1.10% 9.20% 22.31%Russell 3000 16.93% 1.03% 16.42% 33.55% 12.56% 0.48% 12.74% 21.13%ACWI ex US 11.60% -13.33% 17.39% 15.78% -3.44% -5.25% 5.01% 27.77%Barclays Muni 2.38% 10.70% 6.78% -2.55% 9.05% 3.30% 0.25% 5.45%HFRX 5.19% -8.87% 3.51% 6.72% -0.58% -3.64% 2.50% 5.99%
The above chart reflects a hypothetical $100,000 investment made at inception with no additional trading and all dividends reinvested. The product changed its investment mandate in April 2009. Past performance is no guarantee of future results or trends. The performance returns for Investment Strategies included in the Unified Managed Account (“UMA”) Program are based upon monthly composite returns of accounts that were open and invested in the recommended InvestmentStrategy for the entire month. The composite excludes accounts that: (i) had a contribution or withdrawal during a month greater than 10% of the market value of the account, (ii) had more than 3% in cash during the month, (iii) had client specified investment restrictions or (iv) utilized a customized tax transition investment approach. Detailed information regarding the Investment Strategy composite is available upon request. The composite returns are based on actual market values and are weighted accordingly. All calculations reflect the deduction of the internal management fees and expenses of any mutual funds or ETFs included in the accounts. Generally, a higher percentage of smaller UMA accounts will be invested in funds rather than allocated to separate account managers in order to obtain greater diversification among asset classes and investment styles. Since Brinker Capital retains full discretion to add or replace managers and funds in which the account is invested and to change the allocation among such managers and/or funds, the historical performance of the recommended Investment Strategy may reflect the performance of managers and funds which are no longer included in the recommended Investment Strategy. Furthermore, past performance of the managers and funds included in the recommended Investment Strategy is not a guarantee of future results or trends.
Standard Deviation: A statistical measure of volatility indicates the “risk” associated with a return series. The lower the number the less volatility.Returns are calculated gross (before the deduction) of advisory fees payable to Brinker Capital and any other expenses for services not covered by the advisory fee including administrative costs, which would reduce your return. Brinker Capital’s fee does not include the internal management fees and operating expenses of mutual funds in which a client’s account is invested, which are reflected in the performance information contained herein. Brinker Capital’s fees are disclosed in Part 2A of its Form ADV. The net effect of the deduction of Brinker Capital’s fees on annualized performance, including the compounded effect over time, is determined by the relative size of the fee and the account’s investment performance. The chart to the right depicts the effect of a 1% management fee on the growth of one dollar over a ten year period at 10% (9% after fees), 5% (4% after fees) and 3% (2% after fees) assumed rates of return. Looked at another way, $10,000.00 invested at 10% for ten years would grow to $25,937.42; at 9% it would grow to $23,673.64.
As a strategist, Brinker Capital creates and updates a model portfolio utilizing various mutual funds, exchange traded funds or stocks and delivers the model portfolio to platforms for implementation. Your account may not contain certain securities due to their availability and substitute securities will be selected at Brinker Capital’s discretion. All investments involve risk including loss of principal. Foreign securities involve additional risks, including foreign currency changes, political risks, foreigntaxes, and different methods of accounting and financial reporting. Fixed income investments are subject to interest rate and credit risks. Alternative investment strategies are speculative, not suitable for all clients, and intended for experienced and sophisticated investors who are willing to bear the high economic risks of the investment. Mutual fund and exchange traded fund (ETF) performance information is based upon published performance of the mutual funds or ETFs, which must be calculated by the funds in accordance with rules and regulations promulgated by the Securities and Exchange Commission.
Indices: Figures for the indices reflect the reinvestment of dividends but do not reflect any management fees, transaction costs or expenses, which would reduce returns. Indices are unmanaged and an investor cannot invest directly in an index. Russell 3000: A market capitalization weighted equity index maintained by the Russell Investment Group that seeks to be a benchmark of the entire U.S. stock market. This index encompasses the 3,000 largest U.S.-traded stocks, in which the underlying companies are all incorporated in the U.S. MSCI All Country World Index Ex USA: A market-capitalization-weighted index maintained by MSCI Inc. anddesigned to provide a broad measure of stock performance throughout the world, with the exception of U.S.-based companies. The MSCI All Country World Index Ex-U.S. includes both developed and emerging markets. Bloomberg Barclays U.S. Aggregate: A market capitalization-weighted index, maintained by Bloomberg Barclays, and is often used to represent investment grade bonds being traded in United States. HFRX Global Hedge Fund Index (USD): An asset weighted index comprised of all eligible hedge fund strategies, designed to be representative of the overall composition of the hedge fund universe.
Year 1 2 3 4 5 6 7 8 9 1010% 1.10 1.21 1.33 1.46 1.61 1.77 1.95 2.14 2.36 2.599% 1.09 1.19 1.30 1.41 1.54 1.68 1.83 1.99 2.17 2.375% 1.05 1.10 1.16 1.22 1.28 1.34 1.41 1.48 1.55 1.634% 1.04 1.08 1.12 1.17 1.22 1.27 1.32 1.37 1.42 1.483% 1.03 1.06 1.09 1.13 1.16 1.19 1.23 1.27 1.30 1.342% 1.02 1.04 1.06 1.08 1.10 1.13 1.15 1.17 1.20 1.22
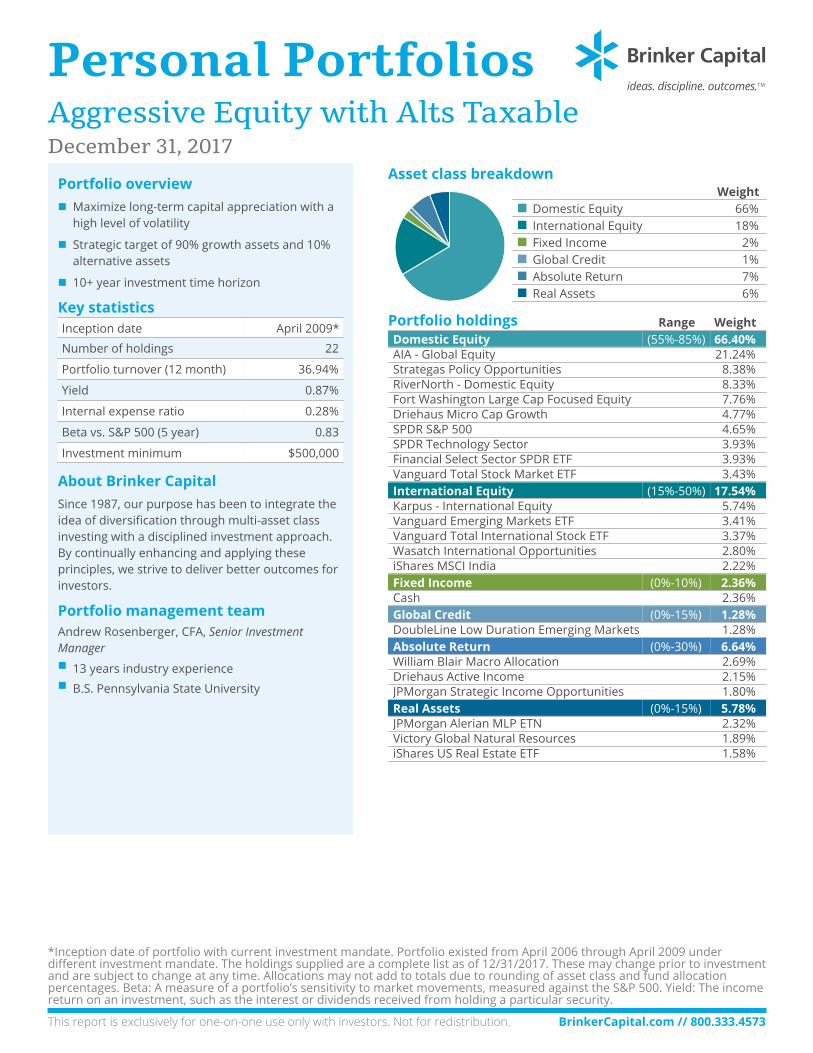
Personal PortfoliosAggressive Equity with Alts TaxableDecember 31, 2017
*Inception date of portfolio with current investment mandate. Portfolio existed from April 2006 through April 2009 under different investment mandate. The holdings supplied are a complete list as of 12/31/2017. These may change prior to investment and are subject to change at any time. Allocations may not add to totals due to rounding of asset class and fund allocation percentages. Beta: A measure of a portfolio’s sensitivity to market movements, measured against the S&P 500. Yield: The income return on an investment, such as the interest or dividends received from holding a particular security.
This report is exclusively for one-on-one use only with investors. Not for redistribution. BrinkerCapital.com // 800.333.4573
Portfolio overviewn Maximize long-term capital appreciation with a
high level of volatility
n Strategic target of 90% growth assets and 10% alternative assets
n 10+ year investment time horizon
Key statisticsInception date April 2009*
Number of holdings 22
Portfolio turnover (12 month) 36.94%
Yield 0.87%
Internal expense ratio 0.28%
Beta vs. S&P 500 (5 year) 0.83
Investment minimum $500,000
About Brinker CapitalSince 1987, our purpose has been to integrate the idea of diversification through multi-asset class investing with a disciplined investment approach. By continually enhancing and applying these principles, we strive to deliver better outcomes for investors.
Portfolio management teamAndrew Rosenberger, CFA, Senior Investment Managern 13 years industry experiencen B.S. Pennsylvania State University
Asset class breakdownWeight
n Domestic Equity 66%n International Equity 18%n Fixed Income 2%n Global Credit 1%n Absolute Return 7%n Real Assets 6%
Portfolio holdings Range WeightDomestic Equity (55%-85%) 66.40%AIA - Global Equity 21.24%Strategas Policy Opportunities 8.38%RiverNorth - Domestic Equity 8.33%Fort Washington Large Cap Focused Equity 7.76%Driehaus Micro Cap Growth 4.77%SPDR S&P 500 4.65%SPDR Technology Sector 3.93%Financial Select Sector SPDR ETF 3.93%Vanguard Total Stock Market ETF 3.43%International Equity (15%-50%) 17.54%Karpus - International Equity 5.74%Vanguard Emerging Markets ETF 3.41%Vanguard Total International Stock ETF 3.37%Wasatch International Opportunities 2.80%iShares MSCI India 2.22%Fixed Income (0%-10%) 2.36%Cash 2.36%Global Credit (0%-15%) 1.28%DoubleLine Low Duration Emerging Markets 1.28%Absolute Return (0%-30%) 6.64%William Blair Macro Allocation 2.69%Driehaus Active Income 2.15%JPMorgan Strategic Income Opportunities 1.80%Real Assets (0%-15%) 5.78%JPMorgan Alerian MLP ETN 2.32%Victory Global Natural Resources 1.89%iShares US Real Estate ETF 1.58%

This report is exclusively for one-on-one use only with investors. Not for redistribution. BrinkerCapital.com // 800.333.4573FS_PP_A_EQ_ALT_T2
Growth of $100,000 since inception
Mar-09 May-11 Aug-13 Oct-15 Dec-17$50,000
$100,000
$150,000
$200,000
$250,000
$300,000
$350,000
$400,000
$450,000Ending valuesas of December 31, 2017
Strategy $297,999
Russell 3000 $408,130
ACWI ex US $256,657
Barclays Muni $152,140
HFRX $124,147
Annualized performance (trailing as of quarter-end)QTD YTD 1 Year 3 Year 5 Year 10 Year Since Inc.
Strategy 5.26% 20.69% 20.69% 8.83% 10.86% -- 13.29%Russell 3000 6.34% 21.13% 21.13% 11.12% 15.58% -- 17.44%ACWI ex US 5.06% 27.77% 27.77% 8.33% 7.28% -- 11.37%Barclays Muni 0.75% 5.45% 5.45% 2.98% 3.02% -- 4.91%HFRX 1.50% 5.99% 5.99% 1.54% 2.12% -- 2.50%
Standard deviation1 Year 3 Year 5 Year Since Inc.2.30% 8.38% 8.09% 11.36%3.68% 10.09% 9.67% 12.68%3.74% 11.88% 11.42% 15.91%2.17% 3.30% 3.49% 3.84%1.13% 3.51% 3.37% 3.99%
Calendar year performance2010 2011 2012 2013 2014 2015 2016 2017
Strategy 13.38% -4.64% 15.25% 23.66% 5.06% -1.23% 8.12% 20.69%Russell 3000 16.93% 1.03% 16.42% 33.55% 12.56% 0.48% 12.74% 21.13%ACWI ex US 11.60% -13.33% 17.39% 15.78% -3.44% -5.25% 5.01% 27.77%Barclays Muni 2.38% 10.70% 6.78% -2.55% 9.05% 3.30% 0.25% 5.45%HFRX 5.19% -8.87% 3.51% 6.72% -0.58% -3.64% 2.50% 5.99%
The above chart reflects a hypothetical $100,000 investment made at inception with no additional trading and all dividends reinvested. The product changed its investment mandate in April 2009. Past performance is no guarantee of future results or trends. The performance returns for Investment Strategies included in the Unified Managed Account (“UMA”) Program are based upon monthly composite returns of accounts that were open and invested in the recommended InvestmentStrategy for the entire month. The composite excludes accounts that: (i) had a contribution or withdrawal during a month greater than 10% of the market value of the account, (ii) had more than 3% in cash during the month, (iii) had client specified investment restrictions or (iv) utilized a customized tax transition investment approach. Detailed information regarding the Investment Strategy composite is available upon request. The composite returns are based on actual market values and are weighted accordingly. All calculations reflect the deduction of the internal management fees and expenses of any mutual funds or ETFs included in the accounts. Generally, a higher percentage of smaller UMA accounts will be invested in funds rather than allocated to separate account managers in order to obtain greater diversification among asset classes and investment styles. Since Brinker Capital retains full discretion to add or replace managers and funds in which the account is invested and to change the allocation among such managers and/or funds, the historical performance of the recommended Investment Strategy may reflect the performance of managers and funds which are no longer included in the recommended Investment Strategy. Furthermore, past performance of the managers and funds included in the recommended Investment Strategy is not a guarantee of future results or trends.
Standard Deviation: A statistical measure of volatility indicates the “risk” associated with a return series. The lower the number the less volatility.Returns are calculated gross (before the deduction) of advisory fees payable to Brinker Capital and any other expenses for services not covered by the advisory fee including administrative costs, which would reduce your return. Brinker Capital’s fee does not include the internal management fees and operating expenses of mutual funds in which a client’s account is invested, which are reflected in the performance information contained herein. Brinker Capital’s fees are disclosed in Part 2A of its Form ADV. The net effect of the deduction of Brinker Capital’s fees on annualized performance, including the compounded effect over time, is determined by the relative size of the fee and the account’s investment performance. The chart to the right depicts the effect of a 1% management fee on the growth of one dollar over a ten year period at 10% (9% after fees), 5% (4% after fees) and 3% (2% after fees) assumed rates of return. Looked at another way, $10,000.00 invested at 10% for ten years would grow to $25,937.42; at 9% it would grow to $23,673.64.
As a strategist, Brinker Capital creates and updates a model portfolio utilizing various mutual funds, exchange traded funds or stocks and delivers the model portfolio to platforms for implementation. Your account may not contain certain securities due to their availability and substitute securities will be selected at Brinker Capital’s discretion. All investments involve risk including loss of principal. Foreign securities involve additional risks, including foreign currency changes, political risks, foreigntaxes, and different methods of accounting and financial reporting. Fixed income investments are subject to interest rate and credit risks. Alternative investment strategies are speculative, not suitable for all clients, and intended for experienced and sophisticated investors who are willing to bear the high economic risks of the investment. Mutual fund and exchange traded fund (ETF) performance information is based upon published performance of the mutual funds or ETFs, which must be calculated by the funds in accordance with rules and regulations promulgated by the Securities and Exchange Commission.
Indices: Figures for the indices reflect the reinvestment of dividends but do not reflect any management fees, transaction costs or expenses, which would reduce returns. Indices are unmanaged and an investor cannot invest directly in an index. Russell 3000: A market capitalization weighted equity index maintained by the Russell Investment Group that seeks to be a benchmark of the entire U.S. stock market. This index encompasses the 3,000 largest U.S.-traded stocks, in which the underlying companies are all incorporated in the U.S. MSCI All Country World Index Ex USA: A market-capitalization-weighted index maintained by MSCI Inc. anddesigned to provide a broad measure of stock performance throughout the world, with the exception of U.S.-based companies. The MSCI All Country World Index Ex-U.S. includes both developed and emerging markets. Bloomberg Barclays U.S. Aggregate: A market capitalization-weighted index, maintained by Bloomberg Barclays, and is often used to represent investment grade bonds being traded in United States. HFRX Global Hedge Fund Index (USD): An asset weighted index comprised of all eligible hedge fund strategies, designed to be representative of the overall composition of the hedge fund universe.
Year 1 2 3 4 5 6 7 8 9 1010% 1.10 1.21 1.33 1.46 1.61 1.77 1.95 2.14 2.36 2.599% 1.09 1.19 1.30 1.41 1.54 1.68 1.83 1.99 2.17 2.375% 1.05 1.10 1.16 1.22 1.28 1.34 1.41 1.48 1.55 1.634% 1.04 1.08 1.12 1.17 1.22 1.27 1.32 1.37 1.42 1.483% 1.03 1.06 1.09 1.13 1.16 1.19 1.23 1.27 1.30 1.342% 1.02 1.04 1.06 1.08 1.10 1.13 1.15 1.17 1.20 1.22