Embed Size (px)
Citation preview
CrystalStrategy I
Portfolio StructureCrystal Strategy I seeks to outpace inflation by3-5% over a full 3-year market cycle. ThePortfolio’s investment philosophy is based onthe time-proven investment principles used bylarge academic endowments. These principlesinclude broad diversification (includingdomestic and foreign equity, fixed income,absolute return, real assets, and privateequity), equity-like returns, active and passivemanagement, focused strategy exposures,strong risk management, and others. CrystalStrategy I is a robust and complete investmentframework for individual and institutionalinvestors alike.
Portfolio Management TeamChris HartSenior Vice President18 years industry experienceM.B.A. University of VirginiaB.A. Trinity College
Andrew Rosenberger, CFASenior Investment Manager11 years industry experienceB.S. Pennsylvania StateUniversity
Stuart P. Quint, III, CFASenior Investment Manager23 years industry experienceB.S./B.A. Dual DegreeUniversity of Pennsylvania
Key StatisticsInception Date January 2009Cumulative Return Since Inc. 37.67%Total Net Assets (Mil) $403Number of Holdings/Positions 27Annual Portfolio Turnover 177.86Yield 2.31%Expense Ratio 0.71%Portfolio Investment Minimum $100,000Net Market Exposure 57%
Portfolio Objectives
Seeks to produce absolute (positive) return and compound wealth above therate of inflation with reduced correlation to the S&P 500 Index.
APRFACT SHEET 20
16
Portfolio Highlights
1 Broad Asset Class Exposures: Portfolio allocates across six major asset classes with a significant portion invested inthe non-traditional asset classes of absolute return, real assets and private equity.
2 Many Diverse Strategies: Portfolio has an average of 40 different strategies at work at any given time. The Portfoliouses multi-sector strategies that are transparent and offer daily liquidity.
3 Highly Focused Stock Selection: In addition to researching and adding the best managers, the Portfolio also uses ahighly focused stock selection approach.
Asset Class Breakdown as of 4/30/16
Market ExposureLegendGroup Gross Net
Asset
Rank
¢ Domestic EquityDomestic Equity 23% -12%1.0
0¢ International EquityInternational Equity 6% 6%
2.00
¢ Fixed IncomeFixed Income 25% 25%3.0
0¢ Real AssetsReal Assets 12% 12%
4.00
¢ Absolute ReturnAbsolute Return 21% 21%5.0
0¢ Private EquityPrivate Equity 5% 5%
6.00
Gross Market Exposure may not add to 100% due to the exclusion of cash.Net Market Exposure represents long minus short exposure.
Annualized Performance as of 4/30/16 Standard Deviation
StrategyHFRXCPI + 3
1 Month 3 Months YTD 1 Year 3 Year 5 YearSince
Incep.0.63% 1.14% -2.20% -8.58% -2.24% 0.51% 4.46%0.41% 1.33% -1.47% -7.18% -0.99% -1.19% 1.72%0.25% 0.66% 0.94% 3.73% 3.86% 4.20% 4.62%
StrategyHFRXCPI + 3
1 Year 3 Year 5 Year4.41% 3.95% 4.33%4.50% 3.88% 4.16%0.47% 0.62% 0.72%
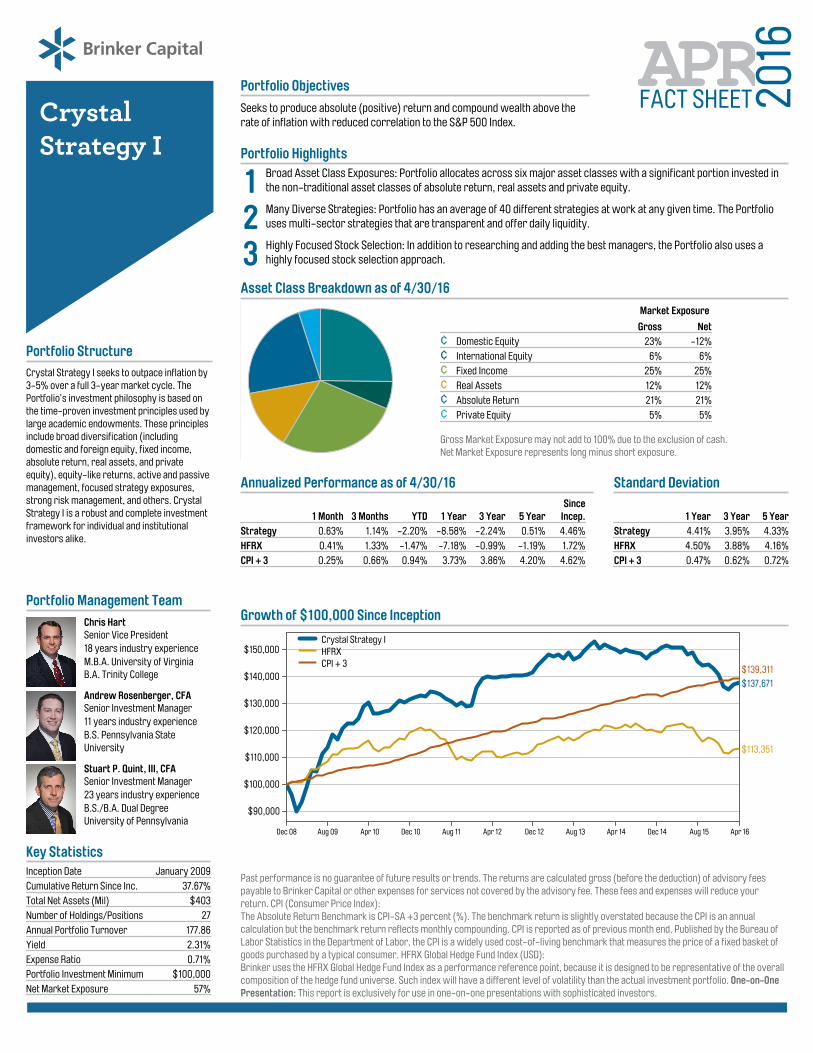
Growth of $100,000 Since Inception
Dec 08 Aug 09 Apr 10 Dec 10 Aug 11 Apr 12 Dec 12 Aug 13 Apr 14 Dec 14 Aug 15 Apr 16
$90,000
$100,000
$110,000
$120,000
$130,000
$140,000
$150,000
$113,351
$137,671$139,311
Crystal Strategy IHFRXCPI + 3
Past performance is no guarantee of future results or trends. The returns are calculated gross (before the deduction) of advisory feespayable to Brinker Capital or other expenses for services not covered by the advisory fee. These fees and expenses will reduce yourreturn. CPI (Consumer Price Index):The Absolute Return Benchmark is CPI-SA +3 percent (%). The benchmark return is slightly overstated because the CPI is an annualcalculation but the benchmark return reflects monthly compounding. CPI is reported as of previous month end. Published by the Bureau ofLabor Statistics in the Department of Labor, the CPI is a widely used cost-of-living benchmark that measures the price of a fixed basket ofgoods purchased by a typical consumer. HFRX Global Hedge Fund Index (USD):Brinker uses the HFRX Global Hedge Fund Index as a performance reference point, because it is designed to be representative of the overallcomposition of the hedge fund universe. Such index will have a different level of volatility than the actual investment portfolio. One-on-OnePresentation: This report is exclusively for use in one-on-one presentations with sophisticated investors.

www.BrinkerCapital.com 800.333.4573 1055 Westlakes Drive / Suite 250 / Berwyn, PA 19312
Year 1 2 3 4 5 6 7 8 9 1010% 1.10 1.21 1.33 1.46 1.61 1.77 1.95 2.14 2.36 2.599% 1.09 1.19 1.30 1.41 1.54 1.68 1.83 1.99 2.17 2.375% 1.05 1.10 1.16 1.22 1.28 1.34 1.41 1.48 1.55 1.634% 1.04 1.08 1.12 1.17 1.22 1.27 1.32 1.37 1.42 1.483% 1.03 1.06 1.09 1.13 1.16 1.19 1.23 1.27 1.30 1.342% 1.02 1.04 1.06 1.08 1.10 1.13 1.15 1.17 1.20 1.22
APRFACT SHEET 20
16CrystalStrategy I
Firm OverviewBrinker Capital is an investment managementfirm and one of the nation’s leadingindependent providers of managed accountand mutual fund investment services. Throughour innovative investment products, we seekto provide real purchasing power for investorsand sustainable purchasing power for futuregenerations. Brinker Capital was founded in1987 by Charles Widger and is located insuburban Philadelphia. Brinker Capital Inc., aregistered investment advisor.
The returns above are based upon actualperformance from accountsseeded by Brinker Capital in December 2008through June of 2010. Returns are based onactual market values and are weighted accordingly. Returns for periods exceeding oneyear are annualized.100% of the returns are non-fee payingthrough June of 2010. All return calculationsare in U.S. Dollars and include all paid andaccrued dividends and interest as well as thereinvestment of dividends when applicable.Past performance is no guarantee of futureresults. Estimated Beta: Unlike Historical Betawhich shows the beta of the portfolio usingprior returns, the Estimated Beta is a forwardlooking estimate of our current beta basedupon current portfolio positioning. HistoricalBeta: A measure of a portfolio’s sensitivity tomarket movements. Sharpe Ratio: A measureof a portfolio's excess return per unit of risk.Maximum Drawdown: The peak to troughdecline of a portfolio during a specific period.
The holdings supplied are a complete list as of4/29/2016. These may change prior toinvestment and are subject to change at anytime. Allocations may not add to totals due torounding of asset class and fund allocationpercentages.
Portfolio HoldingsTarget Range
Domestic Equity 23.08% 5%-50%Proshares Short Russell 2000 6.49% 5%-50%Proshares Short QQQ 5.82% 5%-50%Proshares Short Dow 30 5.16% 5%-50%United Airlines 2.41% 5%-50%Bogle Small Cap Growth 1.93% 5%-50%Delta Air Lines Inc 1.28% 5%-50%International Equity 5.66% 5%-50%iShares MSCI India 2.13% 5%-50%Wasatch Frontier Emg Small Countries 1.92% 5%-50%iShares FTSE/Xinhua China 25 ETF 1.61% 5%-50%Fixed Income 33.41% 5%-50%SPDR Barclays High Yield Bond 15.47% 5%-50%Cash 8.50% 5%-50%DoubleLine Total Return Bond 3.80% 5%-50%RiverPark Strategic Income 2.95% 5%-50%RiverPark Short Term High Yield 2.68% 5%-50%Real Assets 12.26% 5%-50%iShares Gold Trust 7.14% 5%-50%iShares Silver Trust 3.40% 5%-50%Starwood Property Trust 1.71% 5%-50%Absolute Return 20.98% 5%-50%RiverNorth Core Opportunity 5.05% 5%-50%ASTON/River Road Independent Value 3.09% 5%-50%William Blair Macro Allocation 3.03% 5%-50%AQR Style Premia Alternative 2.96% 5%-50%Driehaus Active Income 2.00% 5%-50%ASTON/River Road Long/Short 1.99% 5%-50%ASG Managed Futures Strategy Fund 1.94% 5%-50%Witherspoon Managed Futures 0.93% 5%-50%Private Equity 4.61% 5%-50%Red Rocks Listed Private Equity 3.54% 5%-50%Stonegate Bank 1.06% 5%-50%
Additional Statistics - Five YearsEstimated Beta 0.09Historical Beta 0.23Sharpe Ratio 0.10Maximum Drawdown -11.56%# Positive Months 31# Negative Months 29Best Quarter % Return 8.25%Worst Quarter % Return -3.00%
Calendar Year Performance
Strategy HFRX CPI + 32015 -5.58% -3.64% 3.67%2014 -2.35% -0.58% 3.69%2013 7.95% 6.72% 4.55%2012 9.38% 3.51% 4.78%2011 -1.61% -8.87% 6.06%2010 7.18% 5.19% 4.44%2009 22.61% 13.40% 5.81%
Mutual Fund Performance:Mutual fund and Exchange Traded Fund (ETF)performance information is based upon publishedperformance of the mutual funds or ETFs, which mustbe calculated by the funds in accordance with rules andregulations promulgated bythe Securities and ExchangeCommission. Indices: Figures for the indices reflect thereinvestment of dividends but do not reflect anymanagement fees, transaction costs or expenses,which would reduce returns. Indices are unmanagedand an investor cannot invest directly in an index. As astrategist, Brinker Capital creates and updates a modelportfolio utilizing various mutual funds, exchangetraded funds or stocks and delivers the model portfolioto platforms for implementation. Your account may notcontain certain securities due to their availability andsubstitute securities will be selected at BrinkerCapital's discretion.
Absolute Return as represented by HFRX Global Hedge Fund Index USD and CPI above. An index is unmanaged and does not reflect the deduction of any fees or expenses, which could reducereturns. The assumed inception date of the strategy for performance comparison purposes is 1/1/2009. Your account may not contain certain funds listed above due to their availability. Fees: Theperformance information does not reflect the deduction of advisory fees payable to Brinker Capital and any other expenses for services not covered by the advisory fee that an investor mayincur, which will reduce a client's return. Brinker Capital charges one comprehensive fee for investment management services, which includes manager and fund due diligence, asset allocation,manager fees, custody fees and trading expenses and solicitor fees. Brinker Capital's fee does not include the internal management fees and operating expenses of mutual funds in which a client'saccount is invested, which are reflected in the performance information contained herein. Brinker Capital's fees are disclosed in Part II of its Form ADV. The net effect of the deduction of BrinkerCapital's fees on annualized performance, including the compounded effect over time, is determined by the relative size of the fee and the account's investment performance. The chart to theright depicts the effect of a 1% management fee on the growth of one dollar over a ten year period at 10% (9% after fees), 5% (4% after fees) and 3% (2% after fees) assumed rates of return. Allinvestments involve risk including loss of principal. Alternative investment/strategies are speculative, not suitable for all clients, and intended for experienced and sophisticated investors whoare willing to bear the high economic risks of the investment. Foreign securities involve additional risks, including foreign currency changes, political risks, foreign taxes, and different methods ofaccounting and financial reporting. Fixed income investments are subject to interest rate and credit risk. For REITS, property values may fall due to increasing vacancies, declining rents resultingfrom economic, legal, tax, political or technological developments, lack of liquidity, limited diversification and sensitivity to certaineconomic factors such as interest rate changes and market recessions. Additionally, ETFs are traded on an exchange and aresubject to market price risk. There is also a liquidity risk in that the trading of an ETF may be halted due to such things as marketconditions. The investor will pay brokerage commissions in connection with the purchase of shares of ETFs. Inverse ETFs may bemore costly and pose greater risk than traditional ETFs and may disproportionately increase losses. FS_CRYSTAL_I