Embed Size (px)
Citation preview
TEE JOUHKAL 01” I~IOLOGICAL CHEMISTRY
Vol. 247, No. 18, Issue of September 25, pp. 5765-5776, 1972
Printed in C.S.A.
Permeation of Glucose by Simple and Facilitated Diffusion by
Novikoff Rat Hepatoma Cells in Suspension Culture and
Its Relationship to Glucose Metabolism*
(Received for publication, Dcccmbcr 20, 1971)
SUMMARY
The incorporation of 2-deoxy-D-[14C]glucose by cultured Novikoff rat hepatoma cells was investigated as a function of the deoxyglucose concentration in the medium. The
intracellular radioactivity was mainly associated with de- oxyglucose O-phosphate, to a small extent with 6-phospho- deoxygluconate, and the remainder with free deoxyglucose. Below a concentration of 1 to 2 mM in the medium, the initial rate of deoxyglucose incorporation followed simple Michaelis-Menten kinetics at 22, 27, 32, and 37” with an apparent Km of about 2 mM. The VlnBX values increased with a Qlo of about 2.5 with an increase in temperature. Between 2 and 10 mM, on the other hand, the initial rate of incorporation increased Knearly with an increase in deoxy- glucose concentration and the relative increase in incorpora- tion rate with increase in deoxyglucose concentration was about the same at the temperatures tested. Treatment of the cells with 0.5 mM fi-chloromercuribenzoate for 15 min or heat shock (48.5”, 5 min) abolished the saturable uptake component without affecting the nonsaturable component. When combined, the results indicate that at low concentra- tions, deoxyglucose is taken up mainly by carrier-mediated transport (probably facilitated diffusion), whereas at con- centrations above 2 mM, simple diffusion becomes the princi- pal mode of entry of deoxyglucose into the cells. Results from studies on D-glucose and 3-O-methyl-D-glucose in- corporation support this conclusion and suggest that all three substrates are transported by a single system.
Persantine competitively inhibited deoxyglucose uptake by whole cells and decreased the metabolism of glucose without affecting the phosphorylation of the substrates. Prior treatment with p-chloromercuribenzoate or heat shock also had no effect on the hexokinase activity of the cells. Little if any hexokinase activity was associated with the plasma membrane and the kinetic properties of the in vitro hexokinase reaction differed from that for glucose or de- oxyglucose uptake by whole cells. These results indicate that transport of glucose into the cell is a reaction distinct from phosphorylation and is the rate-limiting step in the metabolism of glucose by the cells. Since the cells possess
* This work was supported by grants from the Minnesota Medi- cal Foundation, Public Health Service Research <irants AI O’i250 and AI 050%, and National Science Foundation Grant GB-lW34.
an excess of hexokinase, glucose is phosphorylated as rap- idly as it enters the cells and thereby trapped. At low con- centrations of glucose in the medium (5 to 50 PM), the glu- cose 6-phosphate formed was exclusively used by the cells for macromolecular synthesis and oxidative processes with- out net production of lactate. The rate of COz production and incorporation of glucose in macromolecules approached a maximum at about 1 mM glucose in the medium and the excess glucose 6-phosphate formed, particularly at higher concentrations of glucose in the medium, was converted to lactate.
The transformation of mammalia~~ cells by tumor viruses (l-4) or of lymphorytes by l)h~tohemngglutitlitl (5, B), as x-e11 as the cell derlsit~-dependent inhibition of growth of c~ult,urctl mammalian cell:: (T-9), is associated with dramatic cllanges in t,he capacity of the cells to take up small molecular weight sut,stancrs sucll as glucose, nucleosides, or phosphate ions. ‘I‘llese c~ll:u1~~cs
may be directly related to changes in the metabolism of the (sell since the metabolism of certain substrates by marnmali:u~ cells may be limited by the rate of their tr:uqort into the cell (10-l 2). Hormones may also affect metabolism by induced (2hanges of the transport systems (I 2-15).
The fact that the capacity of the cells to take up glucose is affected by tumor virus or pllytohemagg;lntiIlill-induced cell transformations or by cell density inhibition of growth, and is regulated by hormones is of particular interest in view of the central importance glucose serves as energy source and ill the supply of metabolic intermediates for growth. Although the up take of hesoses by erythrocytes (see Reference 16), adipose tissue (12, I3), and by suspensions of Ehrlich ascites tumor cells har- vested from whole animals (17-19) has been investigated es- tensively, the mechanism of uptake is poorly understood (20, 21). Not even the kinetics of glucose uptake by human erythrocytes has been well defined since different methods yield variant re- sults (22, 23). Further, few studies have concerned themselves with the mode and regulation of uptake of glucose by growing mammalian cells in culture (24) and the relationship between the rate of glucose uptake and the rate of its metabolism. In attempts to gain further understanding of these processes, we
5765
by guest on April 11, 2019
http://ww
w.jbc.org/
Dow
nloaded from
5766
have first compared the usefulness of various substrates as models for measuring glucose transport by Novikoff rat hepatoma cells growing in suspension culture and then analyzed the mode(s) of uptake of glucose by the cells. Of additional interest was the substrate specificity of the glucose transport system and the question of whether phosphorylation represents an integral part of the transport system (19). We also concerned ourselves with the question of whether the metabolic fate of glucose is influenced by the rate with which it is taken up by the cells, and whether transport is the rate-limiting step in the metabolism of glucose by the cells. A preliminary report of some of our findings has been presented (25).
EXPERIMENTAL PROCEDURE
AVaterials
Materials were purchased as follows: uniformly labeled D-
[14C]glucose, 2-deoxy-n-[i4C]glucose, 3-@methyl-n-[14C]glucose, and L-[%]sorbose from International Chemical and Nuclear Corporat.ion; unlabeled n-glucose, 2-deoxy-n-glucose, n-galactose, n-mannose, n-fructose, n-sorbose, 3-0 -methyl-n-glucose, D-
glucosamine-HCl, n-gluconic acid, n-glucose B-phosphate, 2- deoxy-n-glucose B-phosphate, fructose 1,6-bis-phosphate, and 6-phospho-r-gluconic acid from Calbiochem; n-glucose 6-phos- phate dehydrogenase and NADP from Pabst Laboratories; and uridine and adenosine from Schwarz BioResearch. Persantine (2,6-bis(diethanolamino)-4,8, -dipiperidinopyrimido - (5,4-d)-py- rimidine) was a gift from Geigy Pharmaceuticals, Yonkers, N. Y. Glucose-free BM42 had the same composition as BM42 (26) except that glucose was omitted. BM42 is a basal medium containing salts, amino acids, vitamins, and antibiotics, but no serum or other body fluids, and is buffered with bicarbonate. A’-2-H~droxyethylpiperazine-N’-2-ethanesulfol~ic acid-buffered BM42 had the same composition as glucose-free BM42, except that the bicarbonate was replaced by 50 mM N-2-hydroxyethyl- piperazine-N-2-ethanesulfonic acid. B4 was composed of 10 mM Tris-HCl (pH 7.4), 10 rnM NaCl, 1.5 InM RI&&, 1 mM CaC12, and 1 InM triethanolamine, and BSS of 136 mu NaCl, 5 mM
KCl, 1 mrw MgS04, 4.2 mu NasHPOd, 0.8 mM KHzP04, and 0.02 mg per ml of phenol red.
Methods
Cell Culfure-Novikoff rat hepatoma cells (subline NISI-67) were propagated in suspension culture in Swim’s medium 67 and enumerated by tabulation in a Coulter counter as described previously (26, 27). For experiments, cells were collected by centrifugation at 400 x g for 1 to 2 min from cultures in the exponential phase of growth (2 X lo6 to 2.8 X lo6 cells per ml) and suspended to 2 x lo6 cells per ml in glucose-free BM42 or N-2 - hydroxyethylpiperazine- N’-2- ethanesulfonic acid -buff- ered BM42 as indicated in the appropriate experiments.
Incorporation of Labeled Hexoses into Cell Material and Prep- aration of Acid-soluble Cell Extracts-Suspensions of cells in glucose-free BM42 were supplemented with 14C-labeled hexoses as indicated in the appropriate experiments and incubated on a gyrotory shaker at about 200 rpm. At appropriate time in- tervals, samples of 0.5 or 1.0 ml of suspension were analyzed as follows. (a) For total radioactivity associated with the cells, the cells were collected by centrifugation at 400 x g for 1 to 2 min (O”), rapidly washed in 5 ml of cold BSS, and suspended in 0.2 ml of 0.5 N trichloroacetic acid. (b) For radioactivity in acid-insoluble material, other samples were quickly frozen in a bath of solid COZ in ethanol and later thawed and mixed
with perchloric acid at O”, and the precipitated material was washed repeatedly with perchloric acid and trichloroacetic acid as described previously (27). The washed precipitates were mixed with 0.1 ml of 0.5 N trichloroacetic acid and then all sam- ples of (a) and (b) were heated at 70” for 30 min and analyzed for radioactivity. The total radioactivity in the cell suspension was estimated as follows. Samples (0.1.ml) of the suspension were mixed with 0.1 ml of 1 N trichloroacetic acid, heated at 70” for 30 min, and analyzed for radioactivity. The acid-soluble pools were extracted from samples of 1 x lo7 to 2 x lo7 cells as described previously (11, 28).
Analysis of W02 and [14C]Lacfate Production-Production of 14C02 from [r4C]glucose was measured by incubating suspensions of cells in 14C02 collection flasks (Wheaton Scientific, Millville, N. J.). The attached scintillation vials contained strips of Whatman No. 3MM paper soaked with 0.3 ml of 10% (w/v) KOH. The vials were replaced at appropriate time intervals of incubation. The cell suspensions were acidified prior to re- moval of the vials when indicated in the appropriate experiments. The paper was dried in the vials at room temperature, then scin- tillation fluid was added to the vials, and the radioactivity was determined as described below.
Production of extracellular lactate was measured as follows. Samples of a suspension of [r4C]glucose-labeled cells were cen- trifuged and 25.~1 samples of the supernatant fluid (culture fluid) were chromatographed with solvent 36 as described below.
Chromatographic Analyses-All materials were analyzed by ascending chromatography on Whatman No. 3MM paper. Chromatograms of acid extracts of cells and hexokinase reaction mixtures were developed at 30” for 18 hours with solvent 28r (3 volumes of 1 r+f ammonium acet,ate, pH 5, and 7 volumes of 95$& ethanol). Chromatograms of culture fluid were developed at room temperature for 5 hours with a solvent composed of 3 volumes of ethyl acetate, 1 volume of glacial acetic acid, and 1 volume of Hz0 (solvent 36). Appropriate mistures of standards were co-chromatographed. Nucleotides were located by ex- amining the developed paper under ultraviolet light, hexoses and hexose derivatives by staining with alkaline silver nitrate reagent (29), and lactate and pyruvate by staining with 0.4c/, (w/v) methyl orange in 95% ethanol. The developed chro- matograms of the experimental samples were cut into l-cm seg- ments at right angles to the direction of migration. The segments were placed in scintillation vials and agitated with 1 ml of Hz0 at 37” for 30 min. Then scintillation fluid was added and the radioactivity was determined. About 100% of the radioactivity was recovered from the paper.
Cell Eractionations-All steps were conducted at O-4”. Cell- free extracts were prepared as described previously (28) except for the use of a different buffer solution. In brief, 4 x lo7 to 20 x lo7 cells were collected by centrifugation from exponential phase cultures, suspended in 2 ml of a solution composed of 0.1 M glycylglycine buffer (pH 7.5) and 1 mM mercaptoethanol, and disrupted by sonication. The suspension was centrifuged
at 18,000 x g for 15 min and the supernatant fluid designated cell-free extract. Cells were fractionated into a nuclear and a mitochondrial-microsomal fraction and the cell sap by dis- rupting the cells by homogenization in B4 followed by differential centrifugation as described in detail elsewhere (30). Cell frac-
tions were prepared in 0.4 M sucrose plus 10 mM Na3EDTA in the same manner except for the initial treatment: 1 X lo8 cells
1 The numbers refer to the solvents described in the 1967 catalog (p. 123) of Schwarz BioResearch, Orangeburg, N.Y.
by guest on April 11, 2019
http://ww
w.jbc.org/
Dow
nloaded from
were suspended in 2.4 ml of I-I& and after 10 min at 0” disrupted by five strokes with a Dounce homogenizer. Immediately thereafter, the suspension was mixed with 0.6 ml of 2 M sucrose and 0.06 ml of 0.5 M NaoEDTh and again homogenized with 10 strokes. The supernatant fluid obtained by centrifuging the suspension at 500 x g for 5 min was termed postnuclear fraction.
Enzyme Assays-Fractions from sucrose density gradients were assayed for cytochrome oxidase and total ATPase activities as described previously (31). Hexokinase activity was meas- ured either by (a) a spectrophotometric method modified from that of Walker and Parry (32) or (b) a direct method. For method (a), the reaction mixture contained 50 mM glycyl- glycine buffer (pH 7.5), 10 mM Mg$Od, 100 mM KCl, 10 mM
ATP, 1 mM NADP, 10 InM glucose, 0.5 unit of glucose 6-phos- phate dehydrogenase, and cell fraction in a total volume of 1 .O ml. Incubation was at room temperature and hexokinase ac-
til-ity was estimated from the linear increase in absorbance at 340 nm. Xo significant reduction of NADP occurred in the absence of glucose.
The composition of the reaction mixture in method (b) was
the same as in (a), except that NADP and glucose B-phosphate dehydrogenase were omitted, the unlabeled glucose was replaced by 0.6 mM [14C]glucose or [14C]deoxyglucose, and the total volume
r I II I I
u TIME (MINUTES)
5767
was 0.5 ml. Other substrate concentrations were employed as indicated in the appropriate experiments. The reaction mix- tures were incubated at 37” and at appropriate time intervals, 50.~1 samples were removed and placed in a bath of boiling water for 1 min. The suspension was clarified by centrifugation and the substrate and the phosphorylated product in the supernatant
fluid were separated chromatographically with solvent 28 as already described. Hexokinase activity was estimated from the initial linear portion of a plot of the amount of phosphorylated product formed as a function of time of incubation. One unit of hexokinase was defined as the amount of enzyme that phos- phorylated 1 pmole of substrate per min.
Radioactivity A!leasurements-All samples were mixed with 15 ml of modified Bray’s solution (26) and the radioactivity was measured with a Beckman or a Packard liquid scintillation spectrometer. The counting efficiencies with the two instru- ments were approximately 92 and 83%) respectively, for all 1YXabeled samples, except those from 14C02 collection flasks for which the counting efficiencies were approximately one-third lower.
RESULTS
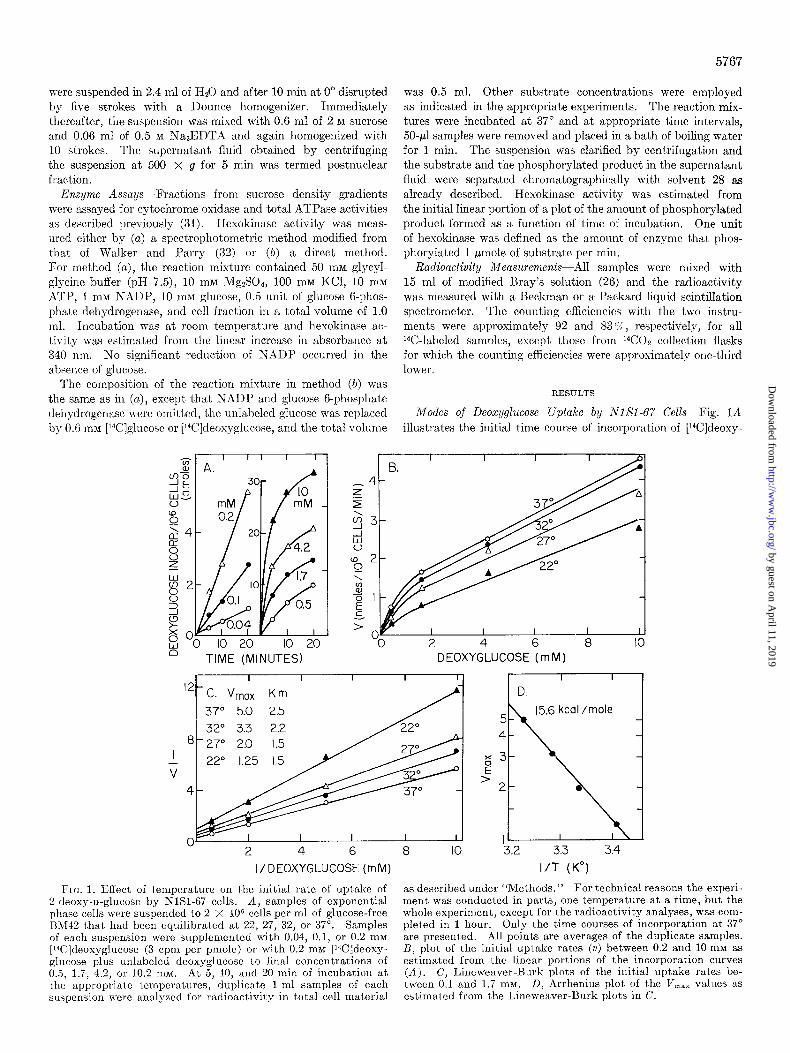
Modes of Deoxyglucose Uptake by NISI-67 Cells--Fig. 1A
illustrates the initial time course of incorporation of [‘%]deoxy-
2 4 6 8 IO DEOXYGLUCOSE (m M)
”
2 4 6 a IO
15.6 kcal /mole
‘3.2 3.3 3.4
I/ DEOXYGLUCOSE (mM) I/T (K”)
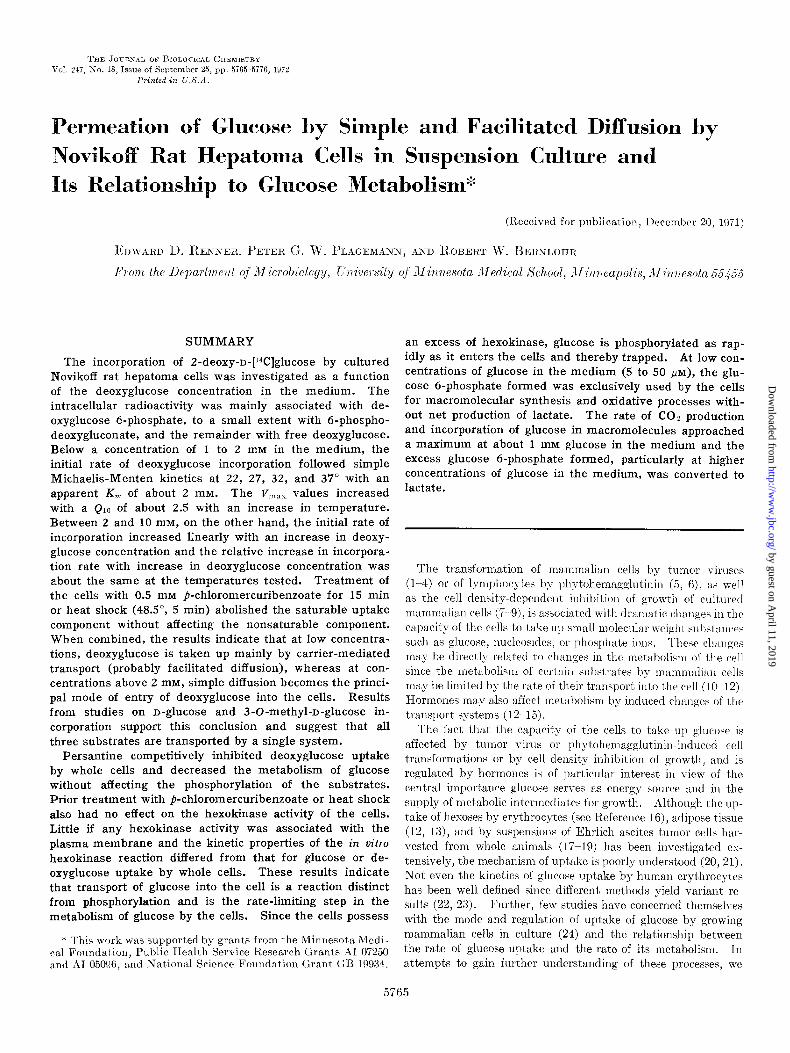
Fro. 1. Effect of temperature on ihe initial rate of uptake of as described under “Methods.” For technical reasons the experi- 2.deoxy-n-glucose by NISI-67 cells. A, samples of exponential ment was conducted in parts, one temperature at a time, but the phase cells xere suspended to 2 x 10” cells per ml of glucose-free whole experiment, except for the radioactivity analyses, was com- B1\142 that had been equilibrated at 22, 27, 32, or 37”. Samples pleted in 1 hour. Only the time courses of incorporation at 37” of each suspension were supplemented with 0.04, 0.1, or 0.2 mM are presented. All points are averages of the duplicate samples. [l%]deoxyglucose (3 cpm per pmole) or with 0.2 ma [Wldeoxy- B, plot of the initial uptake rates (v) between 0.2 and 10 mM as glucose plus unlabeled deoxyglucosc IO final concentrations of estimated from the linear portions of the incorporation curves 0.5, 1.7, 4.2, or 10.2 rnM. At 5, 10, and 20 min of incubation at (A), C, Lineweaver-Burk plots of the initial uptake rates be- the appropriate temperatures, duplicate l-ml samples of each tween 0.1 and 1.7 mM. D, Arrhenius plot of the V,,, values as suspension were analyzed for radioactivity in total cell material estimated from the Lineu-caver-13urk plots in C.
by guest on April 11, 2019
http://ww
w.jbc.org/
Dow
nloaded from
glucow into total cell material by NlSl-67 cells at various con- centrations of deoxyglucose in t,he medium. At concentrations below 0.5 m&f deoxyglucose, incorporation was linear with time for at least 20 min, whereas at higher concentrations, the rate of incorporation decreased rapidly. In agreement with previous results (15), most of the deoxyglucose taken up by the cells was phosphorylated and partially further converted to B-phospho- deoxygluconate, but not further metabolized. As indicated by the chromatographic analysis of acid extracts from labeled cells (Table I), most of the intracellular label was associated with deoxyglucose B-phosphate, smaller amounts with B-phos- phodeosggluconate, and the remainder m-ith free deoxyglucose, regardless of the deoxyglucose concentration in the medium. The relative proportion of free deoxyglucose inside the cell in- creased from about 10 to 300/, with an increase in deoxyglucose concentration in the medium from 0.04 to 4.2 1x1~. After 20 min of incubation with 4.2 ma1 deoxyglucose, the cells contained 6.3 nmoles of free deoxyglucose per IO6 cells. Based on an av- erage over-all volume of 2.5 ~1 per lo6 cells (28), this amount reljresents an over-all intracellular concentration of 2.7 mM free deoxyglucose, which is close to the extracellular colrcentration.
Lillemeaver-I~urk plots of the initial rates of uptake up to 1.i rnhl deosyglucose in the medium show that deoxyglucose uptake followed normal I\Iichaelis-~lentel1 kinetics at 22, 27, 32, and 3’7” (Fig. 1C). The apparent K, increased slightly with an increase in temperature, but less than that observed for glu- cose uptake by hurnan erythrocytes (33). The apparerlt V,,,,, decBreased from 5.0 nmoles of deosyglucose taken ul) per I O6 celli; per min at 3’7” to 1.25 nmoles per lo6 cells per min at 22” xvith an average Qlo of 2.5. When the V,,,,, I-alues were analyzed ill ar1 Xrrhenius plot a straight line was obtained from which an activation energy of 15.6 Cal per mole was calculated (Fig. 1 D). The results indicate that at these concentrations deoxgglucose is taken up by the cells by a carrier-mediated process.
The data in Fig. lB, however, show that at coi~centratioii~ abo~ 2 11112 the initial rate of deosyglucose uptake inc*reased
linearly with a11 increase in the deosyglucoFe concentration in the medium and that this increase was relatively unaffect,ed by the changes ill temperature of incubation. When analyzed ilr a Lineweaver~l%urk plot the uptake rates above 2 IYIRI deosy-
glucose deviated from the straight line in the direction of the origill. These results were similar to those obtained with nu-
The details of the experiment are described in t,he legend to Fig. 1. At the indicated times of labcling with [l%]deoxyglucose, acid extracts were prepared from 10’ cells and the acid extracts were analyzed chromatographically as described render “Meth- ods.”
Deoxyglucose 1 Time
WLM min
0.04 10 20
0 .5 10 20
4.2 10 20
n7noles
0 .5 81 1 78 6 80
10 80 18 62 21 60
___.~
I Percentage of total in cell Incorporated per 106 cells Deoxyglucos~
6.phosphate -Phosphode- Kygluconate
10 11 9 8 8 9
9 11 11 12 30 31
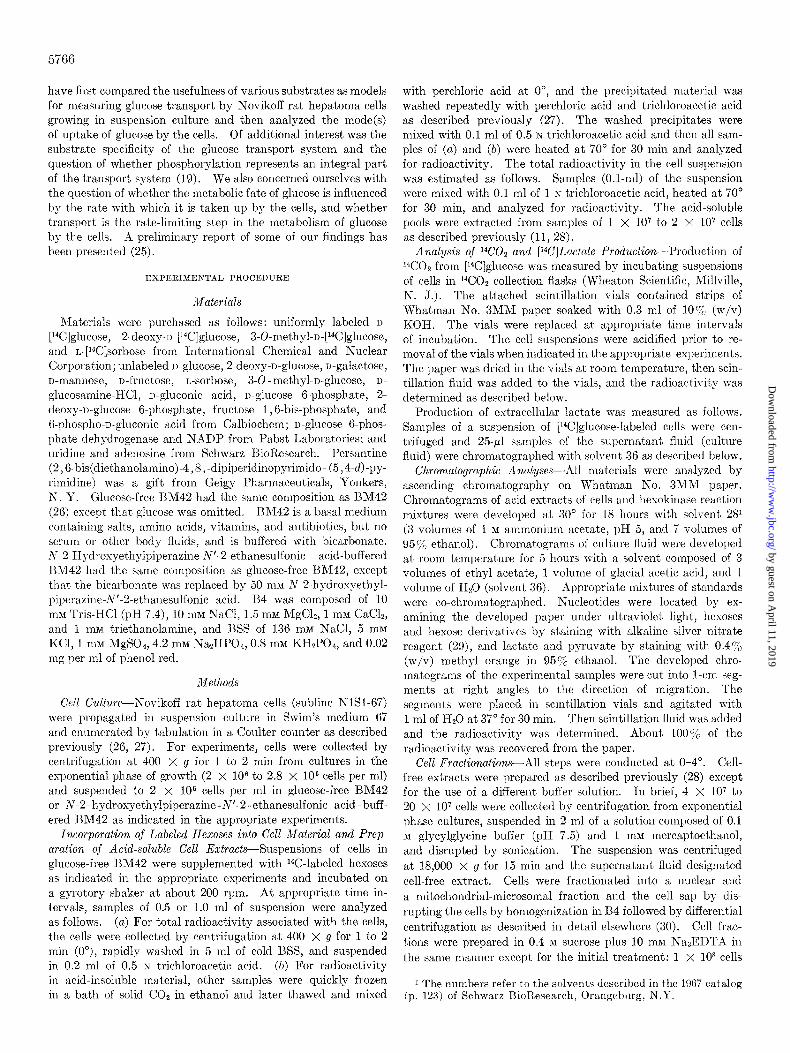
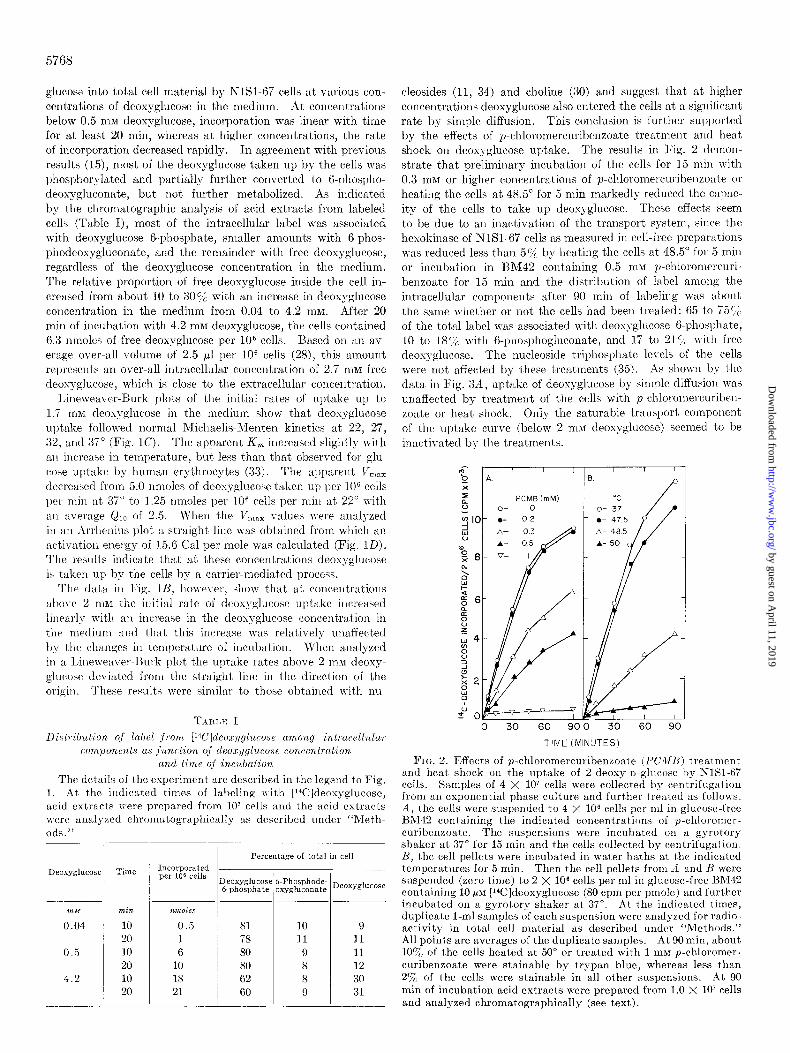
cleosides (11, 34) and choline (30) and suggest that at higher concentrations deoxyglucose also entered the rells at a significant rate by simple diffusion. This conclusion is further supl)orted by the effects of p-chloromercuribenzoate treatment and heat shock on deoxyglucose uptake. The results in Fig. 2 demon- strate that preliminary incubation of the cells for I5 min with 0.3 rnhf or higher concentrations of p-chloromercuribellzoate or heating the cells at 48.5” for 5 min markedly reduced the capac- ity of the cells to take up deoxyglucose. These effects seem to be due to an inactivation of the transport system, since the hesokinase of XlSl-67 cells as measured in cell-free preparations was reduced less than 5% by heating the cells at 48.5” for 5 min or incubation in BM42 containing 0.5 ~IV p-chloromercuri- benzoate for 15 min and the distribution of label among the intracellular components after 90 min of labeling was about the same whether or not the cells had been treated: 65 to i5C;;~ of the total label was associated with deosyglucose 6-phoq)hate, 10 to 18c/; with 6.l)llosl)hogluconate, and Ii to 21 T; with free deoxyglucose. The nucleoside triphosphate levels of the cells were not affected by tllese treatments (35). As shown by the dat,a in Fig. 3A, uptake of deosyglucose by simple diffusion was unaffected by treatment of the cells with p~cl?loromercuribell- zoate or beat. shock. Only the saturable transport component of the uptake curve (below 2 m&I deosg-glucose) seemed to be inactivated by the treatments.
PCMB imM)
0 30 60 SO 30 60 SC
TIME (MINUTES)
FIN. 2. Effects of p-chloromercuribenzoate (PCJI/~) treatment and heat, shock on the lIptake of 2.deoxy-o-glucose by NlKl-67 cells. Samples of 4 X lo7 cells were collected by centrifugation from an exponential phase culture and further treated as follows. A, the cells were sllspended to 4 X lo6 cells per ml in glucose-free BM42 containing the indicated concentrations of p-chloromer- curibenzoate. The suspensions were incubated on a gyrotory shaker at 37” for 15 min and the cells collected by centrifugation. 1l, the cell pellets were incubated in water baths at the indicated temperatures for 5 min. Then the cell pellets from Li and Ij were suspended (zero time) to 2 X lo6 cells per ml in glucose-free Hi\142 containing 10 /IM [14C]deoxyglucose (80 cpm per pmole) and further incubated on a gyrotory shaker at 37”. At the indicated times, duplicate l-ml sarnples of each suspension were analyzed for radio- activity in total cell material as described under “Methods.” All points are averages of the duplicate samples. At 90 min, about 10% of the cells heated at 50” or treated with 1 rnM p-chloromer- cnribenzoate were stainable by trypan blue, whereas less than 2’j& of the cells were stainable in all other suspensions. At 90 min of incubation acid extracts were prepared from 1.0 X 10’ cells and analyzed chromatographically (see text).
by guest on April 11, 2019
http://ww
w.jbc.org/
Dow
nloaded from
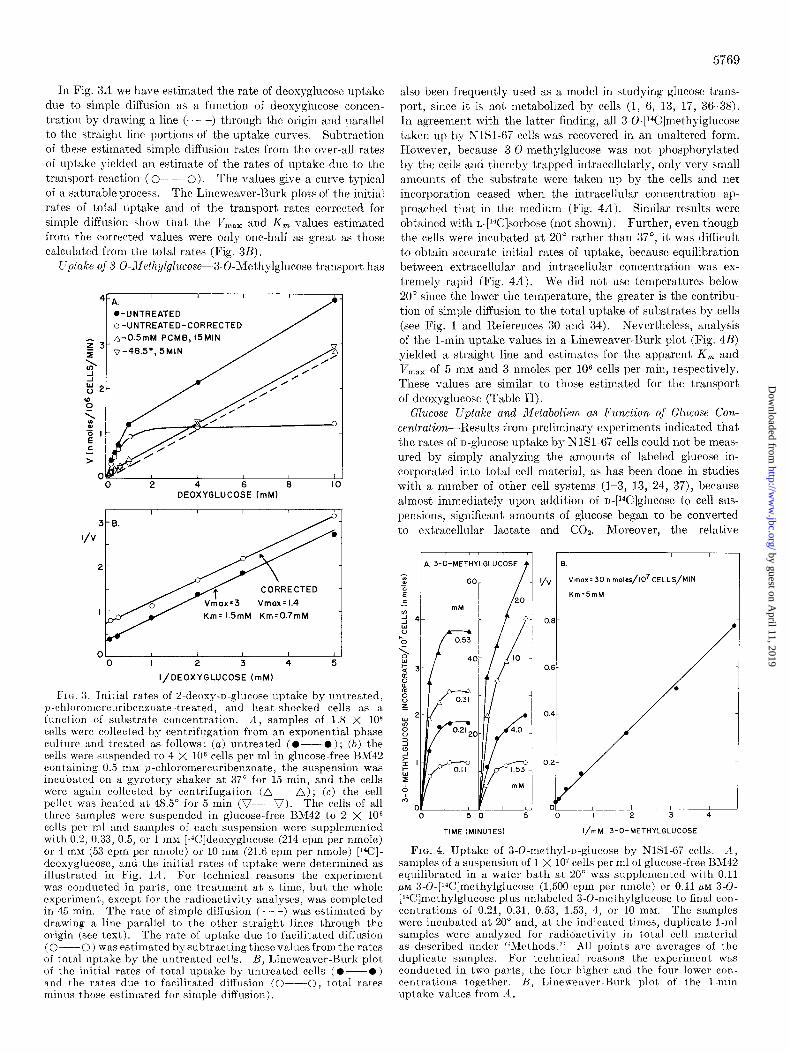
In Fig. 3A we have estimated the rate of deosyglucose uptake due to simple diffusion as a function of deoxyglucose concen- tration by drawing a line (- - -) through the origin and parallel to the straight line portions of t’he uptake curves. Subtraction of these estimated simple diffusion rates from the over-all rates of uptake yielded an estimate of the rates of uptake due to the transport reaction ( O- 0). The values give a curve typical of a saturable process. The Lineweaver-ISurk plots of the initial rates of total uptake and of the transport rates corrected for simple diffusion show that the VI,,,, and K, values estimated from the corrected values were only one-half as great as those calculated from the total rates (Fig. 3B).
L’ptake oj 3-O-Jfethylglucose-.3-O-Ylethylglucose transport has
I I I A.
.-UNTREATED o-UNTREATED-CORRECTED A-OSmM PCMB, 15MIN
o-48.5’, 5MIN
2 4 6 a DEOXYGLUCOSE (mM)
I ! I
3 B.
Km= 1.5mM Km=0.7mM
01 / I I I 0 I 2 3 4 5
I/DEOXYGLUCOSE (mM)
Fro. 3. Initial rates of 2.deoxy-D-glucose uptake by untreated, p-chloromercuribenzoate-treated, and heat-shocked cells as a function of substrate concentration. .I, samples of 1.8 X 1O8 cells were collected by centrifugation from an exponential phase culture and ‘created as follows: (a) untreated (O--O); (6) the cells were suspended to 4 X 10⁶ cells per ml in glucose-free BM42 containing 0.5 mu p-chloromercuribenxoate, the suspension was incltbated on a gyrotory shaker at 37” for 15 min, and the cells were again collected by centrifugation (n--A); (c) the cell pellet was heated at 48.5” for 5 min (V--V). The cells of all three samples were suspended in glucose-free BM42 to 2 X lo6 cells per ml and samples of each suspension were supplemented with 0.2, 0.33, 0.5, or 1 rnM [14C]deoxyglucose (214 cpm per nmole) or 4 mM (53 cpm per nmole) or 10 HIM (21.6 cpm per nmole) [I%]- deoxyglucose, and the initial rates of uptake were determined as illustrated in Fig. 111. For technical reasons the experiment was conducted in part,s, one treatment at a time, but the whole experiment, except. for the radioactivity analyses, was completed in 45 min. The rate of simple diffusion (- - -) was estimated by drawing a line parallel to t,he other straight lines through the origin (see text,). The rate of uptake due to facilitated diffusion (O--O) wasestimatedbysubtractingthesevalllesfromtherates of total lIptake by the untreated cells. B, Lineweaver-Burk plot of the initial rates of total uptake by untreated cells (O--O) and the rates dlle to facilitated diffusion (O---O, total rates mintls those estimated for simple diffusion).
5769
also been frequently used as a model in studying glucose trans- port, since it is not metabolized by cells (1, 6, 13, 17, 36-38). In agreement with the latter finding, all 3~0-[14C]methylglucose
taken up by NlSl-67 cells was recovered in an unaltered form. However, because 3-0-methylglucose was not phosphorylated by the cells and thereby trapped intracellularly, only very small amounts of the substrate were taken up by the cells and net incorporation ceased when the intracellular concentration ap- proached that in the medium (Fig. 4A). Similar results were obtained with L#*C]sorbose (not shown). Further, even though the cells were incubated at 20” rather than 37”, it was difficult to obtain accurate initial rates of uptake, because equilibration between extracellular and intracellular concentration was ex- tremely rapid (Fig. 4A). We did not use temperatures below 20” since the lower the temperature, the greater is the contribu- tion of simple diffusion to the total uptake of substrates by cells (see Fig. 1 and References 30 and 34). Nevertheless, analysis of the 1-min uptake values in a Lineweaver-Burk plot (Fig. 4B)
yielded a straight line and estimates for the apparent K, and V ,naX of 5 mM and 3 nmoles per lo6 cells per min, respectively. These values are similar to those estimated for the transport of deoxyglucose (Table II).
Glucose Uptake and Metabolism as Function of Glucose Con- centration-Results from preliminary experiments indicated that the rates of D-glucose uptake by JSlSl-67 cells could not be meas-
ured by simply analyzing the amounts of labeled glucose in- corporated into total cell material, as has been done in studies with a number of other cell systems (l-3, 13, 24, 37), because almost immediately upon addition of D-[14C]glucose to cell SUS-
pensions, significant amounts of glucose began to be converted
to extracellular lactate and COZ. Moreover, the relative
A. 3-0-METHYLGLUCOSE
)- / 20
TlME IMINUTES) I/mM 3-0-METHYLGLUCOSE
VV.__ir*! Vmax=30n moles/IO CELLS/MlN
I 4
J
FIG. 4. Uptake of 3.O-methyl-n-glllcose by NlSl-67 cells. .-I, samples of a suspension of 1 X 10’ cells per ml of glucose-free NM42 equilibrated in a water bath at 20” was supplemented wit,h 0.11 PM 3.0-[l%]methylglucose (1,500 cpm per nmolc) or 0.11 PM 3-O- [‘4C]methylglucose plus unlabeled 3.0-methylglucose to final con- centrations of 0.21, 0.31, 0.53, 1.53, 4, or 10 mM. The samples were incubated at 20” and, at the indicated times, duplicate l-ml samples were analyzed for radioactivity in total cell material as described Imder “Methods.” All points are averages of the duplicate samples. For technical reasons the experiment was conducted in two parts, the four higher and the four lower con- centrations together. I%, I,ineweaver-Rurk plot of the 1-min uptake values from A.
by guest on April 11, 2019
http://ww
w.jbc.org/
Dow
nloaded from
5770
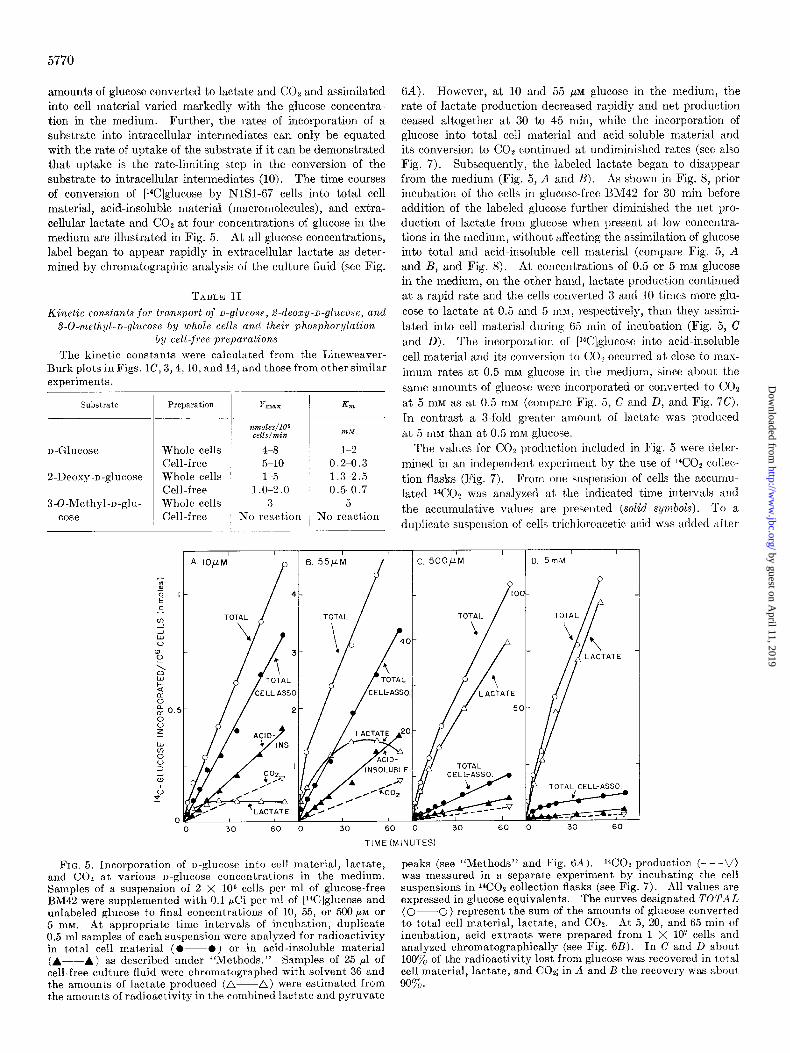
amounts of glucose converted to lactate and COz and assimilated into cell material varied markedly with the glucose concentra- tion in the medium. Further, the rates of incorporation of a substrate into intracellular intermediates can only be equated with the rate of uptake of the substrate if it can be demonstrated that uptake is the rate-limiting step in the conversion of the substrate to intracellular intermediates (10). The time courses of conversion of [14C]glucose by NISI-67 cells into total cell material, acid-insoluble material (macromolecules), and extra- cellular lactate and CO2 at four concentrations of glucose in the medium are illustrated in Fig. 5. At all glucose concentrations, label began to appear rapidly in extracellular lactate as deter- mined by chromatographic analysis of the culture fluid (see Fig.
TABLE II
Kinetic constants for transport of o-gl‘ucoae, 2.deoxy-D-glucose, and
3.O-methyl-D-gkcose by whole cells and their phosphorylution by cell-jree preparations
The kinetic constants were calculated from the Lineweaver- Burk plots in Figs. lC, 3,4,10, and 14, and those from other similar experiments
Substrate
D-Glucose
2-Deoxy-D-glucose
3-O-Methyl-n-glu- case
Preparation
Whole cells Cell-free Whole cells Cell-free Whole cells Cell-free
?k+%Ol~S/lO~ cells/?nin
468 5-10 1-5
1 .o-2.0 3
No reaction
30 60
T
- Knt
l-2 0.2-0.3 1.3-2.5 0.5-0.7
5 No reaction
6A). However, at 10 and 55 PM glucose in the medium, the rate of lactate production decreased rapidly and net production ceased altogether at 30 to 45 min, while the incorporation of glucose into total cell material and acid-soluble material and its conversion to CO2 continued at undiminished rates (see also Fig. 7). Subsequently, the labeled lactate began to disappear from the medium (Fig. 5, A and B). As shown in Fig. 8, prior incubation of the cells in glucose-free EM42 for 30 min before addition of the labeled glucose further diminished the net pro- duction of lactate from glucose when present at low concentra- tions in the medium, without affecting the assimilation of glucose into total and acid-insoluble cell material (compare Fig. 5, A and B, and Fig. 8). At concentrations of 0.5 or 5 mM glucose in the medium, on the other hand, lactate production continued at a rapid rate and the cells converted 3 and 10 times more glu- cose to lactate at 0.5 and 5 InM, respectively, than they assimi- lated into cell material during 65 min of incubation (Fig. 5, C and D). The incorporation of [lJC]glucose into acid-insoluble cell material and its conversion to COs occurred at close to mas- imum rates at 0.5 mM glucose in the medium, since about the same amounts of glucose were incorporated or converted to CO*
at 5 mM as at 0.5 mu (compare Fig. 5, C and D, and Fig. 7C). In contrast a a-fold greater amount of lactate was produced at 5 mM than at 0.5 1nM glucose.
The values for COz production included in Fig. 5 were deter- mined in an independent experiment by the use of ‘*CO2 collec- tion flasks (Fig. 7). From one suspension of cells the accumu- lated YZ02 was analyzed at the indicated time intervals and the accumulative values are presented (solid S?JVZ~O~S). To a duplicate suspension of cells trichloroacetic acid was added after
I I
D 5mM
TOTAL CELL-ASS0
30 60 0 30 60 0 30 60
TIME (MINUTES)
FIG. 5. Incorporation of D-glucose into cell material, lactate, and CO2 at various D-glucose concentrations in the medium. Samples of a suspension of 2 X lo6 cells per ml of glucose-free BM42 were supplemented with 0.1 pCi per ml of [l%]glucose and unlabeled glucose to final concentrations of 10, 55, or 500 PM OP
5 mM. At appropriate time intervals of incubation, duplicate 0.5-ml samples of each suspension were analyzed for radioactivity in total cell material (O-O) or in acid-insoluble material (A--A) as described under “Methods.” Samples of 25 ~1 of cell-free culture fluid were chromatographed with solvent 36 and the amounts of lactate produced (A-A) were estimated from the amounts of radioactivity in the combined lactate and pyruvate
peaks (see “Methods” and Fig. 6A ). ‘GO2 production (- - -V) was measured in a separate experiment by incubating the cell suspensions in 14C02 collection flasks (see Fig. 7). All values are expressed in glucose equivalents. The curves designated TOYA4L (0-0) represent the sum of the amounts of glucose converted to total cell material, lactate, and COQ. At 5, 20, and 65 min of incubation, acid extracts were prepared from 1 X 10’ cells and analyzed chromatographically (see Fig. 6L3). In C and D about 100% of the radioactivity lost from glucose was recovered in total cell material, lactate, and CO*; in A and B the recovery was about 90%.
by guest on April 11, 2019
http://ww
w.jbc.org/
Dow
nloaded from
5771
I I I
A. CULTURE FLUID
SOLVENT 36
;LUCOSE LACTAT
@ @@ PYRUVATE
0 IO 20 0 IO 20
FRACTION NUMBER
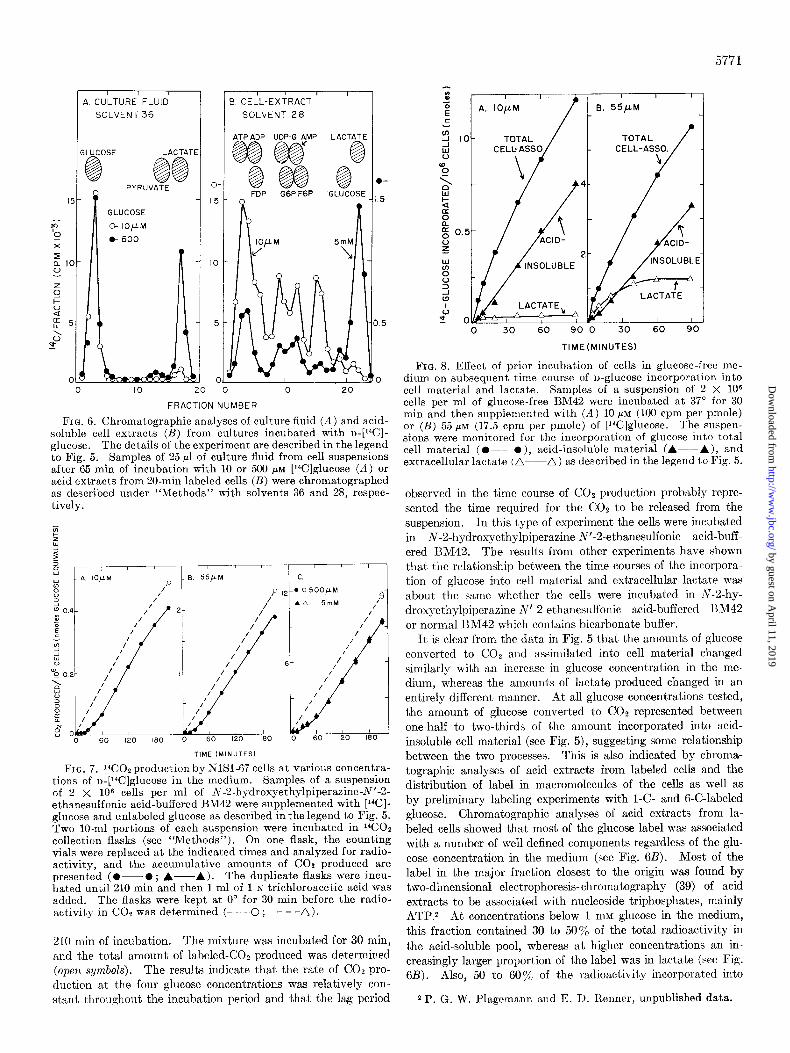
FIG. 6. Chromatographic analyses of culture fluid (A) and acid- soluble cell extracts (B) from cultures incubated with D-[WI- glucose. The details of the experiment are described in the legend to Fig. 5. Samples of 25 ~1 of culture fluid from cell suspensions after 65 min of incubation with 10 or 500 PM [14C]glucose (A) or acid extracts from 20-min labeled cells (B) were chromatographed as described under “Methods” with solvents 36 and 28, respec- tively.
F c 3
FIG. 7. ‘%!02 production by NlSl-67 cells at various concentra- tions of n-[‘4C]glucose in the medium. Samples of a suspension of 2 X 10⁶ cells per ml of N-2.hydroxyethylpiperazine-N’-2- ethanesulfonic acid-buffered BM42 were supplemented with [‘*Cl- glucose and unlabeled glucose as described in the legend to Fig. 5. Two lo-ml portions of each suspension were incubated in ‘4CO2 collection flasks (see “Methods”). On one flask, the counting vials were replaced at the indicated times and analyzed for radio- activity, and the accumulative amounts of CO2 produced are presented (O---O; A-A). The duplicate flasks were incu- bated until 210 min and then 1 ml of 1 N trichloroacetic acid was added. The flasks were kept at 0” for 30 min before the radio- activity in COT was determined (- - -0 ; - --a).
210 min of incubation. The mixture was incubated for 30 min, and the total amount of labeled-COz produced was determined (open symbols). The results indicate that the rate of CO2 pro- duction at the four glucose concentrations was relatively con- stant throughout the incubation period and that the lag period
30 60 9C
TOTAL / CELL-ASSO.
I
/
I I I 30 60 90
TIMEtMINlJTES)
FIG. 8. Effect of prior incubation of cells in glucose-free me- dium on subsequent time course of n-glucose incorporation into cell material and lactate. Samples of a suspension of 2 X lo6 cells per ml of glucose-free BM42 were incubated at 37” for 30 min and then supplemented with (A) 10 pM (100 cpm per pmole) or (B) 55 PM (17.5 cpm per pmole) of [‘“Clglucose. The suspen- sions were monitored for the incorporation of glucose int,o total cell material (O---O), acid-insoluble material (A-----A), and extracellular lactate (a---a) as described in the legend to Fig. 5.
observed in the time course of COz production probably repre- sented the time required for the COz to be released from the suspension. In this type of experiment the cells were incubated in N-2-hydroxyethylpiperazine-N’-2-ethanesulfonic acid-buff- ered 13M42. The results from other experiments have shown that the relationship between the time courses of the incorpora-
tion of glucose into cell material and extracellular laclate was about the same whether the cells were incubated in N-2-hy- droxyethylpiperazine-N’-2.ethanesulfonic acid-buffered IlM42
or normal BM42 which contains bicarbonate buffer. It, is clear from the data in Fig. 5 that the amounts of glucose
converted to COe and assimilated into cell material changed similarly with an increase in glucose concentration in the me- dium, whereas the amounts of lactate produced changed in an entirely different manner. At all glucose concentrations tested, the amount of glucose converted to COz represented between one-half to two-thirds of the amount incorporated into acid- insoluble cell material (see Fig. 5), suggesting some relationship between the two processes. This is also indicated by chroma- tographic analyses of acid extracts from labeled cells and the distribution of label in macromolecules of the cells as well as by preliminary labeling experiments with I-C- and 6-C-labeled glucose. Chromatographic analyses of acid extracts from la- beled cells showed that most of the glucose label was associated with a number of well defined components regardless of the glu- cose concentration in the medium (see Fig. 6B). Most of the label in the major fraction closest to the origin was found by two-dimensional electrophoresis-chromatography (39) of acid extracts to be associated with nucleoside triphosphates, mainly ATP.% At concentrations below 1 mM glucose in the medium, this fraction contained 30 to 50% of the total radioactivity in the acid-soluble pool, whereas at higher concentrations an in- creasingly larger proportion of the label was in lactate (see Fig. 6B). Also, 50 to 60% of the radioactivity incorporated into
2 P. G. W. Plagemann and F:. 1). Renner, unpublished data.
by guest on April 11, 2019
http://ww
w.jbc.org/
Dow
nloaded from
5772
TIME (MIN, OISTbwCE FROM ORWN (CM,
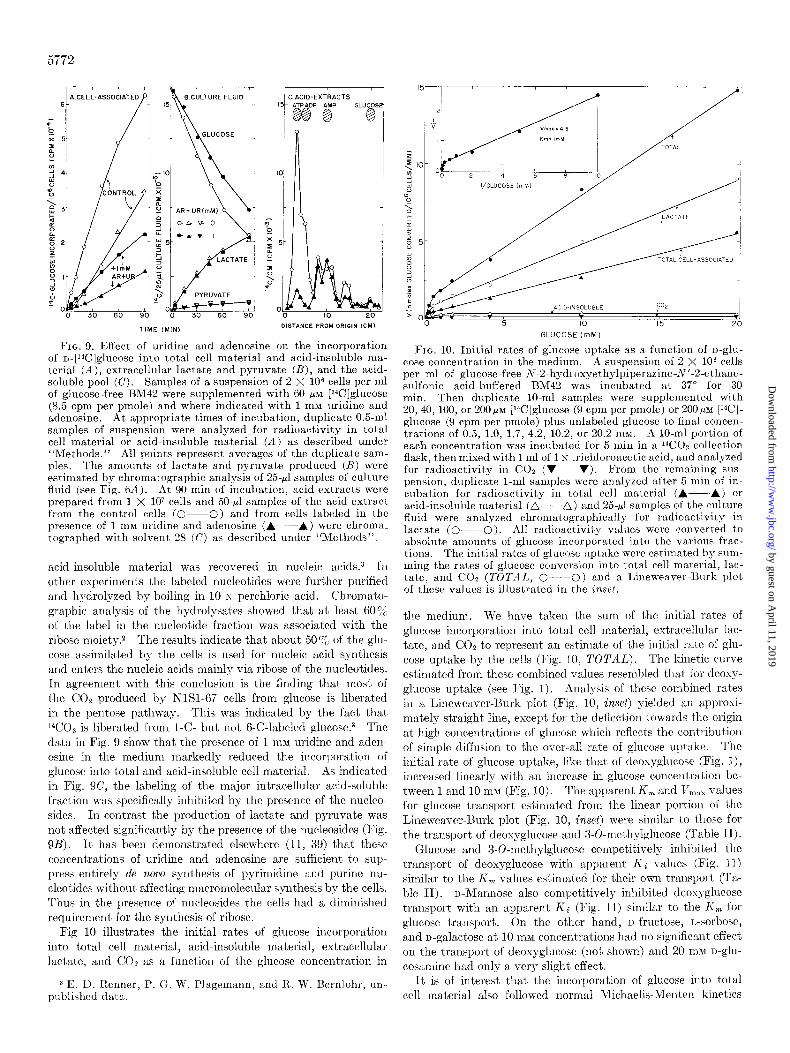
FIG. 9. Effect of uridine and adenosine on the incorporation of D-[‘%]glucose into total cell material and acid-insoluble ma- terial (A), extracellular lactate and pyruvate (B), and the acid- soluble pool (C). Samples of a suspension of 2 X lo6 cells per ml of glucose-free BM42 were supplemented with 60 PM [14C]glucose (8.5 cpm per pmole) and where indicated with 1 mM uridine and adenosine. At appropriate times of incubation, duplicate 0.5.ml samples of suspension were analyzed for radioactivity in total cell material or acid-insoluble material (A) as described under “Methods.” All points represent averages of the duplicate sam- ples. The amounts of lactate and pyruvate produced (n) were estimated by chromatographic analysis of 25.~1 samples of culture fluid (see Fig. 6A). At 90 min of incubation, acid extracts were prepared from 1 X lo7 cells and 50-J samples of the acid extract from the control cells (O--O) and from cells labeled in the presence of 1 mM uridine and adenosine (A---h.) were chroma. tographed with solvent 28 (C) as described under “Methods”.
acid-insoluble material was recovered in nucleic acids.3 In other experiments the labeled nucleotides were further purified and hydrolyzed by boiling in 10 N perchloric acid. Chromato- graphic analysis of the hydrolysates showed that at least 60% of the label in the nucleotide fraction was associated with the ribose moiety.2 The results indicate that about 50% of the glu- cose assimilated by the cells is used for nucleic acid synthesis and enters the nucleic acids mainly via ribose of the nucleotides. In agreement with this conclusion is the finding that most of the CO% produced by NlSl-67 cells from glucose is liberated in the pentose pathway. This was indicated by the fact that 14C02 is liberated from l-C- but not B-C-labeled glucose.a The data ill Fig. 9 show that the presence of 1 mM uridine and adell- osine in the medium markedly reduced the incorporation of glucose into total and acid-insoluble cell material. As indicated in Fig. SC, the labeling of the major intracellular acid-soluble fraction was specifically inhibited by the presence of the nucleo- sides. In contrast the production of lactate and pyruvate was not affected significantly by the presence of the nucleosides (Fig. 9B). It has been demonstrated elsewhere (11, 39) that these concent,rations of uridine and adenosine are sufficient to sup- press entirely de novo synthesis of pyrimidine and purine nu- cleotides without affecting macromolecular synthesis by the cells. Thus in the presence of nucleosides the cells had a diminished requirement for the synthesis of ribose.
Fig 10 illustrates the initial rates of glucose incorporation int>o total cell material, acid-insoluble material, extracellular lactate, and COP as a function of the glucose concentration in
3 E. L). Renner, P. G. W. Plagemann, and E. W. Bernlohr, un- published data.
GLUCOSE (mM)
FIG. 10. Initial rates of glucose uptake as a function of n-glu- cose concentration in the medium. A suspension of 2 X lo6 cells per ml of glucose-free A-2.hydroxyethylpiperazine-N’-2.ethane- sulfonic acid-buffered BM42 was incubated at 37” for 30 min. Then duplicate IO-ml samples were supplemented with 20, 40, 100, or 200 PM [%?]glucose (9 cpm per pmole) or 200 MM [‘“Cl- glucose (9 cpm per pmole) plus unlabeled glucose to final concen- trations of 0.5, 1.0, 1.7, 4.2, 10.2, or 20.2 mM. A lo-ml portion of each concentration was incubated for 5 min in a “COZ collection flask, then mixed with 1 ml of 1 N trichloroacetic acid, and analyzed for radioactivity in CO2 (V--V). From the remaining sus- pension, duplicate l-ml samples were analyzed after 5 min of in- cubation for radioactivity in total cell material (A--A) or acid-insoluble material (a---A) and 25.~1 samples of t,he culture fluid were analyzed chromatographically for radioactivity in lactate (O--O). All radioactivity values were converted to absohlte amounts of glucose incorporated into the various frac- tions. The initial rates of glucose uptake were estimated by sum- ming the rates of glucose conversion into t,otal cell material, lac- tate, and CO2 (TOTAT,, O--O) and a Lineweaver-Burk plot of these values is ilhlstrated in the inset.
the medium. We have taken the surn of t,he initial rates of glucose incorporation into total cell material, ext’racellular lac- tate, and CO2 to represent au estimate of the initial rate of glu- cose uptake by the cells (Fig. 10, TOTAL). The kinet’ic curve estimated from these combined values resembled that for deoxg- glucose uptake (see Fig. 1). Analysis of these combined rates in a Lineweaver-Burk plot (Fig. 10, inset) yielded an approsi- mately straight line, except for the deflection towards the origin at high concentrations of glucose which reflects the contribut’ion of simple diffusion to the over-all rate of glucose uptake. The
initial rate of glucose uptake, like that of deoxyglucose (Fig. l), increased linearly with an increase in glucose concentration be- tween 1 and 10 mM (Fig. 10). The apparent I<, and Ir,,,, values for glucose transport estimated from the linear portion of the Lineweaver-Shirk plot (Fig. 10, inset) were similar to those for t’he transport of deosyglucose and 3-0-methylglucose (Table II).
Glucose and 3-O-methylglucose competitively inhibited the transport of deoxyglucose with apparent Ki values (Fig. 11) similar to the K, values estimated for their own transport (Ta- ble II). u-Mannose also competitively inhibited deosyglucose transport with an apparent Ki (Fig. 11) similar to the k’, for glucose transport. On the other hand, n-fructose, L-sorbose, and n-galactose at 10 mM concentrations had no significant effect on the transport of deoxyglucose (not shown) and 20 m&I n-glu- cosamine had only a very slight effect.
It is of interest that the incorporation of glucose into total cell material also followed normal Michaelis-Menten kinetics
by guest on April 11, 2019
http://ww
w.jbc.org/
Dow
nloaded from
5773
2
P I: IO
r 20 GLUCOSAMIN
d 0 UNTREATED
“0 -;.
z
2 5 c
3
0
0 2 4 6 6 IO
I/DEOXYGLUCOSE (mM)
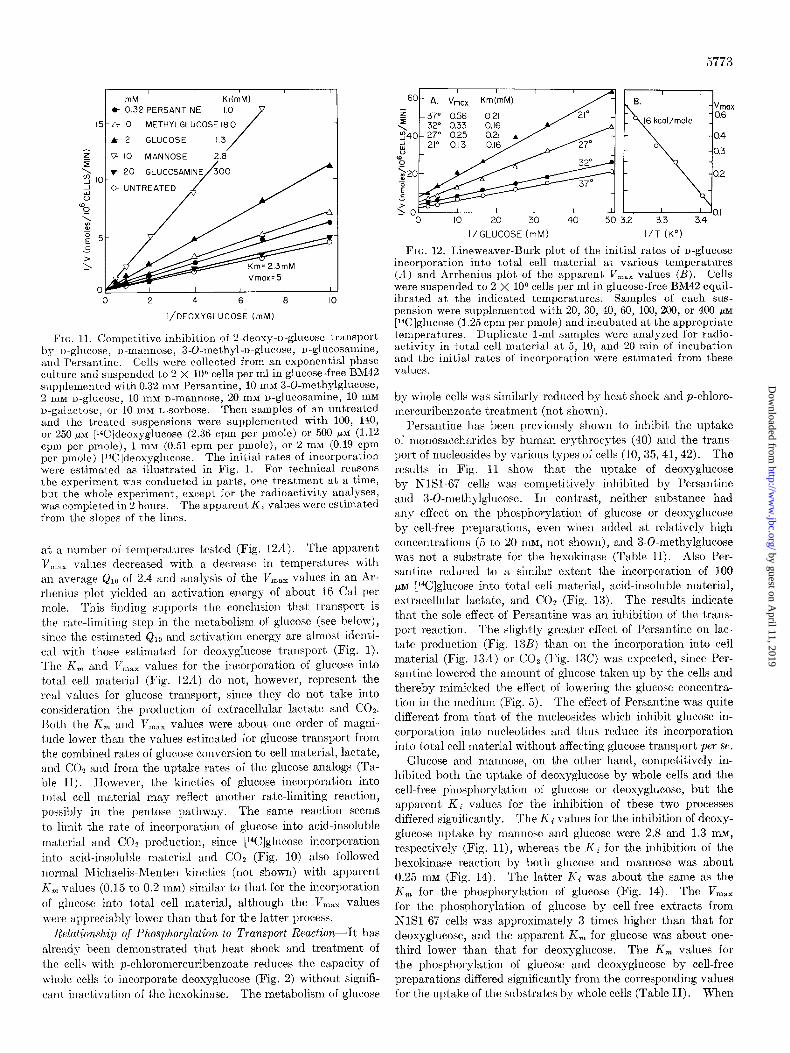
FIG. 11. Competitive inhibition of 2.deoxy-D-glucose transport by D-glucose, n-mannose, 3-O-methyl-D-glucose, n-glucosamine, and Persantine. Cells were collected from an exponential phase culture and suspended to 2 x lo6 cells per ml in glucose-free BM42 supplemented with 0.32 rnM Persantine, 10 mM 3-0-methylglucose, 2 rnM D-glucose, 10 rnM o-mannose, 20 mM u-glucosamine, 10 mM u-galactose, or 10 mM L-sorbose. Then samples of an untreated and the treated suspensions were supplemented with 100, 140, or 250 p~ [‘%]deoxyglucose (2.36 cpm per pmole) or 500 /IM (1.12 cprn per pmole), 1 rnM (0.51 cpm per pmole), or 2 mM (0.19 cpm per pmole) [‘“C]deoxyglucose. The initial rates of incorporation were estimated as illustrated in Fig. 1. For technical reasons the experiment was conducted in parts, one Qeatment at a time, but the whole experiment, except for the radioactivity analyses, was completed in 2 hours. The apparent Ki values were estimated from the slopes of the lines.
at a number of temperatures tested (Fig. 12A). The apparent V,,,,, values decreased with a decrease in temperatures with an average & of 2.4 and analysis of the li,,, values in an Ar- rhenius plot yielded an activation energy of about 16 Cal per mole. This finding supports the conclusion that transport is the rate-limiting step in the metabolism of glucose (see below), since the estimated Q10 and activation energy are almost identi- cal with those estimated for deoxyglucose transport (Fig. 1). The K, and V,,,, values for the incorporation of glucose into total cell material (Fig. 12A) do not, however, represent the real values for glucose transport, since they do not take into consideration the production of extracellular lactate and COz. Both the K, and V,,, values were about one order of magni- tude lower than the values estimated for glucose transport from the combined rates of glucose conversion to cell material, lactate, and COz and from the uptake rates of the glucose analogs (Ta- ble II). However, the kinetics of glucose incorporation into total cell material may reflect another rate-limiting reaction, possibly in the pentose pathway. The same reaction seems to limit the rate of incorporation of glucose into acid-insoluble
material and COz production, since [14C]glucose incorporation into acid-insoluble material and CO? (Fig. 10) also followed normal Michaelis-Menten kinetics (not shown) with apparent K, values (0.15 to 0.2 mM) similar to that for the incorporation of glucose into total cell material, although the V,,, values were appreciably lower than that for the latter process.
Relationship of Phosphorylation to Transport Reaction-It has
already been demonstrated that heat shock and treatment of the cells with p-chloromercuribenzoate reduces the capacity of whole cells to incorporate deoxyglucose (Fig. 2) without signifi- cant inactivation of the hexokinase. The metabolism of glucose
I I I ,
60 A. Vmax Km(mM)
0 IO 20 30 40 50
Vmax 0.6
- 3.3
I /GLUCOSE (mM) I/T (K”)
FIG. 12. Lineweaver-Burk plot of the init,ial rates of D-glucose incorporation into total cell material at various temperatures (A) and Arrhenius plot of the apparent V,,, values (B). Cells were suspended to 2 X lo6 cells per ml in glucose-free BM42 equil- ibrated at the indicated temperatures. Samples of each sus- pension were supplemented with 20, 30, 40, 60, 100, 200, or 400 pM [14C]glucose (1.25 cpm per pmole) and incubated at the appropriate temperatures. Duplicate l-ml samples were analyzed for radio- activity in total cell material at 5, 10, and 20 min of incubation and the initial rates of incorporation were estimated from these values.
by whole cells was similarly reduced by heat shock and p-chloro- mercuribenzoate treatment (not shown).
Persantine has been previously shown to inhibit the uptake of monosaccharides by human erythrocytes (40) and the trans- port of nucleosides by various types of cells (10,35, 41,42). The results in Fig. 11 show that the uptake of deoxyglucose by NlSl-67 cells was competitively inhibited by Persantine and 3-0-methylglucose. In contrast, neither substance had any effect on the phosphorylation of glucose or deoxyglucose by cell-free preparations, even when added at relatively high concentrations (5 to 20 InM, not shown), and 3-O-methylglucose was not a substrate for the hesokinase (Table II). Also Per- santine reduced to a similar extent the incorporation of 100 pM [14C]glucose into total cell material, acid-insoluble material, extracellular lactate, and CO2 (Fig. 13). The results indicate that the sole effect of Persantine was an inhibition of the trans- port reaction. The slightly greater effect of Persantine on lar- tate production (Fig. 13B) than on the incorporation into cell material (Fig. 13A) or COz (Fig. 13C) was expected, since Per- santine lowered the amount of glucose taken up by the cells and thereby mimicked the effect of lowering the glucose concentra- tion in the medium (Fig. 5). The effect of Persantine was quite different from that of the nucleosides which inhibit glucose in- corporation into nucleotides and thus reduce its incorporation into total cell material without affecting glucose transport per se.
Glucose and mannose, on the other hand, competitively in- hibited both the uptake of deoxyglucose by whole cells and the cell-free phosphorylation of glucose or deoxyglucose, but the apparent Kc values for the inhibition of these two processes differed significantly. The Ki values for the inhibition of deoxy- glucose uptake by mannose and glucose were 2.8 and 1.3 InM,
respectively (Fig. ll), whereas the Ki for the inhibition of the hexokinase reaction by both glucose and mannose was about 0.25 mu (Fig. 14). The latter Kc was about the same as the K, for the phosphorylation of glucose (Fig. 14). The V,,, for the phosphorylation of glucose by cell-free extracts from NlSl-67 cells was approximately 3 times higher than that for deoxyglucose, and the apparent K, for glucose was about one- third lower than that for deoxyglucose. The K, values for the phosphorylation of glucose and deoxyglucose by cell-free preparations differed significantly from the corresponding values for the uptake of the substrates by whole cells (Table II). When
by guest on April 11, 2019
http://ww
w.jbc.org/
Dow
nloaded from
IO-
.5
I 0 0 TIMEo.lINl
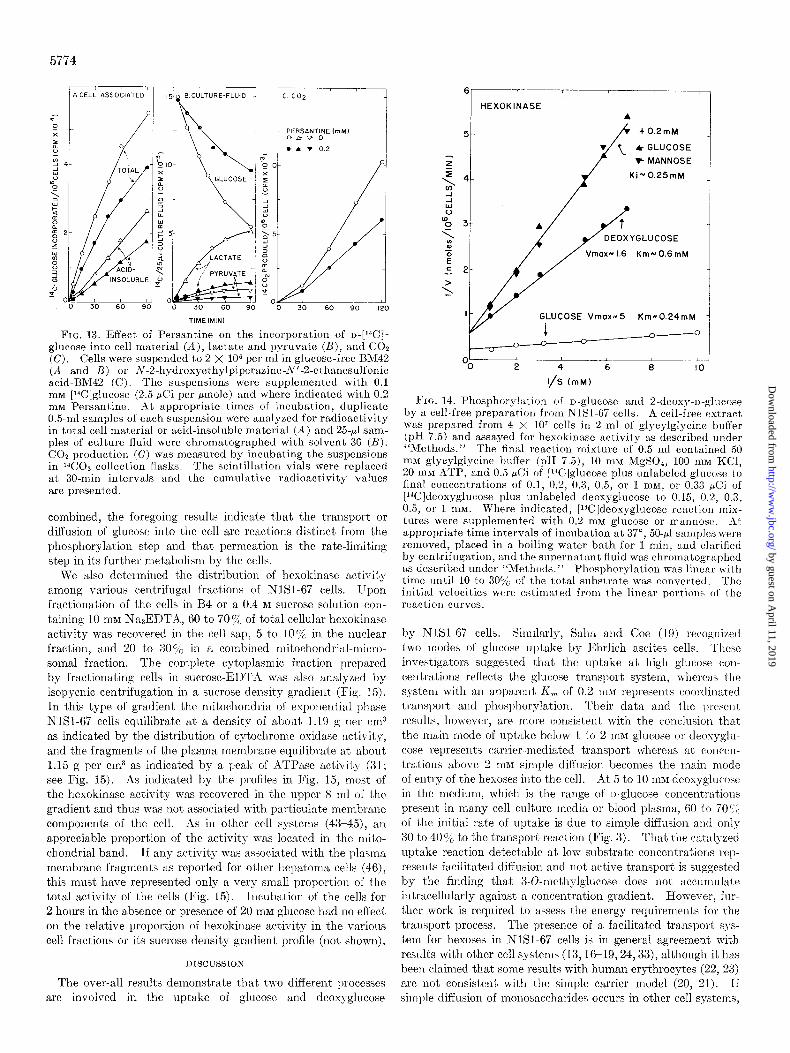
FIG. 13. Effect of Persantine on the incorporation of u-[14C]- glucose into cell material (A), lactate and pyruvate (B), and COn (C). Cells were sllspended to 2 X lo6 per ml in glucose-free BM42 (A and B) or .\r-2.hydroxyethylpiperazine-N’-2.ethanesulfonic acid-BM42 (C). The suspensions were supplemented with 0.1 rnM [l%]glucose (2.5 PC1 per bmole) and where indicated with 0.2 rnM Persantine. At appropriate times of incubation, duplicate 0.5-ml samples of each suspension were analyzed for radioactivity in total cell material or acid-insoluble material (A) and 25-J sam- ples of culture fluid were chromatographed with solvent 36 (LI). COz production (C) was measured by incubating the suspensions in IGO% collection flasks. The scintillation vials were replaced at 30.min intervals and the cumulative radioactivity values are presented.
combined, the foregoing results indicate that the transport or diffusion of glucose into the cell are reactions distinct from the phosphorylation step and that permeation is the rate-limiting
step in its further metabolism by the cells. We also determined the distribution of hexokinase activity
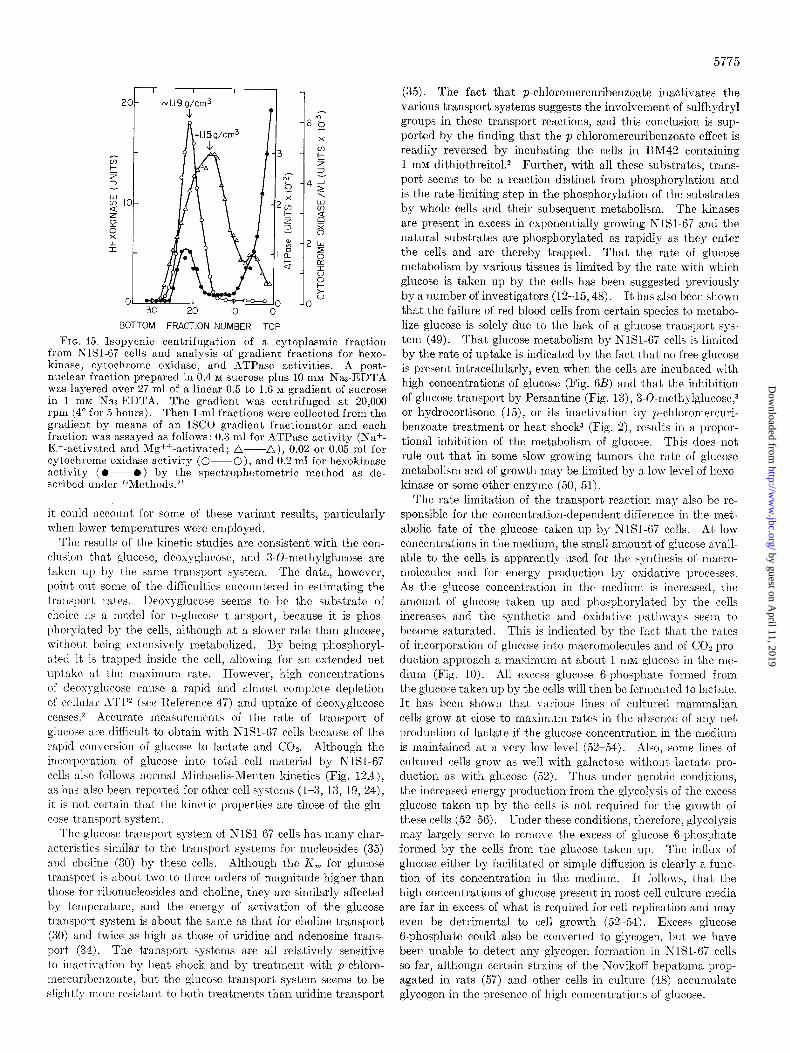
among various centrifugal fractions of NlSl-67 cells. Upon fractionation of the cells in R4 or a 0.4 RI sucrose solution cor- taining 10 IDM NasEDTA, 60 to 7OG/; of total cellular hexokinase activity was recovered in the cell sap, 5 to 1Ou/G in the nuclear fraction, and 20 to 30% in a combined mitochondria-rnicro- somal fraction. The complete cytoplasmic fraction prepared by fractionating cells in sucrose-El>TA was also analyzed by isopycnic centrifugation in a sucrose density gradient (Fig. 15). In this type of gradient the mitochondria of exponential phase NISI-67 cells equilibrate at a density of about 1.19 g per cm3 as indicated by the distribution of cytochrome osidase activity, and the fragments of the plasma membrane equilibrate at about 1.15 g per cm3 as indicated by a peak of ATPase activity (31; see Fig. 15). As indicated by the profiles in Fig. 15, most of the hexokinase activity was recovered in the upper 8 ml of the gradient and thus was not associated with particulate membrane components of the cell. As in other cell systems (43-45), an appreciable proportion of the activity was located in the mito- chondrial band. If any activity was associated with the plasma membrane fragments as reported for other hepatoma cells (46), this must have represented only a very small proportion of the total activity of the cells (Fig. 15). Incubation of the cells for 2 hours in the absence or presence of 20 InM glucose had no effect on the relative proportion of hexokinase activity in the various cell fractions or its sucrose density T gradient profile (not shown).
DISCUSSION
The over-all results demonstrate that tn-o different processes are involved in the uptake of glucose and deoxyglucose
DEOXYGLUCOSE
Km*O.GmM
GLUCOSE Vmoxd5 Km-0.24mM
OL--..L--- 0 2 4 6 6 IC
I/S ImM)
F’ro. 14. Phosphorylation of o-glucose and 2.deoxy-n-glucose by a cell-free preparation from NlSl-67 cells. A cell-free extract was prepared from 4 X lo7 cells in 2 ml of glycylglycine buffer (pH 7.5) and assayed for hexokinttse activity as described under “Methods.” The final reaction mixture of 0.5 ml contained 50 mM glycylglycine buffer (pH 7.5), 10 IBM NIgS04, 100 mM KCl, 20 mM ATP, and 0.5 &i of [‘4C]glucose plus unlabeled glucose to final concentrations of 0.1, 0.2, 0.3, 0.5, or I mnq or 0.33 PCi of [Wldeoxyglucose plus unlabeled deoxyglucose to 0.15, 0.2, 0.3, 0.5, or 1 mM. Where indicated, [l%?]deoxyglucose reaction mix- tures were supplemented with 0.2 m&I glucose or mannose. At appropriate time intervals of incubation at 37”, 50.~1 samples were removed, placed in a boiling water bath for 1 min, and clarified by centrifugation, and the supernatunt fluid was chromatographcd as described under “Mcthotls.” Phosphorylation was linear with time until 10 to 30y0 of the tot,al substrate was converted. The initial velocities were cstimaled from the linear portions of the reaction curves.
by NISI-67 cells. Similarly, 81~11:~ and Coe (19) recogtlized two modes of glucose uptake by Ehrlich ascites cells. ‘I’hese investigators suggested that the upt’ake at high glucose con- centrations reflects the glucose transport system, whereas the system with an apparent k’, of 0.2 nihl represents coordi~~nted transport and phosphorylatioll. ‘l’heir data and the In’esent results, however, are more consistent with the conclusion that the main mode ol uptake below 1 to 2 mM glucose or deosygh- case representIs carrier-mediated transport whereas at concetl- trations above 2 mM simple diffusion becomes the main mode of entry of the hexoses into the cell. At 5 to 10 mar deosyglurose in the medium, which is the range of I)-glucose concentratious present in many cell culture media or blood plasma, 60 to 70:; of the initial rate of uptake is due to simple diffusion and 011ly 30 to 40% to the transport reaction (Fig. 3). That the catalyzed uptake reaction detectable at low substrate concentrations rep- resents facilitated diffusion and not active transport is suggested by the finding that 3-O-methylglucose does not accumulate intracellularly against a concentratiou gradient. However, fur- ther work is required to assess the energy requirements for the transport process. The presence of a facilitated transport sys- tern for hesoses in NISI-67 cells is in general agreement with results with other cell systems (13,16-19,24,33), although it has been claimed that some results wit,11 human erythrocytes (22, 23) are not consistent with the simple carrier model (20, 21). If sirnl)le diffusion of monosaccharides occurs in other cell systems,
by guest on April 11, 2019
http://ww
w.jbc.org/
Dow
nloaded from
5775
BOTTOM FRACT!ON NUMBER TOP
FIG. 15. Isopycnic centrifugation of a cytoplasmic fraction from KlSM7 cells and analysis of gradient fractions for hexo- kinase, cytochrome oxidase, and ATPase activities. A post- nuclear fraction prepared in 0.4 M sucrose plus 10 mM Nas-EDTA was layered over 27 ml of a linear 0.5 to 1.6 M gradient of sucrose in 1 mnf NaJ-EDTA. The gradient was centrifuged at 20,000 rpm (4’ for 5 hours). Then l-ml fractions were collected from the gradient hy means of an ISCO gradient fractionator and each fraction was assayed as follows : 0.3 ml for ATPase activity (Na+- Kf-activated and Mg++ -activated; a---A), 0.02 or 0.05 ml for cytochrome oxidase activity (O---O), and 0.2 ml for hexokinase activity (O--O) by the spectrophotometric method as de- scribed under “Methods.”
it could account for some of these variant results, particularly when lower temperatures were employed.
The results of the kinetic studies are consistent with the con- clusioll that glucose, deosyglucose, and N-0-methylglucose are taken up by the same transport system. The data, however, point out some of the difficulties encountered in estimating the transport rates. Drosyglucose seems to be the substrate of choice as a model for I)-glucose t ansport’, because it is phos- phoryluted by the cells, although at a slower rate than glucose, without being extensively metabolized. By being phosphoryl- ated it is trapped inside the cell, allowing for an extended net uptake at the maximum rate. However, high concentrations of dcosyglucose cause a rapid and almost complete depletion of cellular L1TP2 (see Reference 47) and uptake of deoxyglucose ceases.2 Accurate measurements of the rate of transport of glucose are difficult to obtain with NlSl-67 cells because of the rapid conversion of glucose to la&ate and COZ. Although the incorporation of glucose into total cell material by NlSl-67 cells also follows normal Michaelis-hlenten kinetics (Fig. 12A), as has also been reported for other cell systems (l-3, 13, 19, 24), it is not certain that, the kinet,ic properties are those of the glu- cose transport system.
The glucose transport system of NlSl-67 cells has many char- acteristics similar to the transport systems for nucleosides (35) and choline (30) by these cells. Although the K, for glucose transport is about two to three orders of magnitude higher than those for ribonucleosides and choline, they are similarly affected by temperature, and the energy of activation of the glucose transport system is about the same as that for choline transport (30) and twice as high as those of uridine and adenosine trans- port (34). The transport systems are all relatively sensitive to inac,tivation by heat shock rend by treatment with p-chloro- Jilrrcllriheilzoate, but the glucose transport system seems to be slightly more resistant to both treatments than uridine transport
(35). The fact that p-chloromercuribenzoate inactivates the various transport systems suggests the involvement of sulfhydryl groups in these transport reactions, and this conclusion is sup- ported by the finding that the p-chloromercuribenzoate effect is readily reversed by incubating the cells in Bh/142 containing 1 mM dithiothreitol.2 Further, with all these substrates, trans- port seems to be a reaction distinct from phosphorylation and is the rate-limiting step in the phosphorylation of the substrates by whole cells and their subsequent metabolism. The kinases are present in excess in exponentially growing NlSl-67 and the natural substrates are phosphorylated as rapidly as they enter the cells and are thereby trapped. That the rate of glucose metabolism by various tissues is limited by the rate with which glucose is taken up by the cells has been suggested previously by a number of investigators (12-15,48). It has also been shown
that the failure of red blood cells from certain species to metabo- lize glucose is solely due to the lack of a glucose transport sys- tem (49). That glucose metabolism by NlSl-67 cells is limited by the rate of uptake is indicated by the fact that no free glucose is present intracellularly, even when the cells are incubated with high concentrations of glucose (Fig. 6B) and that the inllibition of glucose transport by Persantine (Fig. 13), 3-O-methylglucose, or hydrocortisone (15)) or its inactivation by p-chloromercuri- benzoate treatment or heat shock3 (Fig. 2), results in a propor- tional inhibition of the metabolism of glucose. This does not rule out that in some slow growing tumors the rate of glucose metabolism and of growth may be limited by a low level of heso- kinase or some other enzyme (50, 51).
The rate limitation of the transport reaction may also be re- sponsible for the concentration-dependent difference in the met- abolic fate of the glucose taken up by NlSl-67 cells. At low concentrations in the medium, the small amount of glucose avail- able to the cells is apparently used for the synthesis of macro- molecules and for energy production by osidative processes. As the glucose concentration in the medium is increased, the amount of glucose taken up and phosphorylated by the cells increases and the synthetic and osidative pathways seem to become saturated. This is indicated by the fact’ that the rates of incorporation of glucose into macromolecules and of CO2 pro- duction approach a maximum at about 1 nlM glucose in the me- dium (Fig. 10). All excess glucose B-phosphate formed from the glucose taken up by the cells will then be fermented to lactate. It has been shown that various lines of cultured mammalian cells grow at close to maximum rates in the absence of any net production of lactate if the glucose concentration in the medium is maintained at a very low level (52-54). Also, some lines of cultured cells grow as well with galactose without lactate pro- duction as with glucose (52). Thus under aerobic conditions, the increased energy production from the glycolysis of the excess glucose taken up by the cells is not required for the gro&h of these cells (52-56). Under these conditions, t’herefore, glycolysis may largely serve to remove the excess of glucose 6-phosphate formed by the cells from the glucose taken up. The influx of glucose either by facilitated or simple diffusion is clearly a func- tion of its concentration in the medium. It follows, that the high concentrations of glucose present in most cell culture media are far in excess of what is required for cell replication and may even be detrimental to cell growth (52-54). Excess glucose 6-phosphate could also be converted to glycogen, but we have been unable to detect any glycogen formation in KlSl-67 cells so far, although certain strains of the Novikoff hepatoma prop- agated in rats (57) and other cells in culture (48) accumulate glycogen in the presence of high concentrations of glucose.
by guest on April 11, 2019
http://ww
w.jbc.org/
Dow
nloaded from
5776
At low concentrations of glucose in the medium, cell growth may be limited by the rate with which glucose is transported into the cells. In this respect, mammalian cells may behave in the same manner as yeast (58). An increased capacity to take up glucose may be essential for the growth potential of tumor cells (l-4) or phytohemagglutinin-stimulated lympho- cytes (6).
It has been suggested (46) that the ability of rapidly growing rat tumors to utilize glucose efficiently and their high rate of glycolysis is related to the presence of hexokinase in their plasma membrane and its involvement in glucose transport since hexo- kinase activity is absent from rat liver plasma membranes. The
present results do not support this hypothesis. Glucose trans- port is clearly a process distinct from phosphorylation and if some hexokinase of NlSl-67 cells is associated with the plasma membrane, it represents only a very small proportion of the total activity of the cells (Fig. 15). Our results are more consistent with the view previously expressed by Eagle et al. (52) that the high rate of glycolysis exhibited by many tumor cells at physio logical concentrations of glucose may be simply a consequence of an increased capacity of the tumor cells to transport the sub- strate into the cell.
Acknowledgments--We thank John Erbe, Lynn Scarborough, and Eugene C. Durkin for competent technical assistance.
1.
2. 3.
4.
E: 7.
8.
9.
10.
11. 12. 13.
14.
15.
16.
Ii.
1X.
REFERENCES
H.YTANAKA, M., HEUBNER, R. J., I~ND GILDP:N, It. V. (1969) J. Nat. Cancer Inst. 43, 1091
H.~T~~NAKA, M., .IND H.+.NAFUS.I, H. (1970) Virology 41, 647 H.\T.~N.~K~~, M., GILDEN, R. V., .\ND KELLOFF, G. (1971) Vi-
rology 43, 734 iLIan~~lv, G. S., VENUT.~, S., WEBER, M., .~ND RUBIN, H. (1971)
Proc. kal. Acad. Sci.‘U. S. il. 68, 2739 PETERS. J. H.. .ZND HEUSEN. I?. 11971) Eur. J. Biochem. 19.502 PICTER~; J. 1-r.: .YND ~~~~~~~~~~ P. (1971j Eur. J. Biochem. 19; 509 CUNNINGHAM, I>. D., AND P.\RDI~E, A. B. (1969) Proc. lATat.
dead. Sci. U. S. A. 64, 1049 WEINER, M. J., .\ND RU~IN, H. (1971) J. Cell. Physiol. 77, 157-
167 WEIIER, M. J., .YXD EDLIN, (+. (1071) .I. Bid. Chem. 246, 182%
1833 PL.ZGF:MANN, P. G. W., IND ROTH, M. F. (1969) Biochemistry
8, 4782 PL~~GICMANW, P. G. W. (1971) J. Cell. Physiol. 77, 213 F.\IN, J. N. (1964) J. Biol. Chem. 239, 958-962 CILOFFORD, 0. B., BND RENOLD, A. E. (1965) J. Biol. Chem.
240, 3237-3244 I~OSIZN, J. M., MILHOLLSND, IL. J., ANI) ROSEN, F. (1970) Hio-
Aim. Biophys. Acta 219, 447 PL.~GEMANN, P. G. W., AND RENNJ~:R, 13;. II. (1972) Biochem.
Biophus. Res. Commun. 46, 816 STXIN*, %. D. (1967) The Movement of Molecules across Cell
Membranes. Academic Press. New York CRA~TE. R. K:, FIELD, It. A., .&D CORI, C. F. (1957) J. Bid.
Chem. 224, 649
WJSNNRR, C. (1967) Advan. Enzymol. 29, 321 P.w XONSTANTINOU, J., GOLDBERG, E. B., AND COI,OU;ICK,
S. P. (1961) in Control Mechanisms in Resviration and Fer- mentat>on (WRIGHT, B., ed) p. 243, The R’onald Press Co., New York
KOLBER, A. R., AND LEFEVI~E, P. G. (1967) J. Gen. Physio!. 57. NIG~M, V. N. (1969) Biochem. J. 116, 315-322 60, 1907 58. V.IN UDEN, N. (1967) Arch. Mikrobiol. 68, 155
19.
20. 21.
22. MILLER, D. M. (1968) Biophys. J. 8, 1329 23. MILLER, D. M. (1968) Biophys. J. 8, 1339 24. MMO. J. J., AND RICKENBI~:RG. H. V. (1962) EXD. Cell Res.
25.
26.
27.
28.
29.
30. 31. 32.
33. 34.
35. 36.
37. 38.
39. 40.
41.
42. 43.
44. 45. 46.
47. 48.
49.
50. 51.
52.
53.
54.
55. 56.
Saxi, J., AND COE, E. L. (1967) Biochem. Biophys. Res. Cotn- mun. 26, 441
LIEB, W. R., AND STEIN, W. D. (1970) Biophys. J. 10, 585 LIES, W. R., AND STEIN, W. D. (1971) Nature New Biol. 230,
108-109
27,31-47 ’ ~ I .
RMNNER, E. D., PLAGEMANN, P. G. W., AND BERNLOHR, IL. W. (1971) Fed. Proc. 30, 1116
PLIIGEMANN, 1’. G. W., END SI\~IM, H. E. (1966) J. Bacterial. 91, 2317-2326
W.\RD, G. A., AND PL.IGI:M.~NN, P. G. W. (1969) J. Cell. Physiol. 73, 213-231
PL.LGERIBNN, P. G. W., WAIT, G. A., M.~HY, B. W. J., .OD KORRFXKI, M. (1969) J. Cell. Physiol. 73, 233
TREVELY~UX, W. II:., PROCTIX, 11. P., AND HARRISON, J. H. (1950) Arature 166, 444
PLAGEMANN, P. G. W. (1971) J. Lipid Res. 12, 715 PLIGEMANN, P. G. W. (1968) Arch. Biochem. Biophys. 128, 70 W.\LICER, D. G., AND P.ZRRY, M. J. (1966) Methods Enzymol.
9, 381 SEN, A. K., AND WIDDAS, W. F. (1962) J. Physiol. 160, 392 PLAGEM.IXN, P. G. W. (1970) -4 rch. Riochem. Biophys. 140,223-
249 PL.ZGEMANN, P. G. W. (1971) Biochim. Biophys. Acta 233, 688 REGEN, D. M., AND MORGAN, H. E. (1964) Biochim. Biophys.
Acta 79, 151-166 SC.\RROROUGH, G. A. (1970) J. Bid. Chem. 245, 1694-1698 NISVILLE, M. M., SUSICI~VD, S. 11., AND ROSEMAN, S. (1971)
J. Biol. Chem. 246, 1294 PLAGEM~NN, P. 6. W. (1972) J. Cell. Biol. 62, 131 I)ISUTICI<E, B., DUIIM, J., .UXD GJ~XLBCH, E. (1964) Arch. Ge-
samte Physiol. Menschen Tiere (Pjtuegers) 280, 275 K~~BLI~;R, W., BND BRETSCHXEIDER, H. J. (1964) Arch. Gesamte
Physiol. Menschen Tiere (Pjluegers) 230, 141 SCHOLTISSEI~, C. (1908) Biochim. Biophys. Acta 168, 435-447 ROSE, I. A., I\ND W.\RMS, J. V. B. (1907) J. Biol. Chem. 242,
1635-1645 WILSON, J. E:. (1968) J. Biol. Chem. 243, 3640-3647 S.\I,J%O, M., AND S.zrro, S. (1971) Biochim. Biophys. Ada 227,344 EMMJ,:LOT, P., AND Bos, C. J. (1966) Biochim. Biophys. Acta
121, 434-436 YUSHOIC, W. 11. (1971) J. Viol. Chem. 246, 1007-1617 R.\CKISR, E. (19G5) Mechanisms in Bioenergetics, p. 226, Aca-
demic Press, New York KIM, H. D., AND MCMANIX, T. J. (1971) Biochim. Biophys.
Acta 230, 1 WEINHOUSE, S. (1966) Gann Monogr. 1, 99 F,II~IN.\, F. A., ADELMAN, It. C., Lo, C. H., MORRIS, H. P.,
.\ND WEINHOUSE, S. (1968) Cancer Res. 28, 1897 E.\GLE, H., BARBAN, S., LI~VY, M., .ZND SCHULZE, H. 0. (1958)
J. Biol. Chem. 233, 551 GRAFF, S., MOSI~R, FT., K.~STNXR, O., GR.4FF, A. M., AND T1m-
NI’INUAU~M, M. (1965) J. I\:at. Cancer Inst. 34, 511 AVJ<;EDUNI~, B., AND LISS, IX. (1971) 2. Naturforsch. Teil B
26b, 595
by guest on April 11, 2019
http://ww
w.jbc.org/
Dow
nloaded from
Edward D. Renner, Peter G. W. Plagemann and Robert W. BernlohrMetabolismHepatoma Cells in Suspension Culture and Its Relationship to Glucose
Permeation of Glucose by Simple and Facilitated Diffusion by Novikoff Rat
1972, 247:5765-5776.J. Biol. Chem.
http://www.jbc.org/content/247/18/5765Access the most updated version of this article at
Alerts:
When a correction for this article is posted•
When this article is cited•
to choose from all of JBC's e-mail alertsClick here
http://www.jbc.org/content/247/18/5765.full.html#ref-list-1
This article cites 0 references, 0 of which can be accessed free at
by guest on April 11, 2019
http://ww
w.jbc.org/
Dow
nloaded from