Embed Size (px)
Citation preview
A-I 0028 UTAH UNIV SALT LAKE CITY F/B 6/18EHAVIORAL AND IOLOGICAL EFFECTS OF RESONANT ELECTROMAGNETIC A-ETC(U)NOV 76 0 P 6ANDHI, J A O'ANDREA, M J HAGMANN DAM17-7-C-4092
UNCLASSIFIEO l
"IIIII IIIIIIIIIIIEIIIIIIIIIIIIIIEIIIIIIIEIIIIIIIIIIIIIuIIIIIIIIIIIIIu
PHOTOGRAPH THIS SHEET
LEVEL UTAH UNIV., SALT LAKE CITY INVENTORY
z2 BEHAVIORAL AND BIOLOGICAL EFFECTS OF RESONANT ELECTRC4AGNETIC
ABSORPTION IN RATS. ANNUAL PROGRESS REPT. NO. 2.1974 - 1976.NOV. 76 CONTRACT DAMD17-74-C-4092
DOCUMENT IDENTIFICATION
DISTVRIBU7ION STATEMENT AApproved for public releamel
Distribution Unlimited
DISTRIBUTION STATEMENT
ACCESSION FORNTIS GRAMric TAB DTICUNNOUNCED] E LECTED
JUSTIFICATIONJUN 10 1981
BY DDISTRIBUTION /AVAILABILITY CODESDIST AVAIL AND/OR SPECIAL DATE ACCESSIONED
DISTRIBUTION STAMP
DATE RECEIVED IN DTIC
PHOTOGRAPH THIS SHEET AND RETURN TO DTIC-DDA-2
FORM DOCUMENT PROCESSING SHEETDTIC OCT 79 70A
AD
BEHAVIORAL AND BIOLOGICAL EFFECTS OF RESONANT
ELECTROMAGNETIC ABSORPTION IN RATS
ANNUAL REPORT NO. 2
Om P. Gandhi
John A. D'AndreaMark J. HagmannJames L. LordsKazem Sedigh
November 1976
Supported byU. S. Army Medical Research and Development Command
Washington, D. C. 20314
Contract No. DAMD 17-74-C-4092
University of UtahSalt Lake City, Utah 84112
DDC DISTRIBUTION STATEMENT
Approved for public release; distribution unlimited.
Ihe findings in this report are not to be construed asan official Department of the Army position unless so
designated by other authorized documents.
81 6 05 019
SE I! R1 Y C LASSIFI ' OF TrS P .- A .r, O..e Ent.r.d)
READ INSTRUJCTION.;REPORT DOCUMENTATION PAGE ______B-FORE COMPLETING -FORM
I. R.-Z.r IT - NUMBER Z. GOVT ACCESSiON NO., 3. RECIPI-4T'S CATALOG NJ14-J-
71 TILE S "5 TYPE O REPORT & PERIQO COVERED
Behavioral and Biologica! Effects of Resonant Annual Progress ReoortElectromagnetic Absorption in Rats ]974-1976
6 PE ORm-4, 01G. REPORT NU-ASSA
8 CONTRACTORG.ANTNUI's-)
Om P. Gandhi, John A. D'Andrea, Mark J. Hagmann, DAND 17-74-C-4092James L. Lords, Kazem Sedigh
9. PERFCRMING ORSANZATION NAME AND AOOR SS 10. PROGAAM ELEMEtT. PROJECT. TASKAREA , WORK UNIT NU4SERS
University of Utah 62758A
Salt Lake City, Utah 84112 3A762758A824.02.012
11. CONTROLLING OFFICE NAME AND AODRESS 12. REPORT DATE
U.S. Army Medical Research and Development November 1976Command, Washington, D. C. 20314 13. NUMBER OF PAGES146
14. MONITORING AGENCY NAME & AOORESS(If diferent irom Controllinj Office) 15. SECURITY CLASS. (at thl report)
Unclassified
13s. DECL ASSIFICATION/ DOWNGRADINGSCHEDULE
16. DISTRIBUTION STATEMENT (of this Report)
Approved for public release; distribution unlimited.
17. DISTRIBUTION STATEMENT (o the abstract entored In Block 20, it dlffrent from Re.port)
IS. SUPPLEMENTARY NOTES
19. KEY WORDS (Contiu. on reverse aide it nece --ary and Identify by block number)
Electromagnetic deposition and its distribution for man, free space irradia-tion, ground and reflector effects, peak absorption frequencies, simulationof man for 23-550 MHz, biological phantom materials to simulate tissueproperties, monopole-above-ground radiation chamber, design of a waveguideslot array for constant radiation intensity, behavioral experiments with
23. A BTRACT (Conlinue on roevr,, side If nec.*ary rnd Identify by block number)
Past experiments of this project utilizing three separate and distinct
radiation facilities have determined the uhole body and distribution within
the body of resonant electromagnetic power absorption for both man models and
laboratory rodents. The absorption of such energy is reliably determined by
both the frequency of radiation and the orientation of the model or rodent in
electromagnetic energy fields. For an ungrounded 1.75 m tall man, power
absorption has been determined for E L, using scaled-down models, for the 23
to 570 MHIz band with resonant power absorption at 62-68 11Fz. Power absorntin
D AN 73 1473 EDITION O' 1 H' 5 : 0OSOLETES./NSECURITY CLASSIFICATION OF T.. .. PACE (W•n Date Ente
4 C ,_oj ,:s jC**.0 -
19. (continued)
laboratory rats, time to work stoppage at different frequencies.
20. (continued)
for the laboratory rat has been determined fo_ the 300-800 MHz band withresonant absorption being at: 600 NHI for the Eli L orientation. At re:-pectiveresonance fre:,uencies in the E' L o;erntation for both man and laboratoryrodent, maximum power absorption is found in the neck region of the body.For a grounded 1.75 m tall man, the resonance region shifts to approximatelyone-half the free sDace resonance or 30-34 !Hz. Man models or laboratoryrats placed in proximity of metallic reflecting surfaces experience con-siderably enhanced electromagnetic energy depositions. Behavioral experi-ments with laboratory rats have shown that frequency of radiation and animalorientation in the fields are highly significant parameters in determiaingelectromagnetic energy absorption and consequential disruption of behavioralperformance.
ST
FOREiORD
In conduct . the research described ini this report, the in-
vestigators adhered to the "Guide of laboratory Animual Facilities
and Care" as promulgated by the Committee on the Guide for Laboratory
Animal Resources, National Academy of Sciences, National Research
Council.
I i
TABIL' OF CON'iNTS
Page
Foreword .i .........
List of Figures and Tables........ ...... . .. .. .. .. . . ...
Abstract ..................... . . . ... . .. .. .. .. .. ... 1
Objective ............. ............... 2
Highlights of the Work Done During the Last Year. .... .... 2
Papers Published or Presented, Meetings Attended. ......... 53
Papers in Preparation . ..................... 54
References .. .......................... 56
Appendix A: "Biological Phantom Materials for Simulating Man
at Different Frequencies"
Appendix B: "Distribution of Electromagnetic Energy Deposi-tion in Moe~els of Man with Frequencies NearResonnne"
Apptendix C: "Electromagnetic Power Deposition in Man andAnimnals with and without Grcund and ReflectorEffects"
Appendix D: "Radiatocs for Microwave Biologic.01-1:,Research -- Waveguide Slot Ai i ~ i., nRadiation Intensirv@"
Appendix E: "Upper -~ .I ,z for Moment-Method Solu-t i . I Scatterers"
A, 'io.. dures for Improving Convergence of Moment-Method Solutions in Electromagnetics"
Appendix G: "Behavioral Effects of Resonant ElectromagneticPower Absorption in Rats"
L T OF FTCTIF S A,'L i .LIS
SFigure Pa
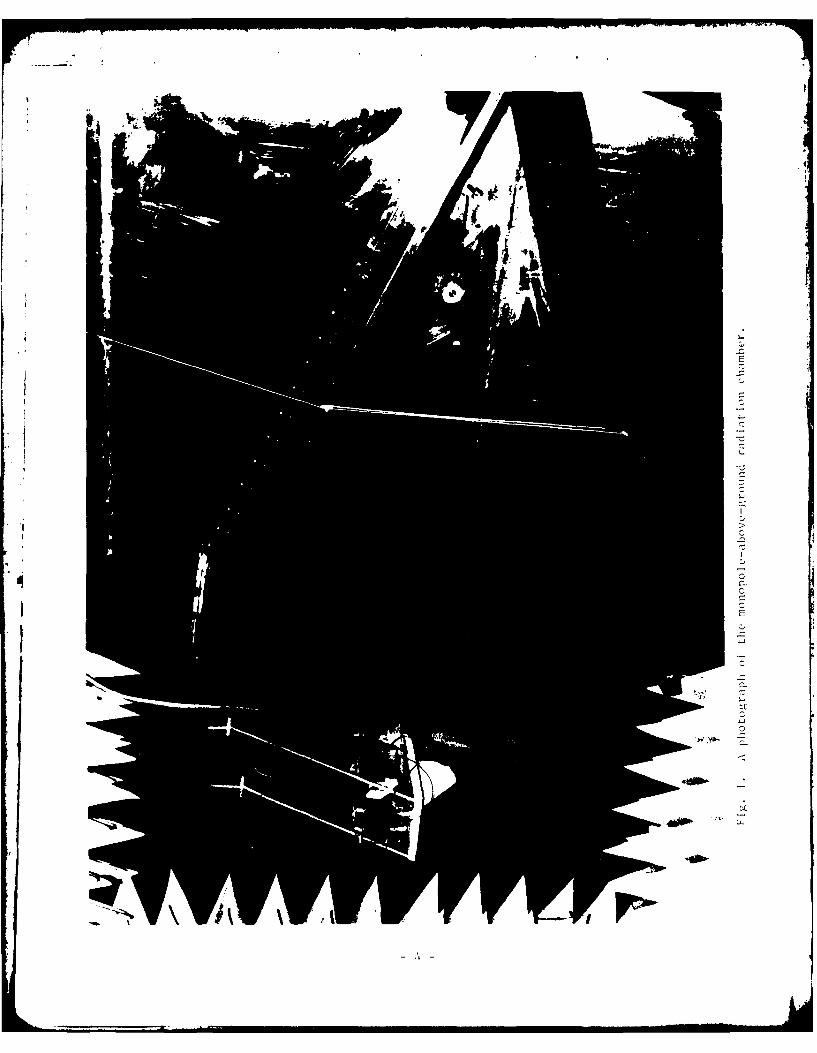
1 A photograiph of the monopole-above-gruund radiationchamber . . . . . . . . . . . . . . . . . . . . . . . . 4
2 Calculated pattcrn of a uionopole-abov=--;round radiatorin a 45' corner reflector for h/X = 0.23, d/X = 0.675 . 7
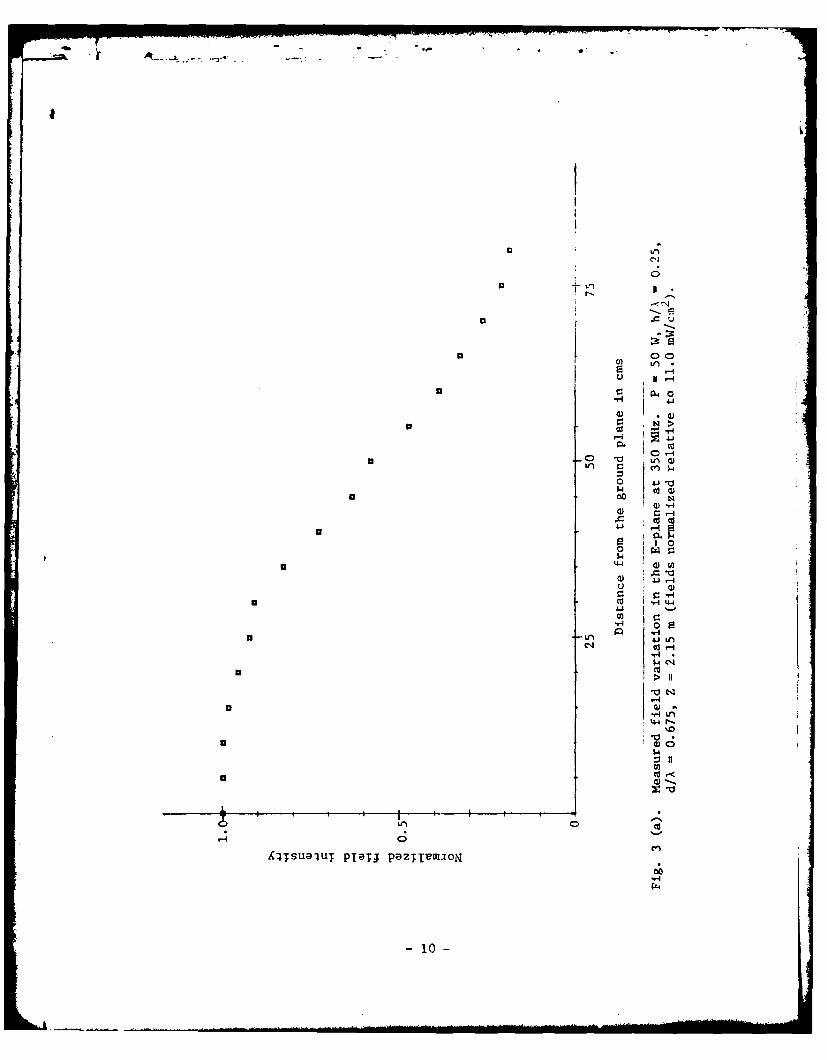
3 (a) Measured field variation in the E-plane at 350 MHz.P = 50 W, h/A = 0.25, d/X = 0.675, Z = 2.15 m(fields normalized relative to 11.0 mW/cm 2 ) . . . .
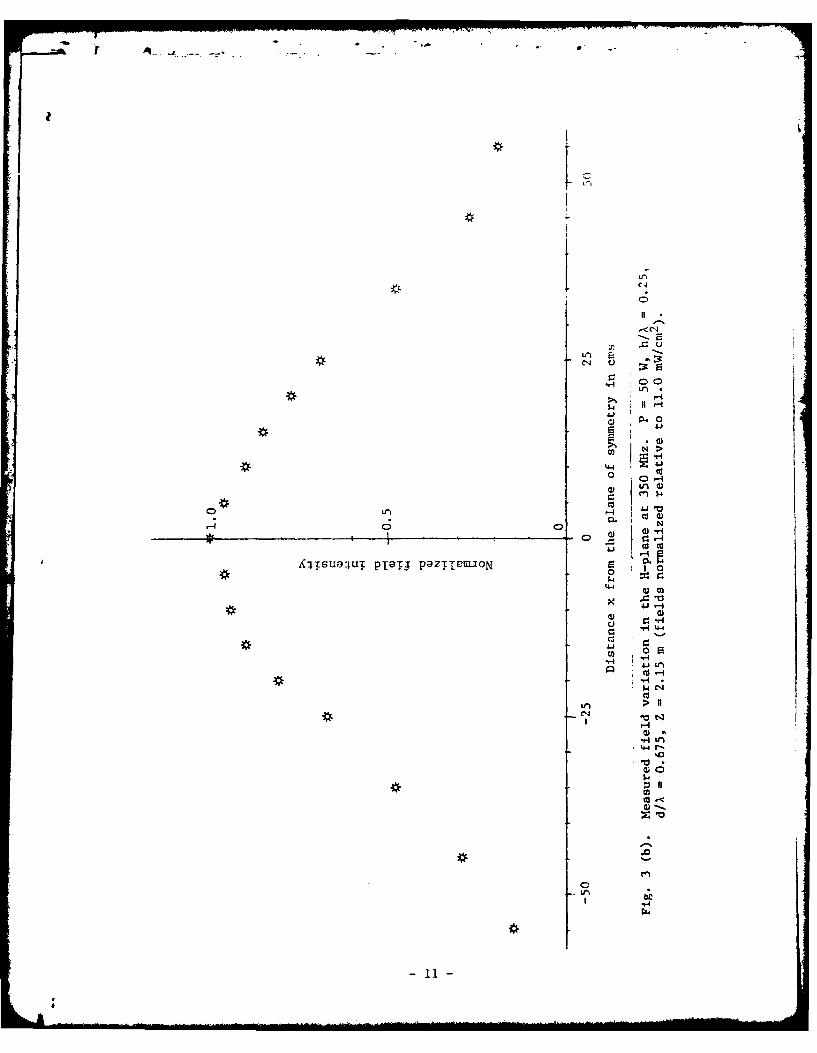
(b) Measured field variation in the H-plane :rP = 50 W, h/X = 0.25, d/X = 0.67.(fields normalized relative. to . . .
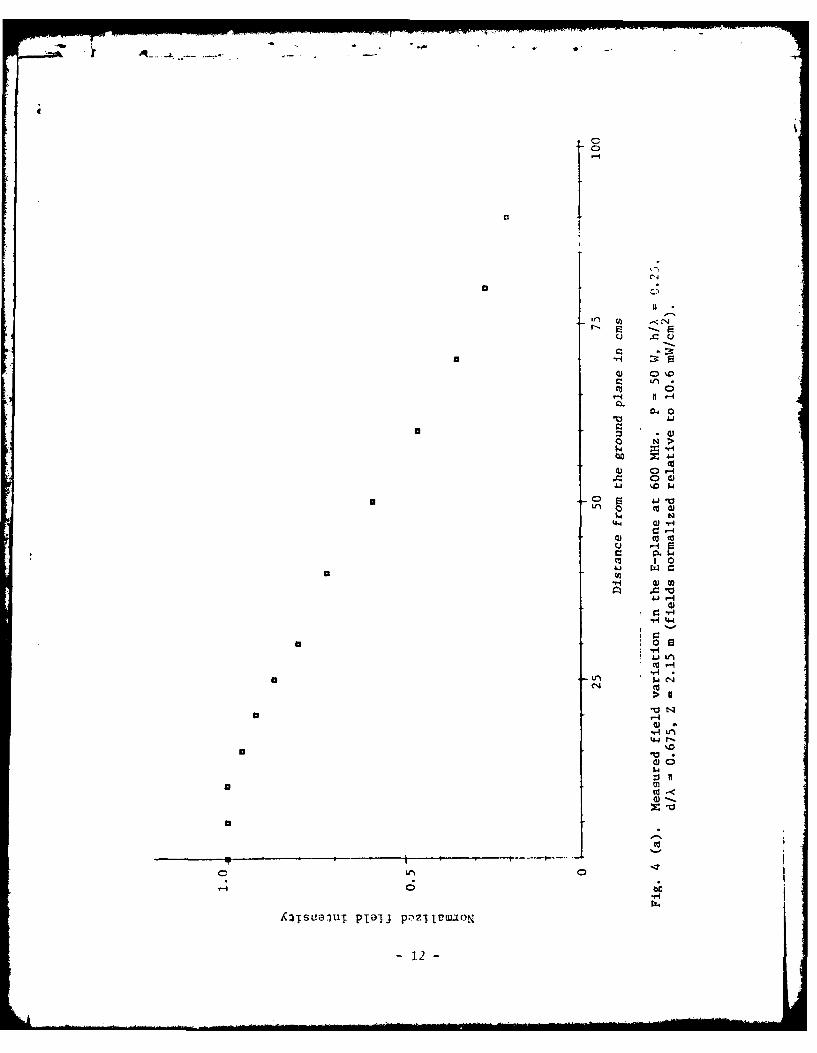
4 (a) Measured field v.;, ... . t. t.-plane at 600 MHz.P = %0 W. 1 0.-. d,'A 0.675, Z = 2.15 m( , ' ;. . ized relative to 10.6 mW/cm 2 ) . . . . 12
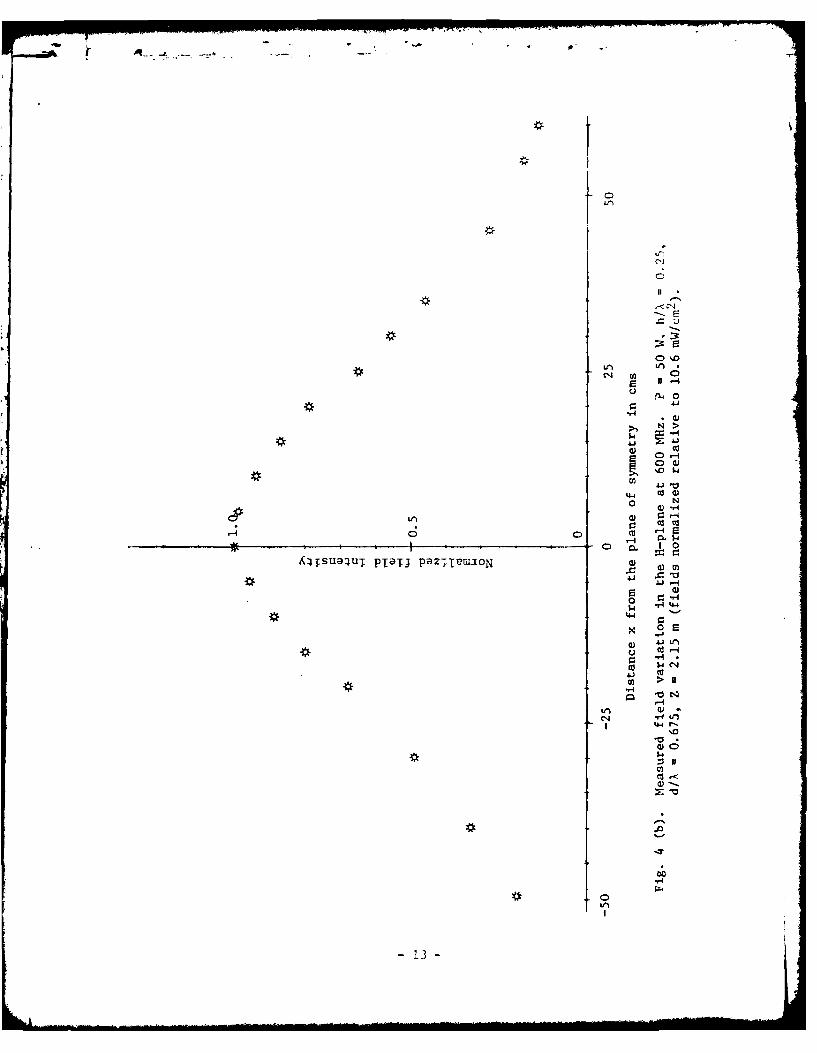
*', Maured field variation in the H-plane at 600 MHz.P - 50 W, h/X = 0.25, d/X = 0.675, Z = 2.15 m
(fields normalized relative to 10.6 mW/cm 2 ) . . . . 13
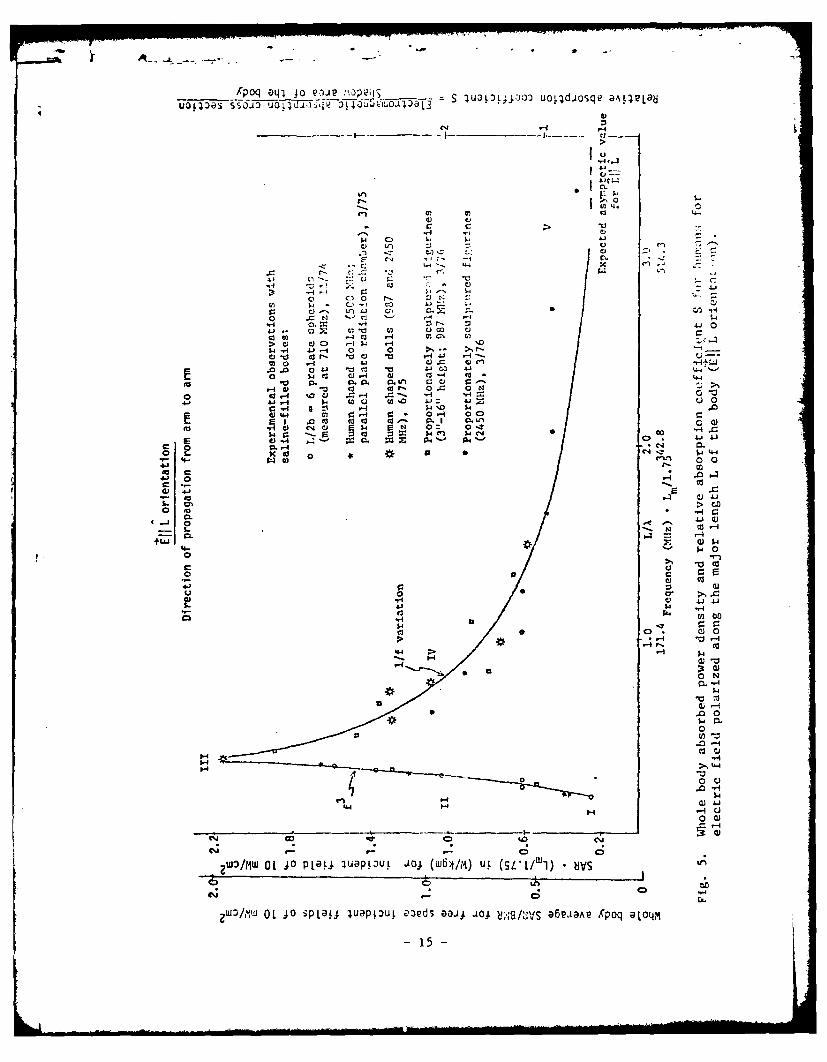
5 Whole body absorbed power density and relative absorp-tion coefficient S for humans for electric field-polarized along the major length L of the body (El L
orientation) ........ ..................... ... 15
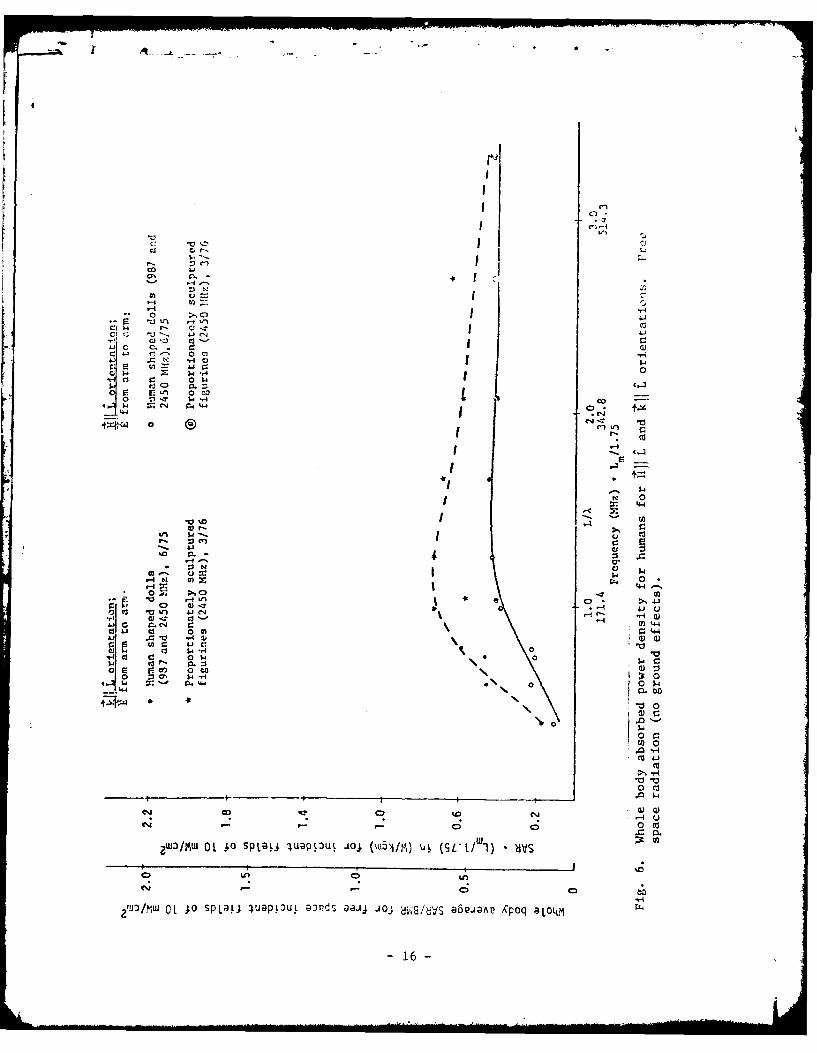
6 Whole body absorbed power density for humans for Land kjj L orientations. Free space radiation (noground effects) ........ .................... ... 16
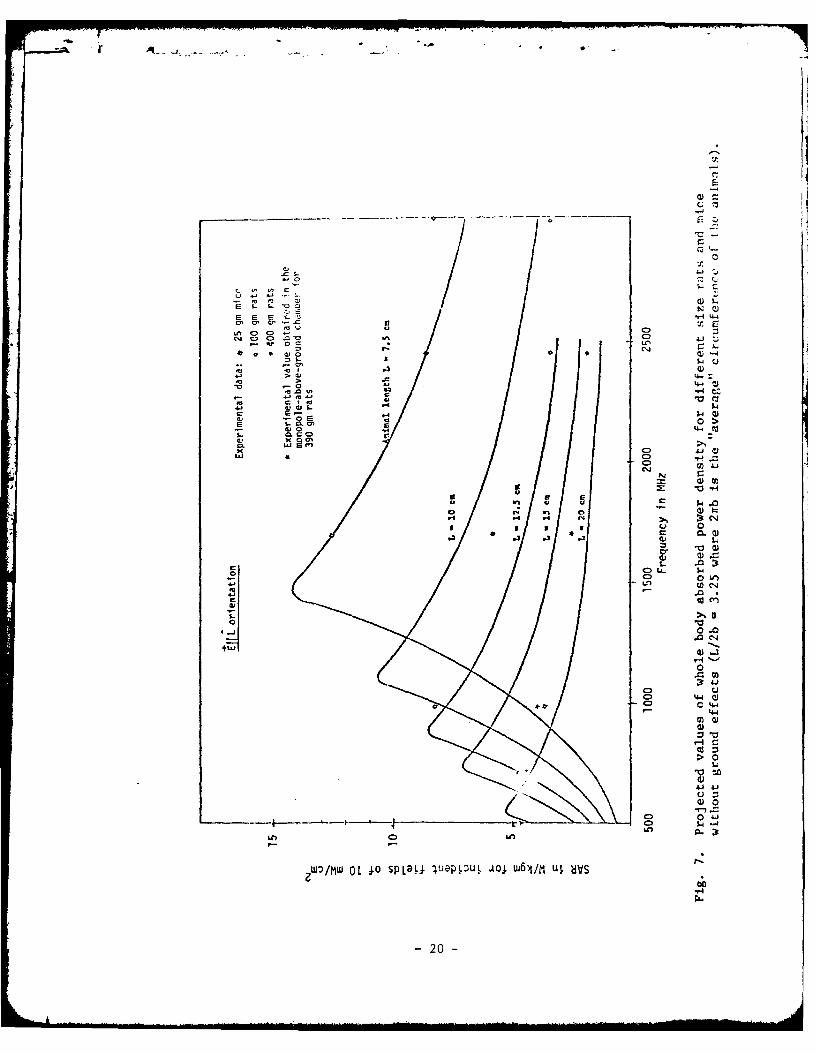
7 Projected values of whole body absorbed power densityfor different size rats and mice without ground effects(L/2b = 3.25 where 21Tb is the "average" circumferenceof the animals) ........ .................... ... 20
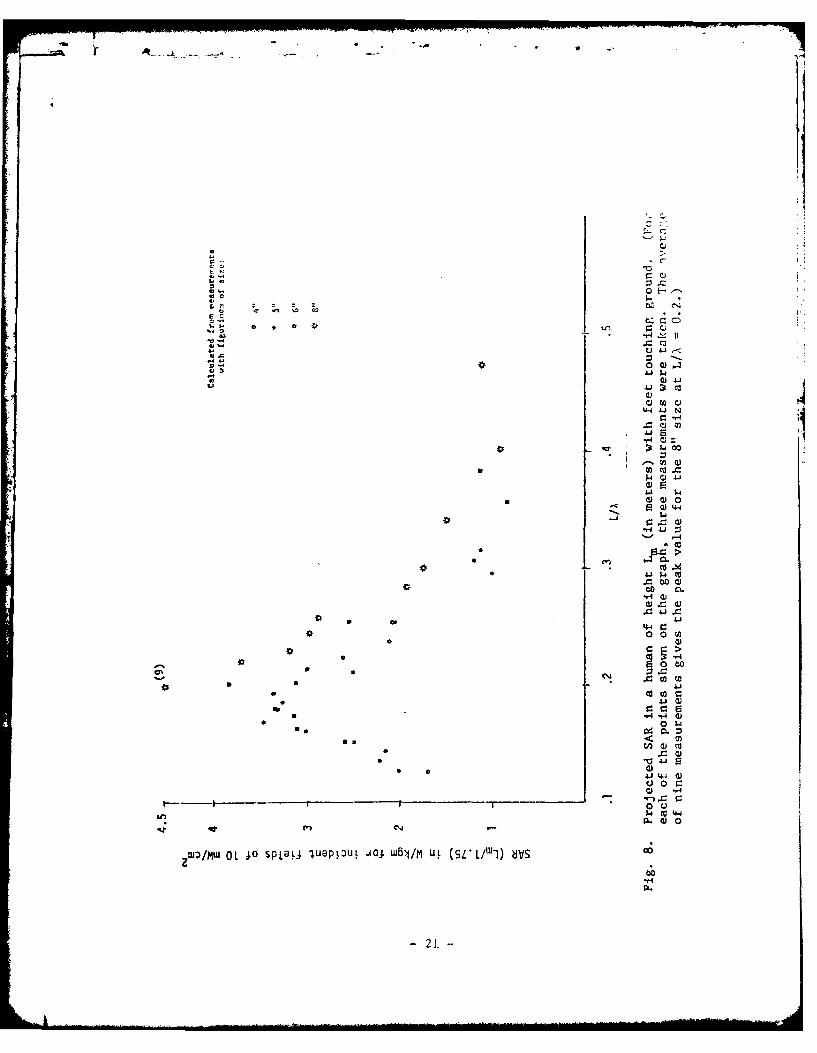
8 Projected SAR In a human of height Lm (in meters) with
feet touching ground. (For each of the points shown onthe graph, three measurements were taken. The averageof nine meaqurements gives the peak value for the 8"
size at L/X = 0.2.) ....... ..... ............. 21
9 Time to convulsion of 400 gm rats for 10 and 20 mW/cm2
incident fields at different frequencies. (Animalsplact-d d = 0.!, X from a 90* corner of reflecting sur-
faces.) .......... ........................ ... 27
- iv -
Figure 1> -..e
]C) Ti: , .'WJ r$./.r 2
[~ . .- ' . . . . . . . . . . . 2
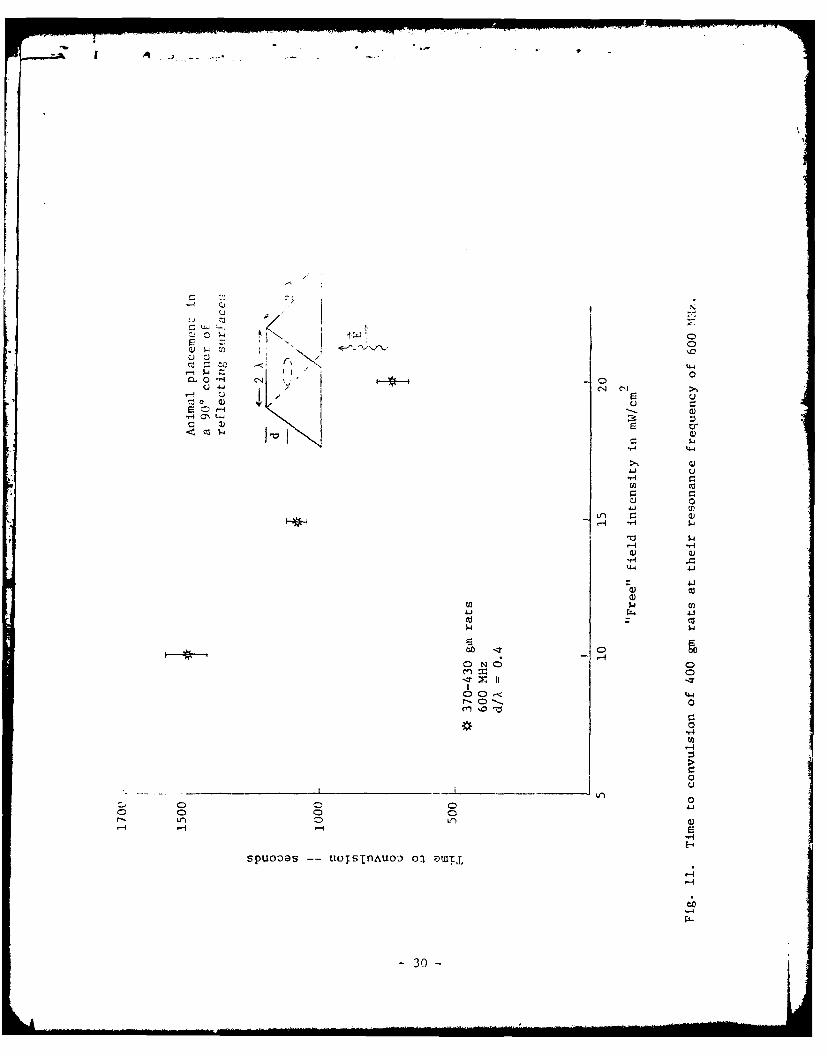
S-, gi raLs 0 t ther res,:.nce
.' . . . . . . . . . . . . . . . . 30
I. Photographs of LS'o r~r ho!Ibrs that should be "rela-
tively transparent" to micro aves of El L polarization. 37
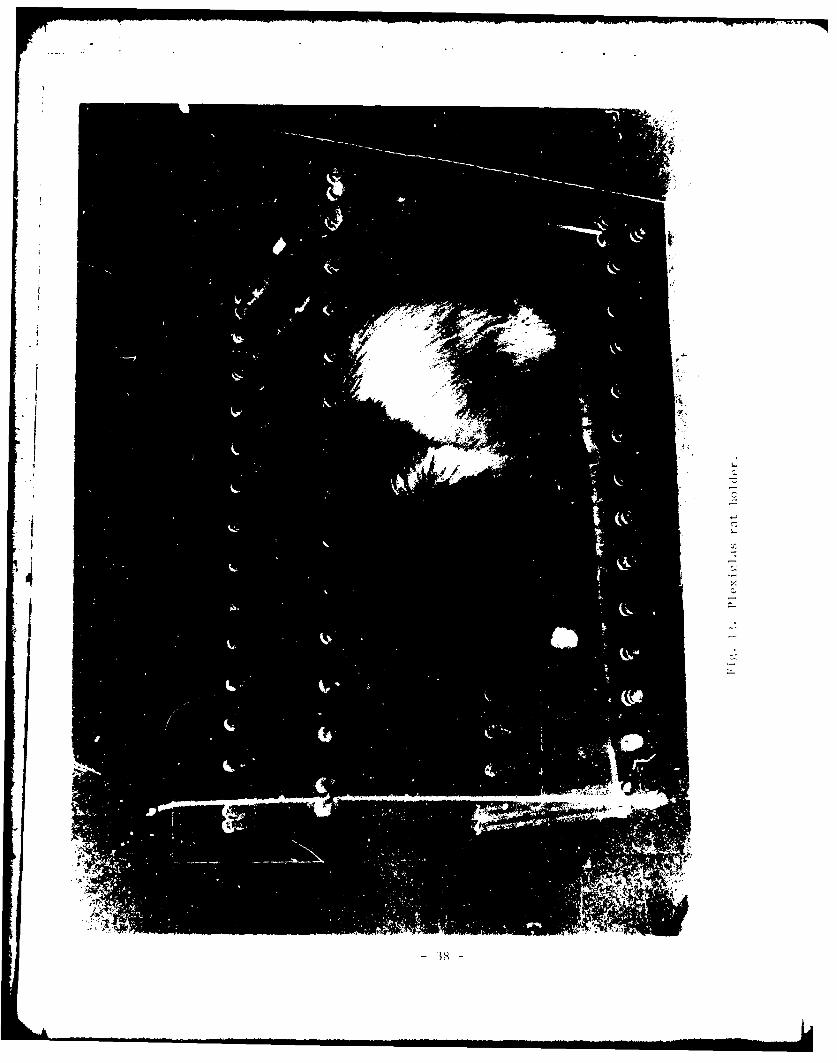
13 Plexiglas rat holder ....... ................. ... 38
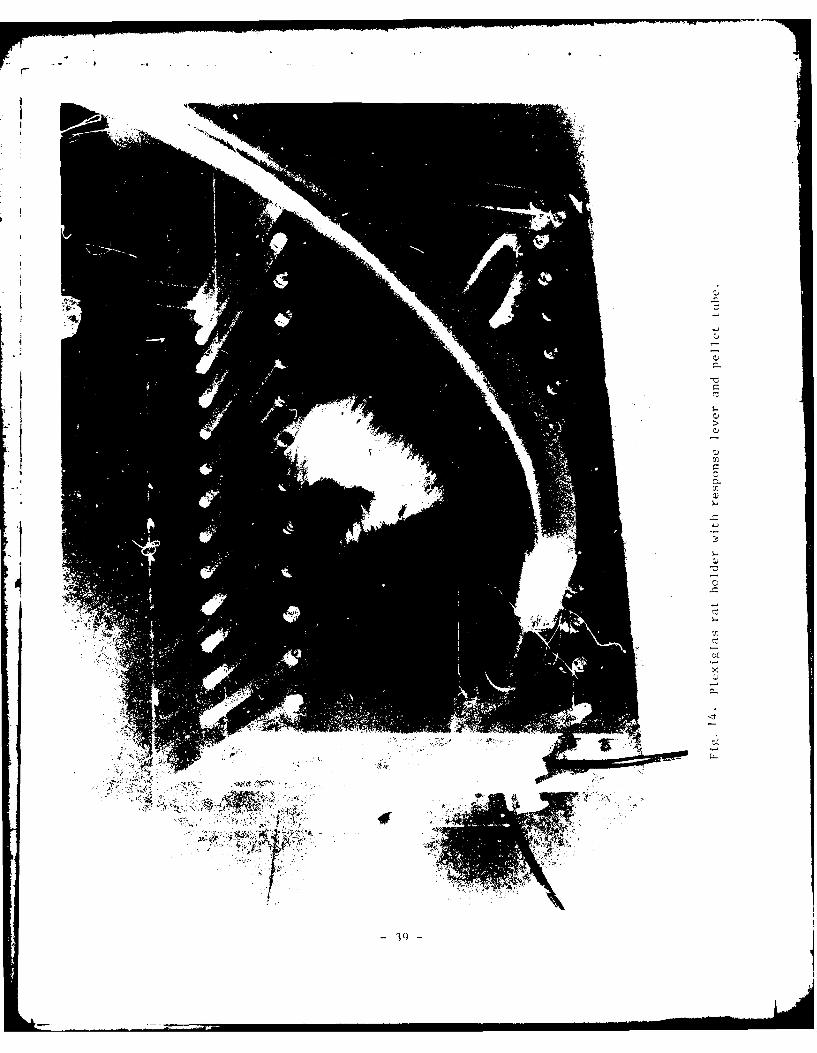
14 Plexiglas rat holder with response lever and pellet
tube .......... ......................... ... 39
15 Rat colonic temperature rise during irradiation at 400,500, 600, and 700 MHz (10 mW/cm 2) .. ........... ... 42
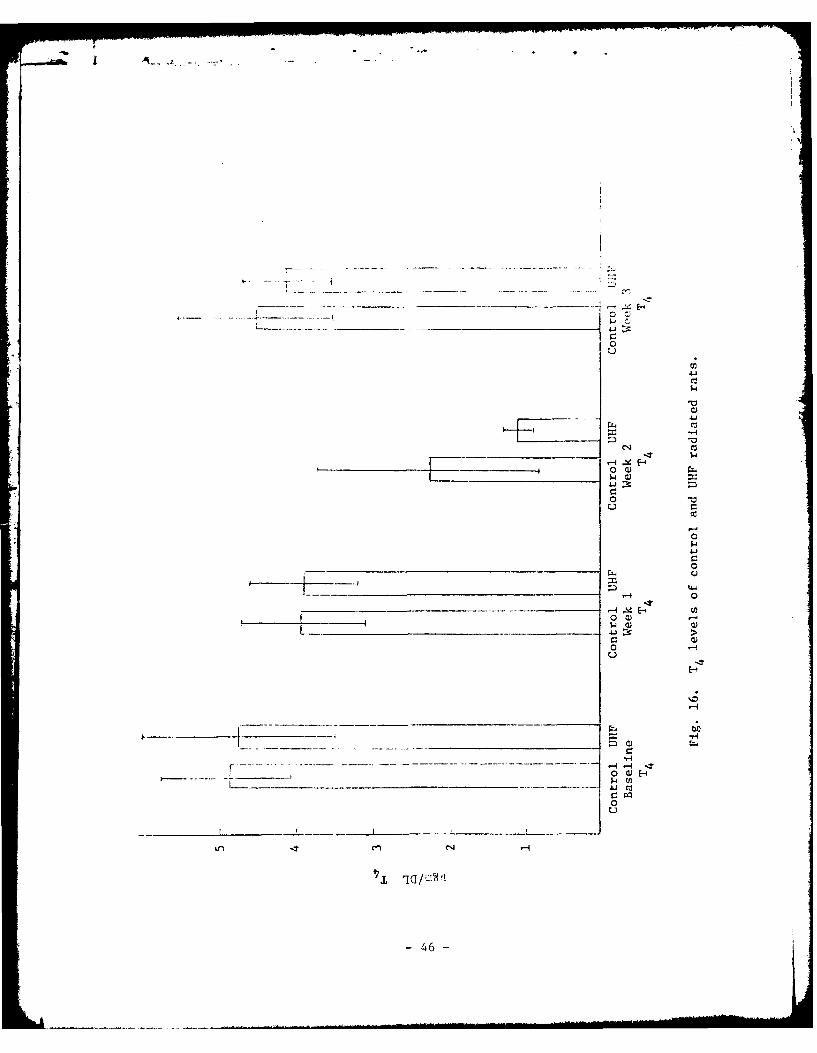
16 T4 levels of control and UHF radiated rats ....... . 46
17 Thyroxine (T4) response to 600 MHz radiation. (Stan-dard deviations are not shown overlapping.) ...... ... 48
18 Thyroxine (T4) response to 600 MHz radiation. (Stan-dard deviations are not shown overlapping.) ...... ... 51
Table
1 Forty-five degree corner reflector monopole-above-ground antenna .......... .................... 5
2 Monopole-above-ground radiator in a 450 corner reflec-tor. Angular widths for different values of fielddeviation relative to maximum ...... ............. 8
3 Some measured parameters of the man models used fore7:periments ......... ...................... ... 14
24 Total power deposited in man and animals at 10 mW/cm . 24
5 Comparison of the whole-body-average "ungrounded" SARat resonance with and without reflectors ........ .. 31
6 Comparison of the whole-body-average "grounded" SAR atresonance with and without reflectors .. ......... ... 32
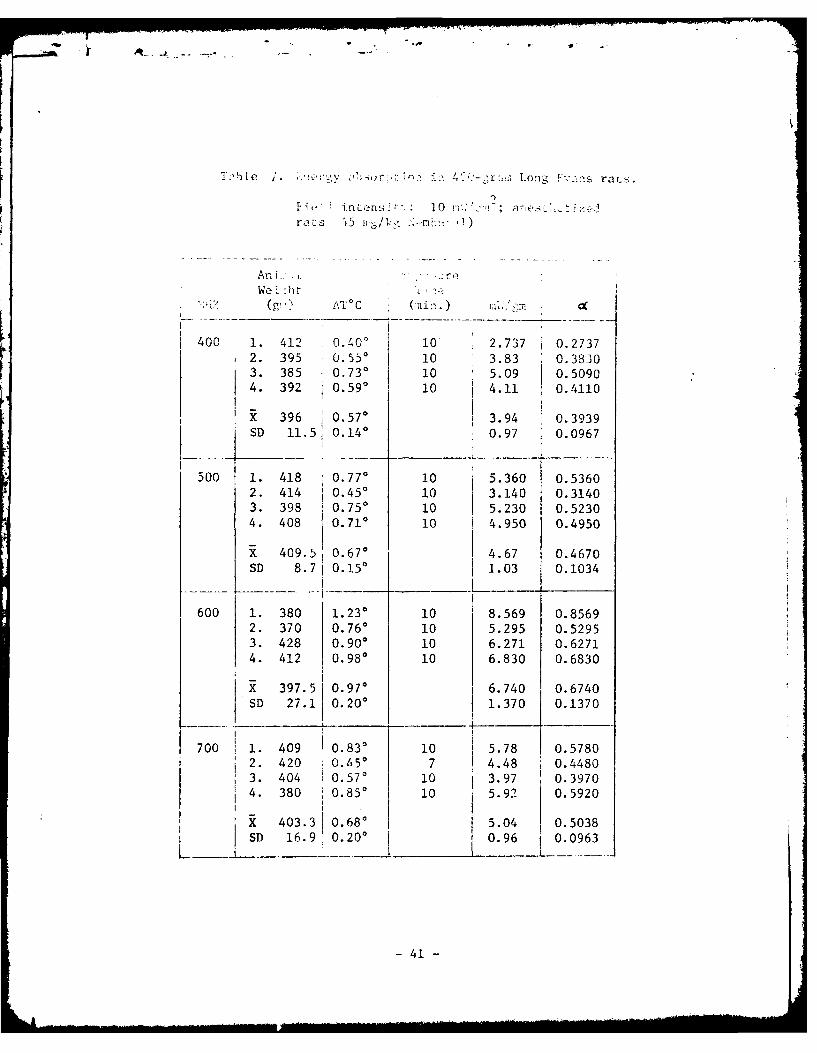
7 Energy absorption in 400-gram Long Evans rats .. ..... 41
- V -
Table P ~
8 Average w <:J., tninperaturi rl-z during, irradiatioriand sham 7r~. tion. .................. 44
9 Avera!: coln *- P.feratulre r:.e uri g raCtionl andsham irr....... .............. ........ 49
10 Average colc-nic temperature rise during radiat~oa andsham irradiation. .................... 49
-vi
BEHAV[C,;AL AND BIOLOGft-.L FFUECT$ OK7 RE-ONXNT
ET 1C"'O}MAGNLTIC 1'0,UEJR ABSORPTION IN !-\S
Abstract
Past experiments of this project utilizing three separate and
distinct radiation facilities have determined the whole body and
distribution within the body of resonant electromagnetic power absocp-
tion for both man models and laboratory rodents. The absorption of
such energy is reliably determined by both the frequency of radiationi
and the orientation of the model or rodent in electromagnetic energy
fields. For an ungrounded 1.75 m tall man, power absorption has been
determined for EL , using scaled-down models, for the 23 to 570 MHz
band with resonant power absorption at 62-68 MHz. Power absorption for
the laboratory rat has been determined for the 300-800 MHz band with
resonant absorption being at 600 MHz for the E1I L orientation. At
respective resonance frequencies in the L 11 orientation for both man
and laboratory rodent, maximum power absorption is found in the neck
region of the body. For a grounded 1.75 m tall man, the resonance
region shifts to approximately one-half the free space resonance or
30-34 MHz. Man models or laboratory rats placed in proximity of metal-
lic reflecting surfaces experience considerably enhanced electromag-
netic energy depositions. Behavioral experiments with laboratory rats
have shown that frequency of radiation and animal orientation in the
fields are highly significant parameters in determining electromagnetic
energy absorption and consequential disruption of behavioral performance.
01-jective
Ti. objectix, s of the project are:
a. To cuaantiv the clectro"gnetic power absorption and its dis-
tribution for man when subjected to radiationr at different
frequencies and under various expos;re couditions.
b. To verify the important observations of (a) by exposure of
living organisms.
The experiments for man are performed with reduced scale models
filled with biological-phantom materials which simulate the electromag-
netic properties of human tissue. The animal experiments consist of
behavioral and biological effects of electromagnetic power absorption in
rats.
The purpose of the project is to develop an understanding that
would lead to projections for humans.
Highlights of the Work DoneDuring the Last Year
1. The parallel plate radiation chamber was used to determine
the distribution of energy deposition for various parts of
the body for different sizes of biological phantom figurines.
This work is detailed in Quarterly Report No. 4. The high-
lights of the results are:
a. Maximum rate of energy deposition is observed for the
neck for L resonance and near-resonance conditions.
For this region, an energy deposition of nearly 12 times
the whole body average is observed. The pattern of energy
-- -
depos:iLion is very sV-'! r to that obtrined from fr :
space ier:.i;tion experi.ments. The higher rate of energy
depc). _ L ri-- th&, i-Ih l '1Lad)(Y vxa:o er
for t,, nec: r. :ioi . w .ce e':u rim&n; is -scribed
to the lLaer pover de-nsities of 100 9c ued thare as
2compared to a maximum field intensity of 26.5 mW/cm avail-
able in the parallel plate radiation chamber. The lower
field intensity needs a longer exposure time, which re-
sults in the heat being carried away from the "hot" neck
region to the cooler torso and head regions of the body.
b. For E orientation, a detailed examination of the leg
shows a higher rate of energy deposition in the knee and
ankle regions. A power deposition varying as (cross-0 )-l
sectional area) is observed. A similar result is
observed for the arm where the maximum rate of deposi-
tion is for the elbow region.
c. For kill, orientation (power propagating from head to toe;
E from arm to arm), the maximum rate of energy deposition
is observed for the elbow region. The second highest
absorption rate is measured for the neck region.
2. The monopole-2bcve-ground chamber was designed and installed
(Fig. 1). A new computer program was written to extend the
field intensity calculations to the near field region. This
is necessitated by the fact that high field intensities are
generally needed for modeling, animal heating and lethality
experiments. This may therefore require that the working
-3-
I I
.4
4 1-
C.:
ii
I-
* I
4I S
C
.4 -
region ba located no cr 1- -an a few w-velcngths from the
antenna. a .e computer progra:. calculates ti vector sum of
neIar Jiu _- -)t, the .? ar it i;.2 e>; (in assu:ed
InfiuLte re-hJ-ctors). 1:. _',r to apply the results to th'
case of !,e n:.mopo3 1-,il)%e-ground, the field compon(::tAo. cal-
culated for th.: half-space above ground are used (because of
their physical realizability).
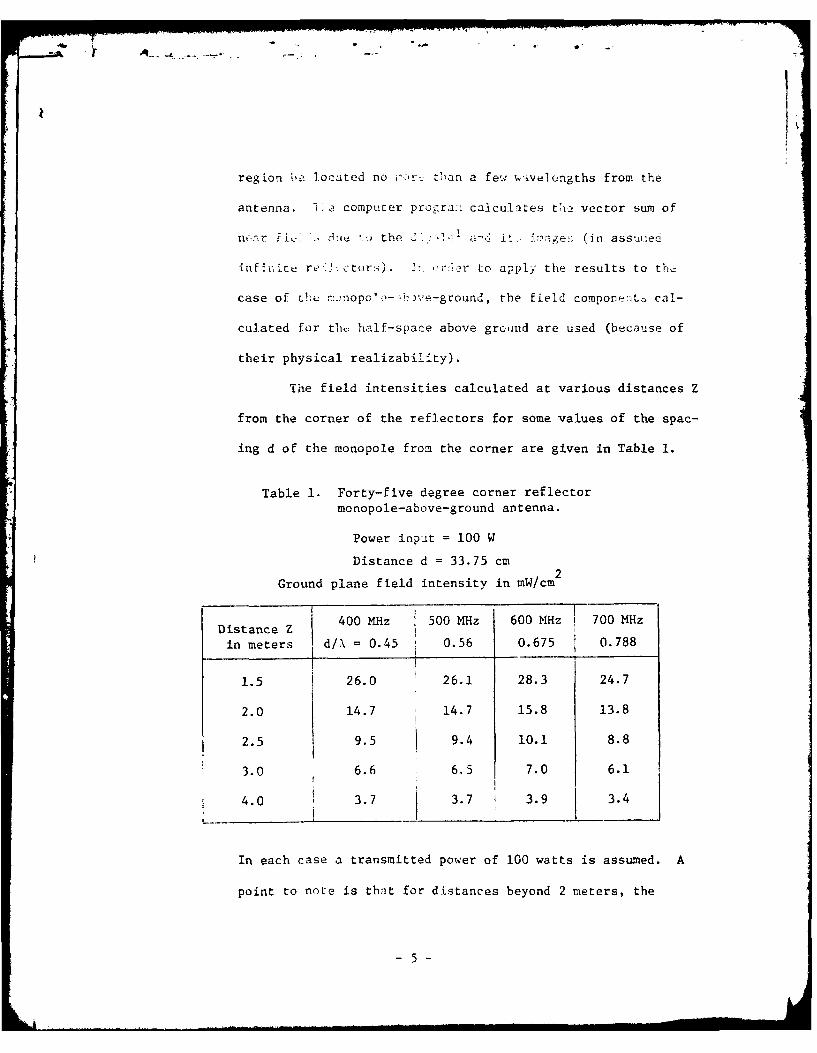
The field intensities calculated at various distances Z
from the corner of the reflectors for some values of the spac-
ing d of the monopole from the corner are given in Table 1.
Table 1. Forty-five degree corner reflectormonopole-above-ground antenna.
Power input = 100 W
Distance d = 33.75 cm
Ground plane field intensity in mW/cm
2
400 MHz 500 MHz 600 MHz 1 700 MHzDistance Z
in meters d/X = 0.45 0.56 0.675 0.788
1.5 26.0 26.1 28.3 24.7
2.0 14.7 14.7 15.8 13.8
2.5 9.5 9.4 10.1 8.8
3.0 6.6 6.5 7.0 6.1
4.0 3.7 3.7 3.9 3.4
In each case a transmitted power of 100 watts is assumed. A
point to note is that for distances beyond 2 meters, the
-5-
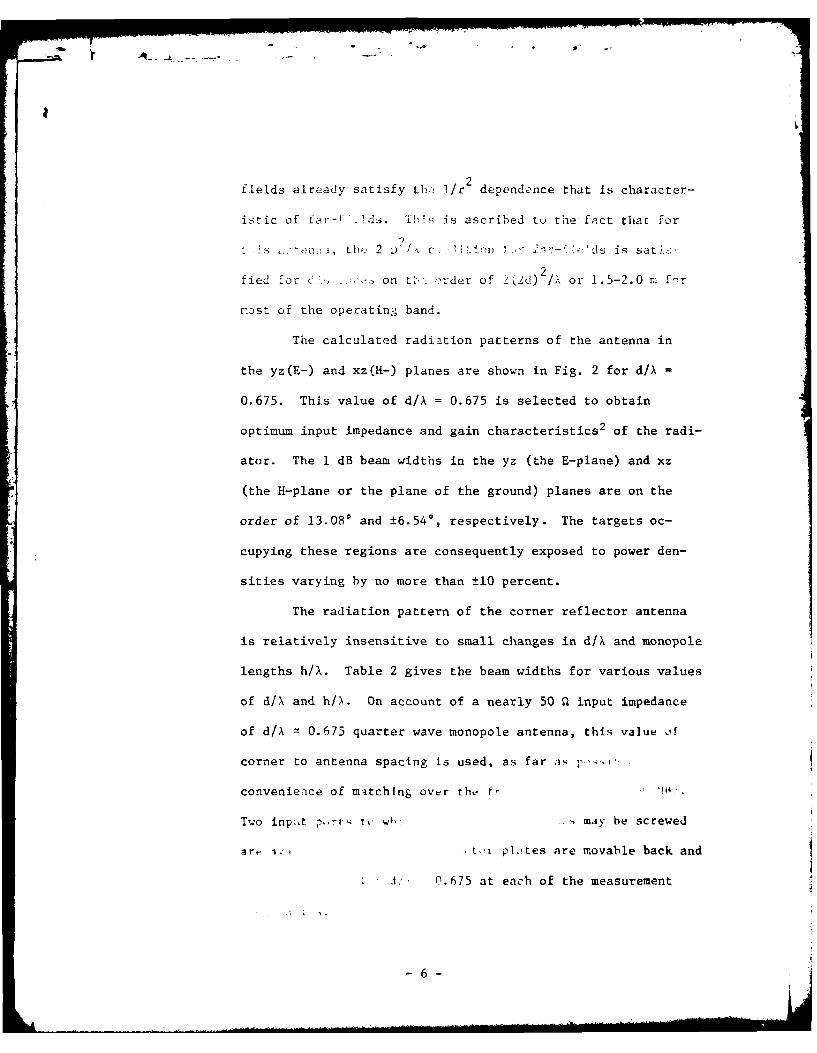
fields already satisfy th: I/r2 dependence that is character-
istic of fa- r- ds. is ascribed to the fact that for
t s . tb, 2 D x c . Ir n ..- i.: ,i s is sat;-:--
fied for , _. ., on t:rder of _i2(d) 2/1 or 1.5-2.0 n f.r
ncst of the operating band.
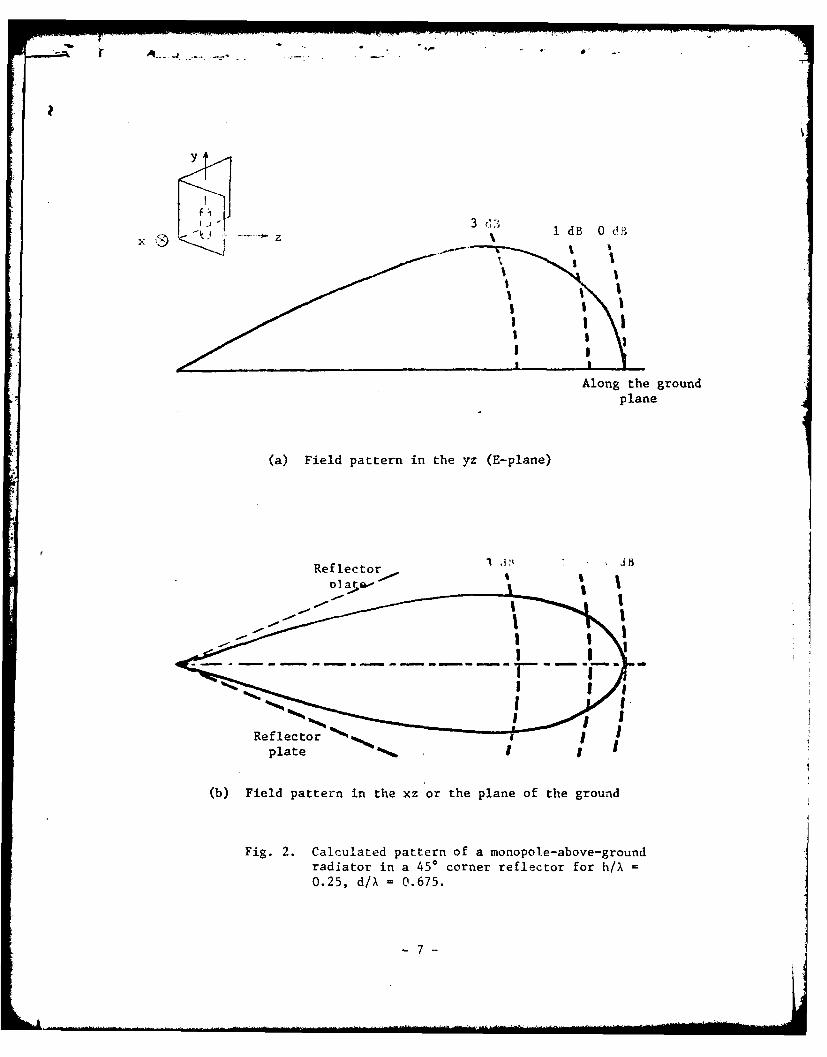
The calculated radiation patterns of the antenna in
the yz(E-) and xz(H-) planes are shown in Fig. 2 for d/A =
0.675. This value of d/X = 0.675 is selected to obtain
optimum input impedance and gain characteristics2 of the radi-
ator. The 1 dB beam widths in the yz (the E-plane) and xz
(the H-plane or the plane of the ground) planes are on the
order of 13.080 and ±6.540, respectively. The targets oc-
cupying these regions are consequently exposed to power den-
sities varying by no more than ±10 percent.
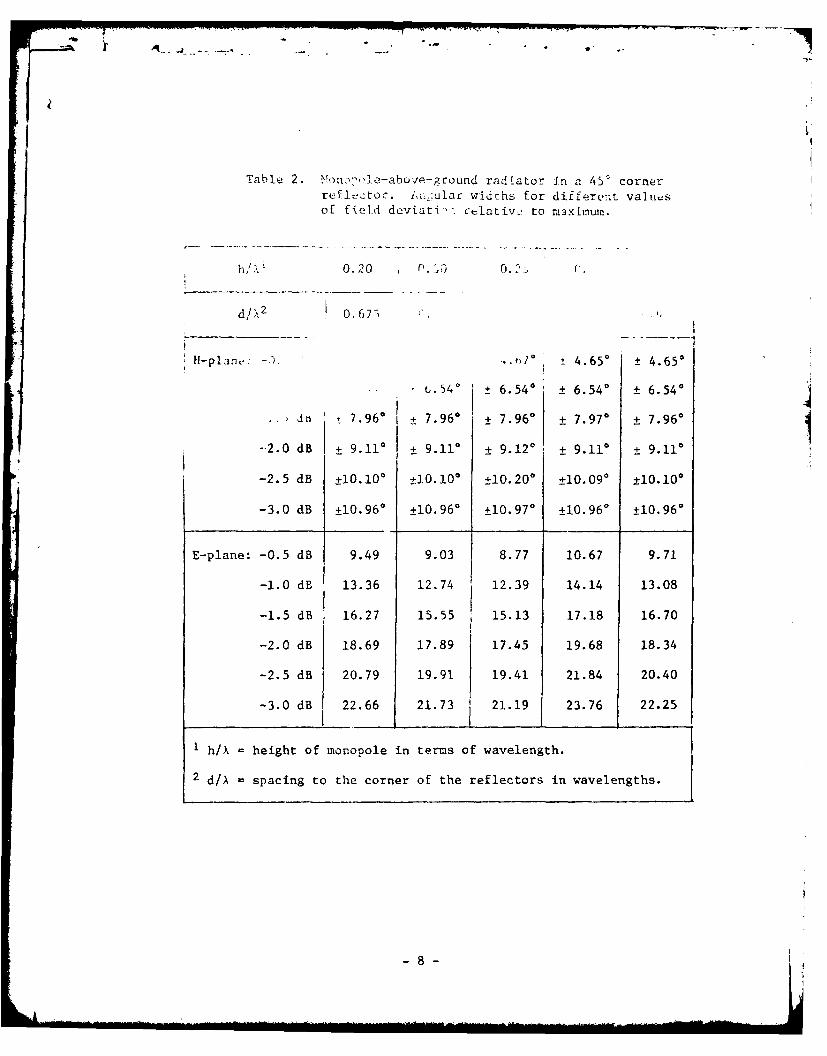
The radiation pattern of the corner reflector antenna
is relatively insensitive to small changes in d/X and monopole
lengths h/X. Table 2 gives the beam widths for various values
of d/X and h/,. On account of a nearly 50 Q input impedance
of d/X = 0.675 quarter wave monopole antenna, this value of
corner to antenna spacing is used, as far as p,-i-'
convenience of matching over the f,
Two inpi.t p r o wr,, may be screwed
art .' ,tot plotes are movable back and
J,- 0.675 at each of the measurement
-6-
y
z e- 1 d B 0 (.
Along the groundplane
(a) Field pattern in the yz (E-plane)
Reflector
Reflectorplate5
(b) Field pattern in the xz or the plane of the ground
Fig. 2. Calculated pattern of a monopole-above-groundradiator in a 450 corner reflector for h/X0.25, d/X =0.675.
-7-
-|,.4 _ .. .. " . . .
Table 2. Noncv:,l-abu e-ground radiator in a 45' cornerreflector. i, .;ulac widths for differcm-t values
of field deviati,: celativ-! to m3ximum.
h/'1 0.20 r'. ,0.:.
d/ 2 0.677
H-planc: -6I. -,° _ 4.650 ± 4.650
t).54 0 _ 6.540 + 6.540 + 6.540
. 7.960 + 7.960 + 7.96 + 7.970 ± 7.960
-2.0 dB + 9.110 + 9.110 ± 9.120 ± 9.110 ± 9.110
-2.5 dB ±10.10* ±10.100 ±10.20 ° ±10.090 ±10.100
-3.0 dB ±10.960 ±10.960 ±10.970 ±10.960 ±10.96*
E-plane: -0.5 dB 9.49 9.03 8.77 10.67 9.71
-1.0 dB 13.36 12.74 12.39 14.14 13.08
-1.5 dB 16.27 15.55 15.13 17.18 16.70
-2.0 dB 18.69 17.89 17.45 19.68 18.34
-2.5 dB 20.79 19.91 19.41 21.84 20.40
-3.0 dB 22.66 21.73 21.19 23.76 22.25
1 h/A = height of monopole in terms of wavelength.
2 d/A = spacing to the corner of the reflectors in wavelengths.
-8-
--
: ,: 1 5 ca L-rt'd usin the Ceneral Micro-
wa- ir:xrtio:' fiuld intensity probe Raham model 1 (300 to
18000 Mlza. Th m, ar, fi.1-ld int , 7'ies in tAe E- and H-
pla':es at ,:auple 0 cepresentativa farrc: - a!e A ic
Figs. 3 ani 4. ::ec;urements confir. the sL:i]arity of pat-
terns at other frequencies.
3. Proportionately scaled man-shaped cavities of height 3, 4, 5,
6, 8, 10, 13, and 16 inches were made in polyurethane. Start-
ing with wire frames, sculptured figurines were made of clay
in roughly the same proportions as those given in reference 3.
Each clay model was then molded of Silastic RTV silicone rub-
ber (Dow Corning type 3110). The reusable molds so formed
were used to cast epoxy figures. The epoxy figures were sub-
sequently cast in polyurethane blocks. After polyurethanep
had been formed, the epoxy castings were cut in half around
the central frontal plane for their easy removal. Two
cavities, one resealed for filling with saline and the other
for stuffing with biological phantom materials, were formed
for each of the eight sizes.
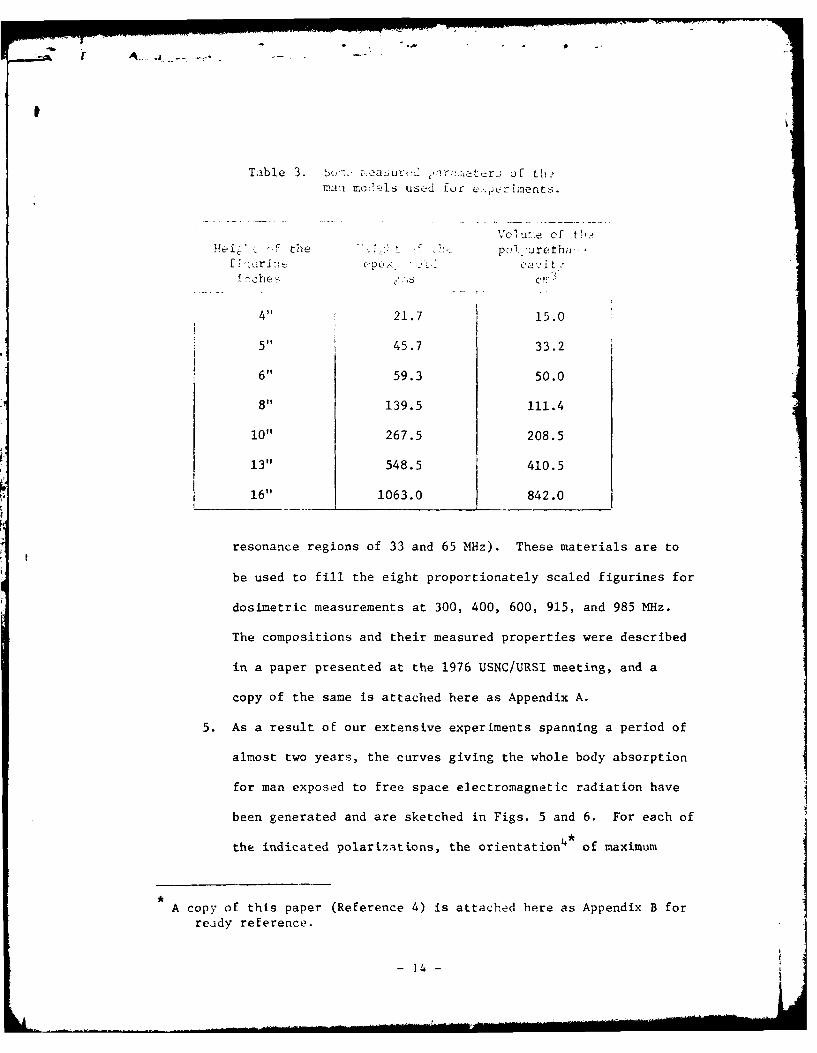
The weights of the epoxy figures and the volume of the
final polyurethane cavities are given in Table 3. The volume
3varies approximately as (height) , which demonstrates the near
proportionality of these figurines.
4. Biological phantom materials were developed for simulating man
over the frequency range 13-230 MHz (including the important
-9-
0
N >00
0 -4
AM
Aij0 wt V.w
o 4 J
m C0
C4
Al~sualJ P:TJPajT'MO
10U
C-
0
l< C14
C) 0
4 0
C3 4
CD 0 -
CC
A ITSUaIU] PlaT PaZ~TTIUIN 1040
44)
(4 d 4-4
C'44).
44 r-
00
Le)4
C.) 0 %D
04
-4 .1~-4
0 0.-
1t4
C.)
0 E
4j 4-
aM'-H
$'4
UL
A2TS~lUT PDIJ Pn7T I.L.O
a 012
-< Clj
r.~
2 >4
ro
C rCD 0
0 N4) r
-4 0 0
XI]StIUT Pp-rJ PaZTl~eflIN = r
a)0A.) -4
0
-H
C14
C',
0x,
-13-
II
Table 3. S. r a:iut,,d 1r uxeterj of tW_man modelIs used for e:-.:, riments.
Yolune of tl,'e - .f€ the ' '..- _ . .,, po!.'uretha .
f.:,turi:'..- -:p -' , Ca ,i t .
-.,hes .S c'is
4" 21.7 15.0
5" 45.7 33.2
6" 59.3 50.0
8" 139.5 111.4
10" 267.5 208.5
13" 548.5 410.5
16" 1063.0 842.0
resonance regions of 33 and 65 MHz). These materials are to
be used to fill the eight proportionately scaled figurines for
dosimetric measurements at 300, 400, 600, 915, and 985 MHz.
The compositions and their measured properties were described
in a paper presented at the 1976 USNC/URSI meeting, and a
copy of the same is attached here as Appendix A.
5. As a result of our extensive experiments spanning a period of
almost two years, the curves giving the whole body absorption
for man exposed to free space electromagnetic radiation have
been generated and are sketched in Figs. 5 and 6. For each of
the indicated polarizations, the orientation4 of maximum
A copy of this paper (Reference 4) is attached here as Appendix B forready reference.
-]4 -
)(p~~a s o q2 aq j o p i p p S J U 0 4J 0 U O L~ d osq2 ? aA t l eja dj
'.P.
U,,
A.) Ll' C
ca 0) l4 ca -I
C) Uj W V.F' CN 0 cn
E. CI W C)3- t *
0 xo H -. = ON$4 C) ca .0 0
V .0 $ ' '' ,4 $4 .cn 0. I r- 0r- H a-00 .0 4' CC'. 1 OC
c- 140r=-co -4 C
0~~~~ '-=o.P - a
0. r4 c 4.4' 4 0414x' 0. 0IT t"f 0.
4-4 mn 02 0TC 00
cc2- O4J .4
0 toC '.4342"0-)*o343 0 )
4--' $4 0.0 * *
.3 00
4) 0
0)0
o0 00.0
0.0. w. . 4
C. C
CC
4' :;M 01 10 S0)Ij a )Lo~d oA o 6PaPX o LC)0o' >.
4I 4' C 4.315
C-11
-j 4 In
C.~ :14J4-0 cJ
1'4
Cl F!
0 - 1. 14 -o
4-11
00
~ 4-4
j ('
~~0C3l c
clii.- 4-4 In-*C4
Z 10 q
4-JI 3-44-ci Cl c 4 0,WO
0 cy Sg.4 0i
Ni \~- 0
0 C:
ca
*0 -Cd
-~~ m -
Zw3IML QL 40 SPL$ JUapL3UL .. OS (WSi/M) Ut (GL- /Wl) IV
-16-
1, ,. - ):,> :{ * , . -;, %his < .r. i1 po,1]s to p:-.pag.'tiu.2
f -.. nr: a r- (r thr- c - f ,n fr L to tack) f'cr E L
, 7 .,. . . to ,; " (r . i, r Lh:1n :- fr,.',t ti
ha.-':) . K L c ,, ,-,. , E f ~ . ,- , ,: H. I
To dnte the: e,*- iiatal da~e have been obtained to
8.7 times th ElI L resona:ce frequency of 62-68 MHz. The
quantities plotted in Figs. 5 and 6 are:
a. The relative absorption coefficient S which is a measure
of the efficiency of power absorption
Microwave absorption (Total power absorbed (Field intensity
cross section in watts) in watts/cm2 )
Shadow area of the body Shadow area of the body in cm2
b. The specific absorption rate (SAR) in watts/kgm.
c. The SAR as units of basal metabolic rate (BY[R).
For the most absorbing Eli L orientation, the whole body
absorption curve may be discussed in terms of five frequency
regions:
Region I -- Freqoencies well below resonance (L/X < 0.1-0.2).
An f2 type depeni..nce derived theoretically and checked
experimentally by uirney and co~vorkers. 5
Region II -- Subresonance region (0.2 < L/A < 0.36).
An f2.75 to f3 dependence of total power deposition has
been experimentally observed for this region.
R-gion ITT -- Reonanco reglin (L/\ 0.36-0.4).
-17-
, -t Muiz and resonance S,.R
:go IV -- Post-resonance region to frequencies on the or-
der of 8 to 9 times the resorance frequency f .
r)rA whle odyabsorption reducing as (f~f )'- from the
resonance value has been observed.
Region V -- f >> f region.r
The S parameter should asymptotically approach the
"optical" value which is (i - power reflection coef-
ficient) or about 0.5.
In comparing the graph of Fig. 5 with those of Fig. 6 (drawn
to the same scale), the following points are noteworthy:
a. For frequencies f > (4-5)f r, there is little distinction
between the total power absorbed for the various polari-
izations. For humans, this corresponds to (frequency in
MHz) x (height in meters/l.75) of about 250.
b. The resonances for k11 L and HL orientations are not
very sharp. In fact, for HII L orientation, the value
gradually reaches a peak value and stays at that value
for higher frequencies.
- 18-
6. Th 2 frequincy dendV-,ce of Fig. 5 i;as been used to dr.1 the
geral.L..d :rves For r. cud (Yi,. i) for f-ee spc:
rc r :a al ii:; f1L
r e s c h) , . 2 1 6 ( z s . "-
osp,-i,'t rati L i?/2 > 25 -. )
taken to d-,: the graphs of Fig. 7. Al;:) s! -.r, in the sa_.2
figure are the values calculated from the let'lality data of
Schrot and Hawkins. 7 In calculating SAR's from their data,
it is assumed that:
a. A temperature elevation of 7.4' C results in convulsion.
b. The temperature increase occurs in an adiabatic manner;
i.e., the rate of deposition is high enough so that there
is no other mechanism for gain or loss of heat from the
animal body.
On account of the high field intensities of 150 mW/cm2
used in the experiments by Schrot and Hawkins, 7 the second
assumption may be quite justified. From Fig. 7, the correla-
tion of the empirical graphs with experimental values is good.
7. The total power absorption for a human with feet touching the
ground is shown in Fig. 8. These results are projected from
measurements with 4", 5", 6", and 8" tall saline-filled
In order to determine the aspect ratio of the equivalent prolate spher-oid, the bulk ol the body is considered representable by a prolate3pheroid of length L and diameter 2b. The diameter 2b is calculated
from the average circumference of the animal body.
- 19-
E...
E Ht-
~,4-
E E E L~*.
C)C
C) W4 4:
-4 4
0~0
41 0) C
1.1 4C4
0
U UCD
o~C 4' )4
> 0
1..V :4
Q) 0
*0
200
0.E
000
0 01
030
n-4 Vi
.04 C A
W w 0
r.: (44
SI ;
a)g 4 (14 41 X
r
figurinc'; expose-d to IL radLation at different frequencie-
in the ?:*n).pcole-aboze-griund r-aiiltinn ch-:.ber. Comparing the
resu tb L ' those of fzrl , r - r- d&.: r t- (Fig. 5), p.- r', .
-V.rpL. L. 'il.s c~ S C'0 . C ~ 4',, O:~O~-
hal t;'-e vil~ue fcr i. coc.i' ti. 2ie ne : resont-c.
frequency is projected to be (30-34) x 11.75/L i MHz. At
resonance, a value about two times the resonance value for
ungrounded conditions is observed.
A point of concern is that the graph of Fig. 8 does
not completely agree with the data obtained with grounded
figurines in the parallel plate chamber (Fig. 16, Appendix B).
While the peak absorption frequency is very similar, the maxi-
mum absorption density observed in the monopole-above-ground
chamber is about half as large as that observed in the paral-
lel plate radiation chamber. This is unlike the observations
with ungrounded figurines where the parallel plate radiation
chamber measurements were in excellent agreement with free
space irradiation experiments. Further experiments are planned
to resolve the issue of 2 versus 4 times enhancement factors
observed with grounded figurines under respective resonant
conditions.
8. Judging from the succes- of the antenna theory in explaining
the resonance frequencies and absorption cross sections under
grounded and ungrounded conditions, highly enhanced values of
SAR are expected for resonant bodies in the presence of 1800,
90*, and otner corner reflectors. Experiments detailed in
A P endi,- C haie in c, i,'. i%-a S'2 ,n'ntecent factors d1; L'l
as 27 in er-<,iritv cf reflecting surfaces undor resonant
cond i t ,
; of r -1pr. J th ot<. .
7 " . [;. . - to 10 incU~ent
h., cal 1.aed for v.ric-.us expo3c_-:_ conditions
and is 1,aLd in Tablh 4. The rates of energy deposition
for resonanu:e conditions in the presence of ground effects
and/or reflectors are truly staggering. Resonance SAR values
as high as 56.5-103 times the BMR are predicted for adult
humans. The til.es to convulsion of 100 gm rats (Fig. 9,
Appendix C) for incident field intensities of 3-20 mW/cm2
confirn, some of the highest projections in the presence of
reflecting surfaces.
In order to fully appreciate the reflector-caused
enhancements in SAR's, it should be mentioned that, for target
length L, reflectors with dimensions 2d x 1.2 L (in the E
direction) are considered adequate2 to simulate infinite
sheets for a target to corner distance d. Furthermore the
reflecting surfaces need neither be of good conducting materials
nor solid in construction to cause considerable enhancements in
SAR's. In fact, surfaces of insulating material with conduct-
ing rods (oriented along incident fields) that are spaced <0.1 X
act effectively as solid conducting surfaces. Experiments,
nevertheless, need to be done with reductd dimensions of
- 23-
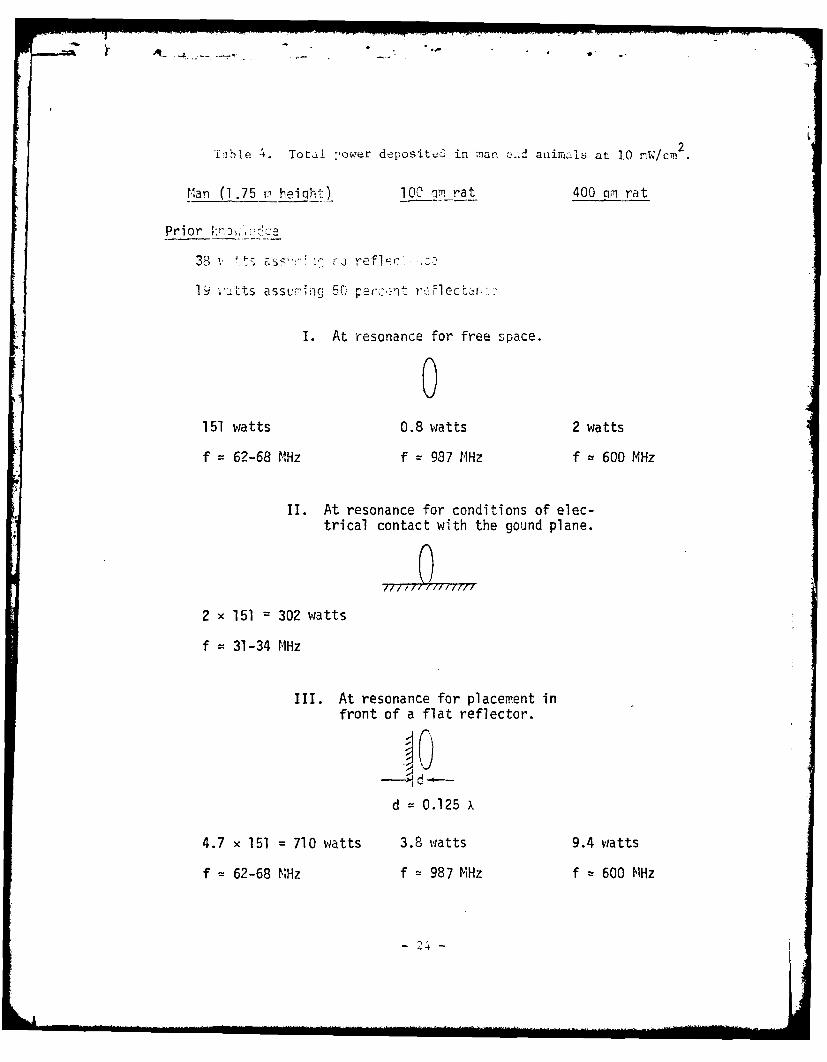
T nI ble 4. Tota! ower deposited in mar d,2 animlis at 10 nW/cm 2 .
rlan (1 .75 vi heiqht) 100 qrn rat 400 cim rat
P r ior o~,
38 v ' s "< r, refl .c *-
9 'Cts assu-il'ng 5G p=cct rFleclr,.:
I. At resonance for free space.
0151 watts 0.8 watts 2 watts
f 62-68 MHz f = 987 MHz f v 600 MHz
II. At resonance for conditions of elec-trical contact with the gound plane.
77/ /
2 x 151 302 watts
f 31-34 MHz
III. At resonance for placement infront of a flat reflector.
-H d --
d 0.125 x
4.7 x 151 = 710 watts 3.8 watts 9.4 watts
f = 62-68 NHz f - 987 MHz f t! 600 MHz
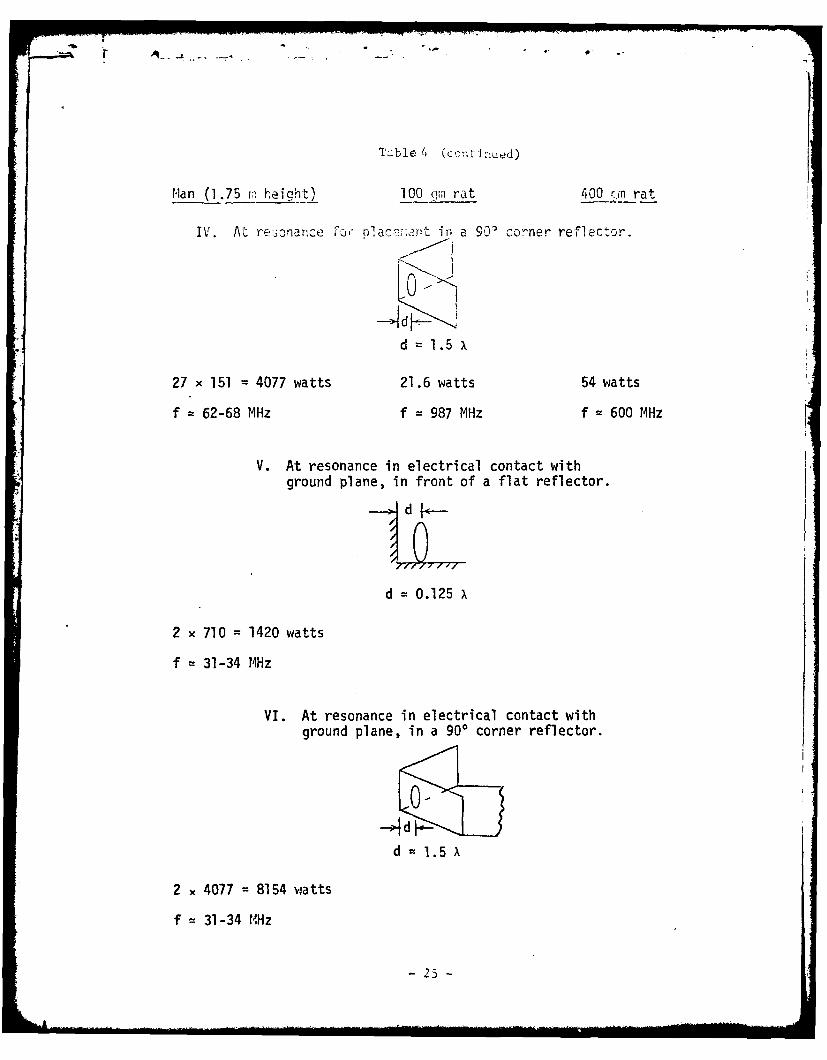
Table 4 (cntir.ued)
Man (1.75 m, height) 100 cm rat 400 r.-n rat
IV. At resonance Fcr plac~ri:-ant in a 90 corner reflector.
d 1.5
27 x 151 : 4077 watts 21.6 watts 54 watts
f 62-68 MHz f = 987 MHz f = 600 MHz
V. At resonance in electrical contact withground plane, in front of a flat reflector.
d -
d = 0.125 x
2 x 710 = 1420 watts
f - 31-34 MHz
VI. At resonance in electrical contact withground plane, in a 90° corner reflector.
d0-d f1.5 X
2 x 4077 = 8154 watts
f t! 31-34 MHz
- 25-
S. -,.
reflector: and for iuperfeAt reflecting surfaces to dectrmine
the rhance,:'-nt factors that actually result in such situa-
t ions.
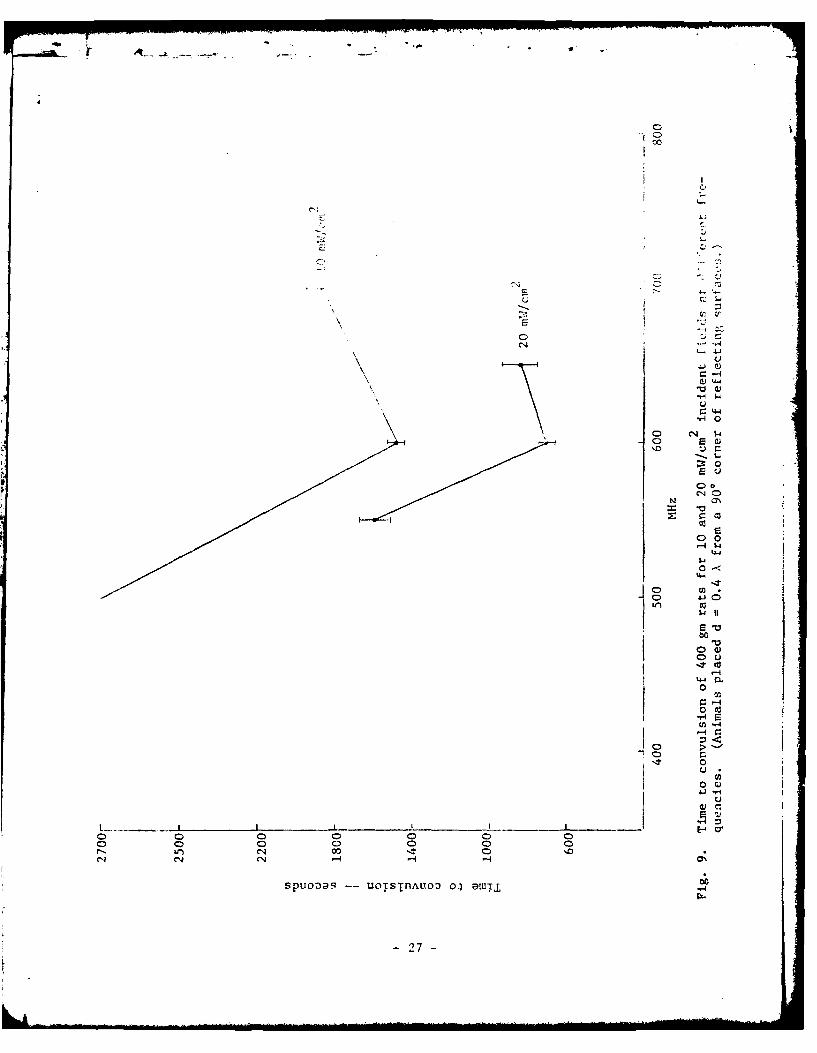
1 !- _,: 7e : for 40, ; r,ts I .',;, fl
run in t',e Ixflojoi2-aL-, e- round chzmt, ' . re-.onance fr--
quency for tlese animals was pinpointed in the first instance
to be 600 MHz in agreement ,th the graphs of Fig. 7. The
mean times-to-convulsion together with the standard deviation
for four animals is plotted in Fig. 9 for irradiation fre-
quencies of 500, 550, 600, 650, and 700 MHz. Minimum time-
to-convulsion is observed for irradiation frequency of 600
MHz. Below resonance, the time-to-convulsion increases more
rapidly than that for frequencies above resonance. This ob-
servation is consistent with the graphs in Figs. 5 and 7, and
is in agreement with the lethality data of Schrot and Hawkins.7
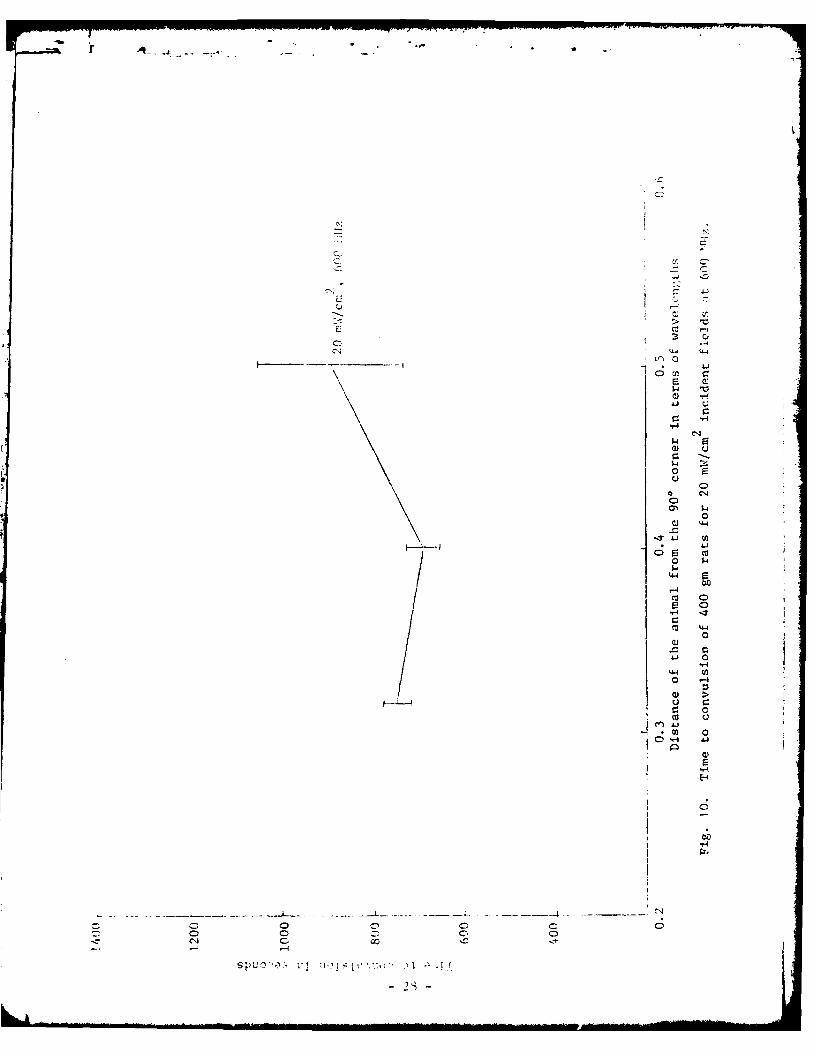
The times-to-convulsion of 400 gm rats for different
locations in front of a 900 corner reflector are shown in
Fig. 10. Of the three locations that were evaluated, d =
0.4 A is the most absorbing. For this location, the times-to-
convulsion for different incident field intensities are plotted
In actual experiments, animals within the weight range of 370-430
grams were used.
On account of the fairly limited length (=2.5 m) of the monopole-
above-ground chamber, the more lethal placement d 1.5 X (seeFig. 5, Appendix C) could not be tried under these exposure con-ditions.
-26-
cc~
CC~41
0
0 W-
o, 0
r_ C3
00
-- uo~j~iuo, 04
0'
ennn-n4-i
0 27
C- 4 4
CIS
C3) U
U-
4; r
o C)
0
4) 0
0 -H
-4 c04 -4
0
-4
2S~ U
in Fig. ]
Cnmpar - n tis s t :-t ,n t mean tme-to-con'!isi-n
oC >30 . ,.: ,i L , . [, J l e ii., t,, the cc:, e-
" f 4 t 7 I " ,) . .. ved by S L-
I [ 2, i
apparent that the d.:siti.- enhanii: nt factor in the monu -
pole-abuve-ground chamber on the order of 7 is not as large as
11 observed for 100 gm rats for d = 0.4 X placement. It
should also be noted that Schrot and Hawkins' experiments7
were done at 710 MHz and they would have observed a slightly
lower convulsion time than 455 seconds had they worked at the
resonance frequency of 600 ',MHz for these animals. As dis-
cussed in the next paragraph, a lower enhancement factor has
also been observed in the monopole-above-ground chamber for
man models.
9. The average values of SAR for ungrounded resonant size saline-
filled figurines with and without reflectors have been mea-
sured in the monopole-above-ground chamber and are tabulated
in Table 5. Consistent with the 400 gm rat lethality data,
somewhat smaller enhancement factors of 2.5 and 6.9, as compared
to 4.7 and 1i observed under respective exposure conditions at
Walter Ree d Laboratories (see Appendix C, Figs. 6 and 8), are
noted. Further theoretical and experimental work is needed to
understand this observation. The reduced effectiveness of
reflectors iin the monopcl.e-above-ground chamers is most
-29-
I rII 0Ia "-' -4 C
-1w
Q)4-qH
U-4
0)DC
0)
CCC - 10- C) 0
C)C
-11
O~ri.
300
-7,-
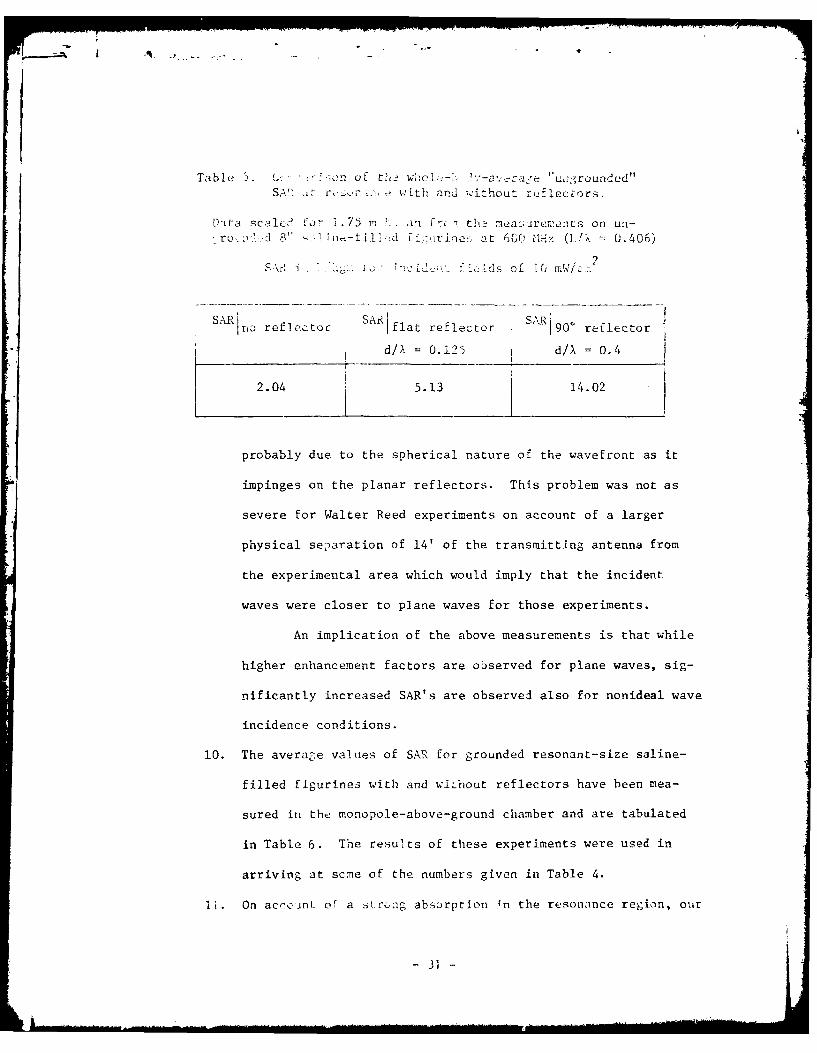
Table 5. C,.- -.on of th2 wl:- .'-avac rounded"SA", a,' , th and '.'ithout r;_Flecfors.
D[ta scalc9! Co- 1.75 n ai frC .7 the aremerts on uri-
ro:: '.d 8" . e-fill-d a>,rlne ot 600 MiHz (L,'X 0.406)
2S' -i .iZ: . -- i i .-. i' :7Ub-icis of 16 m o//o.
no reflectoc • flat reflector SAR1 9 0 ' reflector
d/ = 0.125 d/X = 0.4
2.04 5.13 14.02
probably due to the spherical nature of the wavefront as it
impinges on the planar reflectors. This problem was not as
severe for Walter Reed experiments on account of a larger
physical separation of 14' of the transmitting antenna from
the experimental area which would imply that the incident
waves were closer to plane waves for those experiments.
An implication of the above measurements is that while
higher enhancement factors are observed for plane waves, sig-
nificantly increased SAR's are observed also for nonideal wave
incidence conditions.
10. The averagje values of SAR for grounded resonant-size saline-
filled figurines with and without reflectors have been mea-
sured in the monopole-above-ground chamber and are tabulated
in Table 6. The results of these experiments were used in
arriving at scrne of the numbers given in Table 4.
li. On accc'jnt o' a st r-ag absorption 4n the resonance region, our
- 31 -
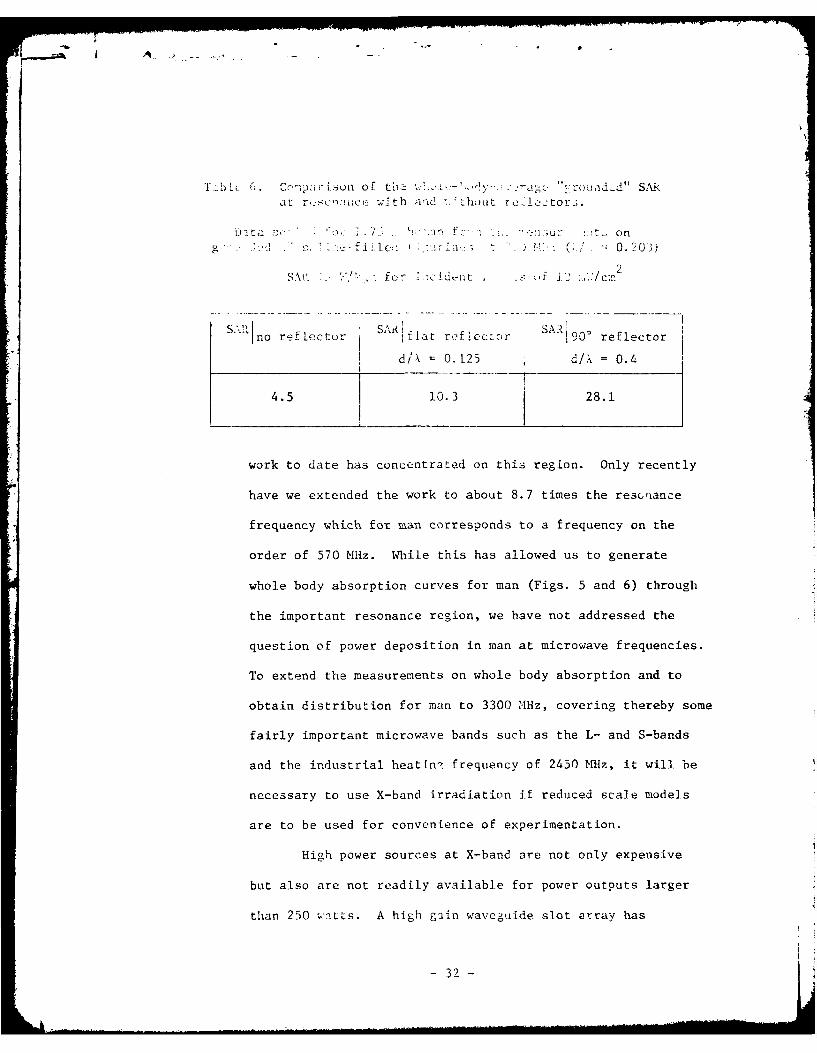
T::L 1. .' .. [: of til '.%uL- .... : "" r i d".SARr, r-se c i c th7 arid .-:huti re,.~c as
-c 7 f U . ong," .7 :] ':i :. -fjl[c,: ' , ,: .. n~l:; . )7::: (;_/. = 0,203)
SAP ... " . fo.r id,.-nt . r ]J ,../cmrf
Ino reflector I t reflector 1 90' reflector
di,\ = 0.125 , d/, = 0.4
4.5 10.3 28.1
work to date has concentrated on this region. Only recently
have we extended the work to about 8.7 times the rescgance
frequency which for man corresponds to a frequency on the
order of 570 MHz. While this has allowed us to generate
whole body absorption curves for man (Figs. 5 and 6) through
the important resonance region, we have not addressed the
question of power deposition in man at microwave frequencies.
To extend the measurements on whole body absorption and to
obtain distribution for man to 3300 MHz, covering thereby some
fairly important microwave bands such as the L- and S-bands
and the industrial heatIn? frequency of 2450 MHz, it will be
necessary to use X-band irradiation if reduced scale models
are to be used for convenience of experimentation.
High power sources at X-band are not only expensive
but also are not readily available for power outputs larger
than 250 wntLs. A high gain waveguide slot array has
- 32-
c,:v u , :lnsiy :i., , fdesic U1, fa:d tested for
at these f"a'v-nccke. ihe r ':iator dcri C in An p: D
gi. -,e an i:t.*~ ) t ! . tL..iL ., ¢ixhin >0.5 d' c'' -:
On anco;. t o a sha: i-:-uct L-,- fiel Is Ir the 1-plar
beyond the work area (7.8'), an antenna gain which is 2.45
times higher than that of a horn with a similar work area is
observed. This is on account of the saving in the power that
would otherwise have been radiated in undesired directions
because of the smooth roll off of the horn antenna.
2For a working area of 55 x 55 cm , a distance to the
radiator of 2 meters is needed. From the measured gain, a
field intensity uf 46.4 mW/cm2 constant to within ±0.5 dB is
calculated for a commercially available X-band power source
of 250 W. This field intensity is quite adequate for model-
ling experiments.
12. Numerical studies have been initiated to understand some of
the salient features of our observations. Among these are
the enhancements in SAR caused by ground and reflecting
surfaces, the 1/f reduction of the absorbed power in the
post-resonance region, etc.
Green's function methods such as the tensor integral
equation used by Chen 8 appear to hold the greatest promise for
calculation of SAR for models of man at frequencies near whole-
body resonance. Chen claims to have solved the problem and
- 33 -
has pubU ' 1 rnl el.ctric field d
absorb-d. ! -e d", -t jn'r~ -n- :1, j .1.0 as
In ordoc to v t . tc,:al equ io) f
Green's, function methods, it i necessary to discrcLiz-. by
representing the fields in terms of some finite basis. For
a pulse function basis, the scatterer is partitione2d into a
number of cells N, where N is large enough that complex
permittivity and the complex time-independent electric field
may be assumed constant within each subvolume. Pulse func-
tions are commonly chosen as a basis and have been used in
Chen's calculations. If linear or higher order variation of
the electric field were allowed within each cell by a more
accurate basis, the storage limitations of computers would
require that fewer cells be used. The number of cells
possible with pulse functions is adequate to represent the
torso with arms, legs, etc., but such detail would not be
possible with a more elaborate basis.
Strictly speaking, pulse functions are not in the
domain of the operator and should not be used with the tensor
integral equation or related Green's function methods. In
practice usable results are obtained if enough cells are used. 9
Since pulse functions fail to allow for any of the variation
of the elrctric field within e-ch cell, in upper bound on
- 34 -
usable col size .:..i- be found by deter:ining th. smaI c:c
size F, Mr.L--ed tU have internal fields -.ithi s Lgnificanr
v ., -- _ ,a-tat !ol 1.
niqes. Theory is used to establish -n upper bound on usable
cell size for pulse function solutions. The bound has been
demonstrated to be useful in our computations. Calculations
made using the bound on cell size suggest that significant
error is present in Chen's calculations for the adult torso
beyond 100 MHz and the child torso beyond 200 MHz.
Two new discretization procedures have been developed
which give improved convergence by approximating the varia-
tion of the fields within each cell but do not require
increased storage or significant increase in computational
effort. The procedures are described in Appendix F which is
a copy of a paper submitted for publication to the IEEE
Transactions on Antennas and Propagation. The new methods
have been used successfully in the two-dimensional problem of
TM excitation of an infinite cylinder of arbitrary cross sec-
tion shape. The extension to the three-dimensional problem
with and without ground and reflector effects is planned.
13. To verify important observations by animal experiments,
attention was devoted to proper design of the rat chambers.
To improve micrcwave tran ;%arency, the animal holders were
- 35 --
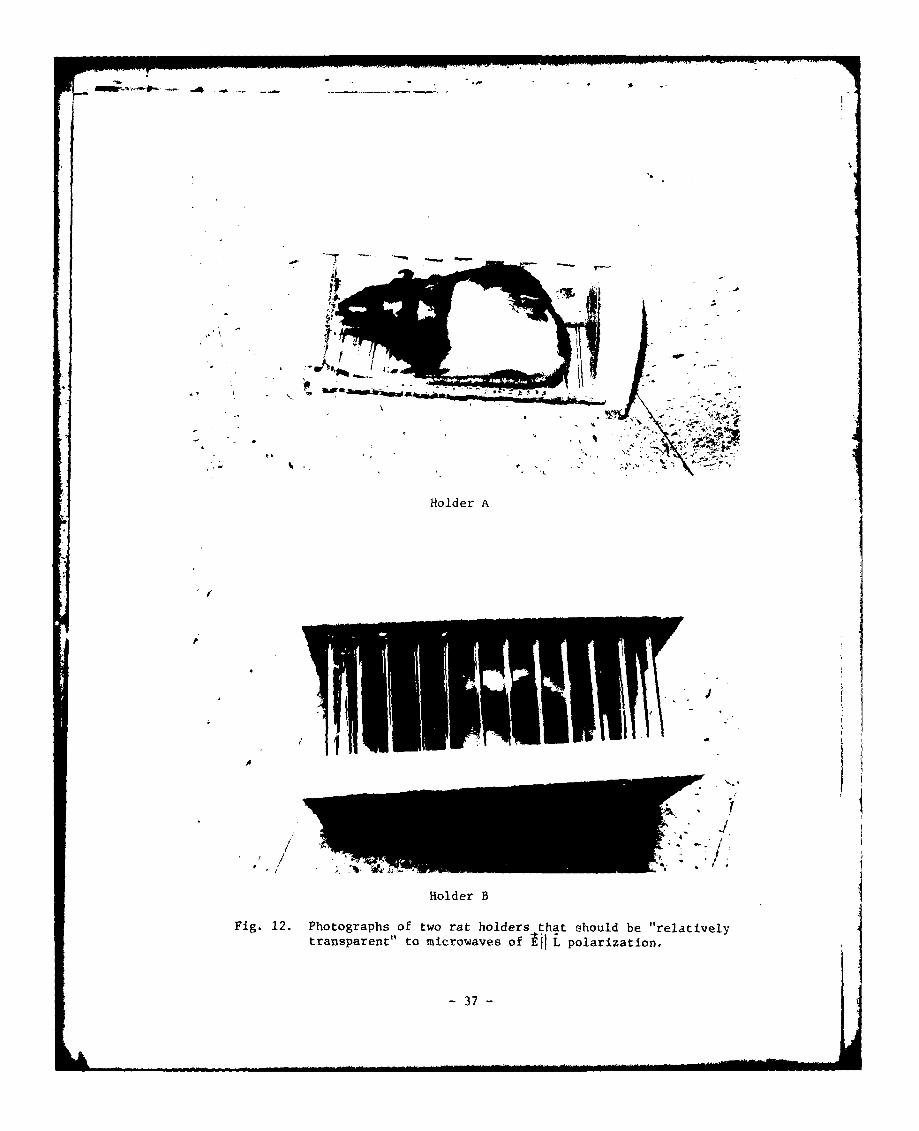
fabri . - with ,. rto . . ma. j f rds pje n-ezu]:
to t! tri. fie "-ce possiblie refi'.I.Lions. The
_7 d
> C t e C :U) ;- wa.; r.:'por-. 2., . z2'1i, j. :::. I ct
this contract, and photographs of the same are reproduced
in Fig. 12 for ready reference. We have found the holder
with styrofoam sides (holder B) to be adequate in contain-
ing 400 gram Long Evans rats for short time periods. We
have attempted to use this holder design for the behavioral
experiments. We find, however, that the styrofoam sides do
not provide adequate structural support for mounting a plastic
response lever and glass food pellet tube. To alleviate this
difficulty we have replaced the styrofoam sides of this holder
design with 1/16-inch Plexiglas panels. We have contained
400 gram Long Evans rats in this holder (Fig. 13) for up to
2eight-hour periods in 5 mW/cm , 600 MHz, CW radiation fields.
The addition of the plastic response lever and glass food
pellet tube (Fig. 14) was easily accomplished on this holder.
We have used this chamber daily in training stable VI-30"
baseline responding in Long Evans rats and find this a
superior holder.
14. The first series of dosimetric measurements on the Long Evans
rat have been completed in the monopole-above-ground radiation
chamber. Sixteen Long Evans male rats (380-400 grams) were
- 36 -
Holder A
Holder B
Fig. 12. Photographs of two rat holders that should be "relativelytransparent" to microwaves of Lpolarization.
-37
.1*1
t L.
~r.
x
I'
r -
C)
-c
C)
C)
C)tj~
C)
C)-cC
-C
C
C':
k
~ ~f
jt~- 39 -
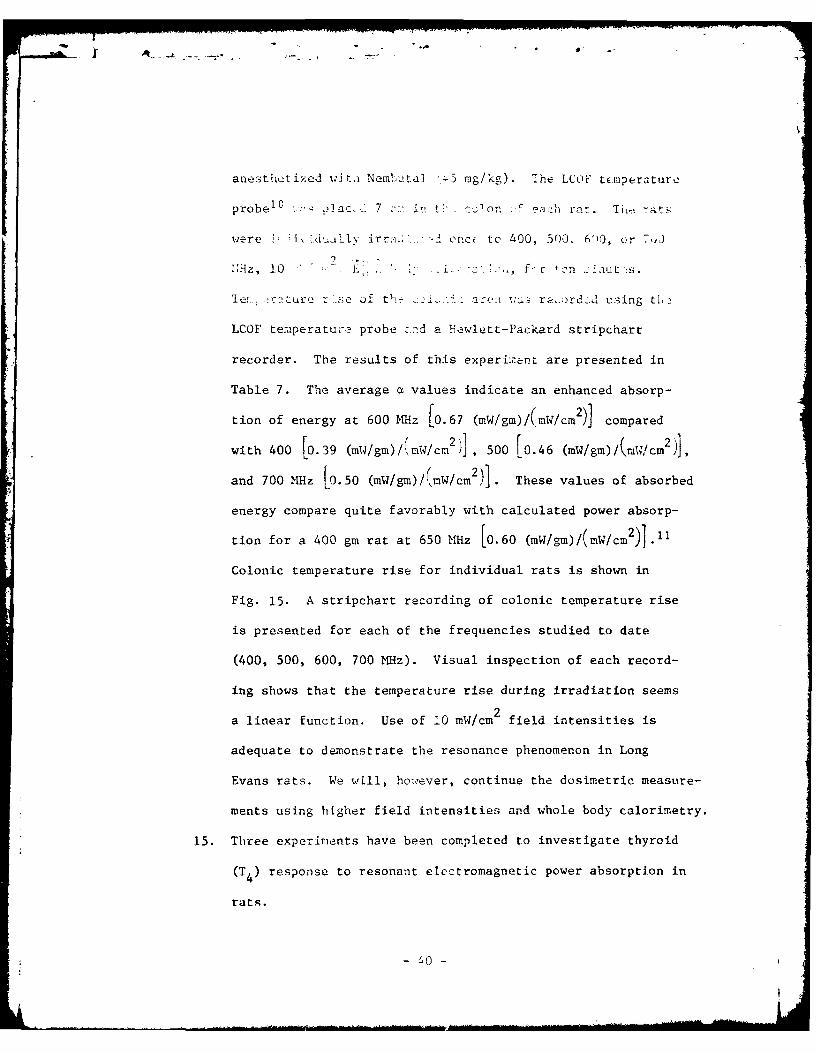
anesthetized wits Nembuta] '5 mg/kg). !he LCOF temperatureprobe1 0 " ] a,, 7 : t. 'on.. enI ria. Ti: rats
were " , i,duallv irr".. -I onct to 400, 500. 6 '0, or 7,j:]
;Hz, 1.0 - ,' -: <,, f r -ri . a. , :so
e!._. Z L.r "2 .se of t. ':.,. ace:, a re.ordc using ti
LCOF temperature probe .nd a Hawlett-Packard stripchart
recorder. The results of this experii.rnt are presented in
Table 7. The average a values indicate an enhanced absorp-
tion of energy at 600 MHz L0.67 (mW/gm)/(mW/cm2)] compared
[0 4gm/ mW/c2)] (m/g (mWc]2with 400 [9.39 (mW/g)/mW/cm , 500 [0.46 (mW/gm)/\mWicm2)J
and 700 MHz [..50 Wg)/jW/r2) These values of absorbed
energy compare quite favorably with calculated power absorp-
tion for a 400 gm rat at 650 MHz [0.60 (mW/gm)/(mW/cm2)A.11
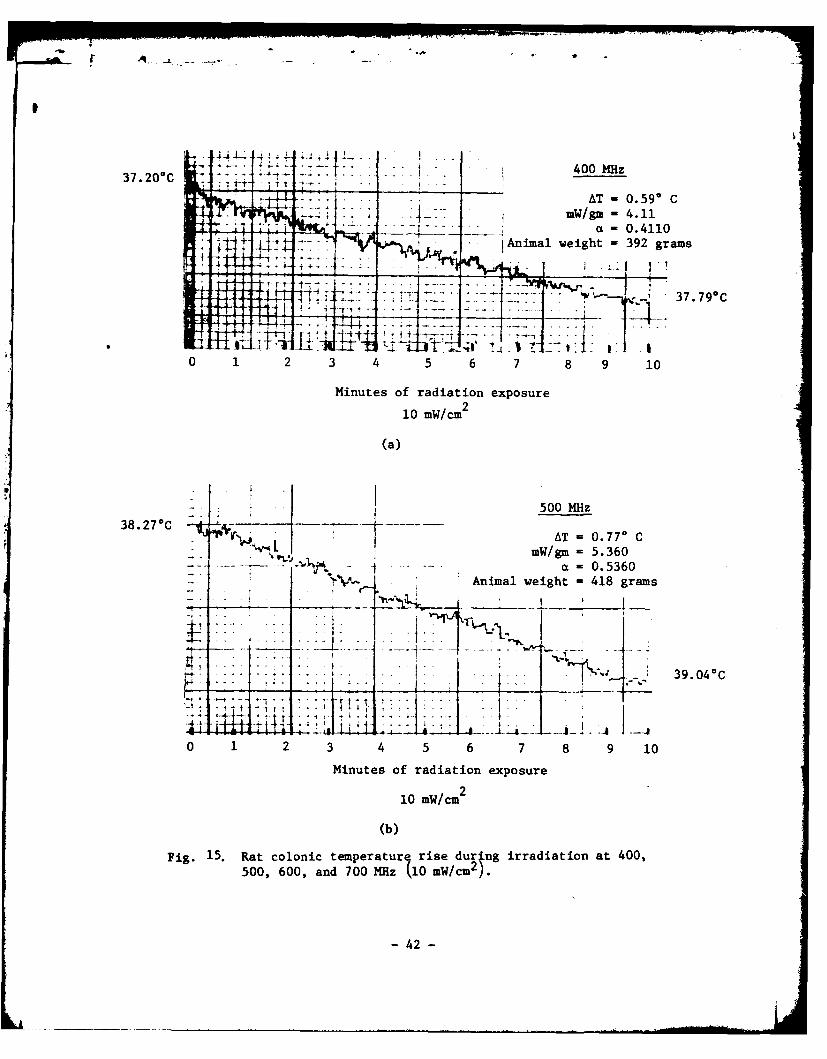
Colonic temperature rise for individual rats is shown in
Fig. 15. A stripchart recording of colonic temperature rise
is presented for each of the frequencies studied to date
(400, 500, 600, 700 MHz). Visual inspection of each record-
ing shows that the temperature rise during irradiation seems
2a linear function. Use of 10 mW/cm 2 field intensities is
adequate to demonstrate the resonance phenomenon in Long
Evans rats. We will, ho,:ever, continue the dosimetric measure-
ments using higher field intensities and whole body calorimetry.
15. Three experiments have been completed to investigate thyroid
(T4 ) response to resonant electromagnetic power absorption in
rats.
- 40 -
r •
T:,~e 7. ;-,t- :y -.,r ,h-i.- -'"''' o g r
...e ,. ., ...: Lon - : raLs.
F--i n T L n ens; '. 10 .. ', ,; ar, L iraLs 45 i'/ i rnb., ,)
An iWe h :11
• -.. A O (gin . ". ' o
400 1. 412 0"40 10 2.737 0.27372. 395 0.550 10 3.83 0.38303. 385 0.730 10 5.09 0.50904. 392 0.590 10 4.11 0.4110
396 0.57* I 3.94 0.3939SD 11.5 0.140 0.97 0.0967
500 1. 418 0.77' 10 5.360 0.53602. 414 0.450 10 3.140 0.31403. 398 0.750 10 5.230 0.52304. 408 0.710 10 4.950 0.4950
409.5 0.670 4.67 0.4670SD 8.71 0.150 1.0
600 1. 380 1.230 10 8.569 0.85692. 370 0.760 10 5.295 0.52953. 428 0.900 10 6.271 0.62714. 412 0.980 10 6.830 0.6830
X 397.5 0.970 6.740 0.6740SD 27.1 0.200 1.370 0.1370
700 1. 409 0.830 10 5.78 0.57802. 420 0.450 7 4.48 0.4480
3. 404 0.570 10 3.97 0.39704. 380 0.850 10 5.92 0.5920
403.3 0.680 5.04 0.5038SD 16.9 0.200 0.96 0.0963
- 41 -
I
400 MHz
AT "0.590 CmW/gm 4.11
a 0.41104- 1Animal weight -392 grams
.7 37.790c
0 1 2 3 4 5 6 7 8 9 10
Minutes of radiation exposure
10 mW/cm2
(a)
500 MHz38.270C
'I.-AT - 0.770 C• "., w L :m W lg m - 5 .3 6 0
.. -a- Ani- 0.5360Animal weight - 418 grams
0 1 2 3 4 5 6 7 8 9 10
Minutes of radiation exposure10 mW/cm 2
(b)
Fig. 15. Rat colonic temperature rise durlng irradiation at 400,500, 600, and 700 M /z 0 mW cm)
0242 6
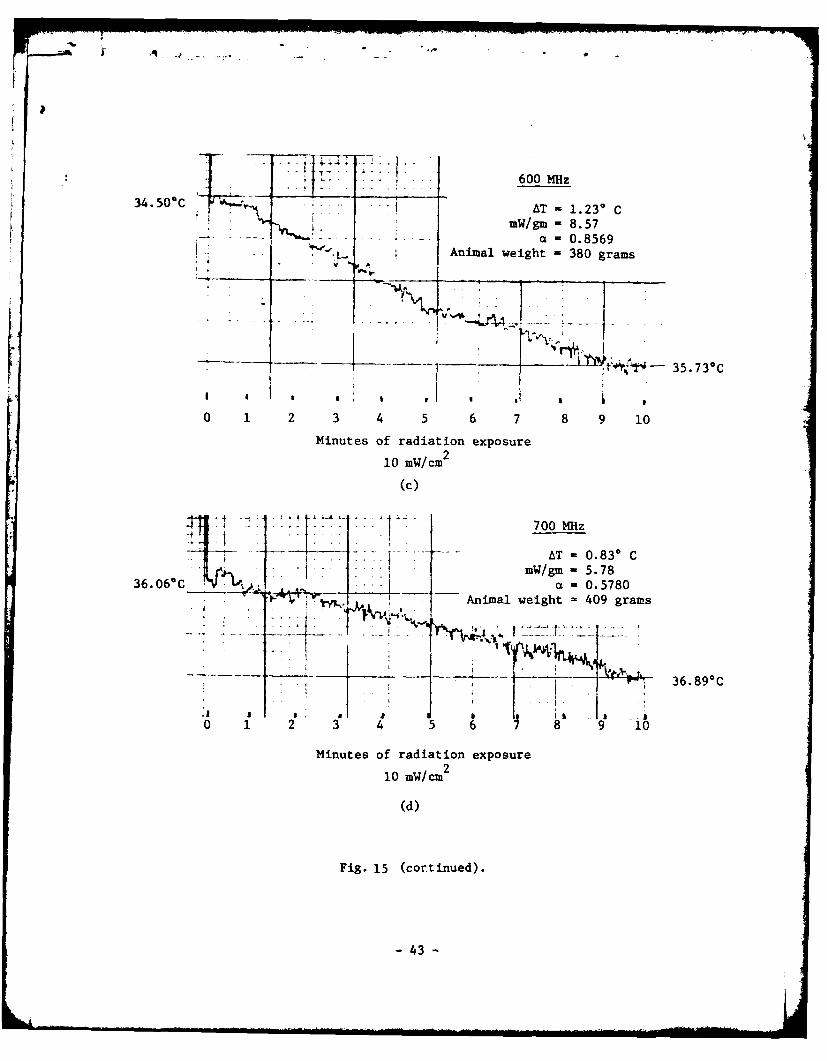
- ...... 600 MHz
34.50*C AT -l.23* CmW/ gm -8.57
V .- 0.8569K.-Animal weight - 380 grams
0 1 2 3 4 5 6 7 8 9 10
Minutes of radiation exposure
10 mW/cm 2
(C)
700 M~z
AT - 0.830 C36.06C a -0. 5780
7 ~ ~ '-I;;2 -Animal weight -409 grams
36.890C
.1 I I0 1 2 3 4 15 6 7 8 19 10Minutes of radiation exposure
10 mW/cm 2
(d)
Fig. 15 (corntinued).
-43
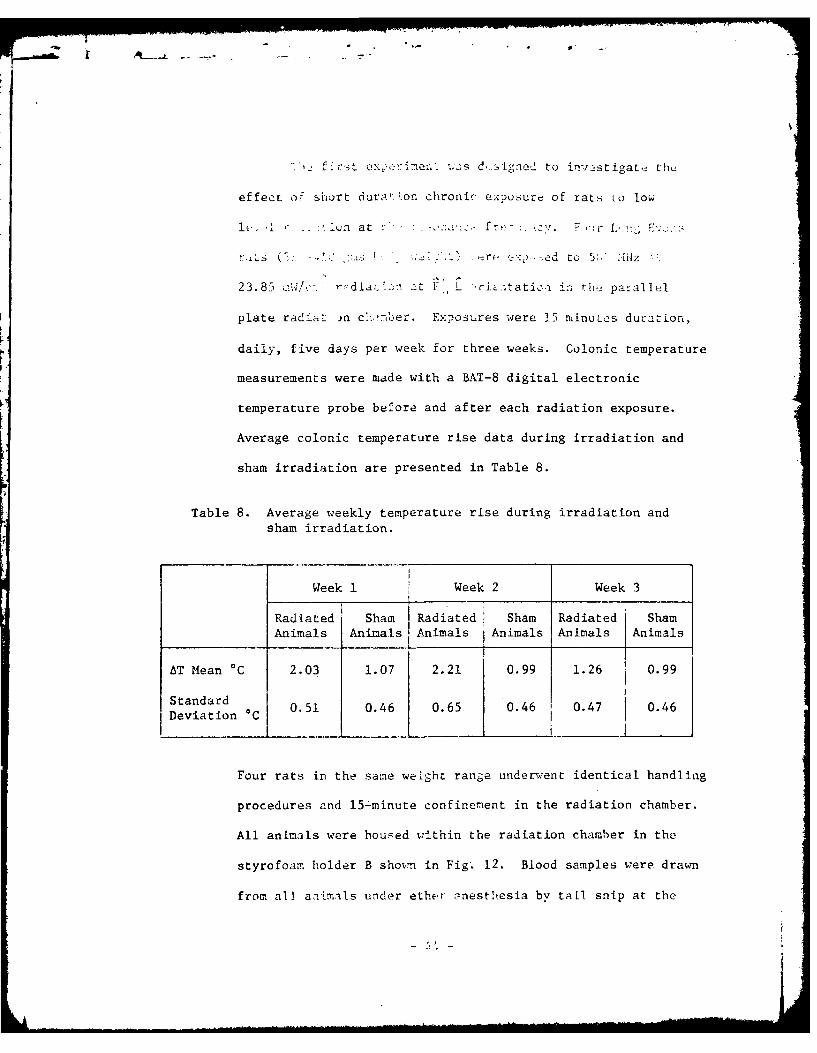
f ;:ct cime, ";,s d,_ iged to investigate thc
effect os short durat!.on chronic exposure of rats Lo low
1-on, at r< . FT
: s (:: - , . . - r <. -ed to 51-. !Hz
23.85 , r/. rdialr *&n at FL L ci-.tatioi In th, parallel
plate radiat -n c!,-,'er. Exposures were 15 minuLcs duration,
daily, five days per week for three weeks. Colonic temperature
measurements were made with a BAT-8 digital electronic
temperature probe before and after each radiation exposure.
Average colonic temperature rise data during irradiation and
sham irradiation are presented in Table 8.
Table 8. Average weekly temperature rise during irradiation andsham irradiation.
Week 1 Week 2 Week 3
Radiated' Sham Radiated Sham Radiated , ShamAnimals Animals Animals Animals Animals IAnimals
6T Mean 0 C 2.03 1.07 2.21 0.99 1.26 0.99
Standard
Deviation 0C 0.51 0.46 0.65 0.46 0.47 0.46
Four rats in the same weight range underncent identical handling
procedures and 15-minute confinement in the radiation chamber.
All animals were housed within the radiation chamber in the
styrofoam holder B shot-m in Fig. 12. Blood samples were drawn
from all animals under ether ,?nesthesia by tail snip at the
strt o .. b the e'd of 1each week.
" 'I.,, i.vi.- s :[Oth s twi M- ic of y.
0!
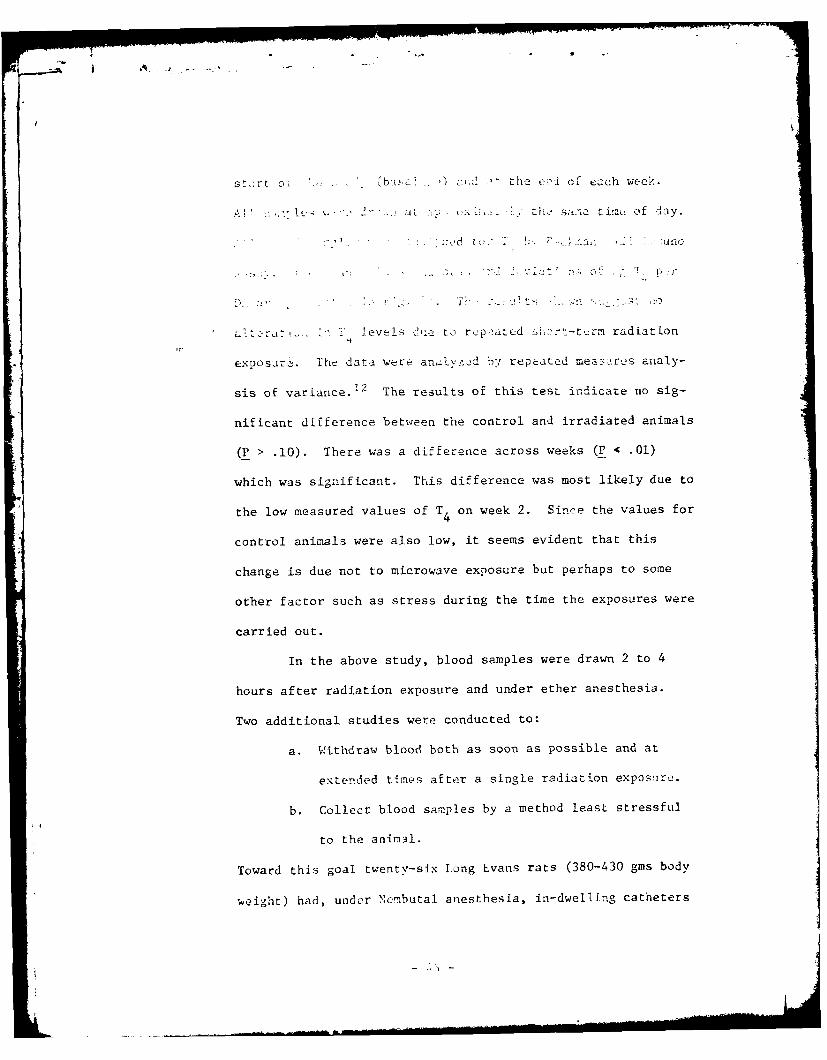
...- levels de to rep-ated st-trm radiation
exposare. The data were analyzed by repeated mear :.trs analy-
sis of variance.12 The results of this test indicate no sig-
nificant difference between the control and irradiated animals
(P > .10). There was a difference across weeks (P 4 .01)
which was significant. This difference was most likely due to
the low measured values of T4 on week 2. Since the values for
control animals were also low, it seems evident that this
change is due not to microwave exposure but perhaps to some
other factor such as stress during the time the exposures were
carried out.
In the above study, blood samples were drawn 2 to 4
hours after radiation exposure and under ether anesthesia.
Two additional studies were conducted to:
a. Withdraw blood both as soon as possible and at
extended times after a single radiation exposire.
b. Collect blood samples by a method least stressful
to the animal.
Toward this goal twenty-six Long Lvans rats (380-430 gins body
weight) had, undor Nembutal anesthesia, in-dwelling catheters
- ,.
E-4A
0
0
44-
0u
-
46-
t [i I . . .do!.. S f Z: < t neck
(22
e. C ' C?: -, " b+C.-n 3 to - -.
surgery.
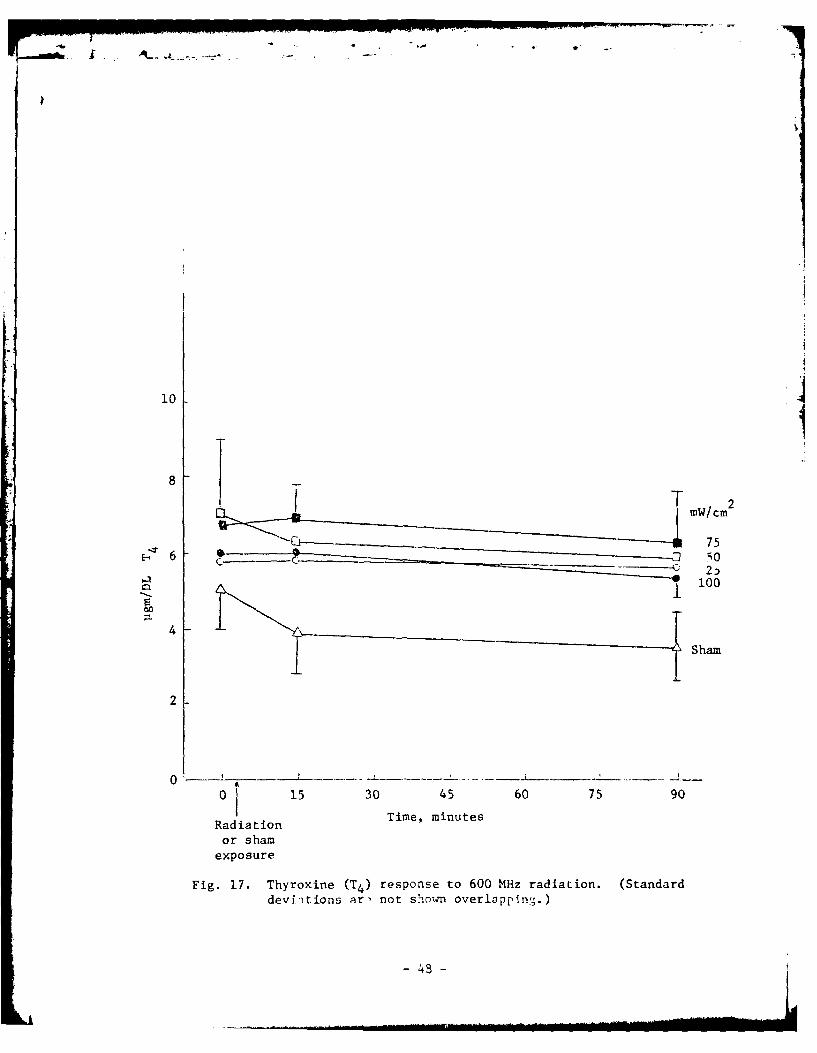
To deterwIne the effect of re onance frequen,:y r diation
on thyroid function (T4 release), seventeen animals were
divided into five groups. A blood sample (.4 ml) was withdrawn
from each of the seventeen animals and was considered a base-
line value. Each group of animals was then exposed once to
600 MHz radiation in EIl L urientation at 100 (N = 3), 75 (N =
4), 50 (N = 4), and 25 (N = 2) mW/cm 2 , respectively, for five
minutes. The fifth group underwent sham irradiation procedures.
All radiation exposures were done in the monopole-above-ground
radiation chamber immediately after the withdrawal of blood
for a baseline value. During irradiation and sham irradiation
within the monopole-above-ground chamber, rats were housed in
the Plexiglas holder (Fig. 13) described in this report. Ad-
ditional samples were t,.. 'wn from the animals at 15 and 90
minutes after the initial baseline sample was drawn. Average
body temperature rise during radiation and sham irradiation is
presented in Table 9. All blood samples were analyzed for T4
by Pantex radioimmuno assay of thyroxine. The results of this
analysis are presented in Fig. 17. Examination of these data
- 47 -
10
8
mw/cm 2
k 75
S 100
4
Sham
2
01 15 30 45 60 75 90
Radiation Time, minutes
or shamexposure
Fig. 17. Thyroxine (TO) response to 600 MHz radiation. (Standarddev.'htiotis ar, not shcnwn overlapping.)
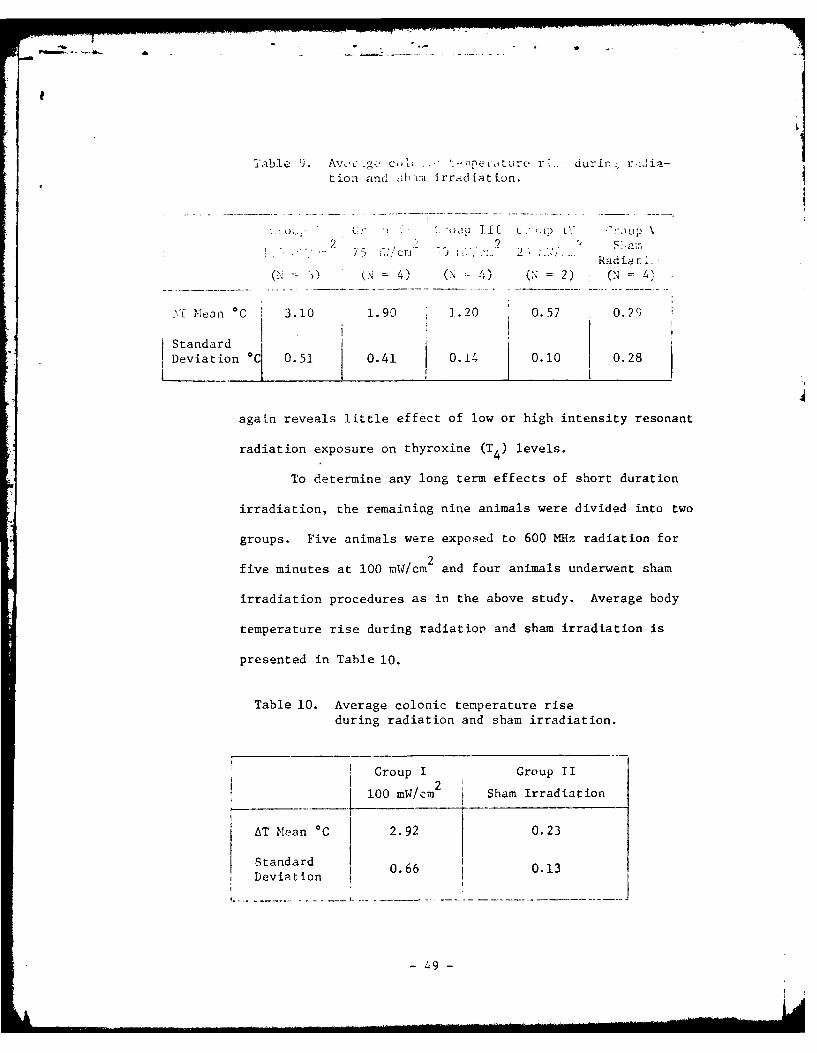
'able 9. Avo c -. . ,r peL ,dLur r .: durir. r.jia-tion and =;_xm irradiation.
.. .. Cr , ( "p II[ "..u .."-,LIP
2Radia t 9.
0( , 4) (.4 ) (N = 2) (N = 4
,' Mean OC 3.10 1.90 1.20 0.57 0. 2 ,Standard
Deviation 0C 0.51 0.41 0.14 0.10 0.28
again reveals little effect of low or high intensity resonant
radiation exposure on thyroxine (T4 ) levels.
To determine any long term effects of short duration
irradiation, the remaining nine animals were divided into two
groups. Five animals were exposed to 600 MHz radiation for
five minutes at 100 mW/cm 2 and four animals underwent sham
irradiation procedures as in the above study. Average body
temperature rise during radiation and sham irradiation is
presented in Table 10.
Table 10. Average colonic temperature rise
during radiation and sham irradiation.
Croup I Group II2 1
100 mW/cm Sham Irradiation
AT Mean 0C 2.92 0.23
Stnad0.66 0.13
Standard
Deviation
- 49 -
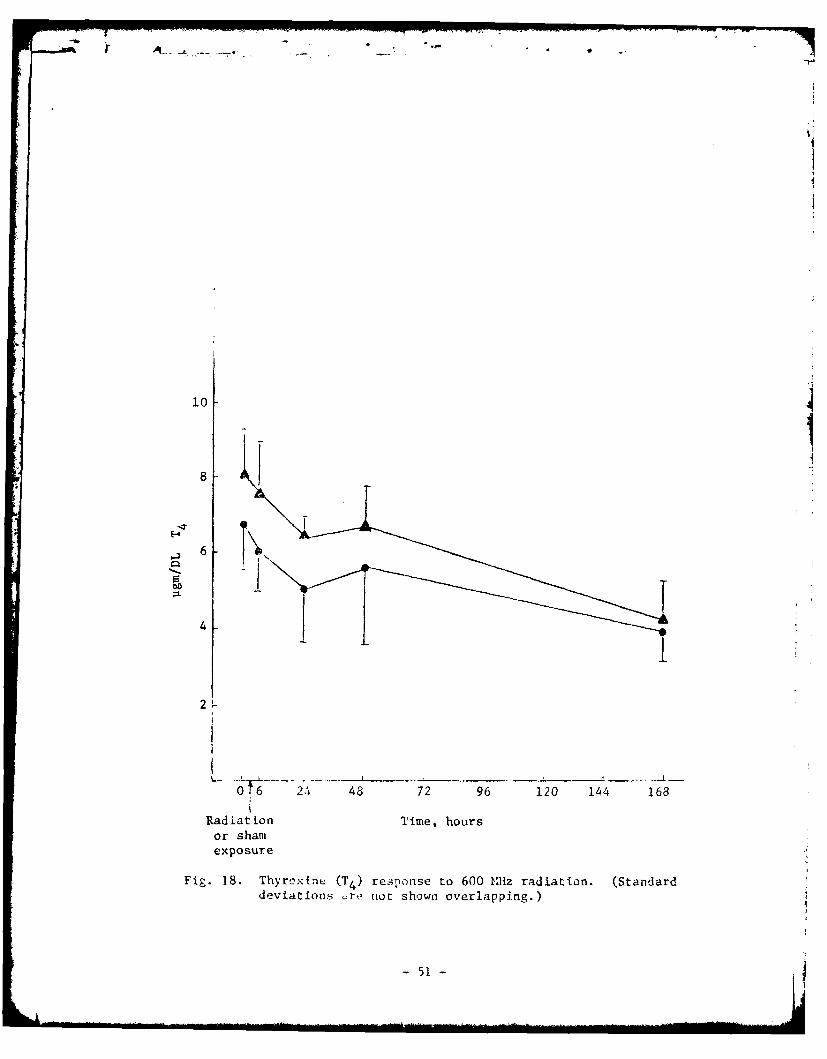
Kaselin¢ blr A sainpl.- vrre draon as in the abzv-
Tt~v Tri-d I.( d:il: r i3W1n fro-:7 "in~- rat.-
6, 1, , anv 6 . . ..u *.. . - L..
s s ci .'~di P8 -':ad . a
of Lhyro fi e. Tho rcsiillr of t1; a ,'y.;s-, Fig. 18, ag:Iin
reveal ILttle effcLt cf rsu.o~:it radiation exposur, on T4
respcose in the rat as compared to sham irradiated animals.
In the three studies described above, there is a
gradual decrease in T4 with time. This effect, however,
appears for both irradiated and sham irradiated animals.
Animals of the first experiment subjected to repeated ex-
posure of low level radiation (23.85 mW/cm 2 ) did appear very
docile and lethargic upon handling compared to the sham ir-
radiated controls. This may have been due to the daily
thermal load to which the animals were subjected. This ef-
fect was not observed for animals of the second and third
experiments. Nevertheless, the gradual decrease in T4 ap-
pears to be due not to microwave exposure but rather to some
other factor. Although the evidence is by no means conclusive,
it seems apparent, under the experimental conditions used,
that no direct effects of resonance frequency irradiation on
thyroid function were observed in the adult rat.
16. Experiments have recently been completed to determine the ef-
fect of resonant and nonresonant electromagnetic power absorp-
tion on rats performing a lever-pressing task on a variable
-50-
r
101
8
!6
4
2'
0 24 48 72 96 120 144 168
Radiation Time, hoursor shamexposure
Fig. 18. Thyroxine (T4) respcnse to 600 MHz radiation. (Standarddeviations ire not shown overlapping.)
51 -
interval 3 - ~ I '-:f r .: s.:J ] . E : r 'a ,
a dt.lt (... -- 5 - 0 -ra 1: ody we i t) 'c-ce r -: to p - [
Slev , ta.:' . - - . , n
the. . . _ . . . - .. radii a i - t-.s *.-re
indiL-idua' , .. r.> _. c-pos.f-" to 400, 1. "Q, .. J... Y00
N1z C. radiation at 20 2c/2 field intecsiry with th!. length
of the antcmai paral:cl to the electric fields. All radiation
exposures produced behavioral deficits. The suppression of
behavior was greatest for exposures to 600 MHz radiation. The
six remaining rats were exposed to 600 MHz CW radiation at
field intensities of 5, 7.5, 10, and 20 mW/cm2 while perform-
ing the behavioral task. The exposures at 20 and 10 mW/cm2
produced suppression of behavior, while exposures at 5 and
7.5 mW/cm 2 showed no measurable effect on performance. In
addition some rats were exposed to pulsed 600 mHz radiation
(1000 pps at 3 and 30 microsecond pulse durations). Pulsed
radiation conditions showed no measurable effect on rat
performance. The data show that the resonant frequency of
power absorption for the adult Long Evans rat is 600 MHz,
while suppression of VI-30 second responding, due to short-
term radiation exposure, requires a field intensity of
10 mW/cm 2 or greater. A copy of this paper (submitted to
Rad-" S " z:. for editorial review) is attached as Appendix G.
- 52 -
7 :ers s .t-sd or Prtseat.od.,".et ns .: < .
1. ,. ,a:ochi, I -- Len dr , ; ..h ,,F.;:.f
" omiianeti.c ha,;es" .
,.-.::i : ;:.": . .0 .oi. B'L- 2, :' .::Ib :-- 97 , pp. 536-:> 2.
2. 0. P. ., "a Ciiio! of SL: ;L(c _,omagoiL ic P-'. -r
Depeo i-n in Man and Animals", IEEE Transaz2 .3o o-4 M:ro.ie
Theory arid Teohniiques, Vol. FLIT-23, December 1975, pp. 1021-1029.
3. J. A. D'Andrea, 0. P. Gandhi, and R. Kesner, "Behavioral Effects
of Resonant Electromagnetic Power Absorption in Rats", 1975 US1 C/
URSI ' -?eting Digest of TechnCaZ Papers. Complete paper to be
published in the proceedings of the series on Microwave Biological
Effects.
4. 0. P. Gandhi, K. Sedigh, G. S. Beck, and E. L. Hunt, "Distribution
of Electromagnetic Energy Deposition in Models of Man with Fre-
quencies Near Resonance", 1975 USNC/URSI Meeting Digest of Tech-
nical Papers, p. 201; complete paper to be published in the pro-
ceedings of the series on Microwave Biological Effects.
5. 0. P. Gandhi, E. L. Hunt, and J. A. D'Andrea, "Electromagnetic
Power Deposition in Man and Animals with and without Ground and
Reflector Effects", 1976 USFJC/'USI Yleeting Digest of TechnicaZ
Paper3, p. 42; complete paper to be publishad in the proceedings
of the series on Microwave Biological Effects.
6. J. A. D'Andrea, 0. P. Gandhi, and J. L. Lords, "Behavioral Ef-
fects of Resonant Electromagnetic Energy Absorption in Rats", 1976
US'C/URSI 1eeting D'gjest of Technica7 Papers, p. 93; complete
- 53-
~.~rto hu s: _tl L:-r'c.: b- -lasC
ce B~uu lolo, A
p. 66; complt-te paper to be pL. .4.Lhed in the proccedi:,,-s of the
series on Micro;~ave Biol-ol-ical E. -iects.
8. 0. P. Gandhi and K. Sedigh, "Biological Phant-om Materials for
Simulating Mlan at Different Frequencies", 1976 USIC/IUPSI ieet--1?zg
Digest of Technical Papers, p. 40.
9. Mf. J. Hagmann, 0. P. Gandhi, and C. H. Durney, "Upper Bound on
Cell Size for Moment-Method Solutions with Hard Scatterers",
submitted for publication to IEEE Transactic':s on Alicrou'ave Theory
and Techniques.
10. M. J. Hacgmann, 0. P. Gandhi, and C. H. Durney, "Procedures for
Improving Convergence of Moment-Method Solutions in Electromag-
netics", submitted for publication to IEEE Transactions on Antennas
and Propagation.
Papers in Preparation
1. 0. P. Gandhi and E. L. Hunt, "Electromagnetic Absorption in Man
and Animals with and wit,.hout Ground Effects", to be submitted for
publication to IEEEr Trcznsac -ions or IMior'clave Theory and T,,chriques.
2. 0. P. G~tidhi and E. L. Hunt, "Enhaincement in Electromagnetic Power
-54
Deposit io- lur Na.:: and Ant:':.ls in the Prese -ce of Reflecting
S-:r r ces", to be s- ..i for pubi 1c. ion ) tio. 2 ' n.3, s
3. P. Ca T. . °1-
3. J. A:. .'2 ,J. -. h JGari . . . .anl, and .. L. Hu ,.
,F.. _U * .,,poun::e C,:.~ ror Rat Used in I'.- ',avioa Mcr -L.'AI
Radiation Research", to be submitted for publication to Joz.,-,ai
of .:owae Power.
- 55-
A --
. . C. J r,::±n ,ic " K. C. -&. wc. in, f: 7 : .
- . Prentixe.-H i , inc., F-.ie. d s, .. ,
3, 3 • L33-'.:
2. H. JW, . " cra,-U1 Bi Conpany,
New York, 196, p. 11-3.
3. H. Dreyfuss, The Measure of Man., lhan Factors in Design, Whitney
Library of Design, New York, 1967.
4. 0. P. Gandhi, K. Sedigh, G. S. Beck, and E. L. Hunt, "Distribution
of Electromagnetic Energy Deposition in Models of Man with Fre-
quencies Near Resonance", 1975 7SNC/URSI Meeting Digest of Tech-
nical Papers, p. 201. Complete paper to be published in the
proceedings of the series on Microwave Biological Effects.
5. H. Massoudi, C. H. Durney, and C. C. Johnson, "Theoretical Cal-
culations of Power Absorbed by Monkey and Human Spheroidal and
Ellipsoidal Phantoms in an Irradiation Chamber", 1975 USNC/URSI
leeting D-gest of Technical Papers, p. 199. Complete paper to be
published in the proceedings of the series on Microwave Biological
Effects.
6. A. C. Guyton, Textbook of 4dgcaZ Phtysioog'y, W. B. Saunders
Company, Philadelphia, 1968.
7. John Schrot and T. D. Hawkins, "Microwave Frequency and E-Field
Orientation Interact with Aninal Size", 1975 UENC/JRSI Aleeting
Digest of Technucal Papers, p. 233; complete paper to be pub-
lished in the proceedings of the series on Microwave Biological
Effects.
- 56 -
K .1<. M. Ch,- L' . S. Ga 'in- a ". ed EM :.c! Absorb, Power
, . 1-" in:.an .<:.. .,s by 1 to 50' -1 : E- . . I 1'c.inccal
!- • )i N ..... :-
r. r° :L -
10. C. C. Johnson, C. H. Durn2y, J. L. Lords, n:id G. K. Living-:'On,
"Fiberoptic Liqcid Crystal Probe for Absorbed Radio Frequency
Power Temperature Measurement in Tissue During Irradiation". In
Paul Tyler (Editor), "Biologic Effects of Nonionizing Radiation",
AnnaZs of i!ew York Academy of Sciences, 1975, Vol. 247, pp. 527-
532.
11. P. W. Barber, "Electromagnetic Power Deposition in Prolate Spheroid
Models of Man and Animals at Resonance", submitted for publication
to IEEE Transactions on Biomedfcal Engineering.
12. B. J. Winer, StatisticaZ Principles in Experimental Design, McGraw-
Hill Book Company, New York, 1971, pp. 514-599.
- 57 -
APPENDIX A
BIOLOGICAL PHANTOM MTERIALS FOR SIIMULATING MANAT DIFFERENT FREQUENCIES
Om P. Gandhi and Kazem SedighDepartments of Electrical Engineering and Bioengineering
University of Utah, Salt Lake City, Utah
Abstract
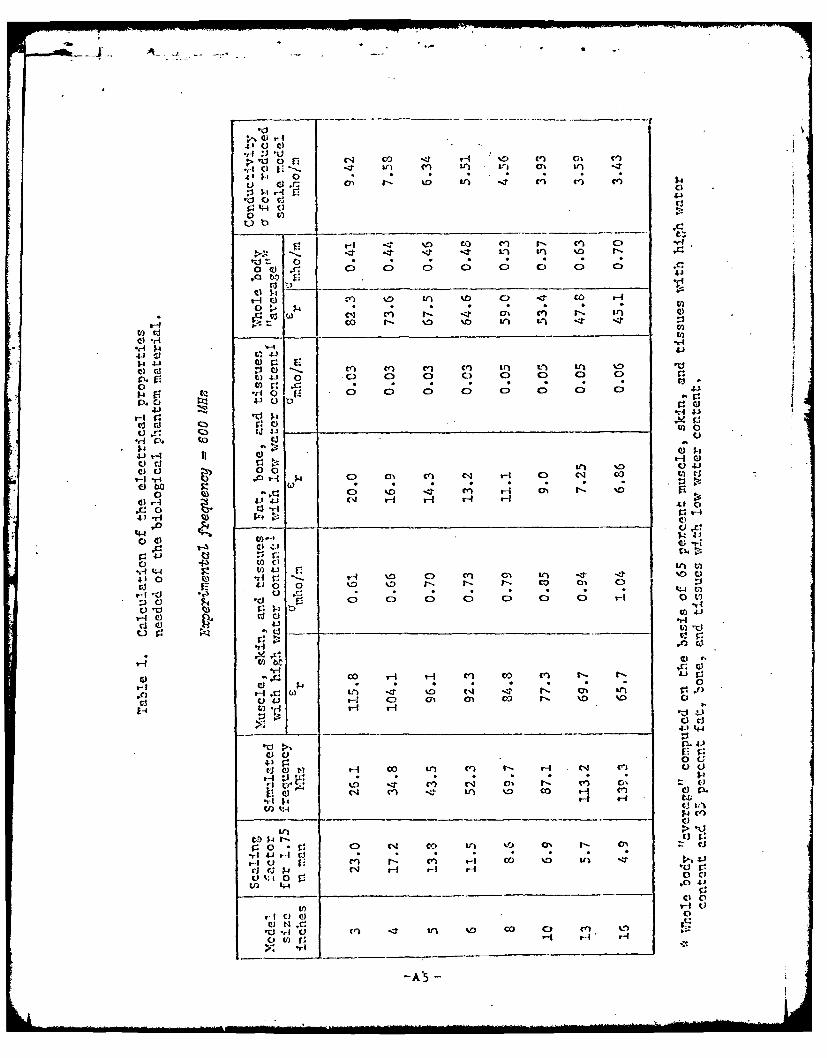
The paper gives compositions of biological phantom materialsfor simulating man over the frequency range 13-230 MHz (includingthe important resonance regions of 3 and 65 MHz). These materialshave been developed to fill eight proportionately scaled man-shapedcavities of height 7.6-40.6 cm for dosimetric measurements at 300,400, 600, 915, and 985 11Hz. Complex permittivity (cc) measurements atthe irradiation frequencies were made using a modified version of thecoaxial line method used previously by Guy. Models reduced by inall dimensions allow simulation of man at frequencies given by(experimentation frequency)/ , provided materials with Ec. at the(lower) simulated frequencies are used. Whole-body "average" valuesof c at simulated frequencies were first calculated on the basis of
65 percent muscle and tissues of high water content and 35 percentfat, bone, and tissues of low water content from extrapolated valuesfor these tissues from Johnson and Guy's article. Several compositionsof salt, polyethylene powder, Superstuff, and water were first measuredfor cec's at the six experimental frequencies. Interpolated composi-tions were then measured and modified, if necessary, for desired per-mittivities.
Paper presented at the 1.976 URSI meeting, Series on Biological Effects;of Electromagnetic Waves, Oclober 10-15, University of Massachusetts,
Amherst.
Al
A.
DIOLOGICAL PMiUNTOM MATERIALS FOR SIMULATING
)1A-N AT DIFFERENT FREQUENCIES
Om 1'. Gaudhi and Kazem SedighDepartments of Electrical Engineering and Bioengineering
University of Utah, Salt Lake City, Utah
Introduct:ion
An' important aspect of electromagnetic wave biological-effects
research is the quantification of absorbed dose and its distribution
in biological systems. For human s the experimentation may be done by
using either the full scale or reduced scale models that use materials
having the same complex p.rmittivity E = (Er - Ji/Wc) as that of the
system that is to be simulated.
For whole body exposure situations, reduced scale models are
preferred for convenience of handling. From electromagnetic field
theory, a body reduced by a factor of 0 in all dimensions may be used
to obtain absorption characteristics of the full body, provided an
irradiation frequency scaled up by a factor cf a ir used. For dis-
tribution of power deposition, high field intensities on the order of
50-150 mW/cm2 are generally needed to prevent the pattern from being
smeared by heat diffusion. A limitation often encountered is that the
high power sources needed for experimentation are not very widely
alterable in their operation frequencies. Use of carefully propor-
tioned different size models at a given experimental frequency way
Paper presented at 1976 USNC/URSI iueetin,g, Amherst, Massachusetts,
October 31-15, 1976.
A2
therefore be used to simulate man at frequencies given by (expcri-
mental frequency)/O. It is necessary, however, that for such experi-
ments the complex permittivity for the mixtures used in the various
models be different and have the values corresponding to the values
for man at the reduced frequency that is being simulated. With these
scaling precautions, the distribution of power deposition in the
reduced-scale model is identical (though the magnitudes are higher
by a factor of 0) to that of the full-scale body.
To simulate lower frequencies where wavelengths are consider-
ably larger than the dimensions of individual parts of the body, whole
body "average" values may be used for the c 's of the homogeneous
filler media. This is a valid procedure to frequencies on the order
of 200-300 MHz. At higher frequencies a more detailed representation
of the body is, however, needed. Different compositions of biological-
phantom materials should then be used to simulate the "average" elec-
trical properties of individual parts of the body. It is fortuitous
that at such frequencies the depth of penetration in the torso is on
the order of a few centimeters,1 and only the compositions of the top
layers may therefore be considered to calculate the "average" C .
For legs, arms, head, etc., a more careful determination of sc may be
in order, based in the first instance on the distribution of power
deposition as though these parts were isolated from the rest of the
While detailed power distributions in the torso are not known and
this assusnpt ion may indeed need to be justified, the previous
experiments with spherical targets I also showed that the penetra-tion of waves at larger frequencies 11 < diameter d] wdas super-ficial in nature.
- A3-
body.
For near-field or part-body exposure situations, full scale
models (1 -- 1) are quite convenient and may therefore be preferred.
Experimaents of this type are often needed in arriving at the optimum
design for applicators.
Materials and Methods-of Procedure
As described above it is necessary to develop biological-phantom
mixtures for complex permittivities at the experimental frequencies
that simulate man at lower frequencies. For available experimental
frequencies of 300, 400, 600, 915, and 985 MHz, the E 's needed for
eight proportionately scaled man-models have been calculated and are
given in Table 1 for an illustrative case of 600 1111z. Corresponding
numbers have been calculated for the remaining four frequencies andt "require e rs varying between 35 and 105 and a varying between 2.3 and
14 mho/m.
Using the homogeneous compositions developed here, it should be
possible to obtain dosimetric measurements for man over the frequency
region 13-230 11Hz, which includes the important resonance regions 2 , 3
of 33 and 65 MHz.
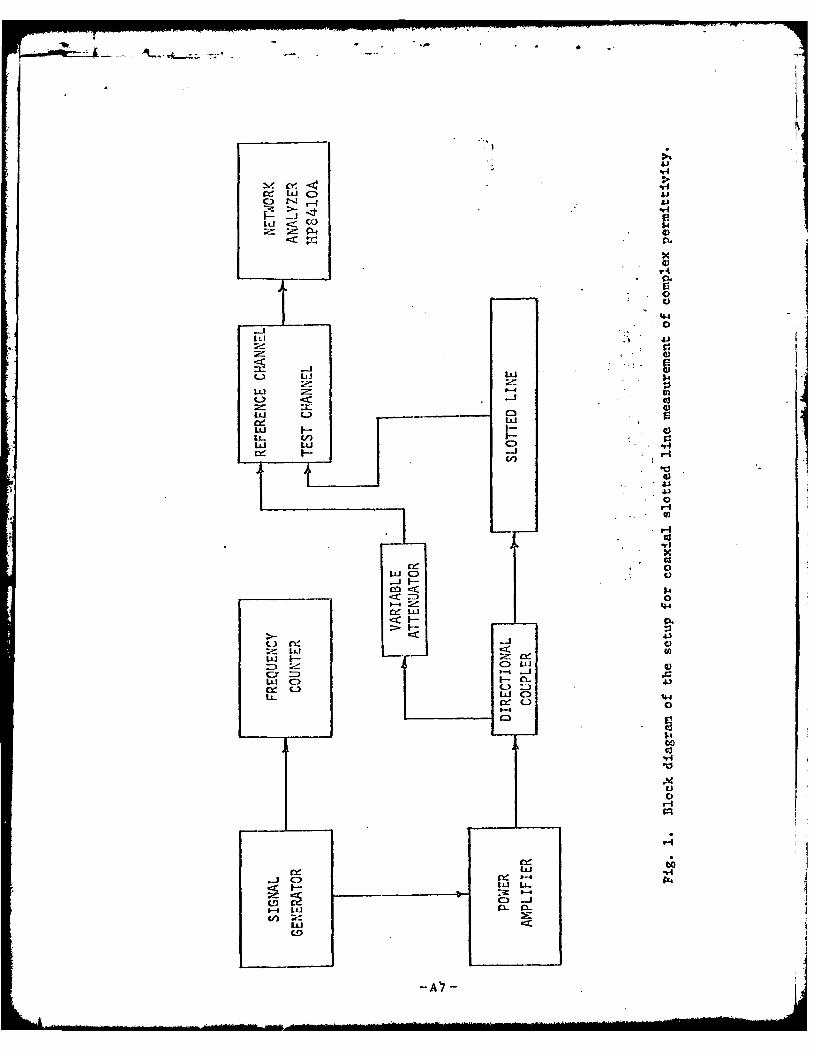
Nine mixtures of compositions given in Table 2 were measured at
the five experimental frequencies, using the arrangemnent'l of Fig. 1.
A slotted coaxial line (Genera. Radito type 874 LB) was filled with
the respective mIxtures and used to measure the attenuation constants
a and propagation constants 8 through the media with the help of the
-A4-
A-I
4 .1 ) 'd. jj
p.. 02 co %-I r) CO) 0% Cl)
-,- C Iit -. r) c-i Lf) Lr (3% It) 17
4 A1 0 *1-
u) C. - D i) . t ~ i
ob
-T:
0 W4 '.0 C i C C
d w. C4 C4 4 .4 It) Er) 9C 14
14 ~ ~ d 0 0 r D v r n -: ;
0w .t: V 0) 0e 0) C)1 0 n L1 l
CIH. 1 4 C) C.0 C) C) C) -4- CO C0. V) C, X. 3
-rf s C.) C; N; .4 0 C1I. I)
CC) f: QC IC) Vt) Ct *
0 41
C) cr r - > C4 c -
41.13q 4. V c.0 A - '4
C)v-C
414i Ci) In WC. V) 41 .;
0 0 0 to 0 1- f- a- co N1 '3
p C) I4) C;) C) C; ItI 0
o -P ca a
.1ci 'C) 0l C) C)0 0 0 H 0r 1-t
'.
aICd u. 41 Cl) GI C oJ %
C3 ) U P
.&1 0 0
Ma- 00. tnci q
C)CO aI -t o 0) eel C) Nl
.V0 ,-.4 ItWl '1 .4 N 0 C .'
Ln :>
o' 0 .C0C(3r r r% I: CCjct- H CO I) o N a-I ) Ci)0(
.) c. Vi.1rI
-~~~~~c 0. 4 C ' ~ l 0I- Vo C) 0t D C) ,4 C P
'r 4 tn -1 co C3- %
C) V)rA C)-A)
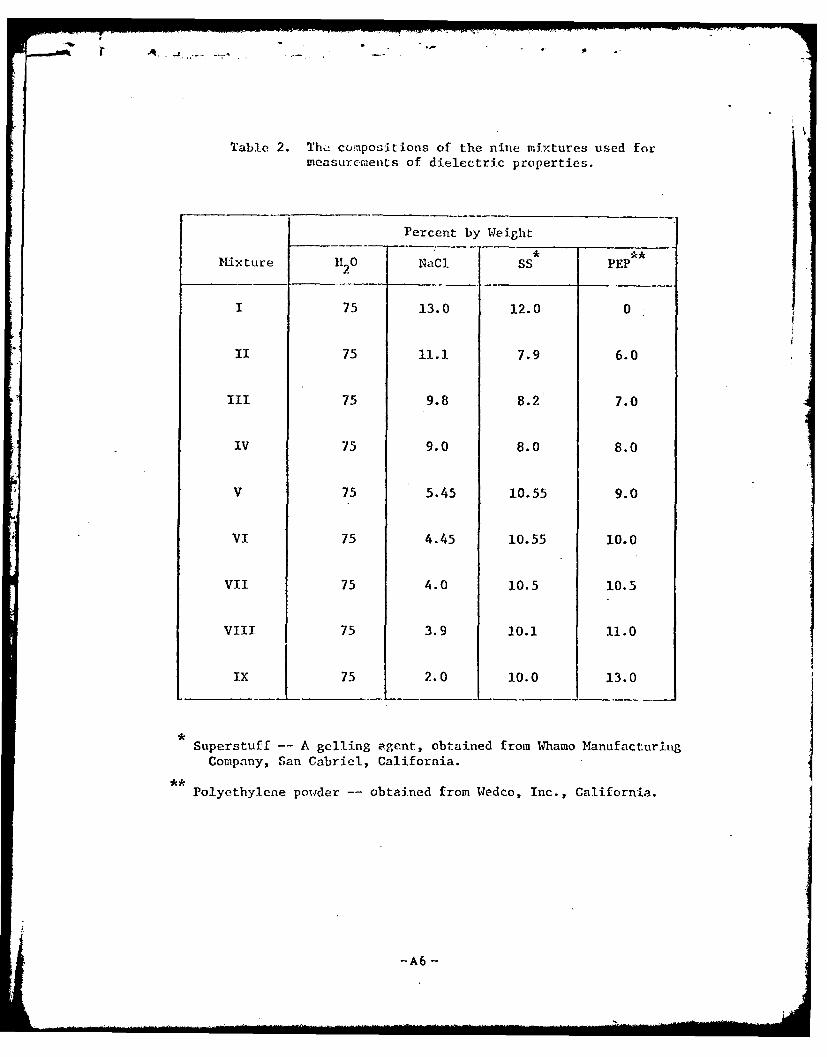
Table 2. Thc ccmpositions of the nine mixtures used formeasurements of dielectric properties.
Percent by Weight
Mixture 12 0 NaCI SS PEP
1 75 13.0 12.0 0
II 75 11.1 7.9 6.0
III 75 9.8 8.2 7.0
IV 75 9.0 8.0 8.0
V 75 5.45 10.55 9.0
VI 75 4.45 10.55 10.0
VII 75 4.0 10.5 10.5
VIII 75 3.9 10.1 11.0
Ix 75 2.0 10.0 13.0
Superstuff -- A gelling agent, obtained from Whamo ManufacturingCompany, San Gabriel, California.
Polyethylene powder -- obtained from Wedco, Inc., California.
-A6 -
.C- .
4
~41
ILI c
Cd
LLxw LL0
'43
*d C)
~ 0
F- Vj
4.1
L.4)
Cr _j
C)) :D
uj CD 44
cc 4a
-AI I
Lii ~ C)U
0
LI C) I-~--reck e (-J
CDo
-A7 -
S _ r A _.. __. . ... ; . . .
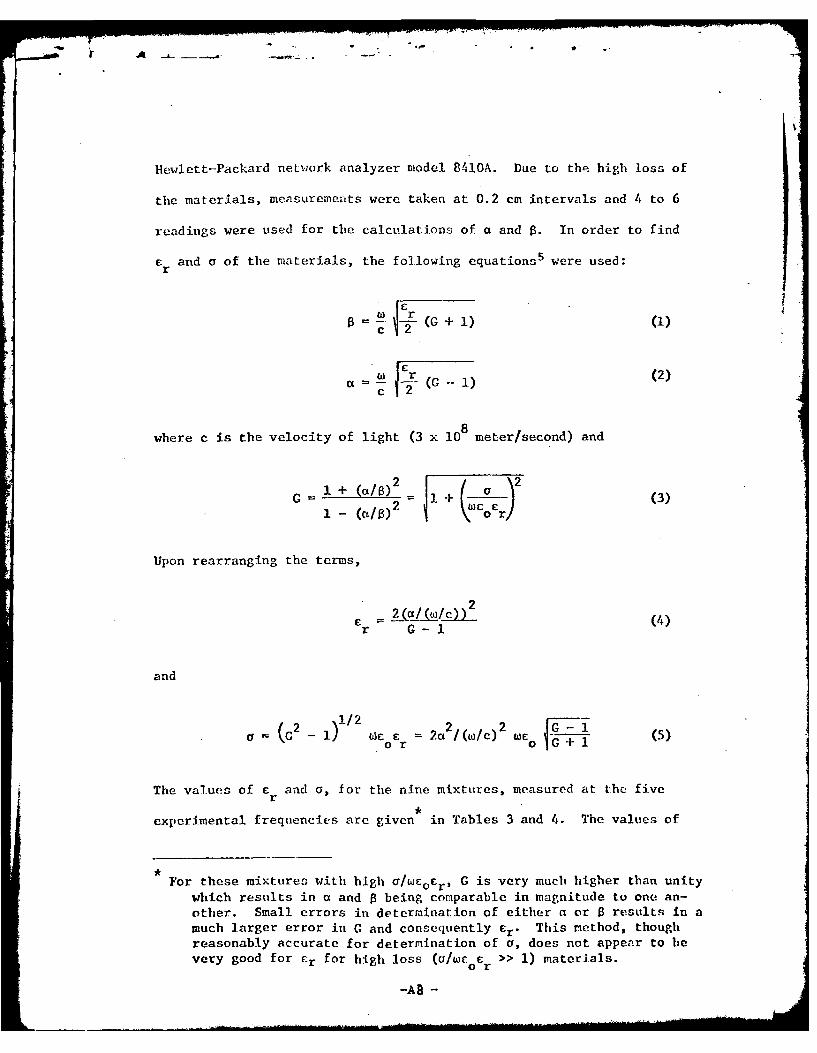
Hewlett-Packard network analyzer model 8410A. Due to the high loss of
the materials, measurements were taken at 0.2 cm intervals and 4 to 6
readings were used for the calculations of a and 0. In order to find
r and a of the materials, the following equations- were used:r
w rc (G + 1)(I
a (2)=- (G - 1)(2C
8where c is the velocity of light (3 x 10 meter/second) and
+- ((/) 2 1 - (3)2
Upon rearranging the terms,
C 2 C,/_(W/c)) (4)r G-
and
or 0 G+I
The values of c and a, for the nine mixtures, measured at the fiver
experimental frequencies are given in Tables 3 and 4. The values of
For these mixtures with high a/wcocr, G is very much higher than unity
which results in a and $ being comparable in magnitude to one an-
other. Small errors in determination of either a or 0 result-, in a
much larger error in G and consequently Er . This method, though
reasonably accurate for determination of a, does not appear to be
very good for cr for high loss (/o/ cr >> 1) materials.
-AS-
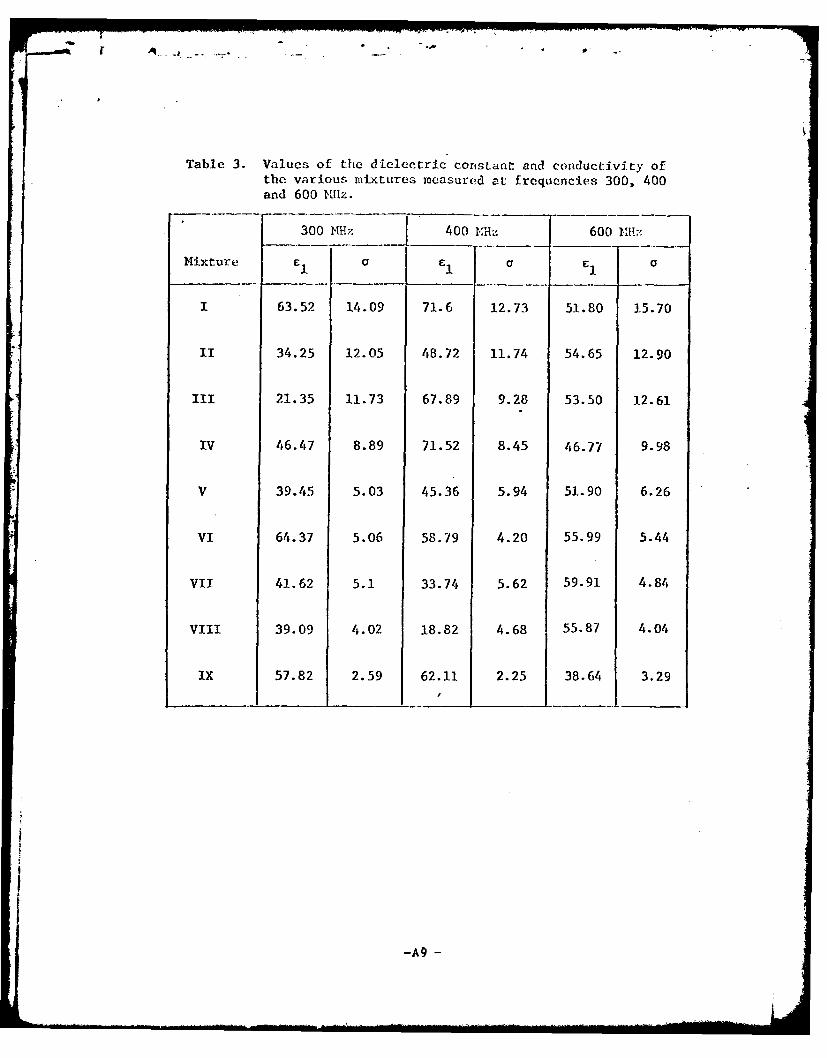
Table 3. Values of the dielectric constant and conductivity ofthe various mixtures measured at frequencies 300, 400and 600 KHIz.
300 MN 400 I!Hz 600 NHz
Mixture l1 a i I a
I 63.52 14.09 71.6 12.73 51.80 15.70
II 34.25 12.05 48.72 11.74 54.65 12.90
III 21.35 11.73 67.89 9.28 53.50 12.61
IV 46.47 8.89 71.52 8.45 46.77 9.98
V 39.45 5.03 45.36 5.94 51.90 6.26
VI 64.37 5.06 58.79 4.20 55.99 5.44
VII 41.62 5.1 33.74 5.62 59.91 4.84
VIII 39.09 4.02 18.82 4.68 55.87 4.04
IX 57.82 2.59 62.11 2.25 38.64 3.29
-A9 -
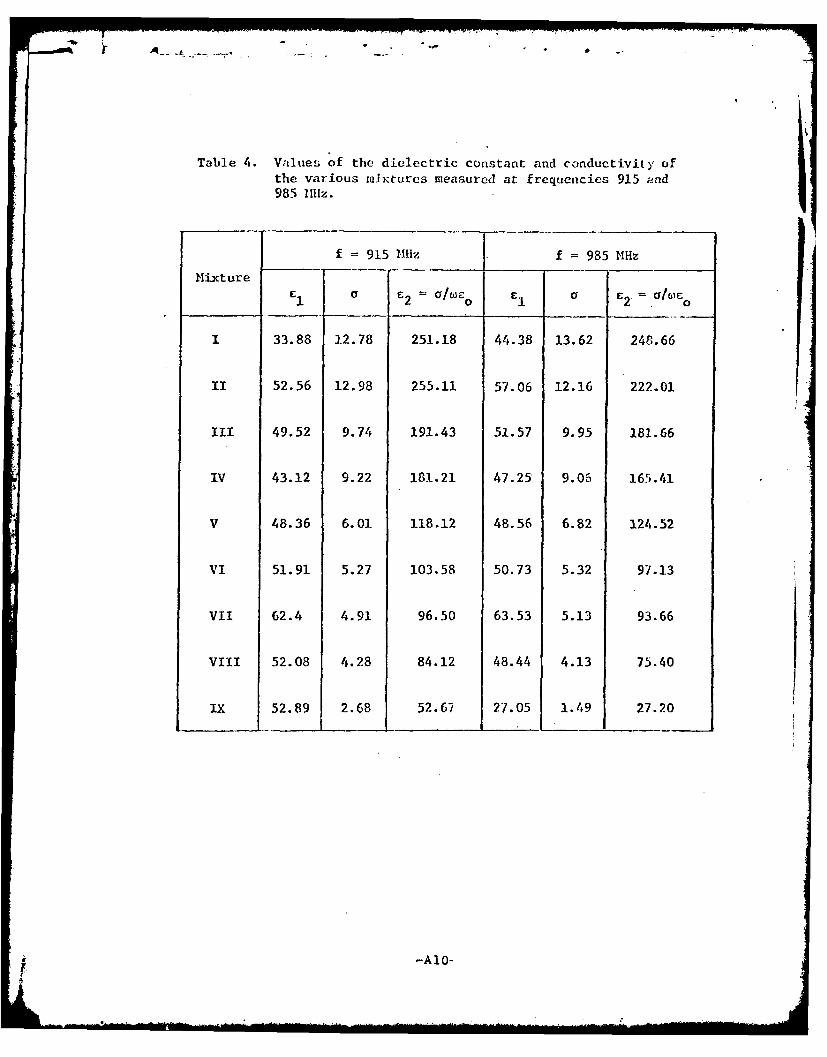
Table 4. Values of the dielectric constant and conductivity ofthe various mixtures measured at frequencies 915 and985 11Hz.
f 915 MHz f = 985 MHz
Mixture
1 I Cr 2 = o/WEo C I2 = o/e°
1 33.88 12.78 251.18 44.38 13.62 248.66
II 52.56 12.98 255.11 57.06 12.16 222.01
III 49.52 9.74 191.43 51.57 9.95 181.66
IV 43.12 9.22 181.21 47.25 9.06 165.41
V 48.36 6.01 118.12 48.56 6.82 124.52
VI 51.91 5.27 103.58 50.73 5.32 97.13
VII 62.4 4.91 96.50 63.53 5.13 93.66
VIl 52.08 4.28 84.12 48.44 4.13 75.40
IX 52.89 2.68 52.67 27.05 1.49 27.20
-AIO-
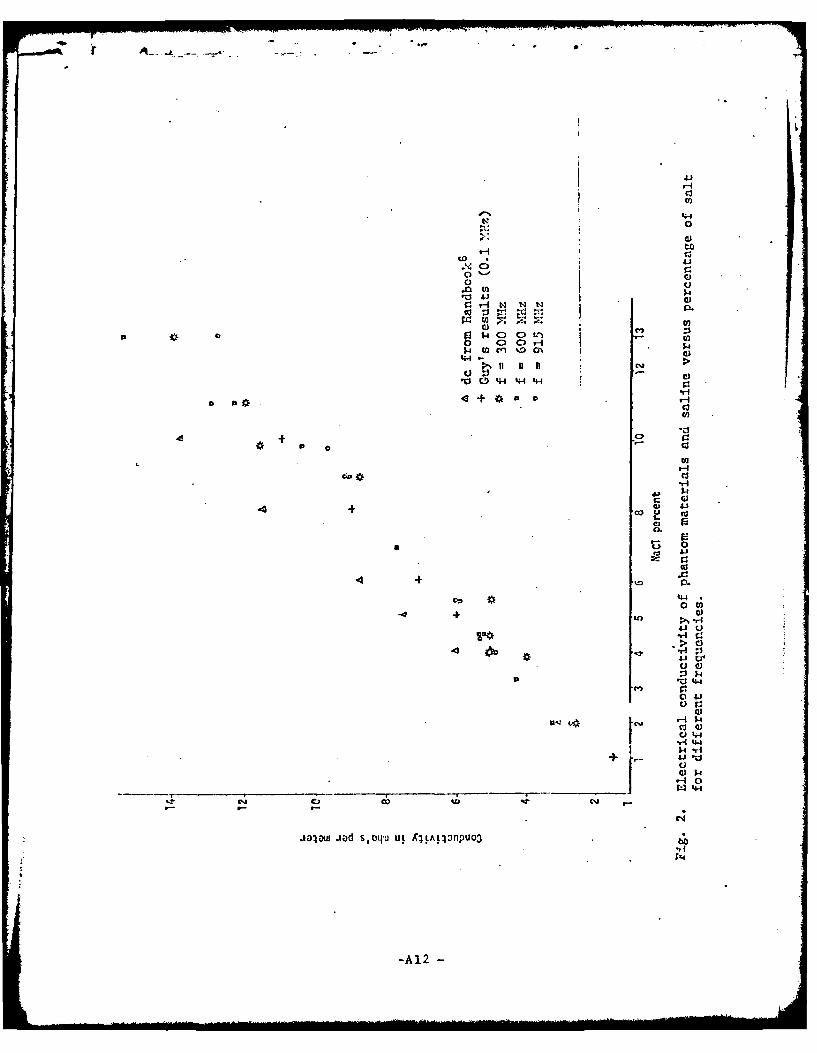
conductivity at different RF frequencies are plotted in Fig. 2 for
different salt contents and compared with the dc6 and low frequency
(f - 0.1 MIHz) values. The conductivity increases linearly with the
percentage of salt and is relatively independent of the frequency.
For any required conductivity, therefore, a percentage of salt needed
for the mixture can therefore be estimated from Fig. 2. To date we
have not developed any simple relationship for c r's needed for the
simulating media.
For simulation at lower frequencies (including the important
resonance regions), a/wc0 is 2 to 4 times er (see e.g. Table 4) and
therefore dominates the complex permittivity of the nedium. Matching
C!WE accurately with the required values while allowing a slight mis-0
match in c therefore does not cause great errors in dosimetria measure--r
ments for simulated frequencies less than about 200 14hz. This point
has been confirmed by measuring distribution of absorbed energy using
the liquid crystal fiber optic temperature probe7 for near-resonant
condition (L/X = 0.417) for free-space irradiation. The model was
filled with a biological phantom material simulant of man at 71.6 MUz.
The distribution pattern scaled to values for the full scale body is
For LA = 0.41-7 or a 5" model at 985 MIHz to simulate 1.75 meter man(at 71.6 MHz), it is necessary that the complex permittivity Er -
al/we o of the filler medium be 58.4 - j130.6, computed on the basisof 65 percent muscle, skin, and tissues with high water contentand 35 percent fat, bone, and tissues with low water content. Thecomposition used for free-space irradiation experinents (5.75 per-cent NaCl, 10.25 percent Superstuff, 9 percent polyethylene powder,
and 75 percent water) has a measured permittivity of 49.5 - j131.7.
-All -
Ici
0)
0
oto
o I
Ot,,-tN t4N .
C.)84
-I m O -I N
44.U 'U I .,j
.cl
-r-
0 . W
u2
.-4
c W
4 w 4-
CL
1.H
r3 0
io
-0
+C Ct)0
CIA
U 444-r4 t$-4
+ 43
0
03 C6 . c'lJ
ja4luw jad s, otp uL (4jAjjonpuo3 1
-A12-
p-
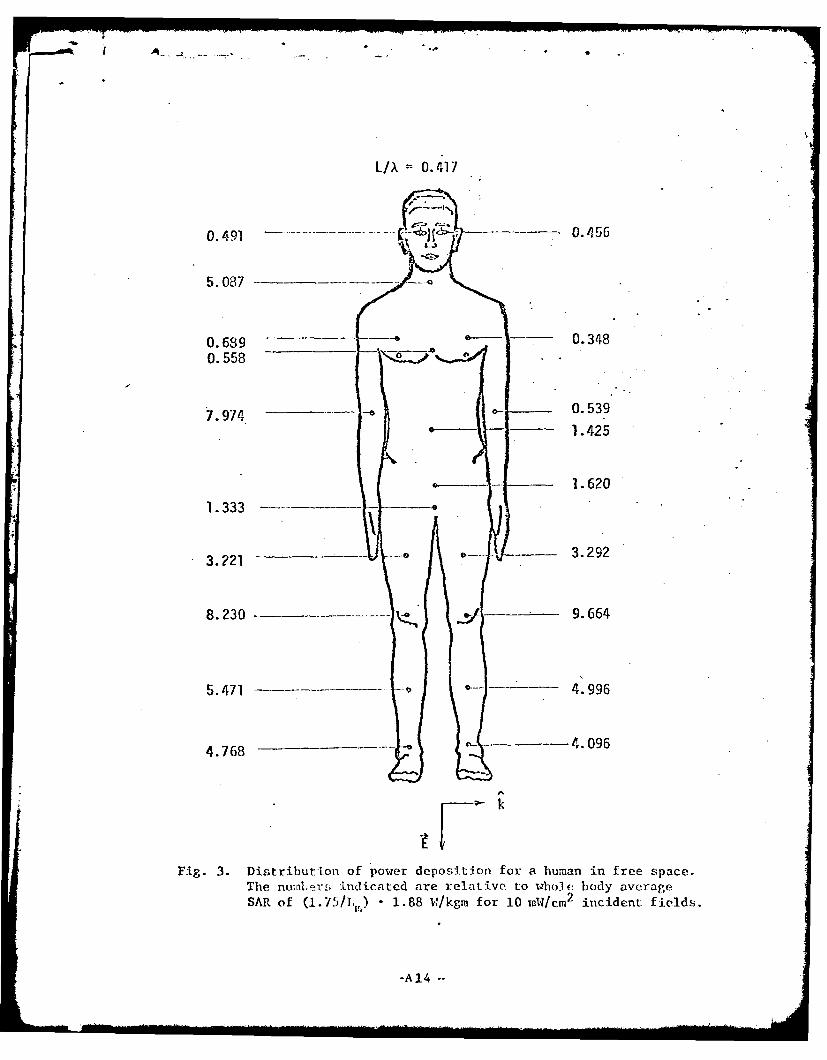
shown in Fig. 3. For free-space irradiation specific absorption rates
(SAR) considerably higher than the whole-body average are observed for
the neck, the legs, and the elbows, with the lower torso receiving
SAR's comparable to the average value and the upper torso receiving
SAR's lower than the average value. Noting that the values indicated
in Fig. 3 are relative to whole-body saline-filled average, it is re-
markable that the weighted average of the numbers obtained with the
biological phantom mixture is not far off from one, or the value ob-
tained with the saline-filled figurine.
Conclusions
In the foregoing we have given the measured properties of some
biological-phantom mixtures for experimental frequencies to 985 1111z.
From these results it is possible to obtain the salt content for a
conductivity required of the biological-phantow material. Vork is
continuing with mixtures of different water and Superstuff contents to
devalop a ternary diagram that may be of help in obtaining required
E fS.r
Acknowledgment
This work was supported by U. S. Army Medical Research and
Development Command, Washington, D. C., under contract DAID 17-74-C-4092.
-A13 -
LIX -0.417
0. 491 .. ....... 0.456
5.087 -
0.689 -- 0.3480.558
7974 -e 0.539
1.425
1.620
1.333
3.221 - " 3.292
8.230 9.664
5.471 - s 4.996
4.7 68 I-4.096
Fig. 3. Distribution of power deposition for a human in free space.The numl,erE indicated are relative to whole body averageSAR of (1.75/T,,) 1.88 1,'/kgm for 10 mW/cm 2 incident fields.
-A14
REFERENCES
1. C. C. Johnson and A. W1. Guy, "Noniizing Electromagnetic W.:aveEffects in Biological Materials and Systems", Proceedings ofthe IEE, Vol. 60, 1972, pp. 692-718.
2. 0. P. Gandhi, "Conditions of Strongest Electromagnetic PowerDeposition in Man and Animals", IEEE Transactions on M$icrowaveTheory and Techniques, Vol. MTT-23, December 1975, pp. 1021-1029.
3. 0. P. Gandhi, K. Sedigh, G. S. Beck, and E. L. Hunt, "Distributionof Electromagnetic Energy Deposition in Models of Ian with Fre-quencies Near Resonance", 1975 USNC/URST Meetinj Su.rnary of Papers,p. 201. Complete paper to be published in the proceedings of the
series on microwave biological effects.
4. A. W. Guy, C. C. Johnson, J. C. Lin, A. F. Emery, and K. K. Kran-ing, "Electromagnetic Power Deposition in Man Exposed to H Fieldsand the Associated Thermal and Physiologic Consequences", ReportSAII-TR-73-13 prepared for U. S. A. F. School of Aerospace Medicine,
Brooks Air Force Base, Texas, December 1973.
5. C. 11. Durney and C. C. Johnson, Introduction to Modern Electro-magnetics, McGraw-Hill, Inc., 1969.
6. Handbook of Chemistry and Physics, Cheraical Rubber PublishingCompany.
7. T. C. Rozzell, C. C. Johnson, C. H. ) urney, J. L. Lords, andR. G. Olsen, "A Nonperturbing Temperature Sensor for Measure-vients in Electromagnetic Fields", Jour-al, of Microwave Power,Vol. 9, 1974, pp. 241-249.
-A15 -
APPIENDIX B
DISTRIBUTION OF ELECTROMAGNETIC ENERGY DEPOSITIONIN MODELS OF MAN WITH FREQUENCIES NEAR RESONANCE
Om P. Gandhi, Kazem Sedigh, and Cary S. Beck
Departments of Electrical Engineering and BioengineeringUniversity of Utah
Salt Lake City, Utah 84112
Edward L. Hunt
Department of Microwave Research
Walter Reed Army Institute of ResearchWashington, D. C. 20012
ABSTRACT
Experimental results are described for whole-body absorption (for orienta-tions t L, ti t, and 111 L) of a series of saline-filled and biological-phantoia figurines of major lengths (L) that varied from 0.4 to 1.5 A. Measure-
ments arc- also reported for several exposure conditions on the density of energydeposition for different regions of the body. In the absence of ground ej-
fects, a whole-body absorption cross section as high as 4.2 times the sbadovcross section has been measured for Ell L at the resonance frequency (in MHz) of
68 x (1.75/height Lm of the human in meters). Under these frequency andpolarization conditions, a whole-body-average energy deposition rate of (2.19)x (1.75/Lm) watts/kgm is projected for incident plane waves of 10 mW/cm
2 . 'Ihe
highest rate of energy deposition is observed for the neck region of the bodywhere a value as high as 28.7 times the whole body average has been measured
under conditions of tli resonance. Maximum whole-body absorption undergrounded conditions is observed at a frequency about one half that of the un-
grounded body. For grounded resonance condition an absorption cross section as
high as 14 times the shadow area has been measured. Here, while the neck is
still one of the hot spots, the zone of maximum power deposition is the ankleregion.
1. INTRODUCTION
We have previously [1, 2] reported on the observation of strong resonance
of whole-body absorption of electromagnetic waves in biological bodies. Inthe absence of ground effects, highest rate of energy deposition occurs forfields polarized along the longest dimension of the body for frequencies suchthat the major length is on the order of 0.4 times free space wavelength (X) of
radiation. At resonance an effective absorption area of about 3-4 tiwes theshadow cross F:ectlon has baen measured using saline-filled prolate spheroidal"equivalents" of man. In these prolate spheroids, a major to vinor axes rotioof 6 was used. On the basis of some preliminary experiments, peak absorption,
in the presence of ground effects, has been observed for frequencies one half
Also consultant to tho Division of Neuropsychiatry, Walter Reed Army
Institute of Research, Washington, D. C. 20012.
From Biological Effects of Electromagnetic Waves--Selected Papers of the
USNC/URSI Annual Meeting, Boulder , CO, Vol II, October 20-23, 1975 (HEW
Publication (FDA) 77-8011).
B1
as riv-h as for bodies isoloted In free s;pace.
Ini this paper wo. report further results on this Important phenomenon. Inparticular, data are presented onl Viole-body absorption o salin:2-filledfigurines of major lengths L varying froia 0.3 to 1.5 X~. Meaurenients are alsoreported onl the distrIbution of power deposition in biological-phantom figu-rines exposed to free-space irradiation at both 985 and 2450 M.~ and to fieldsin the TEM parallel plate (2] chauber. The results obtained under the latterirradiation conditions are s.hown to be rermaykably similar to th-- e with free-space radiation. The highest intensity of unergy deposition Ii both chamlebersis observed for the neck region of the body. The a paramenter (defined as therati o of watts/kgia of absorbed energy to :mW/cm7 of ir ide.lt field Intensity)for the neck region is approximately 30 tines that observed fur the whole-bodyaverage. Initial results are given on figurines with feet touching the groundplane of the parallel-plate chamber.
2. MATERIALS AND METHODS
Cavities corresponding to humuan shapes were forwed in styrofoam by using32.1, 18.4) 22.3, and 23.5 cm tall dolls --s r.olds. After styrofoam had beenformed, the dolls were cut in half around the sagittal plarta for easy removalof the molds. Three cavities, one resealed for filling with 0.9 percent salineand two for stuffing with biological-phantom materials, w~ere formed for each ofthe four sizes.
Different compositious of the biological-phantom material were used tofill the figurines for parallel-plate and free-space Irradiation experiments.From ou,: previous results [1], the frequency of maximun absorption for a 1.75meter tall human is on the order of 63--70 Mflz (L/X t 0.37-0.4). In order tomodel human for this frequency band, an "average" electrical relative perrmit-tivity Er was first calculated oa the basis of 65 percent muscle, skin, andtissues with high water content and 35 percent fat, bone, and tissues with lowwater content. The value of cr needed for modeling for the 63-70 RHz band wascalculated (31 to be 60.5 - j143. The use of whole-body "average" c r Is justi-fied because the dimensions of individual. constituonts are so much smaller thanthe wavelength of radiation for this baud. For iise at 500 MHz in the parallelplate chamber, the composition of the biological-phanitom material was 3.26 per-cent NaCl, 8.74 perc-nt Supcirstuff (obtained from Whamo Manufacturing Company,San Gabriel, California), and 87.0 percent water. This hris a measured (4]diclectric constant of 66 and a conductivity a of 4.39 mhbo/imeter. At thecxperimental frequency of 500 !'1-z, the corip>2 ': relative p -r:itivity of thematerial Is theref, E, - 66 - j afnr, 66 -- j157.9. I ti-fferent compositionof 8.03 NaCi, 13.2> ccent Soperstuff, and 78.74 percent w.ater was used forflec-space irradiatica experirents at 985 K1Th. For use at this frequency cr66 -j164.3, once again close to the needed value of 60.5 - j1.43.
The irradiation facilities used were the parallel pl-ite TE1 chamber atS and free-spnce onechoic chambers at 985 and 2450 MHz. For the parallel
* (h-.ihher [2), theC worhing area consists of a copper plate of width 63.5 cm*t (d by a 25. 4 cio- cearance f rom the ground plane of 316.8 cm, width. The
Il t r;nsmission l ength of 198.2 cm I s occupied by two symmetrical taperedof 6.1 cm axial lcngrh, the central work-ing area (f 61 cm length, and'.1 3. E. ct ion'r; cocimeted to UG58/U input and output coaxial connectors.
V, 0() to 500 MP:, Fpsco signal source wpas used to fevd pov'-r to thisV..- fieldF. in the ccntrizi. (working) region of the chz: ',r were mappedGeneral. Microwave CorporatIon Raham model 1 (300-l.8,tlo 11,1z) field
yprobp. The variation of the fiold intensity in the working region isi n Fi p!. I1(a) , (b), and (c). The 985 and 2450 Miz f ree space f ields
rvided by Scientific Atlanta pyr, fda). horns radiating into the
B2
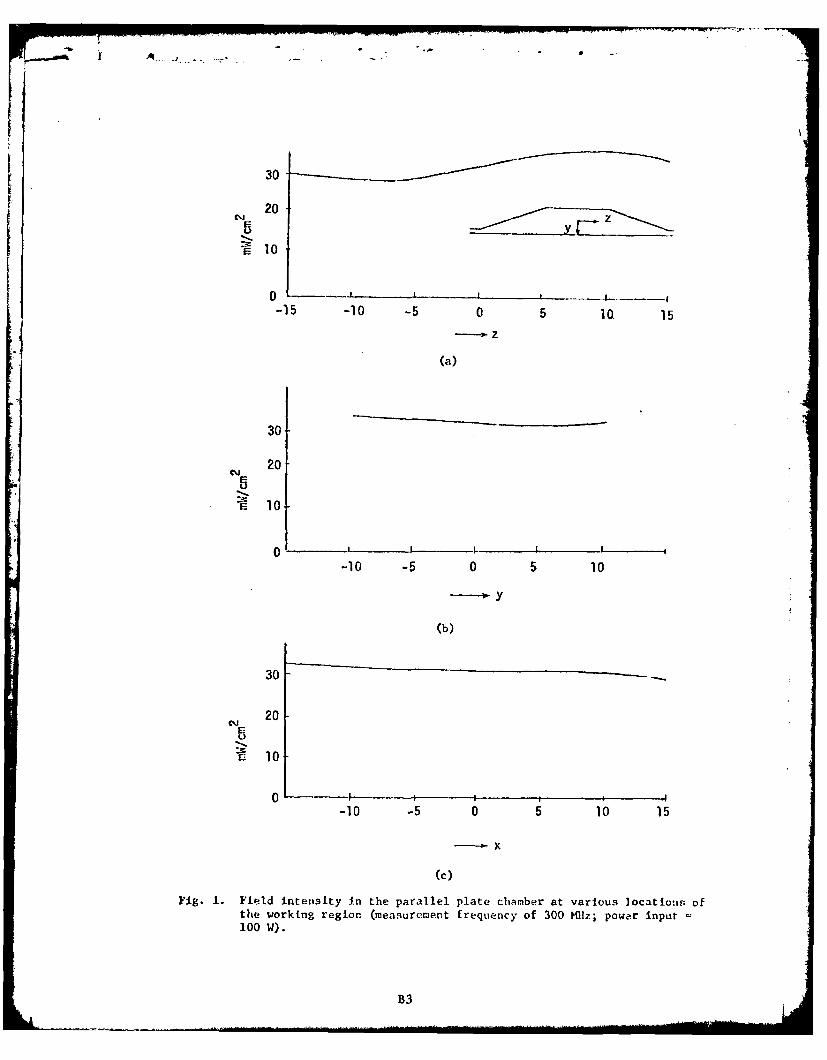
30
S20
E 10
0 -
-15 -10 -5 0 5 10. 15
--- z
(a)
30
20C%j~
E 10
-10 -5 0 5 10
-- y
(b)
30
20U
10 10
o - ; I
-10 -5 0 5 10 15
--- x
(c)
Fig. 1. Field intensity in the parallel plate chamber at various locations ofthe working region (measurement frequency of 300 Miz; power input100 W).
B3
re t. anechoic chmnibvrs at the D~eartment of Microwave Research, Waltcr
geed Army Institute of Research, Washington, D. C.
The whole body power absorption was obtained from the temperature rise: of
saline-filled figurines. The temperatture before and after irradiation wasmeasured with a digital thermometer after shaking the styrofoam cavity figu-rines in order to equalize the temperature over the volume of the saline. To
determine the distribution of power deposition, biological-phantom figurineswere exposed to the highest available radiation intensities to speed up thebeating process and thus reduce the heat diffusion to cooler areas of the body.
Temperature under irradiation was recorded using the liquid crystal temperature
probe [5].
The incident field intensities used in the experiments were considerably
higher for free-space exposures on account of a 2000 W power source ovailable
at Walter Reed Laboratories. The field intensities used for free-space and
parallel-plate irradiations were 100 and 26.5 mWfcm2 , respectively.
From the measured increase in temperature AT, the density of power absorp-tioa in W/kgrm is calculated from the expression (4180 AT x specific heat of themedium in calories/gn/*C)/irradiation tiaie in seconds. This divided by thefield intensity in rW/crm2 gives the a parameter either for the whole body (forsaline-filled figurines) or for different parts of the body (for biological-
phantom figurines). The values of the a parameter so calculated are then re-
duced by the model scaling factor (height of the human/length of the figurine)to obtain the corresponding values for humans.
3. RESULTS
Free-Space Irradiation Experiments
The whole body average value of a defined in W/kgm of absorbed powerdensity divided by incident field intensity in mW/cm2 is calculated (by scaling)
from the mieasured results at 985 and at 2450 MIz and is plotted in Fig. 2. Foreach of the orientations Ell L, kil L.nd i1i f, two distinct exposure configura-tions are possible. (The vectors E, H, and k are along the electric and mag-
teric fields and along the direction of propagation, respectively; L is alongthe major length L of the body.) For electric field along the major length,for example, these are:
1. Power propagating from front to back.
2. Power propagating from arm to arm.
A 5 to 10 percent larger whole-body a', rption is found for case 2 forelectric polarizatio. The results for LbjrP; most absorbing configuration arel]so plotted in Fig. 2. Table 1 surmarizes the projected a for the si:: distinct
Orientations under respective conditiois of maximum absorption. The most dif-ference in absorption Is found for k-p',Iarization ( l f.) where a 50 porcentIncrease in overall absorption is me:an, red for electric field from arm to arm4S compared to the case where the electric field is from front to back of thet-,dy. The results observed with salin"-filled figurines are qualitatively$-ilar to those observed with rectngular parallelopipeds [6] of biological--
PhIto" Materi;l . At (63) x (1.75/1,m) MHz which Is the frequency of maximurmVl.}] body powf.r deposition (sec Fig. 2), the a x (1. /3.75) values for kI[ f. and1:i I. orientations are 0.01.7 and 0.011, respe(tively, and both of these valuesare !--re than an order of magn itude sna]lcr than the value for electric polar-zation of 0.216 (W/kgn)/(inW/cm 2 ). Fror, a parameter the relative absorption
tocfficient S (defined as the electromagnetic absorption cross section divided
B4
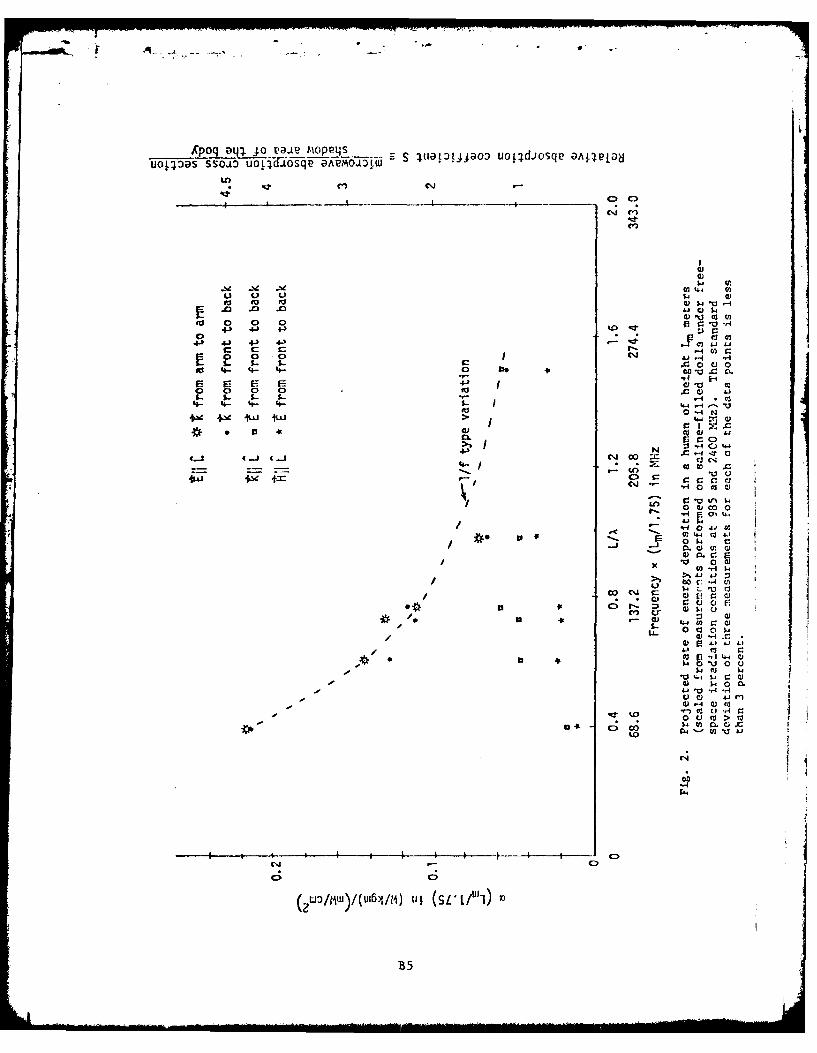
______________ eavt-oppqs.__
Ap-p o q ss j uot a o q & zmtjjos uot.;djoscp? DALI-WL
uot; sscUo6AP ol
OCt cn;
Il $j U )14 -44 o~In
ri $4 C
co o 0 0 0j
4.- - '4- 4- 00 0 N
0.~ Ci
oo 4 1+-4- C 0 00
0~ 0** 0~* c0- fo C~- 0
4t-- 4-- 10
CL- C)
4--
-' C r.! w ~i4 ax i
4w 0~ w*c
* -. ; c r: (D
C) fl V c C) F
LL- ej 01.
- 0 *o V "1 ' 44c
34 4 0 C
- C) 41 3(1
0 0 > 0U)V
CoC -4
B5
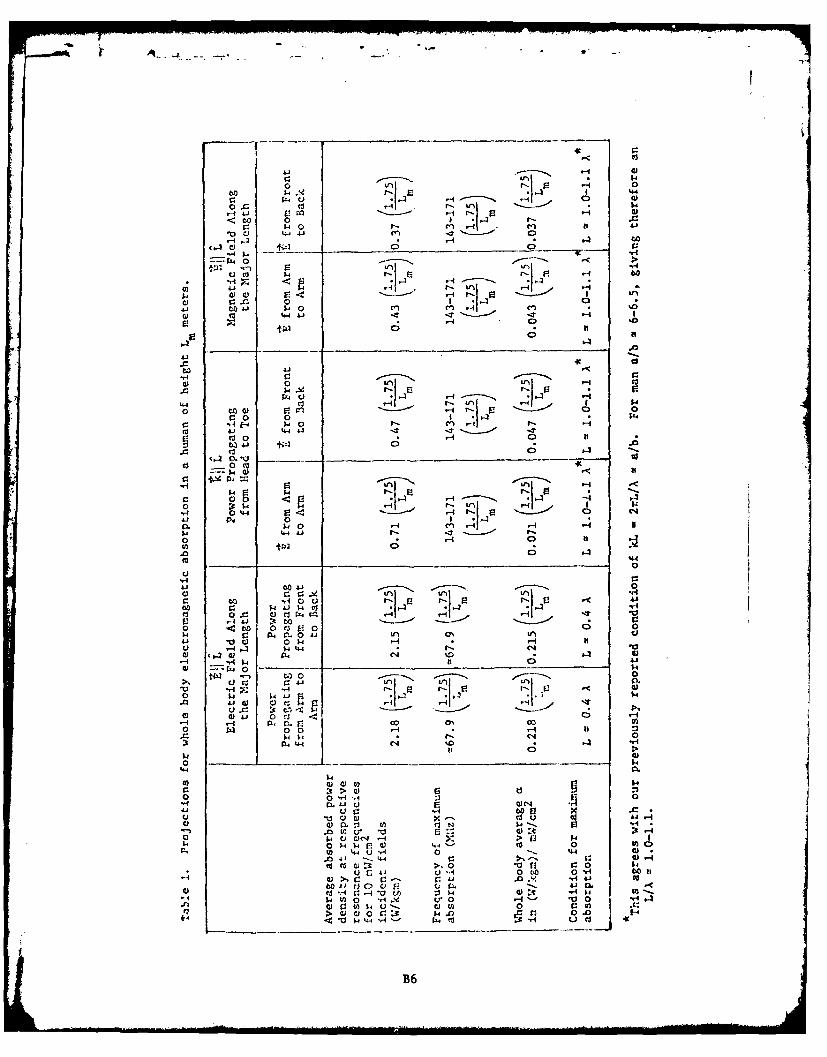
K 0z~ S-
U U- AJ .-40~ ---.. V .
004j o .. p'I 0 '.A4e
ca .p4 4J - -. 0
to 4J r H
44 vi - 40 ol 0 0-- '
14 E-0 0 '- A- -1
(d V 4-4 0 11 -
V0 10 - t0 0
. P4 _ _ _ _ _ _ _ _ _ _ .
0 12 ~ .- ~..04 0 "1 -4 c4
.0~ 0.. r'IEr-i,$4. t-4 4--. '-
c 0 00.~
0 Q (0 * .4 0 H-Do 4 V 0 4j p
.0 (0 0) rir.
(0 0C0 0 *V$4 . P4 P. 0 . H 7 nc
540 W 4 tii
r- 4 0
W to 0dC - -O -
0o P3 ti4J4F .- . ' .W01 <00 Cr30 0
0 $4~4 0 .'4.44 54- N 4'
O~ -- r-5.U ~ ~ 4 t0 0) ci14----..
u ~ .ci Q) O
.,-4i Uc4 -fI0 54 P4'i r Q) In C
.0 0.&. 01 < , 1'I c-4 C;0. :T 0 10 (00 $
0 0 j 0 ,-4 0 114 b44.0 545. r- o - C.4 W01
S-44- u) 4 Y V0 10 04 '
14 -A c
4-' B6
by the shadow area of the body) is calculated from the expreSsion:
weiht of tile body__
shadow area of tile body
The value of the S coefficient thus calculated for E. and iH11f. orientationSis also shown in Fig. 2. At resonance an effective absorption area of 4.2times the shadow cross section is measured. For the post-resonance region tofrequencies on the order of 3 to 4 times the resonance frequency fr' a whole-body absorption reducing as (f/fr)-1 from the resonance value may be seen fromFig. 2.
The measured rates of temperature increase are used to calculate a's forvarious parts of the body in a hu:aau for different exposure parameters. Thevalues of a multiplied by the field intensity in mW/cm2 give the rates ofdeposition in W/kgm. Figures 3-5 give the rates of energy deposition fur10 mW/ca 2 incident fields for prescribed exposure conditions. While Figs. 3-5give an idea of the rates of energy deposition, the temperature rise for thevarious parts in an actual human would, of course, depend upon several complexfactors such as blood circulation, convective coolitig, etc.
Experiments in the Parallel-Plate Radiation Chamber
The TEM radiation chamber was used to measure the whole body a paraaeterof the four sizes of the saline-filled figurines at the highest power sourcefrequency of 500 MHz. The a parameters so obtained were scaled to the valuesfor humans and these are plotted in Fig. 6 as a function of L/A. For Ell f.orientation the results are noteworthy In two respects:
1. Maximum power absorption is observed for L/X v 0.37. This is Inagreement with the condition for maximum absorption observed withfree-space experiments (Fig. 2). This result is surprising in thatthe parallel plate chamber seems to simulate the free-space planewaves rather than the ground plane effects. As will be pointed outlater, physical contact with the ground plate does indeed allow thischamber to simulate ground effects.
2. The value of a at resonance observed with the parallel plate chamberis about 80 percent of the value obtained from free-space irradiationexperiments. In view of the fact that different frequencies, figurinesizes, and calibrating field probes were used for the two radiationconditions, the two results should be considered in remarkably goodcorrelation.
While we have always been convinced of the validity of ,,sing a parallelplate transmission line to provide a medium of plane waves, and the above re--sults are a further confirmation of our feelings, doubts have, however, b.-enexpressed by some researchers in the field regarding this transvission line.Also a handicap of the paralle. plate line is the rather limited space avail-able between the two plates, and this hinders its application to frequencieswhere the target size may be comparable to or larger than one half the free-
space wavelength. On account of these reasons, we have designed [2] and in-stalled a monopole-above-ground radiation cha:mber. Tile anechoic chamber i,.formed by lining a 10' x 10' x 7.5' Faraday screen room with sheets of micro-wave absorbing material of pyramidal (Eccosorb VHP-18) and planar (EccosorbAN--79) varieties. The radiator conslsts of a quarter-wave monopole aboveground mounted in a 450 corner reflector. Due to the high gain or the antenna,field Intensities on the order of 13 mW/cm2 hav bforn measured vt 2.4 meters.from the radiator for 100 watts Input to the antena . An MCL model 1.14i
B7
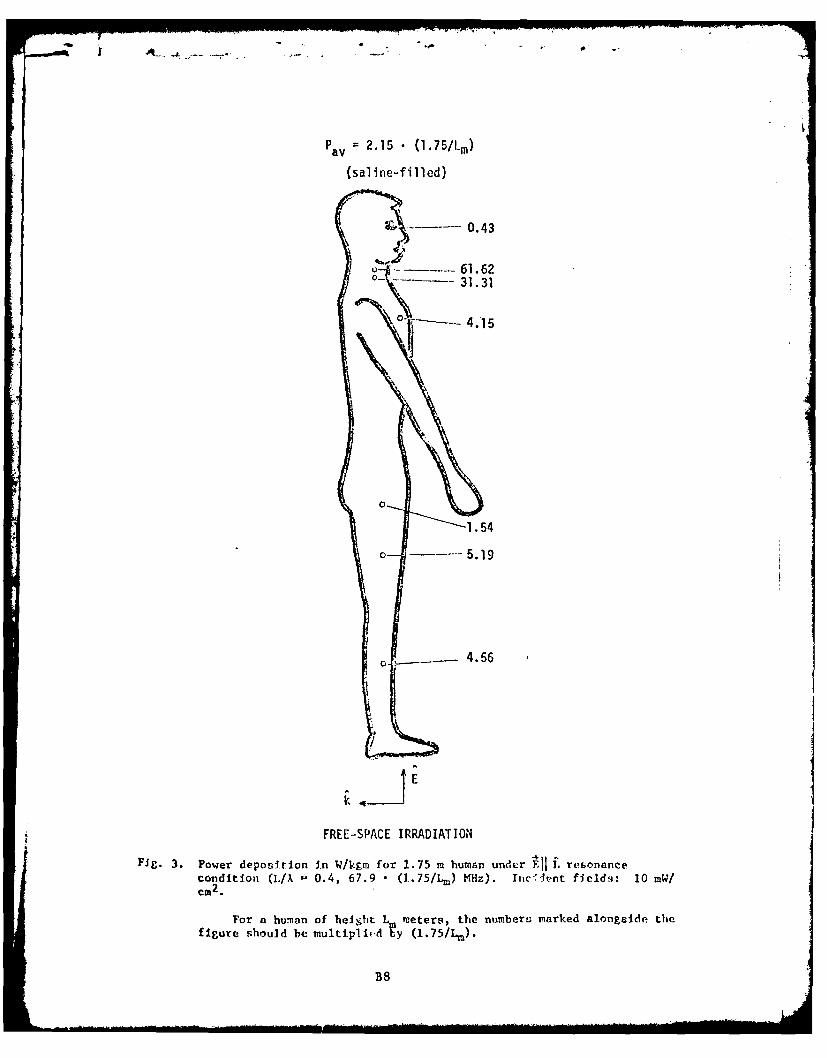
P 2.15 (1.75/Lm)av
(saline-filled)
0.43
61.62031.31
0 - 4.15
0
1.54
o 5.19
II
E
FREE-SPACE IRRADIATION
Fig. 3. Power deposItion in W/kgm for 1.75 m human under .IF. resonance
condition (L/A - 0.4, 67.9 * (1.75/L m1 ) MHz). Inc:'-Ient fields: 10 mW/cm2 .
For a human of height Lm meters, the number-i marked alongside thefigure should be multiplit.d by (l.75/Lm).
B8
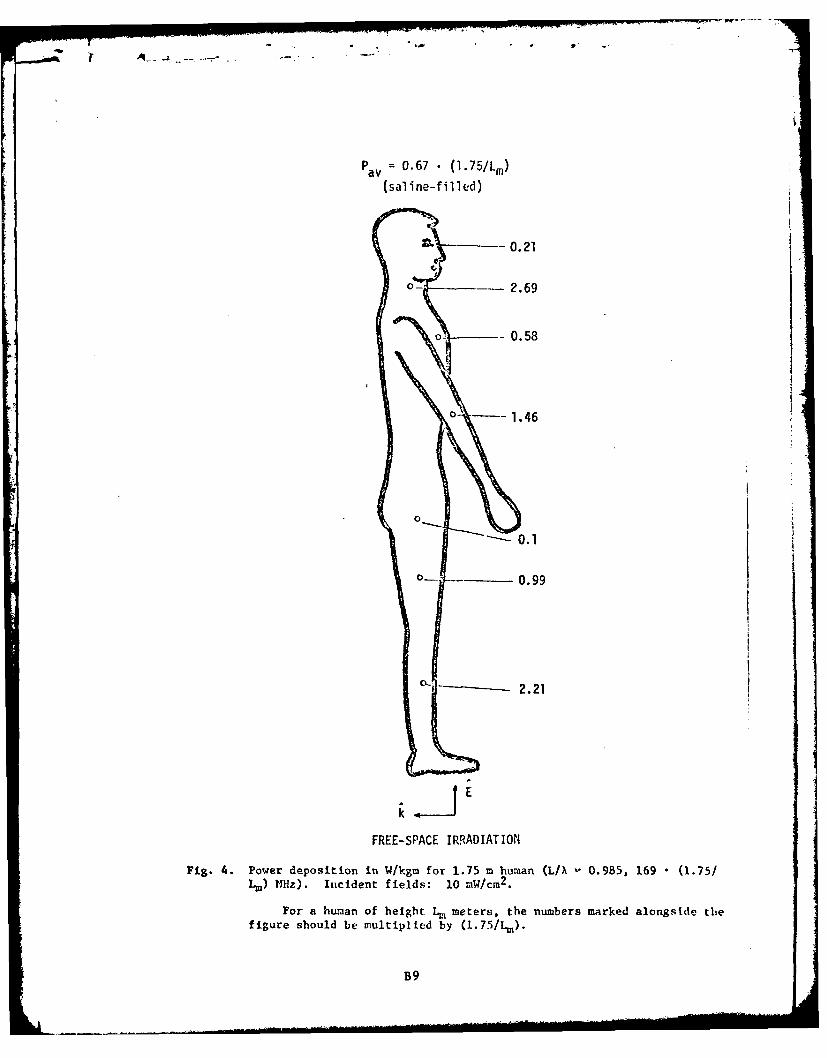
Pay 0.67 (l.75/Lm)
(saline-filled)
-0.21
0- 2.69
0.58
0 - 1.46
-0.1
0.99
c 2.21
E
FREE-SPACE IRRADIATION
Fig. 4. Power deposition in W/kgm for 1.75 m human (L/X 0.985, 169 • (1.75/Lm ) MHz). Incident fields: 10 mW/cm 2.
For a human of height L, meters, the numbers marked alongside thefigure should be multiplied by (1.75/L1 ).
B9
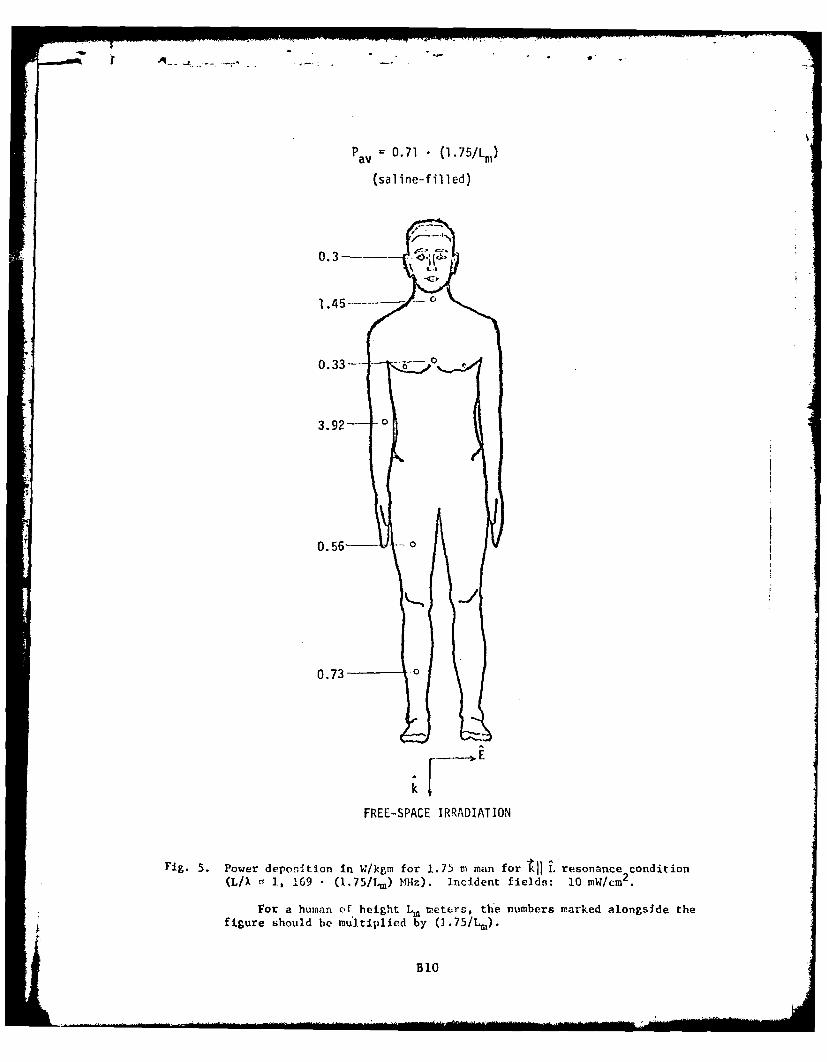
Pav =0.71 (1.75/Lil)
(saline-filled)
0.33-
3.92- 0
0.56- -0
0.73 .0
-iE
FREE-SPACE IRRADIATION
Fig. S. Power deposition in W/kgrn for 1.75 m man for ) .resonance condition(L/X 1, 169 -(1.75/1".) mHz). Incident fields: 10 mW/cm2.
For a human of height L. meters, t1he numbers marked alongside thefigure should be multiplied by (1-75/L,1).
BID
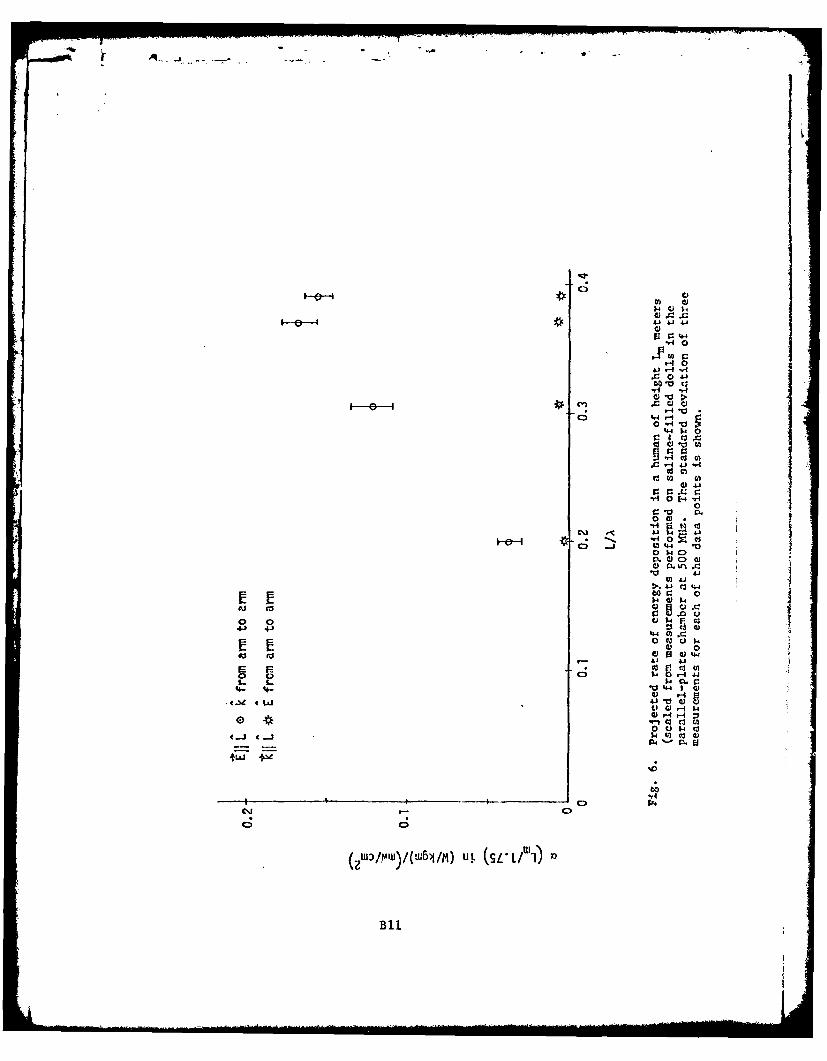
0
.C.. 44
164 r-4 -0 -H 0 N
"-414
1 -4 ~0 0
-H o co
4J
000.
40-4C,4 0 C;
*0 0 i04
4-- 4- V 44401
o 0u 04. 0
40 .0 1c4 0
40-
o C)
S.. S.. 14 C'..3) u
*4.~e ILL
1000 W out put 400-800 1Hz RF aplifier is presently on order. and this ould beused in thc. continuing dosimetry experiments. Wile detailea data fro;- thischamber are not avaIlable at this tine, preliiinaiy experiments have given avalues fairly comparable to those of Fig. 6.
Figures 7-11 give the rates of energy deposition in various parts of thebody determined from the prrallel plate chbambr for prescrbCed exposure condi-tions. At least three measurements w,:re taken to obtain the values indicatedon these diagraws. A standard deviation of less than 5 percent for hoLterregions of the body and a value of less than 10 perceit for the cooler regionswere calculated from the experimental data. From Figs. 7-11 the importantfeatures to note are:
1. Maximum rate of energy deposition once again is observed for the neckfor E)l L resonance and near-resonance couditions. For this region anenergy deposition of nearly 10 times the whole body average is ob-served. This ratio is considerably lower than 28.7 observed withfree-space irradiation (Fig. 3) on accoa;.t of I w field intensitiesused to date with parallel plate chambe- expf- i, ents. This wouldcause a lower power deposition rate resulting in heat being carriedaway from the "hot" neck region to the cooler torso and head regionsof the body. With the future availability of higher field intensities(V150 mW/cm2 ), it is felt that energy deposition rates comparable tothose observed under free-space irradiation conditions may indeed beobtained with parallel plate TEM chambers.
2. Foc L[[ £ orientation, a more detailed examination of the heating ofleg shows a higher rate of energy deposition in the knee and ankleregions (Figs. 8 and 9). These also are the zones of smaller cross-sectional areas than the rest of the leg. The plot of a as a functionof the cross-sectional area over the entire length of the leg is shownin Fig. 12. A rate of energy deposition varying inversely as thecross-sectional area is observed. If a constant current were flowingthrough the entire leg, a (cross-sectional area)- 2 type dependence ofa would be expected. However, even from antenna theory, a dininishingvalue of current is anticipated as one approaches the ankle region.This may well be the reason for the experimentally observed (cross-sectional area)-I dependence of a.
3. A detailed examination of the heating pattern of the arm (Figs. 8 ari9) shows the maximum rate of deposition in the elbow region. Itshould be mentioned that the arms are in the plane of the body In ourfigurines. In Figs. 3, 4, and 9, the arais are shown protruding onlyfor clarity of marking the measured values.
4. For kIJ £ orientation (Figs. 4 and 11), maximum rates of energy deposi-tion are observed for the elbow followed by the neck region.
Power Deposition in the Presence of Ground Effects
Experiments were performed with the 18.4 cm saline-filled figurine ground-ed to the bottom plate of the parallel plate chamber by means of a thin wireprobe forming the electrical connection through a rubber cork at the base ofthe figurine. On account of an increased rate of energy deposition under theseconditions, only two minutes of Irradiation time (as against five minutes inexperiments with ungrounded figurines) was found to be adequate for theseexposures. The values of a calculated from the measurements over the frequencyband 220-500 M11z are plotted in Fig. 13. Also shown in the same figure are thevalues projected for humans of different heights and the relative absorptioncoefficient S. Peak power absorption is observed for a frequency slightly
B12
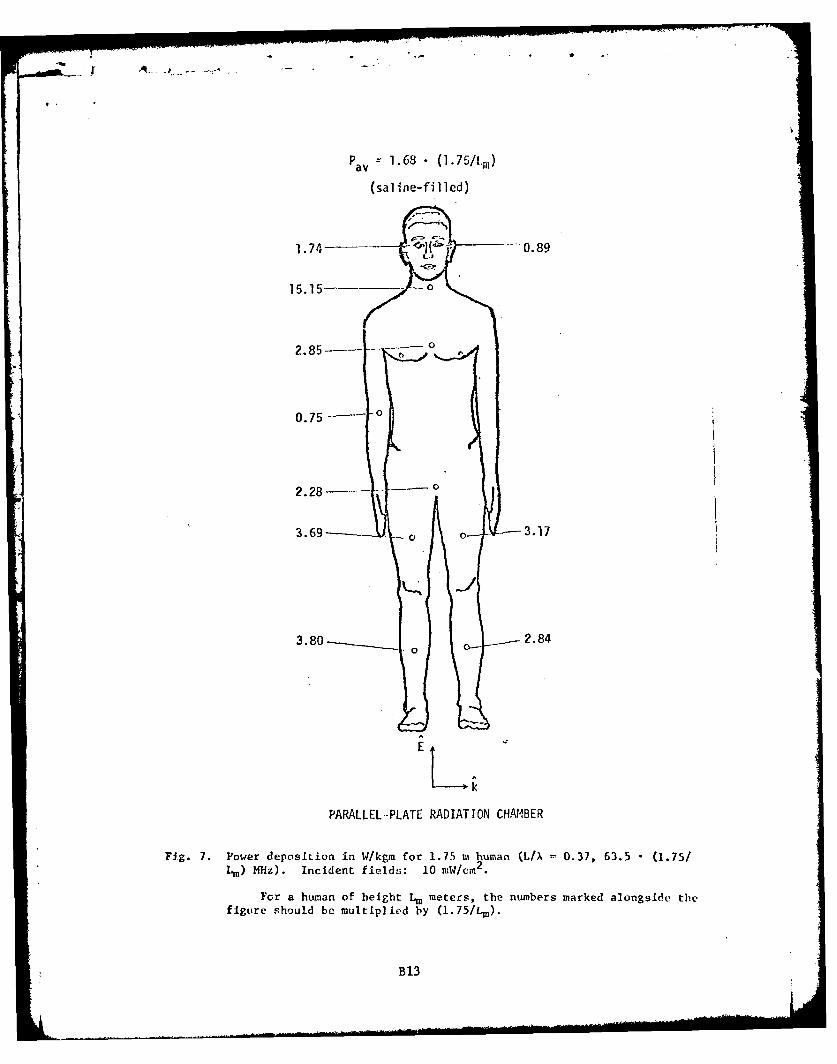
P av 1.68 -(1. 7 5/.0n
(saline-filled)
1.74 -- --0.89LJ
2.85-- -O
0.75 - 0
2.28 - -~
3.69 -o 0 3.17
EL
PARALLEL-PLATE RADIATION CHAM7BER
Fig. 7. Power deposition in W/kgm for 1.75 m human (L/X 0.37, 63.5 (1.75/Lm) MHz). Incident fields: 10 mW/cm2.
For a human of height Lm meters, the numbers marked alongside thefigure should be multiplied by (1.75/Em).
B13
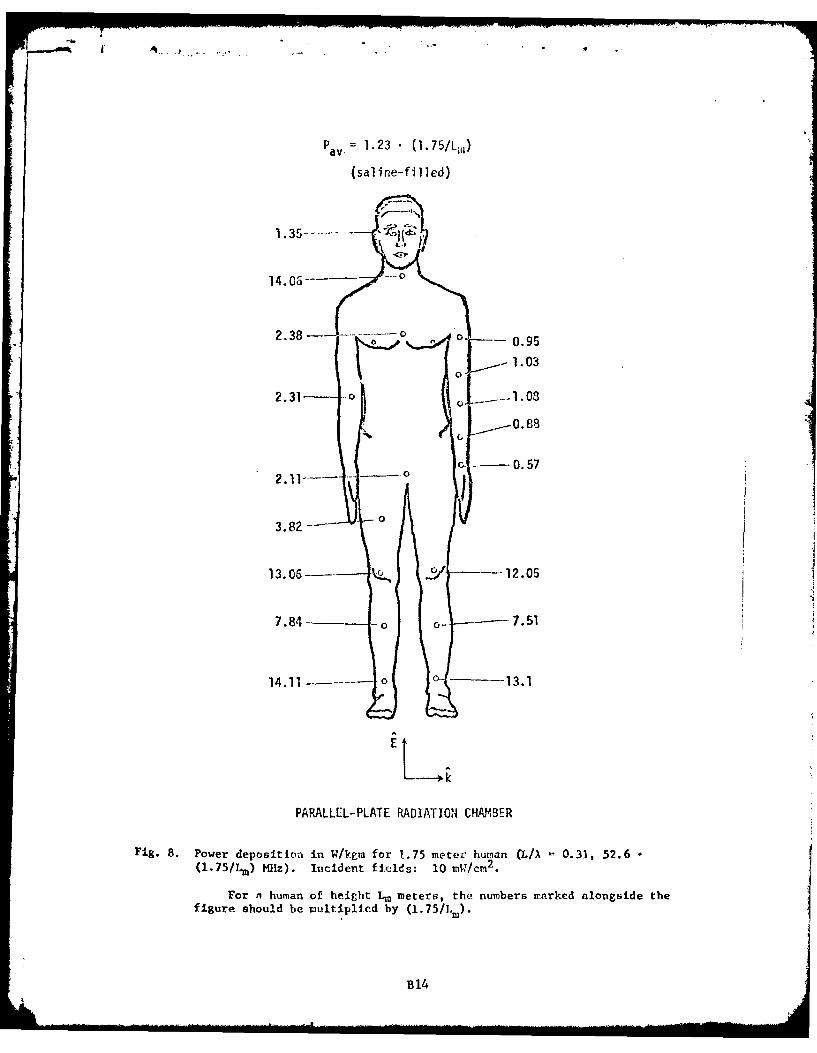
-_
Pavy= 1.23 (1.75/Liz)
(saline-filled)
14.06-
2.38 - -... . . 0,, ,, - - 0.95i-1.03
2.31 - ---
F ..- 0.572.11 1 05
00
13.06---. k° I --- 12. 05
7.84 o- -7.51
EL
PARALLEL-PLATE RADIATION CHA?,BER
Fig. 8. Power deposition in W/kgm for 1.75 meter human (L/A 0.31, 52.6(1. 7 5/Lm) Mhz). Incident fields: 10 nW/cm 2.
For n human of height Lm meters, the numbers marked alongside thefigure should be multiplied by (1.75/1,m).
B14
-,~ ~ ~ ~ ~ ~ ~ ~ ~ ~~~~~~~M ...... ' ........... -...... .... --- I-................. .. . -.--......... i M......... ...
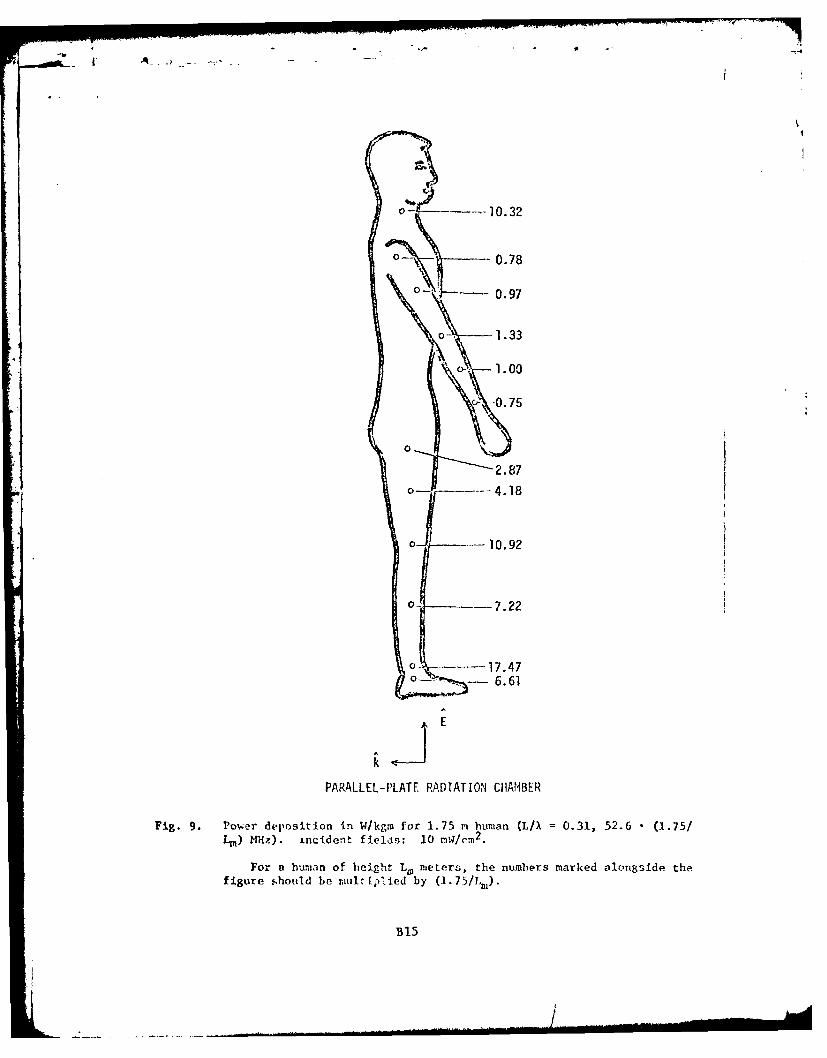
o ----- 10.32
0.78
"- - 0.97
0 1.33
1.00
-0.75
4.18
o...-10.92
-7.22
o ------ 17.476.61
E
PARALLEL-PLATE RADIATION CHAMBER
Fig. 9. Power deposition In W/kgm for 1.75 n human (L/)= 0.31, 52.6 (1.75/Lm) fdzz). incident fields: 10 m/cm2.
For a human of height Lm meters, the numbers marked alongside thefigure should be multiplied by (1.75/L1w).
B15
AD-A1L 028 UTAH W4IV SALT LAKE CITY F/6 6/18IEHAVIORAL AND BIOLOGICAL EFFECTS OF RESONANT ELECTROMAGNETIC A-ETC(U)
OV 76 0 P GAN-HI. J A O-ANOREA, M J HAGMANN DAM17-7-C-4092*lllflSllFD*
IIIIIIIIIIIIIIEIIIIIIEEEEEEEIEEIIIIIIIIEEE
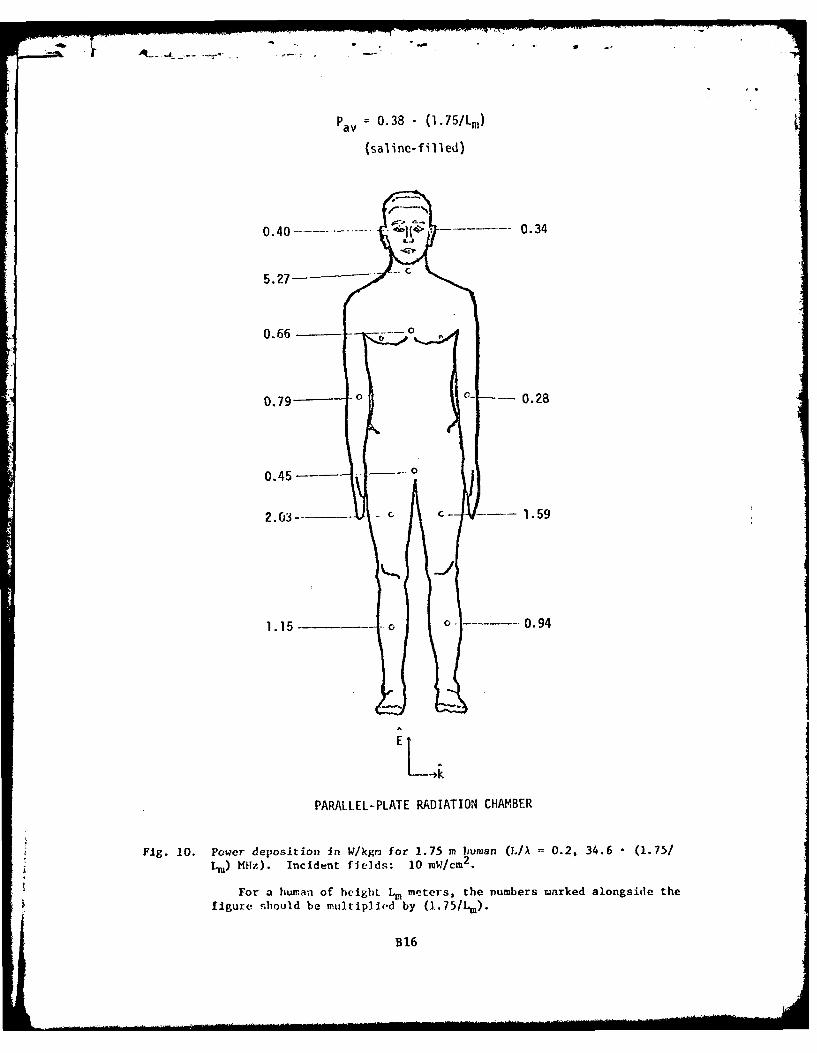
=av 0.38 (1.75/Ln)
(saline-filled)
0.40-.... ........- 0.34LJ
5.27-.. . .
0.66 0
0.79 -0 0.28
0.45 -
2. 3 - - .. .- . 1.59
1.15 - - -000.94
E L
PARALLEL.-PLATE RADIATION CHAMBER
Fig. 10. Power deposition in W/kgrj for 1.75 m human (L/A = 0.2, 34.6 (1.75/L,) MHz). Incident fJelds: 10 mW/cm2.
For a human of height Lm meters, the numbers marked alongside thefigure should be multiplied by (1.75/L).
B16
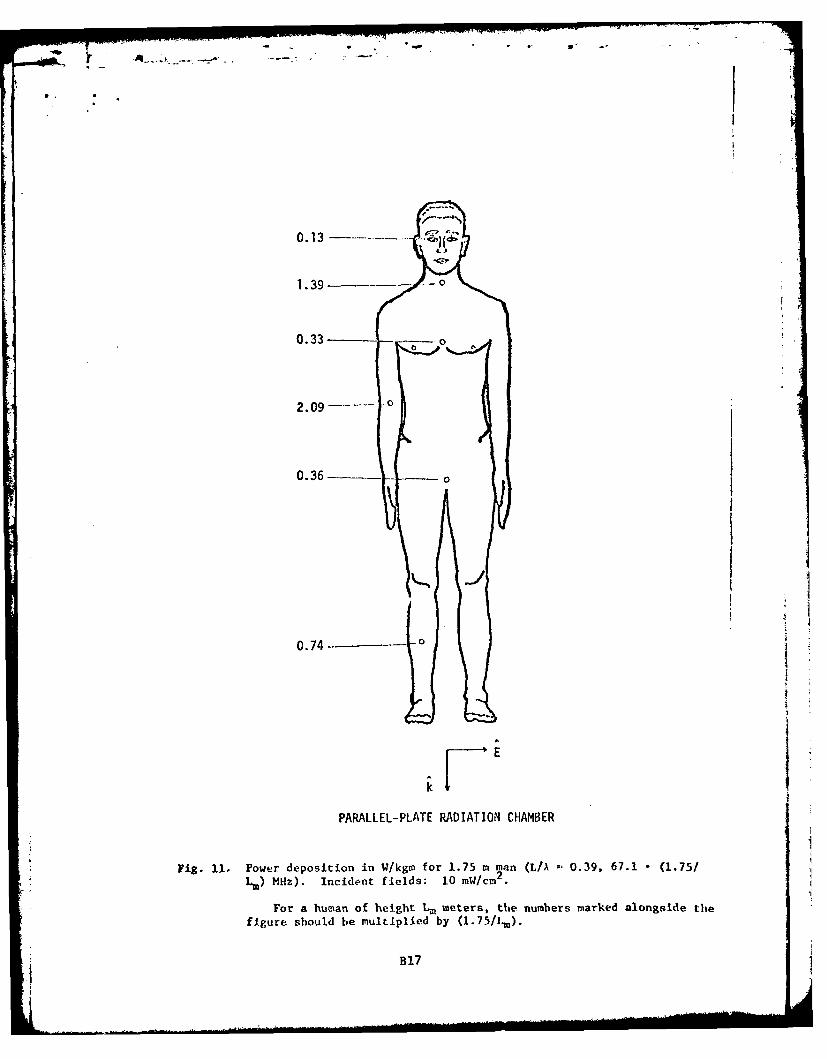
0. 13
1.390
0.33
0.36. - o
0.74 0
PARALLEL-PLATE RADIATION CHAMBER
Fig. 11. Power deposition in W/kgm for 1.75 m man (,/A = 0.39, 67.1 (1.75/Lm) MHz). Incident fields: 10 mW/cm 2.
For a human of height L. meters, the numbers marked alongside the
figure should be multiplied by (1.75/1.,).
B17
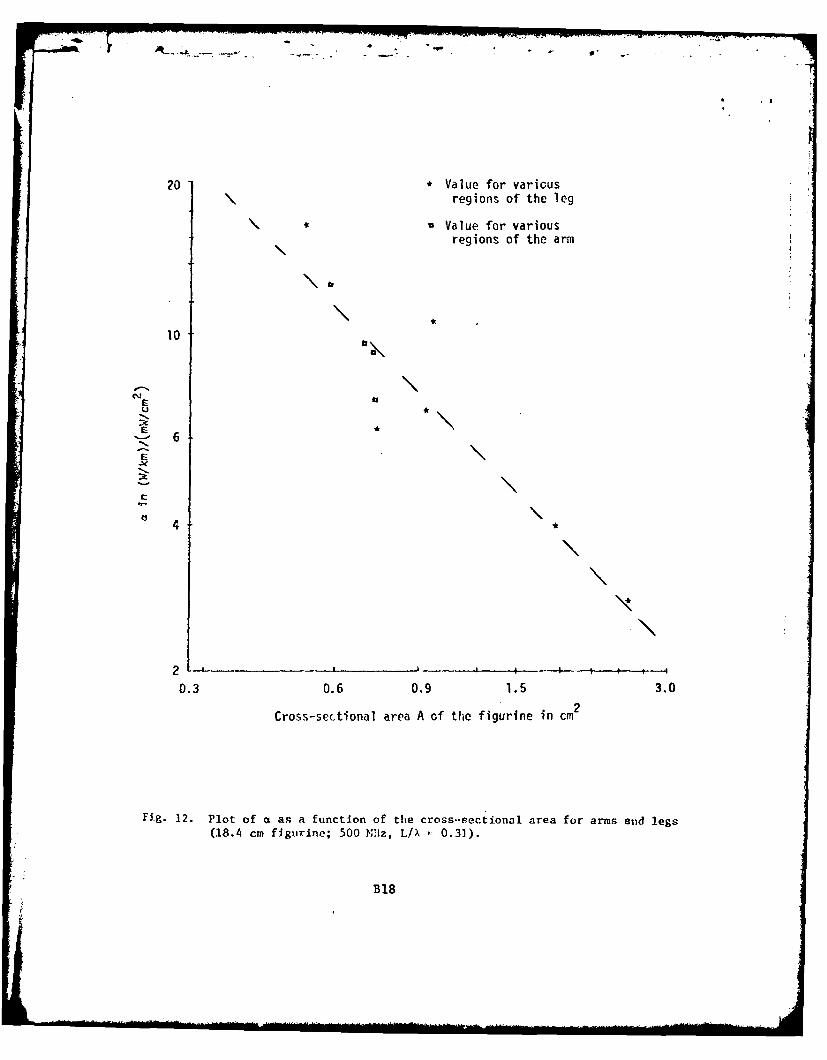
... .- .-
20 Value for variousregions of the leg
* aValue for variousregions of the arm
10
Ci a
U 6
*\
, c0
0.3 0.6 0.9 1.5 3.02
Cross-sectional area A of the figurine in cm
Fig. 12. Plot of ct as a function of the cross-sectional area for arms and legs
(18.4 cm figurine; 500 Nl11z, L/X - 0.31).
B18
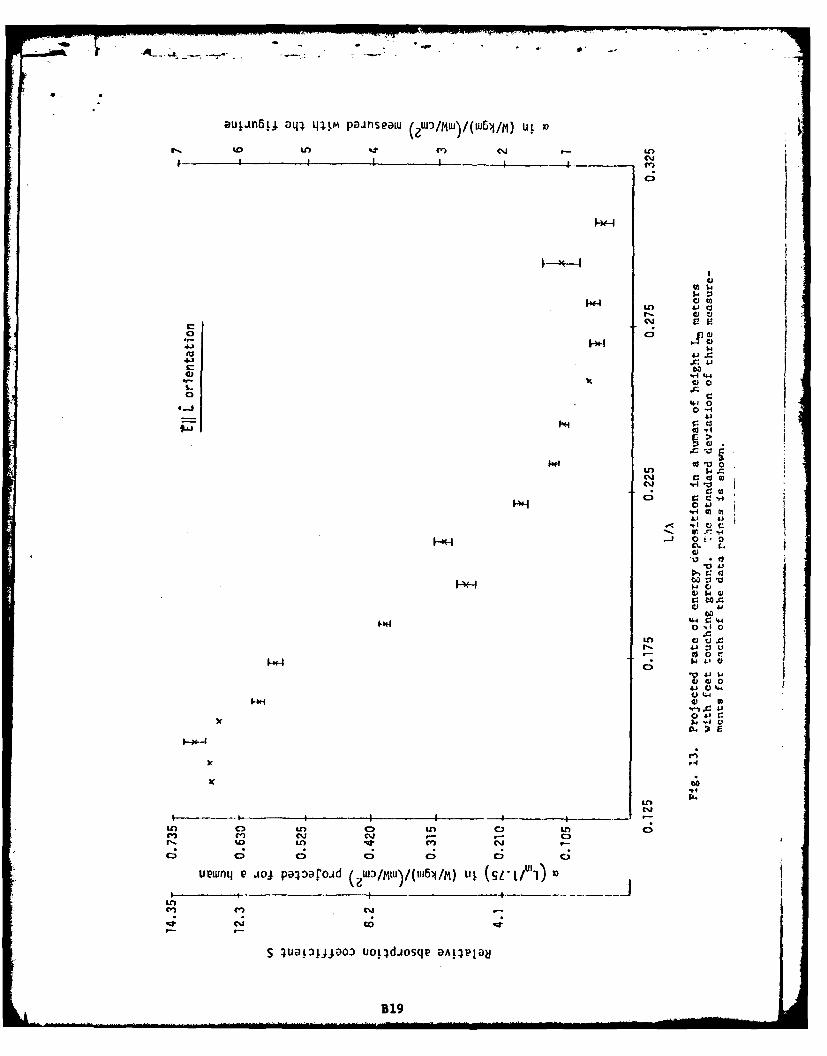
oun~. Da4 tll2m paJflseaw (W)/MWl)/(tU~j/M) UL U
coo
rJr
r- 60ci 1,4 t 4
-o0 "
CCsJ
t0 10 0
C)
80 E.
140
44) C: 440- 4 0XV
LC) 0
0 00 0 C.
-0J 4-4)4
S~~~~~ 41j~o rodoq: A;P~
B194
lover than one half the value for ungrounded conditions. At resonance an ef-fective absorption area of nearly 14 times the shadow cross section if measuredwhich is about 4 times the value measured at resonance under ungrounded condi-tions In the parallel plate chamber. Beth these results are predicted approxi-mately by antenna theory. The derivations giving an S of 4.2 for free-spaceirradiation and a four-times enhancement in the absorption cross section of anisolated versus a grounded body are illustrated in rigs. 14 and 15.
Judging from the success of the antenna theory in explaining most of thewhole body absorption observations under grounded and ungrounded conditions,highly enhanced valves of S may result for bodies in the presence of 180, 90,and other corner reflectors. Preliminary experiments in the monopole-above--ground chamber have shown this to be true indeed. S parameters on the order of20 and higher have been observed to date. Further experiments are in progressto completely understand these effects.
The distribution of power deposition under grounded resonance conditionshas been determined using the biological-phantom figurine with feet touchingthe ground plate of the parallel plate chamber. The rates of energy depositionprojected for a human exposed to 10 mW/cm 2 fields are shown in Fig. 16. Thepoints to note are:
1. The whole body average value is fairly close to that obtained withsaline-filled figurine grounded by means of a wire probe, lendingsome credence to this method of grounding for saline-filled figurines.
2. While the neck is still one of the hot spots, the region of maximumpower deposition shifts to the lower half of the leg under grounded
conditions.
3. Consistent with the previous observations (Figs. 8 and 9) on thedetailed distribution in the leg region, the zones of maximum powerdeposition are the ankle and the knee, which also correspond to theareas of minimum cross section in the leg.
4. CONCLUSIONS
In the absence of ground effects, a whole body absorption cross section ashigh as 4.2 times the shadow cross section has been measured for electric
polarization at the resonance frequency (in MHz) of (68) x (1.75/height Lm ofthe human in meters). Under these frequency and polarization conditions, awhole-body-average energy deposition rate of (2.15) x (1.75/1.) watts/kgm isprojected for incident plane wave fields of 10 mW/cm2 . At hi her frequencies(to f L 3-4 fr), the whole body absorption reduces as (f/fr)-I from theresonance value. The distribution of power deposition is given for the variousregions of the body for several exposure conditions. For fjIf. resonance condi-tions, the higheost rate of energy deposition Is observed for ,be neck region ofthe body, and a value as high as 28.7 times the whole body average is measured.
Maximum whole body absorption under grounded conditions is observed at afrequency about one half that of the ungrounded body. For grounded resonancecondition an absorption cross section as high as 14 times the shadow area hasbeen measured. Autenna theory has been used to explain this highly enhancedabsorption cross section. The distribution of power deposition is determinedfor grounded resonance condition. While the neck is still one of the hot spots,the zone of maximum power deposition is the-ankle region. Judging from theSuccess of antenna theory In explaining most of the whole body absorption oh-fcrvations under grounded and ungrounded condition, highl.y enhanced depositionrates are anticipated for bodies in the presence of 1800, 900 , and other
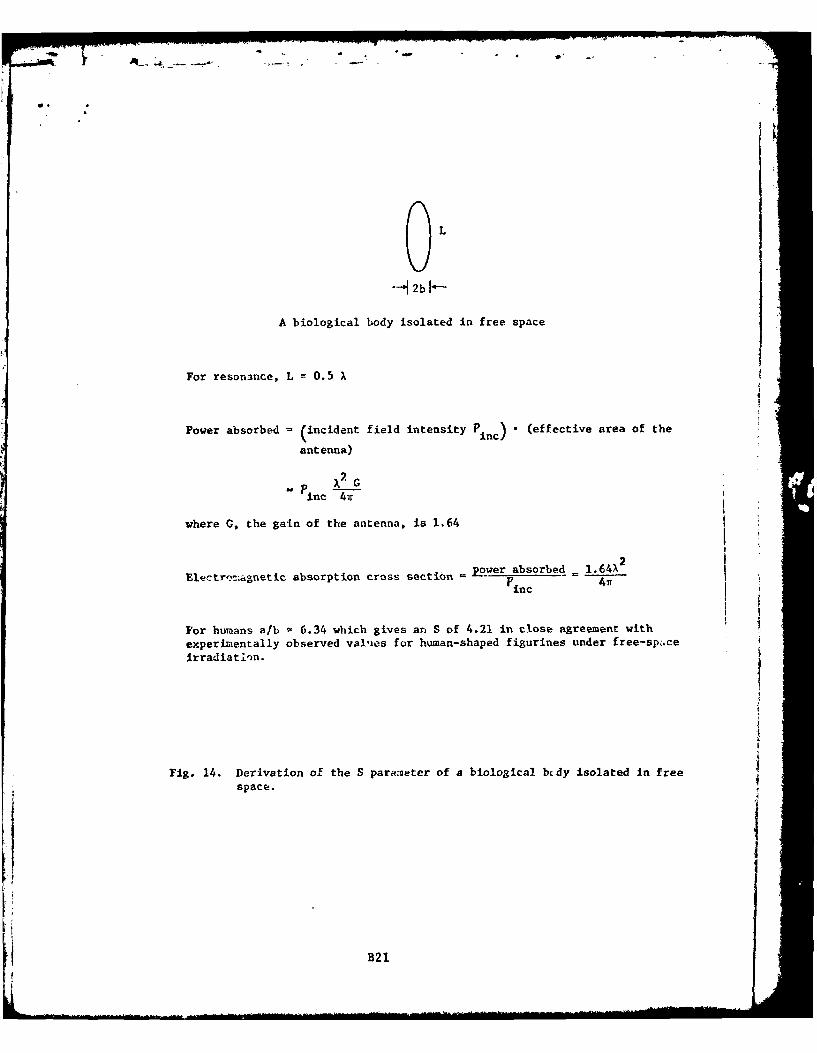
0 L-A2b I-
A biological body isolated in free space
For resonance, L 0.5 X
Power absorbed (incident field intensity P (effective area of the
antenna)
X2inc 41
where C, the gain of the antenna, is 1.64
Electr. -agnetic absorption cross section power absorbed 1.64 2
F inc 4 7r
For humans a/b v 6.34 which gives an S of 4.21 in close agreement withexperimentally observed val-ies for human-shaped figurines under free-sp-.ceIrradiation.
Fig. 14. Derivation of the S parameter of a biological bcdy isolated in freespace.
B21
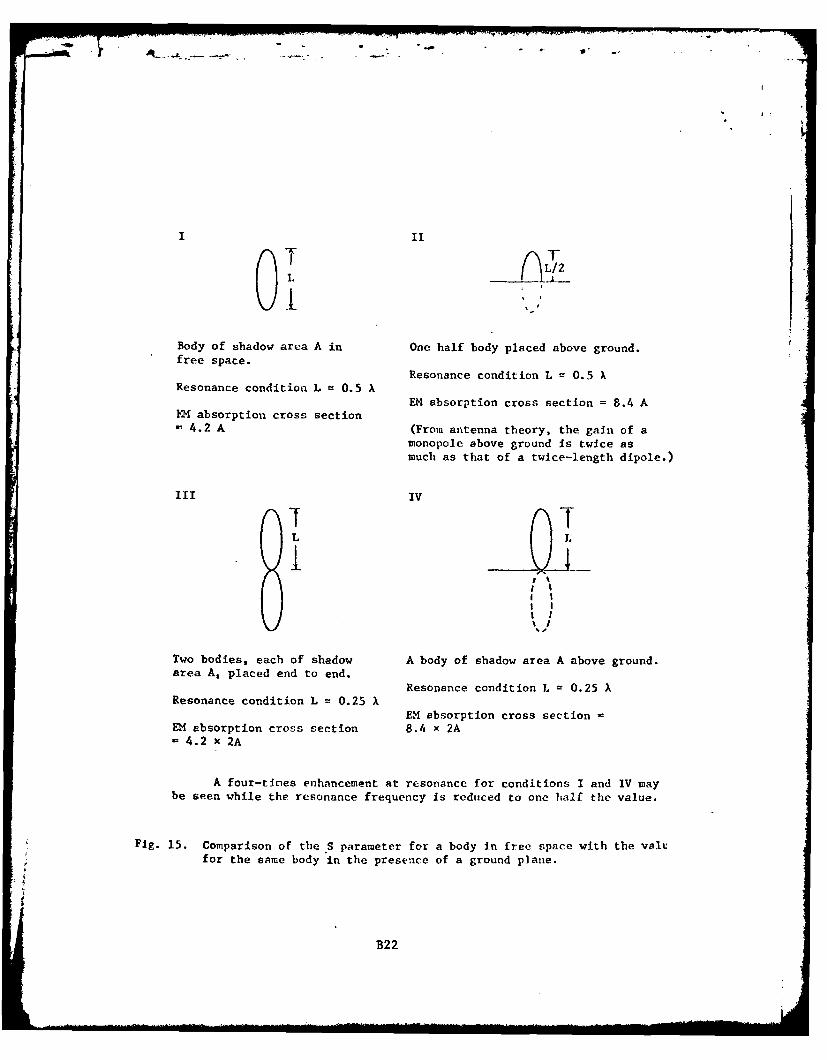
is
I II
01Body of shadow area A in One half body placed above ground.free space.
Resonance condition L a 0.5 XResonance condition L = 0.5 A°
EM absorption cross section = 8.4 AEM absorption cross section4.2 A (From antenna theory, the gain of a
monopole above ground is twice asmuch as that of a twice-length dipole.)
SIII IV
* 1 L
II
L L
Two bodies, each of shadow A body of shadow area A above ground.area A, placed end to end.
Resonance condition L = 0.25 XResonance condition L = 0.25 X
EM absorption cross sectionEM absorption cross section 8.4 x 2A4.2 x 2A
A four-times enhancement at resonance for conditions I and IV maybe seen while the resonance frequency is reduced to one half the value.
Fig. 15. Comparison of the S parameter for a body in free space with the valufor the same body in the presence of a ground plane.
B22
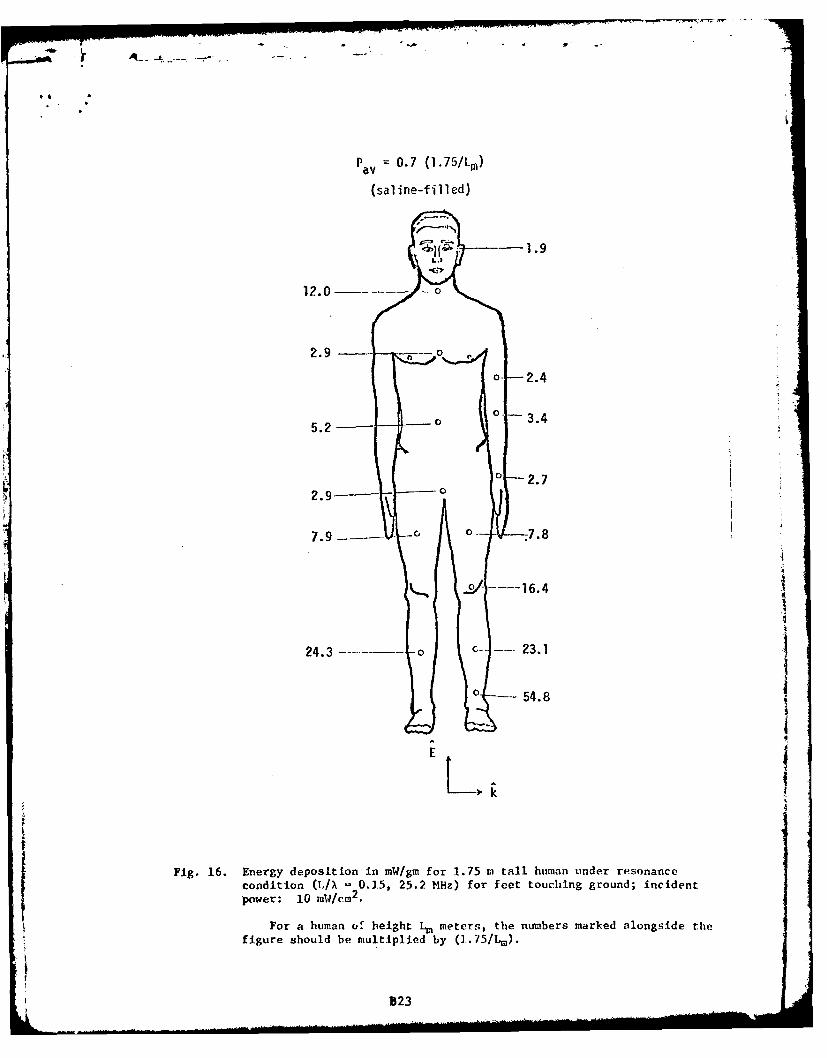
PaV = 0.7 (1.75/Lm)
(saline-filled)
-1.9
12.0 o
2.9 -o
o- 2.4
5.2
2.9 I0 --2.7
7.9 _ - - -- 0 .7.8
/ ---l6.4
24 .3 -oc;. . 23 .1
0 54.8
E
Fig. 16. Energy deposition in mW/gm for 1.75 m tall human under resonancecondition (1,/X - 0.15, 25.2 MHz) for feet touching ground; incidentpower: 10 mW/cm 2.
For a human of height L meters, the numbers marked alongside the
figure should be multiplied by (1.75/Lm).
B23
corner reflectors.
5. REFERENCES
1. Gandhi, 0. P. Polarizationi and frequency effects on whole animal absorp-tion of RF energy. Proc. IEEE, 62, 1171-1175, 1974.
2. Gandhi, 0. P. Conditions of strongest electromagnetic power deposition inman and animals. IEEE Trans. KfT, MTT-23, 1021-1029, 1975.
3. Johnson, C. C., and A. W. Guy. Nonlonizing electromagnetic wave effects inbiological materials and systems. Proc. IEEE, 60, 246-253, 1972.
4. Guy, A. W., C. C. Johnson, J. C. Lin, A. F. Emery, and K. K. Kranlrg.Electromagnetic power deposition in man exposed to HF fields and the associatedtherial and physiologic consequences. USAF School of Aerospace Medicine,
Brooks Air Force Base, Texa%, Report SAM-TR-73-13, December 1973.
5. Rozzell, T. C., C. C. Johnson, C. H. Durney, J. L. Lords, and R. C. Olsen.A nonperturbing temperature sensor for measurements in electromagnetic fields.
J. Microwave Power, 9, 241-249, 1974.
6. Gandhi, 0. P. Orientrtional and frequency effects on whole animal absorp-tion of RF energy. J. Indian Inst. of Sdl., 56, 315-364, 1974.
ACKNOWLEDGMENT
Tha technical support of J. H. Jacobi and P. B. Brown, Department ofMicrowave Reaearch, Walter Reed Arr; Institute of Research, Is gratefullyacknowledged. This wvo-k was supported by the U. S. Army Medical Research andDevelopment Coscsand under Contract DAMD 17-7L-C--4092.
B24
/ Radio Science, Vol. 12, No. 6 (S),November-December 1977.
APPENDIX C
Deposition of electromagnetic energy in animals and in models of man with and without grounding andreflector effects
Om P. Gandhi
Departments of Electrical Engineering and Bioengineering, University of Utah, Salt Lake City, Utah 84112
Edward L. Hunt
Department of Microwave Research, Walter Reed Army Institute of Research, Washington, D. C. 20012
John A. D'Andrea
Departments of Electrical Engineering and Bioengineering, Unieersity of Utah. Salt Lake City, Utah 84112
Generalized curves are given for rates of' whole-body absorption of electromagnetic energy bymodels of human beings as a function of frequency. Exposures were made in free space, or when themodel made electrical contact witl the ground. The effects of the presence of retlecting surfaces alsowL e analyzed. Peaks of absorption with and without a ground, arc projected, respectively, to be(31 to 34 MHz) and (62 to 68 MHz) X (I1.75/height of model in meters). Rates of energy depositionare given for models of man and for animals subjected to radiation at a power density of 10 mW/C11
2
for the various conditions of exposure. At resonance, values of whole-body absorption as high as4,077 to 8,154 watts for the adult human being are predicted. The tines-to-convulsion of'- 100-grats at power densities of 3 to 20 mW/cm 2 confirmed predictions of extremely high rates of absorp-tion in the presence of reflecting surfaces.
I. INTRODUCTION Iawkins [19751 confirms the validity of the equationfor rats and titice of differing sizes.
We have previously reported on the observation of a Results are also presented for a simulated human beingstrong resonance in the whole-body absorption of elcc- with its feet in electrical contact with the ground. Introtnagnetic waves by biological bodies [Gandhi, 1974, such atn exposure, a resonant frequency one-half as high19751. For plane-wave irradiation in free space, the with a peak absorption twice that of free-space irradia-highest rate of energy deposition occurs in fields that are tion is observed.polariized along the longest dimension of the body Energy deposition rates are given for models of triai(E II C) and for frequencies such that the major length and for aninals that were exposed to radiation at power(L) is approximately 0.36 to 0.40 times tise free-space dettsities of 10 mtsW/crn 2 under various conditions ofwavelength (X) of radiation. Peaks of whole-body ab- exposure.sorption for two other configurations (major letgthoriented along the direction of wave propagation oralong tile vector of the magnetic field) were also re- 2. ELECTROMAGNETIC ENERGY ABSORPTION INported [Gandhi. 1974, 19751 for L/X on the order of MAN IN FREE SPACEL/4srb where 2nb is the weighted averaged ctrcuferenceof the anitals. The procedure for obtaining tile mass-normalized rate
A handicap of past measurements has been that conm- of electromagnetic energy deposition (SAR) through thettercially available dolls that have been used as iolds use of reduced-scale models has been detailed in earlierfor models are not properly proportioned. Using care- publications [Gandhi, 1975; Gandhi et al., 19751. Thefully sculptured, accurately scaled figurines JDrcY'iiss. SAR in W/kg is calculated from the temperature rise,19671, neasttrements have now been extended to cover ^ T, of 7.6, 10.2. 12.7. 15.2. 20.3, 25.4. 33.0, and 40.6the regic., 0.2 < I,/s < 3.3. Specific absorption rates ctt high, saline-filled (0.9% NaCI) figurines from the(SARs) are given in this paper under thiee configura- expression (4,180 .'T X specific heat of the mediumlions it free spece for the frequency range 0.5 to 8.7 in calories/g/0 C)/irradiation timte in seconds. The SARstimes rlte E I L resonance frequency Jr. which, for so calculated are divided by the model's scaling factorman. is 05 X 11 .75/legh its meters) Mlt/. From these (height of the hunian/length of the figurine) to obtainresults, antena theory ts used to devylop an empirical the value for a Ituian being. At least three measure-equation for the SAR. 1i the E I L orientation of tuents were taken to calculate the averaged SARs thatmodels. at resotant and suprarcsonant frequencies. A are given it this paper. Unless otherwise stated, thecottparison with the lethality data of Schrot and standard deviation of the measurements is less than
Cl
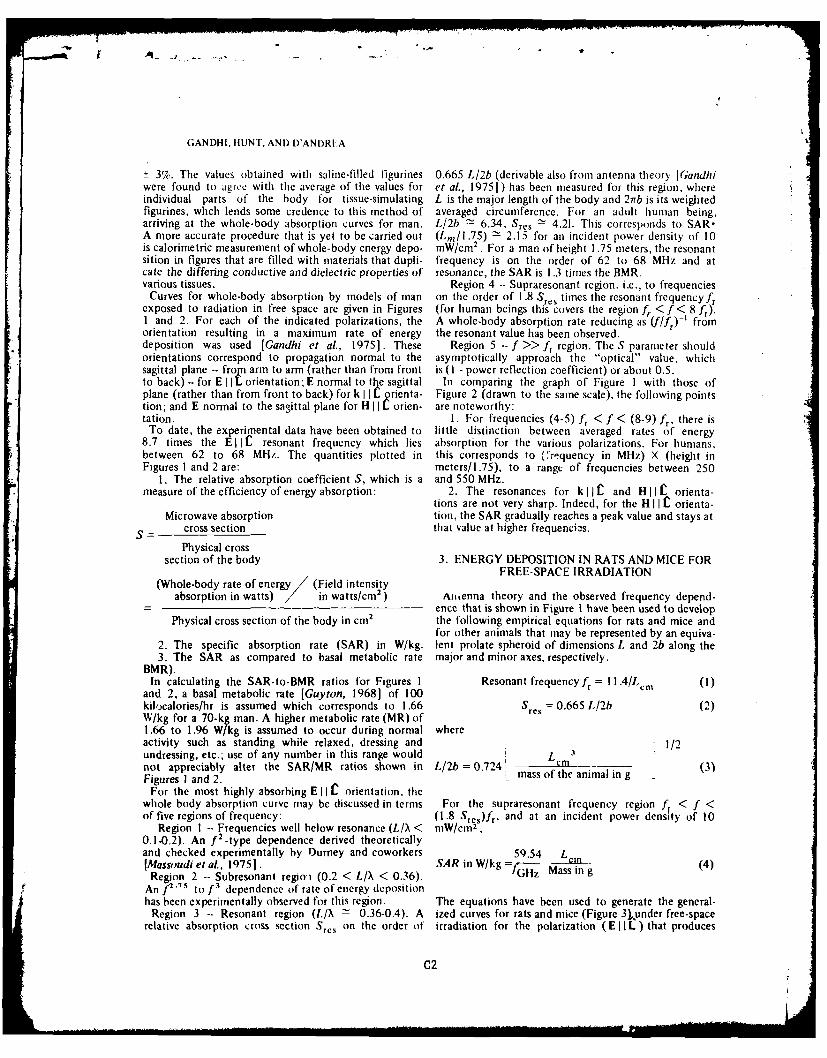
GANDHI, HUNT, ANt D'ANDREA
- 3%. The values obtained with saline-filled figurines 0.665 L/2b (derivable also from antenna theory [Gandhiwere found to agree with the average of the values for et al., 19751) has been measured for this region, whereindividual parts of the body for tissue-simulating L is the major length of the body and 21rb is its weightedfigurines, whch lends some credence to this method of averaged circumference. For an adult human being,arriving at the whole-body absorption curves for man. L/2b 6.34, Sres 4.21. This corresponds to SAR-A more accurate procedure that is yet to be carried out (Lml1.75) - 2.15 for an incident power density of 10is calorimetric measurement of whole-body energy depo- mW/cm 2 .For a man of height 1.75 meters, the resonantsition in figures that are filled with materials that dupli- frequency is on the order of 62 to 68 MHz and atcate the differing conductive and dielectric properties of resonance, the SAR is 1.3 times the BMR.various tissues. Region 4 -- Supraresonant region. i.e., to frequencies
Curves for whole-body absorption by models of man on the order of 1.8 Sres times the resonant frequency frexposed to radiation in free space are given in Figures (for human beings this covers the region fr < f < 8 fr)'I and 2. For each of the indicated polarizations, the A whole-body absorption rate reducing as (f/f,)- ' fromorientation resulting in a maximum rate of energy the resonant value has been observed.deposition was used [Gandhi et al, 19751. These Region 5 -- f >> fr region. The S parameter shouldorientations correspond to propagation normal to the asymptotically approach the "optical" value, whichsagittal plane -- from arm to arm (rather than from front is (1 - power reflection coefficient) or about 0.5.to back)-- for E li L orientation; E normal to the sagittal In comparing the graph of Figure 1 with those ofplane (rather than from front to back) for k I I orienta- Figure 2 (drawn to the same scale). the following pointstion; and E normal to the sagittal plane for HI £ orien- are noteworthy:tation. 1. For frequencies (4-5) fr < f < (8-9) fr, there is .1
To date, the experimental data have been obtained to little distinction between averaged rates of energy8.7 times the E II C resonant frequency which lies absorption for the various polarizations. For humans,between 62 to 68 MHz. The quantities plotted in this corresponds to (.-r'quency in MHz) X (height inFigures 1 and 2 are: meters/I.75), to a range of frequencies between 250
1. The relative absorption coefficient S, which is a and 550 MHz.measure of the efficiency of energy absorption: 2. The resonances for k I £ and H II £ orienta-
tions are not very sharp. Indeed, for the H I I £ orienta-Microwave absorption tion, the SAR gradually reaches a peak value and stays at
cross section that value at higher frequencics.
Physical crosssection of the body 3. ENERGY DEPOSITION IN RATS AND MICE FOR
FREE-SPACE IRRADIATION(Whole-body rate of energy / (Field intensity
absorption in watts) in watts/cm 2) Antenna theory and the observed frequency depend-2 ence that is shown in Figure I have been used to develop
Physical cross section of the body in cm2 the following empirical equations for rats and mice andfor other animals that may be represented by an equiva-
2. The specific absorption rate (SAR) in W/kg. lent prolate spheroid of dimensions L and 2b along the3. The SAR as compared to basal metabolic rate major and minor axes, respectively.
BMR).In calculating the SAR-to-BMR ratios for Figures I Resonant frequencyfr = l.4/Lcm (I)
and 2, a basal metabolic rate [Guyton, 19681 of 100kilocalories/hr is assumed which corresponds to 1.66 Sr,, = 0.665 L/2b (2)W/kg for a 70-kg man. A higher metabolic rate (MR) of1.66 to 1.96 W/kg is assumed to occur during normal whereactivity such as standing while relaxed, dressing and 1/2undressing, etc.; use of any number in this range would L 3
not appreciably alter the SAR/MR ratios shown in L/2b = 0.724' Lm (3)Figures I and 2. mass of the animal in g j
For the most highly absorbing E II C orientation, thewhole body absorption curve may be discussed in terms For the supraresonani frequency region fr < f <of five regions of frequency: (1.8 Sres)fr, and at an incident power density of 10
Region I -- Frequencies well below resonance (L/ < mW/cm2,0.1-0.2). An f2-type dependence derived theoreticallyand checked experimentally by Durney and coworkers 59.54 L[Massoudiet al., 19751. SAR in W/kg GHz Mass in (4)
Regon 2 -- Subresonant regiom (0.2 < LI/ < 0.36).
An j.7 5 to f3 dependence of rate of energy depositionhas been experimentally observed for this region. The equations have been used to generate the general-
Region 3 -. Resonant region (L/X " 0.36-0.4). A ized curves for rats and mice (Figure 3Lunder free-spacerelative absorption cross section Sres on the order of irradiation for the polarization (E II L) that produces
C2
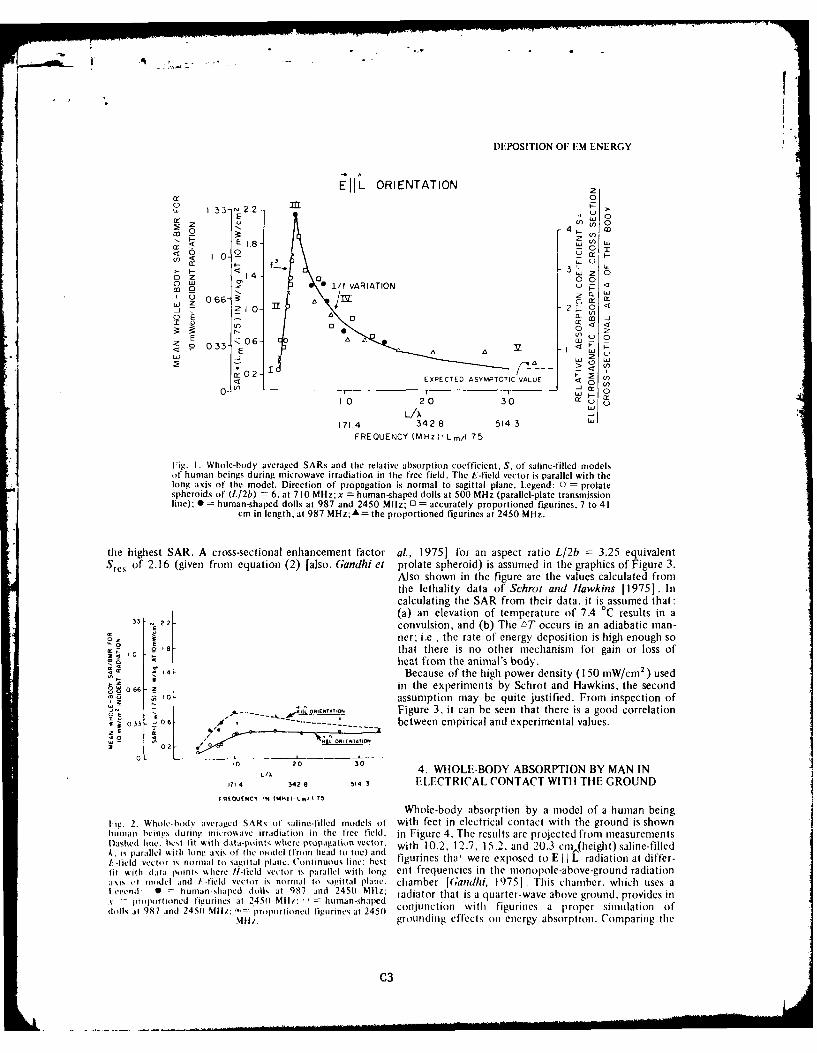
DEPOSITION OlFEM ENERGY
EfjL ORIENTATION
X E-0 -.A
w~0660
0 Z 10- 0 0~
_J~~~ Z m-0 E 0
E Z06- ~ -
Z 3 - y ~ s
r0- 21 EXPECTED ASYMPTOTIC VAU
1 0 2.0 3 0
LA -
171 4 342 8 514 3 UJFREQUENCY (MHZ) LmA 75
lig. 1. Whole-body averaged SARs and the relative absorption coefficient, S. of'saline-filled nmodelsof human beings during microwave irradiation in the free field. The E-field vector is parallel with thelong axis of the model. Direction of propagation is normal to sagittal plane. Legend: 0 = prolatespheroids of (Lf2b) =6. at 710 MHz;x = human-shaped dolls at 500 MHz (parallel-plate transmissionline); 0 human-shaped dolls at 987 and 2450 MHz; 0 accurately proportioned figurines. 7 to 41
cm in length, at 987 MHz;A= the proportioned figurines at 2450 MHz.
the highest SAR. A cross-sectional enhancement factor at, 1975] for an aspect ratio L/2b =3.25 equivalentSre, of 2.16 (given from equation (2) [also, Gandhi et prolate spheroid) is asstumed in the graphics of Figure 3.
Also shown in the figure are the values calculated fromlihe lethality data of Schrot and h1awkins [1975]. Incalculating the SAR from their data, it is assumed that:(a) an elevation of temperature (of 7.4 0C results in a
F. 2 convulsion, and (b) The nT occurs in an adiabatic man-ner; i.e., the rate of etnergy deposition is high enough so
01
'0 that there is no other tmechanism for gain or loss ofheat from the aninmal's body.
14 Because of the high power density (150 miW/cm' ) used~~566in the experiments by Schrot and Hawkins, the second
a'o assumption may be quite justified. From inspection of0_E7_---- ____AT Figure 3, it can be seen that there is a good correlation
V 1- 033 ------ between enmpirical and experimental values.
00 -'0 20 30 4. WHOLE-BODY ABSORPTION BY MAN IN
1714 342 8 514 3 ELECTRICAL CONTACT WITH THE GROUNDF REQUEHcy %i" I tM5)L n/i.T5
Whole-body absorption by a model of a human beingl ig. 2. Wholc-body averaged SARs of saline-filled models of with feet in electrical cotntact willh thle ground is shownIsuiiami beinps during mficrossavc irradiation in the free field, in Figure 4. The results are projected fromt measuretments
Dased in: bst itwitIt at-pont wle r popaatin ectrwith 10.2, 12.7, 15.2. and 20.3 cmii(heightI) saline-filledA. is parallel %kitlh long axis of the model ( from head to toe) andA-field vector is normal to, sagittal plane. Continuous line: best figurines tha' were exposed to E I I L radiation at differ-fit %ith dJata points \%here Il-feld sector is parallel witls long ent frequencies in the mon opole -above -ground radiation
i'i (i miodel and I--field sector is normsal to savit tal plane. chamber [Gamdhi, 19751. This chaitber, which uses aI erend 0 b iiman-stia pert dolls at 987 and 2450 111-1IIz ra dia to(r this ure-wv bv rud rvdsi
v -ptoportioned figuirines at 245o1 M1I/: Is,= unan-,haped tatj is a ure-wv bv go .prvdsidotls it 987 and 24561 MIz: -- srolsortioned figur nes at 24501 cmjtction witht figurines a proper simulation oSf
Mile. gristitditig effects oti energy abstorption. Comparitng the
C3
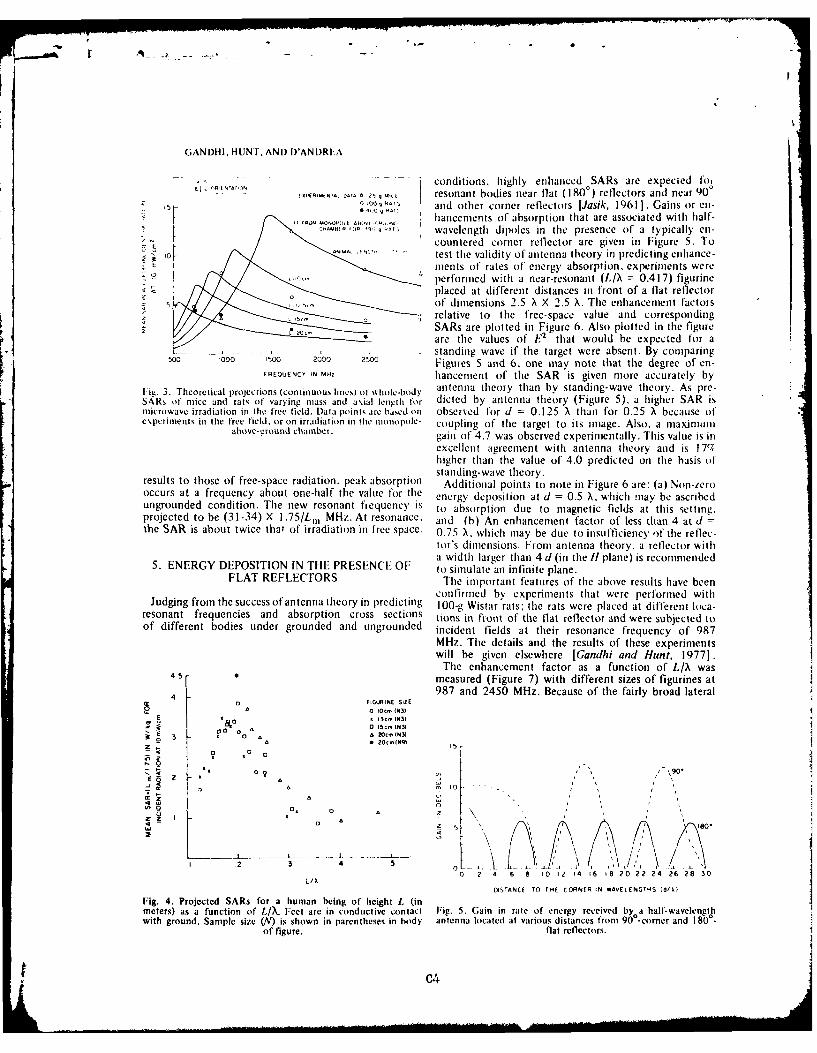
.,i , "
-1 1
-
GANDHI, HUNr. AND I)D'ANDRIA
conditions, highly enhanced SARs are expected fo.-, 0+. o A , resonant bodies near flat ( 1800) reflectors and near 900. and other corner reflectors [Jasik, 19611. Gains or en-
hancements of absorption that are associated with half-wavelength dipoles in the presence of a typically en-countered corner reflector are given in Figure 5. To
S _ test the validity of antenna theory in predicting enhance-- ments of rates of energy absorption, experiments were
performed with a near-resonant (I,/ = 0.417) figurineoq placed at different distances nt front of a flat reflector
of dimensions 2.5 X X 2.5 X. The enhancement factorsrelative to the free-space value and correspondingSARs are plotted in Figure 6. Also plotted in the figureare the values of h' that would be expected for a
. .standing wave if the target were absent. By comparing500 ,000 1500 2000 20 Figures 5 and 6. one may note that the degree of en-
FREOUENCY iN MH hancement of the SAR is given more accurately byIig. 3. Theoretical projections (continuous tines) of .tIle-Ibdy antenna theory than by standing-wave theory. As pre-SARs of mice and rats of varying mass and aial length for dicted by antenna theory (Figure 5), a higher SAR ismicrowave irradiation in the free field. Data points are based on observed for d = 0.125 X than for 0.25 X because ofexperiments in the free field, or on irradiation in the monopole- coupling of the target to its image. Also, a maxinlumn
above-eround elhanber. gain of 4.7 was observed experimentally. This value is inexcellent agreement with antenna theory and is 17';,higher than the value of 4.0 predicted on the basis ofstanding-wave theory.
results to those of free-space radiation, peak absorption Additional points to note in Figure 6 are: (a) Non-icrooccurs at a frequency about one-half the value for the energy deposition at d = 0.5 X. which may be ascribedungrounded condition. The new resonant frequency Is to absorption due to magnetic fields at this setting.projected to be (31-34) X 1.75/L1 MHz. At resonance, and (b) An enhancement factor of less than 4 at d =the SAR is about twice that of irradiation in free space. 0.75 X. which may be due to insufficiency of the reflec-
tor's dimensions. Front antenna theory, a reflector witha width larger than 4 d (in the /1 plane) is recommended
5. ENERGY DEPOSITION IN THE PRESENCE OF to simulate an infinite plane.FLAT REFLECTORS The important features of the above results have been
confirtmed by experiments that were performed withJudging from the success of antenna theory in predicting 100-g Wistar rats' the rats were placed at different loca-
resonant frequencies and absorption cross sections tions in front of the flat reflector and were subjected toof different bodies under grounded and ungrounded incident fields at their resonance frequency of 987
MHz. The details and the results of these experimentswill be given elsewhere [Gandhi and Hunt, 19771.
The enhancement factor as a function of L/X was4+ 5 - measured (Figure 7) with different sizes of figurines at
987 and 2450 MHz. Because of the fairly broad lateral0 FIGURINE SIZE
o~ A 0O.. INN)
,c a o I Ocm (N3I
3A a 20I
i- z
2 A
S I K -
0 5 \ 180"oo
32 4 5 o L-l- 1A
0 24 6 8 10 12 14 16 18 20 22 24 26 28 30LI)-
t5STANCE TO THE CORNER IN WAVELENGTHS dk)
Fig. 4. Projected SARs for a human being of height L (inmeters) as a function of LI. Feet are in conductive contact Fig. 5. Gain in rate of energy received by a hall*-wavelengthIwith ground. Sample size (.,) is shown in parentheses in body antenna located at various distances from 90°-corner and 180 °
-of figure. flat reflectors.
C4
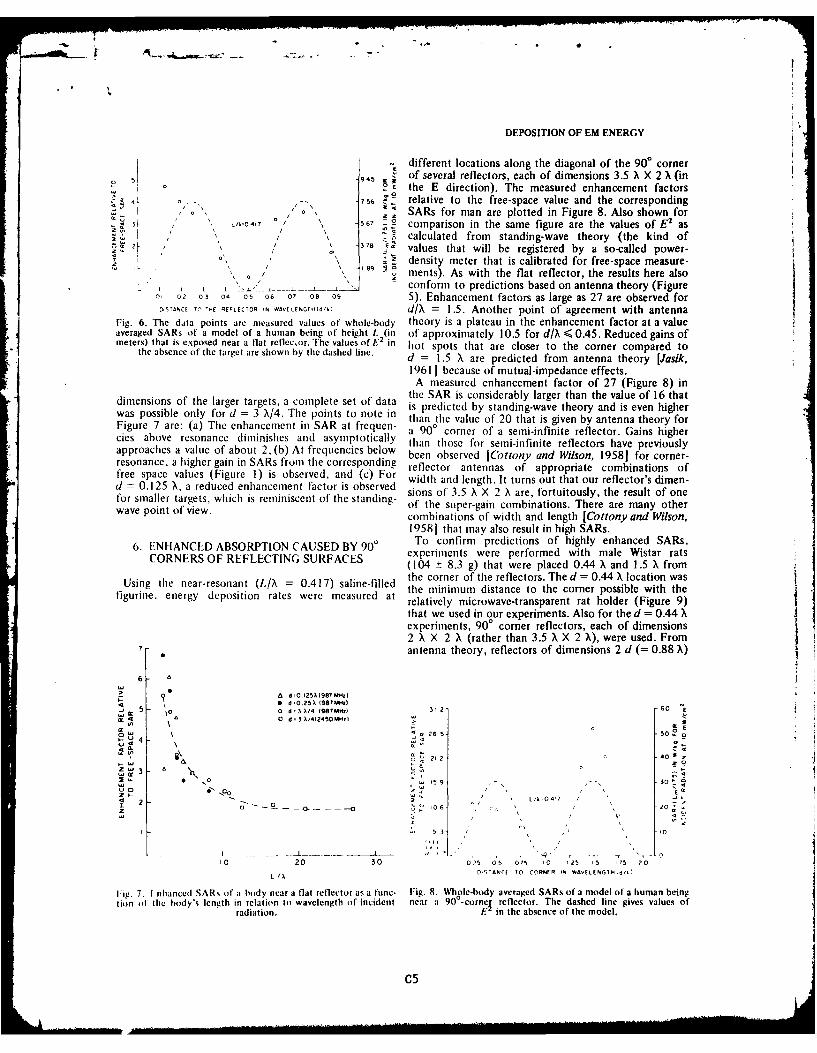
DEPOSITION OF EM ENERGY
different locations along the diagonal of the 900 cornerof several reflectors, each of dimensions 3.5 X, X 2 X (in
E the E direction). The measured enhancement factorso -. -56 relative to the free-space value and the corresponding
! / o SARs for man are plotted in Figure 8. Also shown for567 comparison in the same figure are the values of E2 as
, ,,', s calculated from standing-wave theory (the kind of"2 3 \ I values that will be registered by a so-called power-
0\I° ; - density meter that is calibrated for free-space measure-
, , s _ments). As with the flat reflector, the results here alsoK r I I 'conform11 to predictions based on antenna theory (Figure
0. 02 03 04 05 06 07 08 o9 5). Enhancement factors as large as 27 are observed forDIS.ANCE - 'HE REFLECTOR IN WAVELENGTH(d/k) d/X = 1.5. Another point of agreement with antenna
Fig. 6. The data points are measured values of whole-body theory is a plateau in the enhancement factor at a valueaveraged SARs of a model of a human being of height L (in of approximately 10.5 for d/X < 0.45. Reduced gains ofmeters) that is exposed near a flat reflecor. The values of E2
in hot spots that are closer to the comer compared tothe absence of the target are shown by the dashed line. d = 1.5 X are predicted from antenna theory tJasik,19611 because of mutual-impedance effects.A measured enhancement factor of 27 (Figure 8) in
the SAR is considerably larger than the value of 16 thatdimensions of the larger targets, a complete set of data is predicted by standing-wave theory and is even higherwas possible only for d = 3 X/4. The points to note in than the value of 20 that is given by antenna theory forFigure 7 are: (a) The enhancement in SAR at frequen- a 900 corner of a semi-infinite reflector. Gains highercies above resonance diminishes and asymptotically than those for semi-infinite reflectors have previouslyapproaches a value of about 2, (b) At frequencies below been observed [Cottony and Wilson, 1958] for corner-resonance, a higher gain in SARs from the corresponding reflector antennas of appropriate combinations offree space values (Figure 1) is observed, and (c) For width and length. It turns out that our reflector's dimen-d = 0.125 X, a reduced enhancement factor is observed sions of 3.5 X X 2 X are, fortuitously, the result of onefor smaller targets, which is reminiscent of the standing- of the super-gain combinations. There are many otherwave point of view. combinations of width and length [Cottony and Wilson,
19581 that may also result in high SARs.
6. ENHANCED ABSORPTION CAUSED BY 900 To confirm predictions of highly enhanced SARs,CORNERS OF REFLECTING SURFACES experiments were performed with male Wistar rats
(104 ± 8.3 g) that were placed 0.44 X and 1.5 X fromthe corner of the reflectors. The d = 0.44 X location wasUsing thethe minimum distance to the corner possible with the
figurine, energy deposition rates were measured at relatively microwave-transparent rat holder (Figure 9)
that we used in our experiments. Also for the d = 0.44 Xexperiments, 90' corner reflectors, each of dimensions2 X X 2 X (rather than 3.5 X X 2 X ), were used. Fromantenna theory, reflectors of dimensions 2 d (= 0.88 X)
6 -
> A~~ d. 125 A 987 M14z47 0 d-.25A(997M~s)
5\
i - "/4 19 " -3 2 60
0i. 26 5 s,4i -
214 2 40*
LZ bi6 A oU C[RINWatENT~d/
Z4 3'"a4.415 9 30
40 Ll 1,04?17
7. nhanced SARs ofa body nara flat reflector as a rune- Fig. 8. Whole-body averaged SARs of a model of a human beinglion of the body's length in relation to wavelength o~f incident near a 90-cornei reflector. The dashed line gives values ofradiation. E in the absence of the model.
C5
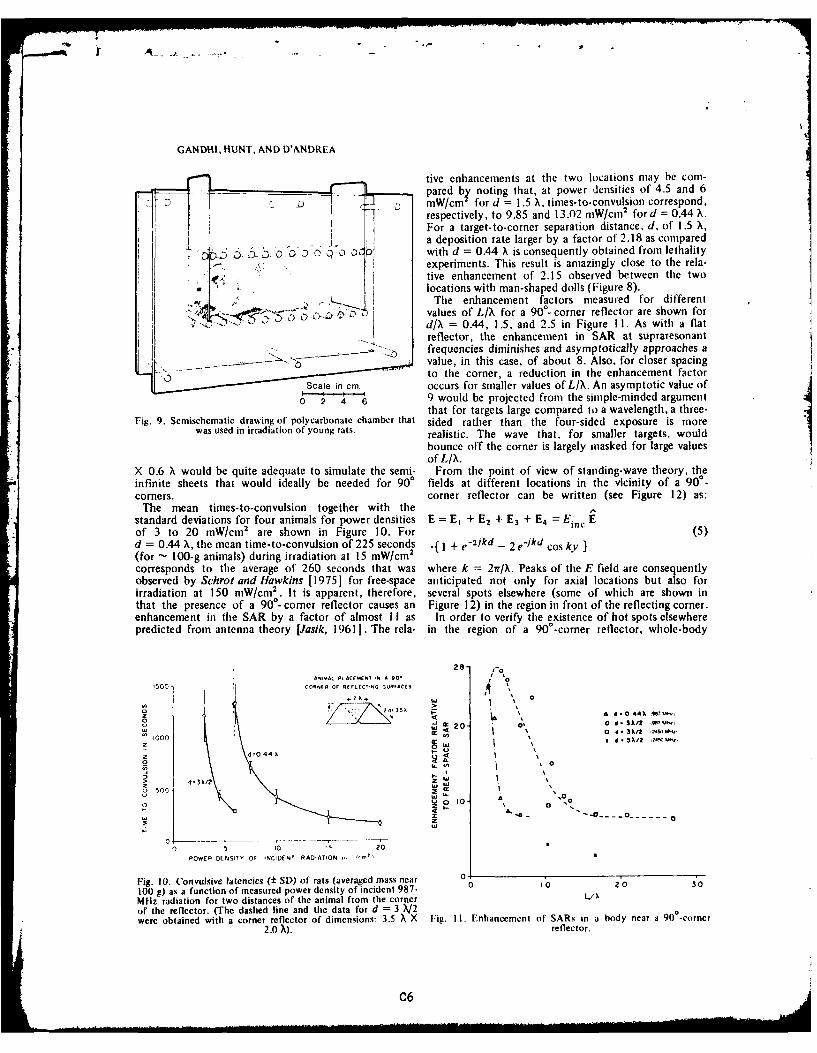
r ...- ,
GANDHI, HUNT, AND D'ANDREA
tive enhancements at the two locations may be com-- -pared by noting that, at power densities of 4.5 and 6
D mW/cmi for d = 1.5 X, times-to-convulsion correspond,respectively, to 9.85 and 13.02 mW/cm 2 ford = 0.44 X.For a target-to-corner separation distance. d, of 1.5 X,a deposition rate larger by a factor of 2.18 as compared
- 5 o "o0 0 D with d = 0.44 X is consequently obtained from lethalityexperiments. This result is amazingly close to the rela-tive enhancement of 2.15 observed between the twolocations with man-shaped dolls (Figure 8).
The enhancement factors measured for different0- values of L/X for a 90 - corner reflector are shown for
d/X = 0.44, 1.5, and 2.5 in Figure II. As with a flatreflector, the enhancement in SAR at supraresonant
. - frequencies diminishes and asymptotically approaches avalue, in this case, of about 8. Also, for closer spacingto the corner, a reduction in the enhancement factor
Scale in cm OCCUrs for smaller values of L/X. An asymptotic value of0 2 4 6 9 would be projected from the simple-minded argument
that for targets large compared to a wavelength, a three-Fig. 9. Semischematic drawing ol polycarbonate chamber that sided rather than the four-sided exposure is more
was used in irradiation of young rats. realistic. The wave that. for smaller targets. wouldbounce off the corner is largely masked for large valuesof L/X.
X 0.6 X would be quite adequate to simulate the semi- From the point of view of standing-wave theory, theinfinite sheets that would ideally be needed for 900 fields at different locations in the vicinity of a 900-corners, corner reflector can be written (see Figure 12) as:
The mean times-to-convulsion together with thestandard deviations for four animals for power densities E = E, + E2 + E3 + E4 = Einc Eof 3 to 20 mW/ctn 2 are shown in Figure 10. For (5)d = 0.44 X, the mean time-to-convulsion of 225 seconds .{ I + e2 i kd - 2 e -kd cos ky(for - l00-g animals) during irradiation at 15 mW/cm 2
corresponds to the average of 260 seconds that was where k = 2irfX. Peaks of the E field are consequentlyobserved by Schrot and Hawkins [1975] for free-space anticipated not only for axial locations but also forirradiation at 150 mW/cm2 It is apparent, therefore, several spots elsewhere (some of which are shown inthat the presence of a 900- corner reflector causes an Figure 12) in the region in front of the reflecting corner.enhancement in the SAR by a factor of almost I I as In order to verify the existence of hot spots elsewherepredicted from antenna theory [Jasik, 1961]. The rela- in the region of a 90 0-comer reflector, whole-body
28- -
ANIMAL P.AC(IMEI IN A 90' 1 OOC 1 COONFR OF RIEFLFCITIG ,RFACES FI "
)A 44),
~'i000 20- 0' 0d3ki2 ,W 20
dO 3I0 00
POE AlIYO ADNCRDAIO , " ~
d,3h/2 Zw
U, 0
0010 10 0
0 5 10 20A
POWERA DENSITO OF INCIDENT RADIATION -21I
Fig. I0. Convulsive latencies (± SD) of rats (averaged mass near100 g) as a function of measured power density of incident 987- 0 I0 20 30
MHz radiation for two distances of the animal from the corner L'/Xof the reflector. (The dashed line and the data for d = 3 X/2were obtained with a corner reflector of dimensions: 3.5 X X Fig. II. Enhancement of SARs in a body near a 90°-corner
2.0 X). reflector.
C6
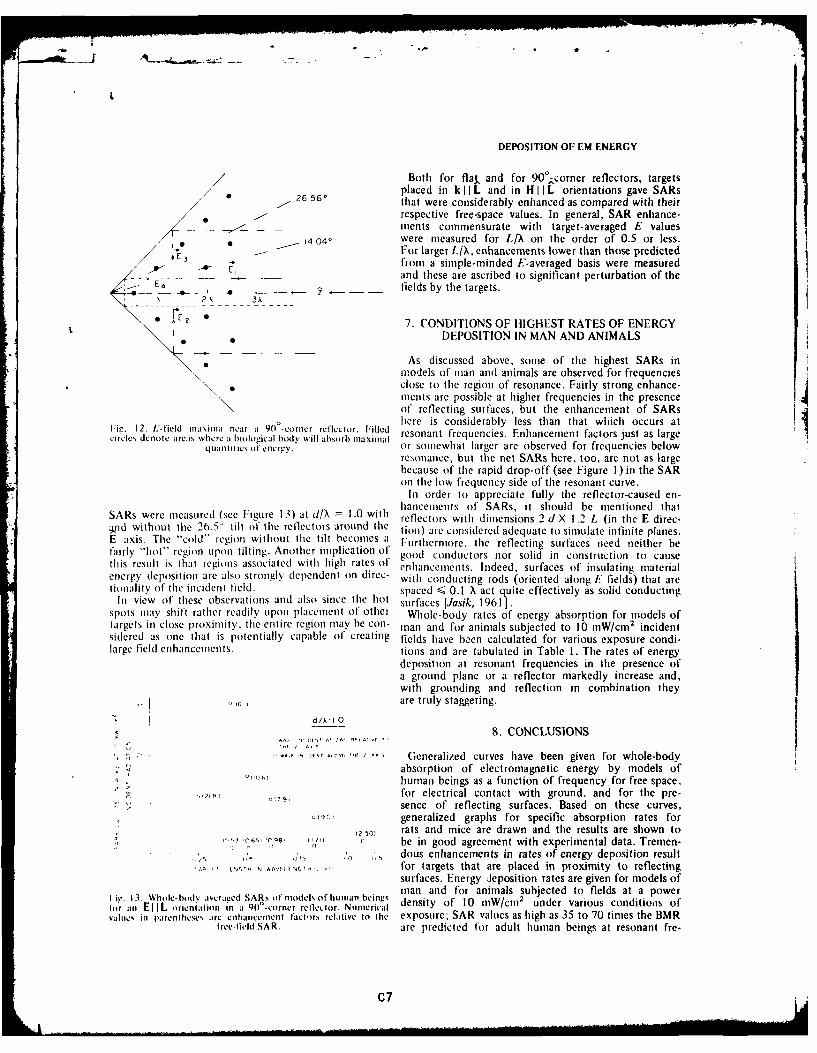
DEPOSITION OF EM ENERGY
Both for flak and for 900.corner reflectors, targetsplaced in k IL and in H IlL orientations gave SARs
26 560 that were considerably enhanced as compared with their
respective free-space values. In general, SAR enhance-_ _,.-_ - _ ments commensurate with target-averaged E values
*14 0 were measured for L/X on the order of 0.5 or less.For larger L/X, enhancements lower than those predicted
E 3 from a simple-minded E-averaged basis were measured,/-_ and these are ascribed to significant perturbation of the
_E4 fields by the targets.
SE " 7. CONDITIONS OF HIGHEST RATES OF ENERGY
DEPOSITION IN MAN AND ANIMALS
As discussed above, some of the highest SARs inmin.odels of man and animals are observed for frequenciesclose to the region of resonance. Fairly strong enhance-mcnts are possible at higher frequencies in the presenceof reflecting surfaces, but the enhancement of SARshere is considerably less than that which occurs at
ig. 12. 1:'-field maxima near a 90f-corner reflector. Filied resonant frequencies. Enhancement factors just as largecircles dCeote areas where a biological body will absorb maximalquantilics ofencrgy. or somewhat larger are observed for frequencies below
resonance, but the net SARs here, too, are not as largebecause of the rapid drop-off (see Figure I) in the SARon the low frequency side of the resonant curve.
In order to appreciate fully the reflector-caused en-ihancements of SARs, it should be mentioned that
SARs were measured (see Fizure 13) at d/X= 1.0 with reflectors with dimensions 2 d X 1.2 L (in the E direc-Wid without the 26.5 ' tilt of the reflectors around the lion) arc considered adequate to simulate infinite planes.E axis. The "cold" region without the tilt becomes a Furthernore. the reflecting surfaces need neither befairly "'hot" region upon tilting. Another implication of good conductors nor solid in construction to causethis result is that regions associated with high rates of enhancements. Indeed, surfaces of insulating materialenergy deposition are also strongly dependent on direc- with conducting rods (oriented along F fields) that aretionality of the incident field, spaced < 0.1 A act quite effectively as solid conducting
In view of these observations and also since the hot surfaces [Jasik, 19611.spots may shift rather readily upon placement of other Whole-body rates of energy absorption for models oftargets in close proximity. the entire region may be con- man and for animals subjected to 10 mW/cm 2 incidentsidered as one that is potentially capable of creating fields have been calculated for various exposure condi-large field enhancements. lions and are tabulated in Table I . The rates of energy
deposition at resonant frequencies in the presence ofa ground plane or a reflector markedly increase and,with grounding and reflection in combination theyare truly staggering.
d/,:I 0
8. CONCLUSIONS
Generalized curves have been given for whole-body7 4 absorption of electromagnetic energy by models of
hunian beings as a function of frequency for free space,S21 for electrical contact with ground, and for the pre-
sence of reflecting surfaces. Based on these curves,generalized graphs for specific absorption rates for
2 5 rats and mice are drawn and the results are shown to"1.. 0U q6 (17r) be in good agreement with experimental data. Tremen-
'5 ,, ,, , Z5 dous enhancements in rates of energy deposition result
S.,, . ., for targets that are placed in proximity to reflectingsurfaces. Energy deposition rates are given for models of
tiv. 13. Whote-bodv averaved SAls ol miodel of Itunian ben, ian and for animals subjected to fields at a power
for an E IlL orientation in a 9nt-corner relleLtor. Nmierica density of 10 mW/cot2 under various conditiots ofvJlues in parentheses are enhancemient factors relative to tie exposure; SAR values as high as 35 to 70 times tile BMR
tree-field SAR. are predicted for adult human beings at resonant fre-
C7
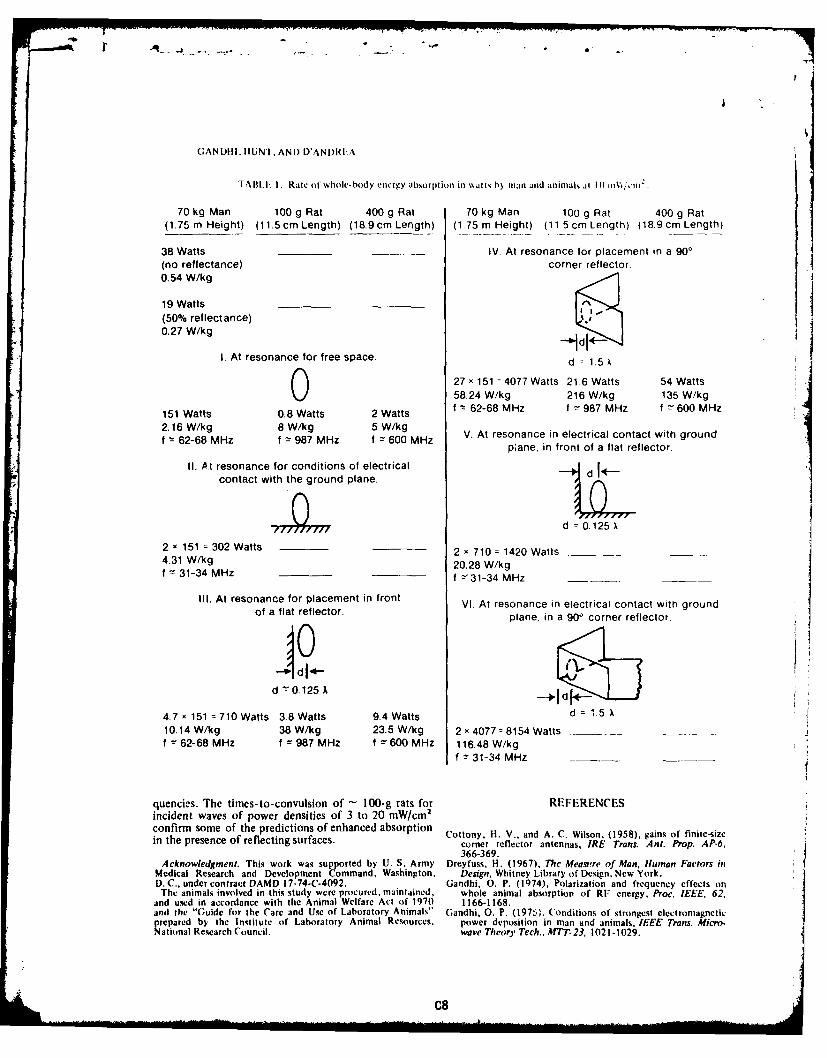
GANDI-1I. IIUNI, AND I)'ANDRI:A
'ABL I. I. Rate of whole- body energy absorption in , ,alit s b5 Ia n and anilnais ItI Ii inl\i, c
70 kg Man 100 g Rat 400 g Rat 70 kg Man 100 g Rat 400 g Rat(1.75 m Height) (11.5cm Length) (18.9cm Length) (1.75m Height) (11 5cmLength) (18.9cm Length)
38 Watts IV. At resonance for placement in a 900(no reflectance) corner reflector.0.54 W/kg
19 Watts
(50% reflectance)0.27 W/kg
I. At resonance for free space. d 1.5 A
27 0 151 = 4077 Watts 21.6 Watts 54 Watts
0 58.24 W/kg 216 W/kg 135 W/kg
151 Watts 0.8 Watts 2 Watts f 62-68 MHz f 987 MHz f 600 MHz2.16 W/kg 8 W/kg 5 W/kg V. At resonance in electrical contact with ground
62-68 MHz f 987 MHz f 600 MHz p;ane, in front of a flat reflector.
II. .t resonance for conditions of electricalcontact with the ground plane.0 I
77777.7777 d = 0.125 X
2 x 151 = 302 Watts 2 x 710 = 1420 Watts4.31 W/kg 20.28 W/kgf 31-34 MHz f 231-34 MHz
Ill. At resonance for placement in front VI. At resonance in electrical contact with groundof a flat reflector. plane, in a 900 corner reflector.
d - 0.125 A __ d
4.7 x 151 0710 Watts 3.8 Watts 9.4 Watts d = 1.5 )
10.14 W/kg 38 W/kg 23.5 W/kg 2 0 4077 8154 Wattsf -- 62-68 MHz f -- 987 MHz f = 600 MHz 116.48 W/kg
f -- 31-34 MHz
quencies. The times-to-convulsion of - 100-g rats for REFERENCESincident waves of power densities of 3 to 20 mW/cm2
confirm some of the predictions of enhanced absorption Cottony, H. V., and A. C. Wilson. (1958), gains of finic-sizein the presence of reflecting surfaces. corner reflector antennas, IRE Trans. Ant. Prop. AP-6,
366-369.Acknowledgment. This work was supported by U. S. Army Dreyfuss, H. (1967). The Measwtre of Man, Human Factors in
Medical Research and Development Command, Washington, Design, Whitney Library of Design, New York.D.C., under contract DAMD 17-74-C-4092. Gandhi, 0. P. (1974), Polarization and frequency effects on
The animals involved in this study were procured, maintained, whole animal absorption of RF energy, Proc. IEEE. 62,and used in accordance with the Animal Welfare Act of 1970 1166-1168.and the "Guide for the Care and Use of Laboratory Animals" Gandhi, 0. P. (1975). Conditions of strongest electromagneticprepared by the Institute of Laboratory Animal Revources, power deposition in man and animals, IEEE Trans. Micro-National Research Council. wave Theory Tech.. MTT. 23, 102 1-1029.
C8
o 2° . U
DEPOSITION OF EM ENERGY
Gandhi, 0. P., K. Sedigh, G. S. Beck, and E. L. Hunt (1976), Massoudi, H., C. H. Durney, C. C. Johnson, and S. Allen (1976).Distribution of electromagnetic energy deposition in models Theoretical calculations of power absorbed by monkey andof man with frequencies near resonance, in Biological Effects human prolate spheroidal phantoms in an irradiation cham-of Electromagntic Waves, Selected Papers of the USNCIURSI ber, in Biological Effects of Electromagnetic Waves. SelectedAnnual Meeting, Boulder, Colorado, October 20-23, 1975, Papers of the USNC/URSI Annual Meeting. Boulder,Vol. II, 44-67, edited by C. C. Johnson and M. L. Shore, Colorado, October 20-23, 1975, Vol. 11, 135-157, edited by
HEW PubL (FDA) 77-8011, U. S. Government Printing C. C. Johnson and M. L. Shore, HEW Publ. (FDA) 77.8011,Office, Washington, D. C. 20402. U. S. Government Printing Office, Washington, D.C. 20402.
Gandhi, 0. P., and 1. L. Hunt (1977), Enhancement in electro- Schrot, J., and T. D. Hawkins (1976), Interaction of microwavemagnetic energy deposition for man and animals in the frequency and polarization with animal size, in Biologicalpresence of reflecting surfaces, to be published. Effects of Electromagnetic Waves, Selected Papers of the
Guyton, A. C. (1968), Textbook of Medical Physiology, pp. 978- USNC/URS1 Annual Meeting, Boulder, Colorado, October983. W. B.Saunders, Philadelphia, Pennsylvania. 20.23, 1975, Vol. 1I, 184-192, edited by C. C. Johnsoig and
Jasik, H., (Ed.) (1961), Antenna Enginering Handbook, McGraw- M. L. Shore, HEW Pub. (FDA) 77-8011, U. S. GovernmentHill, New York. Chapter I1. Printing Office, Washington, D. C. 20402.
C9
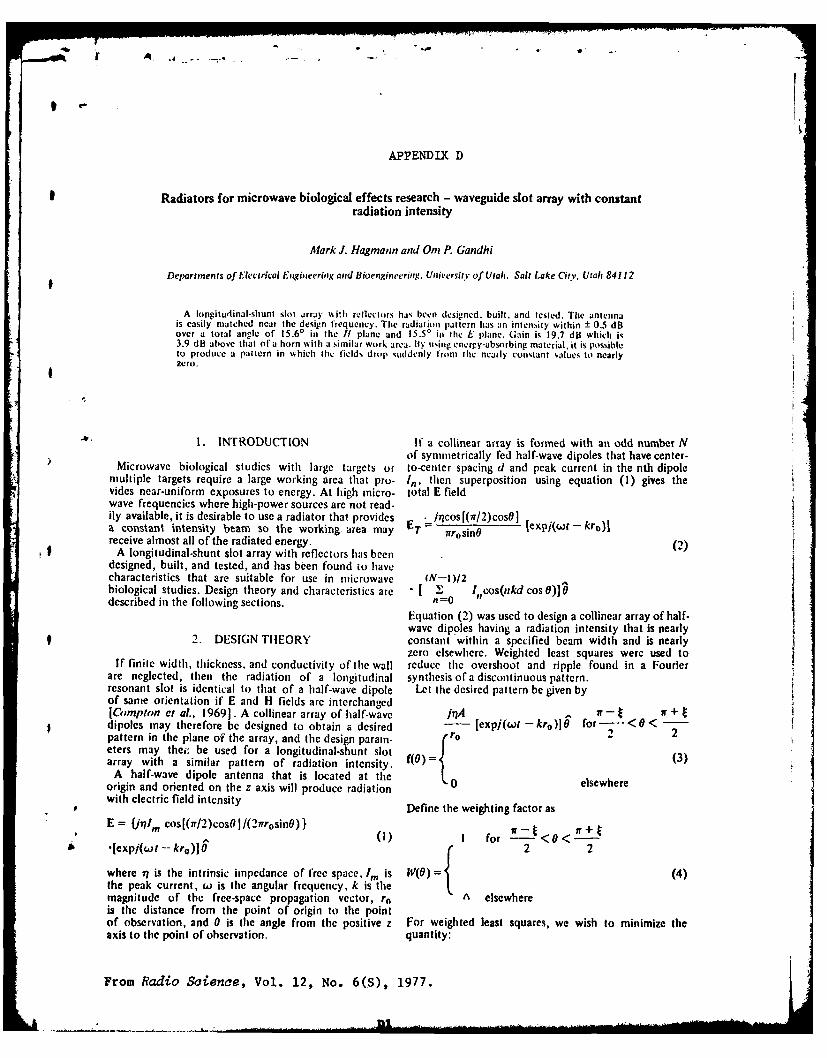
r ..
APPENDIX D
Radiators for microwave biological effects research - waveguide slot array with constantradiation intensity
Mark J. Hagmann and Om P. Gandhi
Departments of I:'ectrical Engineering atd Bioengineering. University of Utah. Salt Lake City, Utah 84112
A longitudinal-shun slot array %sith reflectors has been designed. built, and tested. The antennais easily matched near the design frequency. The radialiom pattern has an intensity within ± 0.5 dBover a total angle of 15.60 in the 1t plane and 15.50 in the E plane. Gain is 19.7 dB which is3.9 dB above that of a horn with a similar work area. I% using energy-absorbing naterial, it is possibleto produce a pattern in which the fields drop suddenly lrom thc nearly contant values to nearlyzero.
e4
1. INTRODUCTION If a collinear array is formed with at odd number Nof symmetrically fed half-wave dipoles that have center-
Microwave biological studies with large targets or to-center spacing d and peak current in the nth dipolemultiple targets require a large working area that pro- i,, then superposition using equation (1) gives thevides near-uniform exposures to energy. At high tnicro- total E fieldwave frequencies where high-power sources are not read-ily available, it is desirable to use a radiator that provides i.rcos[(7r/2)cos6J Iexpi(ot - kro)Ia constant intensity beam so the working area may ET irosinOreceive almost all of the radiated energy. (2)
A longitudinal-shunt slot array with reflectors has beendesigned, built, and tested, and has been found io havecharacteristics that are suitable for use in microwave (N-I )/2biological studies. Design theory and characteristics are [, I cos(nkd cos0)]0described in the following sections. n=0Equation (2) was used to design a collinear array of half-
wave dipoles having a radiation intensity that is nearly2. DESIGN THEORY constant within a specified beam width and is nearlyzero elsewhere. Weighted least squares were used to
If finite width, thickness. and conductivity of the wall reduce the overshoot and ripple found in a Fourierare neglected, then the radiation of a longitudinal synthesis of a discontinuous pattern.resonant slot is identical to that of a half-wave dipole Let the desired pattern be given byof same orientation if E and H fields are interchanged(Compton et al., 1969]. A collinear array of half-wave 7AIr - ir +dipoles may therefore be designed to obtain a desired [expi(wt - kro)]0 for - < < -pattern in the plane of the array, and the design param- ro 2 2eters may thei, be used for a longitudinal-shunt slot (3)array with a similar pattern of radiation intensity. f40)= 3
A half-wave dipole antenna that is located at theorigin and oriented on the z axis will produce radiation elsewherewith electric field intensity Define the weighting factor as
E = {ji71m cos[(ir/2)cosO /(2 rosinO)} (lI for ir- t< 0 <
A ' [exp/(wt - kro) 0 2 2
where ir is the intrinsic impedance of free space, !m is !W(O) (4)the peak current, w is the angular frequeticy, k is themagnitude of the free-space propagation vector, ro A elsewhereis the distance from the point of origin to the pointof observation, and 0 is the angle from the positive z For weighted least squares, we wish to minimize theaxis to the point of ohservation. quantity:
From Radio Science, Vol. 12, No. 6(0), 1977.
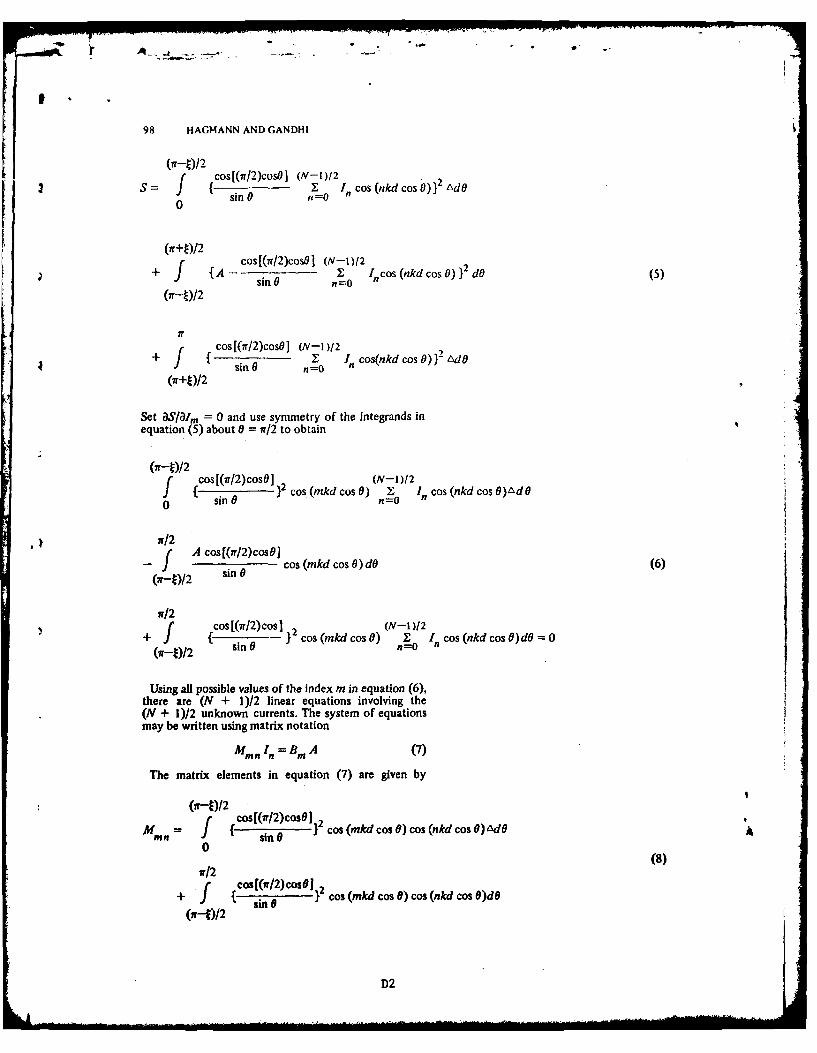
98 HAGMANN AND GANDHI
(7r-t)/2 o[i/)ol(N12
S= f o[(/)osj( 2 In Cos(Pkd Cos 0)} 2 AdO
0 sinG 0It=0 '
+ [~~cs(7r/2)cos91 (N-Et)t2 1 Cs}
{A ~ ~ ~ , -s Co(i 0nnkd cos 0) } d5)
Ifcos[(7r/2)cosOj (N-1 )12+in f I;1, cos(nkd Cos 0)} AdO
Set aS/aIm = 0 and use symmetry of the integrands inequation (5) about 0 = w/2 to obtain
co[i/)oP (N-0)12f o!r2cs] Cos (rkd cos0) Y, In, Cos(nkd Cos0) Ad 0
A ir/2-f A cosf(7r/2)cosOj(6
rn cos (mkd cos 0) dO(6
ir/2cosl(r2)cos 2 co~kcs)(N-1)12
+ f Co (k Ios 6) 2 nCos (nkd cos8) dO=0sin 0 n0O
Using all possible values of the index m in equation (6),there are (N + 1)/2 linear equations involving the(N + 1)/2 unknown currents. The system of equationsmay be written using matrix notation
Mmnln = BA (7)
The matrix elements in equation (7) are given by
M = f fi-)l cs in/o~ 2 Cos (mkd Cos 0) cos (nkd cos 0) AdO
0(8)
+~ ~~i f [/2csj2cos (mkd Cos 0) cos (nkd cos 0)dO
D2
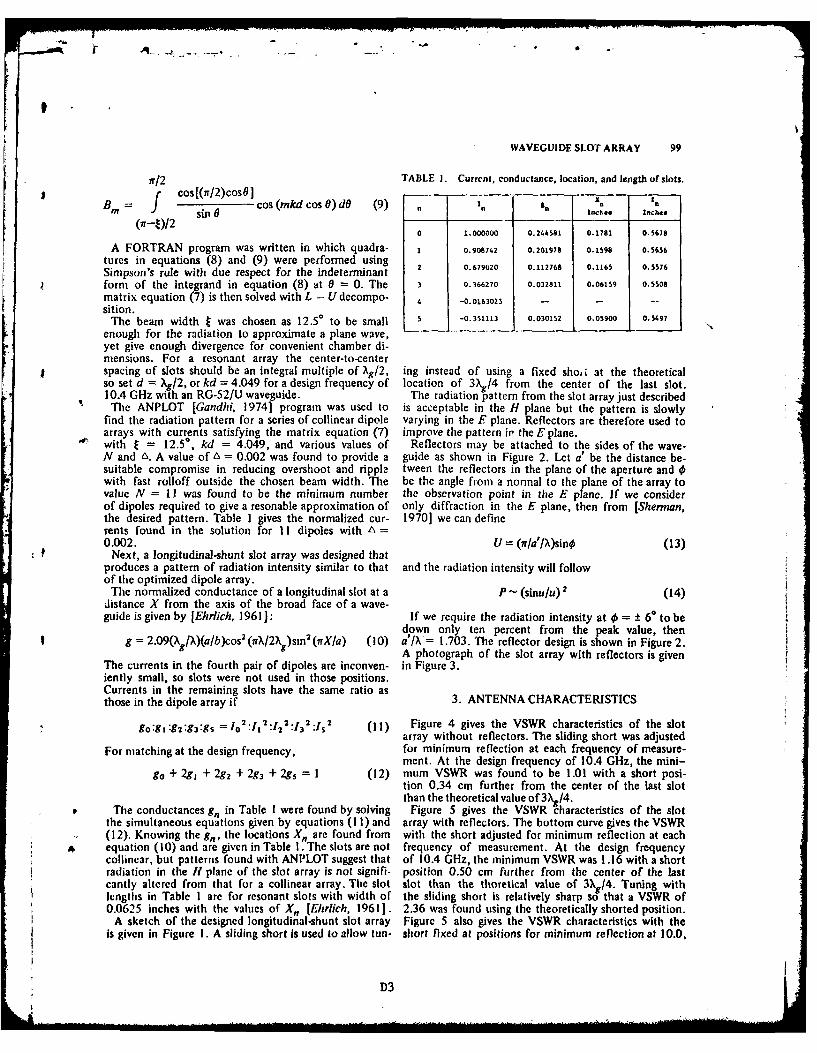
WAVEGUIDE SLOT ARRAY 99
ir/2 TABLE I. Currcni, conductance, location, and length of slots.f- cos[(r/2)cosO]B = sin 0 cos (mkd cos O) dO (9) n in a a, , .
0 1.00000 0.244581 0.1781 0.5678
A FORTRAN program was written in which quadra- 1 0.908742 0.201978 0.1598 0.5656tures in equations (8) and (9) were performed usingSimpson's rule with due respect for the indeterminant 2 0.679020 0.112768 0.1165 0.5576form of the integrand in equation (8) at 0 = 0. The 3 0.366270 0.032811 0.06159 0.5508
matrix equation (7) is then solved with L - U decompo- 4 -0.0163023 ....sition.The beam width t was chosen as 12.50 to be small 5 -0.351113 0.030152 0.05900 0.5497
enough for the radiation to approximate a plane wave,yet give enough divergence for convenient chamber di-mensions. For a resonant array the center-to-centerspacing of slots should be an integral multiple of Xg/2, ing instead of using a fixed sho,! at the theoreticalso set d = Xg/2, or kd = 4.049 for a design frequency of location of 3Xg/4 from the center of the last slot.10.4 GHz with an RG-52/U waveguide. The radiation pattern from the slot array just described
The ANPLOT [Gandhi, 1974] program was used to is acceptable in the H plane but the pattern is slowlyfind the radiation pattern for a series of collinear dipole varying in the F plane. Reflectors are therefore used toarrays with currents satisfying the matrix equation (7) improve the pattern in the E plane.with t = 12.50, kd = 4.049, and various values of Reflectors may be attached to the sides of the wave-N and A. A value of A = 0.002 was found to provide a guide as shown in Figure 2. Let a' be the distance be-suitable compromise in reducing overshoot and rippla tween the reflectors in the plane of the aperture and 0with fast rolloff outside the chosen beam width. The be the angle from a normal to the plane of the array tovalue N = 11 was found to be the minimum number the observation point in the E plane. If we considerof dipoles required to give a resonable approximation of only diffraction in the E plane, then from [Sherman,the desired pattern. Table I gives the normalized cur- 1970] we can definerents found in the solution for I I dipoles with A =0.002. U = (ir/a'lX )sin0 (13)
* Next, a longitudinal-shunt slot array was designed thatproduces a pattern of radiation intensity similar to that and the radiation intensity will followof the optimized dipole array.
The normalized conductance of a longitudinal slot at a P - (sinufu) 2 (14)distance X from the axis of the broad face of a wave-guide is given by [Ehrlich, 1961]: If we require the radiation intensity at = + 60 to be
down only ten percent from the peak value, theng = 2.09(X /?.)(a/b)cos2 (i'X/2X )sm 2 (rXla) (10) a'/X= 1.703. The reflector design is shown in Figure 2.
A photograph of the slot array with reflectors is givenThe currents in the fourth pair of dipoles are inconven- in Figure 3.iently small, so slots were not used in those positions.Currents in the remaining slots have the same ratio asthose in the dipole array if 3. ANTENNA CHARACTERISTICS
g0 :g1 :g2 :g3 :g5 = lo 2 :l1 2 :122 :13 2 :1s 2 (11) Figure 4 gives the VSWR characteristics of the slotarray without reflectors. The sliding short was adjusted
For matching at the design frequency, for minimum reflection at each frequency of measure-ment. At the design frequency of 10.4 GHz, the mini-
g0 + 2g 1 + 2g 2 + 2g3 + 2g5 = 1 (12) mum VSWR was found to be 1.01 with a short posi-tion 0.34 cm further from the center of the last slotthan the theoretical value of 3Xg/4.
The conductances g,, in Table I were found by solving Figure 5 gives the VSWR characteristics of the slotthe simultaneous equations given by equations (1i) and array with reflectors. The bottom curve gives the VSWR(12). Knowing the g,, the locations X, are found from with the short adjusted for minimum reflection at eachequation (10) and are given in Table 1. The slots are not frequency of measurement. At the design frequencycollincar, but patterns found with ANPLOT suggest that of 10.4 GHz, the minimum VSWR was 1.16 with a shortradiation in the H plane of the slot array is not signifi- position 0.50 cm further from the center of the lastcantly altered from that for a collinear array. The slot slot than the thoretical value of 3Xg/4. Tuning withlengths in Table I are for resonant slots with width of the sliding short is relatively sharp so that a VSWR of0.0625 inches with the values of Xn [Ehrlich, 1961]. 2.36 was found using the theoretically shorted position.
A sketch of the designed longitudinal-shunt slot array Figure 5 also gives the VSWR characteristics with theis given in Figure 1. A sliding short is used to allow tun- short fixed at positions for minimum reflection at 10.0,
D3
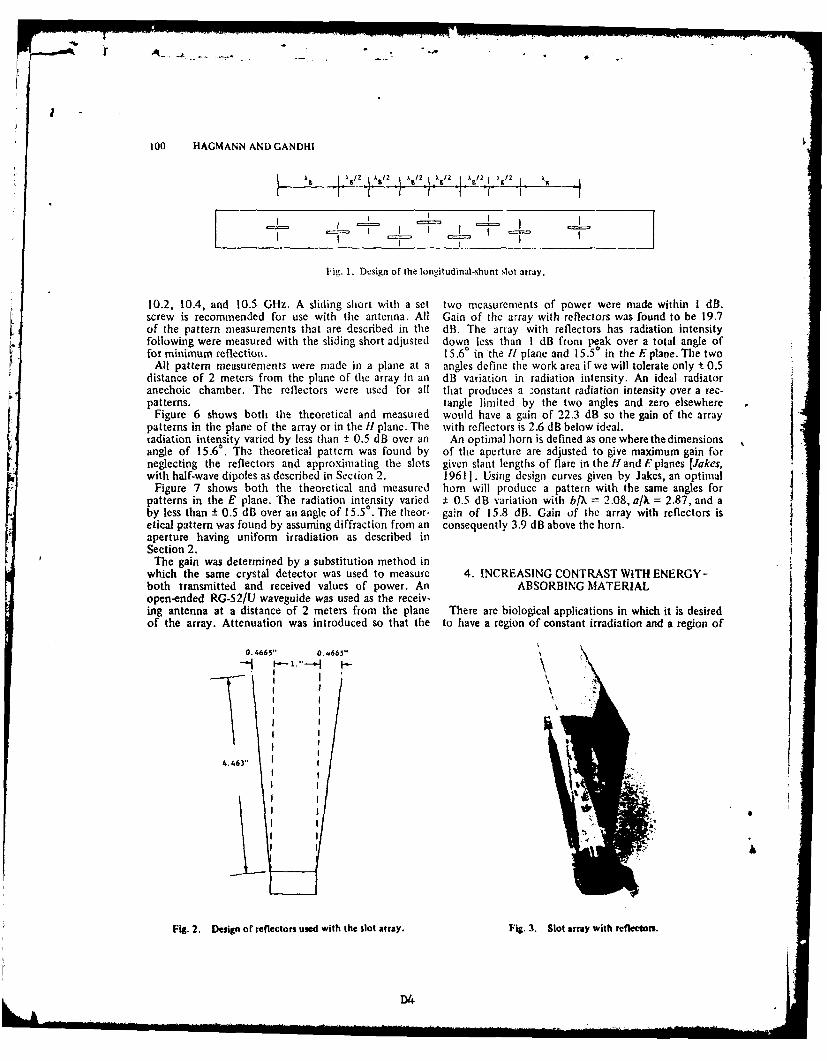
'I100 IIAGMANN AND GANDHI
X 5/2 A /2A /2 A 12 A,/2 1,/2
I T __F__T__T
II I I= I_ -J
F ig. 1. Design of the longitudinal-shunt slot array.
10.2, 10.4, and 10.5 GHz. A sliding short with a set two measurements of power were made within I dB.screw is recommended for use with the antenna. All Gain of the array with reflectors was found to be 19.7of the pattern measurements that are described in the dB. The array with reflectors has radiation intensityfollowing were measured with the sliding short adjusted down less than I dB from peak over a total angle offor minimum reflection. 15.60 in the !t plane and 15.5 in the E plane. The twoAll pattern measurements were made in a plane at a angles define the work area if we will tolerate only ± 0.5
distance of 2 meters from the plane of the array in an dB variation in radiation intensity. An ideal radiatoranechoic chamber. The reflectors were used for all that produces a ;onstant radiation intensity over a rec-patterns. tangle limited by the two angles and zero elsewhere
Figure 6 shows both the theoretical and measured would have a gain of 22.3 dB so the gain of the arraypatterns in the plane of the array or in the H plane. The with reflectors is 2.6 dB below ideal.radiation intensity varied by less than ± 0.5 dB over an An optimal horn is defined as one where the dimensionsangle of 15.60. The theoretical pattern was found by of the aperture are adjusted to give maximum gain forneglecting the reflectors and approximating the slots given slant lengths of flare in the H and E planes [lakes,with half-wave dipoles as described in Section 2. 1961]. Using design curves given by Jakes, an optimal
Figure 7 shows both the theoretical and measured horn will produce a pattern with the same angles forpatterns in the E plane. The radiation intensity varied ± 0.5 dB variation with bJX = 2.08, aPk = 2.87, and aby less than ± 0.5 dB over an angle of 1 5.50 . The theor- gain of 15.8 dB. Gain of the array with reflectors isetical pattern was found by assuming diffraction from an consequently 3.9 dB above the horn.aperture having uniform irradiation as described inSection 2.
The gain was determined by a substitution method inwhich the same crystal detector was used to measure 4. INCREASING CONTRAST WITH ENERGY-both transmitted and received values of power. An ABSORBING MATERIALopen-ended RG-52/U waveguide was used as the receiv-ing antenna at a distance of 2 meters from the plane There are biological applications in which it is desiredof the array. Attenuation was introduced so that the to have a region of constant irradiation and a region of
0. 4665" O..665"
4.463' .
Fig. 2. Design or reflectors used with the slot array. Fig. 3. Slot array with reflectors.
D4
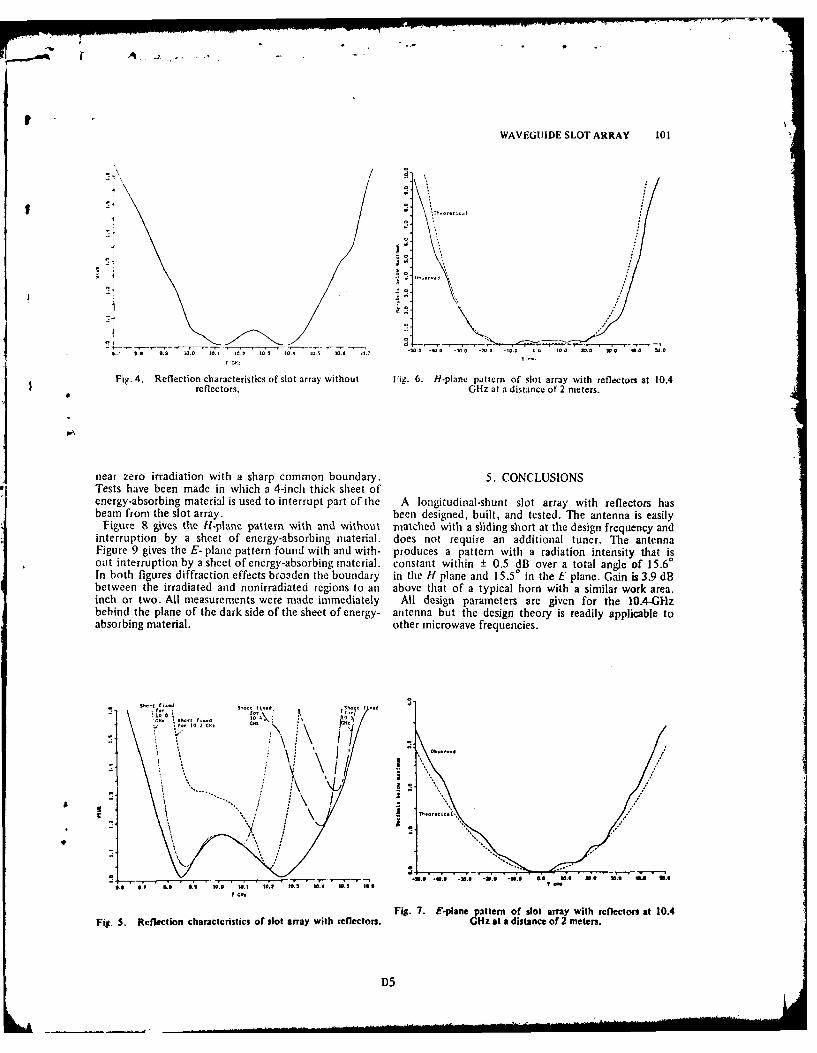
WAVEGUIDE SLOT ARRAY 101
! c!' .I
19
.7 I's 9.1 3.O 30. 102 303 10. 30.5 -06 o., 30 -D -, .0 -M.O -00. 0 1. W. 0 Wo CC 30.
f G.:
Fig. 4. Reflection characteristics of slot array without Fig. 6. H-plane pattern of slot array with reflectors at 10.4reflectors. Gliz at a distance of 2 meters.
near zero irradiation with a sharp common boundary. 5. CONCLUSIONSTests have been made in which a 4-inch thick sheet ofenergy-absorbing material is used to interrupt part of the A longitudinal-shunt slot array with reflectors hasbeam from the slot array. been designed, built, and tested. The antenna is easily
Figure 8 gives the H-plare pattern with and without matched with a sliding short at the design frequency andinterruption by a sheet of energy-absorbing material, does not require an additional tuner. The antennaFigure 9 gives the E- plane pattern found with and with- produces a pattern with a radiation intensity that isout interruption by a sheet of energy-absorbing material, constant within ± 0.5 dB over a total angle of 15.60In both figures diffraction effects broaden the boundary in the H plane and 15.5 in the E plane. Gain is 3.9 dBbetween the irradiated and nonirradiated regions to an above that of a typical horn with a similar work area.inch or two. All measurements were made immediately All design parameters are given for the 1O.4-GIlzbehind the plane of the dark side of the sheet of energy- antenna but the design theory is readily applicable toabsorbing material. other microwave frequencies.
s,- fk..d Sh-r fi.. Sh; f.031*f'00Z -0. SOM.8 -20 .100 0.30 o 492.
, /\ \ f
* -- \ / ,. ,,,
'0. t;, to., W. to'
t CH.
Fig. 7. E-plane pattern of slot array with reflectors at 10.4Fig. 5. Reflection characteristics of slot array with reflectors. GHz at a distance of 2 meters.
D5
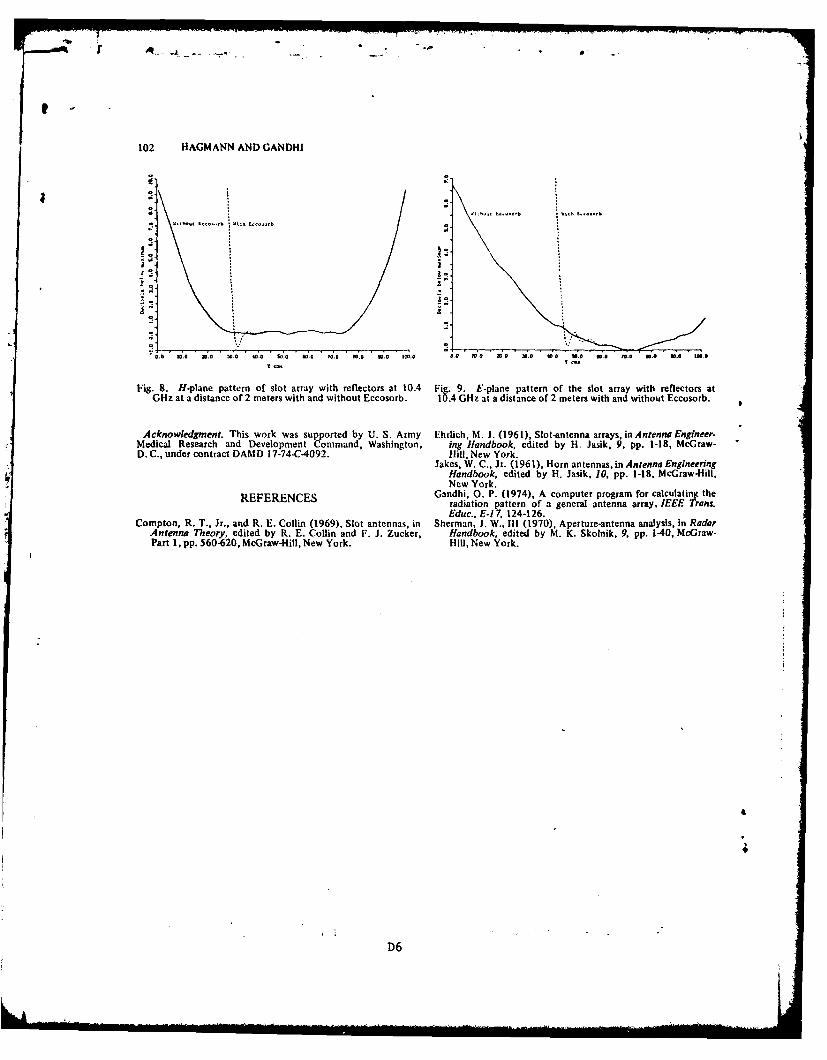
Ir -
102 HAGMANN AND GANDHI
WUh1u C...o.. '4kut E110.3rS
•a£
0.4 00.8 10.0 a W W0.8 00.0 0.0 w 0.0 10.0 10 W.0 10o. 0.0 Igo 8 . 10 0 a to .a's .8 1o. 10.0 t1o
Fig. 8. H-plane pattern of slot array with reflectors at 10.4 Fig. 9. E-plane pattern of the slot array with reflectors atGHz at a distance of 2 meters with and without Eccosorb. 10.4 GHz at a distance of 2 meters with and without Eccosorb.
Acknowledgment. This work was supported by U. S. Army Ehrlich, M. J. (1961), Slot-antenna arrays, in Antenna Engineer-Medical Research and Development Command, Washington, ing Handbook, edited by H. Jasik, 9, pp. 1-18, McGraw-D. C., under contract DAMD 17-74-C-4092. Hill, New York.
Jakes, W. C., Jr. (1961), Horn antennas, in Antenna EngineeringHandbook, edited by H. Jasik, 10, pp. 1-18. McGraw-Hill,New York.
REFERENCES Gandhi, 0. P. (1974), A computer program for calculating theradiation pattern of a general antenna array, IEEE Trans.Educ., E-1 7, 124-126.
Compton, R. T., Jr., and R. E. Collin (1969), Slot antennas, in Sherman, J. W., I1 (1970), Aperture-antenna analysis, in RadarAntenna Theory, edited by R. E. Collin and F. J. Zucker, Handbook, edited by M. K. Skolnik, 9, pp. 1-40, McGraw-Part 1, pp. 560-620, McGraw-Hill, New York. HllU, New York.
D6
D6
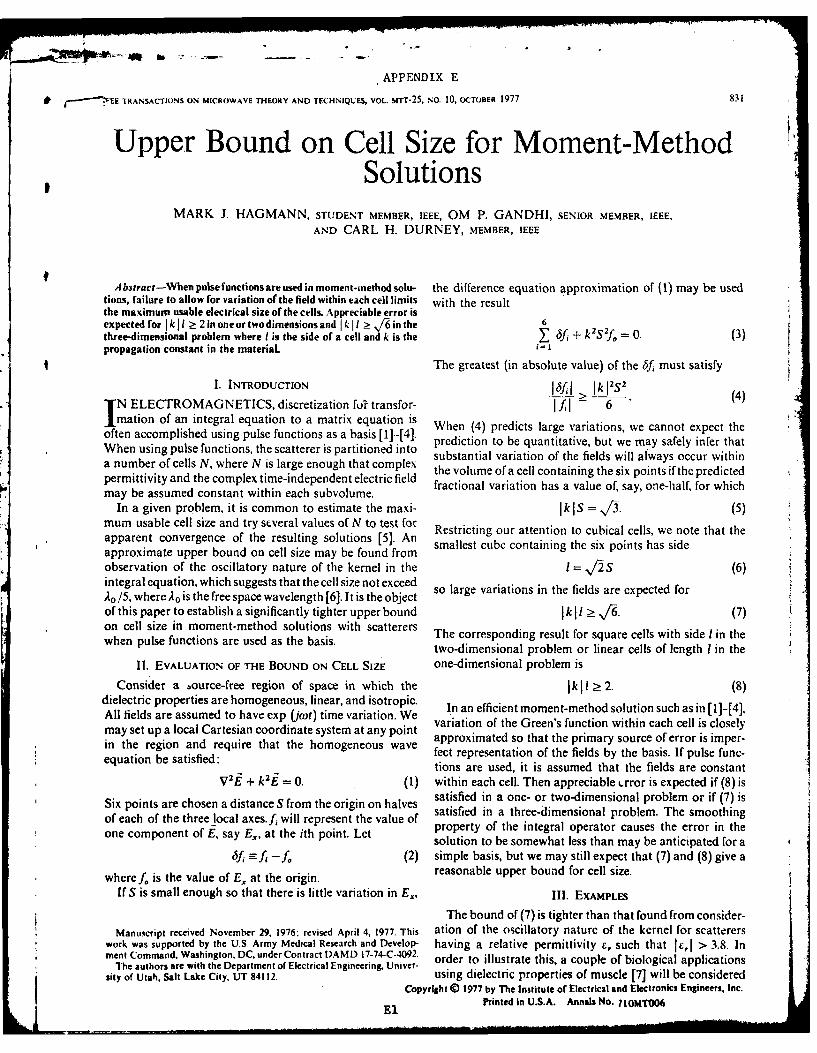
APPENDIX E
* .j EE TRANSACTIONS ON MICROWAVE I7HEORY AND TECHNIQUES, VOL. MTT-25, NO. 10, OCTOBER 1977 831
Upper Bound on Cell Size for Moment-MethodSolutions
MARK J. HAGMANN, STUDENT MEMBER, IEEE, OM P. GANDHI, SENIOR MEMBER, IEEE,
AND CARL H. DURNEY, MEMBER, IEEE
Abstract-Whenpulsefunctions areused inmomentinethodsolu- the difference equation approximation of (1) may be usedtions, failure to allow for variation of the field within each cell limits with the resultthe maximum usable electrical size of the cells. Appreciable error isexpectedfor JkJi I 2inoneortwodimensionsand IkII .,/6inthe 6three-dimensional problem where I is the side of a cell and k is the , 6fi + k2 S 2fo = 0. (3)propagation constant in the material
The greatest (in absolute value) of the bfi must satisfyI. INTRODUCTION 16,I > Ik 2S2
TN ELECTROMAGNETICS, discretization fu? transfor- I L- 6lmation of an integral equation to a matrix equation is When (4) predicts large variations, we cannot expect the
often accomplished using pulse functions as a basis [i 4]. prediction to be quantitative, but we may safely infer thatWhen using pulse functions, the scatterer is partitioned into substantial variation of the fields will always occur withinpermittivity andlthecomplex time-independentgelectricofield the volume ofa cell containing the six points ifthe predictedpermittivity and the complex time-independent electric field fractional variation has a value of, say, one-half, for whichmay be assumed constant within each subvolume.
In a given problem, it is common to estimate the maxi- IkIS =- ,/i (5)mum usable cell size and try several values of N to test for Restricting our attention to cubical cells, we note that theapparent convergence of the resulting solutions [5]. An smallest cube containing the six points has side
L approximate upper bound on cell size may be found fromobservation of the oscillatory nature of the kernel in the I = 12S (6)integral equation, which suggests that the cell size not exceed so large variations in the fields are expected foro /5, where Ao is the free space wavelength [6]. It is the object
of this paper to establish a significantly tighter upper bound 1k Il ,/6. (7)on cell size in moment-method solutions with scatterers The corresponding result for square cells with side I in thewhen pulse functions are used as the basis. two-dimensional problem or linear cells of length I in the
II. EVALUATION OF THE BOUND ON CELL SIZE one-dimensional problem is
Consider a source-free region of space in which the k I I > 2. (8)dielectric properties are homogeneous, linear, and isotropic. In an efficient moment-method solution such as in [1]-[4],All fields are assumed to have exp (jcot) time variation. We variation of the Green's function within each cell is closelymay set up a local Cartesian coordinate system at any point approximated so that the primary source of error is imper-in the region and require that the homogeneous wave fect representation of the fields by the basis. If pulse func-equation be satisfied:
tions are used, it is assumed that the fields are constantV2j + k2f = 0. (1) within each cell. Then appreciable Irror is expected if (8) is
Six points are chosen a distance S from the origin on halves satisfied in a one- or two-dimensional problem or if (7) is
of each of the three local axes.fi will represent the value of satisfied in a three-dimensional problem. The smoothingone component of i, say E, at the ith point. Let property of the integral operator causes the error in the
solution to be somewhat less than may be anticipated for abf1 A - f. (2) simple basis, but we may still expect that (7) and (8) give a
whercf. is the value of E-,, at the origin, reasonable upper bound for cell size.
IfS is small enough so that there is little variation in E, III. EXAMPLES
The bound of (7) is tighter than that found from consider-
Manuscript received November 29, 1976: revised April 4, 1977. This ation of the oscillatory nature of the kernel for scattererswork was supported by the U.S. Army Medical Research and Develop- having a relative permittivity c, such that I c,I > 3.8. In
, ment Command, Washington. DC, under Contract DAMID 17-74-C-4o92. order to illustrate this, a couple of biological applications* The authors are with the Department of Electrical Engineering. Univer-
sity of Utah, Salt Lake City, UT 84112. using dielectric properties of muscle [7] will be consideredCopyright Q 1977 by The Institute of Electrical and Electronics Engineers. Inc.
El Printed In U.S.A. Annals No. ?IOMTO6
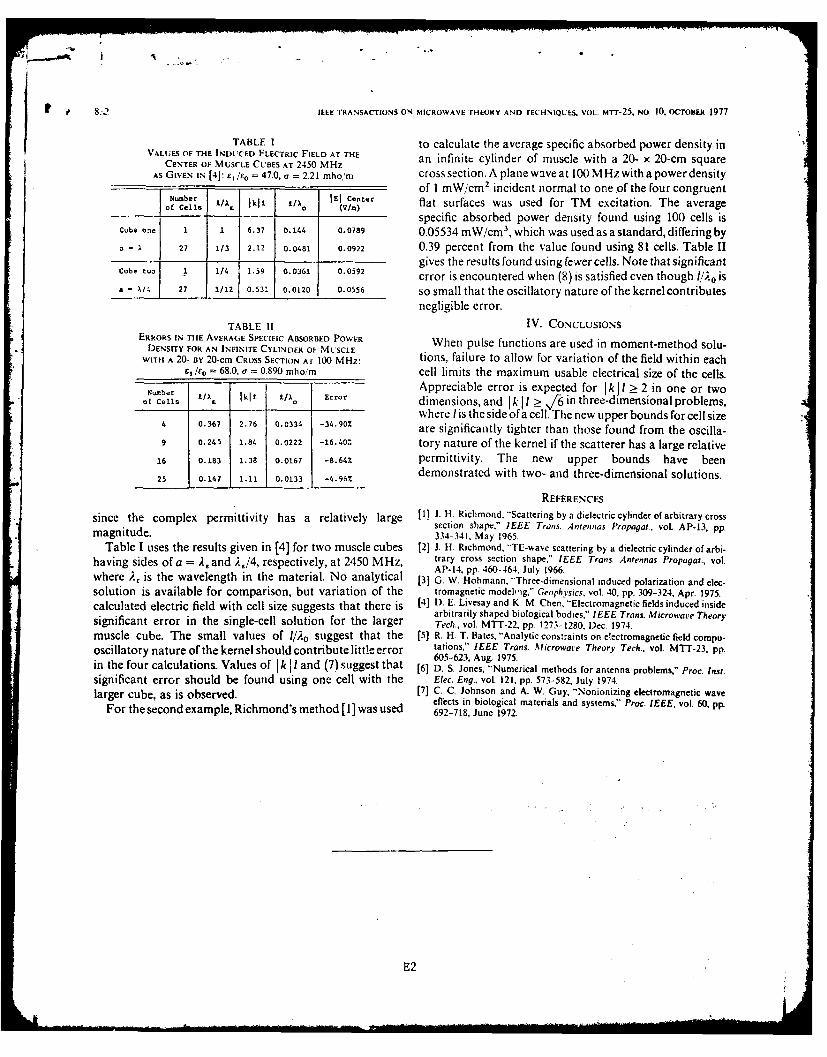
t 8: IEEE TRANSACTIONS ON MICROWAVE THEORY AND rECHNIQUI:S. VOL. MTT-25, NO 10, OCTOBER 1977
TABLE I to calculate the average specific absorbed power density in
VALUES OF THE INDUCED ELECTRIC FIELD AT THE an infinite cylinder of muscle with a 20- x 20-cm squareCENTER OF MUSCLE CUBES AT 2450 MHz
AS GIVEN IN [4]: E/ = 47.0, a = 2.21 mho/m cross section. A plane wave at 100 M Hz with a power densityof 1 mW/cm 2 incident normal to one of the four congruent
iofbo e 1 kli ° Il CenrV/ flat surfaces was used for TM excitation. The average
specific absorbed power density found using 100 cells isCube one 1 1 6.37 0.144 0.0789 0.05534 mW/cm 3 , which was used as a standard, differing bya - A 27 1/3 2.1_ 0.0481 0.0922 0.39 percent from the value found using 81 cells. Table IICube t. 1 1 1.5 0.0361 0.0592 gives the results found using fewer cells. Note that significant
1/4 . error is encountered when (8) is satisfied even though t/;o is
a - 1/4 21 1/12 0.53- 0.0120 0.0556 so small that the oscillatory nature of the kernel contributesnegligible error.
TABLE II IV. CONCLUSIONSERRORS IN THE AVERAGE SPECIFIC ABSORBED POWER When pulse functions are used in moment-method solu-DENSITY FOR AN INFINITE CYLINDER OF MUSCLE
WITH A 20- BY 20-cm CROSS SECTION AT 100 MHz: tions, failure to allow for variation of the field within each, /to = 68.0, a = 0.890 mhoim cell limits the maximum usable electrical size of the cells.
- - ______ - Appreciable error is expected for Ik J I > 2 in one or twooces IX/ I Iklt ,/Xo Error dimensions, and I k I / in three-dimensional problems,
4 where I is the side of a cell. The new upper bounds for cell size4 0.367 2.76 0.0334 -34.90% are significantly tighter than those found from the oscilla-9 0.245 1.84. 0.0222 -16.40- tory nature of the kernel if the scatterer has a large relative
16 0.13 1.38 0.0167 -8.64Z permittivity. The new upper bounds have been25 0.147 1.11 0.0133 -4.96% demonstrated with two- and three-dimensional solutions.
REFERENCESsince the complex permittivity has a relatively large [11 J_ H. Richmond, 'Scattering by a dielectric cylinder of arbitrary cross
section shape," IEEE Trans. Antennas Propagat., vol. AP-13, pp.magnitude. 334-341, May 1965.
Table I uses the results given in [4] for two muscle cubes [2] J. H. Richmond, "TE-wave scattering by a dielectric cylinder of arbi-having sides of a = . and ;.,/4 , respectively, at 2450 MHz, trary cross section shape." IEEE Trans. Antennas Propagat., vol.AP-14, pp. 460-464, July 1966.where 2, is the wavelength in the material. No analytical [3] G. W. Hohmann, 'Three-dimensional induced polarization and elec-solution is available for comparison, but variation of the tromagnetic modeliig," Geophysics, vol. 40, pp. 309-324, Apr. 1975.calculated electric field with cell size suggests that there is (4] D. E. Livesay and K M Chen, "Electromagnetic fields induced inside
arbitrarily shaped biological bodies," IEEE Trans. Microwave Theorysignificant error in the single-cell solution for the larger Tech., vol. MTT-22. pp 1273-1280, Dec. 1974.muscle cube. The small values of 1/A0 suggest that the [5] R. H. T. Bates, "Analytic constraints on electromagnetic field compu-oscillatory nature of the kernel should contribute little error tations," IEEE Trans. Microware Theory Tech., vol. MTT-23, pp.605-623, Aug. 1975.in the four calculations. Values of I k 1l and (7) suggest that [6] D. S. Jones, "Numerical methods for antenna problems," Proc. Inst.significant error should be found using one cell with the Elec. Eng., vol. 121, pp. 573-582, July 1974.larger cube, as is observed. [7] C. C. Johnson and A. W. Guy. "Nonionizing electromagnetic waveeffects in biological materials and systems," Proc. IEEE, vol. 60, pp.
For thesecond example, Richmond's method [11 was used 692-718, June 1972.
E2
APPENDIX F
PROCEDUU ES FOR IMPRC(V IN( CONVEK.UUENCE OF I4OMENT-IME'ffODSO.JTICN)ZS 1NIE.cl'~)AGElC
M. J. Hagmati, 0. P. Gandhi, and C. HI. DurneyDepar',xient of ElcCtrical Engineering
University of UtahSaIl Lake City, Utah 84112
ABSTRACT
Two new methods, termed "Plane Wave Correction" and "Cylindri-
cal.-Cell Correction", are presented for improving convergence of
nio-ent-method solutions in elactrornagaetics. Convergence is imiprovedl
becase te cac-lt-ions include approximation for the variation of
the field w-ith-in each cell.
*This work was supported by U. S. Armay Medical Research and Development
Command, Washington, D. C., under ContracL MHOD 1.7-74-C-4092.
Accepted for publication in IEEETransactions on Antennas and Propagation
-Fl-
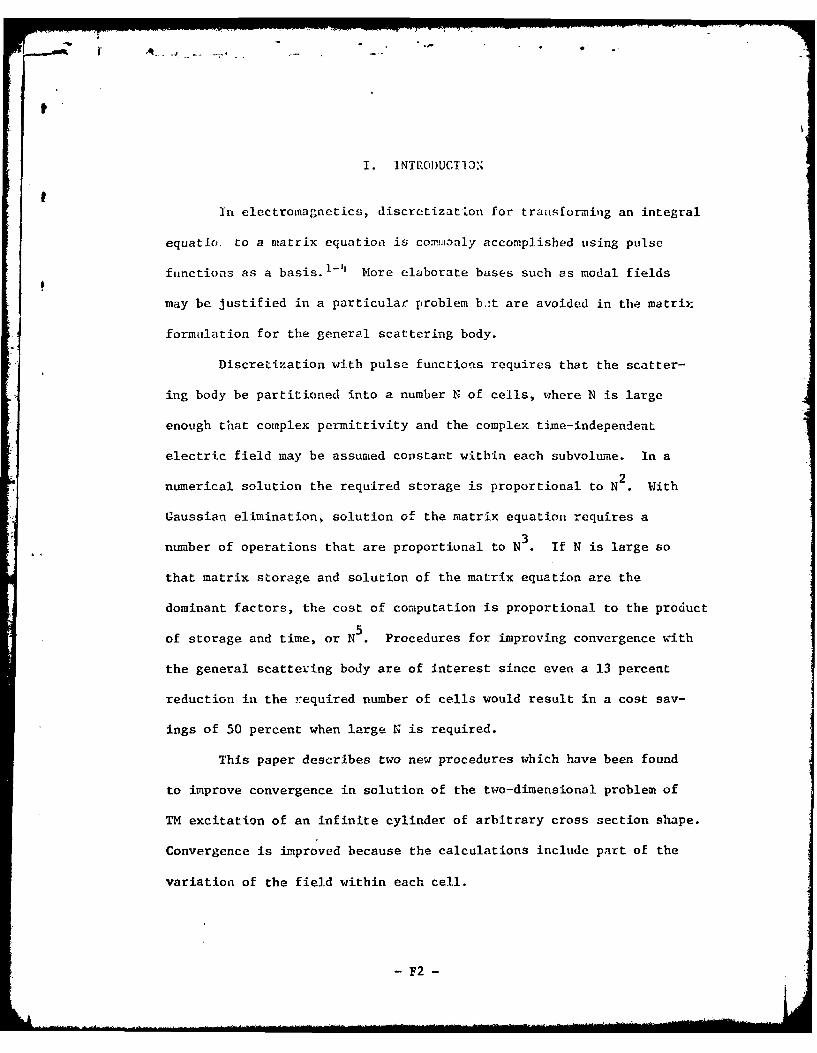
Ir
I. INTRODUCTION
IL electromagnetics, discretizatLon for transforming an integral
equatio. to a matrix equation is comlonly accomplished using pulse
functions as a basis. -1 More elaborate bases such as modal fields
may be justified in a particular problem bit are avoided in the matrix
form lation for the general scattering body.
Discretization with pulse functions requires that the scatter-
ing body be partitioned into a number N of cells, where N is large
enough that complex permittivity and the complex time-independent
electric field may be assumed constant within each subvoltme. In a
2numerical solution the required storage is proportional to N . With
Gaussian elimination, solution of the matrix equation requires a
3number of operations that are proportiunal to N . If N is large so
that matrix storage and solution of the matrix equation are the
dominant factors, the cost of computation is proportional to the product
of storage and time, or N 5 . Procedures for improving convergence with
the general scattering body are of interest since even a 13 percent
reduction in the required number of cells would result in a cost sav-
ings of 50 percent when large N is required.
This paper describes two new procedures which have been found
to improve convergence in solution of the two-dimensional problem of
TM excitation of an infinite cylinder of arbitrary cross section shape.
Convergence is improved because the calculations include part of the
variation of the field within each cell.
- F2 -
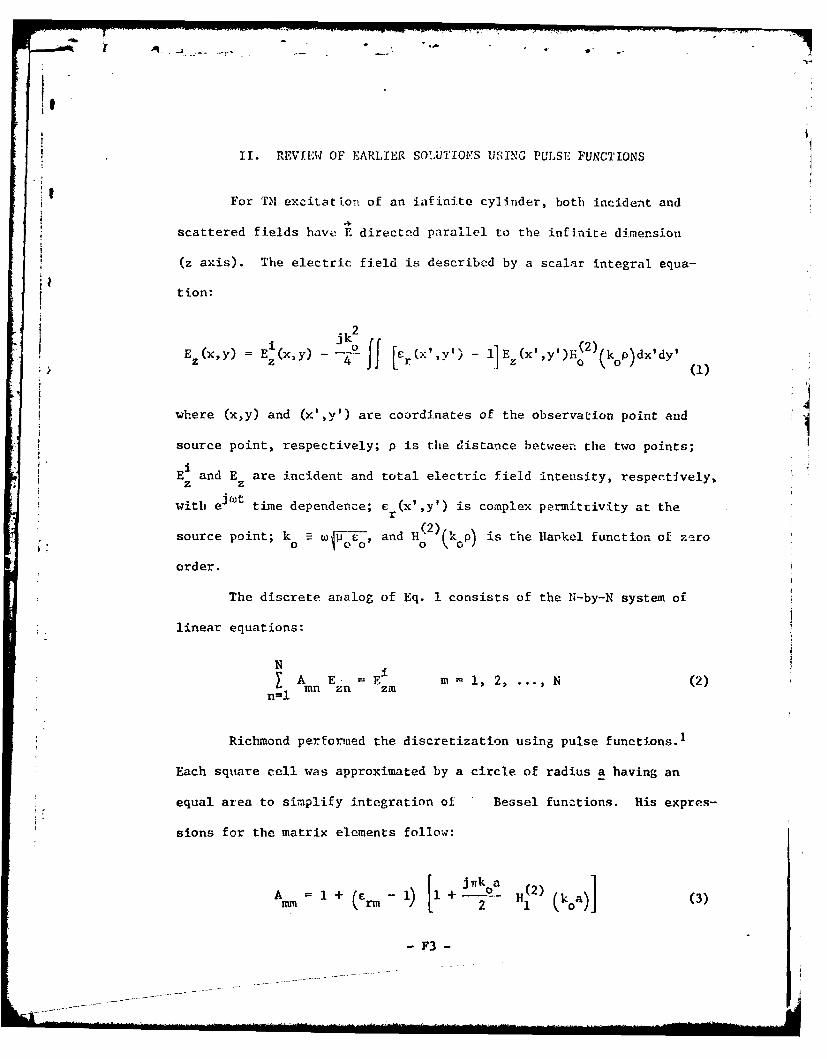
II. REVIEW OF EARLIER SOIUTIOtS USING PULSE FUNCTIONS
For TI excitat ion of an infinite cylinder, both incident and
scattered fields have E directed parallel to the infinite dimension
(z axis). The electric field is described by a scalar integral equa-
tion:
jk2
E. (x~y) E pi ( -0 W4[('Vlj -1 lE (xi, Y '~Hi2) k p~dx'dy'z 4 J r jz: ,y (1)
where (x,y) and (x',y') are coordinates of the observation point and
source point, respectively; p is the distance betwee, the two points;
Ei and E are incident and total electric field intensity, respectively,z z
with ej(ot time dependence; c (x',y') is complex permittivity at ther
source point; k = and H(2) kop ) is the ilarkel function of zaro
order.
The discrete analog of Eq. 1 consists of the N-by-N system of
linear equations:
N iSAE = E m 1, 2, ... ,N (2)
n=l zn z M
Richmond performed the discretization using pulse functions.1
Each square cell was approximated by a circle of radius a having an
equal. area to simplify integration of Bessel functions. His expres-
sions for the matrix elements follow:
m m E r m I) + 2 )c lA + ( H (koa (3)
- F3 -
M,_
A j _ 1) C 1 a) Io 1 (koom) i P n (4)AMrl 2 ra 0L o
In this method, the electric field intensity is considered to
be constant over the area of a cell, an approximation that results in
significant error if the cells are not very small. Larger cells can
be used if the variation of the electric field is included in the
calculations. A method of approximating the variation of the electric
field called "plane wave correction" is described in the next section.-4
F 4-
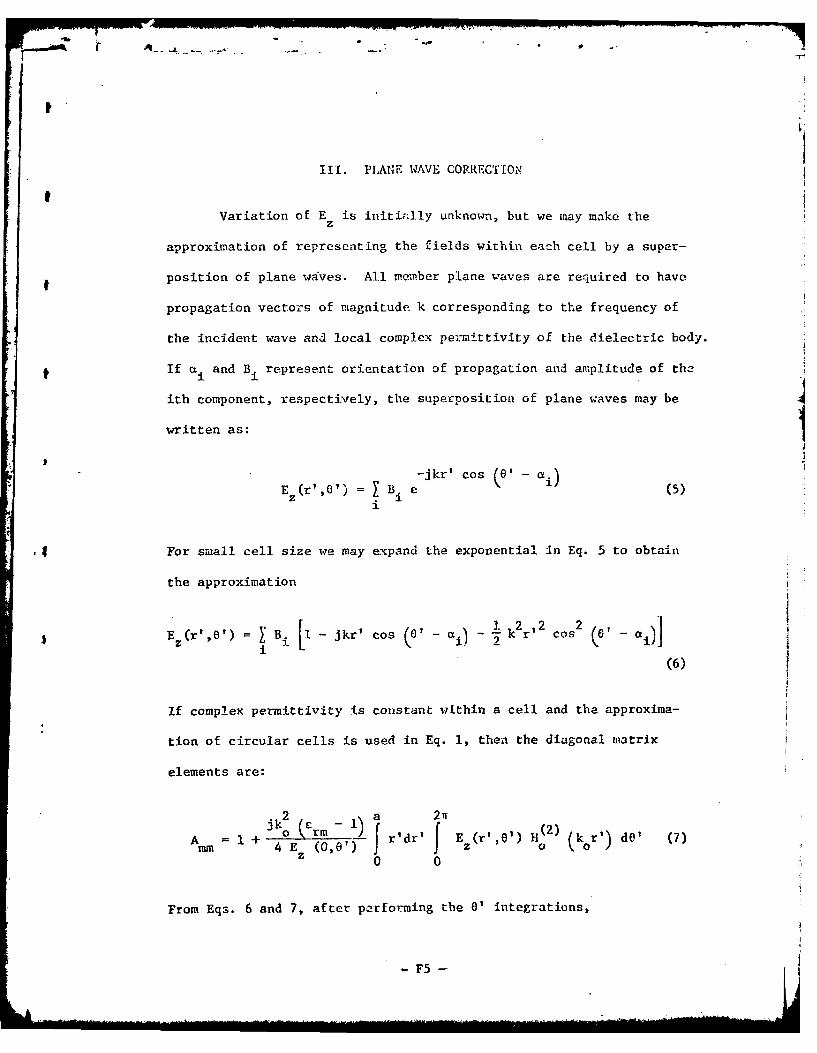
III. PLANE WAVE CORRECTION
Variation of E is initially unknown, but we may make the
approximation of representing the fields within each cell by a super-
position of plane waves. All member plane waves are required to have
propagation vectors of magnitude k corresponding to the frequency of
the incident wave and local complex peinnittivity of the dielectric body.
If ct. and B. represent orientation of propagation and amplitude of the
ith component, respectively, the superposition of plane waves may be
written as:
-jkr' cos ( a' - .. )E (r',O') B .e (5)Z Ii
, For small cell size we may expand the exponential In Eq. 5 to obtain
the approximation
E (r',0') = B[ - jkr' cos (0'- ci) k 2 r'2 cos 2 a0 ,-
(6)
If complex permittivity is constant within a cell and the approxima-
tion of circular cells is used in Eq. 1, then the diagonal matrix
elements are:
jk2 al'2n (2)A =1 + o rm f r'dr' f E((r',2') rr ' (7)
mm 4 E (z0 0
From Eqs. 6 and 7, after performing the 0' integrations,
- F5 -
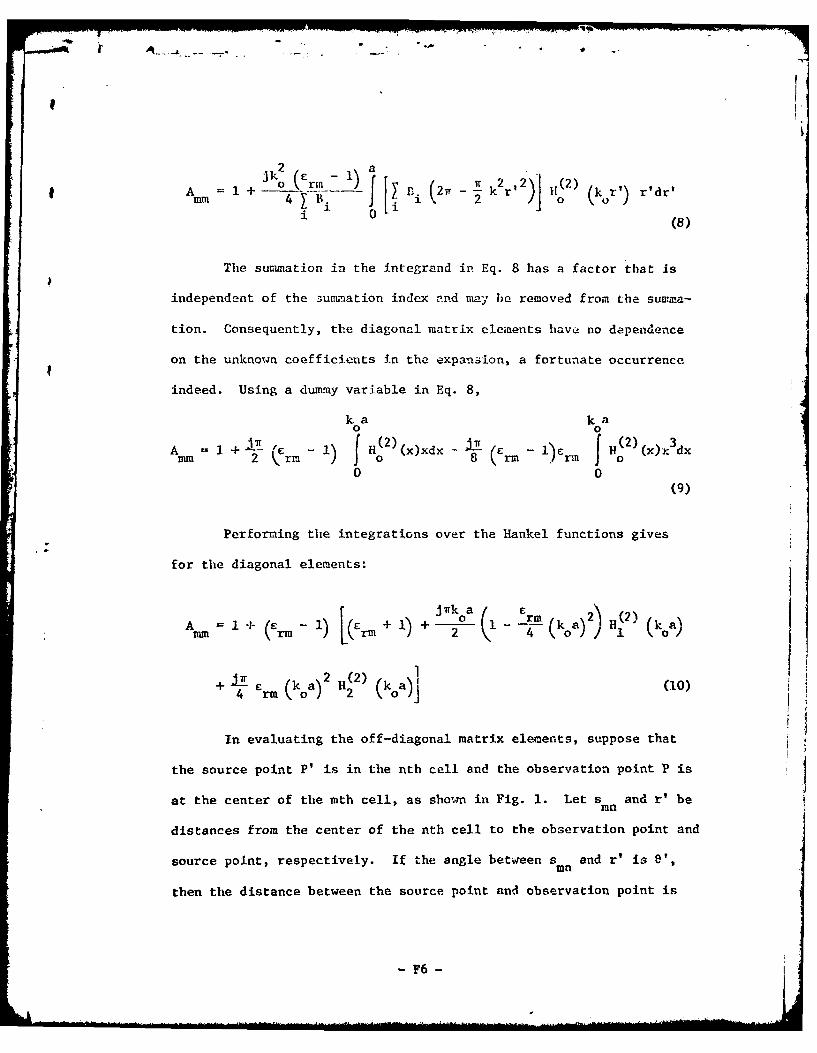
A I1+ jk_c! B, (2n - k r)J1c2 (kr') r'dr'mm 4 ~B 2 0i
i " (8)
The summation in the integrand in Eq. 8 has a factor that is
independent of the 3unmation index and may be removed from the summa-
tion. Consequently, the diagonal matrix clements have no dependence
on the unknown coefficients in the expanaon, a fortunate occurrence
indeed. Using a dummy variable in Eq. 8,
ka kao 0
A Il+~ 1i I e H ((x)xdx - J" c - 1) cr H ( x 3 dxnun 2 V rm ,' j rm rf 0
0 0(9)
Performing the integrations over the Hankel functions gives
for the diagonal elements:
A I1+ (rm 11 ) )l k - -- (k a)2) H (2) (k a)
Mrm 2 4201)
+) 2 (2) "
4 (koa) 2) ( 0 ) (10)
In evaluating the off-diagonal matrix elements, suppose that
the source point P' is in the nth cell and the observation point P is
at the center of the mth cell, as shown in Fig. 1. Let s and r' be
distances from the center of the nth cell to the observation point and
source point, respectively. If the angle between s and r' is ',
then the distance between the source point and observation point is
- F6 -
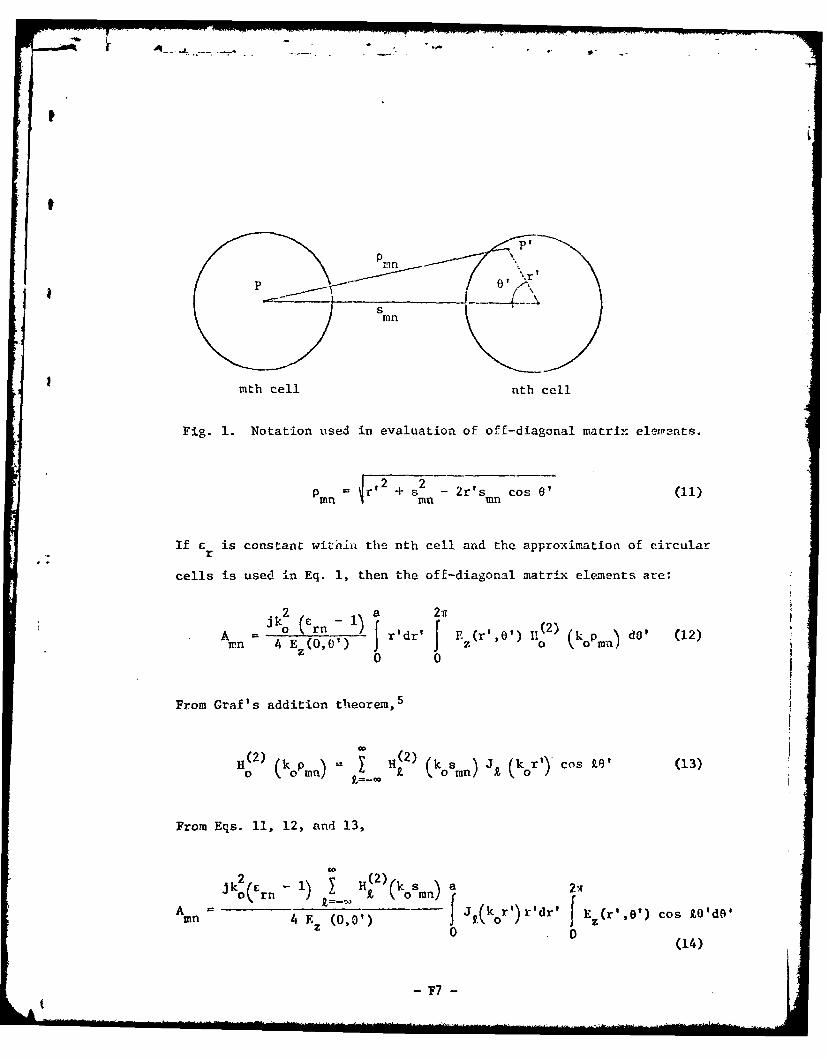
- o ° . -
P
mn
mn
mth cell nth cell
Fig. 1. Notation used in evaluation of off-diagonal matrix eleipents.
P rnf2 + Sn 2r'n cos O' (11)
If c r is constant witniln the nth cell and the approximation of circularsr
cells is used in Eq. 1, then the off-diagonal matrix elements are:
2 a2rjk Cr ) "2An 4 E (,0') r'dr' (r',)o d' (12)0 0
From Graf's addition theorem,5
()(kP~ p ( J (krl' Cos to' (13)
From Eqs. 11, 12, and 13,
0 0jk 0 Crn - 1) HZ R (k s) a 21T
A mn 4 F (0,01) f J,(kr')r'dr' f E z r',O') csk'D(14)
- F7 -t
From Eqs. 6 and 14,
co
jk 2 (C -iY H (2) (k s a * k' 'r0, rn 9=00MA mn4 B B ,(k0r) '
i 0
. [i - jkr' cos (0' - a) k 2r cos2 ' cos
i L0 (15)
Performing the 0' integrations in Eq. 15,
jk2 r 1)II(2) (koS a
mn ~ ~ ... 4 nB.ii (kmn 4 B. f B, 2r] J o kr')
i 0
-k j 2 (C - 1) R (2) (k S) a
2k2 rn- ) k- Jo Bmkr' cos ii J1 (kor')r'dr'
4 B.1 0
(16)
The summations in all three integrands of Eq. 16 contain factors
independent of the summation index that may be removed from the simmia-
tions. Also changing to a dummy variable,
ka0
A 211it(2) ksJ()xdxj- 2Cern 1) o (omn) 0 ~c
0
- F8 -
I
l °. .. .
ka0
( ~~(2-k 'ks ON) [ 3 ( X8 rn Er, 10 0 lflf) f 0
0
B cosa o
1r1 (2 2 (7+ ( C -1) rn 0 1mn) [ f J (x)x dx (17)
I0
Define
B. cort a(8Y B
Performing the integrations in Eq. 17 and using Eq. 18,
-n 2)rn 1 ( osmn) koa J
4 (ko \ a 0(0njJ J2+4 rn - 1)) H 2 (k s )(k a) 2 J 2 (ka)
8 (C 1 1) crn 11(2) )(koa)
+ a 1) p- Y H (2) (ks (ka 2 (ka) (19)
Since only the last member in Eq. 19 is dependent on the unknown
coefficients in the plane wave expansion, we wish to delete the tern
and use the first three members for the off-diagonal matrix elcmenta:
- F9 -
jrk a (2) .2A k I - rnak1 + rnmI 2 ( 1, 0 o n) ' J~o2j)lko)+ koJ"(l a)
(20)
The use of Eq. 20 is jutstified only if the last me.iber of Eq. J.9 is
small. Fractional error in A due to neglecting the last member ofmn
Eq. 19 is:
-- ~jy F ~ H~ (2)~ a 2 (ar, I -( <Oran.) --oo 2, (,a)mn H~2 (k r)ks ( - (oa)2) J(k ) + TrR koa J (k 4
(21)
Since the magnitude of the ratio of the Hankel functions is
greatest for small argument, we set s = r a for adjacent cells.
Expanding the Bessel functions for small arguments gives:
lJn i 0 a (22)Ymn rff n (T7 2k
where r = ey - 1.78107, with y = Euler's constant.
In the plane wave correction method, EqEs. 10 and 20 are used
for the matrix elements and the solution corresponds to the value of
Ez at each cell center. Numerical considerations suggest that deletion
of the last member in Eq. 19 is the prir ipal source of error, so that
it is possible to use Eq. 22 with the condition number of the matrix
to give an error bound for the solution. Since no error bound is
available in the method using pulse functions that is described in
-F1l0
Section 11, the plane wave correction has thc advan.Lage oil an expres-
I sion for the error bound, in addition to improving convergence. A
second method of approximating the variaticin of the electric field
called "cylindrical-cell correction" is described in the next section.
-Fil1
IV. CYLINDRICAL-CULL CORRECTION
In the methods described in Sections 11 and III, the scattering
i body is divided into cells that are approximated by circular cylindersI
in calculation of the matrix elements. The method of cylindrical-cell
correction, which is presented for the first time in this paper,
emphasizes the properties of such a model of the original body.
Let the cross section of the scatterer be divided into square
cells, each having side s. For the model, replace each cell with a
circular cylinder having radius a, and assume properties of free space
between the cylinders. For the chosen geo-metry6 the effective relative
complex permittivity E reff of the model and the complex permittivity
C' of each cylinder are related byr
2
if we require that the effective relative complex periaittivity of the
model equal that of the original scatterer, then
2
C =+ --- C ) (24)wa
If the electrical size of the cylinders is sufficiently small,
the inhomogeneities of the model will have no significant effect, so
that scattering from the model satisfying Eq. 24 will duplicate that
of the physical scatterer. The model is useful since we may approxi-
mate the variation of the electric field within each cylinder. A
- F12 -
circular cylinder with TiT exc[tatioii i]! .have internal fields given
by
E = 0 b J (kr) cos 1nO + c ) (25)
where the b and c are determined by the excitation. If the cylindern n
is sufficiently small, the zero order term will dominae, so we may
use the approximation
E = b J (kr) (26)
From Eqs. 7 and 26 the diagonal matrix elemencs are given by:
ik 2 aC r 2 Tr ( ) _ _]
A =1 + J o (k'r') it(2) (kor" r'dr' dA' (27)mm 4 0 0f0 0
where k' - Er T .
Performing the 0' integration and using a relationship from
Ref. 7 for the r' integration, we obtain the fo lowing expression used
to calculate the diagonal matrix elements:
A 2 ka J1 (k'a) H (2)( ka - k a J (k'a) it2) (koa)J (28)
From Eqs. 12 and 25 the off-diagonal tratrix elements are given by:
jk2 ' -) 2
A 4-0 r'dr' J 0 (k'r') W 1(2) (kp d8' (29)M 4f f 00 o mn)d' ()
0 0
- F13 -
, - i, . _ . - -. ... ".
Using Graf's addition theorem5 and notation of Fig. 1:
2 a 2Tr
A k ( 2)(s)fJk~jcsl'QA k , ( J r"J (k'r')r'dr' cos 0de'ti 4'-(- rn 1) Y orn) f o fX=M0 0
(30)
Performing the 0' integration, which collapses the summation, we get
a= J-2 2oiro-) (2) a
A I-E k 1 ( (ks\ Jk'r') Jo(kor'\ r'dr' (31)tmn 2 (oE~rn Jo \on)j00
Using a relationship from Ref. 6 for the r' integration, we obtain the
follo;.,ing expression used to calculate the off-diagonal matrix elements:
A = -H (2 ) (kS) ' a.Jk'a) J. koa) - koa Jo(k'a) Jlkoa)] (32)
Mn 2 o 0~'a
m fn
In the cylindrical-cell correction method, Eqs. 28 and 32 are
used for the matrix elements and the solution corresponds to the value
of E at each cell center. A solution is defined for any ratio of a/s,z
but only two cases have been studied:
Tangent cyli.idrical cells: a 1 A! (
Overlapping cylindrical cells: a = c --r r
For very large or very small values of a/s, the structure of the model
- F14 -
diff ers signif icantly f romn that of the kecattere-c so that thev sulut Lon,
which actually corresponds to scattering fromn the cu.mosite of circular
cylinders, will differ from that for che cicaired scatterer. Advanta.-es
of the menthodl will be seen in the example in Section VI.
-FIS-
AA
V. CALCULATION OF POWER ABSORPTION
With both plane wave correction and cylindrical-cell correction,
the solution corresponds to the value of Ez at each cell center. The
plane wave correction leaves the variation of E within each cell
undefined, but with clindrical-cell correction Eq. 26 describes the
approx:imate variation of E within each circular cylinder of the model.
If the value of power absorption is desired, then 1/2 aE E* mayzz
be computed within each cell using the values of Ez found using pulse
functions or plane wave corrections. In this section the approximate
variation of Ez within each cell is used for an improved expression
for power absorption if Lylindrical-cll correction is used.
Total power absorption in one circular cylinder is given by:
a 27
P a j .'EzE* rdrdO (33)
00
From Eq. 24 the conductivity of the cylinder is related to that of the
scatterer by
2aY = S-- (34)
Yra
Substituting Eqs. 26 and 34 in Eq. 33 gives:
2 a
P -- bob* Jo (k'r) J* (k'r) rdr (35)a2 0oa 0
- F16 -
Using a relationship from Ref. 6 for the r' integration:
s2ob b* [ka J (k'*a) J(k]'a) - k'a J (L'a) J ((,'*a)P 0 0. (36)
a ~ ) (k'*) t
Then the average absorbed power density within the cell is given by:
ab b* [kia J (k'*a) J (ka) -k'*a J (k'a) J~ -(V
[(k'a)2 - (k'*a)2 J
Simplifying Eq. 37 we obtain the result
In mk'a J *(k'a) J(a)]1
Pd b ob * 0._ ._ _ _ (38 ) . ..2 0 [ Re(k'a) Im(ka) J
whare b is the calculated value of E found using cylindrical-cel!0 Z
correction.
- F17 -
VI. NUMERICAL FXAPLE: THlE INFINITE CYLINDER MODEL OF 11A4N
The infinite cylinder has been suggested for use as a u-odel for
body extremities or the chest cavity in evaluation of biological
hazards from electromagnetic radiation.8 Approximation of an extremity
or the whole body by an infinite cylinder may be made using the ratio
of volume to length for the cross-sectional area.
The model considered in this example is an infinitely long
cylinder with square cross section of 20 by 20 cm, having TM excita-
tion by a plane wave incident perpendicular to one of the four
congruent faces. The body is homogenecus with values of permittivity
and conductivity that are typical for muscle, skin, and other tissues
having high water content.9
The methods described in this paper have been used to calculate
average specific absorbed power for the model.. Suitability of the
model can only be justified at high frequencies where end effectu way
be neglected, but calculations have been made over a wide range of
frequencies to allow comparison of convergence with the different
methods.
Figure 2 illustrates the frequency depetLdence of average
specific absorption rate (SAR) for the model. The values obtained
using the accepted method of pulse functions with ]00 cells are the
standard for comparison. Values obtained using pulse functions !ith
81 cells were found to differ from those with 100 cells by less than
I percent for frequencies up to 200 MHz. Values found using 9 cells
with pulse functions, plane wave correction, and cylindrical-cell
- P18 -
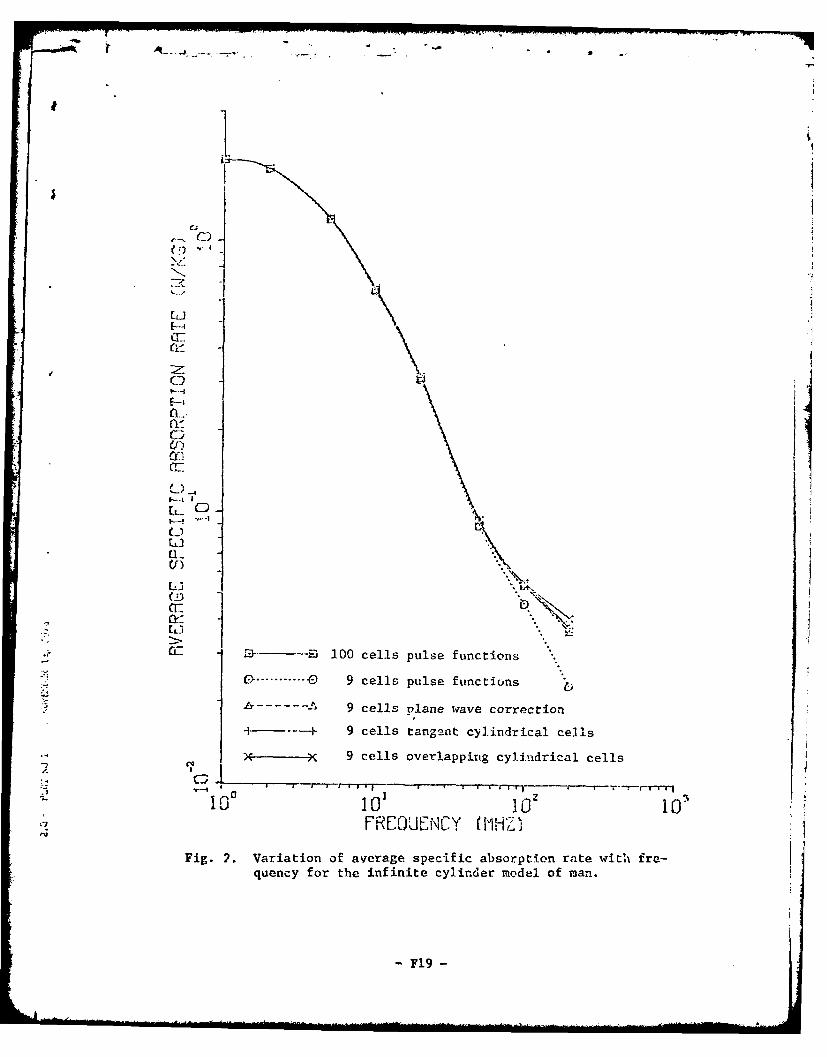
A-J
U1'--S
F--i(4 i
(T:
ci*
(/)
L. °
ELI
• , -a -,100 cells pulse functions............ 9 cells pulse functions "
- ------- 9 cells plane wave correction
4--- -- 9 cells tangent cylindrical cells
X - x 9 cells overlapping cylindrical cells
0I0 10 10 iOFREOUE NCY ([1HZ
Fig. 2. Variation of average specific absorption rate with fre-quency for the infinite cylinder model of man.
- F19 -
correction with tangent and overLlapping cells are also given in the
figure. For 9 cells all four calculations ara in good agreement with
the standard at low frequencies, where the cells have small electrical
size. Calculations with the new methods appear to have comparable
accuracy and appear to offer a significant improvement in convergence
when compared to pulse functions.
From Eq. 22, 16 1 < 3.3, 7.0, or 18.1 percent with 9 cells atmn
50, 100, or 200 14Hz, respectively. Then significant error in the
calculations with plane wave corrections is not predicted until the
frequency is about 200 MHz, at which the curve deviates from the
standard in Fig. 2. It appears that Eq. 22 is usable for determining
maximum usable cell size* for calculations at a given frequency.
- F20 -
...... -- :-- * --- ..
VII. CONCLUSIONS
Two methods have been found which improve convergence in solu-
tion of the two-dimeansional problem of TM excitation of an infinite
cylinder of arbitrary cross section shape. The extension to the
three-dimensional problem has not yet been completed.
Convergence is improved because the calcI!ations include ap-
proximation for the variation of the field within each cell. The new
methods give expressions for the matrix elements that are different
from those found using pulse functions, but values of the matrix
elements are in good agreement for electrically sinall cells.
The matrix elements found with the new methodq do not require
a substantial increase in computational effort. For a homogeneous
scatterer, if equal size cells are used, the new methods require one
time computation of several additional Bessel functions, but time for
calculation of the matrix elements i- dominated by recalculation of
the zero-order Hankel function which is nee ' with or without the
corrections made in the new methods. If the scatterer is not
homogeneous or if different cell sizes are used, then time for calcula-
tion of each matrix element is approximately doubled in the new methods.
Time spent in calculation of the matrix elements is proportional to
2N , whereas time spent in solving the matrix equation is proportionalto N3 , so for large numbers of cells there is still no significant
increase in computation time with the new methods.
- F21 -
REFERENCES
1. J. II. Richmond, "Scattering by a Dielectric Cylinder of ArbitraryCross Section Shape", IEEE Transactions on Antennas and Propaga-tion, Vol. AP-13, May 1965, pp. 334-341.
2. J. H. Richmond, "TE-Wave Scattering by a Dielectric Cylinder ofArbitrary Cross Section Shape", IEEE Transactions on Antennas andPropagation, Vol. AP-14, July 1966, pp. 460-464.
3. C. W. lohmann, "Three-Dimensional Induced Polarization and Electro-magnetic Modeling", Geophysics, Vol. 40, April 1975, pp. 309-324.
4. D. E. Livesay and K. N. Chen, "Electromagnetic Fields Induced In-side Arbitrarily Shaped Biological Bodies", IEEE Transactions onMicrowave Theory and Techniques, Vol. MTT-22, December 1974,pp. 1273-1280.
5. M. Abramowitz and I. A. Stegun, Eds., Handbook of 14athematic:-atFunctions, National BLlreau of Standards, 1964.
6. L. K. H. Van Beek, "Dielectric Behaviour of Heterogeneous Systems",Progress in Dielectrics, Vol. 7, 1967, pp. 69-114.
7. P. M. Morse and H. Feshbach, Methods of Theoretical Physics,McGraw-Hill, New York, 1953.
8. T. K. Wu and L. L. Tsai, "Numerical Analysis of ElectromagneticFields in Biological Tissues", Proceedings of the IEEE, Vol. 62,August 1974, pp. 1167-1168.
9. C. C. Johnson and A. W. Guy, "Nonionizing Electromagnetic WaveEffects in Biological Materials and Systems", Proceedings of theIEEE, Vol. 60, June 1972, pp. 692--718.
-22-
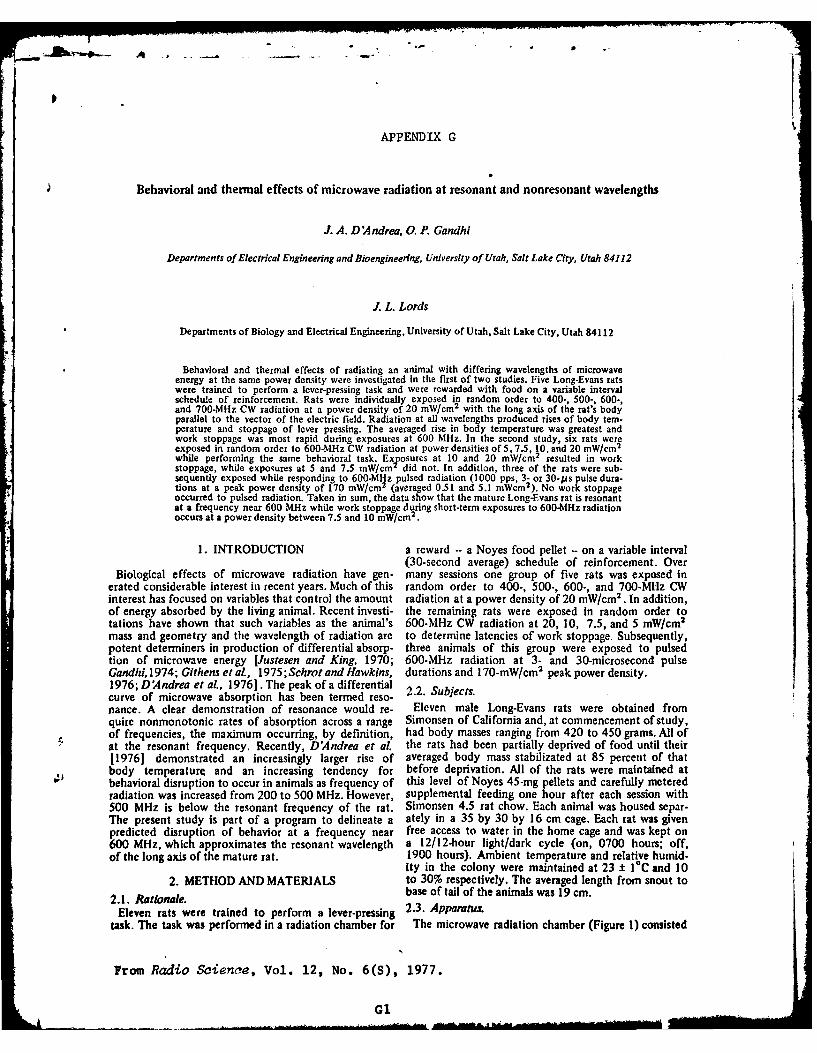
APPENDIX G
Behavioral and thermal effects of microwave radiation at resonant and nonresonant wavelengths
J. A. D Andrea, 0. P. Gandhi
Departments of Electrical Engineering and Bioengineering, University of Utah, Salt Lake City, Utah 84112
J. L. Lords
Departments of Biology and Electrical Engineering, University of Utah, Salt Lake City, Utah 84112
Behavioral and thermal effects of radiating an animal with differing wavelengths of microwaveenergy at the same power density were investigated in the first of two studies. Five Long-Evans ratswere trained to perform a lever-pressing task and were rewarded with food on a variable intervalschedule of reinforcement. Rats were individually exposed in random order to 400-, 500-, 600-,and 700-MHz CW radiation at a power density of 20 mW/cm2 with the long axis of the rat's bodyparallel to the vector of the electric field. Radiation at all wavelengths produced rises of body tem-perature and stoppage of lever pressing. The averaged rise in body temperature was greatest andwork stoppage was most rapid during exposures at 600 MHz. In the second study, six rats wereexposed in random order to 600-MHz CW radiation at power densities of 5, 7.5, 10, and 20 mW/cm
2
while performing the same behavioral task. Exposures at 10 and 20 mNV/cm 2 resulted in workstoppage, while exposures at 5 and 7.5 mW/cm5 did not. In addition, three of the rats were sub-sequently exposed while responding to 600-MHz pulsed radiation (1000 pps, 3- or 30-ps pulse dura-tions at a peak power density of 170 mW/cm2 (averaged 0.51 and 5.1 nWcm2 ). No work stoppageoccurred to pulsed radiation. Taken in sum, the data show that the mature Long-Evans rat is resonantat a frequency near 600 MHz while work stoppage during short-term exposures to 600-MHz radiationoccurs at a power density between 7.5 and 10 mW/crn2 .
1. INTRODUCTION a reward -- a Noyes food pellet - on a variable interval(30-second average) schedule of reinforcement. Over
Biological effects of microwave radiation have gen- many sessions one group of five rats was exposed incrated considerable interest in recent years. Much of this random order to 400-, 500-, 600-, and 700-MHz CWinterest has focused on variables that control the amount radiation at a power density of 20 mW/cm2 . In addition,of energy absorbed by the living animal. Recent investi- the remaining rats were exposed in random order totations have shown that such variables as the animal's 600-MHz CW radiation at 20, 10, 7.5, and 5 mW/cm 2
mass and geometry and the wavelength of radiation are to determine latencies of work stoppage. Subsequently,potent determiners in production of differential absorp- three animals of this group were exposed to pulsedtion of microwave energy [Justesen and King, 1970; 600-MHz radiation at 3- and 30-microsecond pulseGandhi,1974; Githens etaL, 1975;Schrot and Hawkins, durations and 170-mW/cm 2 peak power density.1976; DAndrea et aL, 1976]. The peak of a differentialcurve of microwave absorption has been termed reso- 2nance. A clear demonstration of resonance would re- Eleven male Long-Evans rats were obtained fromquire nonmonotonic rates of absorption across a range Simonsen of California and, at commencement of study,of frequencies, the maximum occurring, by definition, had body masses ranging from 420 to 450 grams. All ofat the resonant frequency. Recently, DAndrea et al. the rats had been partially deprived of food until their[1976] demonstrated an increasingly larger rise of averaged body mass stabilizated at 85 percent of thatbody temperature and an increasing tendency for before deprivation. All of the rats were maintained atbehavioral disruption to occur in animals as frequency of this level of Noyes 45-mg pellets and carefully meteredradiation was increased from 200 to 500 MHz. However, supplemental feeding one hour after each session with500 MHz is below the resonant frequency of the rat. Simonsen 4.5 rat chow. Each animal was housed separ-The present study is part of a program to delineate a ately in a 35 by 30 by 16 cm cage. Each rat was givenpredicted disruption of behavior at a frequency near free access to water in the home cage and was kept on600 MHz, which approximates the resonant wavelength a 12/12-hour light/dark cycle (on, 0700 hours; off,of the long axis of the mature rat. 1900 hours). Ambient temperature and relative humid-
ity in the colony were maintained at 23 ± I°C and 102. METHOD AND MATERIALS to 30% respectively. The averaged length from snout to
2.1. Rationale. base of tail of the animals was 19 cm.
Eleven rats were trained to perform a lever-pressing 2.3. Apparatustask. The task was performed in a radiation chamber for The microwave radiation chamber (Figure 1) consisted
From Radio Science, Vol. 12, No. 6(S), 1977.
GI
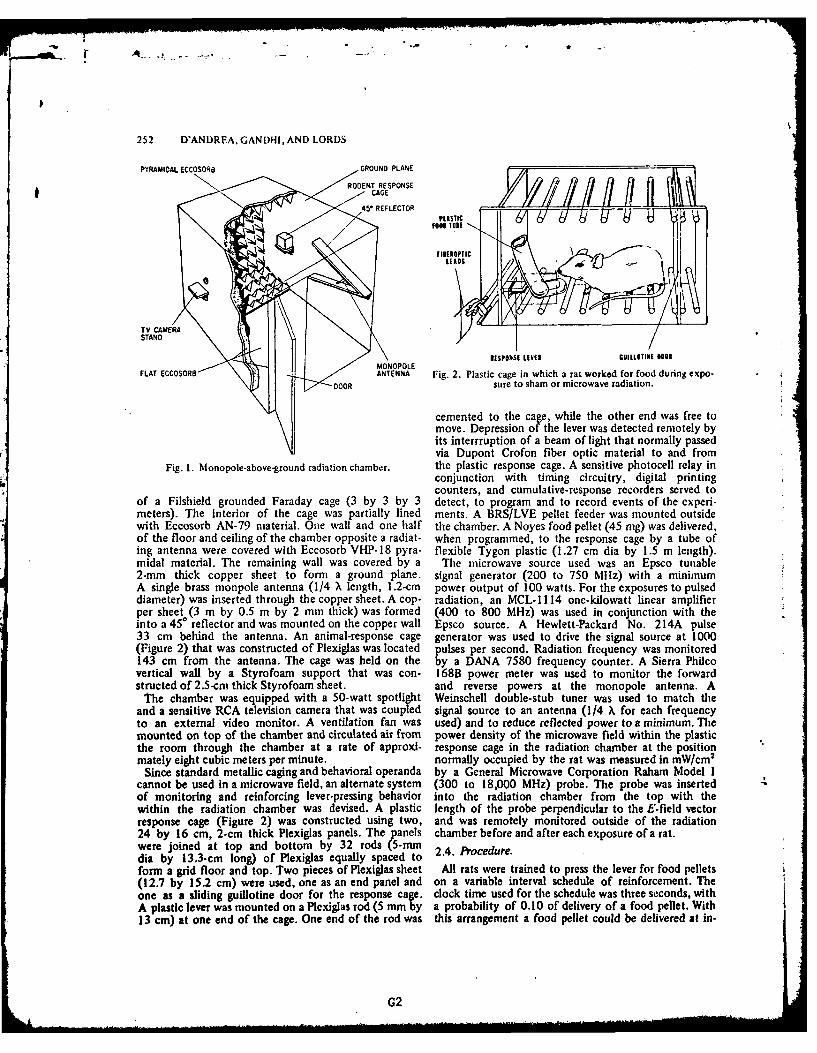
252 D'ANDRFA, GANDHI, AND LORDS
PYRAMIDAL ECCOSORa GROUND PLANE
RODENT RESPONSE
W5 REFLECTOR
STAND
ESPONSE LIVER GUILLOTINE ootMONOPOLE
FLAT ,CCOSORS ANTENNA Fig. 2. Plastic cage in which a rat worked for food during expo-sure to sham or microwave radiation.
cemented to the cage, while the other end was free tomove. Depression of the lever was detected remotely byits interrruption of a beam of light that normally passedvia Dupont Crofon fiber optic material to and from
Fig. 1. Monopole-above-ground radiation chamber. the plastic response cage. A sensitive photocell relay inconjunction with timing circuitry, digital printingcounters, and cumulative-response recorders served to
of a Filshield grounded Faraday cage (3 by 3 by 3 detect, to program and to record events of the experi-meters). The interior of the cage was partially lined ments. A BRS/LVE pellet feeder was mounted outsidewith Eccosorb AN-79 material. One wall and one half the chamber. A Noyes food pellet (45 mg) was delivered,of the floor and ceiling of the chamber opposite a radiat- when programmed, to the response cage by a tube ofing antenna were covered with Eccosorb VHP-18 pyra- flexible Tygon plastic (1.27 cm dia by 1.5 m length).midal material. The remaining wall was covered by a The microwave source used was an Epsco tunable2-mm thick copper sheet to form a ground plane. signal generator (200 to 750 MHz) with a minimumA single brass monpole antenna (1/4 X length, 1.2-cm power output of 100 watts. For the exposures to pulseddiameter) was inserted through the copper sheet. A cop- radiation, an MCL-1114 one-kilowatt linear amplifierper sheet (3 m by 0.5 m by 2 mm thick) was formed (400 to 800 MHz) was used in conjunction with theinto a 450 reflector and was mounted on the copper wall Epsco source. A Hewlett-Packard No. 214A pulse33 cm behind the antenna. An animal-response cage generator was used to drive the signal source at 1000(Figure 2) that was constructed of Plexiglas was located pulses per second. Radiation frequency was monitored143 cm from the antenna. The cage was held on the by a DANA 7580 frequency counter. A Sierra Philcovertical wall by a Styrofoam support that was con- 168B power meter was used to monitor the forwardstructed of 2.5-cm thick Styrofoam sheet. and reverse powers at the monopole antenna. A
The chamber was equipped with a 50-watt spotlight Weinschell double-stub tuner was used to match theand a sensitive RCA television camera that was coupled signal source to an antenna (1/4 X for each frequencyto an external video monitor. A ventilation fan was used) and to reduce reflected power to a minimum. Themounted on top of the chamber and circulated air from power density of the microwave field within the plasticthe room through the chamber at a rate of approxi- response cage in the radiation chamber at the positionmately eight cubic meters per minute. normally occupied by the rat was measured in mW/cm2
Since standard metallic caging and behavioral operanda by a General Microwave Corporation Raharn Model 1cannot be used in a microwave field, an alternate system (300 to 18,000 MHz) probe. The probe was inserted 4of monitoring and reinforcing lever-pressing behavior into the radiation chamber from the top with thewithin the radiation chamber was devised. A plastic length of the probe perpendicular to the E-field vectorresponse cage (Figure 2) was constructed using two, and was remotely monitored outside of the radiation24 by 16 cm, 2-cm thick Plexiglas panels. The panels chamber before and after each exposure of a rat.were joined at top and bottom by 32 rods (5-mmdia by 13.3-cm long) of Plexiglas equally spaced to 2.4. Procedure.form a grid floor and top. Two pieces of Plexiglas sheet All rats were trained to press the lever for food pellets(12.7 by 15.2 cm) were used, one as an end panel and on a variable interval schedule of reinforcement. Theone as a sliding guillotine door for the response cage. clock time used for the schedule was three seconds, withA plastic lever was mounted on a Plexiglas rod (5 mm by a probability of 0.10 of delivery of a food pellet. With13 cm) at one end of the cage. One end of the rod was this arrangement a food pellet could be delivered at in-
G2
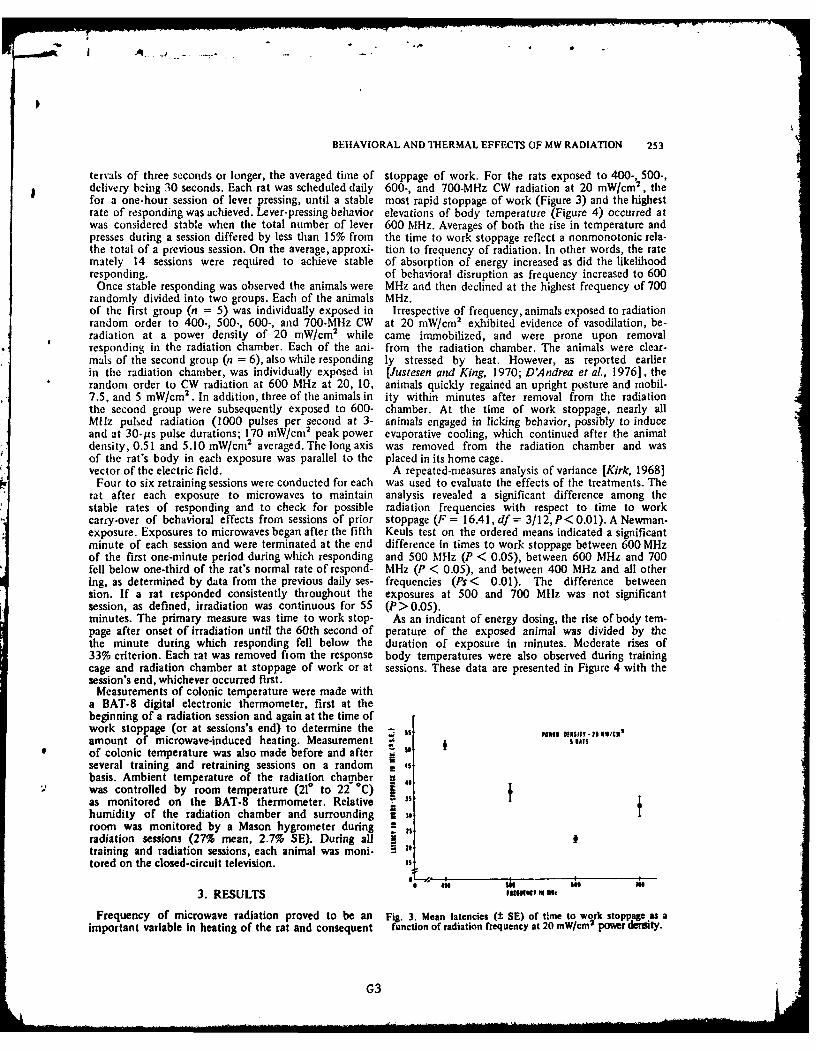
BEHAVIORAL AND THERMAL EFFECTS OF MW RADIATION 253
tervals of three seconds or longer, the averaged time of stoppage of work. For the rats exposed to 400-, 500-,delivery being 30 seconds. Each rat was scheduled daily 600-, and 700-MHz CW radiation at 20 mW/cm 2 , thefor a one-hour session of lever pressing, until a stable most rapid stoppage of work (Figure 3) and the highestrate of responding was achieved. Lever-pressing behavior elevations of body temperature (Figure 4) occurred atwas considered stable when the total number of lever 600 MHz. Averages of both the rise in temperature andpresses during a session differed by less than 15% from the time to work stoppage reflect a nonmonotonic rela-the total of a previous session. On the average, approxi- tion to frequency of radiation. In other words, the ratemately 14 sessions were required to achieve stable of absorption of energy increased as did the likelihoodresponding. of behavioral disruption as frequency increased to 600
Once stable responding was observed the animals were MHz and then declined at the highest frequency of 700randomly divided into two groups. Each of the animals MHz.of the first group (n = 5) was individually exposed in Irrespective of frequency, animals exposed to radiationrandom order to 400-, 500-, 600-, and 700-MHz CW at 20 mW/cm 2 exhibited evidence of vasodilation, be-radiation at a power density of 20 mW/cm 2 while came immobilized, and were prone upon removalresponding in the radiation chamber. Each of the ani- from the radiation chamber. The animals were clear-mals of the second group (n = 6), also while responding ly stressed by heat. However, as reported earlierin the radiation chamber, was individually exposed in [Justesen and King, 1970; D'Andrea et aL, 1976], therandom order to CW radiation at 600 MHz at 20, 10, animals quickly regained an upright posture and mobil-7.5, and 5 mW/cm 2 . In addition, three of the animals in ity within minutes after removal from the radiationthe second group were subsequently exposed to 600- chamber. At the time of work stoppage, nearly allMHz pulsed radiation (1000 pulses per second at 3- animals engaged in licking behavior, possibly to induceand at 30-ps pulse durations; 170 mW/cm 2 peak power evaporative cooling, which continued after the animaldensity, 0.51 and 5.10 mW/cm2 averaged. The long axis was removed from the radiation chamber and wasof the rat's body in each exposure was parallel to the placed in its home cage.vector of the electric field. A repeated-measures analysis of variance [Kirk, 1968]
Four to six retraining sessions were conducted for each was used to evaluate the effects of the treatments. Therat after each exposure to microwaves to maintain analysis revealed a significant difference among thestable rates of responding and to check for possible radiation frequencies with respect to time to workcarry-over of behavioral effects from sessions of prior stoppage (F = 16.41, dfr= 3/12,P<0.01). A Newman-exposure. Exposures to microwaves began after the fifth Keuls test on the ordered means indicated a significantminute of each session and were terminated at the end difference in times to work stoppage between 600 MHzof the first one-minute period during which responding and 500 MHz (P < 0.05), between 600 MHz and 700fell below one-third of the rat's normal rate of respond- MHz (P < 0.05), and between 400 MHz and all othering, as determined by data from the previous daily ses- frequencies (Ps< 0.01). The difference betweension. If a rat responded consistently throughout the exposures at 500 and 700 Mtlz was not significantsession, as defined, irradiation was continuous for 55 (P> 0.05).minutes. The primary measure was time to work stop- As an indicant of energy dosing, the rise of body tern-page after onset of irradiation until the 60th second of perature of the exposed animal was divided by thethe minute during which responding fell below the duration of exposure in minutes. Moderate rises of33% criterion. Each rat was removed fiom the response body temperatures were also observed during trainingcage and radiation chamber at stoppage of work or at sessions. These data are presented in Figure 4 with thesession's end, whichever occurred first.
Measurements of colonic temperature were made witha BAT-8 digital electronic thermometer, first at thebeginning of a radiation session and again at the time ofwork stoppage (or at sessions's end) to determine the -ss PS D111 -23,iS/91'amount of microwave-induced heating. Measurementof colonic temperature was also made before and afterseveral training and retraining sessions on a random 4sbasis. Ambient temperature of the radiation chamber -was controlled by room temperature (210 to 22-*C) as monitored on the BAT-8 thermometer. Relative 3,
humidity of the radiation chamber and surrounding s oroom was monitored by a Mason hygrometer during ,radiation sessions (27% mean, 2.7% SE). During alltraining and radiation sessions, each animal was moni-tored on the closed-circuit television.
3. RESULTS 11111101tr ,1
Frequency of microwave radiation proved to be an Fig. 3. Mean latencies (+ SE) of time to work stoppage as aimportant variable in heating of the rat and consequent function of radiation frequency at 20 mW/cm 2 power deity.
G3
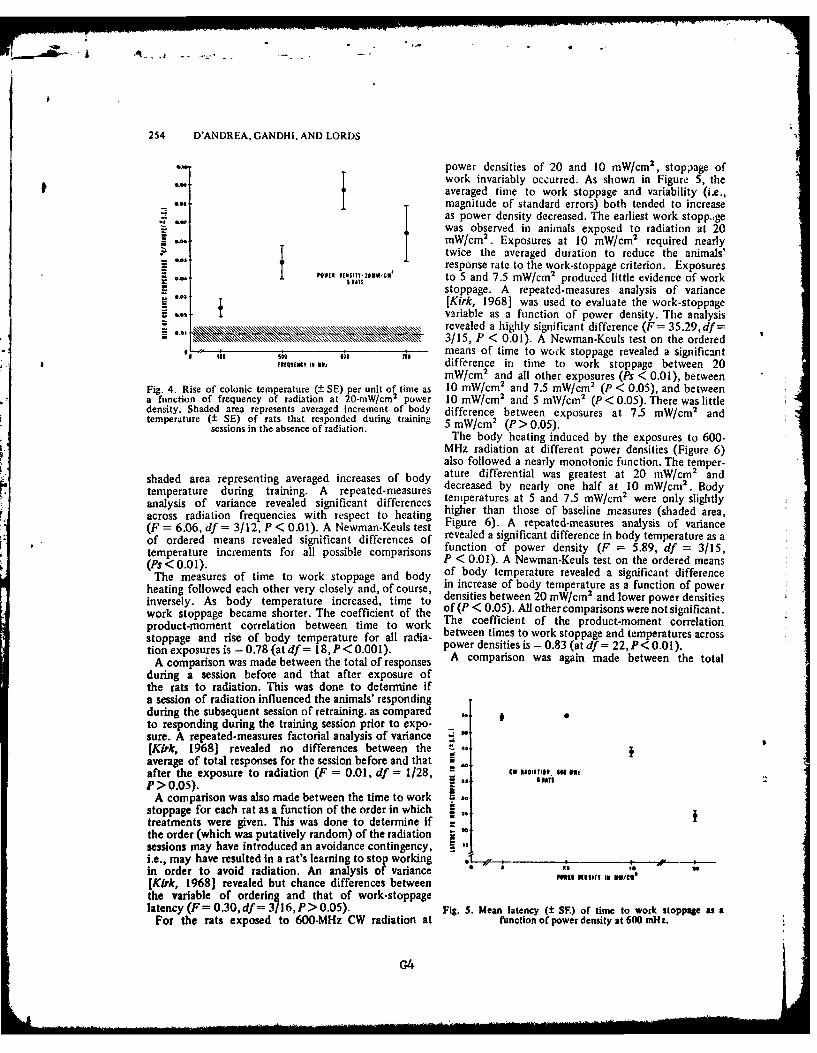
A-. . " -
254 D'ANDREA, GANDHI, AND LORDS
power densities of 20 and 10 mW/cm 2 , stoppage ofI work invariably occurred. As shown in Figure 5, the
averaged time to work stoppage and variability (i.e.,magnitude of standard errors) both tended to increaseas power density decreased. The earliest work stoppigewas observed in animals exposed to radiation at 20
a -*- mW/cm 2 . Exposures at 10 mW/cm 2 required nearlyJ jTtwice the averaged duration to reduce the animals'
response rate to the work-stoppage criterion. Exposures"all ,INSIT6 UW,,,CM,' to 5 and 7.5 mW/cm 2 produced little evidence of work
- stoppage. A repeated-measures analysis of variance" 0.03 [Kirk, 19681 was used to evaluate the work-stoppage
U02 variable as a function of power density. The analysisrevealed a highly significant difference (F= 35.29, df=
o_-- ..- 3/15, P < 0.01). A Newman-Keuls test on the ordered0 .- 4o $1111 60 "1 means of time to wouk stoppage revealed a significant
FRIIIIIC IN , difference in time to work stoppage between 20mW/cm 2 and all other exposures (Ps < 0.01), between
Fig. 4. Rise of colonic temperature (± SE) per unit of time as 10 mW/cm 2 and 7.5 mW/cm 2 (P < 0.05), and betweena function of frequency of radiation at 20-mW/cm2 power 10 mW/cm2 and 5 mW/cm 2 (P < 0.05). There was littledensity. Shaded area represents averaged increment of body difference between exposures at 7.5 mW/cm 2 andtemperature (± SE) of rats that responded during training mW/cm2sessions in the absence of radiation. 5 mWc 2 (P > 0.05).
The body heating induced by the exposures to 600-MHz radiation at different power densities (Figure 6)also followed a nearly monotonic function. The temper-
shaded area representing averaged increases of body ature differential was greatest at 20 mW/cm 2 andtemperature during training. A repeated-measures decreased by nearly one half at 10 mW/cm2 . Bodyanalysis of variance revealed significant differences eiperatos t 5 andl7.5 m/cm2 were only slightlyacross radiation frequencies with respect to heating higher than those of baseline measures (shaded area,(F = 6.06, df = 3/12, P < 0.01). A Newman-Keuls test Figure 6). A repeated-measures analysis of varianceof ordered means revealed significant differences of revealed a significant difference in body temperature as a
function of power density (F = 5.89, df = 3/15,temperature increments for all possible comparisons P < 0.01). A Newman-Keuls test on the ordered means(Ps < 0.01).
The measures of time to work stoppage and body of body temperature revealed a significant differenceheating followed each other very closely and, of course, in increase of body temperature as a function of powerinversely. As body temperature increased, time to densities between 20 mW/cm2 and lower power densitieswork stoppage became shorter. The coefficient of the of(P <f0.05). AUlother comparisonswerenotsignificant.product-moment correlation between time to work The coefficient of the product-moment correlationstoppage and rise of body temperature for all radia- between times to work stoppage and temperatures acrosstion exposures is - 0.78 (at df = 18, P < 0.00 1). power densities is - 0.83 (at df = 22, P< 0.01).
A comparison was made between the total of responses A comparison was again made between the totalduring a session before and that after exposure ofthe rats to radiation. This was done to determine ifa session of radiation influenced the animals' respondingduring the subsequent session of retraining, as compared *,
to responding during the training session prior to expo-sure. A repeated-measures factorial analysis of variance -
[Kirk, 19681 revealed no differences between the "-average of total responses for the session before and that -after the exposure to radiation (F = 0.01, df = 1/28, -" Rw no. ,o, all
P > 0.05). 6 TS
A comparison was also made between the time to work .,sstoppage for each rat as a function of the order in which 0 ,treatments were given. This was done to determine if 7.Sthe order (which was putatively random) of the radiation ,sessions may have introduced an avoidance contingency,i.e., may have resulted in a rat's learning to stop working .0. l, , _-__ -
in order to avoid radiation. An analysis of variance(Kirk, 19681 revealed but chance differences betweenthe variable of ordering and that of work-stoppagelatency (F= 0.30,df = 3/16,P > 0.05). Fig. 5. Mean latency (±-SE) of time to work stoppage as a
For the rats exposed to 600-MHz CW radiation at function of power density at 600 mH z.
G4
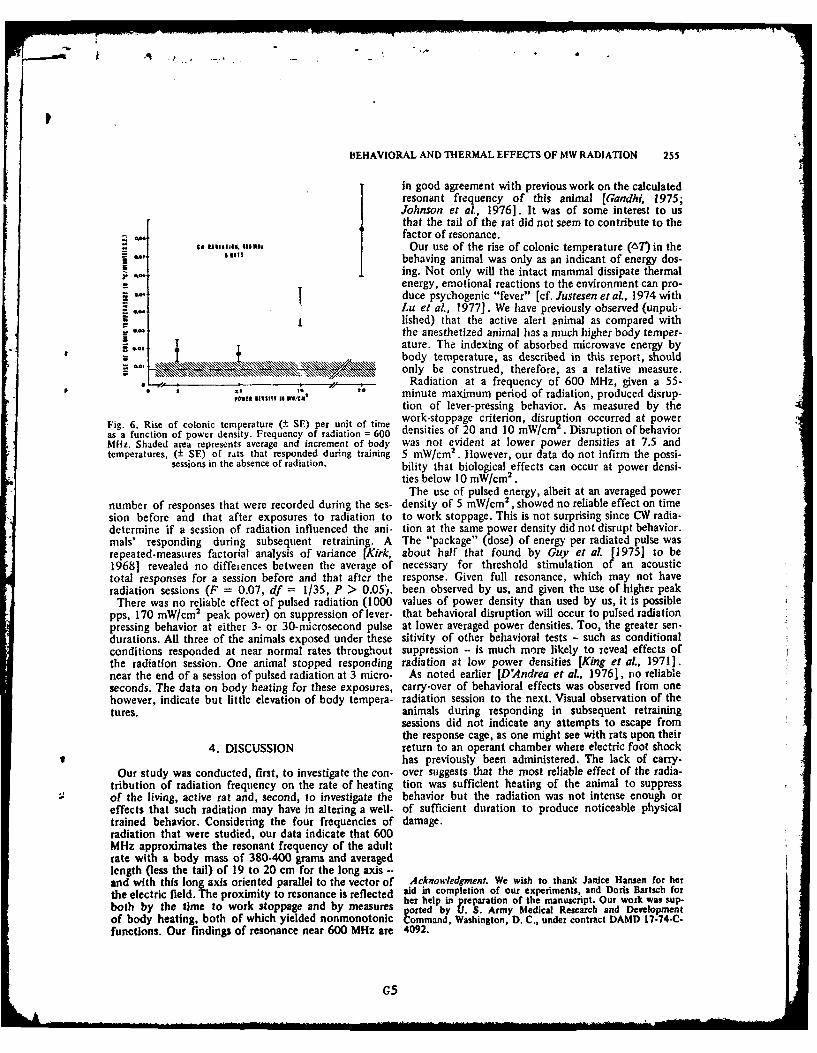
-
BEHAVIORAL AND THERMAL EFFECTS OF MW RADIATION 255
in good agreement with previous work on the calculatedresonant frequency of this animal [Gandhi, 1975;Johnson et at, 1976]. It was of some interest to usthat the tail of the rat did not seem to contribute to thefactor of resonance.
-e C I11111116. ess-, Our use of the rise of colonic temperature (AT) in the., hhus behaving animal was only as an indicant of energy dos-
an ing. Not only will the intact mammal dissipate thermal
_= energy, emotional reactions to the environment can pro--Jduce psychogenic "fever" [cf. Justesen et al., 1974 with
Lu et at, 19771. We have previously observed (unpuL---. lished) that the active alert animal as compared with
an the anesthetized animal has a much higher body temper-** f ature. The indexing of absorbed microwave energy by
- body temperature, as described in this report, should_- only be construed, therefore, as a relative measure.011 Radiation at a frequency of 600 MHz, given a 55-
POWER '11 IN 10 minute maximum period of radiation, produced disrup-tion of lever-pressing behavior. As measured by the
Fig. 6. Rise of colonic temperature (± SE) per unit of time work-stoppage criterion, disrution occurred at poweras a function of power density. Frequency of radiation = 600 densities of 20 and 10 mW/cm . Disruption of behaviorMHz. Shaded area represents average and increment of body was not evident at lower power densities at 7.5 andtemperatures, (± SE) of rats that responded during training 5 mW/cm 2 . lowever, our data do not infirm the possi-
sessions in the absence of radiation. bility that biological effects can occur at power densi-ties below 10 mW/cm2 .
The use of pulsed energy, albeit at an averaged powernumber of responses that were recorded during the ses- density of 5 mW/cm2 , showed no reliable effect on timesion before and that after exposures to radiation to to work stoppage. This is not surprising since CW radia-determine if a session of radiation influenced the ani- tion at the same power density did not disrupt behavior.mals' responding during subsequent retraining. A The "package" (dose) of energy per radiated pulse wasrepeated-measures factorial analysis of variance [Kirk, about half that found by Guy et al. [1975] to be19681 revealed no diffeiences between the average of necessary for threshold stimulation of an acoustictotal responses for a session before and that after the response. Given full resonance, which may not haveradiation sessions (F = 0.07, df = 1/35, P > 0.05). been observed by us, and given the use of higher peak
There was no reliable effect of pulsed radiation (1000 values of power density than used by us, it is possiblepps, 170 mW/cm2 peak power) on suppression of lever- that behavioral disruption will occur to pulsed radiationpressing behavior at either 3- or 30-microsecond pulse at lower averaged power densities. Too, the greater sen-durations. All three of the animals exposed under these sitivity of other behavioral tests - such as conditionalconditions responded at near normal rates throughout suppression - is much more likely to reveal effects ofthe radiation session. One animal stopped responding radiation at low power densities [King et al, 1971].near the end of a session of pulsed radiation at 3 micro- As noted earlier [D'Andrea et al., 19761, no reliableseconds. The data on body heating for these exposures, carry-over of behavioral effects was observed from onehowever, indicate but little elevation of body tempera- radiation session to the next. Visual observation of thetures. animals during responding in subsequent retraining
sessions did not indicate any attempts to escape fromthe response cage, as one might see with rats upon their
4. DISCUSSION return to an operant chamber where electric foot shockhas previously been administered. The lack of carry-
Our study was conducted, first, to investigate the con- over suggests that the most reliable effect of the radia-tribution of radiation frequency on the rate of heating tion was sufficient heating of the animal to suppressof the living, active rat and, second, to investigate the behavior but the radiation was not intense enough oreffects that such radiation may have in altering a well. of sufficient duration to produce noticeable physicaltrained behavior. Considering the four frequencies of damage.radiation that were studied, our data indicate that 600MHz approximates the resonant frequency of the adultrate with a body mass of 380-400 grams and averagedlength (less the tail) of 19 to 20 cm for the long axis --and with this long axis oriented parallel to the vector of Acknowledgment. We wish to thank Janice Hansen for herthe electric field. The proximity to resonance is reflected aid in completion of our experiments, and Doris Bartsch for
her help in reparation of the manuscript. Our work was sup-both by the time to work stoppage and by measures orted by U. S. Army Medical Research and Developmentof body heating, both of which yielded nonmonotonic Command, Washington, D. C., under contract DAMD 17-74-C-functions. Our findings of resonance near 600 MHz are 4092.
G5
-A. 4
256 D'ANDREA, GANDHI, AND LORDS
.W
REFERENCES Dosimetry Handbook, Rep. SAM-TR-76.35, pp. 100-101,Interim report under contract F41609-76-C-0025, USAFSchool of Aerospace Medicine, Brooks Air Force Base,Texas.
Justesen, D. R., and N. W. King (1970), Behavioral effects ofD'Andrea, J. A., 0. P. Gandhi, and R. P. Kesner (1976), Behav- low4evel microwave irradiation in the closed space situation,
ioral effects of resonant electromagnetic power absorption in in Biological Effects and Health Implications of Microwaverats, in Biological Effects of Electromagnetic Waves, Selected Radiation - Symposium Proceedings, edited by S. F. Cleary,Papers of the USNC/URSI Annual Mfeeting, Boulder, Colo. U. S. Public Health Service Publication No. BRH/DBE 70-2,rado, October 20.23, 1975, Vol. 1. edited by C. C. Johnson Washington, D. C., pp. 154-179.and M. L. Shore, 257-273, HEW PubL (FDA) 77-8010, U.S. Juttesen, D. R., D. M. Levinson, and L. R. Justesen (1974),Government Printing Office, Washington, D. C. 20402. Psychogenic stressors are potent mediators of the thermal
Gandhi, 0. P. (1974), Polarization and frequency effects on response to microwave irradiation, in Biologic Effects andwhole animal absorption of RF energy, Proc. IEEE, 62(8), Health Hazards of Microwave Radiation, edited by P. Czerski,1171-1175. pp. 134-140, Polish Medical Publishers, Warsaw.
Gandhi, 0. P. (1975), Conditions of strongest electromagnetic King, N. W., D. R. Justesen, and R. L. Clarke (197 1), Behavioralpower deposition in man and animals, IEEE Trans. Micro. sensitivity to microwave radiation, Science, 172, 398-401.wave Theory Tech., MTT.23(12), 1021-1029. Kirk, R. E. (1968), Experimental Design Procedures for the
Githens, S. H., T. D. Hawkins, and J. Schrot (1975), Colonic Behavioral Sciences, Brooks Cole, California, 577 pp.temperature changes during microwave exposure (abstract Lu, S.-T., N. Lebda, S. M. Michaelson, S. Pettit, and D. Riveraonly) Technical Program Booklet, USNC/URSI Annual f19771, Thermal and endocrinological effects of protractedMeeting, October 20-23, 1975, Boulder, Colorado, p. irradiation of rats by 2450-MHz microwaves, Radio Sci.,232 (USNC/URSI National Academy of Sciences, Wash- this issue.ington, D.C. Schrot, J., and T. D. lawkins (1976), Interaction of microwave
Guy, A. W., C. K. Chou, J. C. Lin, and D. Christensen (1975), frequency and polarization with animal size, in BiologicalMicrowave induced acoustic effects in mammalian auditory Effects of Electromagnetic Waves, Selected Papers of thesystems and physical materials, Ann. N. Y. Acad. ScL, 247, USNC]URSI Annual Meeting, Boulder, Colorado, October194-218. 20-23, 1975, VoL If, 184-192, edited by C. C. Johnson and
Johnson, C. C., C. H. Dumey, P. NY. Barber, H. Massoudi, S. J. M. L. Shore, HEW Publ. (FDA) 77.8011, U. S. GovernmentAllen, and J. C. Mitchell (1975), Radiofrequency Radiation Printing Office, Washington, D. C. 20402.
G6S
S
DISTRIBUTION LIST
USAPRd3C (SGRD-RMS)Fort DetrickFrederick, MD 21701
Defense Technical Information Center (DTIC)ATTN: DTIC-DDACameron StationAlexandria, VA 22314

k