Embed Size (px)
Citation preview

Permaculture Adoption Among Malawian Farmers: A Positive Deviance Inquiry
Hope Thornton PIM 65
A Capstone Paper submitted in partial fulfillment of the requirements for a Master of
Intercultural Service, Leadership, and Management at the School for International Training in Brattleboro, Vermont, USA.
May 23, 2008
Advisor: Dr. James Levinson

The author hereby grants to the School for International Training permission to reproduce either electronically or in print format this document in whole or in part library archival purposes only. The author hereby does grant to the School for International Training permission to electronically reproduce and transmit this document to students, alumni, staff and faculty of the World Learning Community. Author’s Signature _________________________________________________________ © Hope Thornton, 2008. All Right Reserved.

ii
TABLE OF CONTENTS Abstract……………………………………………………………………………………...
iv
Introduction………………………………………………………………………………… 1. Background………………………………………………………………………………
A. Snapshot Malawi………………………………………………………………… B. Contemporary Agriculture versus Permaculture: Malawi Context…………….
2. Statement of Research Question………………………………………………………
1156
12
Literature Review…………………………………………………………………………. 1. Positive Deviance……………………………………………………………………… 2. Adoption of Agricultural Techniques and Practices……………………………………
141417
Research Methodology…………………………………………………………………….
20
Presentation and Analysis of Data………………………………………………………… 1. Profile of the Respondents…………………………………………………………….. 2. Adoption……………………………………………………………………………….. 3. Yields…………………………………………………………………………………...
4. Food and Nutrition Security Score……………………………………………………..
2727314446
Discussion & Conclusions......................................................................................................
52
Bibliography............................................................................................................................
58
Appendix……………………………………………………………………………………..
61

iii
LIST OF TABLES AND FIGURES
TABLES TABLE 1. COMPARATIVE PRACTICE CHART…………………………. 10TABLE 2. VARIABLE DEFINITIONS AND DESCRIPTIVE STATISTICS…... 23TABLE 3. SAMPLE CHARACTERISTICS OF POSITIVE DEVIANCE
RESPONDENTS…………………………………………….. 28TABLE 4. FREQUENCY OF ADOPTION………………………………... 32TABLE 5. SAMPLE CHARACTERISTICS BY ADOPTION GROUP:
EXPLANATORY VARIABLES……………………………….. 33TABLE 6. FREQUENCY OF EVALUATED PRACTICES………………….. 40TABLE 7. RESPONDENTS AGRICULTURAL YIELDS…………………... 44TABLE 8. FOOD AND NUTRITION SECURITY RESPONSES…………….. 47TABLE 9. REGRESSION ANALYSIS: FNSS…………………………… 50 FIGURES FIGURE 1. MAP OF MALAWI………………………………………….. 4FIGURE 2. TERMS ASSOCIATED WITH POSITIVE DEVIANCE…………... 15FIGURE 3. VARYING APPLICATIONS OF POSITIVE DEVIANCE………… 16

iv
ABBREVIATIONS CBO Community Based Organization CGIAR Consultative Group on International Agricultural Research INGO International Non Government Organization FAO Food and Agriculture Organization of the United Nations FAST Food Access Survey Tool FNS Food and Nutrition Security FNSS Food and Nutrition Security Score MoAFS Ministry of Agriculture and Food Security MoEST Ministry of Education, Science & Technology MoH Ministry of Health NEF Never Ending Food NGO Non Governmental Organization PDA Positive Deviance Approach PDI Positive Deviance Inquiry PNM Permaculture Network in Malawi UNDP United Nations Development Program USAID United States Agency for International Development

v
ABSTRACT
Malawi is a country rich in underutilized natural resources, which could be used to
reduce household food and nutrition insecurity in the country. The burgeoning Permaculture
community in Malawi, including officials in the Ministry of Education, Science and Technology,
is seeking, through Permaculture, to make better use of resources and assets that already Malawi
already possesses. Despite the growing numbers of Permaculture practitioners, however, little is
known about the influences that affect farmers’ decisions to adopt or not to adopt. This positive
deviance inquiry seeks to inform the Permaculture community of the constraints and barriers to
Permaculture practice, the coping strategies adopters employ and the benefits adopters receive.
The data analysis indicates that Permaculture adoption is associated with age and land
ownership but not with income or years of education. Quantitative and qualitative data shows
that food and nutrition security scores are associated with Permaculture adoption scores, weakly
with acres owned and not with income. Such findings are contrary to contemporary thought on
yield-improving techniques and increased household food security, and suggest that farmers who
adopt Permaculture, despite limited income, land holdings, or education have both increased
their yields and improved their food and nutrition security.

vi
ACKNOWLEDGMENTS
There are a number of people who have made this research possible. I am indebted to my advisor Dr. James Levinson for his academic support and for encouraging me to do something different. Kristof, Stacia, and Khalidwe Nordin not only gave me a home but also a new way of looking at the world and for that I am grateful. While there may not be anything presented in this paper that the Nordins did not already know, I hope that this academic research will aid them in their future work. Dr. Denish Moorthy has been a source of both inspiration and technical assistance and without him there would be no statistics in this paper. I am continually obliged to my parents for their understanding and support. I would also like to thank Christopher Darts for his support, love, sense of humour and friendship. Additionally, I want to thank all of the participants, many of whom have given me permission to list their names. I would like for all those who read this to know who has contributed to the continuing discussion of sustainable agriculture in Malawi. In no particular order, they are: Jefferson Kahinja, Virginia White, Patuma Green, Joseph Zamawa, Jeoffrey Bauleni, Crak Phiri, Ethel Khatumba, “Pastor Chawawa”, Michael Pipe, Yanjanani Sapemba, Seba Banda, Clifford Madise, Mary Kalumbi, Margaret Thengu, Steven & Grace Chikoti, Victor Yonasoni, Wyson Mponda, Simon Saka, Isaac Chirwa, Nelson Esau, James Chirwa, Esnart Billy, Angela Isaac, Nesiter Kaniya, Patricia Muleka, Zione Mauel, and one the participant who asked to remain anonymous.

1
INTRODUCTION I. BACKGROUND
Malawi has experienced relative political stability, has not, in recent decades,
experienced major war or tribal clashes, and it is rich with under-utilized natural resources. With
such attributes, including over 600 documented edible localized and indigenous foods (Nordin,
2005; Williamson, 2005; Hirt & M’Pia, 2001, FAO 1988), the world’s ninth largest lake, several
substantial rivers, and a twelve-month growing season, the problem of food and nutrition
insecurity might not be expected to affect Malawians. But in reality, food insecurity and
malnutrition are major constraints to national development (Banda, 2005). Every year Malawi
ranks amongst the world’s poorest countries according to the UNDP Human Development Index.
Jeffrey Sachs opens The End of Poverty (2005) with a description of Malawi using a label that he
and Carol Bellamy, then of UNICEF, coined: “The Perfect Storm”. He writes that this storm
“brings together climactic disaster, impoverishment, the AIDS pandemic, and the long-standing
burdens of malaria, schistosomiasis, and other diseases” (2005, p. 10). Sachs sharply criticizes
the international donor community for failing to provide the requested funds and support that
could have prevented the worst of the storm and reduced much of resulting suffering. “In the
face of this horrific maelstrom, the world community has so far displayed a fair bit of hand-
wringing and even some high minded rhetoric, but precious little action” (Sachs, 2005, p. 10).
Sachs has lobbied Britain and the World Bank on behalf of fertilizer subsidies in Malawi and has
encouraged others who come from countries who have already “climbed the ladder of
development” take on the burden of helping the poorest of the poor to escape from the cycle of
extreme poverty through provision of agricultural inputs and government subsidies. But Malawi

2
is not a resource-deprived country and Sachs and the school of high-external-input development
may have missed the mark.
Contemporary agricultural practices combined with increasing land pressure have left
Malawi’s soil eroded and unhealthy, its forests degraded, and the land prone to drought and
flooding, contributing further to food and nutrition insecurity. It is in this context that
Permaculture, the subject matter of this paper, offers such potential as means to help address
these problems and properly utilize existing agricultural resources. Local, national, and
international organizations, including various Ministries of the Malawian government recognize
the immediate and long-term economic, social, and environmental effects of malnutrition and
hunger (Banda, 2005) and are involved in a range of inter-sectoral initiatives to arrest food and
nutrition insecurity. The bleak outlook offered by Sachs and other international organizations is
not a result of lack of resources but rather a failure to recognize and utilize the valuable resources
and assets that Malawi already possesses.
Development initiatives, especially those related to food and nutrition, typically rely on a
“needs based” approach which employ scientific methods and dialogue to identify what a
community lacks (or needs) to improve living conditions. Such initiatives often fail because what
is “needed” is impossible for the local population to obtain- or maintain, after an intervention or
initiative has ended (Lapping, Marsh, Rosenbaum, Swedenburg, Sternin, Sternin, & Schroeder,
2002). By contrast, Positive Deviance is an “assets-based” approach to inquiry that focuses on
identifying what resources communities are already using to improve livelihoods and overcome
barriers. Therefore, Positive Deviance solutions have the potential to be more sustainable than
solutions that are externally driven and supported by external resources such as aid and policy
conditionality (Ochieng, 2006).

3
This Positive Deviance Inquiry addresses a central issue now facing Malawian
agriculture, i.e. the adoption by farmers of sustainable agriculture practices. It does so by
examining the agricultural practices of 27 Malawian farmers who have been exposed to
Permaculture Nutrition and Design. Using quantitative and qualitative methods, this inquiry
identifies Permaculture adapters (positive deviants) and examines the factors and farmer
characteristics associated with such adoption. The purpose of the inquiry is, specifically, to
inform and better target Permaculture training in Malawi, and more broadly, to provide insights
relating to the transfer/adoption of alternative agricultural practices in developing countries. The
study also examines household food security in Malawi and the extent to which it is affected by
the adoption of Permaculture practices.

4
Figure 1: Map of Malawi (United Nations, 2004)

5
A. SNAPSHOT MALAWI
Lying south of the equator, Malawi is a landlocked country sharing borders with
Tanzania, Mozambique and Zambia. It is 900 kilometers long and ranges in width from 80 to
161 kilometers (UNDP, 2007) . Lake Malawi is the world’s ninth largest lake making up nearly
one fifth of the nations land area and, along with altitude, the lake heavily influences Malawi’s
warm tropical climate.
The country is divided into 27 districts within the Northern, Central and Southern
Regions. The districts are subdivided into Traditional Authorities (TA’s), which are governed by
chiefs. Traditional Authorities are comprised of villages, the smallest administrative unit, and
are governed by village headmen. Before gaining independence in 1964, Malawi was under
British Colonial rule from 1891. In 1994, Malawi became a multi-party democracy adopting a
poverty reduction strategy including a neo-liberal market economy as well as mandating free and
compulsory primary school education.
Agriculture is the most critical sector of the Malawian economy as it consists of nearly 40
percent of the GDP, employs 85 percent of work force and provides an estimated 64% of the
total income of rural Malawians (UNDP, 2007). In 2005, over 90 percent of Malawi’s foreign
exchange earnings were a result of tobacco, tea, and sugar production. (FAO, 2005; MoA, 2005)
In addition to being the foundation of the economy, between 85-90% are subsistence farmers and
rely on agriculture for their daily food intake (MoA, 2005). Between 70% and 80% of arable
land in Malawi is under maize production (Sauer, Tchale & Wobst, 2006; Peters 1999), with
maize constituting 90% of cereal production and, in turn, making Malawians, the highest per
capita consumers of maize in the world at148 kgs. per capita per annum (Sauer, Tchale & Wobst,
2006).

6
B. CONTEMPORARY AGRICULTURE VERSUS PERMACULTURE: MALAWIAN CONTEXT
Donald Plunkett, former scientific advisor to CGIAR calls the technological advances in
agriculture “the greatest agricultural transformation in the history of human kind. “The change”
Plunkett writes, “was brought about by the rise of science-based agriculture which permitted
high and more stable food production, ensuring food stability and security for a constantly
growing world population” (Plunkett in Pretty, 2005, p.3). In Malawi agriculture is dominated by
small landholders and is seen as the most important sector for achieving economic growth
(Chirwa, 2005; MoA, 2005). Worldwide, contemporary agricultural practices have been
influenced by the modernist approach, which relies on hybridized and/or genetically modified
seed combined with chemical fertilizer to increase staple crop production per acre. The
Government of Malawi has invested in the promotion of such technologies through provision of
input subsidies, support of integrated rural development, and funding of research and extension
services (Simtowe, 2006; Chirwa, 2005; Cromwell, et al., 2001).
The international attention that Malawi has recently received for its agricultural successes
is largely attributable to such federal subsidies of agricultural inputs. A New York Times front-
page article (2007) entitled “Ending Famine, Simply by Ignoring the Experts” highlights
Malawi’s 2006/2007 agricultural seasons during which heavily subsidized fertilizer use is
credited with record yields of over 3.4 billion metric tons (World Food Programme, 2007). In
2005, when federal subsidies were smaller, yields were around 1.2 billion metric tons. Despite
the face-value success the subsidies and the modernist approach have yielded, it has not come
without considerable costs. Experts and researchers around the globe have called to question
conventional agriculture’s ecological and financial sustainability (Pretty 1995, 2005; Shiva 1991;
Sauer, Tchale, & Wobst, 2006; Chavez-Tafur, Hampson, Roem, Thijssen, & Ingevall, 2006):

7
x Water contamination as a result of pesticides, nitrates, and soil & livestock wastes threatens biodiversity, disrupts the ecosystems, and poisons drinking water supply.
x Contamination of food and fodder- poisoned by residues of pesticides and nitrates. x Damage to farm and natural resources by pesticides threatens the health of farm
workers and the surrounding population. High levels of toxic chemicals used in pesticides have been found to cause cancer, genetic damage, fetal damage, and severe allergic reactions.
x Contamination of the atmosphere by ammonia, nitrous oxide, methane and the products of burning contributing to ozone depletion, global warming, and atmospheric pollution.
x Overuse of natural resources, causing depletion of groundwater, and loss of wild foods and habitats, and of their capacity to absorb wastes, causing water logging and increased salinity. Additionally, resource overexploitation, such as deforestation contributes heavily to both flooding and drought.
x The tendency in agriculture to standardize and specialize by focusing on modern varieties, causes the displacement and loss of traditional varieties and breeds which have been hybridized in nature over millennia to withstand insects and disease of their indigenous growing regions.
x Inability of low-income farmers to afford agricultural inputs such as fertilizer and hybridized seed and tendency to be locked in a cycle of dependency once the modernist approach has been adopted.
Permaculture is an under-researched assets-based approach to sustainable living and food
production that optimizes use of what resources already exist in any given environment while
following a strict ecological ethic. The word Permaculture is a union of the words “permanent”
and “agriculture” and it is a worldwide movement1 striving to make communities sustainable
through conscious design of resource and energy efficient landscapes. Permaculture can be
practiced in both rural and urban settings and can focus on subsistence farming and/or
commercial production. Permaculture practice around the world varies, but the design theories
include perennials and trees, intercropped plants for optimum yields, incorporation of livestock,
natural pest management systems, and use of organic matter to protect the soil and increase soil
fertility. Such designs mimic the ecological processes, interactions and services of ecosystems
and result in an agriculturally productive and environmentally benign food system (Jackson,
1 Because Permaculture refers to a movement, the word itself shall be capitalized throughout this paper.
8
1984; Chavez-Tafur, et al., 2006). As part of this movement, there are some basic philosophies
on which Permaculture and sustainable agriculture, more generally, have been built:
x Adapting agriculture to local environments and optimizing the use of local resources including plants, animals, soils, water, and human labor
x Reducing the dependency and use of external and non-renewable inputs to reduce damage to the environment and toxicity in humans; animals and the ecosystem as a whole
x Maximizing the use of renewable resources (e.g. solar) x Recognizing, appreciating, and building upon indigenous knowledge and
incorporating this knowledge with science and technology x Empowering local communities to control, manage, and benefit from natural
resources. x Valuing the role that agriculture plays in affecting the environment and
ecosystem, and committing to an agricultural system that positively and sustainably integrates all of the goods and services that nature provides.
(Adapted from Chavez-Tafur, et al. 2006, p. 5; Mollison, 1997)
Malawi is home to a burgeoning Permaculture community. The Permaculture Network
in Malawi (PNM) is an active group with over 100 individual and organizational memberships
and was founded in the early 1990’s as forum for sharing ideas and best practices. Today, the
PNM is deeply involved in various initiatives to reduce food and nutrition insecurity through
sustainable agriculture at the local and national levels. From smallholder farmers to development
agencies, Permaculture is gaining recognition as a means to increase agricultural production and
diversification at the household level while reducing labor and dependency on external inputs.
Citing inconsistency in donated inputs and sporadic support from development partners,
Malawi’s Ministry of Education, Science and Technology (MoEST) is currently piloting World
Food Program’s Low Input Food & Nutrition Security Model, which uses Permaculture as the
agricultural approach, for the School Health and Nutrition Strategy (MoEST, 2007). The
MoEST pilot is focused on crop and diet diversification through use of localized and indigenous
varieties, use of compost and organic manure as means of reducing dependency on inconsistently
subsidized chemical fertilizer and transferring sustainable agriculture and nutrition knowledge to

9
primary school children through theory and practice. Additionally, several other large
development organizations, (I)NGO’s, and CBO’s have recognized the potential that
Permaculture holds for low-input, low-cost food and nutrition security and have incorporated it
into their food security strategies. Organizations either using Permaculture or which have
received training in the theory and practice of Permaculture include : Ministry of Agriculture and
Food Security, World Vision, Family Health International, German Technical Cooperation
(GTZ), GOAL, Emmanuel International, Africare, CARE International, Malawi Red Cross,
Concern Universal, Canadian Physicians for Aid and Relief, World Food Programme Malawi,
US Embassy Public Affairs Alumni Exchange Programme, National Association of Small
Holder Farmers in Malawi, Ripple Africa, Children in the Wilderness, and Kande Care School &
Garden.
The mean amount of land per capita devoted to food production in Malawi is estimated to
be 0.6 hectares (Alwang & Siegel, 1999). With one of the highest population densities in sub-
Saharan Africa and a population that is increasing at 3% per annum, agricultural land is a scarce
resource. Permaculture offers a method of optimizing yields, expanding production areas,
increasing production and consumption diversity, and reducing dependency on often-unreliable
external inputs. The PNM is working with MoEST and several other organizations to
incorporate this promising approach into development initiatives as an alternative to the
contemporary2, capital intensive method of agriculture. Table 1, below, displays the differing
agricultural practices of Permaculture and contemporary Malawian practices.
2 Information regarding current agricultural practices, unless otherwise noted, was primarily obtained by the author through an 8-month practicum followed by 5 months of primary research. For a description of the authors experience see Appendix A.

10
Table 1: Comparative Practices Common Malawian Practice Permaculture Practice
Field Preparation (rain fed crops)
� Clear land using slash & burn method � Form ridges annually � Soil exposed to wind, sun, and heavy rains usually for
several months at a time
� Add compost and mulch soil, protecting it from wind, sun heavy rains. Soil not exposed to erosive elements.
� Zero burn and reduced or zero-tillage � Permanent structures added where needed for water
management
Planting (rain fed crops)
� Monocropped staple food (maize, cassava) � Apply fertilizer if available; otherwise rely only on
leftover stalks or nothing at all. � Rarely save seed thus relying on “ganyu” labor or
starter packs to access seed (Cromwell, et al., 2001)3 � Plants the same crops on the same land year after year
� Intercropping of several staple foods (maize, millet, sorghum) with nitrogen fixing food plants (pigeon peas, etc)
� Majority of seeds saved from previous harvests with some collected from friends & nature.
� Properly rotates crops when necessary
Kitchen Gardens (irrigated, year round food production)
If there is a kitchen garden present: � Usually far from the home (furthest corner of the plot
or on another plot) � Bucket irrigation using fresh, collected water � Usually contains annual “foreign” vegetables (onions,
tomatoes, cabbage, rape) in monocropped beds. � Pesticides & fertilizers are used when available � Soil exposed to elements � No fence or fence constructed from dead
wood/material
� Close to the home using the Zone System4 � Fed with grey and harvested water � Intercropped plants including perennials using the
Guild System5 � Incorporation of localized and indigenous plants with
particular emphasis on the six food groups � Integrated Pest Management system � Compost fed � Constantly mulched � Living fence
Growing Season
� Rain fed crops require no irrigation but require laborious weeding
� Minimal harvest throughout the season � Kitchen garden requires intensive irrigation during dry
season (often 2-3 times per day
� Not a growing season, but year-round, permanent agriculture:
� Crops require additional mulch � Kitchen gardens (zones 1 & 2) require moderate
irrigation
Harvest � Yields one or two kinds of staple food. � Maize is harvested at one time while cassava can sit be
left in the ground for long periods of time.
� Yields many varieties of food (six food groups) � Food is harvested at all times of the year due to
careful planning during the planting stage
3 Portions of this chart have been adapted from Cromwell, Kamwemba, Mwanza, and Chirwa, 2001) 4 The Zone System describes a theoretical and practical approach specific to Permaculture and is described in more detail in Appendix B 5 The Guild System describes a theoretical and practical approach specific to Permaculture and is described in more detail in Appendix B

11
Table 1: Comparative Practices Common Malawian Practice Permaculture Practice
Water
� Water is used once and then dumped on unproductive ground.
� Rainwater is unmanaged causing crop loss, damage to homes and structure, and contributing to massive soil erosion.
� Water is used as many times as possible (ex. After washing dishes, water is used for irrigated a garden bed.
� Non-toxic grey water is used for food production where appropriate
� Rainwater is harvested and stored for future use either in the soil or in a holding container
Pest / Disease Management
� When possible apply chemical pesticides and herbicides for weed and pest control.
� If chemicals are unattainable, farmers may rely solely on laborious reactive measures (ex. removing caterpillars & snails by hand when the problem occurs)
� No fence or fence constructed from dead wood/material
� Fatalistic attitude: “It is God’s will”
� Preventative measures are taken to reduce vulnerability and susceptibility to pest and disease.
� Inclusion of strong smelling plants and mulch and use of strong smelling water
� Encourages beneficial species � Live fencing � Proactive, holistic attitude: “You don’t have a snail
problem, you have a duck deficiency” (Mollison, 1997)
Trees / Agroforestry
� Importance of trees is known, but few trees are planted. � Trees planted or desired to plant include Gmelina or
Eucalyptus which were promoted by the colonial government. These trees disturb agricultural production.
� Few farmers plant fruit trees � Firewood is collected from far away and significantly
contributes to deforestation.
� Many different types of trees are planted for food production, to increase soil fertility, and to conserve topsoil.
� Farmers plant trees specifically for firewood and building materials.
� Trees are used as “supporters” in the guild system thus introducing horizontal plane of agricultural production.
Animal Husbandry / Livestock Farming
If animals are kept, � Roam freely to scavenge for food, often destroying
crops and raiding kitchen gardens � Manure is not used on to enrich soil because it is too
difficult to collect.
� Kept in a “khola” (pen) for easy feeding and collecting of manure.
� Incorporated into the food production system- food is grown for animals that, in turn, provide food for humans.
Diet
� 75% of daily caloric intake is from staple crop (maize) resulting in high rates of under-nutrition
� Monoculture cropping has led to high risk of food insecurity because of a dependency on external inputs, soil degradation, and high risk of crop failure. (Nordin, 2005)
� Proper amounts of six food groups (or five with a protein source) are consumed on a daily basis.
� Diversified planting increased food and nutrition security by: reducing dependence on external inputs, better soil fertility and increased yields.

12
II. STATEMENT OF RESEARCH QUESTION AND PURPOSE
While Malawi has a burgeoning Permaculture community, there is currently no system in
place to monitor or evaluate Permaculture adaptation rates, levels of practice, or perceived/actual
benefits of Permaculture practice by farmers. The aforementioned NGO’s and development
organizations have rarely maintained records of those receiving Permaculture training and have
done little follow-up to track farmers’ adoption rates. Neither the PNM nor Never Ending Food
(NEF)6 has the capacity for follow-up and often completely loses contact with farmers who
receive training; thus the PNM and NEF are unable to assess their success rates or attribute
reasons for the “successes” or “failures” that they hear about. When the question is raised, it is
often assumed that there are no clear common denominators among the participants who have
adopted Permaculture practices. In describing the problem, Kristof Nordin, co-founder of NEF
said, “In some cases, we have people who participate in twelve days of Permaculture training
and never think about Permaculture again, and sometimes we see farmers who come to the
demonstration plot for a half day and change their whole lives. We have no idea what makes
these people [adopters/positive deviants] different” (K. Nordin, personal communication,
September 25, 2006).
In an effort to understand why some people adopt Permaculture practices and why some
do not, this Positive Deviance Inquiry (PDI) was designed to identify farmers who have been
exposed to Permaculture, through various methods, with the hopes of answering the following
questions:
6 Never Ending Food (NEF) is the organization with which the author interned. A description of the organization and her experience are found in Appendix A.

13
The larger purpose of this PDI of Permaculture adopters in Malawi is four fold:
� To understand the constraints and barriers to Permaculture practice in Malawi and, in turn, the means by which adopters have overcome these constraints and barriers in order to inform Permaculture training in the future.
� Using this information to improve the targeting and selection of Permaculture
trainees; � To better inform policy and decision makers in Malawi and the relevant development
agencies as the Permaculture movement in Malawi gains momentum; and � To expand understanding, more generally, of agricultural adoption in developing
countries as it relates to sustainable practices.
Overarching Question: What are the characteristics of Permaculture adopters? Sub-Questions: 1. What are the constraints inhibiting Permaculture adoption? 2. How have high and low adopters overcome the constraints, resistance
points, and barriers to Permaculture adoption? 3. Have adopters benefited from Permaculture practice? 4. Can food and nutrition security be predicted by Permaculture adoption?

14
LITERATURE REVIEW
1. Positive Deviance
The sociological concept of Positive Deviance has its earliest roots in deviance studies
and the classical works of Emile Durkheim, Georg Simmel and Max Weber (West, 2003).
Within sociology, positive deviance represents a paradigmatic shift from the traditional deviance
studies and is thought by some prominent deviance theorists to be an oxymoron (Saragin, 1985;
Goode 1991) because of the disparity associated with the juxtaposition of the words ‘positive’
and ‘deviance’. Within deviance studies, the word ‘deviant’ implies a deviation from cultural
norms, but usually is discussed in terms of “negative reactions to nonconformity” (West, 2003, p.
3). Dodge (1985) is credited for initiating the positive deviance debate in his article “The Over-
Negativized Conceptualization of Deviance: A Programmatic Exploration”.
By many accounts (Marsh, et al. 2004; Lapping, et al., 2002; Berggren and Wray 2002)
the concept of positive deviance first made an appearance in the fields of nutrition and
development in the 1972 Tropical Pediatrics editorial when then-editor, Joe Wray, asked “can
we learn from successful mothers” (in Berggren & Wray, 2002, p.7). Curiously, there is no
mention of the sociological roots of Positive Deviance in even the earliest PD Nutrition writings.
While in the early 1980’s sociologists acrimoniously debated the viability of PD’s place in
deviance studies, nutritionist Susan Van der Vynkt and medical doctor Samuel Wishik (1976)
developed a method for modifying dietary practices in deprived populations using PD and
published it The American Journal of Public Health (1976). Their report is widely accepted in
the field as the first to prescribe a methodology of identifying PD families and PD behaviors as
well as teaching PD practices throughout the population. Wishik and Van der Vynkt, however,
never produced a results based report and PD went unmentioned in the literature for 14 years.

15
Marian Zeitlin’s (1990) pioneering and extensive observations of PD behavior among
Yoruba and Javanese families and their relation to children’s nutrition, reintroduced the assets-
based approach to development with a well-honed methodology. Jerry and Monique Sternin,
colleagues of Zeitlin and founders of the Positive Deviance Initiative, have built upon Zeitlin’s
work with their own projects in Vietnam and have since made the most influential contributions
to the amplification of Positive Deviance as a tool for inquiry and development.
FIGURE 2: TERMS ASSOCIATED WITH POSITIVE DEVIANCE
Definition of the Positive Deviance Approach in Development: A development approach which helps a community and its members find existing, sustainable solutions to community problems today through the presence of positive deviant individuals within the community. Definition of a Positive Deviance Individual: A Positive Deviant is someone whose special practices of behaviors enable him/her to Overcome a problem more successfully than his/her neighbors who have access to the same resources or are affected by the same constraints. Definition of the Positive Deviance Inquiry: The Positive Deviance Inquiry is the tool used to discover the positive deviant's successful or desired practices. (Sternin, in Clawson, 2002, p. 3)
Lapping, et al. (2002) suggests that the Positive Deviance Approach (PDA) differs from
the widely employed needs-based approaches to developments which are aimed at identifying
what resources communities lack. Rather, PDA is an assets-based approach that “focuses on
individuals who have ‘deviated’ from conventional societal expectations and explored—though
perhaps not openly—successful alternatives to cultural norms, beliefs, or perceptions in their
communities” (PROWID, 1999, p. 1). Monique Sternin (in Clawson, 2002, p. 3) provides the
most thorough definitions of terms associated with Positive Deviance (Fig. 2).
Many whose development work has included positive deviance activities (Wishik and Van
der Vynckt 1976; Cederstrom 1999; Berggen and Wray 2002; Lapping et al., 2002; Marsh,

16
Schroeder, Deardon, Sternin & Sternin 2004) have written about the virtues of this approach,
recognizing it as a powerful tool with many advantages for research and development initiatives.
Below is a list of advantages compiled from the literature:
1. The poorest communities can use and benefit from this approach 2. It is a quick and low cost method to identify strategies that are already being
employed for a positive outcome 3. It is sustainable in that the practices identified are easily replicable within the
communities. This can reduce the occurrence of project failure after an intervention/project funding has ended.
4. Knowledge gained is informed by those who are the adopters / “doers”. 5. The approach enhances local research capacity for problem solving. 6. It encourages and permits immediate action rather than having to await external
resources.
Positive Deviance has gained attention within the development community and is now
being used well beyond its “traditional” application in nutrition and child health. The Sternin’s
PDI website lists the many applications in which PD is being used (Fig. 3).
FIGURE 3: VARYING APPLICATIONS OF POSITIVE DEVIANCE INQUIRY x Save the Children (SC)
- Community Empowerment and Nutrition Program in Vietnam - Preventing Girl Trafficking in Indonesia - Family Planning in Guatemala
x World Bank and the Government of Argentina collaborative effort
- Decrease school drop out rates in Argentina
x Center for Development and Population Activities (CEDPA) - Address female genital cutting (FGC, aka female circumcision or female
genital mutilation), in terms of community awareness and in design of appropriate strategies for diminishing/eradicating this practice
x Latin American division of MERCK
- Corporate application of PD to enhance sales.
(Examples of PDI’s listed on the Positive Deviance Initiative website. Stable URL http://www.positivedeviance.org/projects/. Accessed on Sept. 17, 2007)
While there are numerous advantages to the PDA, there also are limitations. Marsh, et al.
(2004) identifies the following limitations of the approach:
1. Uncommon positive practices have a prevalence rate of 1- 10% making them very difficult to find and identify.

17
2. Rare examples can be costly to identify in terms of both time and money. Common examples do not stimulate new thinking
3. It is an inappropriate approach in settings where positive deviant behavior is not possible; for example, when necessary resources are not available
4. Traditionally small sample size has led to criticism about the validity of generalizations
5. Scale-up requires human resources, community mobilization, and capacity building in the areas of participatory research and the concept of positive deviance.
Similarly, Karen Lapping (2003) of Save the Children USA writes that “statistical significance
and quantitative rigor is not the goal of positive deviance. Rather, it is a problem-solving tool
that can be widely applied to social and behavioral information of practical relevance to inform
programmatic realities” (p.13).
Perhaps the most useful aspect of Positive Deviance is the basic underlying assumption
that in every community and organization there are individuals whose deviant behavior results in
viable innovations and solutions to local problems. In his study of Kenyan agriculture, Ochieng
(2006) sees the potential of the PD framework in facilitating understanding both at the grassroots
and at the policy level. Ochieng postulates “the resources needed for development (financial and
intellectual) may already exist within African organizations and institutions” (p. 458). The
ability to recognize and then harness such PD solutions represents a significant paradigmatic
shift from contemporary development thought, but, argues Ochieng, such a shift has huge
implications for development policy and practice in Africa (p. 458).
2. Adoption of Agricultural Technologies and Practices
There is an abundance of literature available on theories of agricultural innovation and
technological change (Feder & Slade, 1984; Feder, Just, & Zilberman, 1984; Binswanger, 1986;
Goldman, 1993; Chirwa, 2005; Simtowe, 2007) most of which relates to the adoption of “new”,
“modern”, or (internationally) “conventional” methods of agriculture such as the introduction

18
and use of new seed varieties, adoption of fertilizer and other Green Revolution technologies.
Little research, however, has focused on the adoption and dissemination of sustainable
agriculture technologies in developing countries.
The literature provides several conceptual and theoretical models, empirically tested, that
have been used to explain farmers’ choices to adopt or not to adopt new agricultural technologies
(Feder & Slade, 1984; Hayami & Ruttan 1987; Goldman 1993; Abadi Ghadim & Pannell, 1999;
Negatu & Parikh, 1999; Isham, 2000; Chirwa, 2005.) The results of empirical studies in
developing countries have identified the following as primary factors influencing farmers’
decisions to adopt agricultural innovations: farm size, risk exposure and capacity to bear risks,
human capital, labor availability, land tenure, access to financial and produce markets, access to
information, participation in off-farm activities, social capital, household characteristics and
ecological and environmental factors.
The Government of Malawi attributes lack of agricultural innovation and failure to adopt
advanced technologies to the continuing household and national food insecurity (MoA, 2005).
In Malawi, and many other developing nations, food security is typically defined in relation to
staple crops production such as maize. Accordingly, Malawi’s agricultural policies and pro-poor
development strategies have focused almost solely on maize production for the past 40 years.
Such policies and strategies have emphasized hybrid maize use and research by establishing
national agricultural research stations and providing micro-credit and input subsidies in the form
of fertilizer and improved seeds in order to encourage the use of these capital intensive and high
yielding technologies. Despite four decades of agricultural policies and research focusing on
modern agriculture, studies such as those of Chirwa (2007) and Simtowe (2006) have found that

19
a majority of Malawi’s farmers have not adopted the new high yielding technologies and farming
systems. (MoA, 2005; Chirwa, 2007; Simtowe, 2006)
Ephraim Chirwa’s study of adoption of fertilizer and hybrid seeds by smallholder maize
farmers in southern Malawi found that adoption of productivity enhancing technologies,
specifically fertilizer, was positively associated with higher levels of education, larger plot sizes,
and higher non-farm incomes, and negatively associated with households headed by women and
distance from input markets. The study also found that hybrid seed adoption is positively
associated with market-based land tenure systems and fertile soils while it is negatively
associated with age and distance from input markets. Chirwa’s study differs from earlier
research (Green & Ng’ong’ola, 1993) which considers only fertilizer technology adoption, where
Chirwa’s study highlights the joint-decision making process and interdependency of adopting
fertilizer and hybrid seed technology.
Similarly Simtowe (2007) explores the link between adoption of fertilizer and HYV seed
through the lens of risk aversion. The study shows that risk aversion towards fertilizer is
positively associated with low intensity of hybrid maize adoption. Simtowe stresses that even in
instances where free inputs are provided, adoption rates remain low. In Simtowe’s study, factors
such as age, household size, land size, and off farm income were found to be useful in explaining
non-adoption of fertilizer.
Research on adoption of sustainable agriculture techniques, such as Neill and Lee’s
(2001) study of maize-mucuna system in Northern Honduras, found significant and positive
associations with farm size and tenure security. Neill and Lee explain that, like Green
Revolution technologies, possession of a minimum threshold farm size and therefore a longer–
term planning horizon are critical for adoption (p. 809) of sustainable agriculture techniques.
20
METHODOLOGY
A PDI can mobilize communities by identifying positive role models with locally
available, sustainable, accessible solutions to common problems. One of the long-lasting effects
is the framework PD provides for facilitating understanding and the empowerment that
understanding of such a method can provide. Marsh, et al. (2004), has found that communities
that have used PD in nutrition interventions have applied the methodology to other common
problems as well. Consequently, the design of the data collection and analysis are such that the
Permaculture Network in Malawi (PNM) could repeat the process in the future if desired.
The participatory nature of a positive deviance inquiry is underlined by Marsh et al.; “the
positive deviance approach involves partnering with communities to…develop case definitions
[and] identify…people who have achieved an unexpected good outcome despite high risk”
(Marsh, et al., p. 329, 2004). In this PDI, participants were selected from four areas in three
districts: Kande Beach, Nkhata Bay District; Kanengo and Chitedze, Lilongwe District; and
Monkey Bay, Mangochi District. These locations were selected because of their proximity to
Permaculture demonstrations plots, all of which are owned and/or operated by members of the
PNM.
Because of the limited record keeping of the PNM and poor communication
infrastructure in Malawi, participants were selected using a snowball sampling strategy, a
subcategory of the purposive sampling method. By capitalizing on the social network of the
PNM, the snowball method was used to identify respondents who would otherwise have been
difficult to locate. All twenty-seven participants met at least one of the following criteria:

21
� participation in a Permaculture Design or Permaculture Nutrition course � living within walking distance of a Permaculture demonstration plot � working / living at a Permaculture demonstration plot
The questionnaire included both open-ended questions, which provided context and
elucidation, and closed ended questions, which were analyzed quantitatively. The Daily Practices
questionnaire (Appendix C) was created by partnering with key members of the PNM who
assisted in the articulation of Permaculture definitions and practices. The data collection tools
were designed to:
� gather demographic and socio-economic information, � determine levels of adaptation � identify barriers/constraints to Permaculture practice adoption as well as coping
strategies in addressing these constraints; and to � gather information regarding participant food and nutrition security to determine the
relationship of Permaculture adoption to this important measure of household wellbeing.
The questionnaire and interview guide were pre-tested and modified based on pre-test
results. In a few instances, minor changes were made once actual data collection began in order
to facilitate understanding and to account for minor inconsistencies the pre-testing failed to
reveal. A Chichewa translator was used, when necessary, to interview participants. All
participants read or were read, the Letter of Informed Consent in accordance with the Internal
Review Board. When necessary, the letter was verbally translated into Chichewa. All
participants were given a chance to ask questions and were informed that they could withdraw
from the study at any time. No participants declined to participate. All participants received a
copy of their signed Letter of Informed Consent.
The preconfigured questionnaire and interview were conducted at the same time. The
interview and questionnaire were typically conducted at the home of the participant and, when

22
possible, were preceded by a tour of participants’ home/food production areas. Together, the
interview and the questionnaire required between 1.5 to 2.25 hours to complete.
Quantitative Data
Adoption levels were determined using a combination of subjective visual evaluations
and quantitatively confirmed data collection on 14 areas of Permaculture practice. The
assessment tool (Appendix D) permits Permaculture adoption scoring with a maximum score of
48 points7. On the basis of these scores, participants were categorized as “adopters” or as “non-
adopters.” A data set was created based on the quantitative responses and was analyzed to
determine the associations between adoption score and the following participant characteristics:
monthly income, off-farm income generation activities, income agricultural sales, farm size (both
land rented in and owned land), gender, number of dependents, and education (see Table 2 for
variable definitions).
Twenty-eight questions were asked to assess household food and nutrition security (FNS)
in order to answer research sub-question 4: “can food and nutrition security be predicted by
Permaculture adoption”. Of these questions, ten were initially selected to create a food and
nutrition security index. This index, in turn, was utilized in regression analysis to identify the
extent to which Permaculture adoption affected this important indicator of household wellbeing,
holding constant the effect of income and of land owned. In this case, FNS functioned as the
dependent variable, while household income, amount of land owned, and Permaculture adoption
score were the independent variables. Testing the model initially revealed concerns about
collinearity (with food production related factors included both in the dependent and independent
7 Because the PNM training emphasizes Permaculture theory rather than particular practices, there were several opportunities for participants to indicate “other” consistent practices, in which case the participant received one additional point. Accordingly, the highest adopter actually had a score of 49 points.

23
variables). Accordingly, it was decided to use a seven-question FNS score containing only
consumption-related information (see Appendix E).
Table 2: DEFINITION OF VARIABLES AND DESCRIPTIVE STATISTICS
Variable Definition Mean SDadoptscore
Adoption score, out of 40 11.963 11.982
FNS
Food and Nutrition Security Score, out of 28
18.703 4.754
female
Dummy: 1 if the participant is female .44 .506
age Age of the participant in years
41.44 12.735
married
Dummy: 1 if the participant is married .89 .320
employed Dummy: 1 if the household earn primary monthly income from off- farm income generation activities
.777 .423
income Household monthly income in thousands of Kwacha per month
7407.41 5607.408
agriculturalsales Dummy: 1 if the household earns monthly income from ag. sales
.407 .500
acres_owned Size of the plots owned by the household, in acres
1.680 1.320
acres_rented Size of the plot rented (in) by the household for ag. production
2.13 1.793
live_exposure Dummy: 1 if participants only exposure to Permaculture is living within < 5KM from demonstration plot
.444 .506
work_exposure Dummy: 1 if participant works at a demonstration plot
.185 .395
certificate_exposure Dummy: 1 if the participants has earned a Permaculture Design/Nutrition certificate
.259 .446
both_exposure Dummy: 1 if participant holds a Permaculture certificate and works at a demonstration plot.
.111 .320
dependents Number of dependents in the 6.78 4.685

24
household
education Number of years the participant has gone to school
7.44 3.423
The quantitative section of the FNS questionnaire was developed by combining Coates,
Webb and Houser’s Food Access Survey Tool (FAST) (2005) and specific questions from the
Monitoring and Evaluation section of Nordin’s Low Input Food and Nutrition Security Manuel
(2005). The Coates, Webb, and Houser Food Access Survey Tool (FAST) was designed through
careful testing for use in Bangladesh and is founded on the following five major criteria which
reflect contemporary thought in the field of food security.
� Level of adequacy in quantity of food consumed � Level of adequacy in quality of food consumed (diversity, safety, and familiarity) � Extent of security or predictability (anxiety over acquisition) � Level of acceptability in acquisition (social norms are not transgressed), and � Level of food security for all individuals in the household.
(From Coates, Webb, and Houser, 2005, p. 5)
Together with the PNM, the FAST questionnaire was adopted to more appropriately
address food and nutrition security in the Malawian context and therefore includes quantitative
questions about consumption of the six food groups as taught by the MoEST and MoAFS.
Qualitative Data
Qualitative data was collected using guided interviews and focus groups. Interviews took
place at the time of the pre-configured questionnaire and interview questions were guided by
participant responses to the questionnaire. Focus groups were designed to create an open
environment in which participants could discuss together the barriers and constraints to
Permaculture practice and to share ideas on how to overcome them. The original intent was to
divide the focus groups by adopter level. After consultation both with members of the PNM and
with several participants, it was decided that all participants in a particular village would be
invited to the focus group meeting to avoid feelings of exclusion. Given the small sample size,

25
each focus group consisted of 6 to 9 participants falling within the suggested focus group range
of 4-12 participants widely accepted in qualitative analysis (Rossman and Rallis, 2003). Because
time constraints prevented a formal focus group in Nkhata Bay, interviews with Nkhata Bay
participants were more in-depth and included many of the questions addressed in focus groups in
other regions.
Such qualitative data was analyzed primarily by coding participant responses into
previously generated categories based on agriculture practices and on constraints and barriers of
Permaculture Practice. This qualitative data collection provided insights that would not have
been possible from quantitative data alone. Results are presented in the following sections.
Qualitative data collection is at the heart of the PDI providing not only contextual information
for understanding the quantitative data, but also by allowing the farmers themselves to be the
experts.
Limitations
The design of this research emerged from the field and was heavily influenced by needs
and wants of the PNM. Because access to contemporary literature on adoption of agricultural
practices was extremely limited, the data collection was more general than might have been the
case, resulting in a fair amount of unused information. Although the survey instrument was
lengthy, there were, in retrospect, some important gaps in that data collection, such as distance to
markets and civic engagement. Both areas have been addressed in the adoption literature and
may have been useful explanatory factors in this inquiry. Although enough data was collected to
create the variables employed and agriculturalsales, these categories emerged post-data
collection and consequently, there is no qualitative information attached to these variables.

26
The design of the research was sufficiently broad to quantify the Permaculture practices
that are both promoted by PNM / Permaculture trainers and are being used by some who have
been exposed to Permaculture. The survey instrument was not, however, designed to account for
the extent to which participants employ specific practices. As a result, it is likely that a few
participants with very low adoptions scores, if evaluated only qualitatively, would fall into the
non-adopter category. Such an in-depth examination would have required more time, funding,
and skill than were available at the time of research. In the years ahead, as larger numbers of
farmers are exposed to Permaculture training- in part as a result of the MoEST pilot project - a
more in-depth PDI of high adopters could provide, as a complement to this study, rich qualitative
data on the barriers facing Permaculture practitioners, and the coping strategies utilized.
Finally, while the small sample size typical of PDIs has provided rich context and
elucidation, it also has rendered many of the statistical models insignificant. The strength of this
research, however, lies in combining quantitative data with complementary qualitative
understandings which sometimes compensate for the absence of such statistical significance.

27
PRESENTATION AND ANALYSIS OF DATA I. PROFILE OF THE RESPONDENTS FARMER CHARACTERISTICS
Specific farmer characteristics, with the exception of age, have not typically been useful
in explaining farmers’ decisions to adopt certain agricultural practices (Neill & Lee, 2001).
However, several variables were included in the data collection as explanatory variables. Gender
was measured as the dummy variable8 female, where 1 was entered if participants are female. As
seen in Table 3, fifteen male participants and 12 female participants were selected from four
regions within Malawi. In Nkhata Bay, all 5 participants were male due to an inability to identify
females who fit the specific criteria for participation. The ages of participants ranged from 23 to
75 years, with a mean of 41.
Religion was measured as a dummy variable, where 1 was equal to identification as
Christian. All but one participant identified themselves as Christians with one participant who
identified as Muslim. The variable married was measured as a dummy variable where 1 is equal
to the participant identifying as being married. Three participants are separated or divorced,
while the remaining 24 are married. All participants indicated financial responsibility for
dependents such as children, ageing parents, and ailing family members and 20 of 27 participants
indicated guardianship for at least one orphan child. This variable, dependents, was measured as
a continuous variable indicating the number of dependents in the household. Excluding
participant 17, who reported responsibility of 26 orphans, the mean of dependents among
participants is 6.
8 Dummy variable refers to the method of quantifying data that does not have quantitative value. Ex. 0 is equal to male, while 1 is equal to female.

28
Table 3: Sample Characteristics of Positive Deviant Inquiry
Respondents # of Part. Percentage Region Kanengo 9 33.3% Nkhata Bay 5 18.5% Chitedze 6 22.2% Monkey Bay 7 25.9% Sex Female 12 44.4% Male 15 55.6% Age (mean) Average Age 41 Marital Status Married 24 88.9% Single 0 0% Divorced/Separated 3 11.1% No. Dependents (mean) Average No. of Dependents 6 Religion Christian 26 96.3% Muslim 1 3.7% Education None 2 7.4% < Primary completion 11 40.7% Primary completion 6 22.2% Secondary and beyond 9 33.3% Permaculture Exposure < 5 km’s from demo. plot only 11 40.7% Training/Certificate 7 33.3% Work @ demo. plot 4 14.8% All of Above (Live, Work, Cert.) 3 11.2% Land Tenure/Ownership Rent 13 48.1% Size of land holding (mean acres) 1.03 acres Own 27 100% Size of land holding (mean acres) 2.2 acres Income Employed (off-farm income generation) 21 77.8% Income from Agricultural Sales 11 40.7% Average Mo. Income 7,200 MK
This average excludes participant 17 who indicated responsibility for 26 dependents thereby skewing the mean.

29
The variable education was measured in number of years the participant attended school.
In the Malawian education system, primary schooling is complete at 8 years. Two participants
(7.4%) reported having never attended school while eleven participants (44.7%) did not complete
primary school for a total of 52.1 % participants never having completed primary school. This
statistic differs slightly from USAID’s calculation (2008) that 66 % of Malawians do not
complete primary school but could be explained by the heavy distribution of participants who
live within a twenty-mile radius of the capital city. Six participants indicated completion of
primary school and 7 participants completed some level of secondary school. Two participants
completed thirteen years of school as well as some college or technical school. No participant
holds a Bachelors’ degree or higher.
The variable certificate is a dummy variable, where 1 indicates that the participant holds
a certificate from any kind of continuing education certificate course. This variable was included
in order to discern if Permaculture adoption could be associated with continuing education, a
factor that was hypothesized in discussions with the PNM. Sixty-six percent of participants (18
of 27) has received at least one certificate of course completion in the following areas: computer
skills, adult literacy, house painting, brick laying, life skills, community design, ANAMED
(Action for Natural Medicine), accounting, empowerment skills, pastor education training,
gender workshop, and Permaculture Nutrition/Design.
Income was measured as a continuous variable. Participants’ monthly income ranges
from 1000 Mk per month to 25,000 Mk per month, with a mean of 7200 Mk per month. The
household characteristic, employed, is represented by a dummy variable where 1 indicates off-
farm employment. According to Chirwa (2007) non-farm incomes provide farmers with
additional resources, which may be used to purchase new technologies (p. 5), while, similarly,

30
Green and Ng’ong’ola (1993) have found in their study on fertilizer adoption in Malawi that
“probability to adopt was an increasing function of non-farm incomes and regular labor” (in
Chirwa, 2007, p. 5). A majority (21) of participants indicated receiving some monthly form of
off-farm income either through a job or “ganyu” (day labor). The research design did not include
the collection of data on access to produce markets. However a question about income from
agricultural sales was included in the preconfigured questionnaire in order to understand the
bases for farmer incomes. After data collection was completed, further examination of the
literature revealed that access to input and produce markets has been positively associated with
technology adoption (Chirwa, 2007). Thus, a dummy variable, agriculturalsales, where 1 equals
a monthly income from agricultural sales, was entered with the intent of examining the
association between monthly income from agricultural sales and access to a produce market.
The data shows that eleven, or 40.7 %, of participants receive a monthly income from
agricultural sales.
PLOT LEVEL-CHARACTERISTICS
The land ownership and tenure variables, acres_owned and acres_rented, were measured
in acres and represent an estimate made by the participant. All participants indicated ownership
of the homes they live in with plot sizes ranging from 1/8 acre to 5 acres. The mean amount of
land owned among all participants is 2.2 acres; however, the number is skewed by two
participants who own an average of 3.5 acres. Thirteen participants rent land for food production
with parcel sizes ranging from .5 acres to 5.5 acres. The mean of land rented among renters is 1.9
acres while mean of land rented among all participants is 1.03 acres. Again, these numbers are
skewed by a few farmers who rent large tracts of land. When disaggregated by region, 12 of 13
renters live in the Lilongwe District villages of Chitedze and Kanengo while only one renter
resides in the lakeshore villages of Nkhata Bay and Monkey Bay districts.

31
EXPOSURE TO PERMACULTURE
Exposure to Permaculture was measured by several dummy variables. Participants
whose only exposure to Permaculture is through living within 5 km of a demonstration plot were
measured using the dummy variable live_exposure; there are 11 such participants. Four
participants fall under the category work_exposure measured as a dummy variable for those
participants who work at a demonstration plot. Certificate_exposure accounts for the 7
participants who received their introduction to Permaculture via a training/certificate course and
both_exposure is a dummy variable where 1 indicates that the participant both works at a
demonstration plot and holds a certificate. There are 3 participants who work at a demonstration
plot, hold a design certificate and live within a 5 kilometer radius of a demo plot. Twenty five of
27 participants live within a 5 kilometer distance from the demonstration plot which first
exposed them to Permaculture.
All of the participants in the Kanengo region have been part of a social group at the
demonstration plot. The main focus of the groups is to promote nutrition within the community
by educating young mothers about how to care for their children. The group is entirely run by
local women and has never received external funding or support. The qualitative interviews
revealed that at some point Permaculture was introduced as one focus of the meetings. During
the design phase of the research, it was not known that such meetings existed and therefore
Permaculture exposure of Kanengo participants has been placed in the category live_exposure.
II. ADOPTION
FARMER CHARACTERISTICS
In order to answer the overarching research question: “What are the characteristics of
Permaculture adopters?”, the characteristic variables have been disaggregated by adoption
category. Adoption groups were determined after calculating the adoption scores, which showed

32
distinct number clusters. Participants who scored between 1-5 points were categorized as “non-
adopters”, while those were scored between 11 and 26 points are low adopters. Two participants,
who scored 36 and 49 points are the only high adopters, thus it was decided to create only two
groups: adopters and non-adopters (see Table 4 below). In this study, Permaculture adopters are
the positive deviants. As Table 4 shows, the frequency of adoption is 51.9 percent. The mean
score of adopters is 20.79 while the mean of non-adopters is 2.61
TABLE 4 – Frequency of Adoption (no. & % of total sample) Adopters 14 (51.9%)
High Adaptors 2 (7.4%) Low Adaptors 12 (44.4%)
Non-Adopters 13 (48.1%)
Explanatory characteristics, which have been presented by adoption category in Table 5
show that the mean of years of education are nearly identical. The data suggests that neither
formal education, nor continuing education, in the form of certificate courses (as previously
mentioned), are predictors of adoption in this sample. This differs from Chirwa’s (2005)
hypothesis that farmers who have a greater endowment in human capital are receptive to new
ideas, but supports Isham’s work in Tanzania (in Chirwa, 2005) and Zeller, Diagne, & Mataya
(1998) and Green & Ng’ong’ola’s (1993) findings in Malawi that human capital has no strong
association with adoption. An unsubstantiated, yet important factor to consider with the
education variable is age. It has been suggested by members of the PNM that during the
government of the first president of independent Malawi, Dr. Kamuza Banda, the education
system was more efficient, rigorous and received more government support. This suggests that
the quality of education may have been more important than the quantity. The average age of
adopters is 45 and of non-adopters, 37.

33
TABLE 5: SAMPLE CHARACTERISTICS BY ADOPTION GROUP Explanatory Variables
Ave.
Adoption Score
% Female
Mean age
% Married
% Christian
Mean Education (in years)
Mean acres owned
Mean acres rented
Mean Income
P/C Cert.
Adopters 20.79 5
(35.7%) 45 12
(85.7%) 13
(92.8%) 7.42 1.96 2.03 8,600 6
(42.8%)
Non-Adopters 2.46
7 (53.85%) 37
12 (92.3%)
13 (100%) 7.46 1.3 1.25 5,800
4 (30.8%)
A Pearson’s correlation test shows that age is positively associated with Permaculture adoption. The model shows statistical
significance at the .05 level. Neill and Lee (2001) found age negatively associated with the maize-mucuna system in Honduras, while
in other studies, another in Honduras and one in the Philippines, have also found age to be negatively associated with adoption of
reduced tillage and soil protection practices respectively. Using the human capital theory, a positive association between
Permaculture adoption in Malawi coupled with nearly identical levels of education could support the theory that a higher quality of
education accounts for adoption among older participants.
Many studies have shown that adoption of Green Revolution technologies have a strong and positive correlation with income,
as necessary inputs such as fertilizer and HYV seed are expensive. However, much of the literature as discussed in the review found
that the type of income, such as farm generated income and off-farm income generation, are better indicators of adoption.

34
This study makes an attempt to analyze data that was collected before a review of adoption
literature took place and to examine the associations between types of income generation and
adoption.
A Pearson’s correlation showed that the general variable income has a weak association
with adoption, although the test was not statistically significant. Thirteen of 14 adopters (92.9%)
reported receiving income from off-farm income generation activities, such as regular
employment or “ganyu” labor, while the difference among non-adopters was more significant.
The variable, employed, showed 8 of 13 non-adopters (61.5%) earned off-farm income.
Respondents who indicated being employed had a mean adoption score of 13 while those who
are not employed had an average score of 9. Two participants (ID5, ID15), both of whom work
at the same demonstration plot in Chitedze, indicated that the social capital they are endowed
with via employment at the demonstration plot allows them the security of taking risks. When
talking about the risk of not using fertilizer and worrying about where food would come from,
one participant said “I knew that if I didn’t have enough food, that I could buy some because of
my job here” (ID15). He went on to discuss the feeling of security that accompanies working at
the demonstration plot and the knowledge that if he fails, his employers will help him. The
seemingly positive association between adoption and off-farm income generation differs from
other works such as Neill & Lee (2001) and Triomophe & Reuben, et al. (in Neill & Lee 2001)
which have found negative associations with off-farm income and adoption of agricultural
practices such as contouring and the maize-mucuna system.
Eleven participants indicated receiving income from agricultural sales; 7 of whom are
adopters and 4 are not. Respondents who earn a monthly income from agricultural sales scored
an average of 17.8 points on adoption score compared to 8 points for those who do not. The

35
literature suggests that income earned from agricultural sales indicates close proximity to
markets therefore an incentive to intensify agricultural production. Unfortunately this research
lacks both the quantitative and qualitative data regarding access to markets.
Fifteen (60%) participants are male and 12 (40%) are female. An Independent Sample T-
test shows that men scored an average of 4 points higher than women. Gender was not
qualitatively explored in this research, although it would be interesting to explore the reasons for
a higher adoption score among men especially since human capital does not seem to be
associated with adoption scores.
PLOT LEVEL CHARACTERISTICS
While not statistically significant (likely the result of small sample size), a Pearson
correlation tests showed that Permaculture adoption scores were negatively associated (albeit
weakly, .27) with acres rented, and positively associated (weakly, .18) with income. The test did
however show statistical significance at the .01 level of a strong linear relationship (0.51)
between adoption score and acres owned. This data strongly supports the theme of land tenure
security, which emerged from the qualitative data. Secure access to a “munda”, or agricultural
production zone, is necessary over the long term. Because Permaculture is permanent
agriculture, many farmers do not feel that they will realize the benefits of Permaculture if they
do not own their own land and/or do not have secured access to rented land for more than one
growing season. Similarly, Neill and Lee (2001) found that adoption and continuation of the
maize-mucuna systems is positively associated with a perception of secure and tenured access to
the same agricultural lands as it typically takes two to three years to benefits from the systems.
In Kanengo, one woman (ID24, adopter and renter), spoke at length about the lack of
control she has regarding the fertility of the soil “because sometimes, people can use that land
without applying manure.” Another adopter and renter from Kanengo (ID12) indicated that in

36
the past she has preferred to use tobacco stems to fertilize her soil. She rents five acres and
found that using tobacco stems produces more maize than with fertilizer. With soil infertility
affecting a majority of agricultural lands in her area, she believes fertilizing her soil organically
is risky for fear that the landlord will take it away for personal use.
Tobacco stems bring back the nutrients to the soil and whenever you have heavy rains, the nutrients are still there. But with fertilizer, when the rains are heavy, it [fertilizer] runs away. We would be using tobacco stems every year, but they are not always available. Also, if we get a good harvest, the owners will take away the land so that they can use it the following year (ID12).
Several other participants indicated the belief that if they produced a very good harvest
from rented lands, the landlords were likely to assume that the soil is more fertile and use it for
themselves the following year. It is for this reason that another participant, an adopter and land
owner from Chitedze (ID15), has decided only to plant maize on the land that he owns, thereby
ensuring that his most important crop, maize, will benefit from his efforts to improve the soil.
Another benefit of owning his own land, is that this participant has the freedom to experiment
with soil fertility techniques, seeing for himself what works and what does not.
“Because in Malawi, we like maize, we like a food crop. On the land that I rent I plant groundnuts and sweet potatoes. Only on the land that I own I plant maize. I rent a different piece every year. I use compost only on the land that I own. Last year I tried to use fertilizer. That is why the soil went bad. We can use fertilizer and the maize will grow and we will be harvesting. But if you have the fertilizer, the soil is going bad and the maize won’t mature. In 2006, I used 50 Kgs of fertilizer [on 1.5 acres] and yielded 8 bags of maize. In 2007, with compost only [1.5 acres], I yielded 12. This year we didn’t use fertilizer because it’s not good.”
The means by which participants have become exposed to Permaculture is an important
variable to explore by adopter category. From the qualitative data, emerged an unexpected
category of exposure; the club_variable, which has been created and analyzed post general
analysis. Eight participants from Kanengo are members of the club and the wife of the
remaining participant from Kanengo, the highest of all adopters, is the host. Four of the club

37
members are adopters and 4 are not. The focus group discussion showed that many of the
women, before joining the group, were quite skeptical of Permaculture and several admitted to
believing the owner (both a participant, ID17, and highest adopter) to be a “devil worshipper” or
hiding a “band of armed robbers” in the trees he had planted. However, once they visited the
demonstration plot and saw for themselves the benefits of Permaculture practice, they were
inspired to try. An adopter (ID19) in the group said,
“We want to encourage one another to do something new in addition to daily tasks. We didn’t think that [Permaculture] was beneficial but after we saw how he [ID17] has struggled and now benefits. God helps those who help themselves. We [referring to her own agricultural practice] used what we saw, how he has benefited- because he was also poor when he moved to that land. By working hard, he has benefited.”
Ten participants (37%) hold certificates in Permaculture design. Of those, 6 are adopters
and 4 are not. All 4 non-adopters with Permaculture certificates live in Monkey Bay. June
Walker, the founding PNM member and organizer of the Monkey Bay training course, indicated
that this course, in particular, was designed to train young people in the area to learn an
employable skill. It was originally intended that participants from these courses would then be
hired by the Icelandic International Development Agency (ICEIDA) funded hospital to grow
food and medical plants using Permaculture for the patients at the hospital. For a short while, the
project was on track, with several participants employed at the hospital, but over time both
interest and funding were lost (personal communication, June Walker) and today only one of the
participants (ID23) is an adopter, with the lowest adoption score of 11. At the time of the
Permaculture course, the majority of the participants were still students. One of these
participants blames being a student for his lack of Permaculture practice;
“I wanted to plant more fruits after the Permaculture course. By the time I was learning Permaculture, I was in school and was busy in school. When I came back from school the family was not supportive of my desire to practice Permaculture. I know this

38
because when I left home to visit my friends my family would not take care of the seedlings. They let them die. Now that I am in my own house I lack seeds and am not able to build a fence, which prevents me from starting my own Permaculture garden. I want to build a fence and I will get seeds from June who has offered to give me seeds for free. An adopter from Monkey Bay, who holds a Permaculture certificate from another course,
criticized the selection method for participation in the aforementioned course, saying that the
participants who were selected for participation were lured to the course by the promise of
getting a job and not because of interest in improving their own agricultural situations. This
sentiment is supported by the 100% adoption rate of participants who both hold a Permaculture
certificate and work at a demonstration plot. The three respondents, who both work at
demonstration plot and hold certificates, were all employed at the demonstration plots at the time
of certification. In total, 6 participants are employed at demonstration plots. Those who hold
certificates in addition to their employment are adopters while those who have not completed a
certificate course are not adopters9.
Evaluated Practices by Adoption Category
Table 6, below, presents the frequency of which participants employ the evaluated
Permaculture practices. While the quantitative data presented is largely a result of participant
responses, some of data was interpreted subjectively by judging the intent of the practice. For
example, where a respondent indicated that they do not use fertilizer and qualified the statement
by stating that the only reason is because they can not afford fertilizer, Permaculture intent was
not assumed and therefore such responses received 0 points.
9 It is interesting to note that at the time of interviewing, one of the three non-adopters employed at a demonstration was very clearly a non-adopter. However, in the time between the interview and the focus group, about three weeks, the participant’s son, who lives in the same house, became an intern at the demonstration plot and used the knowledge that he had gained thus far to reduce sweeping and expand permanent production areas. He began planting garden beds in the guild system and encouraged his family to put their grey water on the garden beds. This participant is still considered to be a non-adopter.

39
There are a few practices that a majority of participants employ. Practices that over 50%
of both adopters and non-adopters employ include:
� planting trees for soil conservation � no burning of organic matter � inclusion of localized and indigenous plants in food production zones
Also of interest is that nearly 46% (6) of non-adopters included leguminous plants in their food
production zones during the most recent growing season (2006-2007). None of these more
commonly used practices are specific to Permaculture. Tree planting, incorporation of
leguminous plants, and no-burn agriculture have been promoted by other development
initiatives/organizations. For example, deforestation has been cited as a major barrier to
development as far back as the 1930’s when the colonial government completed a series of
surveys on Nyasaland (Berry & Petty, 1992). Since then, in both the colonial and independent
governments, reforestation has been well supported at the policy, extension, and research levels.
In fact, Malawi has the largest man made forest in Africa. It is important to note that while this
assessment calculated the number of participants who have planted trees for soil conservation
reasons, it did not measure the extent to which they have adopted this practice. Additionally, no
respondent indicated having planted a woodlot, as Permaculture theory suggests.
Roughly 70% of participants indicated growing indigenous or localized plants. The
design of this inquiry did not include a methodical categorization of such food plants, but rather
used a quick recall by participants to gain an understanding of what indigenous and localized
participants are intentionally cultivating.

40
TABLE 6: FREQUENCY OF EVALUATED PRACTICES
PRACTICE NO. & % OF TOTAL RESPONDENTS USING THE PRACTICE
NO. & % OF TOTAL ADOPTERS USING THE PRACTICE
NO. &% OF TOTAL NON-ADOPTERS USING THE PRACTICE
GREY WATER USE For food production 12 (44.4%) 11 (78.6%) 1 (7.7%) WATER HARVESTING For food production 10 (37%) 9 (64.3%) 1 (7.7%) Store for dry season use 2 (7.4%) 2 (14.3%) 0 IRRIGATION For year round harvest 9 (33.3%) 9 (64.3%) 0 SOIL CONSERVATION Mulching 8 (29.6%) 8 (57.1%) 0 Reduced sweeping 7 (25.9%) 6 (42.9%) 1 (7.7%) Reduced tillage 2 (7.4%) 2 (14.3%) 0 No burn 21 (77.8%) 12 (85.7.2%) 9 (69.2%) Swales/Vetiver 9 (33.3%) 8 (57.1%) 1 (7.7%) Trees 23 (85.2%) 13 (92.9%) 10 (76.9%) Other 1 (3.7%) 0 1 (7.7%) SOIL FERTILITY10 Organic only 11 (40.7%) 9 (64.3%) 2 (15.4%) Increasing use of organic 5 (18.5%) 3 (21.4%) 2 (15.4%) No fert. (P/C intent) 8 (29.6%) 8 (57.1%) 0 Decreasing fert. use 9 (33.3%) 5 (35.7%) 4 (30.8%) Makes/uses own compost 6 (22.2%) 6 (42.9%) 0 Applies organic matter 16 (59.3%) 12 (85.7%) 4 (30.8%) Turns stovers into soil 9 (33.3%) 9 (64.3%) 0 Nitrogen fixing plants 16 (59.3%) 10 (71.4%) 6 (46.2%) Animal manure 11 (40.7%) 9 (64.3%) 2 (15.4%) Other 5 (18.5%) 5 (35.7%) 0 DIET DIVERSITY (6 FOOD GROUPS CONSUMPTION: SELF REPORTING) Everyday 3 (11.1%) 3 (21.4%) 0 Several times per week 7 (25.9%) 5 (35.7%) 2 (15.4%) GROWING SIX FOOD GROUPS11 6 groups 4 (14.8%) 4 (28.6%) 0 5 groups 4 (14.8%) 3 (21.4%) 0 PERMANENT/YEAR ROUND HARVESTING OF FOOD Frequency of practice 15 (55.5%) 12 (85.7%) 3 (23.1%) GUILD SYSTEM Frequency of practice 2 (7.4%) 2 (14.3%) 0 REDUCED FOOT TRAFFIC Permanent prod. areas 5 (18.5%) 5 (35.7%) 0 sweeping for production 10 (37%) 8 (57.1) 2 (15.4%)
10 The practices in boldface represents the optimal of the two related practices and is worth 2 points, while the indented practice is an accepted Permaculture practice worth 1 point. 11 Beacause the PNM believes that consumption of 6 food groups trumps production of 6 food groups, only those participants who indicated either daily or weekly consumption of six food groups earned points for the practice of growing 6 food groups.

41
Table 6, cont.: Frequency of Evaluated Practices ZONE SYSTEM Frequency of practice 2 (7.4%) 2 (14.3%) 0 PEST MANAGEMENT Strong smelling plants 7 (25.9%) 6 (42.9%) 1 (7.7%) Strong smelling water 3 (11.1%) 3 (21.4%) 0 Strong smelling mulch 0 0 0 Encourages beneficial Species 1 (3.7%) 1 (7.1%) 0
Intercrops 5 (18.5%) 5 (35.7%) 0 Living fence 1 (3.7%) 1 (7.1%) 0 Fence 4 (14.8%) 4 (28.6%) 0 Other 5 (18.3%) 2 (14.3%) 3 (25%) USES INDIGENOUS / LOCALIZED VARIETIES Frequency of practice 19 (70.4%) 12 (85.7%) 7 (53.8%) SHARES KNOWLEDGE Frequency of practice 13 (48.1%) 9 (64.3%) 4 (30.8%)
Qualitative data showed that for the most part, both adopters and non-adopters have
chosen to cultivate just a few indigenous/localized greens: pumpkin, sweet potato, papaya,
mango, black jack, amaranth, spider plant, and groundnuts, avocado and local maize. With over
600 food plants indigenous to Malawi (Nordin, 2005), there exists a significant opportunity for
under-utilized plants to contribute to achieving food and nutrition security. Interviews and focus
groups discussions highlighted a significant barrier to growth of such “bush foods”: culture.
Many individuals, as well as all three focus groups said that such food plants “come from the
bush” and therefore do not have to be cultivated. Additionally, a few participants alluded to the
“shame” associated with eating “poor peoples’ plants” and questions about them were often met
with snickering and shyness. Those who admitted to growing and eating “bush foods” cited the
Bible, particularly Genesis and mankind’s mandated stewardship of the earth, as a source of
support and guidance (ID17, ID5).
There are a significant number of practices that neither adopters nor non-adopters had a
frequency above 50 %:

42
� reduced sweeping for soil conservation � permanent production areas � storing harvested water for dry season use � reduced tillage � consumption of 6 food groups either every day or a few times per week � production of 6 food groups and 5 groups with a protein source � guild system � zone systems � Any pest management practice
These infrequently used practices represent the difference between high adopters and low
adopters and are some of the more important practices in Malawian Permaculture practice. The
qualitative data shows the barriers to reducing sweeping are largely to do with cultural
perceptions of hygiene. An adopter from Chitedze (ID6) attributes the health of his family to the
cleanliness of the area surrounding his house; “We are sweeping and washing sheets. Sometimes
disease affects us if we don’t sweep around here.” Focus group discussion showed that
participants know the large swept areas surrounding their houses could be used for agricultural
production, but that the messages they receive from community health workers and Permaculture
practitioners are conflicting.
Unsurprisingly, participants have a fear of storing water near the house as it is widely
known that malaria-carrying mosquitoes lay their eggs in standing water. Another reason often
provided for not harvesting water is having a grass roof. Participants do not want to catch the
rainwater that runs off of the grass roofs because it is considered to be “dirty” and “useless”.
Very few participants indicated taking any proactive, preventative pest management
measures in either adoption category. The most frequently cited method of pest management is
the inclusion of strong smelling plants, specifically “mpungabwe” or local basil, in problem
areas. One adopter from Monkey Bay (ID23) sprays the plants in his kitchen garden with water
scented with goat dung to keep the goats from destroying his garden. Free roaming goats,

43
coupled with inadequate fencing, were cited as the main reason why participants in Monkey Bay
could not practice Permaculture. No participant from Monkey Bay, however, had a goat proof
fence despite the presence of goat-proof thorn fences in the area. When the issue was pressed in
the focus group discussion, a rift between the adopters (2) and remaining non-adopters resulting
in an admission that the goats, while annoying, are not a true barrier to Permaculture adoption as
the materials to build fences are available and are free. The true barrier, the participants said, is
that they are “lazy”. The highest of Monkey Bay adopters denied this claim and believes that
because they are a fishing community that agriculture and agricultural improvements comes
second to fishing and therefore does not receive much attention.
Many participants indicated using reactive pest control measures such as removing snails
by hand, collecting and killing army worms, gathering and eating grasshoppers, and applying
ashes to the garden once a problem has presented itself. Only 2 participants, the highest of all
adopters, indicated using the guild system of planting. Both high adopters cited the advantages
of intercropping in preventing insect damage as just one reason for using the guild method.
There are several practices that only adopters employ, including the zone system and
guild system, which are specific to Permaculture. Both the guild and zones systems are used
solely by the two participants with the highest adoption scores. The following practices are
employed only by adopters:
� irrigation for year-round harvesting, � mulching � reduced tillage � zero use of fertilizer � compost making � turning stovers into soil � consumption of 6 food groups everyday � production of 6 food groups � production of 5 groups, with a protein source � permanent production areas

44
� pest management practices: strong smelling water, encourages beneficial species, intercropping, living fence, any fence
� Use of guild and zone systems III. YIELDS
As previously mentioned, one question regarding yields was originally included in the
adoption score. However, during the analytical process, it was decided that “increasing
agricultural yields per acre” is not a Permaculture practice as much as it is a goal. As well, the
phrase has very different subjective meanings. Accordingly, questions regarding yields were
removed from the evaluation tools and the responses are discussed below.
Participants were asked if they believed that their agricultural yields per acre had
increased or decreased in the past five years. At the time of enumeration, it was stressed that
“yields” refers not only to maize yields but also to the yields of any food. However, this proved
a difficult obstacle to overcome, as most participants could only recall yields in terms of “bags”,
“Kgs” or “wheelbarrows” of maize. Very few participants indicated that yields of all foods per
acre had either increased or decreased. Answers were recorded using a 5-point scale ranging
from “increased significantly” to “decreased significantly”. In many instances, participants
remembered the amount of maize they yielded during each growing season of the past five years
but did not equate non-maize production with yield calculation.
TABLE 7: RESPONDENTS AGRICULTURAL YIELDS In the past five years, have your agricultural yields (all foods) per acre increased or decreased? Adopters Non-adopters Increased significantly 3 (21.4%) 1 (7.7%) Increased slightly 8 (57.1%) 1 (7.7%) Remained the same 3 (21.4%) 3 (25%) Decreased slightly 5 (38.5%) Decreased significantly 3 (25%)
As Table 7 shows, there was a noticeable difference in response between adopters and
non-adopters as no adopters indicated decreasing yields. Eleven adopters indicated that over the

45
past five years their yields have increased compared to 2 non-adopters. The remaining 3
adopters indicated that their yields per acre have remained the same. Eight non-adopters
indicated that they have experienced decreasing yields per acre over the past five years. The
qualitative data shows that many participants, especially non-adopters, attribute their decreasing
yields to prior fertilizer dependency coupled with an inability to currently afford fertilizer. When
referring to the land he inherited from his parents, a non-adopter from Monkey Bay (ID25) said
that his agricultural yields have decreased because “my parents were not using compost manure
and were only using fertilizer. When they could no longer afford fertilizer, the soil lost its
fertility.” Other participants, such as an adopter from Kanengo (ID24), blames being dependant
on renting land for her decrease in maize yields, but adds “our fruit and vegetable yields have
increased because of planting at home,” a practice which she says she learned from the nearby
Permaculture demonstration plot and which has led to an overall yields increase. Another
participant, an adopter from Monkey Bay (ID11), attributes the increase in agricultural yields of
all kinds to Permaculture knowledge he gained first from a Permaculture training course. “In the
past, I was doing these things [agriculture] without any knowledge. I was doing these things as
usual. I am now doing these things with knowledge; how to make compost, growing leguminous
plants, using grey water.” The knowledge this participant gained in the course was reinforced by
his work as country counterpart with a Peace Corps volunteer and today, he says, “there is no
hunger season in this house”.
An explanation for such a drastic difference in reported yields may be that Permaculture
helped participants increase their soil fertility practices, as most participants were exposed to
Permaculture within the last five years. Another possibility could be that Permaculture exposure
has broadened participants’ narrow definition of food and that adopters are more likely to

46
consider the food from their kitchen gardens in their yield calculations. Because the data
collected relied on participants memory, there is no way of measuring the exact yield of all food
produced, but that data does show, despite accuracy, 78.6% of adopters believe that their yields
per acre have increased compared to only 15.4% of non-adopters.
IV. FOOD AND NUTRITION SECURITY
The concept of food security is founded on the following three pillars: accessibility,
availability, and utilization (IFRC & RSC, 2008.) Measures of food adequacy, which typically
consider food intake in terms of dietary energy supply (DES), rarely measure the quality
(micronutrients and protein) of the food but rather only the quantity (caloric intake). In most
developing nations, Malawi being no exception, populations rely on cereal crops to account for
more than 50% of daily caloric intake (Nawani, 1994). Therefore, says Nawani, ensuring cereal
crop production is just the first step and without taking further steps to ensure nutrition security
as well, food security merely prevents a person from dying (n.p.). Kristof Nordin, key member
of the PNM, echoes this sentiment when he says, “you can bring all of the maize in the world to
Malawi, and people will still be malnourished, sick, and dying,” (K. Nordin, personal
communication, September 25, 2006) Consequently, the following data represent a measure of
accessibility, availability and utilization of food with a particular emphasis on nutrition. As
previously mentioned, the tool used for the food and nutrition security (FNS) evaluation is a
marriage of Coates, Webb & Houser’s (2005) FAST method and Nordin’s (2005) Low Input
Food and Nutrition Security Manual.
The 7 question FNS survey was scored on a 4-point scale, where 4 equals the optimal
answer and 0 equals the least desired response. Respondents’ scores range from 9 to 28, with a
mean of 18.9. The average score among adopters is 21 compared to 16 among non-adopters.

47
TABLE 8 : FOOD AND NUTRITION SECURITY RESPONSES Adopters Non-adopters
In the past 12 months, did you skip meals due to food scarcity? Never 12 (85.7%) 5 (38.5%)
Rarely (few times per year) 0 2 (15.4%) Sometimes (1-2 times/month) 2 (14.3%) 4 (30.8%)
Often (few times/week) 0 2 (15.4%)
1
Mostly (most days) 0 0 In the past 12 months, how often did your household eat three meals per day?
Mostly (most days) 9 (64.3%) 3 (23.1%) Often (few times/week) 2 (14.3%) 6 (46.2%)
Sometimes (1-2 times/month) 3 (21.4%) 2 (15.4%) Rarely (few times/ year) 0 2 (15.4%)
2
Never 0 0 In the past 12 months, how often did your household run out of food with no money to buy more?
Never 11 (78.6%) 5 (38.5%) Rarely (few times/year) 0 1 (7.7%)
Sometimes (few times/month) 1 (7.4%) 5 (38.5%) Often (few times/week) 2 (14.3%) 2 (15.4%)
3
Mostly (most days) 0 0 In the past 12 months, how often did you worry about where food would come from?
Never 7 (50%) 4 (30.8%) Rarely (few times/year) 2 (14.3%) 4 (30.8%)
Sometimes (few times/month) 4 (28.6%) 3 (23.1%) Often (few times/week) 1 (7.4%) 2 (15.4%)
4
Mostly (most days) 0 0 In the past 12 months how often did your household eat 6 food groups in one day?
Mostly (most days) 2 (14.3%) 0 Often (few times/week) 4 (28.6%) 1 (7.7%)
Sometimes (few times/month) 3 (21.4%) 2 (15.4%) Rarely (few times/year) 1 (7.4%) 4 (28.6%)
5
Never 4 (28.6%) 6 (46.2%) In the past 5 years, has the diet diversity in your household increased or decreased?
Increased significantly 3 (21.4%) 0 Increased slightly 2 (14.3%) 1 (7.7%)
Remained the same 9 (64.3%) 11 (84.6%) Decreased slightly 0 1 (7.7%)
6
Decreased significantly 0 0 In the past three years has your household experienced an increase or decrease in frequency of illness.
Decreased significantly 1 (7.4%) 1 (7.7%) Decreased slightly 8 (57.1%) 8 (57.1%)
Remained the same 3 (21.4%) 2 (15.4%) Increased slightly 1 (7.4%) 1 (7.7%)
7
Increased significantly 1 (7.4%) 1 (7.7%)

48
Table 8 presents the respondents answers disaggregated by adopter group. Twelve (85.7
%) adopters indicated having never skipped a meal in the past 12 months due to scarcity of food,
while 5 (38.5%) of non-adopters responded similarly. When asked how often the household eats
three meals per day in question 2, 64.3% (9) adopters indicated eating three meals everyday
compared to 23.1% (3) non-adopters. The majority of the remaining non-adopters however,
indicated eating three meals in a day several times per week. Question 3 asks participants how
often their households “ran out of food” combined with a lack of money to purchase more. At
the time of enumeration, it was stressed that “ran out of food” referred to empty “kholas” (cereal
storage rooms) and non-producing gardens. Eleven (78.6%) of 14 Permaculture adopters
indicated that this never happened to them in the past 12 months, while 5 (38.5%) of 13 non-
adopters answered the same. Nearly 54 % of non-adopters responded that their households ran
out of food and money either a few times per month or a few times per week.
Question 4, regarding participant anxiety over predictability (Coates, Webb & Houser,
2003) showed no significant difference between adoption groups. Nine (64.3%) adopters and 8
(61.6%) of non-adopters indicated that they either never worry about where food will come from
or if they do it is a few times per year. No participant indicated experiencing anxiety of
acquisition of food on a daily basis.
Question 5 was included in order to evaluate how often participants eat 6 food groups, as
promoted by the PNM and by the Ministries of Education and Agriculture. The responses
showed that only 2 participants, both adopters, eat six food groups every day. Four adopters eat
six groups a few times a week, compared to 1 non-adopter while the remaining participants eat
six food groups a few times per month or less. Six participants indicated an increase in diet
diversity over the past 5 years, while the majority of participants showed no change in diet.

49
However, this question was difficult to enumerate, as most participants did not understand the
concept of “diet diversity”. Where participants did not answer, or did not understand, it was
assumed that their diets have not changed. This question indicated an area that would have
significantly benefited from more in-depth pre-testing. Interestingly, of those who did
understand the concept and indicated an increase, 5 out of 6 were adopters.
Responses to the 7th question regarding frequency of illness in the household showed no
significant difference between adopter groups. Only 1 non-adopter and 1 adopter indicated that
disease has decreased significantly over the past three years, while 16 participants, split evenly
between the two groups, indicated a slight decrease in illness. Examination of the qualitative
data showed that 8 participants indicated that either they “don’t know why” the amount of illness
has increased, and/or that it a result of “God’s will”. Seven of these participants are non-
adopters and 1 is an adopter. In contrast, of those participants who attribute “increase in food
availability” or “increase in diet diversity” for the reason behind a decrease in illness, 8 of 10 are
adopters. This qualitative examination of responses suggests that non-adopters tend to be more
fatalistic when it comes to health than adopters- who have indicated causality between quantity
and quality of food ingested and frequency of household disease as a reason for decreased
household illness
One woman, an adopter from Kanengo (ID19) with a food security score of 27, said “the
disease has decreased in the household because we are eating six foods and it is helping our
bodies.” The same woman, however, admits that before she joined the social group, she believed
that only people infected with HIV/AIDS should eat six food groups.
“In the past whenever we saw someone eating six food groups we thought that they were HIV positive. We would go and tell our friends that these people eating six food groups were HIV positive. Now we see if a child is suffering from malnutrition we go and tell their parents how to take care of them. Sometime we try to buy beans and

50
maize and groundnuts to make Likuni phala [porridge] to help them with malnutrition.” (ID19)
Another adopter from Monkey Bay (ID11) said,
“In the past I was relying on only one type of food. In our culture, we just rely on one type of food…so people in the morning rely on frying maize, all the time. In the morning, in the afternoon, nsima [maize meal], and in the evening nsima and all of the time only with one ndiwo [side dish]. (ID11)
More fatalistic responses attributed either no change in illness or a decrease in illness to God. A
non-adopter (ID27) said, “I don’t know, maybe it is because of God,” while another non- adopter
from Kanengo said, “It has remained the same because God has loved us and we are not
suffering.”
Regression Analysis: Food and Nutrition Security Score
Variables
Unstandardized Coefficient.
B t P value /
sig. Adoptscore .216 2.919 .008 Acres_owned .423 .587 .563
While this research is not suggesting that Permaculture adoption is the only means to
achieve a desirable quality of life in rural Malawi, it has sought to identify the benefits that
adopters have experienced, especially in this primary area of focus: food and nutrition security.
A regression analysis model, where FNS score (FNSS) is the dependent variable and income,
acres_owned, and adoptscore, are the independent variables, finds that the FNSS is positively
associated with Permaculture adoption score and with landholdings, albeit weakly. In this
model, a 10 unit change in adoption score is associated with a 2.2 unit increase in FNSS. The
model is statistically significant at the .05 level. Income has neither a positive or negative
association with adoption score as there is not enough variance in the data. Acres_owned
showed a slightly positive association with adoption score where a 10-acre increase in land

51
holding is associated with a 4 unit change in FNSS. The model is not statistically significant and
acres_owned is not a significant predictor of food and nutrition security.
Permaculture adoption is positively associated with acres owned, holding constant other
factors. It is not, however, associated with income. This suggests that, at present, those with
larger land holdings have been better able to put Permaculture teachings into practice than small
farmers. The food and nutrition security regression analysis, however, has also found that food
and nutrition security scores, again holding constant other factors, are positively associated with
Permaculture adoption, weakly associated with landholdings, and not associated with income.
This finding has considerable implications, suggesting, most likely, that those lower income
farmers with smaller holdings who are able to introduce Permaculture practices are more likely
to benefit from food and nutrition security than wealthier farmers who do not.
The regression analysis supports the theoretical approach to Permaculture, which aims to
optimize yields using available space and without dependence on expensive external inputs, by
showing that income and acres owned are not predictors of FNSS. Interviews with adopters
support the quantitative data as several participants attributed their increase in yields and in diet
diversity to their increasing Permaculture practices. The highest female adopter, (ID 5) said this:
One reason that I used to eat poorly was because I was very poor and I didn’t know the food. I also didn’t know Permaculture. Permaculture has helped me because I have learned about different food and about keeping different food, and now I know how to feed the soil and it has helped me to grow my family well without any problems.
Similarly, an adopter from Chitedze (ID6) said that the increase in diet diversity in his household
is because they have “changed the environment so that the foods are more readily available.”
The greatest benefit of Permaculture adoption, however, is best concluded but by four different
adopters (ID5, ID11, ID17, ID19) who all indicated separately, “there is no hunger season in this
household.”

52
CONCLUSION OVERARCHING QUESTION: What are the characteristics of Permaculture adopters?
The research has found that about 50 percent of those exposed to Permaculture,
have adopted some portion of the Permaculture practices being promoted in the country. Only
two participants emerged as “high adopters,” while the remaining adopters have employed a
handful of practices. All participants are landowners, but adoption scores are positively
associated with acres owned and negatively associated with acres rented. Because Permaculture
is permanent agriculture, the perception of secure access to agricultural land has allowed land
owning adopters to experiment with soil fertility techniques and improve their soil organically
without fearing that their efforts will be wasted.
While Permaculture adoption is positively associated with age and land owned, it is not
predicted by years of education, Permaculture certificates or monthly income. Thirteen of 14
adopters, however, did indicate earning a monthly salary via off-farm income generation
activities. The positive association between age and adoption coupled with no association with
years of education may suggest that adopters received a better quality education in different
political eras as the PNM suspected.
Men scored a mean of 4 points higher than women on the adoption scale and could be
explained by the fact that most participants with secondary source of exposure to Permaculture
are men. Many participants indicated that while many women carry out the farm labor, the
approach to farming is defined by the man in the family. Accepting this to be true, women who
are exposed to Permaculture and would like to adopt Permaculture practices must seek
permission from their husbands who may not have been exposed.
SUB-QUESTIONS 1 & 2: What are the constraints and barriers to Permaculture adoption and how have adopters overcome them?

53
Permaculture is very different from contemporary agricultural practice and requires
overcoming cultural barriers associated with being “different”. For the most part, adopters who
indicated facing ridicule from friends, family, and neighbors, were able to do so because they
had visited demonstration plots on several occasions and had seen for themselves the benefits
that Permaculture practice brings.
While land ownership/tenure was identified by participants to be a prerequisite for
Permaculture practice and the biggest constraint to practice, this perception may not be well
grounded in reality. One hundred percent of participants own the land on which their houses sit,
but only a few use the land immediately surrounding their homes for agricultural purposes. Not
only is it part of Malawian culture to keep the area around the house swept and “clean” to reduce
the spread of disease but also, focus group participants indicated that this emphasis on
“cleanliness” is promoted and reinforced by health officers who visit their villages and homes.
Participants feel that the competing messages of Permaculture practitioners and health extension
officers were confusing. The very few participants who grow food on land they own and which
surrounds their homes, identified moral support from demonstration plot owners as their source
of encouragement (ID5, ID15, ID11, ID17) or repeated and/or elongated exposure to
Permaculture via demonstration plot visits / employment (ID5, ID15, ID8).
The literature identified access to information as a primary factor associated with
adoption of yield increasing techniques. When asked why Permaculture is difficult to adopt,
many participants indicated that lack of education plays a significant role. The data shows that
the method of exposure to Permaculture plays an important role in adoption as most adopters
have a secondary source of exposure such as working at a demonstration plot or participation in a
certificate course in addition to living near a demonstration plot. The two participants with the

54
highest adoption scores indicated their continued exposure or support from PNM members as a
source of support in making these agricultural changes, while many low adopters indicated that
visiting the demonstration plot a number of times, in some cases over a number of years, has
provided them the confidence to adopt particular practices. This would suggest, as does the
literature, that adopters have benefited increased access to information and skills,
SUB-QUESTION 3: What are the benefits for Permaculture adopters?
Food and nutrition security scores have shown to be positively associated with adoption
scores. Both quantitative and qualitative data have shown that adoption of these practices have
led to tangible benefits which the adopters themselves appreciate in terms of both quantity and
quality of food and regardless of income or education. Adoption scores were found to be
associated with acres owned but qualitative analysis of yields (as recalled by participants),
showed that 11 of 14 adopters had increasing yields over the past five years compared to 2 of 13
non-adopters. Because farm size was taken into consideration when calculating increasing
yields, this data suggests that increasing yields are not a function of increasing acreage but other
factors such as intensification and/or increased soil fertility. It is important to reiterate that
participants had a difficult time recalling yields of all food grown, but had an easy time recalling
yields of maize or staple crop. However, the quantitative data, supported by the qualitative data,
suggests that participants who have adopted Permaculture practices have benefited not only in
terms of caloric intake through staple crop consumption, but also in terms of dietary diversity.
Overall, adopters scored an average of 5 points higher on the 28-question food and nutrition
security questionnaire. Additionally, only participants in the adopter category both grow and
consume six food groups.

55
SUB-QUESTION 4: Can food and nutrition security be predicted by Permaculture adoption?
The regression analysis model suggests, with statistical significance, that food and
nutrition security can be predicted by adoption score- holding other variables constant. This
finding suggests that farmers who have been able to adopt Permaculture practice, despite lower
income and fewer acres owned likely benefit more from improved food and nutrition security
compared to wealthier (income and land) non-adopters.
APPLICABILITY AND QUESTIONS FOR FURTHER RESEARCH
As the contemporary agricultural system continues to degrade what is left of Malawi’s
forests, erode precious remaining top soil, and contaminate vital water sources, Malawians
remain food insecure at the household level. The School Health and Nutrition Strategy seeks to
address this problem holistically while other offices within the government seek to temporarily
bandage this problem by subsidizing fertilizer and promoting the dangerous and destructive
modernist approach. The findings in this research will prove useful to those involved in
Permaculture initiatives in Malawi, such as the MoEST’s School Health and Nutrition Strategy,
but also in its ability to contribute to the continuing discussion on sustainable agriculture and
food and nutrition security. The conventional wisdom regarding improved food and nutrition
security is centered on provision of external inputs for increased yield and income generation
(perhaps through agriculture) rather than and assets-based intensification of Malawi’s existing
agricultural diversity for self sufficiency. In a country where nearly 90 percent of the
populations are farmers, all food groups exist in nature and there is a twelve-month growing
season, household food and nutrition security should not be the biggest threat to development.
This study of Permaculture positive deviants has shown that adoption of more intensified
planting strategies combined with organic fertilization and nutrition education has likely

56
increased respondents food and nutrition security by increasing agricultural yields and
diversifying food production and consumption. As agricultural lands become scarcer due to
increased population density, the need to optimize growing space in a sustainable way becomes
even more needed that is already has been. Permaculture theory and practices has demonstrated
to be beneficial to Malawian farmers and it has to many others worldwide.
The rapidly increasing number of demonstration plots spread throughout the country due
to the MoEST pilot program will increase the number of Malawians exposed to Permaculture
and provide, as it did these participants, a source of encouragement to make agricultural change.
Similarly, organizations wishing to use Permaculture or other sustainable agriculture approaches
in Malawi should consider the results of this research and establish several demonstration
gardens in project areas. Additionally, training should be aimed not only at the poorest of the
poor, but also landowners who have shown to be better able to adopt Permaculture practices.
Because the MoEST is promoting this approach nationally, there should be intersectoral support
of the initiative within the other ministerial department, especially from the Ministry of
Agriculture and Food Security. In the same manner that maize, soy beans, and cassava are
studied empirically, a full study of a Permaculture demonstration plot should be undertaken at
one of Malawi’s many agricultural research stations. The long-term study should collect data
measuring labor, inputs, soil fertility, and should include and analysis of the nutritional value
foods produced.
Qualitative data showed that participants who own their own land are more willing to
experiment with soil fertility practices but very few are willing to introduce food plants to the
land immediately surrounding their homes for fear of insects and disease. With agricultural
lands at a premium, optimizing food production land is necessary for household food and

57
nutrition security. Claims by MoH extension officers that planting food near the home is
unsanitary and leads to disease should be empirically investigated. Results of this investigation
should inform health extension officers work and be used in collaboration with the MoEST pilot
program.
CONCLUSION
There is a small faction of people who believe, the PNM included, that the resources for
development- including food and nutrition security- already exist within each community,
organization and country. Positive Deviance and Permaculture, as ideologies, are very similar in
that they are both assets based approaches and represent significant paradigmatic shifts from
contemporary development thought. Malawi is a rich country when looked at through the lens of
Permaculture. Malawi does not need to rely on Jeffrey Sachs to build a Millennium Village or
on the United States or China for agricultural inputs but rather Malawi and Malawians should
make use of the what assets already exist by mimicking the ecological processes, interactions
and services of its ecosystems while using appropriate science and technology to enhance
agricultural understanding and production. The result, as it has been for some Permaculture
adopters, will be an agriculturally productive, diverse, and environmentally benign food system
that will allow for a healthy labor force and true “bottoms-up” development.

58
BIBLIOGRAPHY
Abadi Ghadim, A., Pannell, D. (2003). Risk attitudes and risk perceptions of crop producers in Western Australia, in B.A. Babcock, R.W. Fraser & J.N. Lekakis (eds), Risk Management and the Environment: Agriculture in Perspective, pp. 113-13. Kluwer, Dordrecht
Alwang J., Siegel, P. (1999) Labor shortages on small landholdings in Malawi: Implications for poverty reforms,” World Development, 27(8) pp. 1461-1475. Banda, T. (2005) Ministry of Health Nutrition Policy, unpublished. Berggren, W., Wray, J. (2002) Positive deviant behavior and nutrition education. Food and
nutrition Bulletin, 23 (4) United Nations University Press. Retrieved on January 28, 2008 from http://savethechildren.org/publications/technical-resources/hunger-malnutrition/FoodandNutritionSupp.pdf
Berry, V., Petty, C. (1992) The Nyasaland survey papers 1938-1943: Agriculture, food, and
health. London, Academy Books Limited. Cederstrom, T. (1999) Addressing the immediate causes of malnutrition: The positive deviance
approach to household food security. Save The Children Chavez-Tafur, J., Hampson, K., Roem, W., Thijssen, R., and Ingevall A.; Eds. (Special Issue,
2006) Understanding Sustainable Agriculture. LEISA: Magazine on Low Input Sustainable Agriculture. p. 10-11
Chirwa, E. (2005) Adoption of fertilizer and hybrid seeds by smallhoder maize farmers in southern Malawi. Development of Southern Africa, 22 (1).
Clawson, V. (August, 2002) Application of the positive deviance approach to anti child
trafficking programming in Nepal- a trial in Nuwakot District. Retrieved on September 27, 2007 from http://www.childtrafficking.com/Docs/clawson_2002_positive_deviance_approach_in_anti_trafficking_4.pdf
Coates, J., Webb, P., Houser, R. (2003) Measuring food insecurity; going beyond indicators of
income and anthropometry. Washington, D.C.; Food and Nutrition Technical Assistance Project, Academy for Educational Development.
Cromwell, E., Kamwemba, P., Mwanza, R., and Chirwa, R., (2001) Impact assessment using
participatory approaches: ‘Starter pack’ and sustainable agriculture in Malawi. Retrieved on August 28, 2007 from http://www.eldis.org
Dodge, D. (1985) The over-negativized conceptualization of deviance: A programmatic
exploration” Deviant Behavior 6:17-37.

59
FAO (1988) Traditional food plants: A resource book for promoting the exploitation and
consumption of food plants in arid, semi-arid, and sub-humid lands of Eastern Africa. FAO, Rome.
____ (2005) Food and agricultural development in sub-Saharan Africa: Building a case for more public support. Retrieved on January 30 from http://www.fao.org/docrep/009/a0627e/a0627e00.htm
____ (2006) Malawi: Monitoring progress toward hunger reduction goals of the World
Food Summit (WFS) and the Millennium Declaration (MD). Retrieved on August 28, 2007 from http://www.fao.org/faostat/foodsecurity/MDG/EN/Malawi_e.pdf
Feder, G., Slade, R. (1984) The acquisition of information and adoption of new technology.
American Journal of Agricultural Economics, 66 (3), 312-320. Feder, G., Just, R., and D. Zilberman. (1985) Adoption of Agricultural Innovations: A Survey.
Economic Development and Cultural Change 33 (2). Pp. 255–98. Goldman, A. (1993) Agricultural innovation in three areas of Kenya: Neo-Boserupian theories
and regional characterization. Economic Geography, 69. Goode, E. (1991) Positive deviance: A viable concept. Deviant Behavior 12: 289-309. Green, D., Ng’ong’ola, D. (1993) Factors affecting fertilizer adoption in less developed
countries: An application of multivariate logistic analysis in Malawi. Journal of Agricultural Economics, 44, 99-109
Hayami, Y. & Ruttan, V.W. (1985) Population growth and agricultural productivity. In D.
Johnson & R. Lee (eds.) Population growth and economic development: issues and evidence, 57-101. Madison, Wisconsin: University of Wisconsin Press,
Hirt, H., M’Pia, B. (2001) Natural medicine in the tropics. Johannesburg, Action for
Natural Medicine
Heckert, M. (1989) The relativity of positive deviance: The ase of the French impressionists” Deviant Behavior 10: 131-144.
IFRC & RCS. (2008) Food Security Assessment. International Federation of Red Cross and Red
Crescent Societies. Retrieved on March 3, 2008. Jackson, S. (1984) Permaculture: Sophisticated ecological understanding blended with common
sense designs creates productive landscapes. Context Institute: Living with the Land, 8. Retrieved on August 28, 2007 from http://www.context.org/ICLIB/IC08/Jackson.htm

60
Lapping, K., Marsh, D., Rosenbaum, J., Swedberg, E., Sternin, J., Sternin, M., et al. (2002) The positive deviance approach: Challenges and opportunities for the future. Food and Nutrition Bulletin, 23, no. 4 Retrieved August 28, 2007, from www.positivedeviance.org/materials/bib.html
Marsh, D., Schroeder, D., Dearden, K., Sternin, J., and Sternin M. (2004) The power of positive
deviance. Accessed on Sept. 27, 2007 from http://www.bmj.com/cgi/reprint/329/7475/1177
Ministry of Agriculture (2005) A New Agricultural Policy: A Strategic Agenda for Addressing
Economic Development and Food Security in Malawi. Unpublished. Ministry of Education, Science and Technology (2007). School Health and Nutrition Strategy.
Unpublished. Mollison, B. (1997) Permaculture: A designer’s manual. Tasmania, Tagari Publications Nawani, N. (1994) Indian experience on household food & nutrition security. Accessed on
March 3, 2008 from www.fao.org/docrep/xo172e01.htm#p20_7375 Negatu,W., Parikh, A. (1999) The impact of perception and other factors on the adoption of
agricultural technology in the Moret and Jiru Woreda districts of Ethiopia. Agricultural Economics 21(2): 205-216
Neill, S.; Lee, D. (2001) Explaining the adoption and disadoption of sustainable agriculture: The
case of cover crops in Northern Honduras. Economic Development and Cultural Change Nordin, S. (2005) Low input food and nutrition security: Growing & eating more using
less. Lilongwe, World Food Programme: Malawi. Ochieng, C. (2006) Development through positive deviance and its implication for economic
policy making and public administration in Africa: The case of Kenyan agricultural development, 1930-2005. World Development 35(3): 454-479 Retrieved on March 10, 2008 from www.sciencedirect.com
Peters, P. (1999) Agricultural commercialization, rural economy and household livelihoods. Harvard Institute for International Development. Retrieved from Eldis on 12/30/2006. Stable URL: http://eldis.org
Positive Deviance Initiative (2007) Projects Retrieved on September 17, 2007 from stable URL:
http://www.positivedeviance.org/projects/ PROWID (1999) Ending female genital cutting: A positive deviance approach in Egypt.
Retrieved on September 30 from http://www.positivedeviance.org/projects/egypfgc/egypfgc_rep2.pdf

61
Pretty, J. (2005) Regenerating agriculture: Policies and practices for sustainability and self- reliance. London, Joseph Henry Press.
Rossman, G., Rallis, S., (2003) Learning in the field: An introduction to qualitative research.
Thousand Oaks, California, Sage Publications, Inc.
Sachs, J. (2005) The end of poverty: Economic possibilities for our time. New York, Penguin Press.
Sagarin, E. (1985) Positive deviance: An oxymoron. Deviant Behavior, 6:169-181.
Sauer, Tchale and Wobst (2006) Alternative soil fertility management options in Malawi: An economic analysis. Journal of Sustainable Agriculture, 29: 29-52 Simtowe, F., (2006) Can risk-aversion towards fertilizer explain part of the non-adoption for
hybrid maize: Empirical evidence from Malawi. Retrieved on February 1, 2008 from http://mpra.ub.uni-muenchen.de/1241/
UN (2004) Map number 3853. Retrieved on August 28, 2007 from http://www.un.org/Depts/Cartographic/map/profile/malawi.pdf
UNDP (2007) Discover Malawi. Retrieved on March 14 2008 from
http://www.undp.org.mw/discover_mw.html USAID (2008) About Malawi: Education, Retrieved on March 14 2008 from
http://www.usaid.gov/mw/aboutmalawi/education.htm Van der Vynckt, S., Wishik, S. (1976) The use of nutritional “positive deviants” to identify
approaches for modification of dietary practices. American Journal of Public Health, 66 (1). Retrieved on September 30th from http://pqasb.pqarchiver.com/ajph/search.html
West, B. (2003) Synergies in deviance: Revisiting the positive deviance debate. Electric Journal
of Sociology. Retrieved on August 28, 2007 from http://www.sociology.org/content/vol7.4/west.html
Williamson, J. (2005) Useful plants of Malawi. Zomba, University of Malawi Press. Zeitlin, M., Ghassemi, H. and Mansour, M. (1990) Positive deviance in child nutrition: With
emphasis on psychosocial and behavioral aspects and implications for development. Accessed on September 27, 2007 from http://www.positivedeviance.org/materials/bib.html
Zeller, M., Diagne, A. and Mataya, C. (1998) Market access by smallholder farmers in Malawi: Implications for technology adoption, agricultural productivity, and crop income. Agricultural Economics, Vol. 19 (2), pp. 219-229

62
APPENDICES APPENDIX A: AUTHOR’S PERSONAL EXPERIENCE
This research has evolved as a result of an 8-month practicum working with a small
community education center called Never Ending Food (NEF). NEF was founded, in 2006, by
the husband and wife team of Kristof and Stacia Nordin who came to Malawi as Peace Corps
volunteers in 1997. Kristof, a social worker by training, and Stacia a nutritionist, were placed as
HIV/AIDS educators at the local clinic in the village of Chitedze. Over the course of their work
with HIV/AIDS and other patients, the Nordin’s found many of the problems and illnesses that
patients experienced were a consequence of poor nutrition.
In order to address nutrition related illnesses, the Nordins expanded their teaching
curriculum to include the importance of diversified diet- as the Malawian diet consisted of nearly
three-quarters plate processed maize meal. They soon discovered that when advocating for diet
diversification, one must also include the practical problem of access to a diverse food base. In
response to poor access to diverse foods and the national focus on staple crop production, the
Nordins began looking for methods and approaches to agriculture that increase farmers access to
nutritious food, reduce dependency on maize and external inputs, and could be cultivated on a
small plot of land. In their search, the Nordins found that all of the resources needed for a
nutritious and healthy lifestyle were growing indigenously in Malawi and that it was only in the
past one hundred years that Malawi began to have nationwide problems with hunger caused by
soil infertility and volatile environmental factors such as drought and flooding. In their search
for a holistic, assets-based approach to improving the nutrition status of the population of people
served by the Chitedze clinic, the Nordins found Permaculture.

63
Permaculture offers a means for the average Malawian farmer to diversify his/her diet
and increase their health with only a small amount of land and without relying on external inputs
to improve soil fertility. In addition, Permaculture offers a strategy for bottom-up development
by creating a healthy, nourished labor force free from the barriers of food and nutrition insecurity
and expensive agricultural inputs. Seeing Permaculture as a response to their immediate concerns
at the Chitedze clinic as well as to other barriers to development that Malawi faces, the Nordins
contributed significantly to strengthening the already established Permaculture Network in
Malawi (PNM). Today, the PNM has nearly one hundred members, many of whom are
organizations that serve thousands of Malawians. Permaculture is slowly gaining recognition in
Malawi (and worldwide) as a form of sustainable agriculture that holistically addresses issues of
food and nutrition insecurity as well as decreased soil fertility, dependence on external
agricultural inputs, deforestation, HIV/AIDS infection rates and can improve the lives of people
living with HIV/AIDS (PLWHA).
I interned with Never Ending Food for a total of 8 months. My role in the organization
consisted of a month long introduction, both theoretically and practically, to Permaculture in the
Malawi context. I assisted in facilitation of trainings and performed consulting jobs throughout
Malawi on NEF’s behalf. My two largest projects were:
� A several month consultancy for Children in the Wilderness- an organization that seeks
to provide Orphans and Vulnerable Children (OVC’s) with a unique summer camp
experience. The camp curriculum is expanding to include life skills and as a result they
have contracted the work of NEF to assist in integrating Permaculture into the
organization.

64
� Design and implementation of the Model Village, the newest NEF project in which I
worked with neighborhood children to design a sustainable food producing system from
which tenants will learn the principles of Permaculture and therefore use available
resources to produce nutritious food for free.
Living in Malawi for nearly a year allowed me to see the agricultural cycle as currently
practiced by most Malawians. Comparing this cycle with the principles and practices of
Permaculture left me wondering about the wisdom of the conventional method. I saw neighbors
labor in the fields to prepare them for maize cultivation, wait for the rains to come, and then
harvest maize in the early dry season. So many of these neighbors did not produce enough maize
for both home consumption and for agricultural sales, which is often their only means to earn
money for school fees and medical bills.
Throughout my internship, the theme of adoption was omnipresent. Why do some farmers
see the agricultural and nutrition benefits of Permaculture while other do not? More interestingly,
why do some farmers acknowledge the benefits but continue to practice agriculture and nutrition
using the conventional Malawian approach? There were times that I wondered why something
which seemed so obvious to me as an outsider, was so difficult for an insider to practice? Of
course, I knew the answer was not simple. I decided to focus on what makes those few farmers
who have adopted Permaculture practice different and in the search to find a research method
that, like Permaculture, was assets based, I was introduced to the concept of Positive Deviance.

65
APPENDIX B: DESCRIPTION OF EVALUATED PERMACULTURE PRACTICES 1. Grey Water Use: Water is a valuable resource that is often wasted. Grey Water is water
that has already been used for household activities such as cooking, mopping, bathing, laundry etc. This water, which does not contain toilet discharge or high concentrations of toxic chemicals, can be used/drained into food producing garden beds for year round production. Farmers who use grey water year round food production received one point.
2. Water Harvesting: "Water harvesting" is the process of collecting and concentrating runoff
water from a runoff area into a run-on area, where the collected water is either directly applied to the cropping area and stored in the soil for immediate use by the crop, i.e. runoff farming, or stored in an on-farm water reservoir for future productive uses, i.e. domestic use, livestock watering, aquaculture irrigation. Farmers who store water (either in a container or in the soil) for agricultural production received one point for each method used. Ex. those who both store water in a container and in the soil received two points.
3. Irrigation: Irrigation, the act of supplying water (clean and/or grey) to production zones, is typically not practiced in Malawi. Farmers who irrigated food production areas for year round harvesting received one point. 4. Soil Conservation: According to the World Bank, Malawi looses 20 metric tons of top soil
per hectare, per year. In order to conserve topsoil, the PNM teaches the following practices:
a. Mulching: Any substance that is spread or allowed to remain on the surface of the soil effectively protecting the soil from the erosive and dehydrating effects of wind and sun can be defined as mulch. The technique also reduces weeds, saving time and energy.
b. Reduced Sweeping: It is a common cultural practice in Malawi and elsewhere to sweep organic matter away from the house leaving a large area of exposed, dry, hard soil. This practice reduces potential food production zones, leaves rooftops exposed to damaging winds, and weakens the structural integrity of houses by removing soil from the foundation.
c. Zero burning of organic matter: Many Malawians practice slash and burn agriculture. Due to increasing land pressure, fallow periods for soil regeneration are not an option resulting in the erosion and depletion of soils. The PNM encourages the slash and mulch method, which returns nutrients to the soil and protects it from erosion.
d. Reduced/Zero tillage: Tilling the soil removes organic matter that protects the soil from the eroding effects of wind, water, and sun. Many Malawians plant their maize in neat, tilled rows that damage the topsoil, exacerbate erosion and drought, and reduce food production area.
e. Swales / Vetiver: A swale is a wide depression in the ground used to stop and sink flowing water. It is a permanent feature (as opposed to the typical “Boxed Ridges” used in Malawi) and is usually highly vegetated with long-rooted plants, such as vetiver grass, to strengthen the structure.
f. Trees planting: Planting trees is a widely known method for conserving soil and preventing soil erosion.

66
g. Other: Participants were asked to identify any other practices they may have employed to prevent soil erosion.
Participants received one point for each of the above soil conservation technique
employed. 5. Soil Fertility: There are many effective ways to add fertility to soil without depending on
chemical fertilizers. Some of the commonly used methods are:
a. Incorporation of leguminous plants: It is widely known that incorporating leguminous plants into the garden fixes nitrogen into the soil. Studies have found that such practices are as effective, if not more effective, than high cost chemical fertilizer.
b. Compost/organic manure: The use of compost or organic manure, made from decomposed household scraps, agricultural by-products, human and animal excrement, and any other organic matter, adds nutrient rich soil well suited for gardening and farming. Participants who make compost received two points and those who throw composed organic matter on their soil (as opposed to burning it) received one point.
c. Animal manure: Many Malawians have access to goat, sheep, chicken and cow manure.
d. Manure teas: Manure teas provide soluble nutrients which can be used as a liquid fertilizer
e. Other: Participants were asked to enumerate any other measures taken to improve soil fertility.
Participants received one point for each of the above methods employed to add nutrients to their soil.
6. Diet Diversity- consumption and production: The practice of Diet Diversity was evaluated
by assessing both the production and consumption of a diverse diet through Permaculture methods.
a. Increased diet diversity: Never Ending Food and the PNM focus heavily on
improving nutrition through Permaculture practice. The average Malawian consumes nearly 75 % of daily caloric intake from carbohydrates from staple crops such as maize (Sauer, Tchale, & Wobst, 2005) Increased diet diversity is a key Permaculture practice in Malawi.
b. Growing five/six food groups: In Malawi, where most farmers are subsistence farmers, the only means to consuming six food groups is to produce them. Protein does not have to come from an animal source and this was taken into consideration when evaluating participants adoption rates and production of food groups.
Participants received 2 points for indicating consumption of 6 food groups on a daily basis. Those who reported eating six food groups a few times per week received one point. Of those participants who received point for consumption of 6 food groups, 2 points were assigned to

67
those growing 6 food groups and 1 point to those who grow 5 as long as at least one included the production of a protein source.
7. Three Season (year round) Harvesting: Economically speaking, a majority of the fields in
Malawi are productive for only one month; the harvest month. Permaculture encourages “permanent agriculture” and results in harvest during all three of Malawi’s seasons. This practice does not have to include an irrigation method, but rather a knowledge of Malawi’s indigenous edible plants- which are available for harvest throughout the year. Participants who harvest food year round were given 3 points.
8. Guild System: The guild system is unique to Permaculture and is a method of intercropping
by manipulating natures systems for food production. This concept is a key component to food production using the Permaculture method while including soil fertility, optimum use of space, and plant protection in the garden bed design. The seven parts of the Permaculture guild are:
a. Food for humans: The MoE promotes a diverse diet based on 6 food groups and
each garden bed should be designed to include as many food groups as possible. b. Food for the soil: Plants and organic matter that add nutrients to the soil such as
nitrogen fixing plants, decaying matter, compost, compost tea, mulch, manure, etc increase the soil fertility, reduce cost associated with fertilizer, and can reduce labor.
c. Diggers: Deep or wide rooted plants or animals, such as trees and chickens, will dig into the soil allowing water and beneficial insects in as well as bring minerals to the surface. In Malawi common diggers are cassava, sweet potatoes, yams, any trees.
d. Ground Cover: These plants protect the soil from the eroding effects of wind, rain, and sun, while holding in the moisture and often providing food. Additionally, a good groundcover can prevent unwanted plants from growing in the guild. Sweet potato vines, pumpkin, cucumbers are just a few examples of groundcover that grow well in Malawi. Mulch can also be a groundcover.
e. Climbers: Incorporating plants that produce food vertically increases the amount of food one can harvest from limited soil space, thus creating a new food production space. Climbers such as beans, passions fruit, loofa, air potatoes, and cucumbers grow well Malawi.
f. Supporters: Every climber needs a supporter and this should be considered when planting the guild. Supporters can be food producing or nutrient fixing plants/trees or a supporter could be a house, bathing room, fence, etc.
g. Protectors: Anything that protects the guild, is a protector. Such protecting plants include thorns, flowers, strong smelling plants. Protectors could also include beneficial specials such as frogs, birds, lizards, etc.
Participants were awarded seven points only if they are using all seven parts of the guild (all or nothing). Participants not employing the entire guild system received no points.
9. Zone System: The Zone system is a method of organizing labor and conserving valuable
resources, especially energy. There are six parts to the Permaculture Zone System, which can be thought of as concentric circles moving out from the center of energy, Zone 0.
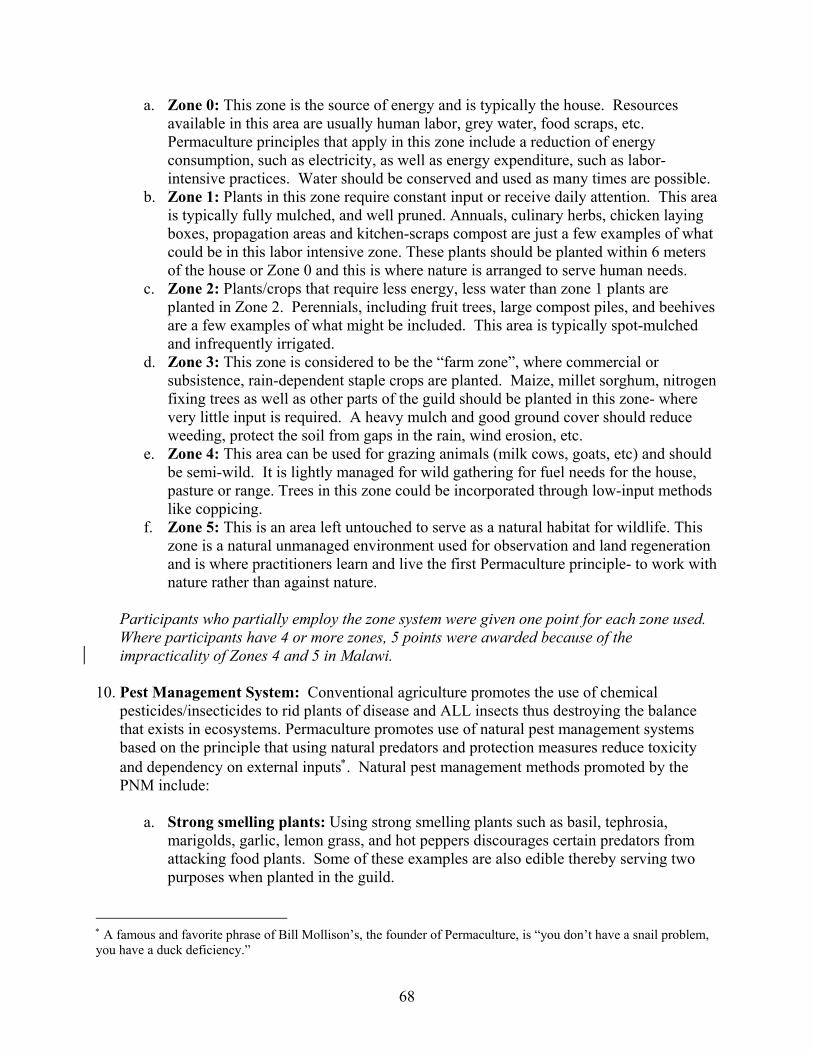
68
a. Zone 0: This zone is the source of energy and is typically the house. Resources available in this area are usually human labor, grey water, food scraps, etc. Permaculture principles that apply in this zone include a reduction of energy consumption, such as electricity, as well as energy expenditure, such as labor-intensive practices. Water should be conserved and used as many times are possible.
b. Zone 1: Plants in this zone require constant input or receive daily attention. This area is typically fully mulched, and well pruned. Annuals, culinary herbs, chicken laying boxes, propagation areas and kitchen-scraps compost are just a few examples of what could be in this labor intensive zone. These plants should be planted within 6 meters of the house or Zone 0 and this is where nature is arranged to serve human needs.
c. Zone 2: Plants/crops that require less energy, less water than zone 1 plants are planted in Zone 2. Perennials, including fruit trees, large compost piles, and beehives are a few examples of what might be included. This area is typically spot-mulched and infrequently irrigated.
d. Zone 3: This zone is considered to be the “farm zone”, where commercial or subsistence, rain-dependent staple crops are planted. Maize, millet sorghum, nitrogen fixing trees as well as other parts of the guild should be planted in this zone- where very little input is required. A heavy mulch and good ground cover should reduce weeding, protect the soil from gaps in the rain, wind erosion, etc.
e. Zone 4: This area can be used for grazing animals (milk cows, goats, etc) and should be semi-wild. It is lightly managed for wild gathering for fuel needs for the house, pasture or range. Trees in this zone could be incorporated through low-input methods like coppicing.
f. Zone 5: This is an area left untouched to serve as a natural habitat for wildlife. This zone is a natural unmanaged environment used for observation and land regeneration and is where practitioners learn and live the first Permaculture principle- to work with nature rather than against nature.
Participants who partially employ the zone system were given one point for each zone used. Where participants have 4 or more zones, 5 points were awarded because of the impracticality of Zones 4 and 5 in Malawi.
10. Pest Management System: Conventional agriculture promotes the use of chemical
pesticides/insecticides to rid plants of disease and ALL insects thus destroying the balance that exists in ecosystems. Permaculture promotes use of natural pest management systems based on the principle that using natural predators and protection measures reduce toxicity and dependency on external inputs . Natural pest management methods promoted by the PNM include:
a. Strong smelling plants: Using strong smelling plants such as basil, tephrosia,
marigolds, garlic, lemon grass, and hot peppers discourages certain predators from attacking food plants. Some of these examples are also edible thereby serving two purposes when planted in the guild.
A famous and favorite phrase of Bill Mollison’s, the founder of Permaculture, is “you don’t have a snail problem, you have a duck deficiency.”

69
b. Strong smelling water: Natural “insecticides” can be made by crushing strong smelling plants, such as those mentioned above, and mixing them into a watering can. When this mixture is allowed to sit overnight and then sprinkled on the plants, insect damage will likely stop.
c. Strong smelling mulch: Any strong smelling plant can also be used as a protective mulch by sprinkling it through garden beds.
d. Encouragement of beneficial species: Creating and attractive place for birds, lady bugs, lizards, etc to live restores the balance of nature. This is a process that may take as long as a year to realize the benefits but once restored labor and losses should be drastically diminished. Most insects are good for the garden and minor insect damage is natural.
e. Intercropping: As mentioned previously intercropping, or companion planting as it is sometimes called, not only protects plants by producing a strong smell that is confusing and discouraging to insects but it also reduces the likelihood that an entire crop of one plant will be destroyed. This is because the plants are not all located in one place. Moncropped beds of carrots might be a complete loss if discovered by the carrot fly, but intercropped with leeks and other plants the carrot fly is discouraged.
f. Live fencing: In Malawi, where livestock roams free, a fence is an essential component to any pest management system. A living fence, made of any combination of impenetrable living plants require energy only during the initial stages. Once established, a living fence will provide protection without intensive labor, permanently. The straw fence method that is typically used in Malawi must be replaced each year.
g. Other: Participants were asked to identify other pest management practices employed which were consistent with Permaculture values and were given one point for each.
Participants were given one point for each of the above practices employed.
11. Use of localized/indigenous varieties: The PNM promotes the use of plants that have been
hybridized by nature since the beginning of time. Localized and indigenous plants are more resistant to pest, disease, and environmental factors. Malawi has over 600 documented edible food that exist in nature, the majority of which are under-used. Participants received one point if they indicated use of localized/indigenous plants.
12. Knowledge dissemination: One important Permaculture principles is to share knowledge and ideas with neighbors, friends, and family. Participants who qualified as “adopters” on the basis of earlier responses, received one additional point if they indicated sharing knowledge with others.

70
APPENDIX C: PRECONFIGURED QUESTIONNAIRE AND INTERVIEW GUIDE
BACKGROUND INFORMATION AND DAILY PRACTICES QUESTIONNAIRE
Name___________________________________M/F__________Date_____________________ Year/ Date of Birth_______________________________________________________________ Place of Birth____________________________________________________________________ Place raised_____________________District_______________________Tribe_______________ Location of Interview______________________________________________________________ Address ________________________________________________________________________ Phone number___________________________ email____________________________________ NO. QUESTION RESPONSE RESPONSE OPTION
Background Information
1. Have you ever lived outside of Malawi? a. yes
b. no
Location Yrs.
1a. If yes, where did you live and for
how long?
2. What is your religion?
1. Chose not to disclose 2. Christian 3. Muslim 4. Bahai 5. Other
3. What is your highest level of education?
1.Primary 2.Secondary 3.College, trade or technical school 4.University 5.Post graduate
3a. Please indicate, to what level you have completed. Ex. Standard 4, Form 3, etc.
1. 3b. If you have marked 3, 4, or 5, please indicate what courses you primarily studied. 2.

71
NO. QUESTION RESPONSE RESPONSE OPTION 3.
4. Have you participated in any certificate courses? a. yes
b. no
1.
2.
3. 4a.
What certificate courses have you participated in? (If possible, please list those related to agriculture/nutrition/food production)
4.
5. Are you employed? a. yes b. no
Employer Position 5a. If yes, where are you employed and
what is your position?
6. What is your primary source of income?
1. Agricultural sales 2. Job 3. Ganyu 4. Friends / Family 5. Other (if so, please specify)
6a. From what other sources do you receive a monthly income?
1. Agricultural sales 2. Job 3. Ganyu 4. Friends / Family 5. Other (if so, please specify)
6b. What is your average monthly income?
1. Less than 5,000 MK 2. Between 5,000-14,999 MK 3. Between 15,000-49,000 MK 4. Above 50,000 MK
7. How many dependents do you support?
Please include all children you are currently supporting or guarding
8. What is your marital status?
1. Never been married 2. Married 3. Separated or divorce 4. Widow / Widower
9. Do you own or rent the home that you live in?
1. own 2. rent 3. living with friends/family

72
NO. QUESTION RESPONSE RESPONSE OPTION
9a. If you own land, how much land do you own? Please indicate acres or
hectares.
9b. If you rent land from someone else, how much land do you rent? Please indicate acres or
hectares.
10.
How much land did you have under food production during the most recent rainy season? Please include both owned and rented land.
Please indicate acres or hectares.
10a. In the past five years, has the amount of land on which you produce food increased or decreased?
1. Increased significantly 2. Increased slightly 3. Remained the same 4. Decreased slightly 5. Decreased significantly
10b.
What are the contributing factors to a change in the amount of land you have under cultivation / food production?
11. In what year did you first learn about Permaculture?
Please indicate the year to the best of your ability. If you can not remember, please give your best guess.
11a. Who or what organization first exposed you to Permaculture?
1.Kristof & Stacia Nordin 2.Never Ending Food 3.Permaculture Network In Malawi 4.Other (please specify)
LOCATION 11b. Where was your exposure to
Permaculture?
DAILY PRACTICES: WATER CONSERVATION & HARVESTING
12. Do you use your waste / grey water?
a. yes b. no
12a. If no, where do you put your waste /
grey water and why?

73
NO. QUESTION RESPONSE RESPONSE OPTION
12b. If yes, approximately what percentage of grey water do you use?
1. 100% 2. More than half 3. About half 4. Less than half
12c. Where do you redirect grey water or waste water?
1. Food producing garden bed 2. Flower pots and beds / grass 3. Swept / unproductive ground 4. Drain / off your property 5. Other (please list)
13. Do you harvest or collect rainwater? a. yes b. no
13a. If no, what happens to the rainwater on your land?
13b. If yes, where do you store harvested/collected water? (check all those that apply)
1. Water tank 2. Soil 3. Dam 4. Other (please list)
14. Do you irrigate your munda, kitchen garden or other? a. yes
b. no
14a. If no, what are the contributing factors to not irrigating?
14a. If yes, what methods do you use?
1. Water can 2. Drip irrigation (bottle/unglazed pot) 3. Gravity 4. Other (please specify)
15a. What do you irrigate?
1. Kitchen garden 2. Zones 1-2 3. Grass & flowers 4. Trees only 5. Other (please list)
15b. How large is the irrigated area?
Please indicate the unit of measurement.
Ex. .5 acres, one-quarter hectare, etc.

74
NO. QUESTION RESPONSE RESPONSE OPTION
15c. Approximately how many times per day do you water during the dry season?
1. 2-3 times per week 2. Once per day 3. Twice per day 4. More than twice per day 5. Other (please specify)
15d.
In the past five years, has the amount of water used for irrigation on your land (owned and/or rented) increased or decreased?
1. Increased significantly 2. Increased slightly 3. Remained the same 4. Decreased slightly 5. Decreased significantly
1.
2. 15e.
If you indicated a change in the amount of water used per unit of land in the past five years, please list the main contributing factors. 3.
16. Where does your irrigation water come from?
1. Borehole 2. Well (chitsimi) 3. Lake / Dam / Lagoon 4. City water (tap) 5. Other (please list)
16a. Approximately how far must you travel to get irrigation water?
Please indicate the unit of measurement. Ex- .5K, 500 meters, etc.
17. Where does your drinking water come from?
1. Borehole 2. Well (chitsimi) 3. Lake / Dam / Lagoon 4. City water (tap) 5. Other (please list)
17a. Approximately how far must you travel to get drinking water?
Please indicate the unit of measurement. Ex- .5K, 500 meters, etc.
DAILY PRACTICES: SOIL CONSERVATION & FERTILITY
18. Does your land have problems with soil erosion? a. yes
b. no
18a. If yes, what are the contributing factors?

75
NO. QUESTION RESPONSE RESPONSE OPTION
19. What do you think about the fertility of the soil on your land?
1. Very fertile 2. Somewhat fertile 3. Undecided 4. Somewhat infertile 5. Very infertile
19a. What contributes to the fertility levels
of your soil?
19b. In the past five years, has the fertility level of your soil increased or decreased?
1. Increased significantly 2. Increased slightly 3. Remained the same 4. Decreased slightly 5. Decreased significantly
20. Do you use artificial / inorganic / chemical fertilizer? a. yes
b. no
1.
2.
3. 20a. On what crops do you use fertilizer?
4.
20b. Approximately how much fertilizer per acre/hectare did you use during the most recent growing season?
Please indicate the unit of measurement. Ex. 3x 50kg bags = 150 kgs
20c. In the past five years has your fertilizer use per acre increased or decreased?
1. Significantly increased 2. Increased slightly 3. Remained the same 4. Decreased slightly 5. Significantly decreased
20d. What factors contribute to change in
fertilizer use, if any?
21. Do you use organic / compost manure? a. yes
b. no

76
NO. QUESTION RESPONSE RESPONSE OPTION
21a.
If yes, on what percentage of your land do you use compost / organic manure? (if you know the approximate percentage, please indicate)
1. Less than half 2. About half 3. More than half 4. 100%
21b. In the past 5 years, has your use of compost / organic manure increased or decreased?
1. Increased significantly 2. Increased slightly 3. Remained the same 4. Decreased slightly 5. Decreased significantly
1.
2.
3. 21c. On what foods do you use organic /
compost manure?
4. Mulching Reduced sweeping No burning of organic matter Reduced tillage Swales / permanent structures Trees / Plants (non legume)
22. What soil conservation methods do you practice?
Other:
Please place an x next to those practices which you use.
Legumes (plants/trees) Compost / organic manure Animal manure Manure teas
23. What soil fertility and structure methods do you practice?
Other:
Please place an x next to those practices which you use.
DAILY PRACTICES: FOOD & NUTRITION SECURITY
24. In the past 12 months, how often did you, yourself, skip meals due to food scarcity?
1.Never 2.Rarely (few times per year) 3.Sometimes (1-2 times per month) 4.Often (few times per weeks) 5. Mostly (most days/week)
24a. In the past 12 months, how often did your household eat three meals per day?
1.Mostly (3 meals per day) 2.Often (few times per week) 3.Sometimes (1-2 times per month) 4.Rarely (few times per year) 5.Never

77
NO. QUESTION RESPONSE RESPONSE OPTION
24b. In the past 12 months, how often did your household run out of food with money to buy more?
1. Never 2. Rarely (few times per year) 3. Sometimes (1-2 per month) 4. Often (few times per week) 5. Mostly (most days/weeks)
24c. In the past 12 months, how often did you worry about where food would come from?
1. Never 2. Rarely (few time per year) 3. Sometimes (1-2 per month) 4. Often (few times per week) 5. Mostly (most days/weeks)
25. In the past 12 months, how often did your household eat six food groups per day?
1. Mostly (3 meals per day) 2. Often (few times per week) 3. Sometimes (6-10 times per month) 4. Rarely (few times per year) 5. Never
Fruits Vegetables Legumes / Nuts Animals (including milk & eggs) Staples
25a. Which food groups are most often missing from your diet?
Fats / Oils
Please place an x next to those food groups which apply to you.
Fruits Vegetables Legumes / Nuts Animals (including milk & eggs) Staples
25b. What food groups do you grow on your land?
Fats / Oils
Please place an x next to those food groups which apply to you.
Fruits Vegetables Legumes / Nuts Animals (including milk & eggs) Staples
25c. This week, what food groups were eaten daily from your land?
Fats / Oils
Please place an x next to those food groups which apply to you.
Fruits Vegetables Legumes Animals (including milk & eggs) Staples
25d. How many times per week do you eat:
Fats/Oils/Substitutes
Please indicate the number of times per week.

78
NO. QUESTION RESPONSE RESPONSE OPTION
25d. In the past five years, has the diet diversity in your household increased or decreased?
1. Increased significantly 2. Increased slightly 3. Remained the same 4. Decreased slightly 5. Decreased significantly
25e.
What are the indicators and contributing factors to any changes in diversity in your household?
26. In the past 5 years, have your agricultural yields increased or decreased?
1. Increased significantly 2. Increased slightly 3. Remained the same 4. Decreased slightly 5. Decreased significantly
26a. What are the contributing factors to
change in your agricultural yields?
SEASON FOODS
Early Dry Season (April, May June, July)
Late Dry Season (Aug, Sept. Oct. Nov.)
26b. What foods and during which months do you harvest food?
Rainy Season (Dec, Jan, Feb, March)

79
NO. QUESTION RESPONSE RESPONSE OPTION
27. In the past three years, has your household experienced an increase or decrease in frequency of illness.
1. Increased significantly 2. Increased slightly 3. Remained the same 4. Decreased slightly 5. Decreased significantly
27a. What illnesses have affected your household? (Please indicate all those which apply to you)
1. Diarrhea 2. Malaria 3. Chaifuwa / Chimfini 4. Malnutrition 5. Other (please list)
Illness Frequency 1. 2. 3. 4.
27b. How many times per year does your household experience these illness?
Other:
27c.
What are the contributing factors to change in the frequency of illness in your household?
DAILY PRACTICES: PERMACULTURE Food for the soil Food for us Groundcover Diggers Climbers Supporters
28. What parts of the Permaculture guild to you use?
Protectors
Please place an x next to those parts of the guild that you use.
28a. Are these planted together in one garden bed? a. yes
b. no
28b. Do you incorporate perennial plants into your garden? a. yes
b. no
29. Do you protect your soil using permanent garden beds and pathways? a. yes
b. no
30. Are you using the Zone system? a. yes b. no

80
30a. Do you have a Zone 5, woodlot, or natural habitat for animals and beneficial species? a. yes
b. no
31. Do you use an integrated pest management system? a. yes
b. no
31a. If no, how do you protect your plants/food from pests?
Strong smelling plants Soapy/strong smelling water Strong smelling mulch Encouragement of beneficial species
Intercropping Live fencing
31a. What natural/organic methods do you use to protect your plants from insects, disease and pests?
Other:
Please place an x next to those methods that apply to you.
31b. Are you using synthetic / artificial / chemicals on your plants to protect from insects, disease, & pests?
a. yes b. no
Aphids Slugs / snails Cutworm, eelworm, cabbageworm, etc
Termites Thieves, goats, chickens, monkeys
31c. What diseases, insects, & pests do you have problems with?
Other:
Please place an x next to those practices that you use.
32. Have you planted indigenous or localized plants on your land (owned or rented)? a. yes
b. no
32a. In the past five years, has your used of localized or indigenous plants increased or decreased?
1. Increased significantly 2. Increased slightly 3. Remained the same 4. Decreased slightly 5. Decreased significantly
32b. Do you share and collect seeds?
1. Share only 2. Collect only 3. Both share and collect 4. no

81
32c. Approximately what percentage of your crops are localized or indigenous crops?
1. None 2. Less than 20 % 3. 20-50% 4. 50-70% 5. 70-100%
33. Have you shared your knowledge of Permaculture with others? a. yes
b. no
33a. With whom have you shared your knowledge?
1. Friends 2. Family 3. Co-workers 4. Participants of a training 5. Other (please list)
34. Have you encountered difficulties in adopting Permaculture practices? a. yes
b. no
34a.
What factors serve as barriers to adoption of Permaculture practice in Malawi? (Please list all that apply)
1. culture 2. money 3. land availability 4. education 5. vulnerability 6. time 7. other (please list)
34b. What factors serve as barriers to continued practice of Permaculture? (Please list all that apply)
1. culture 2. money 3. land availability 4. education 5. vulnerability 6. time 7. other (please list)
35. Since adoption of Permaculture practices, have you been satisfied or dissatisfied with your choice?
1. Very satisfied 2. Slightly satisfied 3. Undecided 4. Slightly dissatisfied 5. Very dissatisfied

82
APPENDIX D: ADOPTER ASSESSMENT TOOL
pointspos. points /
practice Grey Water 1
Use on Food Plants 1 Other: 1 ea
Water Harvesting 2 Redirect to Food Plants 1
Store for Dry Season Use 1 Other 1 ea
Irrigation 1 Irrigating food plants for year round harvesting 1
Other: 1 ea Soil Conservation 6
mulching 1 reduced sweeping 1
no burning 1 reduced tillage 1
swales & permanent structures 1 trees (planted w/ soil cons. intent) 1
Other: 1 ea Soil Fertility & Structure 9
Soley uses organic method (w/ P.C intent) 2 increasing use of organic (w/P.C intent) 1
Does not use fertilizer (w/ P.C intent) 2 Decreasing fertilizer use (w/ P.C intent) 1
makes and uses own compost 2 uses compost 1
turns stovers into soil 1 leguminous trees & plants 1
animal manure 1 Other: 1 ea
Diet Diversity ( 6 food groups self report) 2 answered 1 ( mostly everyday) 2
answered 2 (often, few times per week) 1 Growing Six Food Groups 2
If answered 1 or 2 above, and growing 6 2 If answered 1 or 2 above, and growing 5 1
Permanent/Year Round Harvesting of Food 3 Harvest during rainy and 2 dry seasons 3
Guild System 7 Grows food in the guild system (7 parts) 7
Reduced Food Traffic/Sweeping 2 permanent food production areas 1
reduced sweeping areas for food production 1 Zone System 5

83
up to and including 4 and/or 5 Zones 5 partial use (1 point for each zone) 4
Integrated Pest Management (w/ P/C intent) 6 strong smelling plants 1
soapy/strong smelling water 1 strong smelling mulch 1
encouragement of beneficial species 1 intercropping 1
live fencing 1 Other: 1 ea
Use of localized/indigenous plants 1 conscious inclusion of indigenous/localized food plants 1
Shared Knowledge 1 Share innovation knowledge 1
Total Possible Points 48

84
Appendix E: Food and Nutrition Security Score Tool
TOTAL 28
Question pts pos In the past 12 months, did you skip meals due to food scarcity? 4
Never 4 Rarely (few times per year) 3
Sometimes (1-2 times/month) 2 Often (few times/week) 1
1
Mostly (most days) 0 In the past 12 months, how often did your household eat 3 meals/day? 4
Mostly (most days) 4 Often (few times/week) 3
Sometimes (1-2 times/month) 2 Rarely (few times/ year) 1
2
Never 0 In the past 12 months, how often did your household run out of food with no money to buy more? 4
Never 4 Rarely (few times/year) 3
Sometimes (few times/month) 2 Often (few times/week) 1
3
Mostly (most days) 0 In the past 12 months, how often did you worry about where food would come from? 4
Never 4 Rarely (few times/year) 3
Sometimes (few times/month) 2 Often (few times/week) 1
4
Mostly (most days) 0 In the past 12 months how often did your household eat 6 food groups in one day? 4
Mostly (most days) 4 Often (few times/week) 3
Sometimes (few times/month) 2 Rarely (few times/year) 1
5
Never 0 In the past 5 years, has the diet diversity in your household increased or decreased? 4
Increased significantly 4 Increased slightly 3
Remained the same 2 Decreased slightly 1
6
Decreased significantly 0 In the past three years has your household experienced an increase or decrease in frequency of illness. 4
Decreased significantly 4 Decreased slightly 3
Remained the same 2 Increased slightly 1
7
Increased significantly 0

85


![[Permaculture] farmers of forty centuries or permanent agriculture in china, korea and japan f. h. king (1911)](https://img.pdfslide.us/doc/110x75/559ef69d1a28abe2768b45bb/permaculture-farmers-of-forty-centuries-or-permanent-agriculture-in-china-korea-and-japan-f-h-king-1911.jpg)