Embed Size (px)
Citation preview
Pericardial Adipose Tissue Determined by Dual SourceCT Is a Risk Factor for Coronary Atherosclerosis
Martin Greif, Alexander Becker, Franz von Ziegler, Corinna Lebherz, Michael Lehrke,Uli C. Broedl, Janine Tittus, Klaus Parhofer, Christoph Becker, Maximilian Reiser,
Andreas Knez, Alexander W. Leber
Objectives—Pericardial fat as a visceral fat depot may be involved in the pathogenesis of coronary atherosclerosis. To gainevidence for that concept we sought to investigate the relation of pericardial fat volumes to risk factors, serumadiponectin levels, inflammatory biomarkers, and the quantity and morphology of coronary atherosclerosis.
Methods and Results—Using Dual source CT angiography pericardial fat volume and coronary atherosclerosis wereassessed simultaneously. Plaques were classified as calcified, mixed, and noncalcified, and the number of affectedsegments served as quantitative score. Patients with atherosclerotic lesions had significant larger PAT volumes (226cm3�92 cm3) than patients without atherosclerosis (134 cm3�56 cm3; P�0.001). No association was found betweenBMI and coronary atherosclerosis. PAT volumes �300 cm3 were the strongest independent risk factor for coronaryatherosclerosis (odds ratio 4.1; CI 3.63 to 4.33) also significantly stronger compared to the Framingham score. Wefurthermore demonstrated that elevated PAT volumes are significantly associated with low adiponectin levels, low HDLlevels, elevated TNF-� levels, and hsCRP.
Conclusion—In the present study we demonstrated that elevated PAT volumes are associated with coronary atheroscle-rosis, hypoadiponectinemia, and inflammation and represent the strongest risk factor for the presence of atherosclerosisand may be important for risk stratification and monitoring. (Arterioscler Thromb Vasc Biol. 2009;29:781-786.)
Key Words: cardiac CT � pericardial fat � obesity � adiponectin � plaque imaging
There is growing evidence that regional visceral fatdistribution may contribute to an unfavorable metabolic
and cardiovascular risk profile.1,2 In patients with obesity,insulin resistance, diabetes, and hyperlipidemia visceral fathypertrophies and transforms into a multifunctional organthat produces and secretes multiple endocrine and paracrinefactors promoting inflammation, neovascularization, and ox-idative stress, features that also characterize atherosclerosis.3
Pericardial fat as a local visceral fat depot with closeproximity to coronary arteries may serve as a source ofinflammatory cytokines and cells that may locally enhancesystemic proatherogenic effects via outside to inside signal-ing.4,5 Thus it may be a specific parameter indicating anunfavorable cardio-metabolic state and may be used for riskstratification. To date, however, only little attention hasfocused on this regional fat depot located around the heartand its relation to cardiovascular risk factors, and the quantityand composition of coronary atherosclerosis is not wellstudied yet.
Multi-slice CT is a noninvasive tool that allows to reliablyassess both obstructive and nonobstructive subclinical coro-
nary artery disease in an earlier stage than invasive angiog-raphy.6–9 Based on density measurements, plaques can befurther characterized in noncalcified, mixed, and calcifiedplaques.7 By using the same scan data this tool furthermoreallows to quantify the exact pericardial fat volume.9 We thussought to assess the relation of pericardial fat volume tocardiovascular risk factors, levels of inflammatory cytokines,adiponectin, and to the extent and the phenotype of coronaryatherosclerosis.
MethodsFor detailed methods, please see the supplemental materials (avail-able online at http://atvb.ahajournals.org).
PatientsFrom March 2006 until August 2007 we included 286 consecutivepatients who underwent dual-source multi-slice CT coronary angiog-raphy with an intermediate pretest likelihood for coronary arterydisease. Further patient characteristics are given in Table 1.
Dual-Source CTCT coronary angiography was performed using a Siemens Definitionscanner (Siemens Medical Solutions), which uses 2 X-ray sourcesfor image generation.
Received September 3, 2008; revision accepted January 30, 2009.From the Departments of Cardiology (M.G., A.B., F.v.Z., C.L., U.C.B., J.T., A.K., A.W.L.), Endocrinology (M.L., K.P.), and Radiology (C.B., M.R.)
Klinikum Grosshadern, University Hospital of Munich, Germany.M.G., A.B., and A.W.L. contributed equally to this study.Correspondence to Alexander W. Leber, Department of Cardiology, Klinikum Grosshadern, University Hospital of Munich, Marchioninistrasse 15,
81377 Munich, Germany. E-mail [email protected]© 2009 American Heart Association, Inc.
Arterioscler Thromb Vasc Biol is available at http://atvb.ahajournals.org DOI: 10.1161/ATVBAHA.108.180653
781
by guest on February 11, 2018http://atvb.ahajournals.org/
Dow
nloaded from
by guest on February 11, 2018http://atvb.ahajournals.org/
Dow
nloaded from
by guest on February 11, 2018http://atvb.ahajournals.org/
Dow
nloaded from
by guest on February 11, 2018http://atvb.ahajournals.org/
Dow
nloaded from
by guest on February 11, 2018http://atvb.ahajournals.org/
Dow
nloaded from
by guest on February 11, 2018http://atvb.ahajournals.org/
Dow
nloaded from
by guest on February 11, 2018http://atvb.ahajournals.org/
Dow
nloaded from
by guest on February 11, 2018http://atvb.ahajournals.org/
Dow
nloaded from
Coronary AnalysisAtherosclerotic plaques were classified as calcified, mixed, ornoncalcified as described previously by our group. Based on thenumber of diseased segments a plaque score for each patient wascalculated.10
Following the publications of Stary et al, Mautner et al, and mostrecently Bamberg et al, we defined existence of exclusively noncal-cified plaques in a patient as early stage atherosclerosis.11–14
Peri- and Epicardial Fat Assessment ProtocolThe pericardial fat volume was measured in cm3 using theVolume Analysis software tool of our cardiac workstation (Sie-mens, Leonardo). We defined pericardial fat as epicardial fat plusparacardial fat.
In a subset of 120 patients both epi- and pericardial fat volume wasdetermined. Our analysis revealed an excellent correlation (Pearsoncorrelation coefficient r�0.97 between those two fat depots and anequal correlation of both fat depots with the number of atheroscle-rotic plaque r�0.40 versus 0.41). Because epicardial fat volume wasless reproducible (interobserver variability 15%) compared to PATvolume (8%), only the latter was used for further analysis. In ourstudy, the acquisition of an additional data set was not necessary todetermine PAT volume; the data set of coronary CTA could be used.
ResultsDSCT angiography could be performed in all 286 patients.Adequate image quality for evaluation of coronary plaquescould be obtained in 264 patients. The remaining 22patients with insufficient image quality because of motionartifacts (n�17) or insufficient opacification were ex-
cluded from the study. In all 264 study patients, PATvolume could be determined.
Morphology of Coronary PlaquesIn 56 of 264 (21%) patients coronary plaques could be excluded,42 (16%) patients showed only noncalcified plaques, 110 (42%)patients revealed a mixture of all plaque types, and 56 (21%)patients exclusively calcified plaques.
Relation of PAT Volume to Age, Gender, RiskFactors, and Coronary PlaquesWe found a significant increase of PAT volume with age inboth men and women from 148�77 cm3 in patients under 40years to 252�118 cm3 for patients above 70 years (P�0.05).In all age groups women showed a significantly lower PATvolume compared to men. Patients with cardiovascular riskfactors showed a significantly higher PAT volume comparedto patients without cardiovascular risk factors (222�110 cm3
versus 187�71 cm3, P�0.05). We also found an increase ofPAT volume with an increasing number of risk factors: from187�71 cm3 in patients without any risk factors up to226�119 cm3 in patients with 3 or more risk factors(P�0.05). PAT volume correlated with BMI (r�0.45,P�0.0001) and with the number of diseased coronary seg-ments (r�0,44, P�0.0001). The correlation of PAT volumeand number of plaques remained statistically significant evenafter adjusting for BMI (Table 2). There was no correlationbetween the presence or the number of atherosclerotic seg-ments and BMI (r�0.12, P�0.13).
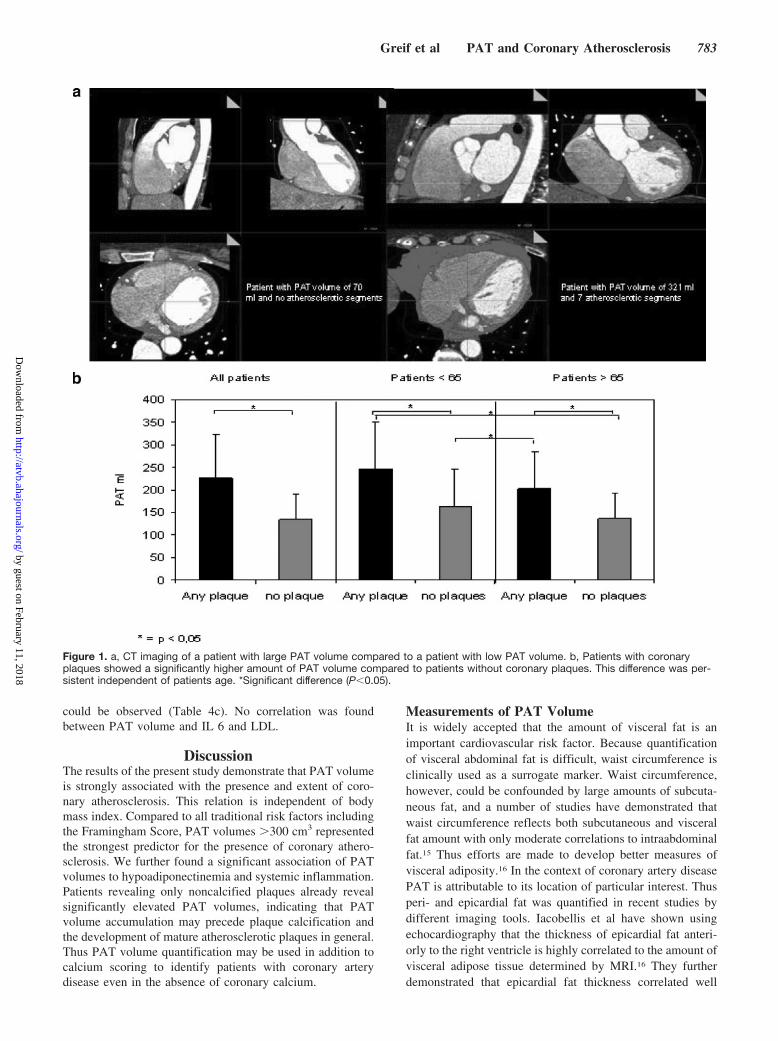
Patients with any coronary plaque showed a significanthigher PAT volume compared to patients without coronaryplaques (226�97 cm3 compared to 134�56 cm3, P�0.01).This difference was persistent independent of patients age(Figure 1). A significant difference in PAT volume betweenpatients with noncalcified, calcified, or a mixture of allplaque types could not be observed, although patients withexclusively noncalcified plaques had a significantly lowerplaque burden (Table 3). All plaque types revealed a similarand significant correlation to PAT-volume (Table 3).
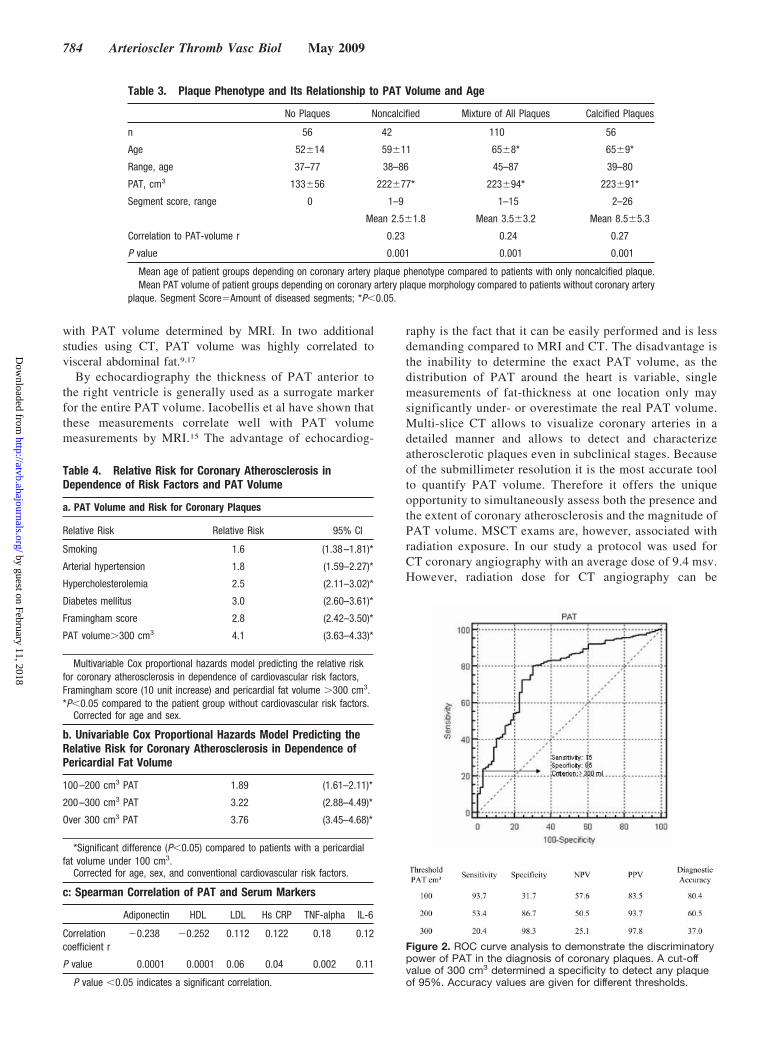
The relative risk for the presence of coronary plaques independence of PAT-Volume and risk factors is given in Table4a and 4b. The area under the ROC curve to discriminatepatients with atherosclerotic plaques from those withoutplaque was significantly higher for PAT volume compared tothe Framingham score (0.82 versus 0.64, P�0.02, Figure 2).
Relation of PAT Volume to Serum Lipids,Inflammation, and AdiponectinUsing the spearman correlation coefficient a significantcorrelation between PAT volume, Adiponectin (inverse cor-relation), HDL (inverse correlation), TNF-�, and hsCRP
Table 1. Baseline Characteristics
Age, years 61�12
Male, % 67
BMI, kg/m2 27�4
Risk factors
Smoking, % 12
Arterial hypertension, % 43
Hypercholesterolemia, % 54
Diabetes mellitus, % 5
No risk factors, % 16
Plaque characteristics
No plaques, % 22
Only noncalcified plaques, % 16
Mixed plaques, % 41
Only calcified plaques, % 21
PAT volume
PAT volume �100 cm3, % 12
PAT volume 100–200 cm3, % 43
PAT volume 200–300 cm3, % 28
PAT volume �300 cm3, % 17
Adiponectin (ng/ml) 6255�4544
HDL, mg/dl 51�12
LDL, mg/dl 122�38
hs CRP, mg/dl 0.84�1.6
TNF alpha, pg/ml 6.8�3.7
IL 6, pg/ml 7.4�7
Table 2. Correlation of PAT Volume and AtheroscleroticPlaque Score in Different BMI Ranges
BMI �25 BMI 25 to 29 BMI �29
Correlation coefficient r�0.36 r�0.34 r�0.37
P value P�0.0005 P�0.0005 P�0.002
Spearman correlation coefficient.
782 Arterioscler Thromb Vasc Biol May 2009
by guest on February 11, 2018http://atvb.ahajournals.org/
Dow
nloaded from
could be observed (Table 4c). No correlation was foundbetween PAT volume and IL 6 and LDL.
DiscussionThe results of the present study demonstrate that PAT volumeis strongly associated with the presence and extent of coro-nary atherosclerosis. This relation is independent of bodymass index. Compared to all traditional risk factors includingthe Framingham Score, PAT volumes �300 cm3 representedthe strongest predictor for the presence of coronary athero-sclerosis. We further found a significant association of PATvolumes to hypoadiponectinemia and systemic inflammation.Patients revealing only noncalcified plaques already revealsignificantly elevated PAT volumes, indicating that PATvolume accumulation may precede plaque calcification andthe development of mature atherosclerotic plaques in general.Thus PAT volume quantification may be used in addition tocalcium scoring to identify patients with coronary arterydisease even in the absence of coronary calcium.
Measurements of PAT VolumeIt is widely accepted that the amount of visceral fat is animportant cardiovascular risk factor. Because quantificationof visceral abdominal fat is difficult, waist circumference isclinically used as a surrogate marker. Waist circumference,however, could be confounded by large amounts of subcuta-neous fat, and a number of studies have demonstrated thatwaist circumference reflects both subcutaneous and visceralfat amount with only moderate correlations to intraabdominalfat.15 Thus efforts are made to develop better measures ofvisceral adiposity.16 In the context of coronary artery diseasePAT is attributable to its location of particular interest. Thusperi- and epicardial fat was quantified in recent studies bydifferent imaging tools. Iacobellis et al have shown usingechocardiography that the thickness of epicardial fat anteri-orly to the right ventricle is highly correlated to the amount ofvisceral adipose tissue determined by MRI.16 They furtherdemonstrated that epicardial fat thickness correlated well
Figure 1. a, CT imaging of a patient with large PAT volume compared to a patient with low PAT volume. b, Patients with coronaryplaques showed a significantly higher amount of PAT volume compared to patients without coronary plaques. This difference was per-sistent independent of patients age. *Significant difference (P�0.05).
Greif et al PAT and Coronary Atherosclerosis 783
by guest on February 11, 2018http://atvb.ahajournals.org/
Dow
nloaded from
with PAT volume determined by MRI. In two additionalstudies using CT, PAT volume was highly correlated tovisceral abdominal fat.9,17
By echocardiography the thickness of PAT anterior tothe right ventricle is generally used as a surrogate markerfor the entire PAT volume. Iacobellis et al have shown thatthese measurements correlate well with PAT volumemeasurements by MRI.15 The advantage of echocardiog-
raphy is the fact that it can be easily performed and is lessdemanding compared to MRI and CT. The disadvantage isthe inability to determine the exact PAT volume, as thedistribution of PAT around the heart is variable, singlemeasurements of fat-thickness at one location only maysignificantly under- or overestimate the real PAT volume.Multi-slice CT allows to visualize coronary arteries in adetailed manner and allows to detect and characterizeatherosclerotic plaques even in subclinical stages. Becauseof the submillimeter resolution it is the most accurate toolto quantify PAT volume. Therefore it offers the uniqueopportunity to simultaneously assess both the presence andthe extent of coronary atherosclerosis and the magnitude ofPAT volume. MSCT exams are, however, associated withradiation exposure. In our study a protocol was used forCT coronary angiography with an average dose of 9.4 msv.However, radiation dose for CT angiography can be
Table 3. Plaque Phenotype and Its Relationship to PAT Volume and Age
No Plaques Noncalcified Mixture of All Plaques Calcified Plaques
n 56 42 110 56
Age 52�14 59�11 65�8* 65�9*
Range, age 37–77 38–86 45–87 39–80
PAT, cm3 133�56 222�77* 223�94* 223�91*
Segment score, range 0 1–9 1–15 2–26
Mean 2.5�1.8 Mean 3.5�3.2 Mean 8.5�5.3
Correlation to PAT-volume r 0.23 0.24 0.27
P value 0.001 0.001 0.001
Mean age of patient groups depending on coronary artery plaque phenotype compared to patients with only noncalcified plaque.Mean PAT volume of patient groups depending on coronary artery plaque morphology compared to patients without coronary artery
plaque. Segment Score�Amount of diseased segments; *P�0.05.
Table 4. Relative Risk for Coronary Atherosclerosis inDependence of Risk Factors and PAT Volume
a. PAT Volume and Risk for Coronary Plaques
Relative Risk Relative Risk 95% CI
Smoking 1.6 (1.38–1.81)*
Arterial hypertension 1.8 (1.59–2.27)*
Hypercholesterolemia 2.5 (2.11–3.02)*
Diabetes mellitus 3.0 (2.60–3.61)*
Framingham score 2.8 (2.42–3.50)*
PAT volume�300 cm3 4.1 (3.63–4.33)*
Multivariable Cox proportional hazards model predicting the relative riskfor coronary atherosclerosis in dependence of cardiovascular risk factors,Framingham score (10 unit increase) and pericardial fat volume �300 cm3.*P�0.05 compared to the patient group without cardiovascular risk factors.
Corrected for age and sex.
b. Univariable Cox Proportional Hazards Model Predicting theRelative Risk for Coronary Atherosclerosis in Dependence ofPericardial Fat Volume
100–200 cm3 PAT 1.89 (1.61–2.11)*
200–300 cm3 PAT 3.22 (2.88–4.49)*
Over 300 cm3 PAT 3.76 (3.45–4.68)*
*Significant difference (P�0.05) compared to patients with a pericardialfat volume under 100 cm3.
Corrected for age, sex, and conventional cardiovascular risk factors.
c: Spearman Correlation of PAT and Serum Markers
Adiponectin HDL LDL Hs CRP TNF-alpha IL-6
Correlationcoefficient r
�0.238 �0.252 0.112 0.122 0.18 0.12
P value 0.0001 0.0001 0.06 0.04 0.002 0.11
P value �0.05 indicates a significant correlation.
Figure 2. ROC curve analysis to demonstrate the discriminatorypower of PAT in the diagnosis of coronary plaques. A cut-offvalue of 300 cm3 determined a specificity to detect any plaqueof 95%. Accuracy values are given for different thresholds.
784 Arterioscler Thromb Vasc Biol May 2009
by guest on February 11, 2018http://atvb.ahajournals.org/
Dow
nloaded from
minimized down to 2.5 msv using the sequential scanningtechnique, and it is expected that wider detector coverageradiation may be reduced below 1.5 msv. PAT volume, how-ever, can also be determined with less sophisticated scanprotocols that are used for calcium scoring. The radiation for thistype of scan is �0.5 msv, which equals 6 chest X-ray exami-nations and is 10% of the annual natural background radiation insouthern Germany (5 msV per year).
PAT Volume and Its Relation to CardiovascularRisk FactorsRecent studies have demonstrated that epicardial and PATvolume is related to cardiovascular risk factors indicating themetabolic syndrome. Iacobellis et al demonstrated an inde-pendent and significant relation of epicardial fat thicknessassessed by echocardiography to fasting insulin levels anddiastolic blood pressure.8 In addition to these findings wenow demonstrated that PAT volume increases with thenumber of risk factors. In the multivariate analysis it issignificantly correlated to hypertension, diabetes, age, andhypercholesterolemia, and thus it reflects the clustering effectof multiple risk factors in the individual patient and is a goodindicator for the metabolic syndrome.
PAT Volume and Its Relation toCoronary AtherosclerosisSo far there are only a few studies investigating the associationof PAT volume and coronary atherosclerosis, although there isstriking evidence that visceral fat is adversely related to cardio-vascular risk. In a recent study by Jeong et al,18 PAT volume wasthe best predictor for angiographic disease severity compared towaist circumference or visceral abdominal fat volume.18 Ahn etal have demonstrated that patients with significant obstructivecoronary artery disease have significantly more epicardial fatdetermined by echocardiography than patients with non signif-icant coronary artery disease.17 These results are in line with theobservations of our present study. Patients with evidence for anyplaque on Dual Source CT-angiography revealed on averagesignificantly higher PAT volumes than patients without coro-nary lesions. Increasing PAT volumes increase the risk for thepresence of coronary plaques substantially. The ROC analysisrevealed that 95% of patients with PAT volumes �300 cm3 haddetectable coronary atherosclerosis. Compared to traditional riskfactors PAT volumes �300 cm3 represent the strongest inde-pendent risk factor for the presence of coronary plaques (oddsratio 4.1). Interestingly, we found absolute no association be-tween BMI and presence or extent of coronary atherosclerosis,so that this parameter seems to be not useful in predictingcoronary artery disease.
Association of PAT Volume andPlaque CompositionIn addition to plaque burden we examined for the first timethe association of plaque composition and PAT volume. Priorstudies using MSCT have demonstrated that the number ofnoncalcified plaques is associated with unstable coronaryartery disease, and it was suggested that these lesions mayindicate an elevated disease activity.19–21 Bamberg et alrecently demonstrated that noncalcified plaques on MSCT are
a feature of early stage atherosclerosis and that their numberdecreases with age whereas the number of calcified lesionsincreases.11 Unfortunately CT does not yet allow an accurateand reliable further classification of noncalcified lesions infibrous and lipid-rich vulnerable lesions, so that we onlyclassified in calcified, mixed, and noncalcified lesions.7 Wefound no difference of PAT-Volumes between patients withonly noncalcified, mixed, or only calcified lesions. All typesof plaques individually and independently correlated signifi-cantly with PAT-volume with similar correlation coefficients.However, patients with exclusively noncalcified plaques weresignificantly younger and had a significantly lower plaqueburden than patients with calcified lesions. These findingsindicate that PAT-Volume accumulation is already presentbefore plaque calcification occurs and it may also precededevelopment of atherosclerosis in general. This speculation issupported by a study of Lear et al who observed thatabdominal visceral fat accumulation was more strongly asso-ciated with carotid intimal thickening than to plaque numberand plaque area. They hypothesized that visceral adiposetissue–derived proatherogenic factors are responsible forearly endothelial dysfunction and predisposition for athero-sclerosis.22 Thus it may be used additionally to calciumscoring as a parameter indicating an increased cardiovascularrisk, and it may indicate an elevated disease activity even inpatients with lower plaque burden. However, whether thesecross-sectional observations will translate into a higher rate ofcomplications in prospective trials has to be proven.
Pathophysiological ConsiderationsVisceral fat is able to produce large amounts of proinflam-matory chemokines like TNF-�, IL-6, free fatty acids, orplasminogen activator inhibitor-1 (PAI-1). All of them arealso involved in atherosclerosis and thrombosis. Adiponectinis a hormone that is exclusively synthesized by adipocytesand has antiatherosclerotic properties. The release of adi-ponectin is reduced by TNF-� in states like obesity andinsulin resistance. We assume that the correlation of PATvolume and systemic inflammation and hypoadiponectine-mia, observed in our study, is driven by the fact that PATvolume is a surrogate marker for the entire visceral fat burden.Nevertheless, because of its location around the coronary ves-sels, evidence suggests that PAT locally enhances systemicatherogenic effects, accelerating initiation and progression ofcoronary atherosclerosis. In patients undergoing bypass sur-gery it could be demonstrated that PAT reveals a pathologicaladipokine and cytokine profile as well as a large number ofinflammatory cells, which could not be observed in subcuta-neous fat.23 The exact mechanism on how cyto- and chemo-kines originating from pericardial adipocytes enter the vesselwall and accelerate and initiate atherosclerosis is not clearyet. These inflammatory mediators may exert their effectthrough diffusion and direct adventitial contact. In a porcinemodel adventitial treatment with proinflammatory factorsresulted in early stage atherosclerosis and migration ofinflammatory cells into the vessel wall.24,25 Another mecha-nism may be a direct communication of the vasa vasorumwith epicardial adipocytes. The concept of this kind of localsignaling is supported by some interesting observations in
Greif et al PAT and Coronary Atherosclerosis 785
by guest on February 11, 2018http://atvb.ahajournals.org/
Dow
nloaded from
human studies: (1) There is a closer correlation and associa-tion of PAT to coronary atherosclerosis than of abdominal visceralfat to coronary atherosclerosis.17 (2) In the human myocardialbridge where visceral fat around the coronary vessels is totallyabsent, no atherosclerotic plaque development can be observed.(3) By using intravascular ultrasound it could be demonstratedthat plaques develop most frequently with a pericardial spatialorientation suggesting a permissive role of pericardial fat.26 (4)In coronary arteries that on autopsy revealed plaques with largenecrotic cores more macrophages in periadventitial fat could beobserved than in vessels without lipidcore plaques.4,27,28
Limitations and Clinical PerspectivesThe findings of our study identify PAT volume as a strong andindependent risk factor for coronary artery disease. By using CTthis local fat depot can be easily quantified even on native CAscoring scans with an acceptable radiation exposure. Futureprospective trials, however, are needed to prove the incrementalprognostic impact of this parameter over CA scoring andtraditional risk factors. As we have found some evidence thatpathological PAT accumulation may precede the developmentof atherosclerotic plaque and indicates a proatherogenic state,this fat depot may be an attractive target for antiatherosclerotictherapies, and future research should also address the effect ofdifferent drugs and weight modifying strategies on PAT volume.
Sources of FundingThis work was supported by grants BR 2151/4-1 (to U.C.B.) and LE1350/2-1 (to M.L.) from the Deutsche Forschungsgemeinschaft.
DisclosuresAlexander Leber is an employee for Siemens AG Healthcare.
References1. Kortelainen ML. Myocardial infarction and coronary pathology in
severely obese people examined at autopsy. Int J Obes Relat MetabDisord. 2002;26:73–79.
2. Iacobellis G, Pistilli D, Gucciardo M, Leonetti F, Miraldi F, BrancaccioG, Gallo P, di Gioia CR. Adiponectin expression in human epicardialadipose tissue in vivo is lower in patients with coronary artery disease.Cytokine. 2005;29:251–255.
3. Cheng KH, Chu CS, Lee KT, Lin TH, Hsieh CC, Chiu CC, Voon WC,Sheu SH, Lai WT. Adipocytokines and proinflammatory mediators fromabdominal and epicardial adipose tissue in patients with coronary arterydisease. Int J Obes (Lond). 2008;32:268–274.
4. Sacks HS, Fain JN. Human epicardial adipose tissue: a review. AmHeart J. 2007;153:907–917.
5. Rabkin SW. Epicardial fat: properties, function and relationship toobesity. Obes Rev. 2007;8:253–261.
6. Leber AW, Knez A, von Ziegler F, Becker A, Nikolaou K, Paul S, WinterspergerB, Reiser M, Becker CR, Steinbeck G, Boekstegers P. Quantification ofobstructive and nonobstructive coronary lesions by 64-slice computed tomog-raphy: a comparative study with quantitative coronary angiography and intra-vascular ultrasound. J Am Coll Cardiol. 2005;46:147–154.
7. Leber AW, Knez A, Becker A, Becker C, von Ziegler F, Nikolaou K, RistC, Reiser M, White C, Steinbeck G, Boekstegers P. Accuracy of multi-detector spiral computed tomography in identifying and differentiatingthe composition of coronary atherosclerotic plaques: a comparative studywith intracoronary ultrasound. J Am Coll Cardiol. 2004;43:1241–1247.
8. Iacobellis G, Leonetti F. Epicardial adipose tissue and insulin resistancein obese subjects. J Clin Endocrinol Metab. 2005;90:6300–6302.
9. Gorter PM, van Lindert AS, de Vos AM, Meijs MF, van der Graaf Y,Doevendans PA, Prokop M, Visseren FL. Quantification of epicardial andperi-coronary fat using cardiac computed tomography; reproducibilityand relation with obesity and metabolic syndrome in patients suspected ofcoronary artery disease. Atherosclerosis. 2008;197:896–903.
10. Leber AW, Becker A, Knez A, von Ziegler F, Sirol M, Nikolaou K,Ohnesorge B, Fayad ZA, Becker CR, Reiser M, Steinbeck G, BoekstegersP. Accuracy of 64-slice computed tomography to classify and quantifyplaque volumes in the proximal coronary system: a comparative studyusing intravascular ultrasound. J Am Coll Cardiol. 2006;47:672–677.
11. Bamberg F, Dannemann N, Shapiro MD, Seneviratne SK, Ferencik M,Butler J, Koenig W, Nasir K, Cury RC, Tawakol A, Achenbach S, BradyTJ, Hoffmann U. Association between cardiovascular risk profiles and thepresence and extent of different types of coronary atherosclerotic plaqueas detected by multidetector computed tomography. Arterioscler ThrombVasc Biol. 2008;28:568–574.
12. Mautner GC, Mautner SL, Froehlich J, Feuerstein IM, Proschan MA,Roberts WC, Doppman JL. Coronary artery calcification: assessmentwith electron beam CT and histomorphometric correlation. Radiology.1994;192:619–623.
13. Mautner SL, Mautner GC, Froehlich J, Feuerstein IM, Proschan MA,Roberts WC, Doppman JL. Coronary artery disease: prediction with invitro electron beam CT. Radiology. 1994;192:625–630.
14. Stary HC, Chandler AB, Dinsmore RE, Fuster V, Glagov S, Insull W Jr,Rosenfeld ME, Schwartz CJ, Wagner WD, Wissler RW. A definition ofadvanced types of atherosclerotic lesions and a histological classification ofatherosclerosis. A report from the Committee on Vascular Lesions of the Councilon Arteriosclerosis, American Heart Association. Circulation. 1995;92:1355–1374.
15. Iacobellis G, Assael F, Ribaudo MC, Zappaterreno A, Alessi G, Di MarioU, Leonetti F. Epicardial fat from echocardiography: a new method forvisceral adipose tissue prediction. Obes Res. 2003;11:304–310.
16. Iacobellis G, Ribaudo MC, Assael F, Vecci E, Tiberti C, Zappaterreno A, DiMario U, Leonetti F. Echocardiographic epicardial adipose tissue is related toanthropometric and clinical parameters of metabolic syndrome: a new indicatorof cardiovascular risk. J Clin Endocrinol Metab. 2003;88:5163–5168.
17. Ahn SG, Lim HS, Joe DY, Kang SJ, Choi BJ, Choi SY, Yoon MH,Hwang GS, Tahk SJ, Shin JH. Relationship of epicardial adipose tissue byechocardiography to coronary artery disease. Heart. 2008;94:e7.
18. Jeong JW, Jeong MH, Yun KH, Oh SK, Park EM, Kim YK, Rhee SJ, LeeEM, Lee J, Yoo NJ, Kim NH, Park JC. Echocardiographic epicardial fatthickness and coronary artery disease. Circ J. 2007;71:536–539.
19. Hausleiter J, Meyer T, Hadamitzky M, Kastrati A, Martinoff S, SchomigA. Prevalence of noncalcified coronary plaques by 64-slice computedtomography in patients with an intermediate risk for significant coronaryartery disease. J Am Coll Cardiol. 2006;48:312–318.
20. Leber AW, Knez A, White CW, Becker A, von Ziegler F, Muehling O,Becker C, Reiser M, Steinbeck G, Boekstegers P. Composition ofcoronary atherosclerotic plaques in patients with acute myocardialinfarction and stable angina pectoris determined by contrast-enhancedmultislice computed tomography. Am J Cardiol. 2003;91:714–718.
21. Leber AW, von Ziegler F, Becker A, Becker CR, Reiser M, Steinbeck G,Knez A, Boekstegers P. Characteristics of coronary plaques before angio-graphic progression determined by Multi-Slice CT. Int J CardiovascImaging. 2008;24:423–428.
22. Lear SA, Humphries KH, Kohli S, Frohlich JJ, Birmingham CL, ManciniGB. Visceral adipose tissue, a potential risk factor for carotid atheroscle-rosis: results of the Multicultural Community Health Assessment Trial(M-CHAT). Stroke. 2007;38:2422–2429.
23. Baker AR, Silva NF, Quinn DW, Harte AL, Pagano D, Bonser RS,Kumar S, McTernan PG. Human epicardial adipose tissue expresses apathogenic profile of adipocytokines in patients with cardiovasculardisease. Cardiovasc Diabetol. 2006;5:1.
24. Shimokawa H, Morishige K, Miyata K, Kandabashi T, Eto Y, Ikegaki I,Asano T, Kaibuchi K, Takeshita A. Long-term inhibition of Rho-kinaseinduces a regression of arteriosclerotic coronary lesions in a porcinemodel in vivo. Cardiovasc Res. 2001;51:169–177.
25. Miyata K, Shimokawa H, Kandabashi T, Higo T, Morishige K, Eto Y,Egashira K, Kaibuchi K, Takeshita A. Rho-kinase is involved in macro-phage-mediated formation of coronary vascular lesions in pigs in vivo.Arterioscler Thromb Vasc Biol. 2000;20:2351–2358.
26. Prati F, Arbustini E, Labellarte A, Sommariva L, Pawlowski T, Manzoli A,Pagano A, Motolese M, Boccanelli A. Eccentric atherosclerotic plaques withpositive remodelling have a pericardial distribution: a permissive role ofepicardial fat? A three-dimensional intravascular ultrasound study of leftanterior descending artery lesions. Eur Heart J. 2003;24:329–336.
27. Vela D, Buja LM, Madjid M, Burke A, Naghavi M, Willerson JT,Casscells SW, Litovsky S. The role of periadventitial fat in atheroscle-rosis. Arch Pathol Lab Med. 2007;131:481–487.
28. Tellides G. Periadventitial fat. Arch Pathol Lab Med. 2007;131:346–347.
786 Arterioscler Thromb Vasc Biol May 2009
by guest on February 11, 2018http://atvb.ahajournals.org/
Dow
nloaded from
Alexander W. LeberBroedl, Janine Tittus, Klaus Parhofer, Christoph Becker, Maximilian Reiser, Andreas Knez and Martin Greif, Alexander Becker, Franz von Ziegler, Corinna Lebherz, Michael Lehrke, Uli C.
AtherosclerosisPericardial Adipose Tissue Determined by Dual Source CT Is a Risk Factor for Coronary
Print ISSN: 1079-5642. Online ISSN: 1524-4636 Copyright © 2009 American Heart Association, Inc. All rights reserved.
Greenville Avenue, Dallas, TX 75231is published by the American Heart Association, 7272Arteriosclerosis, Thrombosis, and Vascular Biology
doi: 10.1161/ATVBAHA.108.1806532009;
2009;29:781-786; originally published online February 19,Arterioscler Thromb Vasc Biol.
http://atvb.ahajournals.org/content/29/5/781World Wide Web at:
The online version of this article, along with updated information and services, is located on the
http://atvb.ahajournals.org/content/suppl/2009/03/16/ATVBAHA.108.180653.DC1Data Supplement (unedited) at:
http://atvb.ahajournals.org//subscriptions/
at: is onlineArteriosclerosis, Thrombosis, and Vascular Biology Information about subscribing to Subscriptions:
http://www.lww.com/reprints
Information about reprints can be found online at: Reprints:
document. Question and AnswerPermissions and Rightspage under Services. Further information about this process is available in the
which permission is being requested is located, click Request Permissions in the middle column of the WebCopyright Clearance Center, not the Editorial Office. Once the online version of the published article for
can be obtained via RightsLink, a service of theArteriosclerosis, Thrombosis, and Vascular Biologyin Requests for permissions to reproduce figures, tables, or portions of articles originally publishedPermissions:
by guest on February 11, 2018http://atvb.ahajournals.org/
Dow
nloaded from
Supplemental Material
MATERIAL and METHODS
Patients:
From march 2006 until august 2007 we included 286 consecutive patients who
underwent dual-source multi-slice CT-coronary angiography for exclusion of coronary artery
stenosis due to typical and atypical chest pain with an intermediate pretest likelihood for
coronary artery disease. None of the patients had prior known coronary artery disease. Of the
286 patients that were assessed, 193 were male. Mean age of the study population was 61 +-
12 years (range 20 -87). 156 patients were less than or equal to and 130 patients were over the
age of 65 years.
Further patient characteristics are given in table I.
Risk factors:
For all patients we evaluated conventional cardiovascular risk factors by personal
interview and screening of medical records. In addition arterial blood pressure, LDL-
cholesterol level, HDL cholesterol level, triglyceride level and blood glucose level were
determined in the fasting state. Diabetes was defined as a fasting glucose level > 120mg/dl or
treatment with a glucose lowering agent, Hypercholesterolemia was defined as a total
Cholesterol level > 200mg/dl or treatment with a lipid lowering medication. Hypertension
was defined as a systolic blood pressure > 140mmHg or a diastolic value >90mmHg.
Serum Markers:
Blood samples were stored at -70°C until analysis. Serum levels of adiponectin (µg/ml), TNF-
alpha and Interleukin 6, were determined with a commercial enzyme-linked immunosorbent
assay (R&D, Wiesbaden, Germany). Plasma LDL-cholesterol (LDL-C), HDL-cholesterol
(HDL-C) and triglycerides were measured by routine enzymatic methods. Determination of
high sensitivity C-reactive protein (hsCRP) levels was performed at the Department of
Clinical Chemistry (Campus Grosshadern, University of Munich, Germany).
Dual-source CT:
CT-coronary angiography was performed using a Siemens Definition scanner
(Siemens Medical Solutions, Forchheim Germany) that uses two X-ray sources for image
generation. With two tubes and two detectors mounted at orthogonal orientation in the gantry,
the transmission data required for the reconstruction of one slab can be acquired in half the
time needed by a conventional MSCT-system. A gantry rotation time of 0,33 s thus results in
a temporal resolution of 82,5 ms. Tube voltage for CT-angiography was 120 kV for both
tubes in patients with a bodyweight >80 kg and 100 kv for those with a weight < 80kg.
Current was 560 mAs with modulation, and full current between 30-50%-80% of the cardiac
cycle, gantry rotation time 0,33 s, and pitch 0,2-0,44 adapted to the HR. Per rotation 64 slices
were generated with a collimation of 0,6 mm, leading to an isotropic voxel resolution of
approximately 0,6 mm edge length and 0,2 mm³ volume. Before the scan, nitroglycerine was
administered sublingually. A bodyweight- adapted volume of contrast agent (1,25 cm²/kg
bodyweight; Ultravist 370, Schering, Berlin, Germany) was injected continuously at a
calculated rate to achieve constant injection duration of 20 s. The scan was started with a
delay of 5 s after the density in the aortic root exceeded a density value of 100 HU (bolus
tracking). A saline flush (100 cm³ at 5 cm³/s) was applied to maintain a compact bolus.
Axial images were reconstructed with 0,75 mm slice thickness and 0,5 mm increment using a
medium sharp convolution kernel (B26f) and retrospective ECG gating. The reconstructions
were performed in 10% steps over the entire R-R cycle using a single-segment algorithm that
utilizes a quarter segment of projection data from both detectors.
Dual source-CT image analysis
Coronary analysis:
In the first step all reconstructed data sets were evaluated at different ECG-phases for
diagnostic image quality and the optimal data set was then chosen for analysis. The DSCT
datasets were evaluated by two independent investigators using a dedicated cardiac
workstation (Siemens, Leonardo Circulation).
Atherosclerotic plaque were classified as calcified, mixed or noncalcified as described
previously by our group. Calcified plaques were defined as lesions with a Hounsfield Unit
value above 130. Noncalcified plaques were defined as structures clearly assignable to the
vessel wall (in at least two views) with densities less then the lumen contrast. Plaques in
which <50% of the plaque area was occupied by calcium were classified as mixed. The
coronary tree was segmented according to the suggestions of the AHA into a 15-segment
model. Each segment was further divided in a proximal and a distal segment. Each segment
was then classified as containing calcified, noncalcified, mixed or no plaque. Based on the
number of diseased segments a plaque score for each patient was calculated.
Peri- and Epicardial fat assessment protocol:
CT measurements of PAT volume were made with a dual-suorce multi-slice CT
System. The same images used for the analysis of atherosclerotic plaque were used to
measure pericardial adipose tissue volumes. There was no impact on PAT volume
measurement by cardiac contrast enhancement. The pericardial fat volume was measured in
cm³ using the Volume Analysis software tool of our cardiac workstation (Siemens,
Leonardo).
We defined pericardial fat as epicardial fat plus paracardial fat. Epicardial fat was
defined as any adipose tissue located within the pericardium. Paracardial fat was defined as
any adipose tissue situated on the external surface of the parietal pericardium. Our upper cut
off point in the axial slices was the bifurcation of the pulmonary artery. Inferiorly, the

analysis volume was segmented from the intrabdominal adipose tissue. The anterior border
was defined by the chest wall and the posterior extend by the oesophagus and the aorta
descendens. The region of interest containing the heart and the surrounding adipose tissue was
assessed by manually tracing in the axial slices. The observer had simultaneously access to
the coronal images.
After the segmentation of the heart and surrounding adipose tissue from the remainder of the
thorax, a threshold of -250 to -30 CT units (ie, Hounsfield units) was applied to isolate the
adipose tissue (fat-) containing voxels. The adipose tissue voxels were then summed to
achieve adipose tissue volume in cm³. (s. figure 1) In a subset of 120 patients both epi- and
pericardial fat volume was determined. Our analysis revealed an excellent correlation
(Pearson correlation coefficient r= 0.97 between those two fat depots and an equal correlation
of both fat depots with the number of atherosclerotic plaque r= 0.40 vs. 0.41). Because
epicardial fat volume was less reproducible (introbserver variability 15%) compared to PAT
volume (8%) only the latter was used for further analysis. In our study, the acquisition of an
additional data set was not necessary to determine PAT volume; the data set of coronary CTA
could be used. The radiation dose for CT-angiography in this study was on average 9.4 msv.
Statistical analysis:
Statistical analyses were performed using the SPSS software package (version 10.0,
SPSS Inc. Chicago, Illinois). All values are expressed as mean score ± standard deviation
except where indicated. Due to the non normality of the distribution of the PAT volume
statisticall analysis were performed on the natural log transformed PAT volume scores = ln (1
+ PAT volume score). To compare score values in different risk groups we used the Wilcoxon
signed rank test for unpaired data. A p-value under 0.05 was considered to indicate statistical
significance. We performed univariate Cox regression analysis to calculate hazard ratio and
95 percent confidence interval of coronary plaque in dependence of cardiovascular risk

factors (patients without cardiovascular risk factors served as the reference group), age, sex,
and PAT volume (patients with PAT volume below 100 cm³ served as the reference group).
To demonstrate the discriminatory power of PAT volume in the diagnosis of coronary plaques
the area under the receiver-operating characteristic (ROC) curve was determined. All figures
are given as mean standard ± deviation.
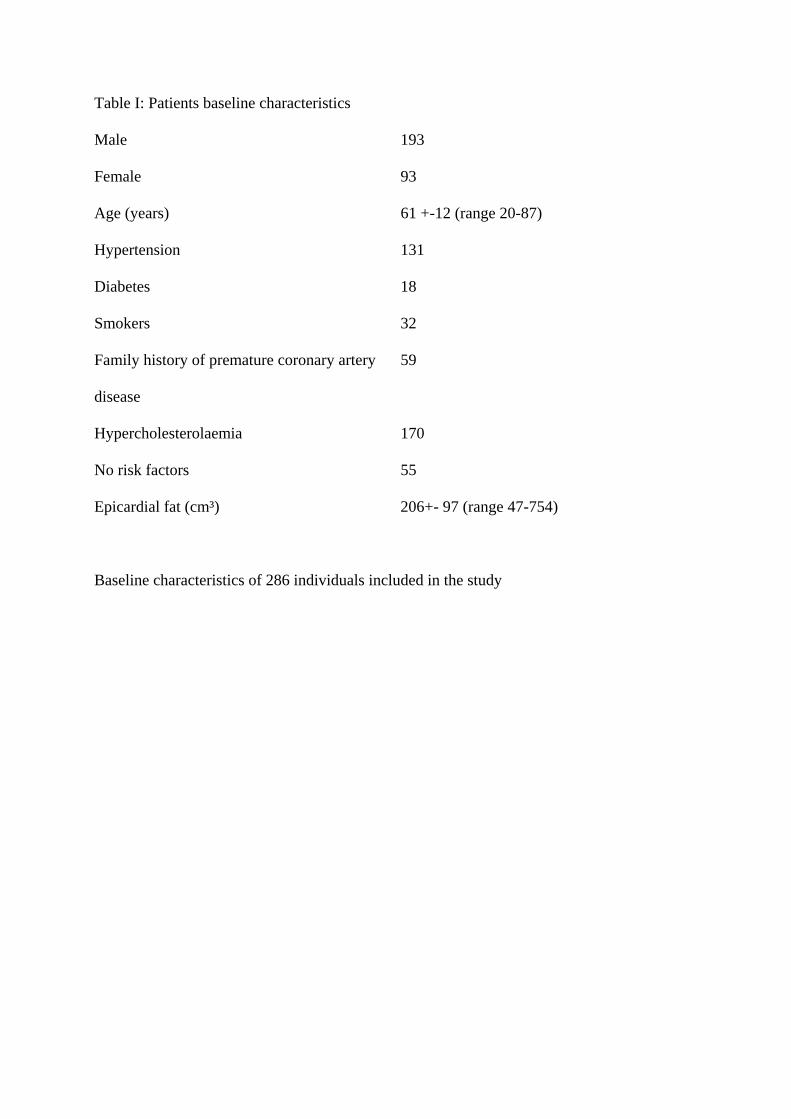
Table I: Patients baseline characteristics
Male 193
Female 93
Age (years) 61 +-12 (range 20-87)
Hypertension 131
Diabetes 18
Smokers 32
Family history of premature coronary artery
disease
59
Hypercholesterolaemia 170
No risk factors 55
Epicardial fat (cm³) 206+- 97 (range 47-754)
Baseline characteristics of 286 individuals included in the study