Embed Size (px)
Citation preview
20 Pericardial Effusion
CLINICAL IMAGAGINGAN ATLAS OF DIFFERENTIAL DAIGNOSIS
EISENBERG
DR. Muhammad Bin Zulfiqar PGR-FCPS III SIMS/SHL
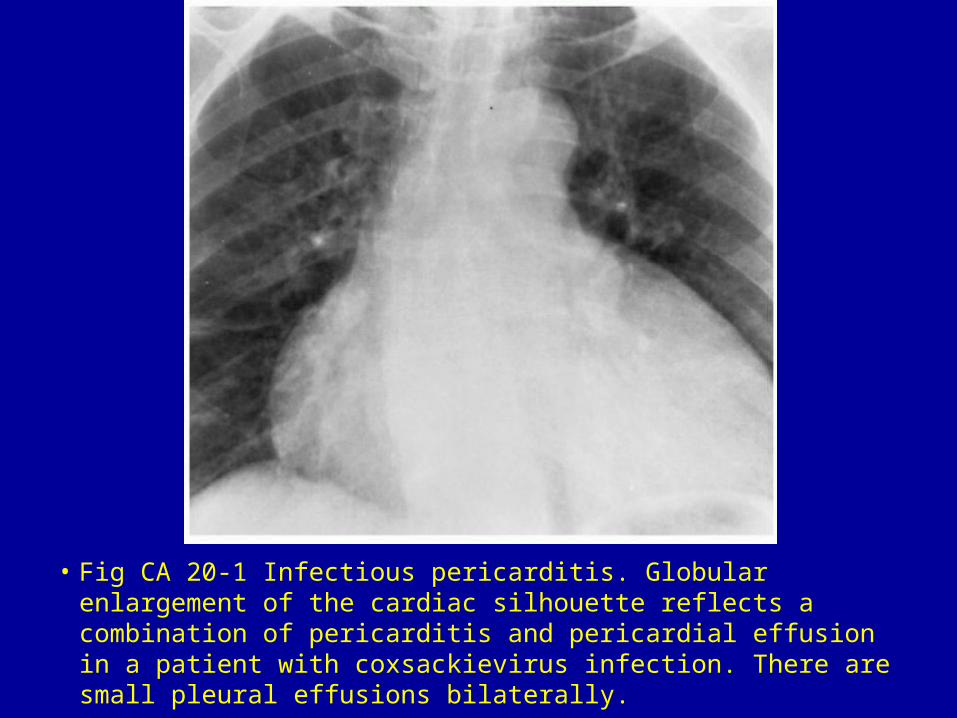
• Fig CA 20-1 Infectious pericarditis. Globular enlargement of the cardiac silhouette reflects a combination of pericarditis and pericardial effusion in a patient with coxsackievirus infection. There are small pleural effusions bilaterally.
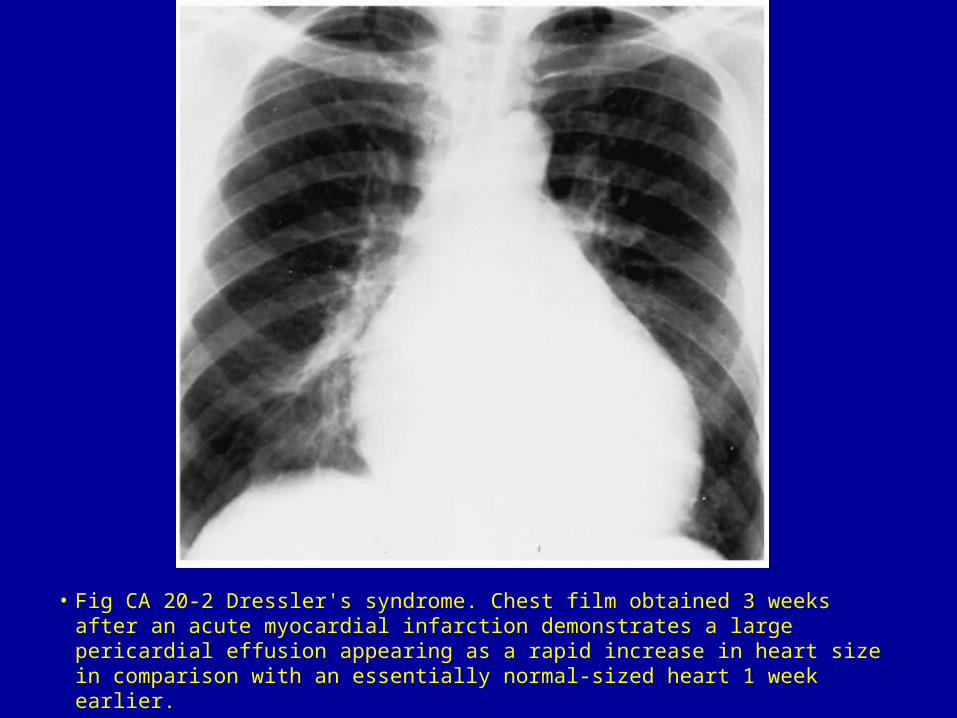
• Fig CA 20-2 Dressler's syndrome. Chest film obtained 3 weeks after an acute myocardial infarction demonstrates a large pericardial effusion appearing as a rapid increase in heart size in comparison with an essentially normal-sized heart 1 week earlier.
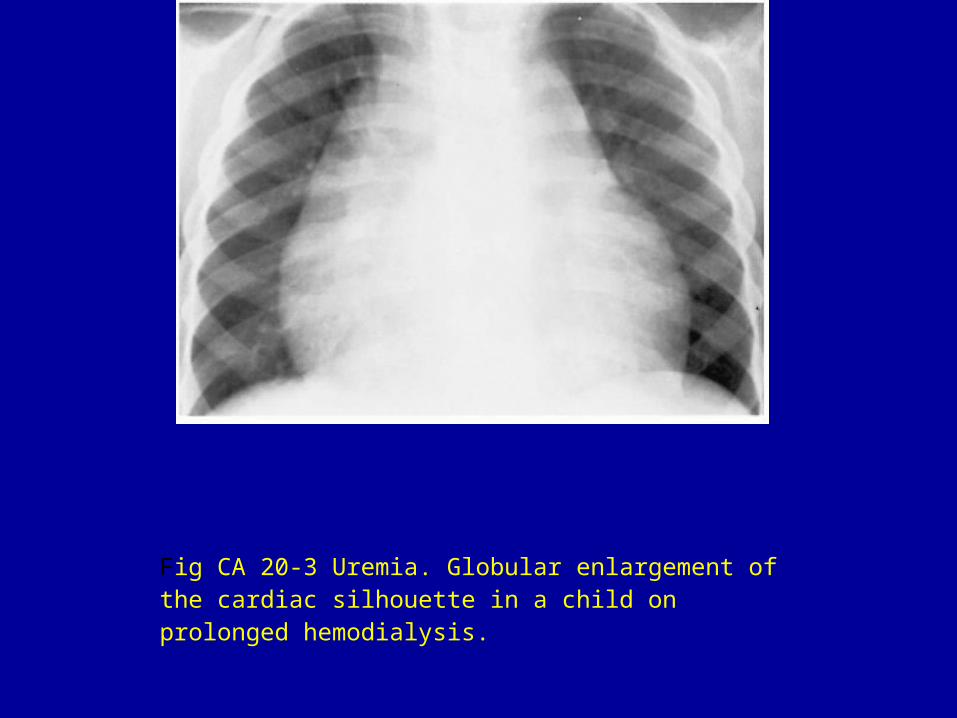
Fig CA 20-3 Uremia. Globular enlargement of the cardiac silhouette in a child on prolonged hemodialysis.
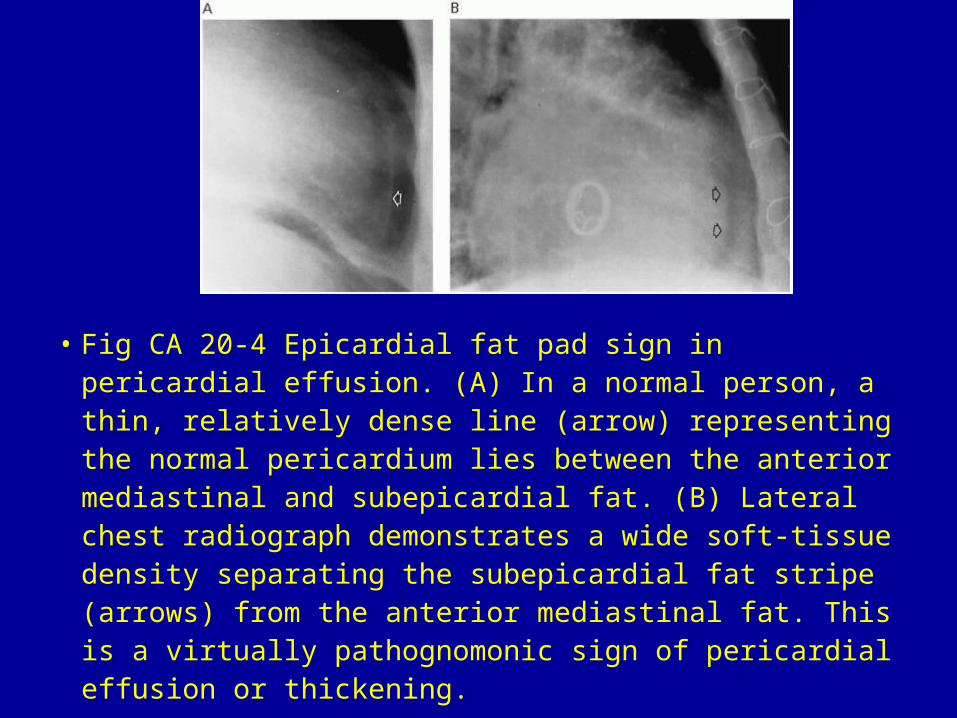
• Fig CA 20-4 Epicardial fat pad sign in pericardial effusion. (A) In a normal person, a thin, relatively dense line (arrow) representing the normal pericardium lies between the anterior mediastinal and subepicardial fat. (B) Lateral chest radiograph demonstrates a wide soft-tissue density separating the subepicardial fat stripe (arrows) from the anterior mediastinal fat. This is a virtually pathognomonic sign of pericardial effusion or thickening.
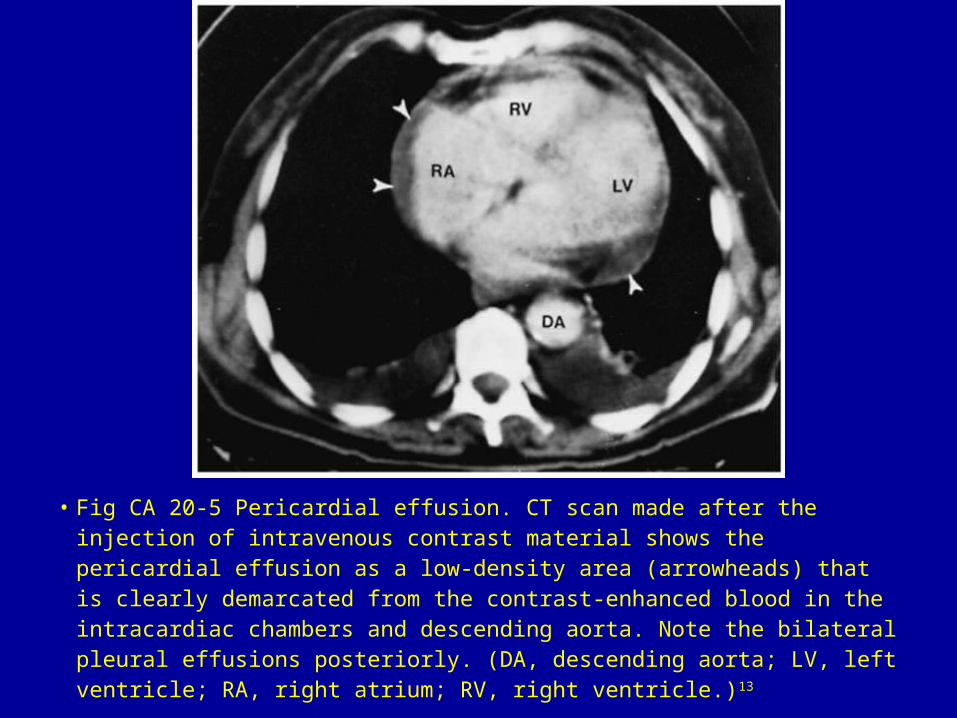
• Fig CA 20-5 Pericardial effusion. CT scan made after the injection of intravenous contrast material shows the pericardial effusion as a low-density area (arrowheads) that is clearly demarcated from the contrast-enhanced blood in the intracardiac chambers and descending aorta. Note the bilateral pleural effusions posteriorly. (DA, descending aorta; LV, left ventricle; RA, right atrium; RV, right ventricle.)13
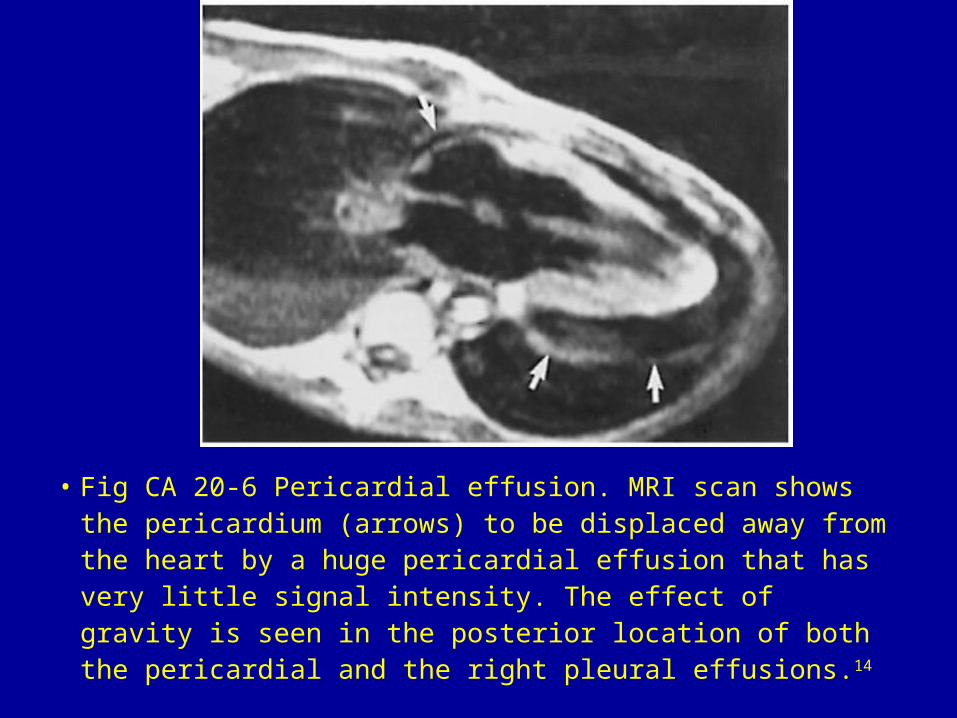
• Fig CA 20-6 Pericardial effusion. MRI scan shows the pericardium (arrows) to be displaced away from the heart by a huge pericardial effusion that has very little signal intensity. The effect of gravity is seen in the posterior location of both the pericardial and the right pleural effusions.14


![Challenges in Management of Pericardial Effusion in ... · [5,6]. It has been demonstrated that cardiac tamponade, a serious hemodynamic medical emergency as a result of pericardial](https://img.pdfslide.us/doc/110x75/5ceb108588c993886b8bfeff/challenges-in-management-of-pericardial-effusion-in-56-it-has-been-demonstrated.jpg)