Embed Size (px)
Citation preview
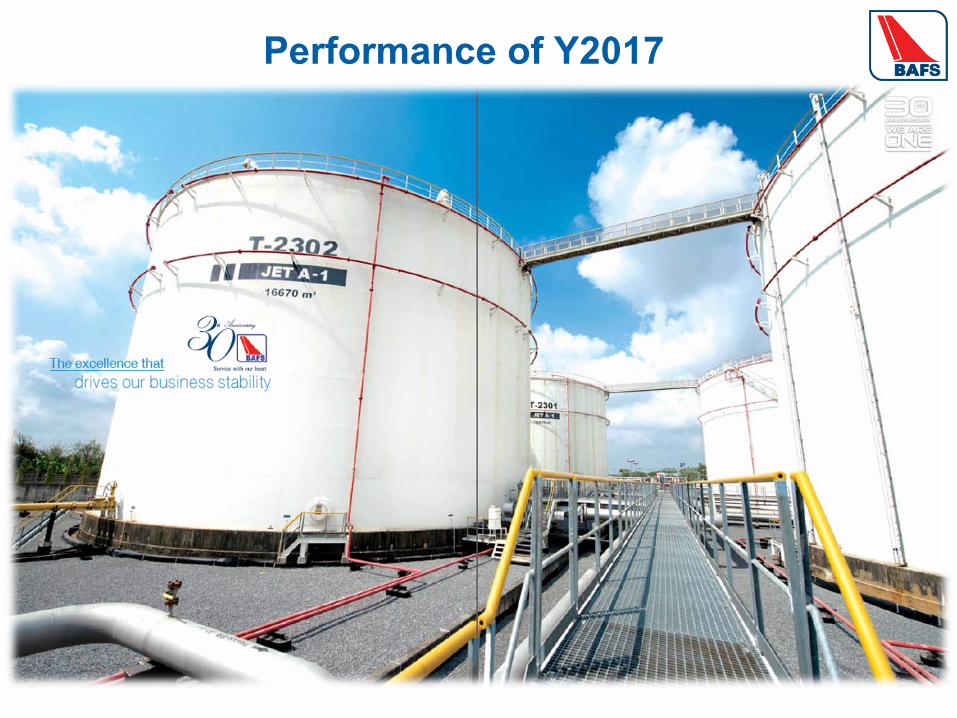
Performance of Y2017
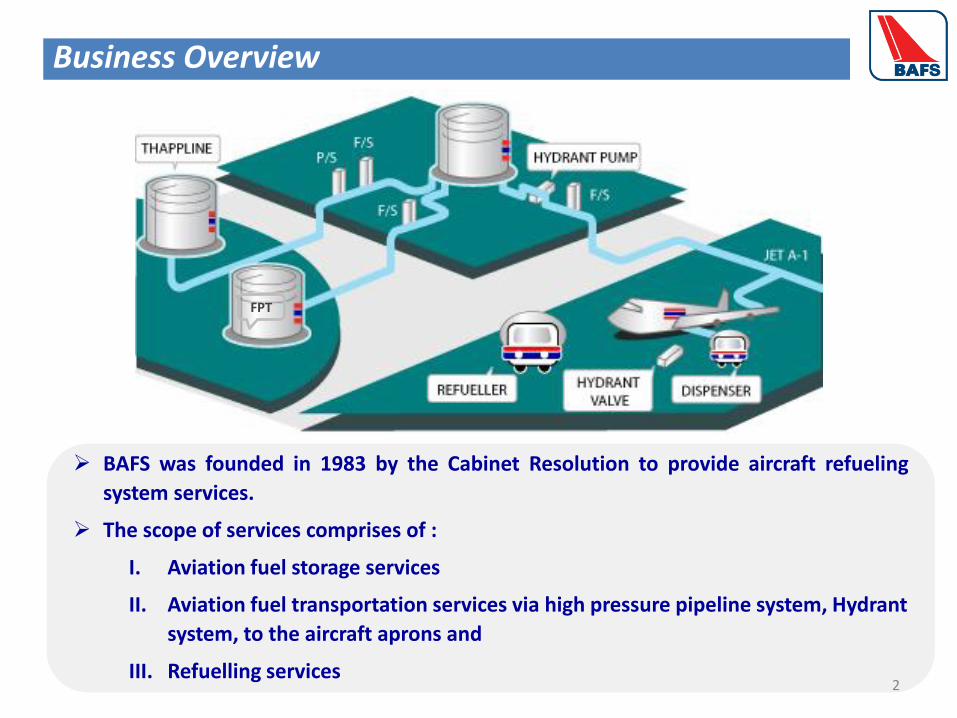
BAFS was founded in 1983 by the Cabinet Resolution to provide aircraft refueling
system services.
The scope of services comprises of :
I. Aviation fuel storage services
II. Aviation fuel transportation services via high pressure pipeline system, Hydrant
system, to the aircraft aprons and
III. Refuelling services
FPT
2
Business Overview
3
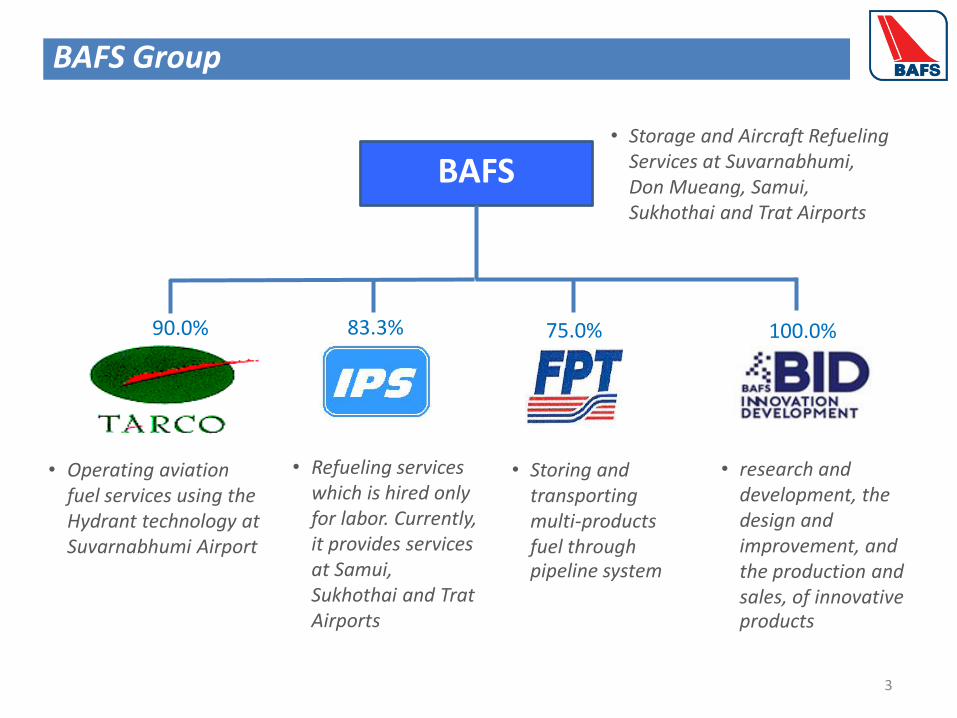
90.0% 83.3% 75.0%
BAFS
• Operating aviation fuel services using the Hydrant technology at Suvarnabhumi Airport
• Storage and Aircraft Refueling Services at Suvarnabhumi, Don Mueang, Samui, Sukhothai and Trat Airports
• Refueling services which is hired only for labor. Currently, it provides services at Samui, Sukhothai and TratAirports
• Storing and transporting multi-products fuel through pipeline system
BAFS Group
• research and development, the design and improvement, and the production and sales, of innovative products
100.0%
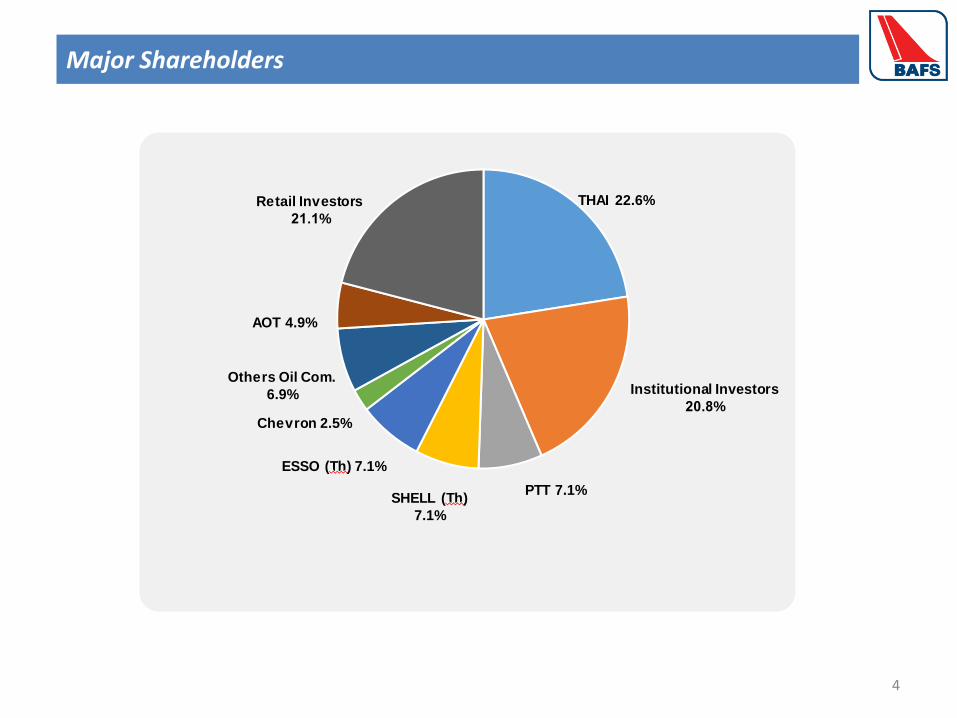
Major Shareholders
THAI 22.6%
Institutional Investors
%
PTT 7.1%
Chevron 2.5%
ESSO (Th) 7.1%
SHELL (Th)
7.1%
AOT 4.9%
Retail Investors
%
Others Oil Com.
6.9%
4
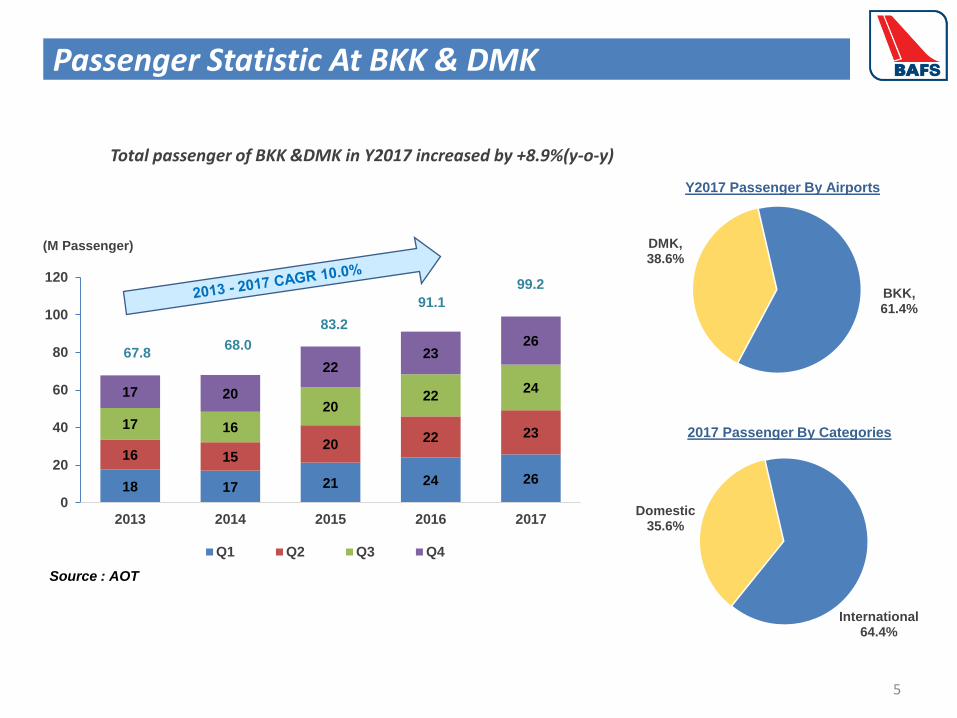
International64.4%
Domestic35.6%
BKK, 61.4%
DMK,38.6%
18 17 21 24 26
16 1520
22 2317 16
2022
2417 20
2223
26
0
20
40
60
80
100
120
2013 2014 2015 2016 2017
Q1 Q2 Q3 Q4
67.8
83.2
68.0
91.1
99.2
5
(M Passenger)
Y2017 Passenger By Airports
Source : AOT
Passenger Statistic At BKK & DMK
2017 Passenger By Categories
Total passenger of BKK &DMK in Y2017 increased by +8.9%(y-o-y)
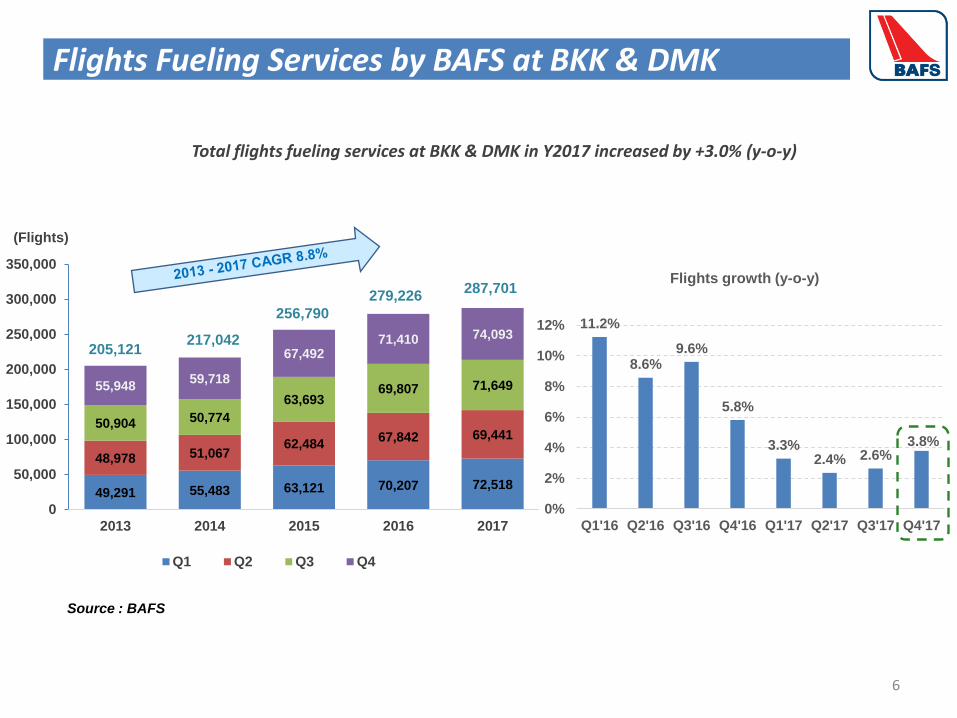
11.2%
8.6%9.6%
5.8%
3.3%2.4% 2.6%
3.8%
0%
2%
4%
6%
8%
10%
12%
Q1'16 Q2'16 Q3'16 Q4'16 Q1'17 Q2'17 Q3'17 Q4'17
Flights growth (y-o-y)
Flights Fueling Services by BAFS at BKK & DMK
49,291 55,483 63,121 70,207 72,518
48,978 51,06762,484
67,842 69,44150,904 50,774
63,69369,807 71,64955,948
59,718
67,49271,410 74,093
0
50,000
100,000
150,000
200,000
250,000
300,000
350,000
2013 2014 2015 2016 2017
Q1 Q2 Q3 Q4
205,121
256,790
217,042
279,226287,701
(Flights)
6
Total flights fueling services at BKK & DMK in Y2017 increased by +3.0% (y-o-y)
Source : BAFS
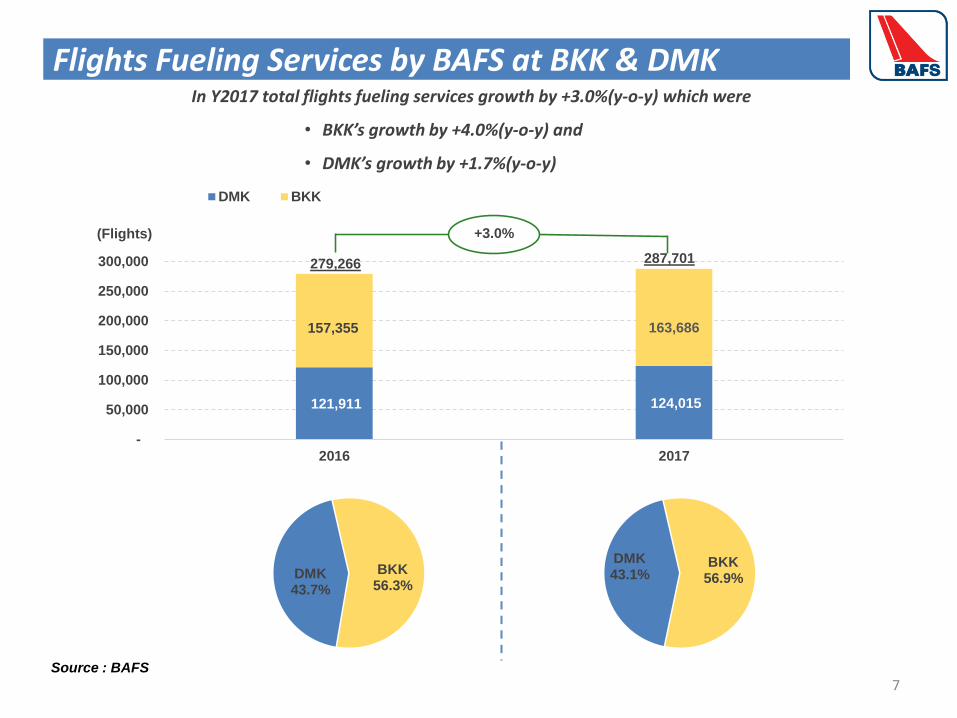
121,911 124,015
157,355 163,686
-
50,000
100,000
150,000
200,000
250,000
300,000
2016 2017
(Flights)
DMK BKK
279,266 287,701
7
Flights Fueling Services by BAFS at BKK & DMK
BKK56.9%
DMK43.1%BKK
56.3%DMK43.7%
In Y2017 total flights fueling services growth by +3.0%(y-o-y) which were
• BKK’s growth by +4.0%(y-o-y) and
• DMK’s growth by +1.7%(y-o-y)
+3.0%
Source : BAFS
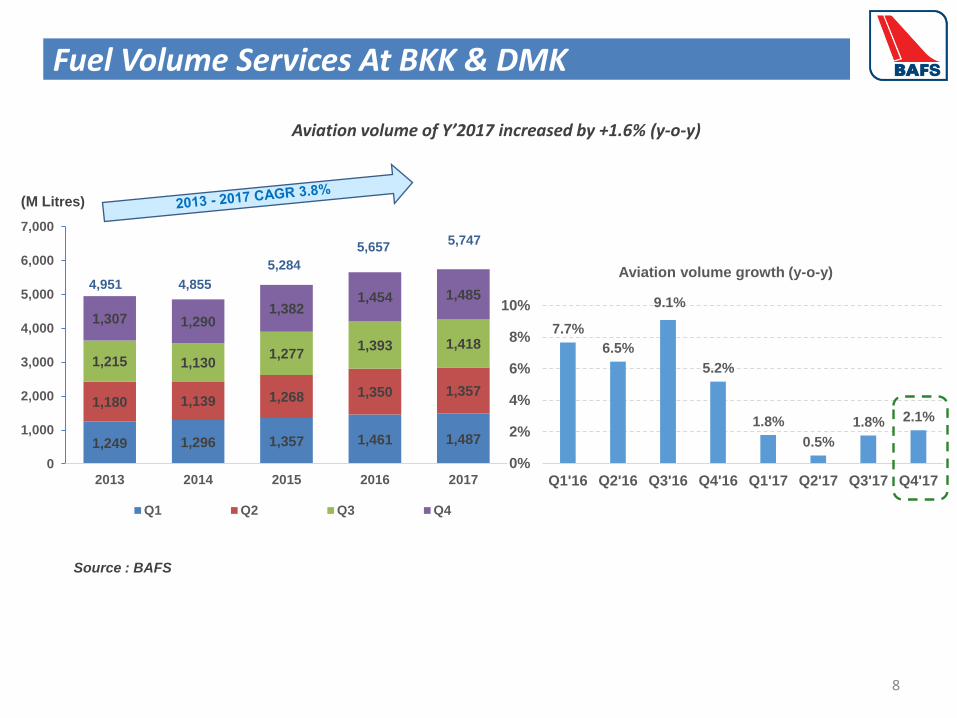
7.7%
6.5%
9.1%
5.2%
1.8%
0.5%
1.8% 2.1%
0%
2%
4%
6%
8%
10%
Q1'16 Q2'16 Q3'16 Q4'16 Q1'17 Q2'17 Q3'17 Q4'17
Aviation volume growth (y-o-y)
Fuel Volume Services At BKK & DMK
1,249 1,296 1,357 1,461 1,487
1,180 1,139 1,268 1,350 1,357
1,215 1,1301,277
1,393 1,418
1,307 1,2901,382
1,454 1,485
0
1,000
2,000
3,000
4,000
5,000
6,000
7,000
2013 2014 2015 2016 2017
Q1 Q2 Q3 Q4
5,747
4,951
5,284
4,855
5,657
(M Litres)
8
Aviation volume of Y’2017 increased by +1.6% (y-o-y)
Source : BAFS
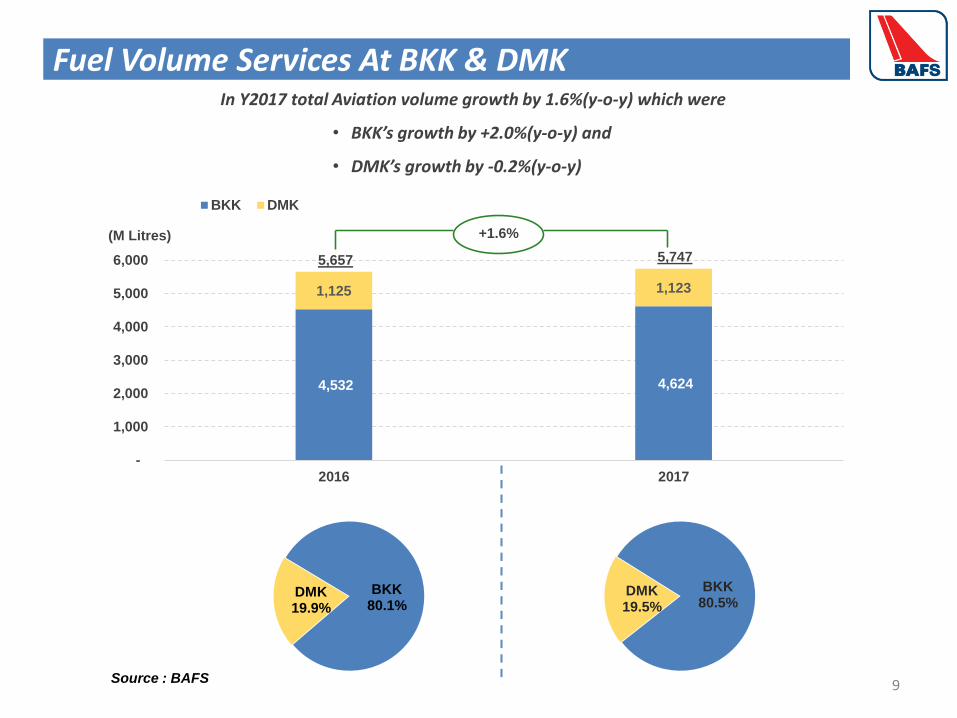
BKK80.1%
DMK19.9%
4,532 4,624
1,125 1,123
-
1,000
2,000
3,000
4,000
5,000
6,000
2016 2017
(M Litres)
BKK DMK
5,747
9
Fuel Volume Services At BKK & DMK
BKK80.5%
DMK19.5%
In Y2017 total Aviation volume growth by 1.6%(y-o-y) which were
• BKK’s growth by +2.0%(y-o-y) and
• DMK’s growth by -0.2%(y-o-y)
+1.6%
5,657
Source : BAFS
Q3’17
10
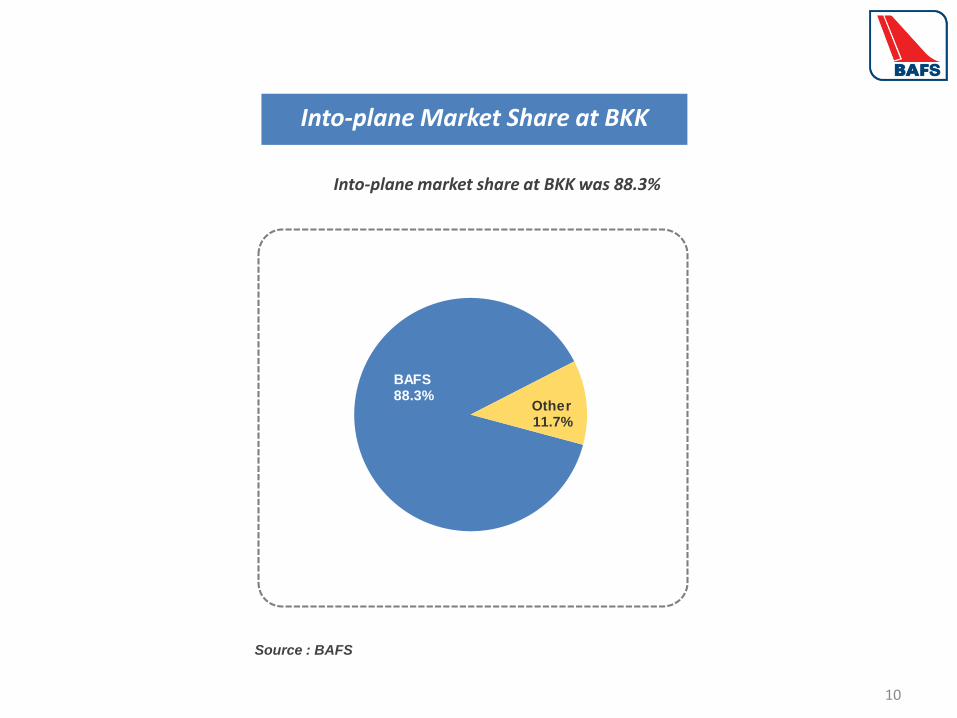
Into-plane Market Share at BKK
Into-plane market share at BKK was 88.3%
Source : BAFS
BAFS88.3%
Other11.7%
11
Financial Performance
Aviation Refueling
Business, 80%
Fuel Transportation,
20%
12
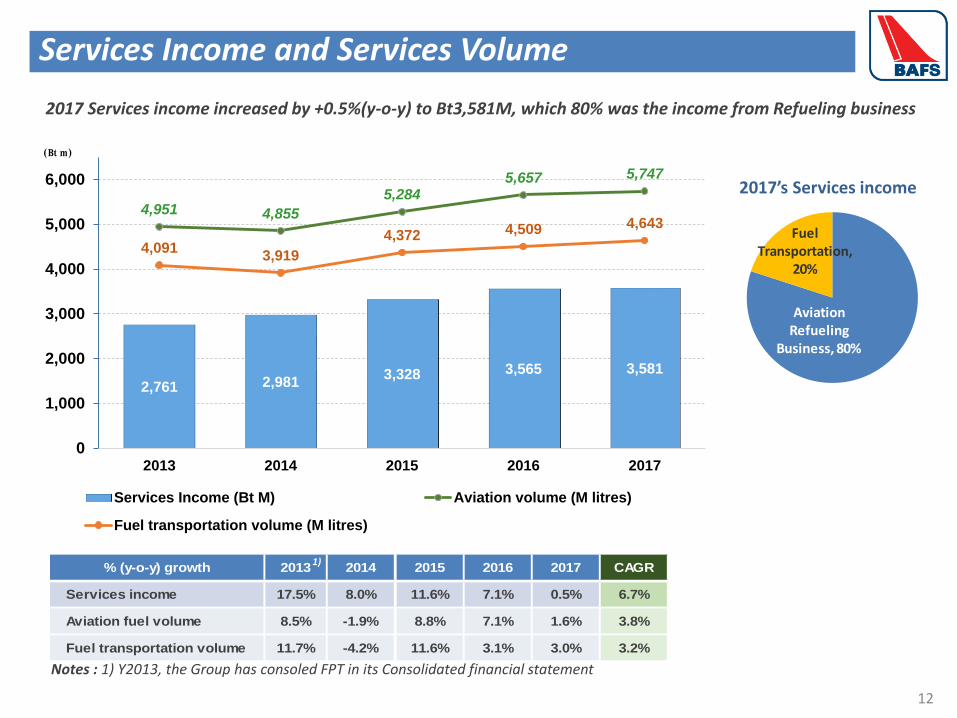
Services Income and Services Volume
% (y-o-y) growth 2013 2014 2015 2016 2017 CAGR
Services income 17.5% 8.0% 11.6% 7.1% 0.5% 6.7%
Aviation fuel volume 8.5% -1.9% 8.8% 7.1% 1.6% 3.8%
Fuel transportation volume 11.7% -4.2% 11.6% 3.1% 3.0% 3.2%
2017’s Services income
2017 Services income increased by +0.5%(y-o-y) to Bt3,581M, which 80% was the income from Refueling business
Notes : 1) Y2013, the Group has consoled FPT in its Consolidated financial statement
1)
2,761 2,9813,328 3,565 3,581
4,951 4,855
5,2845,657 5,747
4,0913,919
4,372 4,509 4,643
0
1,000
2,000
3,000
4,000
5,000
6,000
2013 2014 2015 2016 2017
Services Income (Bt M) Aviation volume (M litres)
Fuel transportation volume (M litres)
(Bt m)
Aviation Refueling Business, 87%
Fuel Transportation
13%
13
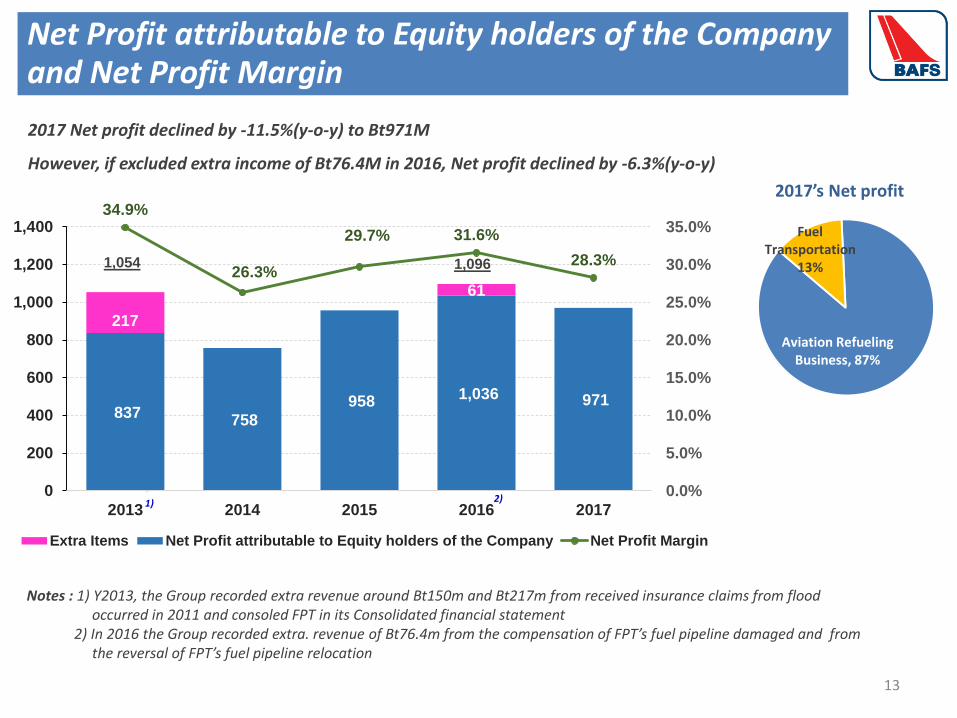
Notes : 1) Y2013, the Group recorded extra revenue around Bt150m and Bt217m from received insurance claims from flood occurred in 2011 and consoled FPT in its Consolidated financial statement
2) In 2016 the Group recorded extra. revenue of Bt76.4m from the compensation of FPT’s fuel pipeline damaged and from the reversal of FPT’s fuel pipeline relocation
Net Profit attributable to Equity holders of the Company and Net Profit Margin
2017’s Net profit
2017 Net profit declined by -11.5%(y-o-y) to Bt971M
However, if excluded extra income of Bt76.4M in 2016, Net profit declined by -6.3%(y-o-y)
1)2)
2)
837 758
958 1,036 971
217
61
34.9%
26.3%
29.7% 31.6%
28.3%
0.0%
5.0%
10.0%
15.0%
20.0%
25.0%
30.0%
35.0%
0
200
400
600
800
1,000
1,200
1,400
2013 2014 2015 2016 2017
Extra Items Net Profit attributable to Equity holders of the Company Net Profit Margin
1,0961,054
1)
Notes : 1) In 2016 the Group recorded extra. items of approximately Bt76.4M from the compensation of FPT’s fuel pipeline damaged and the reversal of FPT’s fuel pipeline relocation
14
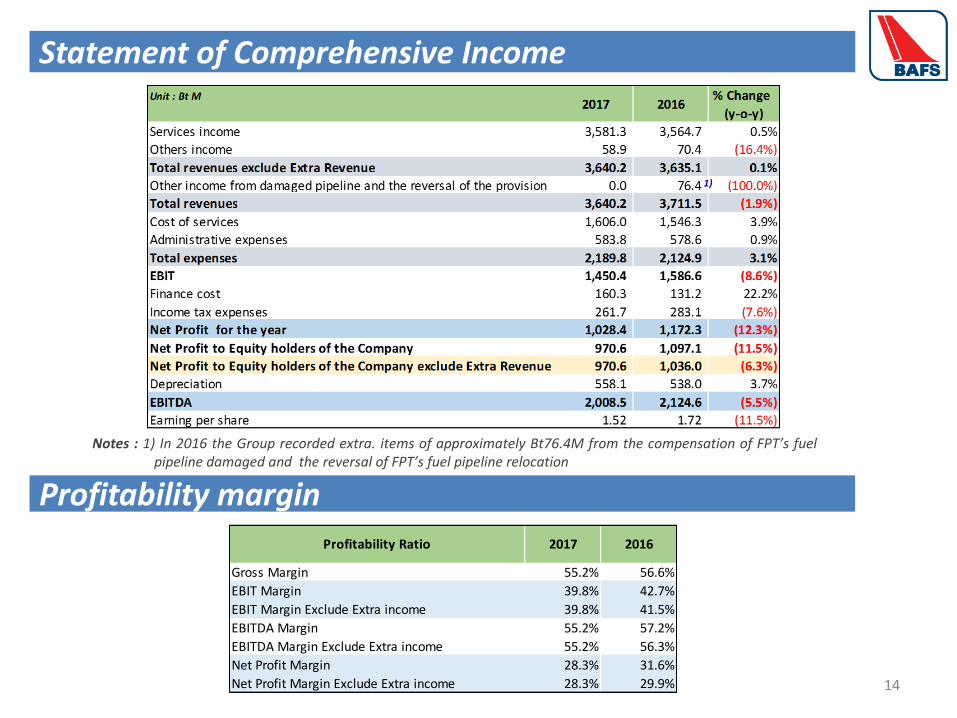
Statement of Comprehensive Income
Profitability margin
1)
Gross Margin 55.2% 56.6%
EBIT Margin 39.8% 42.7%
EBIT Margin Exclude Extra income 39.8% 41.5%
EBITDA Margin 55.2% 57.2%
EBITDA Margin Exclude Extra income 55.2% 56.3%
Net Profit Margin 28.3% 31.6%
Net Profit Margin Exclude Extra income 28.3% 29.9%
Profitability Ratio 20162017
7.82 8.188.89
11.56 11.87
4.0
7.0
10.0
13.0
16.0
2013 2014 2015 2016 2017
BV/Share(Bt)
14.2%
9.7%11.1% 11.3%
8.4%
23.6%
15.6%17.1% 18.0%
13.8%
0%
5%
10%
15%
20%
25%
30%
2013 2014 2015 2016 2017
ROA and ROE
ROA ROE
15
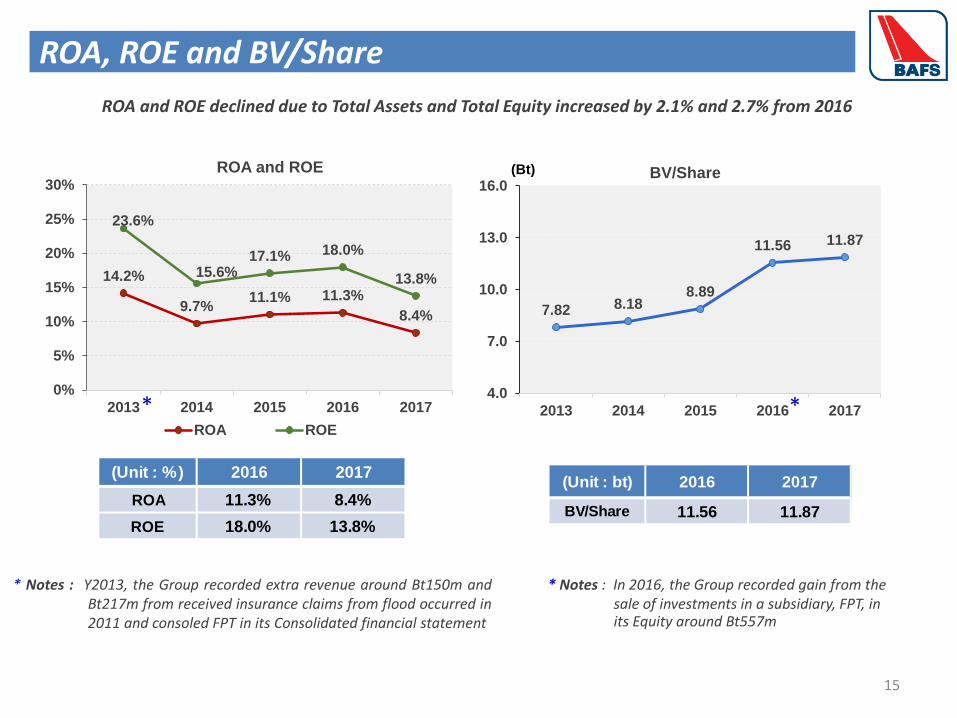
ROA, ROE and BV/Share
* Notes : In 2016, the Group recorded gain from the sale of investments in a subsidiary, FPT, in its Equity around Bt557m
ROA and ROE declined due to Total Assets and Total Equity increased by 2.1% and 2.7% from 2016
*
* Notes : Y2013, the Group recorded extra revenue around Bt150m and Bt217m from received insurance claims from flood occurred in 2011 and consoled FPT in its Consolidated financial statement
*
(Unit : %) 2016 2017
ROA 11.3% 8.4%
ROE 18.0% 13.8%
(Unit : bt) 2016 2017
BV/Share 11.56 11.87
16
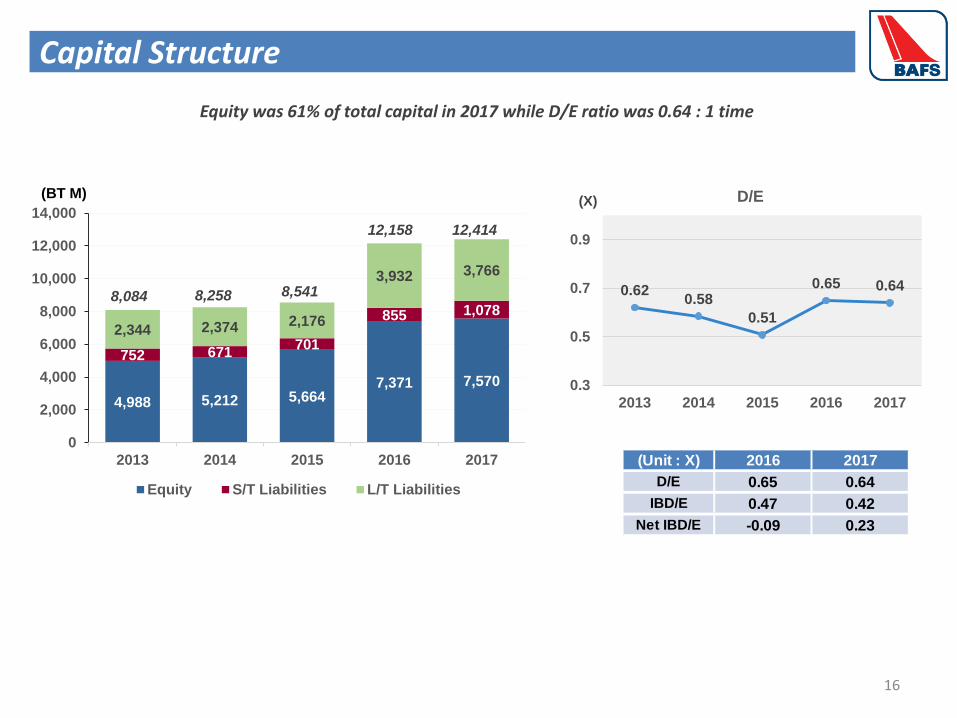
Capital Structure
Equity was 61% of total capital in 2017 while D/E ratio was 0.64 : 1 time
0.620.58
0.51
0.65 0.64
0.3
0.5
0.7
0.9
2013 2014 2015 2016 2017
D/E(X)
(Unit : X) 2016 2017
D/E 0.65 0.64
IBD/E 0.47 0.42
Net IBD/E -0.09 0.23
4,988 5,212 5,6647,371 7,570
752 671701
855 1,078
2,344 2,374 2,176
3,932 3,766
0
2,000
4,000
6,000
8,000
10,000
12,000
14,000
2013 2014 2015 2016 2017
Equity S/T Liabilities L/T Liabilities
8,084 8,258
12,158 12,414
8,541
(BT M)
17
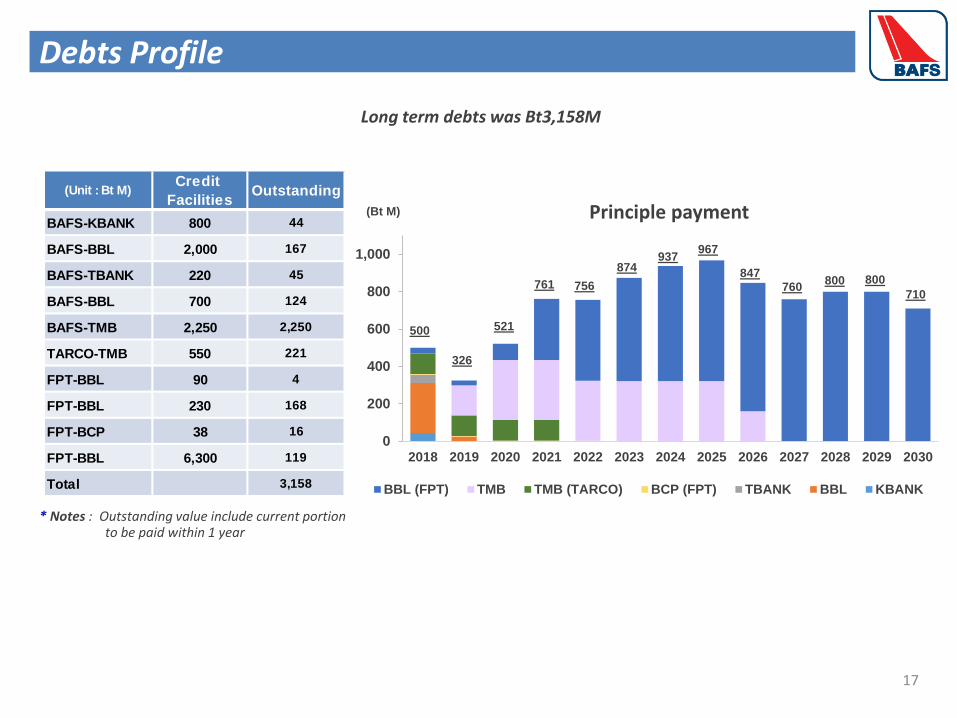
Debts Profile
Long term debts was Bt3,158M
* Notes : Outstanding value include current portion to be paid within 1 year
0
200
400
600
800
1,000
2018 2019 2020 2021 2022 2023 2024 2025 2026 2027 2028 2029 2030
Principle payment
BBL (FPT) TMB TMB (TARCO) BCP (FPT) TBANK BBL KBANK
(Bt M)
500
326
521
874
761
937967
847760756 800
710
800
(Unit : Bt M)Credit
FacilitiesOutstanding
BAFS-KBANK 800 44
BAFS-BBL 2,000 167
BAFS-TBANK 220 45
BAFS-BBL 700 124
BAFS-TMB 2,250 2,250
TARCO-TMB 550 221
FPT-BBL 90 4
FPT-BBL 230 168
FPT-BCP 38 16
FPT-BBL 6,300 119
Total 3,158
18
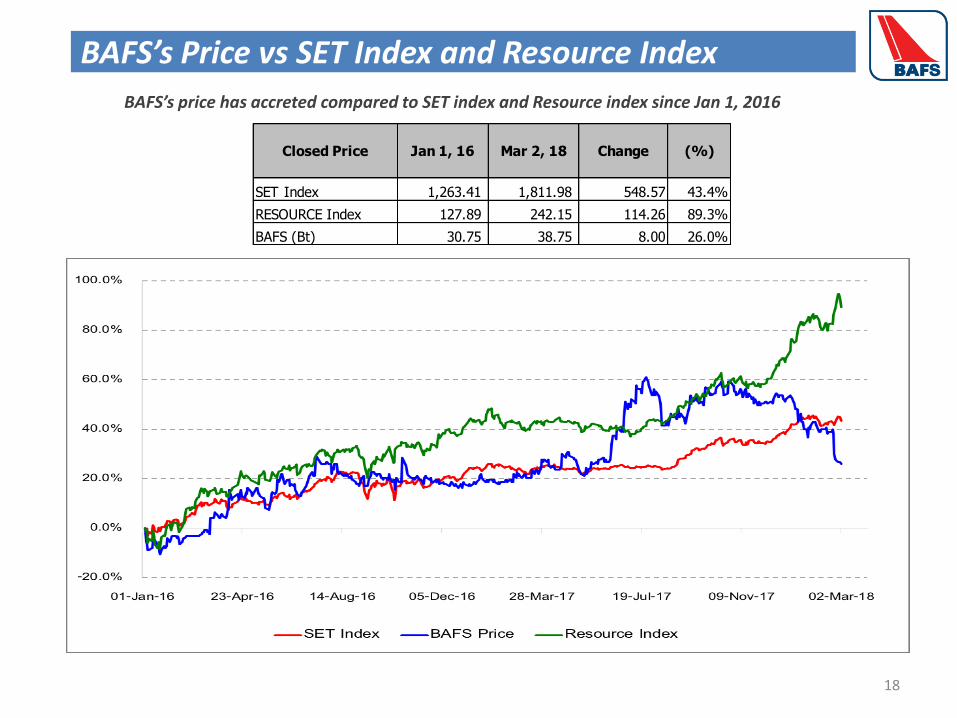
BAFS’s Price vs SET Index and Resource Index
BAFS’s price has accreted compared to SET index and Resource index since Jan 1, 2016
SET Index 1,263.41 1,811.98 548.57 43.4%
RESOURCE Index 127.89 242.15 114.26 89.3%
BAFS (Bt) 30.75 38.75 8.00 26.0%
Closed Price Jan 1, 16 Mar 2, 18 Change (%)
19
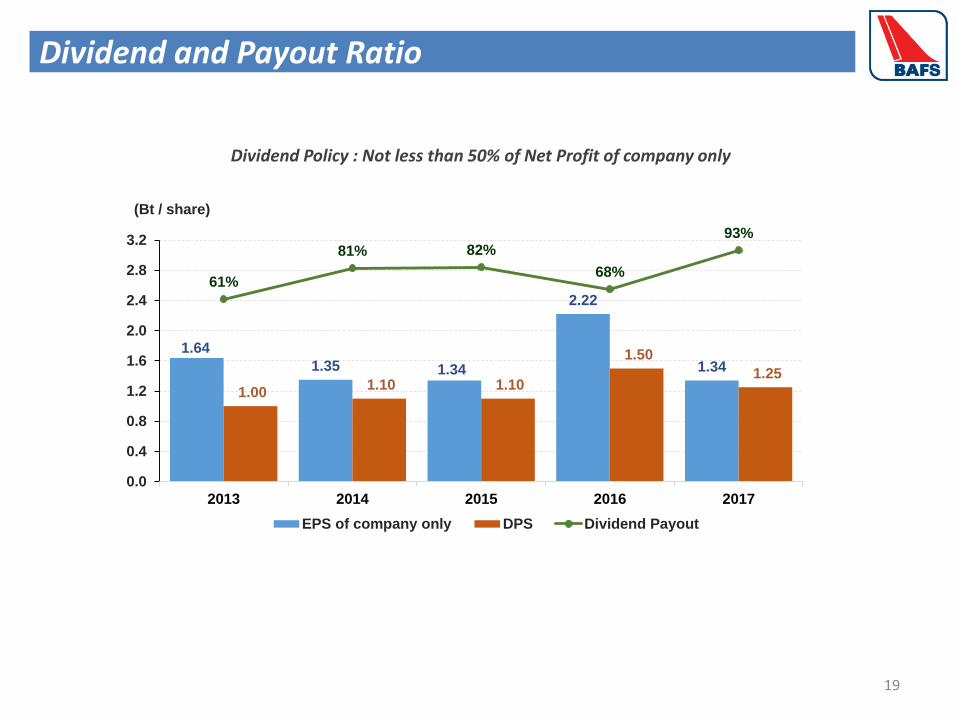
1.64
1.35 1.34
2.22
1.34
1.00 1.10 1.10
1.50
1.25
61%
81% 82%
68%
93%
-60.0%
-35.0%
-10.0%
15.0%
40.0%
65.0%
90.0%
0.0
0.4
0.8
1.2
1.6
2.0
2.4
2.8
3.2
2013 2014 2015 2016 2017
EPS of company only DPS Dividend Payout
(Bt / share)
Dividend and Payout Ratio
Dividend Policy : Not less than 50% of Net Profit of company only
20
Company Update
21
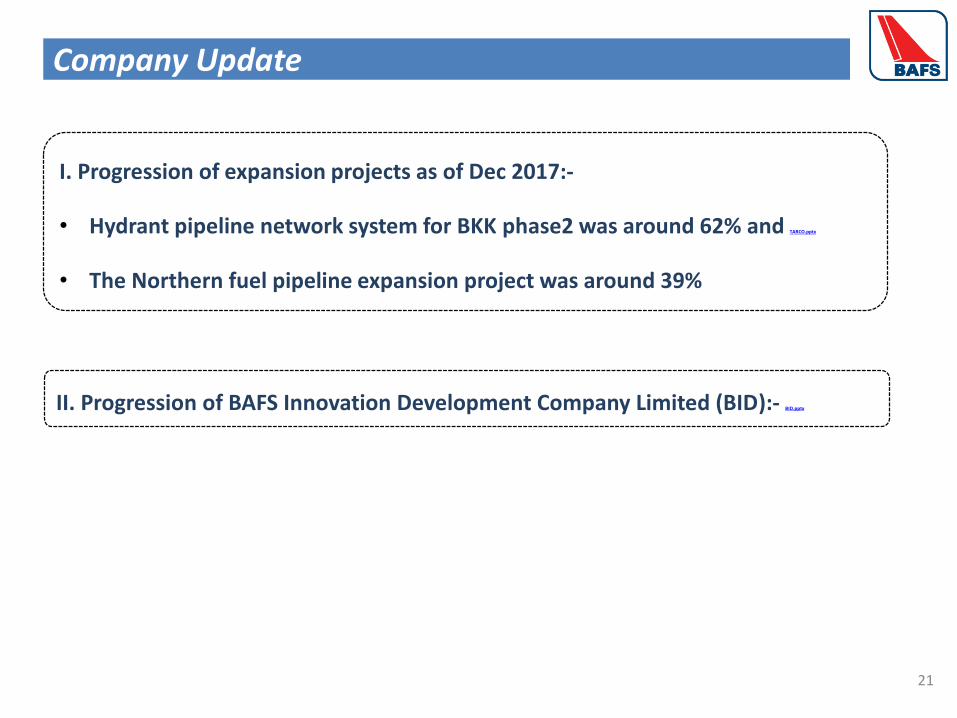
Company Update
I. Progression of expansion projects as of Dec 2017:-
• Hydrant pipeline network system for BKK phase2 was around 62% and TARCO.pptx
• The Northern fuel pipeline expansion project was around 39%
II. Progression of BAFS Innovation Development Company Limited (BID):- BID.pptx

Performance of Y2017