Embed Size (px)
DESCRIPTION
Performance Measures and BCA for RWIS in Idaho. Bob Koeberlein, P.E. Mobility Services Engineer Idaho Transportation Department. Research Team. Dennis Jensen, Winter Maintenance Coordinator Miranda Forcier, Six Mile Engineering, Winter Maintenance Analyst - PowerPoint PPT Presentation
Citation preview

T3 Ju
ly 8
201
4
Performance Measures and BCA for RWIS in IdahoBob Koeberlein, P.E.Mobility Services EngineerIdaho Transportation Department
1

T3 Ju
ly 8
201
4
Research Team• Dennis Jensen, Winter Maintenance Coordinator
• Miranda Forcier, Six Mile Engineering, Winter Maintenance Analyst
• Bob Koeberlein, Mobility Services Engineer
2

T3 Ju
ly 8
201
4
Topics
•Background•Approach•Results•Conclusions
3

T3 Ju
ly 8
201
4
Background (1)• ITD has invested substantially in Road Weather Information
Systems; 106 sites in current inventory, 103 with Winter Performance Reporting capability (“grip”)
• Starting in 2010 many new sites were built and most existing sites were upgraded to provide Winter Performance Reporting (WPR) data (surface grip values)
4
Season New /upgraded Sites
Current Total
2010-2011 46 70
2011-2012 9 79
2012-2013 24 103

T3 Ju
ly 8
201
4
Typical RWIS Site
5

T3 Ju
ly 8
201
4
RWIS Site
6
T3 Ju
ly 8
201
4
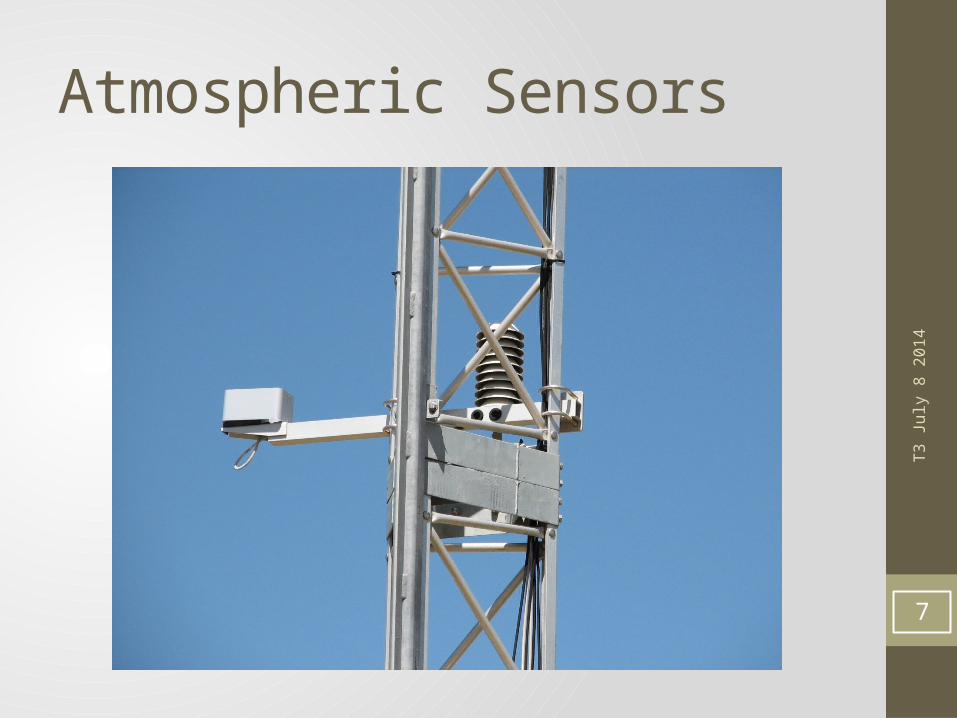
Atmospheric Sensors
7

T3 Ju
ly 8
201
4
RWIS Instruments
8

T3 Ju
ly 8
201
4
Statewide RWIS Distribution
9

T3 Ju
ly 8
201
4
Background (2)
• New RWIS sites average $125,000 (design, equipment, construction)• Annual operations costs average $5,500
per site, including maintenance, utilities and data management• The question to be answered is “what is
the return on investment for this expenditure in technology?”
10

T3 Ju
ly 8
201
4
Background (3)• The deployment of Winter Performance Measurement RWIS
sites enables the following activities:• Better winter maintenance practices
• Treatment timing• Material selection• Scenario review and critique• Performance Measurement-Mobility Index• Winter Maintenance Cost Reduction Trend • 2011-2012 $30M• 2012-2013 $25.5M• 2013-2014 $21.5M
• Higher quality road condition traveler information• Automated road condition reporting on 511 websites
11

T3 Ju
ly 8
201
4
Approach-Winter Mobility Index• Using RWIS pavement
data, calculate the percentage of time the maintenance crews were able to maintain a safe grip when the surface layer is below freezing temperatures.• Surface layer could be
liquid, frost, ice or snow• Only a liquid layer will
provide a safe grip number (>0.6) 12

T3 Ju
ly 8
201
4
Approach-Benefit/Cost• The benefit of the availability of Winter Performance Measurement
data on winter driving safety will be evaluated by:
• Comparing crash rates before and after data became available• During winter driving conditions• Use annual averages for multiple year data sets• Correlate highway segments to RWIS locations
• Establishing metrics for crash costs and average RWIS capital and operating costs (current year dollars)
• Average cost of a crash = $72,700 (based on 674 crashes 2011-2013)
• Average capital cost of RWIS = $125,000. Assumed service life is 10 years.
• Average annual operating cost per site = $5,500 (operations and maintenance)
13
T3 Ju
ly 8
201
4
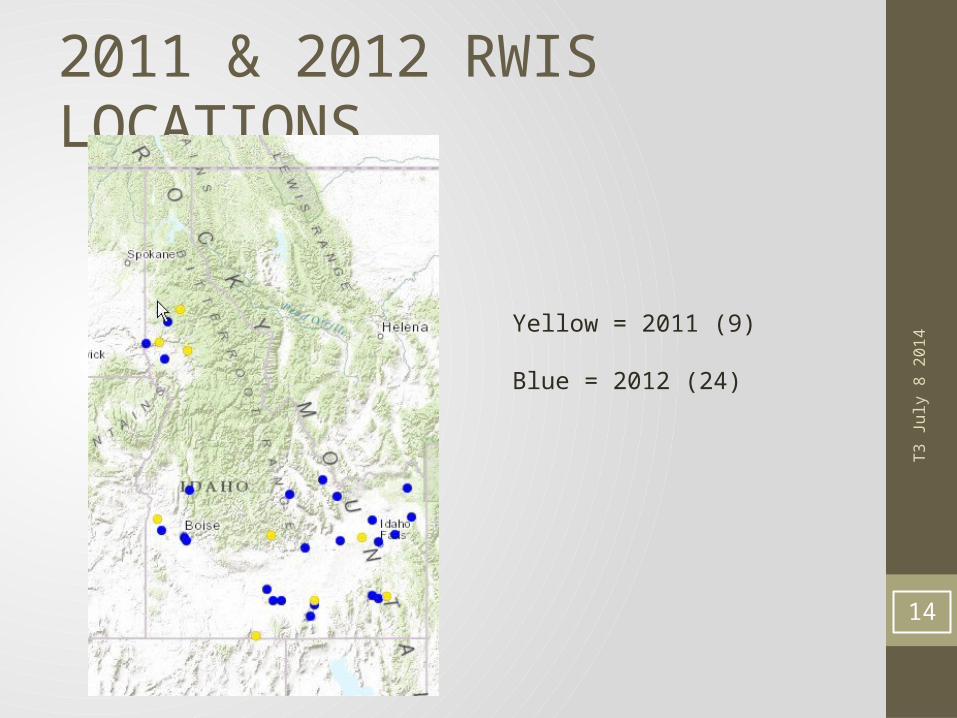
2011 & 2012 RWIS LOCATIONS
14
Yellow = 2011 (9)
Blue = 2012 (24)
T3 Ju
ly 8
201
4
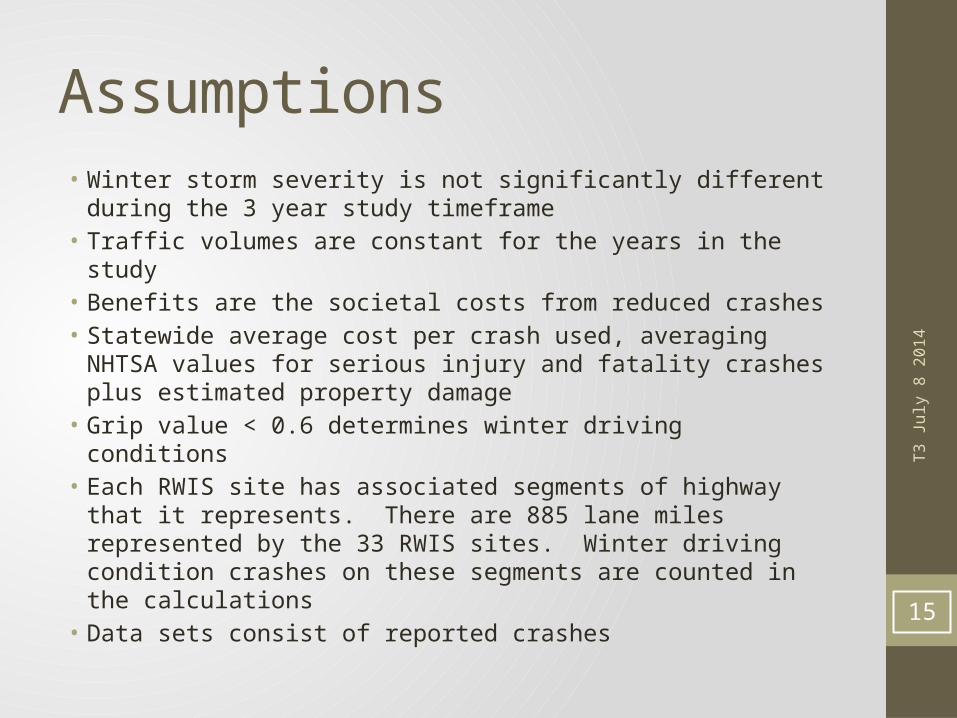
Assumptions• Winter storm severity is not significantly different during the 3
year study timeframe• Traffic volumes are constant for the years in the study• Benefits are the societal costs from reduced crashes• Statewide average cost per crash used, averaging NHTSA
values for serious injury and fatality crashes plus estimated property damage
• Grip value < 0.6 determines winter driving conditions • Each RWIS site has associated segments of highway that it
represents. There are 885 lane miles represented by the 33 RWIS sites. Winter driving condition crashes on these segments are counted in the calculations
• Data sets consist of reported crashes15

T3 Ju
ly 8
201
4
Calculations• Benefits = cumulative monetized reduction in crash incidents
by site/segments (annualized)
CR (crash reduction) = crash total (before data) – crash total (after data)
Benefits = CR x average cost of crash
• Costs = annualized capital and operating costs of WPR RWIS network
Costs = $capital/n + $network operating cost/year(n = site service life)
16

T3 Ju
ly 8
201
4
Results
For RWIS Highway Segments
Benefits for Crash Reduction
17
2010-2011 2011-2012 2012-2013
Series1 301 226 147
25
75
125
175
225
275
325
Total Crashes
Num
ber o
f Cra
shes
9 Sites
33 Sites
2010-2011 2011-2012 2012-2013
Value of Crashes Avoided
0 5452500 11195800
$1,000,000
$3,000,000
$5,000,000
$7,000,000
$9,000,000
$11,000,000
Value of Crashes Avoided
Cras
h Va
lue 9 Sites
33 Sites

T3 Ju
ly 8
201
4
Return on Investment-Crash ReductionsSeason Annual
Crashes pre data
Annual Crashes post
data
Annual Net Difference
Return on Investment
2011-2012 301 226 75 33.7
2012-2013 301 147 154 18.8
Totals 229 22.0
18
Assuming 10 year service life of RWIS site,
2011-2012 ROI = 75 x 72,700/((125,000/10+5,500 ) x 9 ) = 33.7
2012-2013 ROI = 154 x 72,700/((125,000/10 +5,500) x 33) = 18.8
Totals ROI = 229 x 72,700/((125,000/10 +5,500) x 42) = 22.0

T3 Ju
ly 8
201
4
Return on Investment-Operations
Season $ Winter Maintenance
$ Difference $ RWIS Network Operations
Benefit/Cost
2011-2012 30.0 M
2012-2013 25.5 M 4.5 M 1.85 M 2.42
2013-2014 21.5 M 4.0 M 1.85 M 2.16
19
• 103 RWIS sites statewide• $18,000 annual capital and operations costs

T3 Ju
ly 8
201
4
Conclusions• For regions with winter driving conditions, strategically placed
RWIS sites with pavement condition instrumentation offer attractive returns on investment when the data is integrated into a winter maintenance program and a traveler information system
• The Winter Performance Measurement program enabled by RWIS deployment meets the strategic goals of ITD• Safety
• Crash reductions• Mobility
• Maintaining safe grip (>0.6)• Economic opportunity
• Enabling commercial traffic flow
20

T3 Ju
ly 8
201
4
Questions or Comments?
• Bob Koeberlein, P.E.• Idaho Transportation Department• Mobility Services Engineer• [email protected]
• 208 334 8487
• Thanks for your attention! 21