Embed Size (px)
Citation preview

i
Faculty of Engineering of University of Porto
Performance Measurement on Automotive Assembly Line
João Carlos Archer Cunha Alegre
Report of Project/Dissertation
Master in Electronics and Computer Engineering Major Automation
Supervisor: Prof. Américo Lopes Azevedo Company Supervisor: Eng. António Norberto
June, 2010

ii
© João Alegre, 2010

iii
Abstract
The subject of performance measurement was always alongside with automobile
industry, since its beginnings by Henry Ford with the first automobile assembly line
for the Ford T model to the current state of the art assembly lines, improving
throughout time.
Nowadays, with the current automobile sector crisis, it is even more mandatory
to achieve the best performance possible the lower resources. This overwhelming
challenge leads to the needs of faster and more accurate ways to determine the
performance in order to lead industry to right path.
The following document describes the processes used by Volkswagen-Autoeuropa
to measure their performance on their assembly lines, also the design of an
information system capable of measuring performance. A brief description on
theories is presented as well as a functional prototype.

iv
v
Acknowledgements
I would like to take this chance to thank the several persons that helped me
through this educational process of mine and throughout life.
Above all, to my family, for the love shown and the belief in my capabilities.
To a special friend, Tweety, for all the love and support.
To João Silva for the good friendship, support and incitement to finish this
project.
To my friends, for all the good moments we had.
To Professor Américo Lopes Azevedo for the guidance throughout this work.
To Eng. António Norberto for the availability shown in receiving me as his
apprentice on his company and for the support given during my stay.
To Ana, Anabela and Joana for all the help and extraordinary ideas and vision
past during my stay.
To Nuno who revealed a fellow ally in this last challenge.

vi

vii
Index
Abstract .......................................................................................................... iii Acknowledgements ............................................................................................. v Index ............................................................................................................ vii List of Figures ................................................................................................... ix List of Tables .................................................................................................... xi Abbreviations and Symbols ................................................................................ xiii
Chapter 1 ....................................................................................... 1
Introduction ..................................................................................................... 1
1.1 Framing and Objective ................................................................................ 1 1.2 Methodology ............................................................................................ 2 1.3 Document Organization ............................................................................... 2
Chapter 2 ....................................................................................... 4
The Automotive Assembly Line ............................................................................. 4
2.1 Business .................................................................................................. 5 2.2 Objectives ............................................................................................... 5 2.3 Products ................................................................................................. 6 2.4 Plant layout and Production Areas .................................................................. 7 2.5 Production Areas ....................................................................................... 7 2.5.1 The Press Shop ......................................................................................... 7 2.5.2 The Body Shop .......................................................................................... 8 2.5.3 The Paint Shop ......................................................................................... 9 2.5.4 The Trim & Assembly Shop ......................................................................... 10 2.5.5 Workers ................................................................................................ 10 2.5.6 Working Schedule .................................................................................... 11 2.6 Assembly Line Characterization ................................................................... 12
Chapter 3 ...................................................................................... 15
The VFF Project ............................................................................................... 15
3.1 The VFF Concept ..................................................................................... 15 3.2 The VFF expectations ............................................................................... 16
Chapter 4 ...................................................................................... 19
Performance Measurement ................................................................................. 19
4.1 KPI ..................................................................................................... 21

viii
4.2 Volkswagen Autoeuropa Process Description ................................................... 23 4.3 Volkswagen Autoeuropa KPIs ...................................................................... 26 4.3.1 OHPU – Organizational Hours per Unit ........................................................... 26 4.3.2 Productivity (units/employee) .................................................................... 27 4.3.3 Hours per Unit (HPU) ................................................................................ 28 4.4 HPU Calculation Process Analisys ................................................................. 31 4.5 Information Flux ..................................................................................... 33
Chapter 5 ...................................................................................... 35
Requirements Analysis and Specification ............................................................... 35
5.1 Stakeholders .......................................................................................... 35 5.2 General System Requirements .................................................................... 36 5.3 Functional Requirements ........................................................................... 37 5.4 Early Prototype....................................................................................... 43
Chapter 6 ...................................................................................... 49
Performance Measure Support System .................................................................. 49
Chapter 7 ...................................................................................... 54
Conclusions ..................................................................................................... 55
7.1 Main Conclusions ..................................................................................... 55 7.2 Future work ........................................................................................... 56
References ..................................................................................................... 57

ix
List of Figures
Fig. 2-1 – Volkswagen Sharan ................................................................................ 6 Fig. 2-2 – Volkswagen Eos .................................................................................... 6 Fig. 2-3 – Volkswagen Scirocco .............................................................................. 6 Fig. 2-4 – Plant layout ......................................................................................... 7 Fig. 2-5 - Press Shop - overview of Press shop area, were 2 of the 5 tri-axial press are
visible as well as several molds. ...................................................................... 8 Fig. 2-6 – The Body Shop – overview of body shop, deck assembly where several robots
perform automated tasks. ............................................................................. 8 Fig. 2-7 – The Paint Shop ..................................................................................... 9 Fig. 2-8 – The Trim & Assembly shop ..................................................................... 10 Fig. 2-9 – Area Workers Percentage ...................................................................... 11 Fig. 2-10 – 2Shift Scenario .................................................................................. 11 Fig. 2-11 - 3 Shift Scenario ................................................................................. 12 Fig. 2-12 Schematic of entire process .................................................................... 12 Fig. 2-13 - Assembly Line Process ......................................................................... 13 Fig. 2-14 - Stamping Shop Process ........................................................................ 14 Fig. 3-1 - VFF General Overview[1] ....................................................................... 15 Fig. 3-2 - VFF Project - Detailed Pillars View[1] ....................................................... 18 Fig. 4-1 - Participation Scenarios ......................................................................... 24 Fig. 4-2 - Performance Monitoring in Volkswagen Autoeuropa ...................................... 24 Fig. 4-3 – Target values evolution ......................................................................... 25 Fig. 4-4 - Production evolution ............................................................................ 25 Fig. 4-5 - OHPU IDEF0 ....................................................................................... 27 Fig. 4-6 - Productivity IDEF0 ............................................................................... 28 Fig. 4-7 – Payroll update sequence ....................................................................... 29 Fig. 4-8 Absenteeism gather sequence ................................................................... 30 Fig. 4-9 – Adjustments gather sequence ................................................................. 30 Fig. 4-10 – Productions volume retrieval ................................................................ 31 Fig. 4-11 – HPU Calculation steps ......................................................................... 31 Fig. 5-1 – Organizational Structure for Project ......................................................... 35 Fig. 5-2 – Use Case Packages Diagrams................................................................... 37 Fig. 5-3 – Configuration use case package ............................................................... 38 Fig. 5-4 - Data Use Cases Diagram ........................................................................ 40 Fig. 5-5 - Reporting Use Cases Diagram .................................................................. 42 Fig. 5-6 - HPU Report Presentation ....................................................................... 43 Fig. 5-7 – HPU Calculation steps ........................................................................... 44 Fig. 5-8 – Calculation prototype – main input screen .................................................. 44 Fig. 5-9 – calculation prototype – payroll screen ....................................................... 45 Fig. 5-10 – Calculation prototype – Exceptions, Internal transfers, Absenteeism and
Training screen ........................................................................................ 46 Fig. 5-11 – Calculation Prototype – Final calculations for KPI values per model ................. 46 Fig. 6-1 - Splash Screen .................................................................................... 49 Fig. 6-2 - Login Screen ...................................................................................... 50 Fig. 6-3 - Main Screen ....................................................................................... 50 Fig. 6-4 – Plant definitions and Module Configurations ............................................... 51 Fig. 6-5 – Interface for defining new KPI ................................................................ 52 Fig. 6-6 – Input definition .................................................................................. 52 Fig. 6-7 – Define New Product ............................................................................. 52 Fig. 6-8 - Define Report Prompt ........................................................................... 53 Fig. 6-9 – Data Validation by User......................................................................... 53 Fig. 6-10 - Report Visualization Screen .................................................................. 54

x

xi
List of Tables
Table 3-1 – The VFF Advancements referring to current State of the Art [1] ..................... 18 Table 5-1 - Users Levels .................................................................................... 37


xiii
Abbreviations and Symbols
KPI Key Performance Indicators
VFF Virtual Factory Framework
VW Volkswagen
VW-AE Volkswagen Autoeuropa
SOP Start of Product
FIFO First In First Out
MPV Multi-Purpose Vehicle
Sci Scirocco
SME Small and Medium Enterprises
CSF Critical Success Factor
ROI Return of Investment
Sqm Square Meters


Chapter 1
Introduction
The following thesis is part of requirements to achieve the Master’s Degree in Electrical
and Computer Engineering, Automation and Management Specialization in the Faculty of
Engineering of University of Porto.
This makes thesis make an approach to the development of a system capable of measuring
performance on an automobile assembly line, in a Volkswagen Plant.
On this chapter, the author introduces the objectives and overall framing of developed
work as well as used methodologies and document organization.
1.1 Framing and Objective
On the actual scope of automobile industry, the performance measurement is a
subject of greatest importance, this due to the financial crisis world is currently facing and
especially to the oil crisis. Life is more expensive, potential buyers have less capacity to face
investments. These factors are pushing plants to their productive limits in order to reduce
costs to the minimum and make strategic decisions based on the most accurate data as
possible and the fastest as possible for quicker reactions.
With the development of this work it is intended to learn the processes used by VW
AE to measure the performance on the assembly lines and develop a system capable of
effectively measure their performance. On a next phase of project it is meant to develop a
new approach on how to determine the main Key Performance Indicators currently in use.
For the Volkswagen Plant, the outcome of this work would be an improvement to its
current performance measurement process and also to comply with the role taken part on a
larger European project, Virtual Factory Framework. For this project the Volkswagen Plant
should contribute with it’s know how for the achievement of VFF Objective, to foster and
strengthen the primacy of Future European Factory Manufacturing.

2 Introduction
Due to company security issues all values presented on this document were tampered
as well as field names, focus was given to the overall process itself and its improvement
capabilities.
1.2 Methodology
Due to the high level of complexity of current system, the author conducted a
thorough investigation of the process in order to be able to fully understand it on all its
extension and capability.
After the retrieval of all relevant data, based on workflow methodology, the author
developed the requirements specifications according to systems engineering methodology.
As first step the concepts underlying the process, which could take high influence on
project, were identified. Afterwards Stakeholders and system requirements were pointed out;
this allowed a sketch of functional interfaces to be developed.
The interface follows an approach on workflow to make it easier to final user to
follow the steps required.
1.3 Document Organization
This document is divided in the following chapters:
Chapter 1 – Introduction and methodologies used.
On this chapter an introduction to the subject is made and a brief explanation of
used methodologies.
Chapter 2 – Automotive Assembly Line
Description of the assembly line present at the plant where the author was placed
for final project.
Chapter 3 – The VFF Project.
Brief description of the Virtual Factory Framework is given in order to understand
the wider range in which this thesis is inserted.
Chapter 4 – Performance Measurement
Brief introduction to performance measurement and current KPI processes
description at Volkswagen Autoeuropa.
Chapter 5 – Requirements analysis and Specification
Requirements analysis and development of an early functional prototype.
Chapter 6 – Performance Measurement Support System
On this chapter a System Requirements Specification is presented.
It’s also presented a functional prototype.
Chapter 7 – Conclusions
Final conclusions on work developed are presented.

Document Organization 3
Chapter 2
The Automotive Assembly Line
Volkswagen Autoeuropa factory in Palmela is the largest foreign investment project
ever done in Portugal, and its initial goal was to produce three MPVs from three different
brands: Volkswagen Sharan, SEAT Alhambra and Ford Galaxy. Volkswagen Autoeuropa had a
highly positive impact on the Portuguese economy, especially in what exports is concerned.
The overall initial investment in the project, including the development of the 3
models, amounted to 1.970 million EUR. When in 1991 Volkswagen and Ford signed the
Autoeuropa Automóveis, Lda. ―joint-venture‖, the responsibilities in the project were split:
VW led the work on vehicle development, while Ford planned the factory facilities and
purchasing.
It took four years since the signing of the shareholder agreement between VW and
FORD in July 1991 until the start of production. During these 4 years one of Europe’s most
modern automotive production facilities was built in Palmela, with a total area of around 2
million sqm, including the Industrial Park where some of the main suppliers have settled.
On January 1st, 1999, Volkswagen Group assumed 100% of Volkswagen Autoeuropa’s
ownership. This change in the shareholding provided the potential for an increased use of the
capacity of the Palmela plant. Moreover, it had no negative effect on the plant activity,
which continued producing the Volkswagen Sharan, the Seat Alhambra and the Ford Galaxy.
Four years later, in May of 2003, the production of 1.000.000 units is celebrated.
In February of 2006, Volkswagen Autoeuropa ends the production of the Ford Galaxy
and initiates the production for the market of Volkswagen Eos, the first luxury car of the
brand to be produced in Portugal. Due to the characteristics of the new model, a cabriolet
with a unique convertible roof, Volkswagen Autoeuropa factory starts to work with 2
production lines, one dedicated to the production of the MPVs Volkswagen Sharan and Seat
Alhambra and another dedicated to the cabriolet VW Eos.
Characterized for being a competitive factory in the automobile sector, Volkswagen
Autoeuropa presents itself as a flexible company capable of facing the future challenges
following the latest quality and environmental standards.

Document Organization 5
Yet in 2006 is done the announcement of a new product to Palmela’s factory that
intends to revive the former model Volkswagen Scirocco. Its production is started in 2008. In
the same year, the 1.500.000th vehicle is produced in the factory.
Since its inauguration, Volkswagen Autoeuropa has been the target of several
investment agreements aiming the settlement of new production infrastructures, equipment
modernization and the training of the employees in order to turn the production lines and
methods each time more efficient and increase the competences of its employees.
Volkswagen Autoeuropa’s philosophy of continuous improvement has been placing it
as one of the companies of the Volkswagen group in the leading edge in several productivity
indicators.
2.1 Business
Volkswagen Autoeuropa, Lda is an automotive industrial unit of the Volkswagen Group
located in Palmela, Portugal dedicated to vehicle manufacturing.
The car models produced nowadays are Volkswagen Sharan, Seat Alhambra,
Volkswagen Eos and Volkswagen Scirocco.
The four main processes are divided in four distinct areas which are Press Shop
(where most of the car panels for all products are cut and stamped from steel reels), Body
Area (body welding and construction) Paint Shop (painting) and Final Assembly Area (where
each car is assembled according to the final client specifications).
2.2 Objectives
The mission of Volkswagen Autoeuropa is to be the leader in providing the best
products and services to the world-wide automotive market with the highest standards of
environmental protection.
To complete our Mission, we will accomplish the following strategic objectives:
Achieve the highest customer satisfaction ratings for our products and services.
Become the lowest total cost producer providing the best product value to our
customers.
Provide a work place that enables and encourages people to maximize their
involvement and participation in order to achieve personal and Company goals.
Recognize the Environment in all aspects of our business and ensure continuous
improvement in environmental performance within our Plant and towards the Community.
Favour a dynamic spirit in the work place that allows everybody to: rethink the
processes, constantly search for the best practices, strive for state-of-the-art technology,

6
exceed environmental protection requirements and always set new and more demanding
standards.
Achievement of these strategies will ensure profitable growth and maximize the long-
term value to our parent company and us.
2.3 Products
The Volkswagen Autoeuropa Plant has an installed capacity of 180thousand vehicles per
year, on a 3 shift operation.
Currently it’s using 2 shifts and is producing 3 models:
Fig. 2-1 – Volkswagen Sharan
The Volkswagen Sharan Fig. 2-1 is a family car with 7 seats.
Fig. 2-2 – Volkswagen Eos
The Volkswagen EOS, Fig. 2-2, the first luxury sports car from Volkswagen, its production
started in 2005.
Fig. 2-3 – Volkswagen Scirocco

Products 7
The Volkswagen Scirocco, Fig. 2-3, the ―low cost‖ sports car that derived from the
mythical Scirocco from the 70’s.
2.4 Plant layout and Production Areas
Fig. 2-4 – Plant layout
On Fig. 2-4 it is shown the plant map and its divisions, according to manufacturing
area.
The production follows the movement against the clock pointers. Starting in Press
shop then it shifts to Body shop, Paint shop and finally Assembly shop.
2.5 Production Areas
2.5.1 The Press Shop
This area has 23000m2 and is responsible for producing metal parts from reels of
steel.
It is currently producing:
138 parts for the MPV’s Sharan and Alhambra,
78 parts for EOS,
70 parts for Scirocco.

8 The Automotive Assembly Line
It is working in a 2 shifts pattern. It’s equipped with 5 tri-axial presses (2 of 3200ton,
2 of 2500ton and 1 of 1500ton (Fig. 2-5)) and also one ―tandem‖ line with 6 presses
(1700ton/1250ton) supported by cutting machinery.
Parts are built by specialized technician and the pressing cycles are reduced to 2-12
days in order to improve the storing and stocking costs.
Fig. 2-6 - Press Shop - overview of Press shop area, were 2 of the 5 tri-axial press are visible as well as several molds.
2.5.2 The Body Shop
The body is constructed according to the state of the art technology. With the aim of
optimizing the material handling the building is located right next to the stamping shop area.
Fig. 2-7 – The Body Shop – Overview of body shop. Deck assembly where several robots perform automated tasks.

The Assembly Characterization 9
This area is divided in two, the first area, dedicated to MPV and Scirocco, Fig. 2-8,
has 35000m2 and the second, dedicated to Volkswagen EOS has 12530m2.
For the manufacturing process of Volkswagen Sharan and SEAT Alhambra 292 robots
are automatically apply 94% of the 5745 soldering points.
For the Volkswagen EOS, 116 robots apply the 4825 soldering points. Robots from both
these lines are from German origin, from KUKA brand. The remaining robots on this area are
dedicated to the Volkswagen Scirocco, with an innovative automated structure; they apply
4373 soldering points, from Japanese origin, FANUC.
On this area the MPV teams work on single shift pattern and EOS/Scirocco teams work
on double shift pattern.
The body shop has 6 more teams for supporting purposes that include 69 highly
specialized technicians. During the night shift 16 workers remain for maintenance purposes.
2.5.3 The Paint Shop
The Paint Shop area, 22545m2, works on 2 shift pattern and uses aqueous based inks.
The process takes approximately 6.5 hours. On the process, innovative and environmental
friendly techniques are used, like residual oils are separated from washing waters, anti-
corrosive protection exempts of lead and chromium, primary and base enamels from aqueous
base and washing waters re-used thanks to cascade cleaning systems.
This area has 10 robots for PVC applying and 5 more automated machines for primary
and enamels appliance. This machinery is responsible for the transfer of 80% of ink; the other
20% are made in a manual process that has a recovery system capable of reducing the waste
to almost zero.
Fig. 2-9 – The Paint Shop
The concept underlying the material supply is ―single sourcing‖ that implies the only
one supplier is responsible for management and control of entire process on the used material

10 The Automotive Assembly Line
till its application on the final product. This area applies the ―lean production‖ concept so
there are no buffers which imply a rapid problem solving and continuous improvement.
2.5.4 The Trim & Assembly Shop
The 52542m2 represent the biggest area on Plant and it houses around 1000 workers
organized in teams distributed over two shifts.
In order to improve the available resources the logistic concept ―Just In Time‖ was
implemented resulting on a reduction of stocks to just enough to complete on-going process.
This reduces the investment on warehouses and managing manpower, freeing it to
other projects, but it implies a closers and special relation with suppliers.
Fig. 2-10 – The Trim & Assembly shop
On this area the system is based on FIFO (First In, First Out) this allows for a
sequencing system for parts in witch when the body arrives to the station, the respective
parts, chosen by the costumer, also arrive at station, to be assembled by the operator.
2.5.5 Workers
On plant there are the following worker divisions:
Direct Workers, workers that have value adding operations to the final Product,
usually all workers on the assembly are considered direct workers.
Indirect Workers, workers that contribute for the evolvement of process, usually
workers assigned to office locations.
External services, these are workers contracted for their services and are not
accounted for payroll
External Temporary Agency, are short contract workers hired on specific conditions to
fulfil a certain task and as soon as the task, they were hired for finishes, workers are
dismissed.

The Assembly Characterization 11
On Fig. 2-11 is show the percentage of workers assigned to each area. It is also
possible to infer that the Trim and Assembly shop is the area that takes the highest
contribution to the KPI under analysis ahead on the document.
Fig. 2-11 – Area Workers Percentage
2.5.6 Working Schedule
In order to fulfil this production process, Fig. 2-14, the Plant is currently working on a
two shift pattern with the configuration in Fig. 2-12, this represents an effective working
time of 7.667hours. The value of E.W.T. is achieved by the calculation presented in Fig. 2-12,
from the 8h and 30min shift all breaks are extracted, 30mim break for lunch time, two small
breaks of 7min for smoking and/or eating and an additional 6min considered for weekly
meetings.
Fig. 2-12 – 2Shift Scenario

12 The Automotive Assembly Line
The current 2 shift production scenario, in case of market demand, can be extended
to a third production shift, Fig. 2-13, making the plant reach its maximum installed capacity.
Although shifts are not the same length, this is proven to achieve the best results.
Fig. 2-13 - 3 Shift Scenario
2.6 Assembly Line Characterization
The production process is characterized by four different areas, the Press shop, the
Body shop, the Paint shop and the Trim and Assembly shop; they are organized as shown in
Fig. 2-14.
Since only bought cars are made, after the information arrives the process to build
the car starts and follows the steps.
Fig. 2-14 Schematic of entire process
For characterizing the line, the Stamping shop must set aside due to its specific process.
In Fig. 2-15, it’s pointed that the real car assembly process only starts in Body shop,
here parts from Stamping shop are gathered and assembled into a car body.

The Assembly Characterization 13
Fig. 2-15 - Assembly Line Process
Several steps are merged since they are similar from model to model, this is particularly
true in case of Eos / Sci, and these two models are very alike and for that reason, share the
assembly line in various stages.
On this point dwells the major difficulty of data processing. This is how to assign each
worker to each car. This is currently done by a percentage based on built cars.
After the last stage in Body shop, all three models follow through Paint shop in serial
progress, there is no difference between processes, some variation due to shape of body, but
essentially materials are the same and applied the same way.
When painted Bodies arrive to Trim & Assembly shop, the first step is to remove the
doors to make it more accessible and easy to work with. The real assembly process starts
after this point. It follows several stages, like dashboard assembly, decking, name given to
the stage where body meets preassembled chassis, with engine and gearbox, suspension, fuel
tank…, seats and glasses are assembled and doors re-assembled.
A small set of tests are conducted and car is released for costumer
The Stamping shop works differently, it has production cycles. Since there can’t be a
line to stamp every piece, as in an assembly line, the area has to make short production
series and store for small amount of time.
The stocks are in a small warehouse between the Stamping shop and Body shop, this
works as a buffer to allow Stamping shop production cycles of 2 to 12 days.

14 The Automotive Assembly Line
Fig. 2-16 - Stamping Shop Process

Chapter 3
The VFF Project
3.1 The VFF Concept
The VFF project is an international project under the ―Seventh Framework
Programme‖ from European Commission.
The VFF project main objective is to foster and strengthen the primacy of future
European Manufacturing, by defining the Next Generation of Virtual Factory Framework. It
will promote the increase of performance in design, management, evaluation and
reconfiguration of new or existing plants while upholding major time and cost savings.
It will support the capability to simulate the dynamic and complex behaviour of total
plant approached as a complex long living product.
The VFF will research and implement the underlying models and ideas for a new
conceptual design to implement the next generation of virtual factories and also to lay down
the basis for future applications in research areas.
Fig. 3-1 - VFF General Overview [1]

16 The VFF Project
Currently the Project includes 4 key pillars.
I Reference Model for factory planning. Based on new industrial key paradigm
―Factory as a Product‖ and considering new planning methodologies like ―non-linear,
nondeterministic planning‖. The concrete outcome is a Reference Model on Factory Planning
having as background element a Factory Data Model, capable of taking into account the needs
of a holistic and scalable modelling of real time management of manufacturing data and of
collaborative engineering networks [1].
II VF Manager Core. It’s the tool responsible for handling the common space of
objects that represent the factory. This representation is based on the factory data model
defined in Pillar I. The VF manager enables a centralized coordination of the external
decoupled modules (defined in Pillar III), in a way that allows the framework to be extensible
and scalable, thanks to the internal transition system of the core, fostering unparalleled
performances, openness, and increased quality in the environment representation [1].
III Functional Modules. The decoupled Functional Modules implement the various tools
and services for the factory design, reconfiguration, management… these modules operate
independently on the same Common Space of Factory Objects, defined in Pillar II [1].
IV Integration of Knowledge at different layers as engine for the modules aiming at
giving reality to the envisioned Learning Factory. The primary objective is to use contextual
knowledge to model a wider range of complex systems and support greater comprehension of
the modelled phenomenon. Moreover, the integration of knowledge throughout the VF has the
potential to deliver fundamental advisory capabilities as a companion to factories
development in all its scales and complexity dimension [1].
The collaboration of the four pillars leads to the realization of the Virtual Factory
concepts. The Factory Data Model element utilizes information generating an overall picture
of the factory together with its characteristics, allowing the modelling and handling of data
real-time. The data utilized for the development of the Data Model is stored in the
Knowledge Repository, where it can be further exploited. The VF Manager Core supervises the
common space of the framework, ensuring that all pillars, together with their respective
components and actors, interact smoothly, while also managing the flow of data and
knowledge to and from the Knowledge Repository. Pillar III hosts the Functional Modules that
utilize the available knowledge and the insight acquired via the data model to implement
tools and services.
3.2 The VFF expectations
The Virtual Factory, deployed according to the VFF concept, has to be permanently
synchronized with the Real Factory aiming to achieve time and cost savings in the design,
ramp-up, management, evaluation and reconfiguration of the Real Production itself. The Real

17
Factory, interacting in terms of feedbacks and of data needed to set-up and up-date the
simulation system, closes the loop.
The proposed pillars foster the implementation of a holistic, modular, open and
scalable Virtual Factory meant to achieve clear, well-identified and measurable goals for the
real production system according to quantitative indicators/measures:
Time for factory design, re-configuration, re-engineering: -50%. The implementation of
the new reference model for factory planning (see point 1 of the S&T objectives),
integrated with formalized multi-competence knowledge deriving from past and current
planning processes, allows to shorten the time required for new processes design and
existing processes reconfiguration and re-engineering, thanks to a quick retrieval of
actual pertaining know-how, an intelligent selection of coherent functional modules.
Ramp-up time -30%: quick, efficient and adherent to reality modelling speeds up
analysis, synthesis and diagnosis, allowing an accurate but rapid prediction and
optimization of production processes during the pre-production stage though preserving
the reliability of information gathered during production ramp-up and its value-adding
usability in the later stages.
Capability Index Cp >=2.0: the effective virtual representations of the entire production
systems, fostering multi-loop evaluation procedures, multi-dimensional target systems,
knowledge-driven decision support, quickened problem-solving sub-processes, allows a
cost and time saving evaluation of existing and designed processes, resulting in radically
enhanced production quality. The effectual virtual representation of all the production
phases and of their mutual interrelation enables the intelligent selection of parameters
affecting critical product characteristics and the improvement of production parameters,
resulting in a reduction of process normal variation and of the overall amount of
defective products answering to increasingly stringent design specification requirements.
Moreover, a strong qualitative factor has to be considered:
- Democratization: the project will provide a ground-breaking framework for a new VF
but also democratize its usage thanks to new open technologies, thus providing basis for
decision making to all levels and functions, allowing for quick yet substantiated decisions to
be made where they unfold full potential. The VFF will open access to Virtual Representation
technologies to larger group of enterprises, including SMEs.
The Figure 13 integrates the VFF concept schema, further detailing the identified
pillars

18 The VFF Project
Fig. 3-2 - VFF Project - Detailed Pillars View [1]
The VFF Project is meant to represent an enormous advancement to current factory
framework. Such advancements are detailed in the next table.
Table 3-1 – The VFF Advancements referring to current State of the Art [1]
Chapter 4
Performance Measurement
Performance measurement is a simple concept without a simple definition.
Essentially, performance measurement analyses the success of a work group,
program, or organization’s efforts by comparing data on what actually happened to what was
planned or intended [2]. Performance measurement asks ―Is progress being made toward
desired goals? Are appropriate activities being undertaken to promote achieving those goals?
Are there problem areas that need attention? Successful efforts that can serve as a model for
others?‖ [3]
There are countless angles which to look at performance measurement, but the
underlying concept will be the same. One possible definition:
Performance measurement is the selection and use of quantitative measures of
capacities, processes, and outcomes to develop information about critical aspects of
activities, including their effect on the public. [3]
For understanding the definition, terms like capacity, process, and outcome must be
clarified.
Capacity means the ability of a work group, program, or organization to carry out the
overall job, and in particular, to provide specific tasks. Capacity means, for example, that
you have sufficient staff, training, facilities, and finances, among other things.
Process means the things that are done by defined individuals or groups – or to, for,
or with individuals or groups. Process means all the tasks and jobs.
Outcome means a change, or lack of change, such as the tests, investigations, or
educational services you offered as part of your process, above.
There is no exact definition when it comes to usage of the term ―performance
measure." Different people have different definitions for what constitutes the "measure" part.

20 Performance Measurement
Although there are many different ideas about what a "measure" is, there is one commonality
among them:
A performance measure measures something, usually progress towards an objective or
goal. So it doesn't matter if it’s called a performance measure or a performance indicator or,
in some cases, a performance standard. The important idea to retrieve is the concept that a
performance measure measures something.
A good definition of a performance measure:
A Performance Measure is the specific quantitative representation of a capacity,
process, or outcome deemed relevant to the assessment of performance. [3]
Key Attributes of a Performance Measure
Validity: a valid measure is one that captures the essence of what it professes
to measure.
Reliability: a reliable measure has a high likelihood of yielding the same
results in repeated trials, so there are low levels of random error in
measurement.
Responsiveness: a responsive measure should be able to detect change.
Functionality: a functional measure is directly related to objectives.
Credibility: a credible measure is supported by stakeholders.
Understand ability: an understandable measure is easily understood by all,
with minimal explanation.
Availability: an available measure is readily available through the means on
hand.
Abuse-Proof: an abuse-proof measure is unlikely to be used against that which
is, or those who are, measured.
A Performance Standard is a generally accepted, objective standard of measurement
such as a rule or guideline against which an organization's level of performance can be
compared [4].
A performance standard establishes the level of performance expected. Standards can
be descriptive or numerical. A descriptive standard characterizes certain infrastructure
components or certain activities – that is, certain capacities or processes – that are expected
to be in place.
A numerical standard establishes a quantifiable level of achievement. Numerical
standards are often used as minimum standards. These standards look very much like goals or
objectives, except that you are evaluated on whether or not you have achieved them, not on
your progress toward achieving them. For this reason, numerical minimum standards can be
controversial.
Both kinds of performance standard can be considered a measure of performance, in
that each helps you evaluate the success of your efforts by comparing what actually

KPI 21
happened against the standard. The numerical standard is easiest to consider a measure
because it is quantifiable – you can compare the level you achieved against the standard. The
descriptive standard is harder to consider a "measure" by itself, but you can find ways to
measure your level of achievement with such a standard.
To summarize, a performance measure... measures something. A performance
measure can measure your capacity to undertake services, the specific things you do to
provide the services, and the consequences of having provided the services. A performance
measure is a quantitative representation of system. Hence, if something called a performance
―indicator‖ or a performance ―standard‖ measure something – such as capacity, process, or
outcomes – it is a performance "measure."
How do other performance assessment activities relate to performance measurement?
Performance measurement is an aspect of performance management Performance
management is what you do with the information you've developed from measuring
performance.
Performance managing means using performance measurement information to
manage your public health capacity and processes: for example, to review services and
programs; assess and revise goals and objectives; assess progress against targets; conduct
employee evaluations; and formulate and justify budgets.
Performance measurement is needed as a management tool to clarify goals,
document the contribution toward achieving those goals, and document the benefits received
from the investment in each program. – U.S. Department of Health and Human Services [5]
The problem with measurement is that it can be a loaded gun – dangerous if misused
and at least threatening if pointed in the wrong direction. – Dennis S. O'Leary
4.1 Key Performance Indicators
A Key Performance Indicators is a tool to assess performance.
Some companies have formal, enterprise-wide performance measurement systems in
place (such as Six Sigma, the Plan-Do-Check-Act methodology, or the Balanced Scorecard).
Such systems enable executives to look across the organization's business activities to gain a
holistic view of the company's performance. Other companies use a simpler approach,
measuring the performance of one or more discrete aspects of the business.
Regardless of the system a company uses, all organizations use key performance
indicators (KPIs) to assess their performance.
What is a KPI?
Understanding KPI’s can help you measure your and your group's progress toward
corporate and unit goals.

22 Performance Measurement
Key Idea
A key performance indicator (KPI) is a measure reflecting how an organization is doing
in a specific aspect of its performance. A KPI is one representation of a critical success factor
(CSF)—a key activity needed to achieve a given strategic objective. Organizations that
measure performance identify the handful of critical success factors that comprise every
strategic objective.
For example, depending on a company's strategy, the organization might have a KPI
for the percentage of income the organization derives from international markets. Another
KPI might be the number of customer complaints about orders filled incorrectly. Some
organizations use many KPIs, for all their different areas of operation. Other enterprises' KPIs
may focus on a specific area. For instance, a social service non-profit may focus all its KPIs on
the amount of aid that is granted to different entities.
Typically, each unit within a company also has a set of KPIs that support the
company's goals. Performance data for a unit's KPIs can be rolled up into the company's KPIs
to reflect total organizational performance in any given area being measured.
You probably won't participate in developing KPIs at the corporate level. However,
you may be involved in creating KPIs at your unit's level—especially if your unit was recently
acquired or has been associated with a new product, process, department, or line of
reporting. Regardless of your situation, you should be aware of the KPIs that are in place in
your organization. With this awareness, you can measure your and your group's progress
towards corporate and unit goals.
Three types of KPIs
Key performance indicators come in three types:
Process KPIs measure the efficiency or productivity of a business process. Examples
include "Product-repair cycle time," "Days to deliver an order," "Number of rings
before a customer phone call is answered," "Number of employees graduating from
training programs," and "Weeks required to fill vacant positions."
Input KPIs measure assets and resources invested in or used to generate business
results. Examples include "Dollars spent on research and development," "Funding for
employee training," "New hires' knowledge and skills," and "Quality of raw materials."
Output KPIs measure the financial and nonfinancial results of business activities.
Examples include "Revenues," "Number of new customers acquired," and "Percentage
increase in full-time employees." Three particularly common output KPIs that are
used by managers include:
o Return on investment (ROI): Return on investment represents the benefits
generated from the use of assets in a company, unit, or group—or on a
project. ROI is helpful to top executives, finance managers, board members,
and shareholders. A possible way to express return on investment is to divide

VW Autueuropa Process Description 23
net income (revenues less expenses less any liabilities, such as taxes) by total
assets. ROI measures how effectively managers have used resources, and can
be figured as follows:
ROI = Net Income/Total Assets
o Economic value added (EVA)™: EVA, popularized in the 1990s by U.S.
management consultancy Stern Stewart & Co., is defined as the value of a
business activity that is left over after you subtract from it the cost of
executing that activity and the cost of the physical and financial capital
deployed to generate the profits. In the field of corporate finance, EVA is a
way to determine the value created, above the required return, for a
company's shareholders. It's therefore useful to senior management, boards,
and shareholders and other investors. EVA is calculated as follows:
o EVA = Net operating profit after taxes minus (net operating assets multiplied
by the weighted average cost of capital)
o Shareholders of a company receive a positive EVA when the return from the
equity employed in the business's operations is greater than the (risk-
adjusted) cost of that capital.
o Market share: The percentage of sales in a given industry segment or sub-
segment captured by your company.
All three types of KPIs—process, input, and output—generate valuable performance
information. A mix of the three types ensures a comprehensive picture of your unit's or
organization's performance.
4.2 Volkswagen Autoeuropa Process Description
Volkswagen Autoeuropa joined the VFF project under the scope of Performance
Measurement, to provide the project its knowledge and vision on Man Power KPI calculation.
This participation was inserted on scenario 2 of the VFF, ―Ramp Up and Monitoring‖,
as the name states it is divided in two stages, the Ramp Up and the Monitoring phases.

24 Performance Measurement
Fig. 4-1 - Participation Scenarios
The Ramp Up phase is described as:
―The VFF tool will demonstrate in Ramp Up phase, an efficient setting up,
verification and commissioning of software and procedures‖
The Monitoring phase is described as:
―The capability to monitor the real factory will be demonstrated as well the
connection between the real and the digital factory.‖
The current process to determine KPIs in Volkswagen Autoeuropa is described in Fig.
4-2 - Performance Monitoring in Volkswagen Autoeuropa. The entire factory process is taken
into account and from it the overall inputs and outputs are retrieved.
The inputs are: Manpower and Material and the Outputs are final Products
Fig. 4-2 - Performance Monitoring in Volkswagen Autoeuropa

VW Autueuropa Process Description 25
The pattern for production of new car model follows the stages presented in Fig. 4-3,
there are 4 early stages, not presented in picture, that are responsible for project viability
tests, prototype building and studies on future assembly lines for that model.
After these initial first steps, the Ramp Up scenario occurs. It is the time considered
between the SOP till the SOP+1year
Fig. 4-3 – Target values evolution
Fig. 4-4 - Production evolution
During the Ramp Up scenario, the KPI used are obtained using the same premises as
during the monitoring stage, although are compared to special target values.
These special target values are predetermined by the analysis of process by the
Planning Department on plant and by the central planning in VW – WOB. By these studies, the
values for target are derived empirically using the know-how and comparing the complexity of
new project with previews models.
During the Ramp Up the most common negative impacts on KPI are:
Not using the entire installed capacity;
Unstable building process;
Considerable amount of workers under training condition;

26 Performance Measurement
Quality issues:
Suppliers;
Process;
Logistics;
All these issues lead to only one outcome: the need of Rework hours.
During the Ramp Up process, the objective is to achieve the target values defined for
the SOP +1, these target are defined using two main items, the Project Profitability and the
Automation level of the construction process. This leads to a constant target value decrease
that makes the overall process increase its performance.
After the SOP +1, the Monitoring phase begins, although a negative slope remains on
the target values evolution, it lowers smoothly along the time. This will make the process to
increase its performance leading to a continuous improvement.
4.3 Volkswagen Autoeuropa Key Performance Indicators
On the VW-AE, in the department where the author was placed there are currently 3
Man Power KPI in use, they are: the OHPU, the HPU and the Productivity. On the fowling
pages a brief description of each is given.
After a detailed analysis of calculations process for the HPU indicator is presented,
this indicator was chosen by the author due his familiarization level with this indicator.
4.3.1 OHPU – Organizational Hours per Unit
OHPU is a KPI for labour performance used for benchmarking between different factories
of the industrial sector. It is calculated monthly. It is defined by the formula:
Equation 1
) t i n (hours/u Volume Production
Hours Working Total OHPU
OHPU values are calculated not only for the factory as a whole but also in detail for
each Product and each Organizational Divisions, like organization structure, core business
areas, major assembly areas and labour types.
Total Working Hours are obtained from the Payroll, for internal employees and also
from other sources for third party workers currently on plant, temporary workers, external
maintenance services...

Productivity 27
Fig. 4-5 - OHPU IDEF0
Each subtotal, per product, production area and other splits, are calculated with the
sum of employees accounted hours according to its ―Cost Centre/Organizational Unit‖
classification, excluding hours related to training and others kind of absence leaves.
Production Volumes for each product during each time period are collected from the
Production Reports.
After the completeness of the data mining process, the calculation is made and a
report generated. It is broadcasted for management analysis and decision support.
This report is periodical with the cadence of 1 month. The reports always include the
previews values and the annual cumulative.
4.3.2 Productivity (units/employee)
It is a KPI that measures the total number of units, with no distinction between different
products, produced by the number of employees, for the factory total and for each
considered organizational divisions, splits.
Equation 2
) oyee pl m (units/e Days Working
Days 229
Manpower
Volume Production ty i iv t Produc

28 Performance Measurement
Fig. 4-6 - Productivity IDEF0
Actual Volume is the total number of units produced on the chosen time period.
Actual Manpower is calculated as the average between the current and previous
month total number of employees, including temporary agency employees; by definition, is
considered the number of active employees in the last day of each month. Employees with no
cost for factory are not accounted;
Actual Working Days is the average value of the number of effective working days
officially scheduled for each product;
―229 Days‖ is as predefined factor based on year calendar.
The Productivity reports are monthly and include the ―actual‖ values side-by-side
with ―budget‖ values and include an historical with values from each month of the current
year. The report includes detail for each organizational division.
Budget Volume, Manpower and Working Days are previously defined and fixed for all
months in the beginning of each year in the official Budget. With this values will be
calculated the ―Budget‖ Productivity values which will be used as a reference in Productivity
analysis.
4.3.3 Hours per Unit (HPU)
The H.P.U. is the first KPI the author worked in Plant and is the one he dedicated
more time, therefore it’s logical to be the one he is more comfortable with.
The Hours Per Unit (HPU) is a KPI that translates the number of hours required to
build a car. It is determined for a specific given time and for a specific model. It is also used
for benchmarking purposes between VW Plants all around the world.
It is obtained applying the following formula:

HPU 29
Equation 3
) t i n (hours/u Volume Production
.W.T. E M.A. HPU
In the previews formula, there are three factors, they are:
M.A. – This represents the manpower attending on factory on the period referred for
determining the KPI.
E. W. T. this is the Effective Working Time, as previously stated, it represents the
working hour in which workers are actually working on their positions on the assembly
line. This value can be changed in case of line stoppage due to errors or workers
council meeting.
Production Volume is the constructed volume for the given time for the given model.
The HPU is determined only for Core Business areas for each model; this means that
only workers with value adding operations, to the final product are accounted for, these
workers are nominated as direct workers.
To achieve the number of direct workers (M.A.) currently attending, information must
be gathered from three sources, the Payroll Direct, the Absenteeism and Adjustments.
The Payroll Direct is the number of direct workers currently in working in
plant. The Absenteeism gives the workers considered as absent in the day.
Fig. 4-7 – Payroll update sequence
The absenteeism is the number of workers in absence on the production line,
workers that are attending formation are also considered as absent.

30 Performance Measurement
Fig. 4-8 Absenteeism gather sequence
The Adjustments are changes of workers status inside plant, borrows and
loans between the several different departments.
Fig. 4-9 – Adjustments gather sequence
The Effective Working Time (E.W.T.) is considered 7.667h.

HPU 31
The production volume is obtained from an internal system, responsibility of Logistics
Department, which stores all factory operations and production.
Fig. 4-10 – Productions volume retrieval
The HPU is currently a daily report, but it’s time frame can be changed to the desired
period.
4.4 HPU Calculation Process Analysis
The calculation process is easy, as it can be seen from the formula itself, the hard step is
the data gathering and processing steps, the countless number of details makes it almost
impossible to automate. The description of the process is presented on Fig. 4-11
Fig. 4-11 – HPU Calculation steps
From Fig. 4-11 a set of 4 main steps are identified, these steps are: the Production
Values, the Retrieval of Direct Workers, the Absenteeism Processing and the Adjustments
Processing.
Process Production Volume
In order to retrieve the production volumes a system, maintained by the logistics
department, is accessed and the values regarding the production volumes are retrieved from
an automatically generated pdf file organized as a table with 3 columns representing each
column the car model

32 Performance Measurement
iVol - Volume of produced car on referred time period [i]
Process Direct Workers (Payroll)
From the Human Resources Department an Excel file arrives, through e-mail, with the last
payroll status, it is then placed on a local database for sorting the workers according to their
status. For the HPU only direct workers are considered.
i jPayroll - Current number of direct workers on Plant Payroll
Process Absenteeism
In order to retrieve the absenteeism, the SAP-HR system implemented on Plant, is
accessed and two lists are retrieved, one containing all the workers considered as absent on
Plant, on the time period referred for the report, and another list that contains workers that
are not yet considered as absent by the system but are absent on Plant.
These two lists are combined and verified for duplicate entries and then placed on a local
database that counts absent workers by area and status.
i jAbsenteeism
Process Adjustments
The adjustments can be considered as changes in the workers status, these changes can
due to internal transfers, temporary changes, borrows, loans, etc…
i jAdjustments
Effective Working time
The EWT is the effective working time, as already referred; it assumes the values of
7,667hours that can change due to line stoppage time.
iEWT Number of Effective Working Hours on the time period [i] referred
The final value of HPU comes directly from the appliance of following formula
iHPU
i i
k
i
MA EWT
Vol
The [i] represents the time period to which report is referred to and [k] the car model to
which the report is referred to

Information Flux 33
To get the value of M.A. the following step has to be made combining the 3 data
gathering processes.
i j i j i j i jMA Payroll Absenteeism Exceptions
The M.A. is divided by the following categories of workers [j]
EOS
Body Mix
Body Scirocco
Paint Mix
Quality
Stamping
T&A
T&A EOS
T&A Sci
Body
Body
j
4.5 Information Flow
As stated previously, the methods for data gathering are add-hoc and are based on
simple tasks, like collecting data from SAP System, store it as an excel file and process the
file for accounted situations, but these tasks are of highly difficulty to implement as an
automated system. There are no data transfer standards or templates, also reports might be
as accurate and as fast as possible and desired due to human errors and time delays on
deploying information.
On the next chapter an analysis to the requirements of a system capable of measuring the
performance on the assembly line at Volkswagen Autoeuropa is made.


Chapter 5
Requirements Analysis and Specification
Although several KPI indicators are used in Volkswagen Autoeuropa this requirements
analysis and specification will be focused on the HPU indicator. This indicator is currently
used to measure performance on the several Plants from VW group.
5.1 Stakeholders
On an early stage of requirements analysis and specification the main elements
involved in process were identified and their expectations over future system exploited.
When actors were identified a set of iterative meetings took place for the definition of more
detailed expectations.
Fig. 5-1 – Organizational Structure for Project
The Sponsor provides the financial resources and seeks the involvement of all
organization. He is involved in controlling and monitoring the goals of the project at a higher
level, and is the centrepiece in terms of decision changes.
The Project Manager Role is her played by the Manager/Sponsor, he is responsible for
defining the plan of the Project and components associated with it, keep the project within
the stipulated time and budget and identify, monitor and respond to risks associated with the
implementation of the Project.
36 Requirements Analysis and Specifications
The Functional Manager is responsible to provide information to the Project Manager
and guaranty the execution of project.
5.2 General System Requirements
The system is meant to be implemented on the Strategic Industrial Department in VW-AE.
According to the informatics knowledge level of users the system must function intuitively
and simple in order to save time to users. The users should have access to their specific
functions by introducing a login username and a password.
The system must allow several user levels with different permissions,
The system has to be configurable to send notifications on some operations via e-
mail,
System must facilitate communication between the involved departments for data
request reminders,
System must be reliable and trustworthy,
Easily installed and maintained,
The system must fulfil the company security standards.
Regarding the calculus functions the system is idealized for KPI calculation.
The system is intended to calculate KPI automatically,
Data sources, algorithms and methods must be easily editable,
Input of data can be made by different ways:
o Importing files with specific format (by users),
o Automatically importing from other systems (to de defined),
o Directly adding/editing via interface.
The Reporting Functions should comply with:
Produce reports with the KPIs values and other data values,
Reports can be graphics and/or tables and must be editable,
Data must be stored for future revision or for other purposes re-use,
Export reports in different file formats,
Capability of forecasting the behaviour of KPI over short period of time.
The users allowed in the system must fit on the categories presented on Table 5-1.

Functional Requirements 37
Table 5-1 - Users Levels
User Level User Description Functions allowed
Admin SIE Dept. Members Insert/Delete/Edit all data All advanced Configurations
User Responsible from each Area/Dept. Insert/Edit specific data
Viewer Persons allowed viewing the
reports. View reports only.
5.3 Functional Requirements
After the initial requirements recovery, the information gathered allowed a better picture
of the system to be developed. In a way to support the requirements specification, the UML
language was used, specifically the usage diagrams.
A set of 3 use case package was defined with 10 use cases.
The use case diagrams define dependencies and relation between the use case and actors.
For a better understanding the Actor is an entity that requests and demands actions and
receives reactions. Each can actor can participate in more than one use case. The use case
represents de dependencies and events performed by an actor on the system.
Use Cases Packages
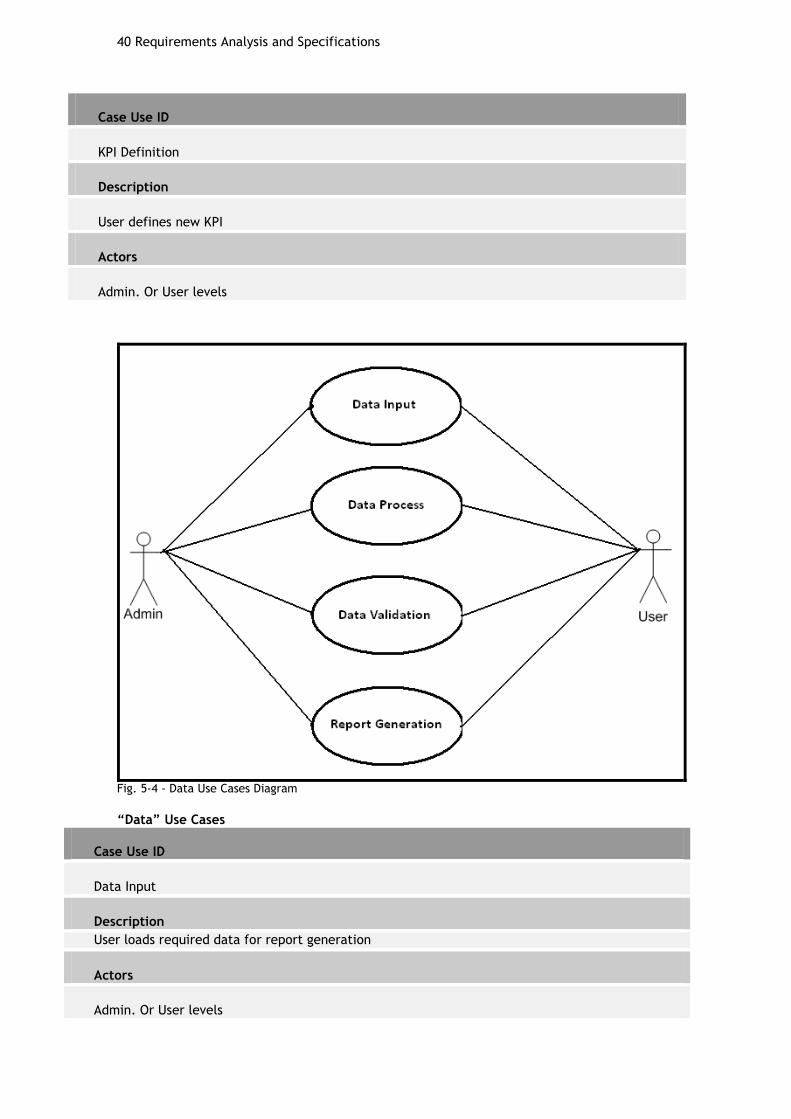
The use cases will be divided into 3 major packages as shown in Fig. 5-2:
Configuration
Admin
User
Viewer
Data
Reporting
Fig. 5-2 – Use Case Packages Diagrams

38 Requirements Analysis and Specifications
On the following pages these use case packages will be detailed and specified.
Configuration package include all use cases related to workflow and other general
configurations.
Data package approaches all use cases to support data importing, editing, validations,
etc.
Reporting package is related to all use cases that allow report viewing: selecting
information, time period ranges, etc.
Package Configuration
For the Configuration package, 4 use cases were defined. They are presented on the Fig.
5-3.
Fig. 5-3 – Configuration use case package
“Configuration” Use Cases
Case Use ID
Plant Configuration
Functional Requirements 39
Description
User inputs or edits organization structure in the system.
Actors
Admin. Or User levels
Requirements
The user must be logged in and have Admin access level.
Case Use ID
Information backup
Description
User manages the backup information on reports (validation)
Actors
Admin. level
Requirements
The user must be logged in and have Admin access level.
Case Use ID
Server Connections
Description
User establishes and manages the connection with database servers
Actors
Admin. level
Requirements
The user must be logged in and have Admin access level.
40 Requirements Analysis and Specifications
Case Use ID
KPI Definition
Description
User defines new KPI
Actors
Admin. Or User levels
Fig. 5-4 - Data Use Cases Diagram
“Data” Use Cases
Case Use ID
Data Input
Description
User loads required data for report generation
Actors
Admin. Or User levels

Functional Requirements 41
Case Use ID
Data Process
Description
User follows the data processing for uncommon values
Actors
Admin or User level users.
Case Use ID
Data Validation
Description
User makes the validation of all data inputs prior to report generation
Actors
Admin. or User levels
Case Use ID
Report Generation
Description
User generates final report and broadcast its availability
Actors
Admin. or User levels

42 Requirements Analysis and Specifications
Fig. 5-5 - Reporting Use Cases Diagram
“Reporting” Use Cases
Case Use ID
Consult Report
Description
User consults existing reports
Actors
Admin, User or Viewer level users.
Case Use ID
Generate Report
Description
User builds new report based on pre - approved data on backup
Actors
Admin or User level users.

5.4 Early Prototype
As a small aide to prove the validity of project, the author committed to build an
early functional prototype with the mere intention of demonstrating the possibilities on the
improvement of calculation process with a simple automation of the data processing stage.
It was built using the available tools in company, Microsoft Excel and its internal
functionalities, Visual Basic for Applications.
Due to company security reasons and lack of access to its systems it was not possible
to extend the prototype further into the data gathering stage of process. Therefore, its only
function is to process all previously gathered raw data and determine the values of KPI.
For the prototype the KPI chosen was the H.P.U. due to author familiarization.
Detailed Specification of Indicator
H.P.U. – Hours Per Unit is a Key Performance Indicator.
It is built by the number of production hours over the number of built cars on the
same period. Although it defies the academic theory around KPI by inverting the calculation
process, inputs over outputs, that makes it more easily readable for its analysis, as the output
comes in hours, not as a percentage of produced car, which is always harder to understand
than the amount of time itself. This could lead to a misdirected attention to decipher its
value instead of its meaning.
Presentation
As referred previously the KPI should be presented against historical data and target
values. The way chosen by company to present this indicator on Volkswagen Autoeuropa is
presented on Fig. 5-6.
HPU HPU MA
Soll Ist Δ Area Soll Ist Δ Soll Ist Δ Overtime (Std./Fzg.)
1,38 1,57 0,19 Press 1,38 1,70 0,32 21 26 5 0,00
9,40 6,72 -2,68 Body 9,40 5,77 -3,63 145 88 -57 0,00
3,42 3,64 0,22 Paint 3,42 3,60 0,18 53 55 2 0,00
16,12 14,75 -1,37 Assembly 16,12 15,33 -0,79 248 234 -14 0,00
1,70 1,73 0,03 Quality 1,70 1,83 0,13 26 28 2 0,00
32,02 28,41 -3,61 Total 32,02 28,23 -3,79 493 431 -62 0,00
28,41 28,23 26,00
33,0829,10
28
,00
28
,00
28
,00
27,3527,3527,3527,3527,3527,35 27,35
32,0232,02 32,02 32,02 32,02 32,02 32,02
Ø kw 43 26.10.2009 27.10.2009 28.10.2009 29.10.2009 30.10.2009 Ø kw 44
80
UP
D
118
Soll
Ist
118 118 118 118 118118
118 105117
118
VBZ if Volume Soll Acheived
Pünktchenplan VBZ
Fig. 5-6 - HPU Report Presentation

44 Requirements Analysis and Specifications
On this report, the decision-maker agent is presented with report on Fig. 5-6 there he can
see how each area on Plant is performing on current time period as well as an overall
comparison with historical values from the same period of time over the previews days and
previews week.
On top is also possible to see the production volumes as well as target production volume.
Calculation process
The calculation process is easy, as it can be seen from the formula itself, the hard step is
the data gathering and processing steps, the countless number of details makes it almost
impossible to automate. The description of entire process is presented on
Fig. 5-7 – HPU Calculation steps
Interface
The prototype interface is based on Microsoft Excel VBA script.
Fig. 5-8 – Calculation prototype – main input screen
Prototyping Of Functional Interface 45
On Fig. 5-8 the main input screen is presented.
On this screen the first input is the date the report is referred to. After this, user is
capable of defining the time discounts that took place on the referred time period, discounts
can be due to workers council meetings or malfunctions on the assembly line, the Effective
Working Time is determined automatically, production volume is also inserted on this screen,
it is inserted by model and must be referred to the time period considered before.
On this screen, user is prompted for the location of database and location of
retrieved Absenteeism excel files, then by pressing the ―Generate Output‖ button an
automated sorting algorithm is executed making the Absenteeism sheets with ―Imputed‖ and
―Absent‖ to be merged counting all workers that are already counted as absent and all
workers that are absent from plant but not yet considered as absent on system.
Here are also presented the target values to witch final value is compared to.
On this screen, many steps were possible to improve and automate but due to
internal company security issues, the access to databases and other logging systems was
limited to the author.
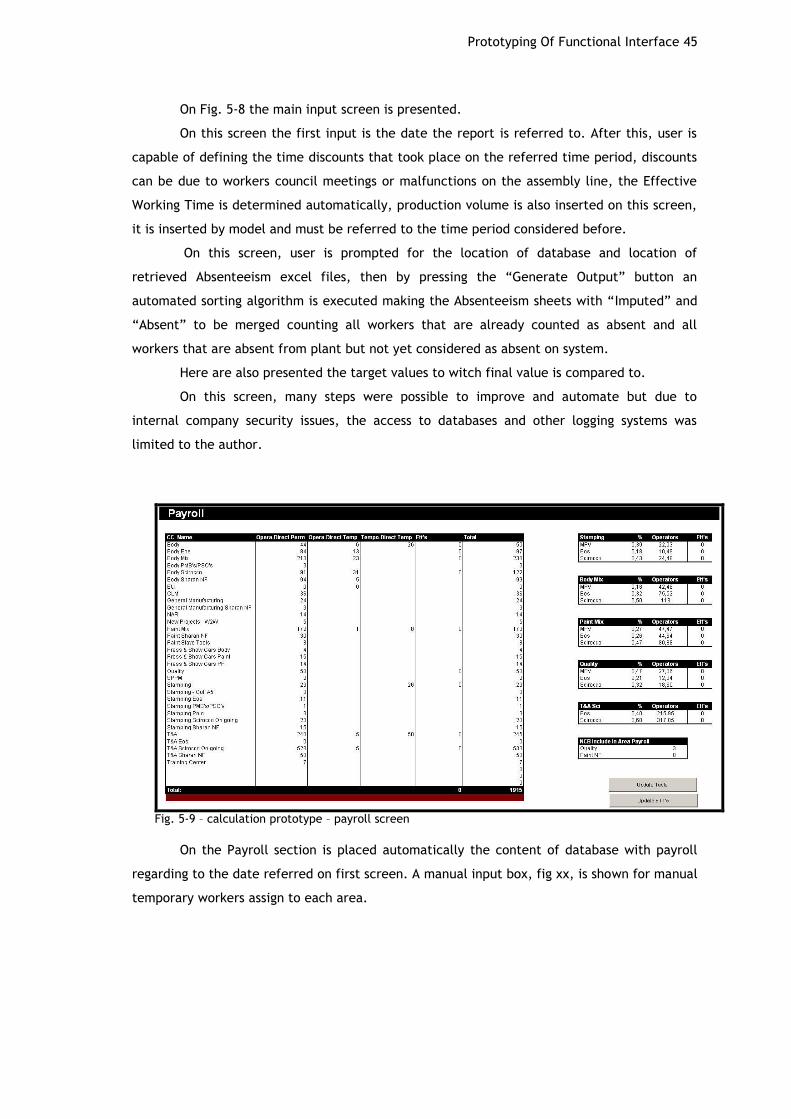
Fig. 5-9 – calculation prototype – payroll screen
On the Payroll section is placed automatically the content of database with payroll
regarding to the date referred on first screen. A manual input box, fig xx, is shown for manual
temporary workers assign to each area.

46 Requirements Analysis and Specifications
Fig. 5-10 – Calculation prototype – Exceptions, Internal transfers, Absenteeism and Training screen
As the previews screen, this is also populated automatically from database and user has to
fulfil the temporary workers by hand.
Fig. 5-11 – Calculation Prototype – Final calculations for KPI values per model
On Fig. 5-11 all calculations are made, to achieve the final KPI value. From this screen the
values are taken to build the final report.

Prototyping Of Functional Interface 47
Conclusion
By this simple calculation prototype is easily seen that the main problem remains, this is,
the allocation of workers. Although some steps were greatly improved, like that absenteeism
categorization, a step that manually done takes an average of 3 minutes is done on prototype
in an average of 8 seconds; this represents an improvement on this part of process around
91%.
The problem of data validation remains. Because there is no standardized data transfers it
is not possible to automate the data treatment on other process like temporary workers
assign and the data gather remains manual due to company security restrictions.


Chapter 6
Performance Measure Support System
After the specification of requirements and the construction of the early prototype the
author achieved a better understand on the process and its difficulties.
The next step was to develop prototype interfaces with users. This was done using an
iterative process, with several meetings with stakeholders, with the objective of tuning to the
best the acceptance level and an improvement on workflow. This specification was prepared
focusing on the current KPIs used in Autoeuropa but system was idealized as scalable, this means
it can be also used to define and determine new KPI’s to be developed/adopted and used on
Plant or even on other plant with different characteristics.
To the launch of application a splash screen is displayed with the company logo, as seen on
Fig. 6-1.
Fig. 6-1 - Splash Screen
The program then prompts user for a login and password, Fig. 6-2.
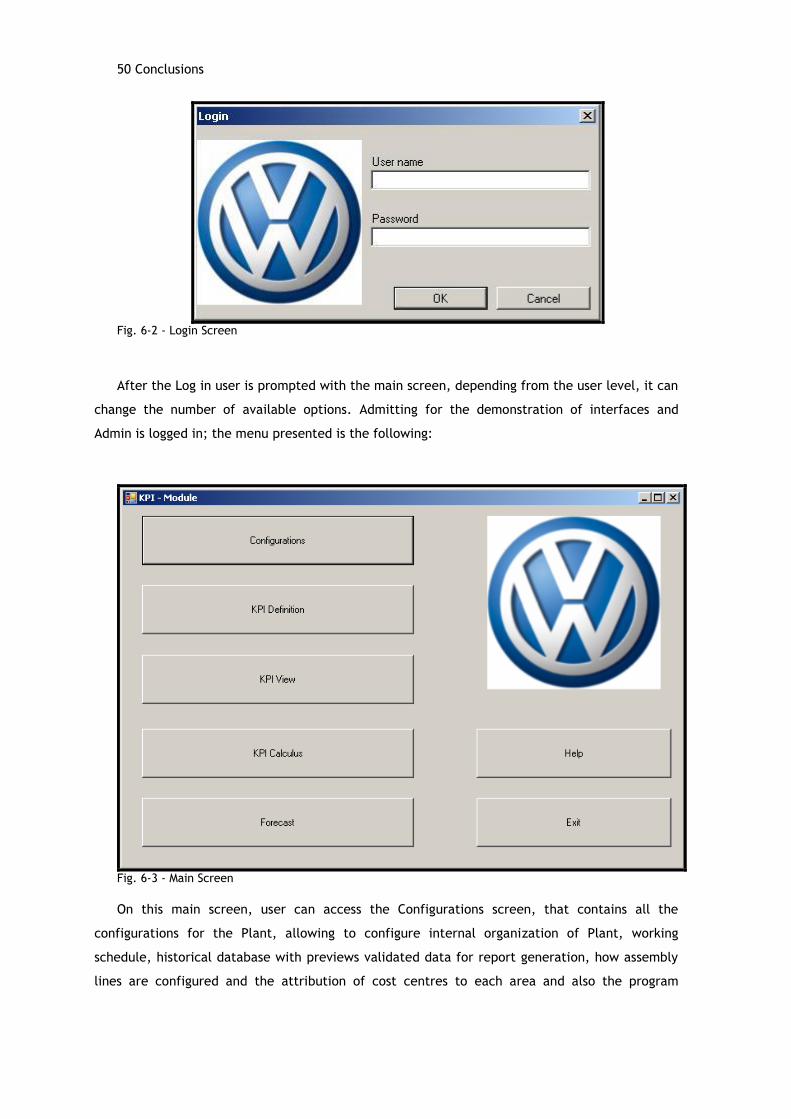
50 Conclusions
Fig. 6-2 - Login Screen
After the Log in user is prompted with the main screen, depending from the user level, it can
change the number of available options. Admitting for the demonstration of interfaces and
Admin is logged in; the menu presented is the following:
Fig. 6-3 - Main Screen
On this main screen, user can access the Configurations screen, that contains all the
configurations for the Plant, allowing to configure internal organization of Plant, working
schedule, historical database with previews validated data for report generation, how assembly
lines are configured and the attribution of cost centres to each area and also the program

configurations such as network connections, user accounts and logging operations. This can be
seen on Fig. 6-4.
Fig. 6-4 – Plant definitions and Module Configurations
After all changes made to configuration user can return to main screen. The option KPI
Definition allows user to access a screen to define or re-define KPIs. Here user can choose
between available inputs and/or define new inputs, in that case he’s taken to Fig. 6-6, when
inputs are chosen, they automatically appear as blocks for formula definition, Fig. 6-5

52 Conclusions
Fig. 6-5 – Interface for defining new KPI
As mentioned previously, if user decides he needs new input values, he is prompted with the
screen on Fig. 6-6, here a list of all values is presented and some criteria for data sorting are
available to help tuning the data, after defined here, these inputs appear automatically on the
list of available inputs for KPI definition.
Fig. 6-6 – Input definition
Something similar is presented when new product is added, user has to define its name and
assign the cost centres assigned to that same product. Fig. 6-7.
Fig. 6-7 – Define New Product

When user selects the option to start the calculation process, the following screen is
presented; Fig. 6-9, here user can select the available options to generate a report
Fig. 6-8 - Define Report Prompt
After choosing the product, the KPI and the time period for the report, data is gathered and
presented on screen like on Fig. 6-9, here is requested to user to review values for any un-
noticed data error, discrepancies and uncommon values.
Fig. 6-9 – Data Validation by User
The final report is presented on a graphical form on screen, Fig. 6-10.
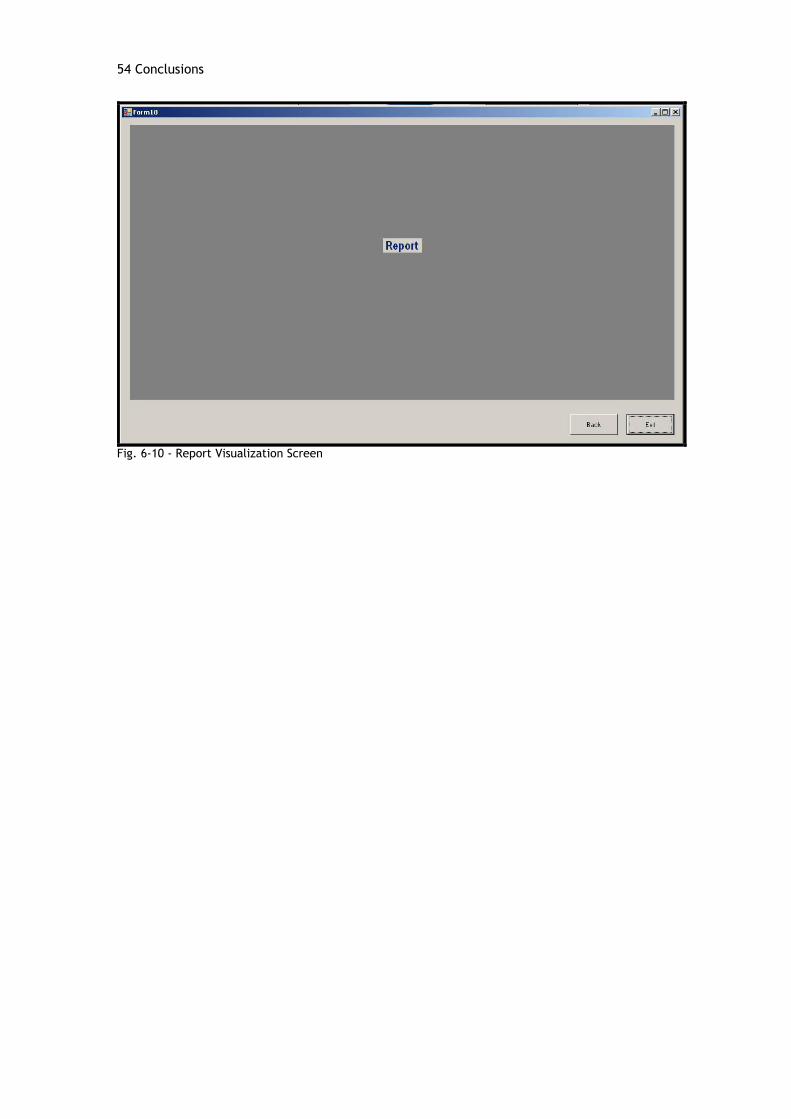
54 Conclusions
Fig. 6-10 - Report Visualization Screen

Chapter 7
Conclusions
7.1 Main Conclusions
The development of this thesis and its specification allowed a visual prediction on the future
KPI calculation system. By doing this a better picture was formed, to all the stakeholders of the
bottlenecks of process and its handicaps. These handicaps on KPI usages lead to several
adjustments every day on the process and therefore the impossibility of improving and fully
automate the entire process.
With the early prototype, based on Microsoft Excel, some steps where automated and a
significant improvement on wasted time was made, but due to lack of template usage between
the several departments, the automated steps are under risk of failing and therefore
compromising the entire process of calculation.
The produced System Requirements Specification, based on IEEE 830 – 1993, allowed a better
explanation of ideas and constraints, as well as a good specification on wanted functionalities.
This specification is also part of Virtual Factory Framework Project and it leads the VFF to a
major advance on developing one of its modules
The usage of Process Engineering Methodology allowed broadness and ambitious specification
identifying some additional and unpredicted functionality.
For the specification of user interfaces used an approach through workflows techniques and
the concepts evolved to a commonly accepted model for all stakeholders.
The developed work fulfilled all the objectives proposed at its beginning, the current
calculation methods were learned and analysed, an early functional prototype was made for the
immediate help on partially solving the major problem, the time taken to build the reports and a
software requirements specification was developed alongside with involved stakeholders in order
to bring it as close as possible to the demanded.

56 Conclusions
7.2 Future work
The impact of this thesis is not yet measurable, but expectations are high.
During the next year the development and implementation of specified system will take
place. After, its approval by the stakeholders, by conducting a series of validations scenarios on
main phases, the ―Monitoring‖ and the ―Ramp-up‖ phases, it is planned to be incorporated on
Volkswagen Autoeuropa systems and also on the VFF Project.

References
[1] VFF Documentation at www.vff-project.eu
[2] Oregon State University Family Study Centre (Clara C. Pratt, et al.). Building
Results: From Wellness Goals to Positive Outcomes for Oregon's Children, Youth, and
Families, 2nd ed. (Salem, OR: Oregon Commission on Children and Families, 1997).
[3] National Research Council. E. B. Perrin, J. S. Durch, and S. M. Skillman, eds., Health
Performance Measurement in the Public Sector: Principles and Policies for
Implementing an Information Network. (Washington D.C.: National Academy Press,
1999).
[4] Virginia Department of Planning and Budget, Planning and Evaluation Section.
Virginia's Handbook on Planning & Performance (Richmond: VA Department of
Planning and Budget, 1998).
[5] Dennis S. O'Leary, Joint Commission on Accreditation of Healthcare Organizations.
"Measurement and Accountability: Taking Careful Aim," Journal of Quality
Improvement 21(July 1995): 354-357.
[6] Based on: Joint Commission on Accreditation of Healthcare Organizations (JCAHO).
[7] Jorge Ferreira Pinheiro, Antonio, ―BP2IT‖ Master Thesis, Faculty of Engineering –
University of Porto


![Fluid Mechanics-61341 - An-Najah Videos · Fluid Mechanics-61341 An-Najah National University College of Engineering Chapter [2] 1 Fluid Mechanics-2nd Semester 2010- [2] Fluid Statics](https://img.pdfslide.us/doc/110x75/5e19634fef3326501a61ebca/fluid-mechanics-61341-an-najah-videos-fluid-mechanics-61341-an-najah-national.jpg)