Embed Size (px)
Citation preview
PERFORMANCE INVESTIGATION OF LARGE DIAMETER WATER PIPE
MATERIALS Prepared by:
THE CENTER FOR UNDERGROUND INFRASRTUCTURE RESEARCH AND EDUCATION (CUIRE)
Director: Dr. Mohammad Najafi, P.E., F., ASCE
Graduate Research Assistants:
Ameya Paradkar, Chandan Venkatesh, Pradip Deshmukh, Rahul Manda, Tushar Joshi
i
DISCLAIMER
All pipe materials have advantages and limitations, and can deteriorate over time. Many project
specific factors, operations and maintenance procedures of a specific utility, and site and soil conditions
around the pipe affect pipe performance. Not all of these factors were considered in the literature used
this presentation, or considered in the limited utility survey responses received. Therefore, this report
cannot be used as basis for selection or rejection of any specific pipe material, and/or to make any design
decisions on a project, which is responsibility of design professionals.
ii
ACKNOWLEDGEMENTS
We would like to express our gratitude to all those who gave us the possibility to complete this
report. We are deeply indebted to Dr. Mohammad Najafi, P.E., Director of the Center for Underground
Infrastructure Research and Education (CUIRE) and Assistant Professor at the University of Texas at
Arlington whose help, stimulating suggestions, knowledge, experience and encouragement helped us in
all the times of study and analysis of the project in the pre and post research period.
We wish to thank all of the 21 water utilities that replied to the survey and made the completion of
this analysis possible. For confidentiality reasons, individual acknowledgements will not be listed here.
However, this report would not have been possible without their support. We also wish to thank the
survey respondents for taking the time to share their views with us.
We would also like to acknowledge Mr. Abhay Jain, CUIRE Program Manager for all the help he
provided in completion of this report.
iii
TABLE OF CONTENTS
DISCLAIMER ................................................................................................................................................. i
ACKNOWLEDGEMENTS ............................................................................................................................. ii
LIST OF ILLUSTRATIONS .......................................................................................................................... vii
LIST OF TABLES ......................................................................................................................................... ix
EXECUTIVE SUMMARY .............................................................................................................................. x
CHAPTER 1. OVERVIEW ................................................................................................................ 1-1
1.1 Introduction .................................................................................................................................. 1-1
1.2 Methodology ................................................................................................................................. 1-1
1.3 Objectives..................................................................................................................................... 1-2
CHAPTER 2. POPULATION SERVED AND FOOTAGE OF
WATER SYSTEM FOR DIFFERENT PIPE MATERIALS ......................................... 2-2
2.1 Population per Utility .................................................................................................................... 2-2
2.2 Footage per Utility ........................................................................................................................ 2-3
2.3 Summary Table ............................................................................................................................ 2-4
2.4 Footage of Water System per Utility ............................................................................................ 2-5
2.5 Footage of Water System for PCCP ............................................................................................ 2-6
2.6 Relationship between Diameter and Footage for PCCP ............................................................. 2-7
2.6 Footage of Water Systems for Steel Pipe .................................................................................... 2-8
2.7 Relationship between Diameter and Footage for Steel Pipe ....................................................... 2-9
2.8 Footage of Water System for PVC Pipes ................................................................................... 2-10
2.9 Relationship between Diameter and Footage for PVC Pipe ...................................................... 2-11
2.10 Footage of Water System for HDPE Pipes .............................................................................. 2-12
iv
2.11 Relationship between Diameter and Footage for HDPE Pipe ................................................. 2-13
2.12 Footage of Water System for DI Pipes .................................................................................... 2-14
2.13 Relationship between Diameter and Footage for DI Pipe ........................................................ 2-15
2.14 Footage of Water System for CI Pipes .................................................................................... 2-16
2.15 Relationship between Diameter and Footage for CI Pipe ........................................................ 2-17
2.16 Footage of Water System for Bar-wrapped Pipes ................................................................... 2-18
2.17 Relationship between Diameter and Footage for Bar-wrapped Pipe ...................................... 2-19
2.18 Footage of Water System for Bar-wrapped Pipes ................................................................... 2-20
2.19 Relationship between Diameter and Footage for Other Pipes ................................................ 2-21
2.20 Summary Table ........................................................................................................................ 2-22
CHAPTER 3. RELATIONSHIP BETWEEN INVENTORY AND AGE
OF EACH PIPE MATERIAL ...................................................................................... 3-1
3.1 Inventory and Age of PCCP ......................................................................................................... 3-2
3.2 Relationship between Diameter Range and Age of PCCP .......................................................... 3-3
3.3 Inventory and Age of Steel Pipe .................................................................................................. 3-4
3.4 Relationship between Diameter Range and Age of Steel Pipe ................................................... 3-5
3.5 Inventory and Age of PVC Pipe ................................................................................................... 3-6
3.6 Relationship between Diameter Range and Age of PVC Pipe .................................................... 3-7
3.7 Inventory and Age of HDPE Pipe ................................................................................................. 3-8
3.8 Relationship between Diameter Range and Age of HDPE Pipe.................................................. 3-9
3.7 Inventory and Age of DI Pipe ..................................................................................................... 3-10
3.8 Relationship between Diameter Range and Age of DI Pipe ...................................................... 3-11
3.7 Inventory and Age of CI Pipe ..................................................................................................... 3-12
v
3.8 Relationship between Diameter Range and Age of DI Pipe ...................................................... 3-13
3.7 Inventory and Age of Bar-wrapped Pipe .................................................................................... 3-14
3.8 Relationship between Diameter Range and Age of DI Pipe ...................................................... 3-15
3.9 Inventory and Age of Other Pipe ................................................................................................ 3-16
3.10 Relationship between Diameter Range and Age of DI Pipe .................................................... 3-17
3.11 Summary Table ........................................................................................................................ 3-18
CHAPTER 4. CAUSES OF FAILURE .............................................................................................. 4-1
4.1 Causes of failure – PCCP ............................................................................................................ 4-1
4.2 Causes of failure – Steel Pipes .................................................................................................... 4-1
4.3 Causes of failure – PVC Pipes ..................................................................................................... 4-1
4.4 Causes of failure – HDPE Pipes .................................................................................................. 4-2
4.5 Causes of failure – DI Pipes......................................................................................................... 4-2
4.6 Causes of failure – CI Pipes......................................................................................................... 4-2
4.7 Causes of failure – Bar-wrapped Pipes ....................................................................................... 4-2
CHAPTER 5. MODES OF FAILURE ................................................................................................ 5-1
5.1 Modes of failure – PCCP.............................................................................................................. 5-1
5.2 Modes of failure – Steel Pipes ..................................................................................................... 5-1
5.3 Modes of failure – DI Pipes .......................................................................................................... 5-1
5.4 Modes of failure – CI Pipes .......................................................................................................... 5-2
5.5 Modes of failure – Bar-wrapped Pipes ......................................................................................... 5-2
CHAPTER 6. CONSIDERATIONS FOR USAGE ............................................................................. 6-1
6.1 Considerations – PCCP ............................................................................................................... 6-1
6.2 Considerations – Steel Pipes ....................................................................................................... 6-1
vi
6.3 Considerations – PVC Pipes ........................................................................................................ 6-1
6.4 Considerations – HDPE Pipes ..................................................................................................... 6-2
6.5 Considerations – DI Pipes............................................................................................................ 6-2
6.6 Considerations – CI Pipes............................................................................................................ 6-2
6.7 Considerations – Bar-wrapped Pipes .......................................................................................... 6-2
CHAPTER 7. PERFORMANCES ..................................................................................................... 7-1
CHAPTER 8. CONCLUDING REMARKS ........................................................................................ 8-1
vii
LIST OF ILLUSTRATIONS
Figure 2-1 Population of Area Served by Water Utilities ........................................................................... 2-2
Figure 2-2: Footage for 24” & Larger Diameter.......................................................................................... 2-3
Figure 2-3: Footage of Water System for all sizes ..................................................................................... 2-5
Figure 2-4: Footage of Water Systems for PCCP ..................................................................................... 2-6
Figure 2-5: Relationship between Diameter Range and Miles of PCCP ................................................... 2-7
Figure 2-6: Footage of Water Systems for Steel Pipes ............................................................................ 2-8
Figure 2-7 Relationship between Diameter Range and Miles of Steel Pipes ............................................ 2-9
Figure 2-8 Footage of Water Systems for PVC pipes .............................................................................. 2-10
Figure 2-9 Relationship between Diameter Range and Miles of PVC Pipes ........................................... 2-11
Figure 2-10 Footage of Water Systems for HDPE Pipe .......................................................................... 2-12
Figure 2-11 Relationship between Diameter Range and Miles of HDPE ................................................ 2-13
Figure 2-12 Footage of Water System for DI Pipes ................................................................................. 2-14
Figure 2-13 Relationship between Diameter Range and Miles of DI Pipes ............................................. 2-15
Figure 2-14 Footage of Water System for CI Pipes ................................................................................. 2-16
Figure 2-15 Relationship between Diameter Range and Miles of CI Pipes ............................................. 2-17
Figure 2-16 Footage of Water Systems for Bar-wrapped Pipes .............................................................. 2-18
Figure 2-17 Relationship between Diameter Range and Miles of Bar-wrapped Pipes ........................... 2-19
Figure 2-18 Footage of Water System for Other Pipes ........................................................................... 2-20
Figure 2-19 Relationship between Diameter Range and Miles of Other Pipes ....................................... 2-21
Figure 3-1 Relationship between Inventory and Age of PCCP .................................................................. 3-2
Figure 3-2 Relationship between Diameter Range and Miles of PCCP .................................................... 3-3
Figure 3-3 Relationship between Inventory and Age of Steel Pipes ......................................................... 3-4
Figure 3-4 Relationship between Diameter Range and Miles of Steel Pipes ............................................ 3-5
Figure 3-5 Relationship between Inventory and Age of PVC Pipes .......................................................... 3-6
Figure 3-6 Relationship between Diameter Range and Miles of PVC Pipes ............................................. 3-7
Figure 3-7 Relationship between Inventory and Age of HDPE Pipes ........................................................ 3-8
Figure 3-8 Relationship between Diameter Range and Miles of HDPE Pipes .......................................... 3-9
viii
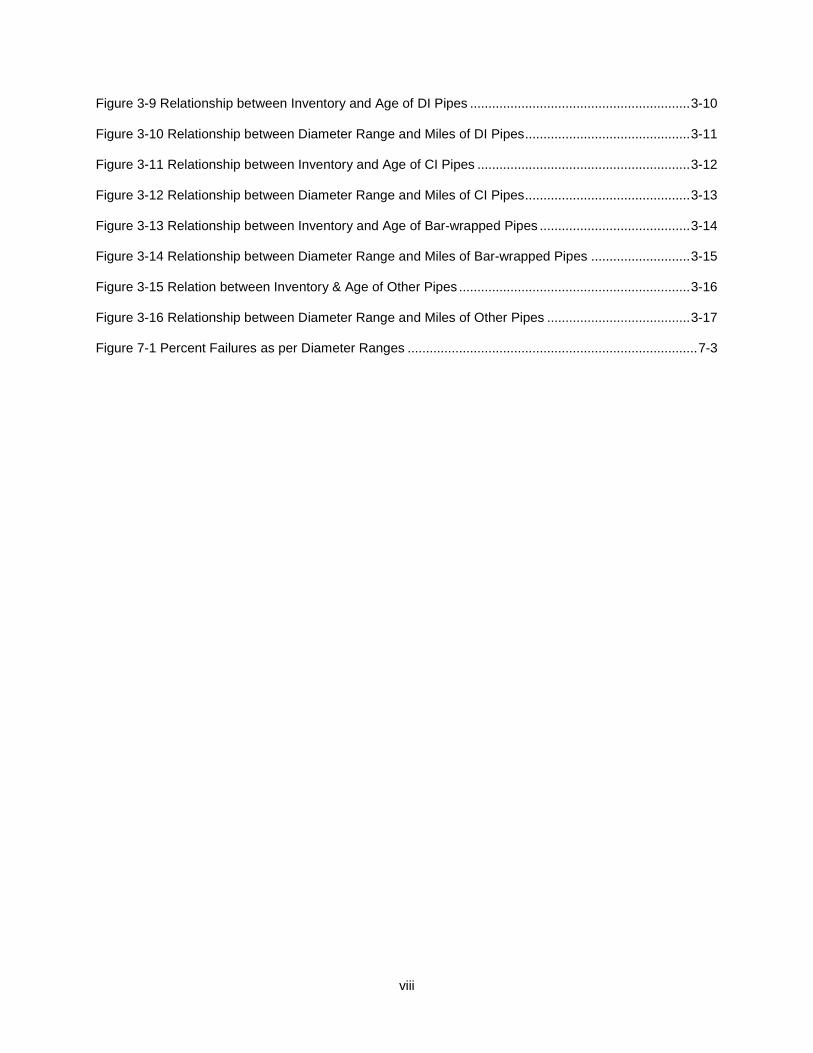
Figure 3-9 Relationship between Inventory and Age of DI Pipes ............................................................ 3-10
Figure 3-10 Relationship between Diameter Range and Miles of DI Pipes ............................................. 3-11
Figure 3-11 Relationship between Inventory and Age of CI Pipes .......................................................... 3-12
Figure 3-12 Relationship between Diameter Range and Miles of CI Pipes ............................................. 3-13
Figure 3-13 Relationship between Inventory and Age of Bar-wrapped Pipes ......................................... 3-14
Figure 3-14 Relationship between Diameter Range and Miles of Bar-wrapped Pipes ........................... 3-15
Figure 3-15 Relation between Inventory & Age of Other Pipes ............................................................... 3-16
Figure 3-16 Relationship between Diameter Range and Miles of Other Pipes ....................................... 3-17
Figure 7-1 Percent Failures as per Diameter Ranges ............................................................................... 7-3
ix
LIST OF TABLES
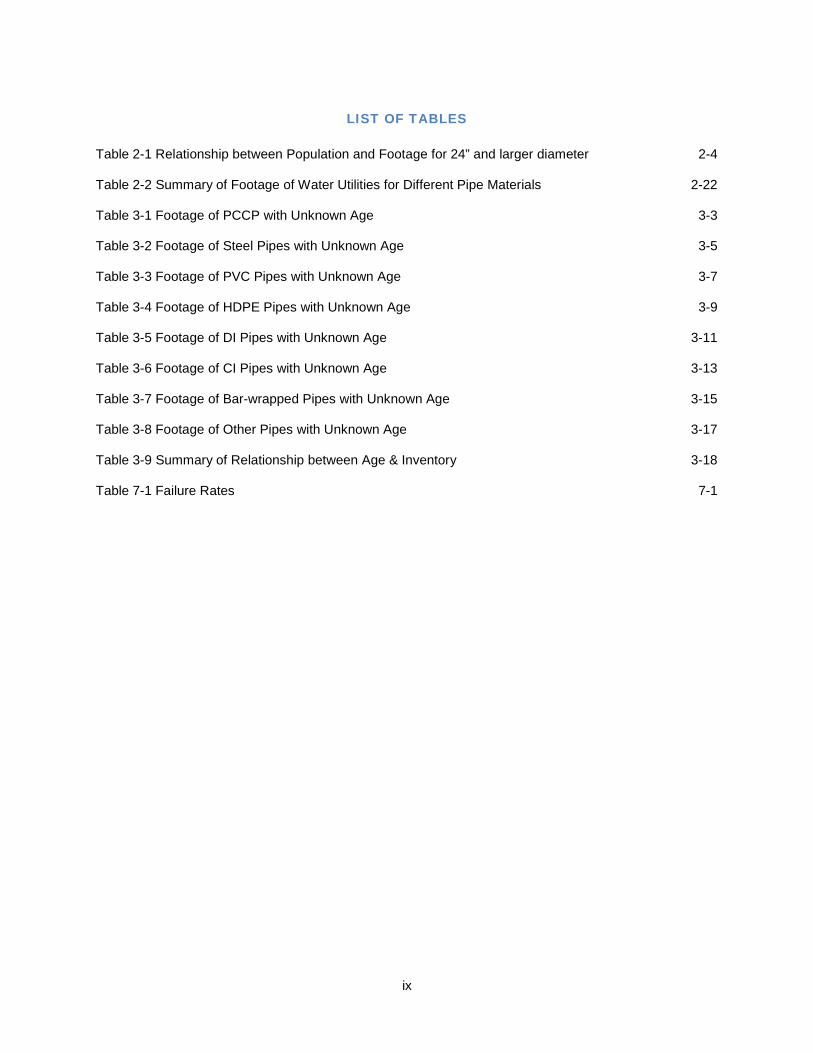
Table 2-1 Relationship between Population and Footage for 24” and larger diameter 2-4
Table 2-2 Summary of Footage of Water Utilities for Different Pipe Materials 2-22
Table 3-1 Footage of PCCP with Unknown Age 3-3
Table 3-2 Footage of Steel Pipes with Unknown Age 3-5
Table 3-3 Footage of PVC Pipes with Unknown Age 3-7
Table 3-4 Footage of HDPE Pipes with Unknown Age 3-9
Table 3-5 Footage of DI Pipes with Unknown Age 3-11
Table 3-6 Footage of CI Pipes with Unknown Age 3-13
Table 3-7 Footage of Bar-wrapped Pipes with Unknown Age 3-15
Table 3-8 Footage of Other Pipes with Unknown Age 3-17
Table 3-9 Summary of Relationship between Age & Inventory 3-18
Table 7-1 Failure Rates 7-1
x
EXECUTIVE SUMMARY
Water distribution and transmission networks form essential components of water supply systems
in most urban centers. The failure in the distribution network can lead to service interruption to large
communities, direct costs for repairs, property damage, lost water, indirect costs like loss of production,
damage to adjacent utilities and social costs like discomfort, traffic and business disruptions (Rajani and
Kleiner, 2010).
In 2007, Drinking Water Infrastructure Needs Survey and Assessment found that the United
States needs to spend $334.8 billion over the next two decades to ensure clean and safe water transport.
Thus, it is of great importance to study the failure of the water pipelines considering its impact on the
social life as well as the financial impact it can have in the near future.
As per the ‘Report Card for America’s Infrastructure’ published by ASCE in 2009, the nation’s
infrastructure is in poor condition and drinking water, wastewater received very low grades compared to
other infrastructure categories.
This research gathered the failure data of 24” and larger diameter water pipelines from 21 water
utilities across the United States of America. The data provided by the utilities is used to create a
comprehensive report which includes population served per mile of pipe length, relationship between the
inventory and age of the pipe materials, causes and modes of failures, advantages and reasons for
restrictions on these pipe materials and the failure rates for different pipe materials for the 21 water
utilities.
1-1
CHAPTER 1. OVERVIEW
1.1 Introduction
This report presents the study of performance of water main materials for diameter sizes of 24-
inch and larger from 21 water utilities from 16 states across the United States of America. The current
study is done by Center for Underground Infrastructure Research and Education (CUIRE). The data
from different water utilities and facilities is gathered to analyze the population served by the pipeline
facility, miles of pipeline material in use, age and diameter (larger than 24 inches) of pipeline material
used per facility, performance of each pipeline material and the causes behind these failures.
A total length of 2,612miles were reported by the survey respondents for different types of pipe
materials like PCC, PVC, HDPE, Steel, CI, DI and some other materials. A total of 64% out of 2,612miles
is in between 24” – 36” diameter range, 17% for 42” – 48” and remaining 19% for 54” and larger.
Performance per 100 miles for PVC pipes is 9, for PCCP pipes is 15, Bar-wrapped pipes is 14, DI pipes is
14, Steel pipes is 19 and for CI pipes it is 29.The performance for HDPE pipes is not available. Also,
performance for other pipes which include CCN, GUN, SCC, Reinforced Concrete, Concrete, Asbestos
Cement, Pre-tensioned Concrete Cylinder, Copper and Unknown is 8.0.
1.2 Methodology
Over 300 surveys were sent out to water distribution utilities in the United States in the year of
2011 - 2012. The study constituted of basic survey questions for 24-inch and larger diameter sizes of
water mains that were to be filled out by the water utilities. The survey focused on asking questions
regarding the population served by respective water utilities, different diameter ranges, age and inventory
of different pipe materials, water mains break data which included date of installation, date and cause of
failure, also soil conditions.
The survey responses were then analyzed and the pipe materials were compared with the help of
different charts to calculate the performances for these pipe materials for 24-inch and larger diameter size
water mains.
1-2
1.3 Objectives
• The principle objective of this study was to calculate the performance for individual pipe material
of 24-inch and larger diameter.
• Average population served per mile of water mains by 24-inch and larger diameters.
• To find out the distribution of pipe materials in different diameter ranges of 24-inch to 36-inch, 42-
inch to 48-inch and 54-inch and larger.
• Identifying considerations for material selection for each water utility.
2-2
CHAPTER 2. POPULATION SERVED AND FOOTAGE OF WATER SYSTEM FOR
DIFFERENT PIPE MATERIALS
This section explains the population served by the water utilities as well as the relationship between
the total footage of the water system with the total population. Further, the total footage of each of the
pipe materials divided in the following three categories is explained:
1. 24” - 36” Diameter Size
2. 42” - 48” Diameter Size
3. 54” and Larger Diameter Size
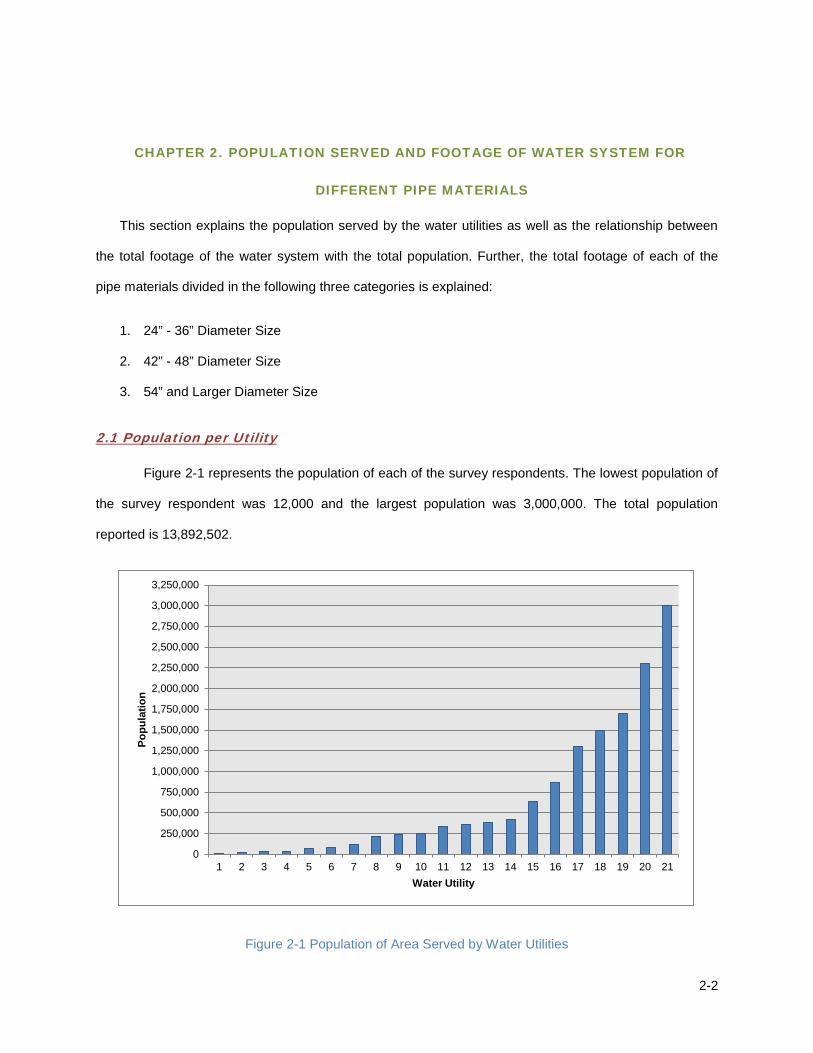
2.1 Population per Utility
Figure 2-1 represents the population of each of the survey respondents. The lowest population of
the survey respondent was 12,000 and the largest population was 3,000,000. The total population
reported is 13,892,502.
Figure 2-1 Population of Area Served by Water Utilities
0
250,000
500,000
750,000
1,000,000
1,250,000
1,500,000
1,750,000
2,000,000
2,250,000
2,500,000
2,750,000
3,000,000
3,250,000
1 2 3 4 5 6 7 8 9 10 11 12 13 14 15 16 17 18 19 20 21
Popu
latio
n
Water Utility
2-3
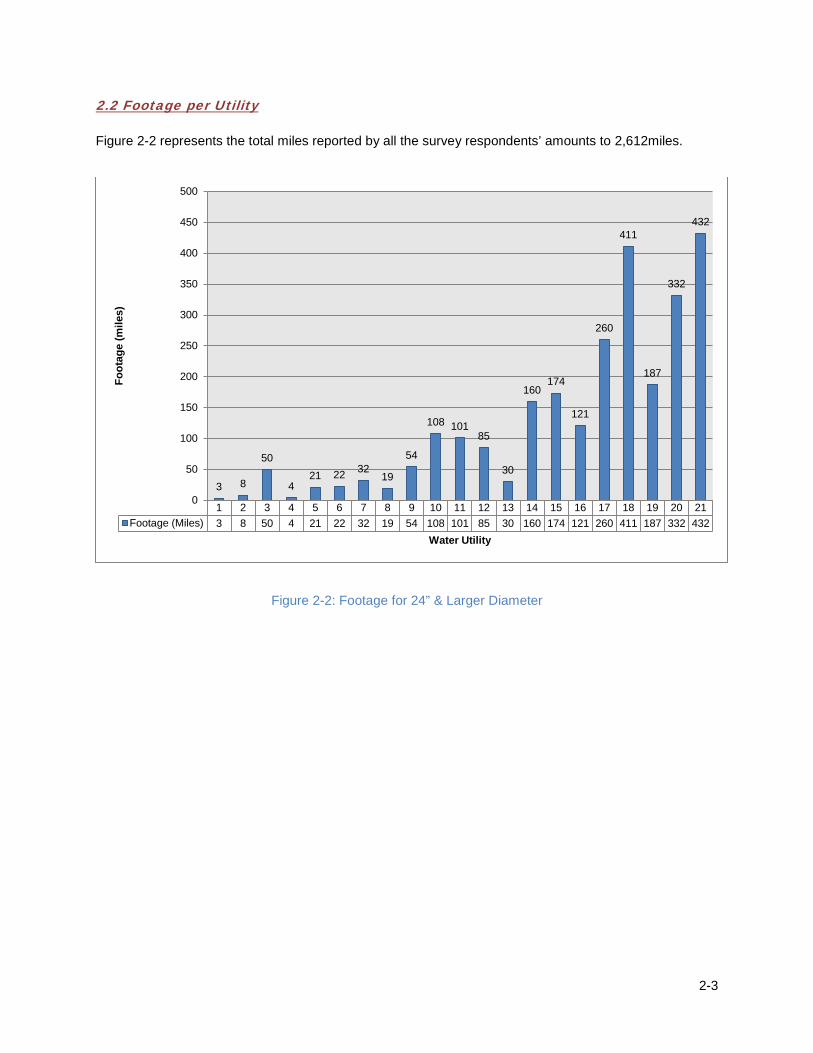
2.2 Footage per Utility
Figure 2-2 represents the total miles reported by all the survey respondents’ amounts to 2,612miles.
Figure 2-2: Footage for 24” & Larger Diameter
1 2 3 4 5 6 7 8 9 10 11 12 13 14 15 16 17 18 19 20 21Footage (Miles) 3 8 50 4 21 22 32 19 54 108 101 85 30 160 174 121 260 411 187 332 432
3 8
50
4 21 22 32
19
54
108 101 85
30
160 174
121
260
411
187
332
432
0
50
100
150
200
250
300
350
400
450
500
Foot
age
(mile
s)
Water Utility

2-4
2.3 Summary Table
Table 2-1 represents the total population served per mile of 24” and larger pipe diameters in each
of the water utilities.
Table 2-1 Relationship between Population and Footage for 24” and larger diameter
Survey Respondents
Population Served
Footage (miles)
Population Served per
mile Survey
Respondents Population
Served Footage (miles)
Population Served per
mile
1 11,529 3.0 3792 12 365,438 85 4299 2 20,000 8.0 2500 13 380,000 30 12667 3 34,400 50 694 14 420,000 160 2633 4 35,000 4 9211 15 634,284 174 3656 5 75,000 21 3571 16 867,599 121 7182 6 78,000 22 3482 17 1,300,000 260 5000 7 120,500 32 3766 18 1,500,000 411 3651 8 220,000 19 11579 19 1,700,000 187 9091 9 240,000 54 4444 20 2,300,000 332 6936
10 250,000 108 2319 21 3,000,000 432 6944 11 340,758 101 3381 Total 13,892,508 2612 5319
2-5
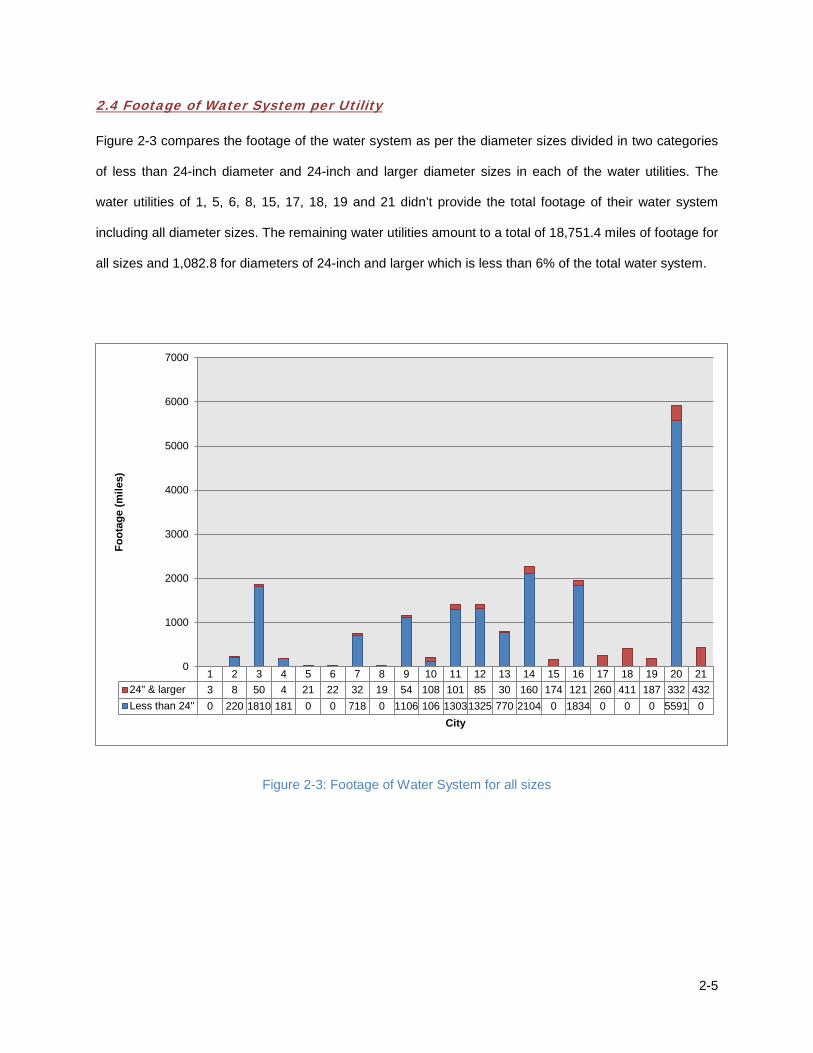
2.4 Footage of Water System per Utility
Figure 2-3 compares the footage of the water system as per the diameter sizes divided in two categories
of less than 24-inch diameter and 24-inch and larger diameter sizes in each of the water utilities. The
water utilities of 1, 5, 6, 8, 15, 17, 18, 19 and 21 didn’t provide the total footage of their water system
including all diameter sizes. The remaining water utilities amount to a total of 18,751.4 miles of footage for
all sizes and 1,082.8 for diameters of 24-inch and larger which is less than 6% of the total water system.
Figure 2-3: Footage of Water System for all sizes
1 2 3 4 5 6 7 8 9 10 11 12 13 14 15 16 17 18 19 20 2124" & larger 3 8 50 4 21 22 32 19 54 108 101 85 30 160 174 121 260 411 187 332 432Less than 24" 0 220 1810 181 0 0 718 0 1106 106 13031325 770 2104 0 1834 0 0 0 5591 0
0
1000
2000
3000
4000
5000
6000
7000
Foot
age
(mile
s)
City
2-6
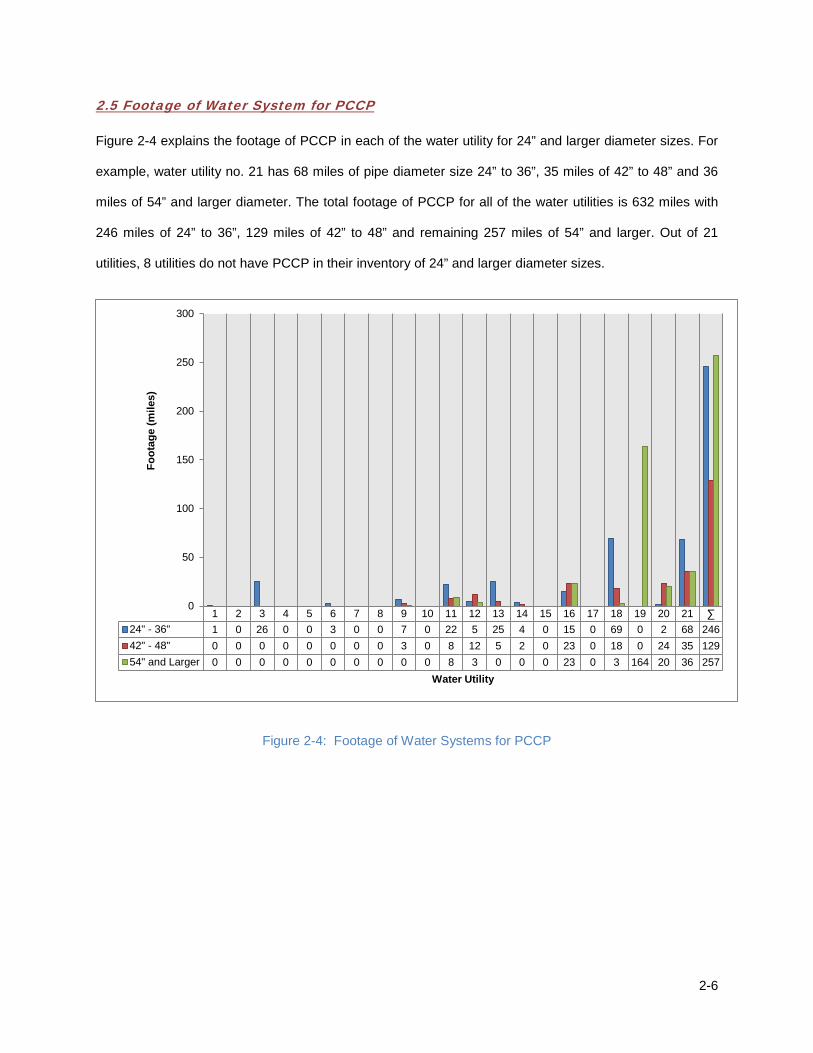
2.5 Footage of Water System for PCCP
Figure 2-4 explains the footage of PCCP in each of the water utility for 24” and larger diameter sizes. For
example, water utility no. 21 has 68 miles of pipe diameter size 24” to 36”, 35 miles of 42” to 48” and 36
miles of 54” and larger diameter. The total footage of PCCP for all of the water utilities is 632 miles with
246 miles of 24” to 36”, 129 miles of 42” to 48” and remaining 257 miles of 54” and larger. Out of 21
utilities, 8 utilities do not have PCCP in their inventory of 24” and larger diameter sizes.
Figure 2-4: Footage of Water Systems for PCCP
1 2 3 4 5 6 7 8 9 10 11 12 13 14 15 16 17 18 19 20 21 ∑ 24" - 36" 1 0 26 0 0 3 0 0 7 0 22 5 25 4 0 15 0 69 0 2 68 24642" - 48" 0 0 0 0 0 0 0 0 3 0 8 12 5 2 0 23 0 18 0 24 35 12954" and Larger 0 0 0 0 0 0 0 0 0 0 8 3 0 0 0 23 0 3 164 20 36 257
0
50
100
150
200
250
300
Foot
age
(mile
s)
Water Utility
2-7
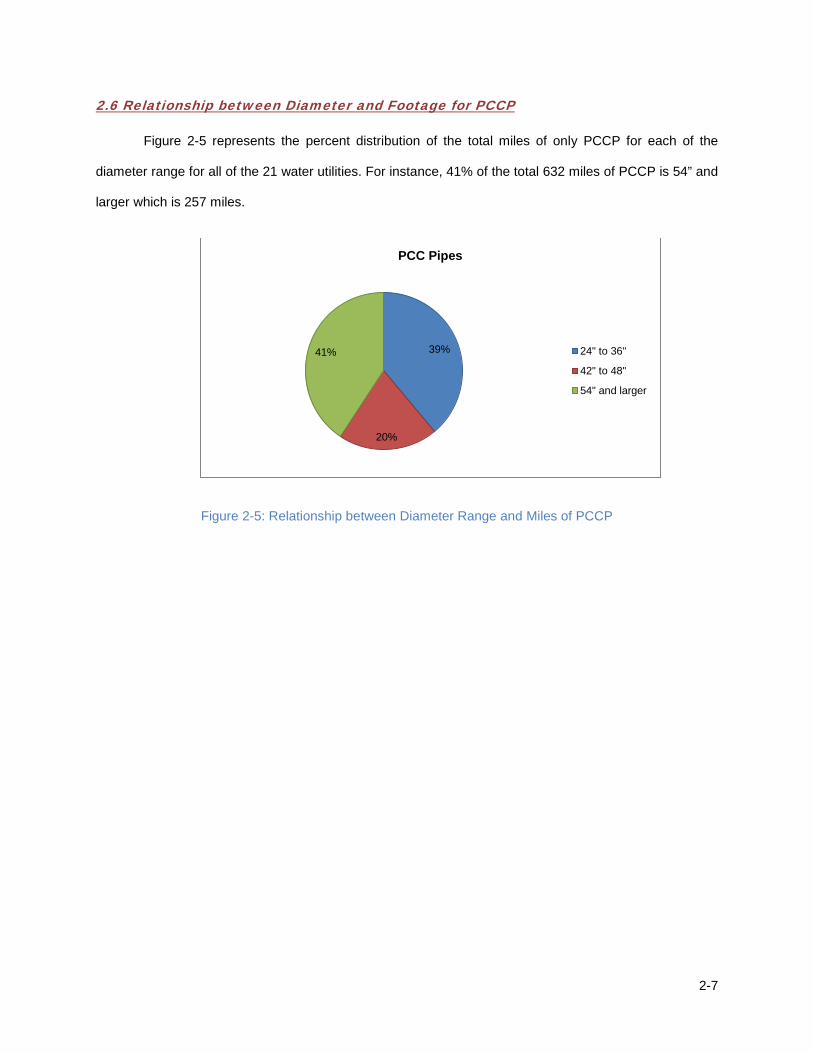
2.6 Relationship between Diameter and Footage for PCCP
Figure 2-5 represents the percent distribution of the total miles of only PCCP for each of the
diameter range for all of the 21 water utilities. For instance, 41% of the total 632 miles of PCCP is 54” and
larger which is 257 miles.
Figure 2-5: Relationship between Diameter Range and Miles of PCCP
39%
20%
41%
PCC Pipes
24" to 36"
42" to 48"
54" and larger
2-8
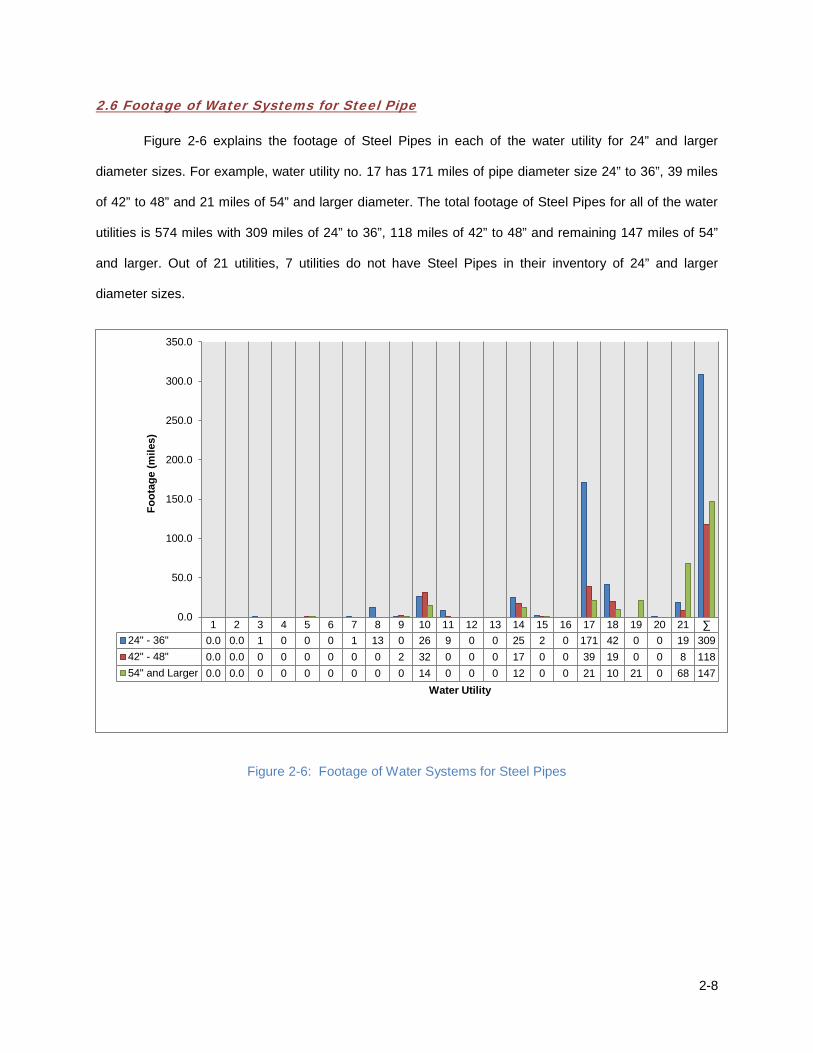
2.6 Footage of Water Systems for Steel Pipe
Figure 2-6 explains the footage of Steel Pipes in each of the water utility for 24” and larger
diameter sizes. For example, water utility no. 17 has 171 miles of pipe diameter size 24” to 36”, 39 miles
of 42” to 48” and 21 miles of 54” and larger diameter. The total footage of Steel Pipes for all of the water
utilities is 574 miles with 309 miles of 24” to 36”, 118 miles of 42” to 48” and remaining 147 miles of 54”
and larger. Out of 21 utilities, 7 utilities do not have Steel Pipes in their inventory of 24” and larger
diameter sizes.
Figure 2-6: Footage of Water Systems for Steel Pipes
1 2 3 4 5 6 7 8 9 10 11 12 13 14 15 16 17 18 19 20 21 ∑ 24" - 36" 0.0 0.0 1 0 0 0 1 13 0 26 9 0 0 25 2 0 171 42 0 0 19 30942" - 48" 0.0 0.0 0 0 0 0 0 0 2 32 0 0 0 17 0 0 39 19 0 0 8 11854" and Larger 0.0 0.0 0 0 0 0 0 0 0 14 0 0 0 12 0 0 21 10 21 0 68 147
0.0
50.0
100.0
150.0
200.0
250.0
300.0
350.0
Foot
age
(mile
s)
Water Utility
2-9
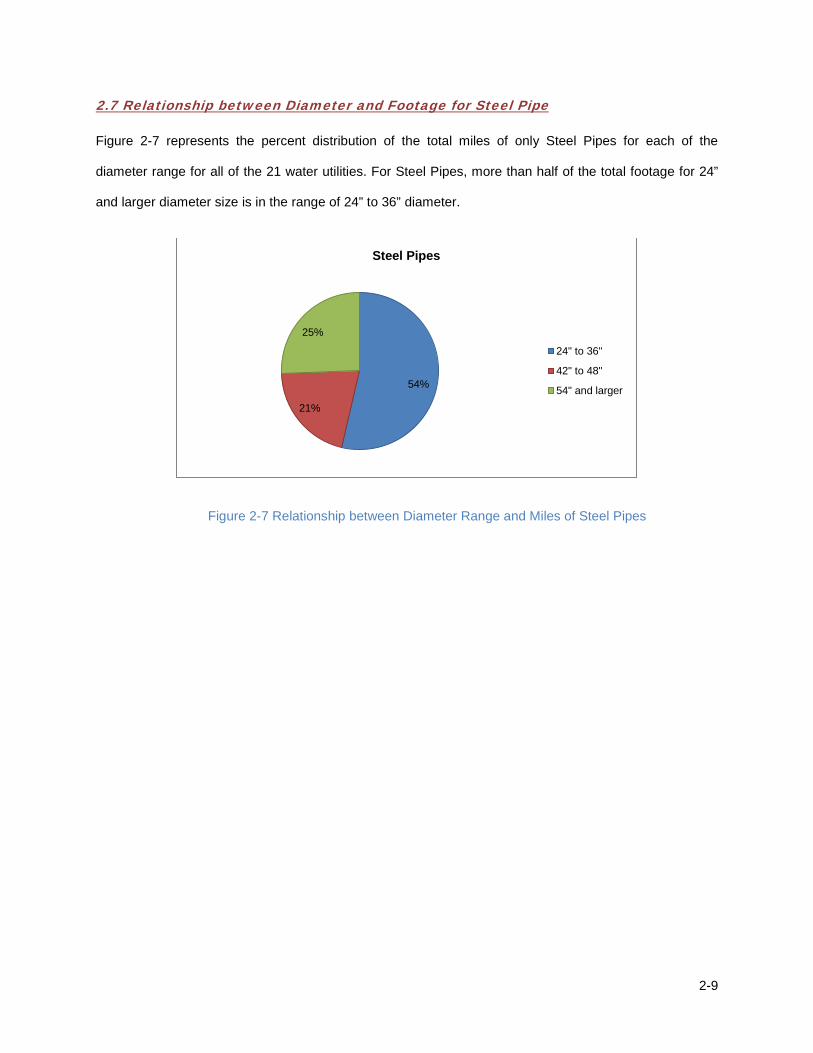
2.7 Relationship between Diameter and Footage for Steel Pipe
Figure 2-7 represents the percent distribution of the total miles of only Steel Pipes for each of the
diameter range for all of the 21 water utilities. For Steel Pipes, more than half of the total footage for 24”
and larger diameter size is in the range of 24” to 36” diameter.
Figure 2-7 Relationship between Diameter Range and Miles of Steel Pipes
54%
21%
25%
Steel Pipes
24" to 36"
42" to 48"
54" and larger
2-10
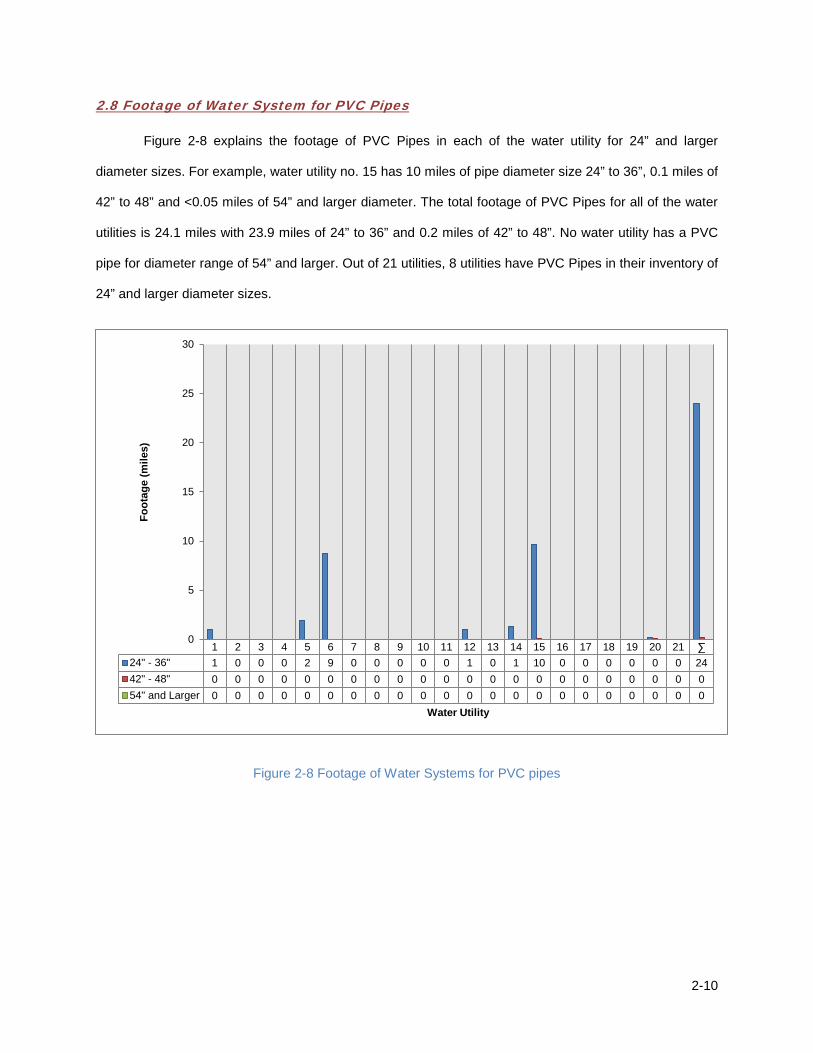
2.8 Footage of Water System for PVC Pipes
Figure 2-8 explains the footage of PVC Pipes in each of the water utility for 24” and larger
diameter sizes. For example, water utility no. 15 has 10 miles of pipe diameter size 24” to 36”, 0.1 miles of
42” to 48” and <0.05 miles of 54” and larger diameter. The total footage of PVC Pipes for all of the water
utilities is 24.1 miles with 23.9 miles of 24” to 36” and 0.2 miles of 42” to 48”. No water utility has a PVC
pipe for diameter range of 54” and larger. Out of 21 utilities, 8 utilities have PVC Pipes in their inventory of
24” and larger diameter sizes.
Figure 2-8 Footage of Water Systems for PVC pipes
1 2 3 4 5 6 7 8 9 10 11 12 13 14 15 16 17 18 19 20 21 ∑ 24" - 36" 1 0 0 0 2 9 0 0 0 0 0 1 0 1 10 0 0 0 0 0 0 2442" - 48" 0 0 0 0 0 0 0 0 0 0 0 0 0 0 0 0 0 0 0 0 0 054" and Larger 0 0 0 0 0 0 0 0 0 0 0 0 0 0 0 0 0 0 0 0 0 0
0
5
10
15
20
25
30
Foot
age
(mile
s)
Water Utility
2-11
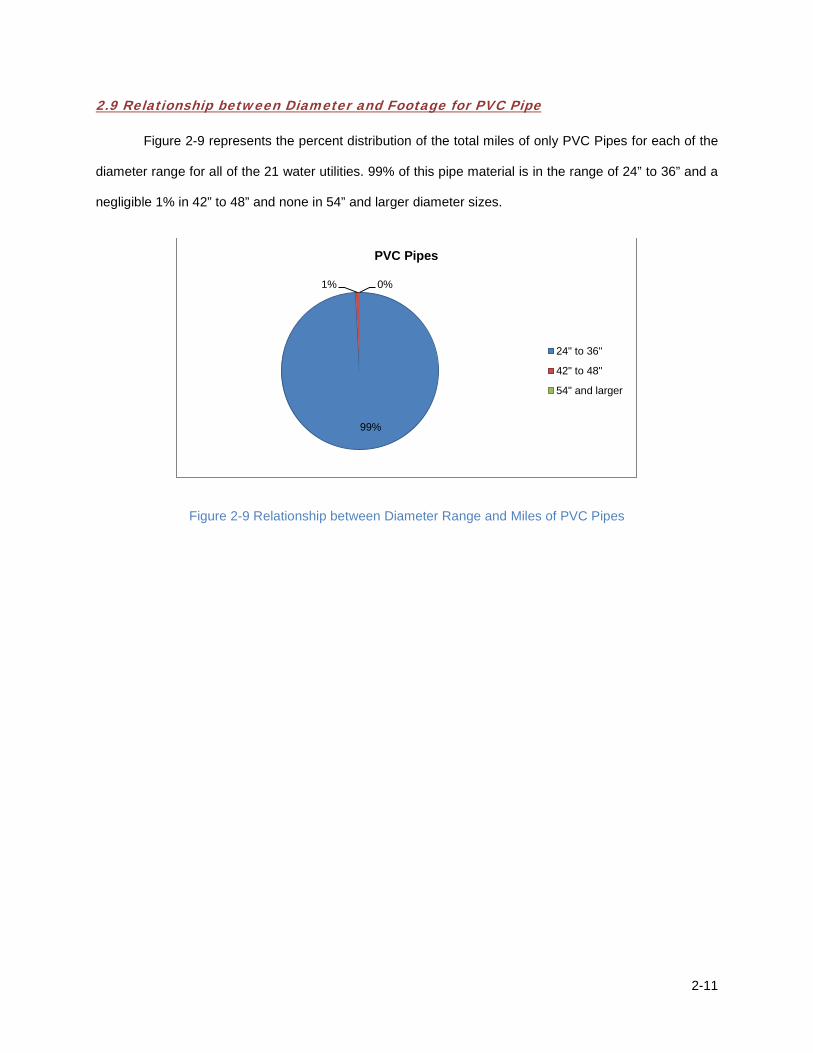
2.9 Relationship between Diameter and Footage for PVC Pipe
Figure 2-9 represents the percent distribution of the total miles of only PVC Pipes for each of the
diameter range for all of the 21 water utilities. 99% of this pipe material is in the range of 24” to 36” and a
negligible 1% in 42” to 48” and none in 54” and larger diameter sizes.
Figure 2-9 Relationship between Diameter Range and Miles of PVC Pipes
99%
1% 0%
PVC Pipes
24" to 36"
42" to 48"
54" and larger
2-12
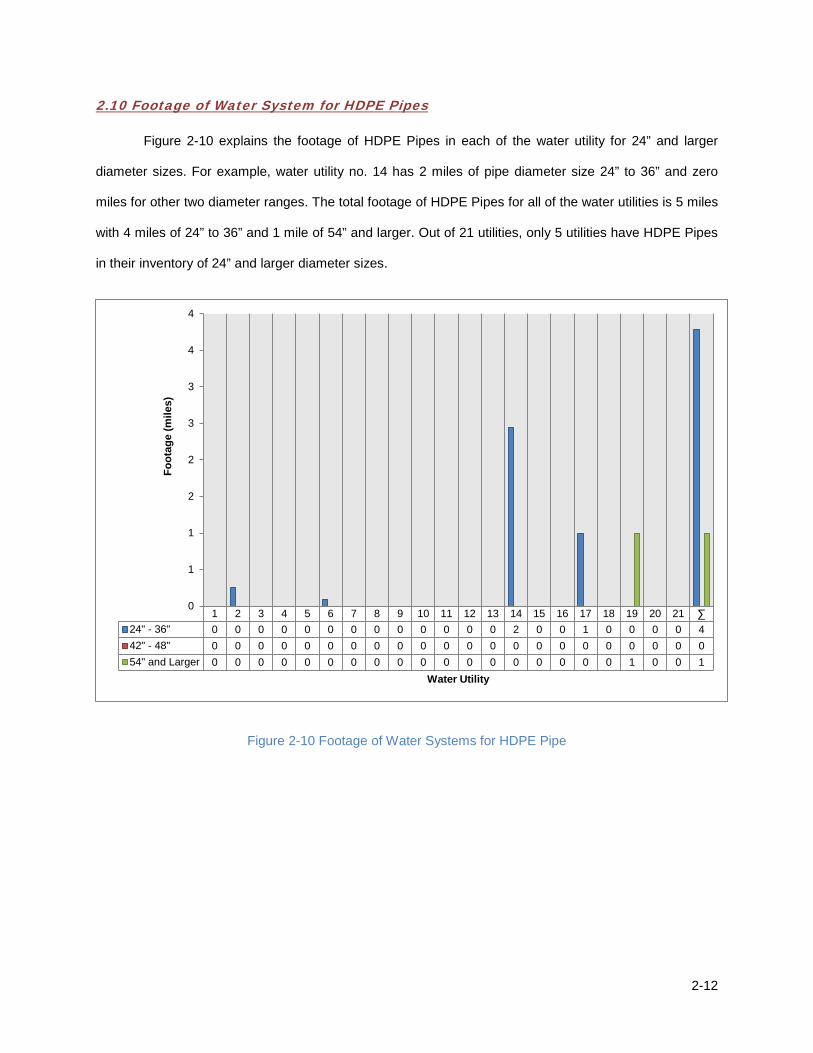
2.10 Footage of Water System for HDPE Pipes
Figure 2-10 explains the footage of HDPE Pipes in each of the water utility for 24” and larger
diameter sizes. For example, water utility no. 14 has 2 miles of pipe diameter size 24” to 36” and zero
miles for other two diameter ranges. The total footage of HDPE Pipes for all of the water utilities is 5 miles
with 4 miles of 24” to 36” and 1 mile of 54” and larger. Out of 21 utilities, only 5 utilities have HDPE Pipes
in their inventory of 24” and larger diameter sizes.
Figure 2-10 Footage of Water Systems for HDPE Pipe
1 2 3 4 5 6 7 8 9 10 11 12 13 14 15 16 17 18 19 20 21 ∑ 24" - 36" 0 0 0 0 0 0 0 0 0 0 0 0 0 2 0 0 1 0 0 0 0 442" - 48" 0 0 0 0 0 0 0 0 0 0 0 0 0 0 0 0 0 0 0 0 0 054" and Larger 0 0 0 0 0 0 0 0 0 0 0 0 0 0 0 0 0 0 1 0 0 1
0
1
1
2
2
3
3
4
4
Foot
age
(mile
s)
Water Utility
2-13
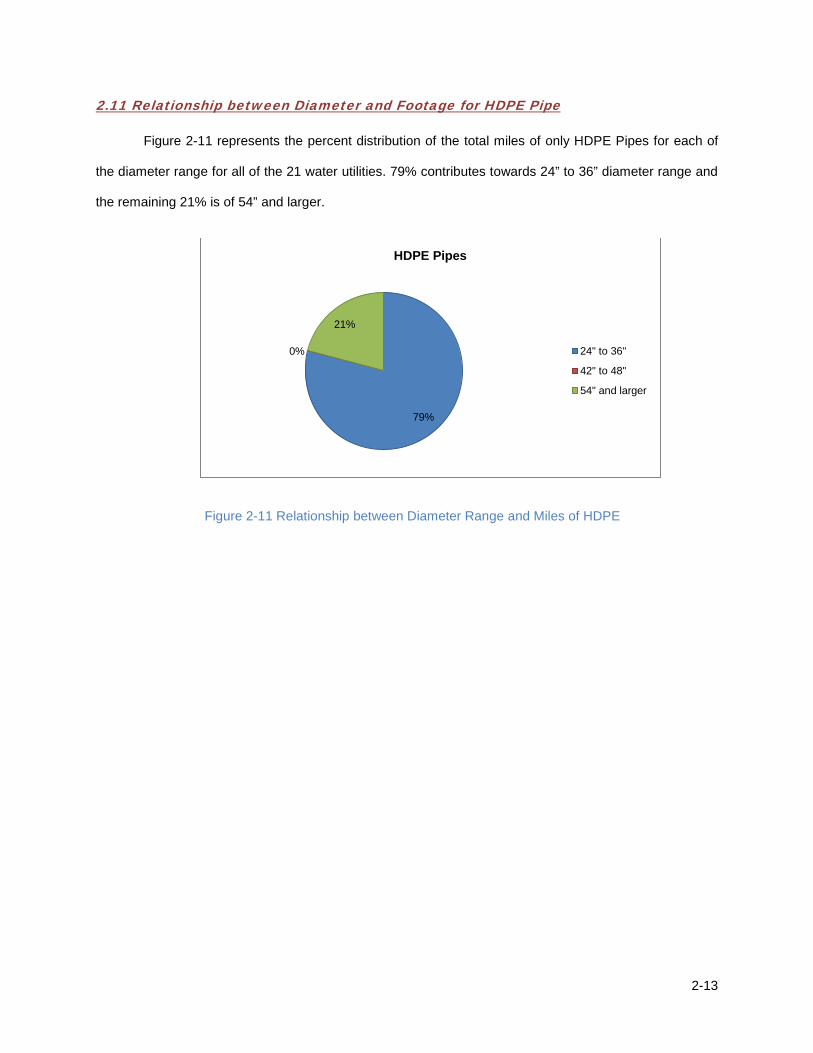
2.11 Relationship between Diameter and Footage for HDPE Pipe
Figure 2-11 represents the percent distribution of the total miles of only HDPE Pipes for each of
the diameter range for all of the 21 water utilities. 79% contributes towards 24” to 36” diameter range and
the remaining 21% is of 54” and larger.
Figure 2-11 Relationship between Diameter Range and Miles of HDPE
79%
0%
21%
HDPE Pipes
24" to 36"
42" to 48"
54" and larger
2-14
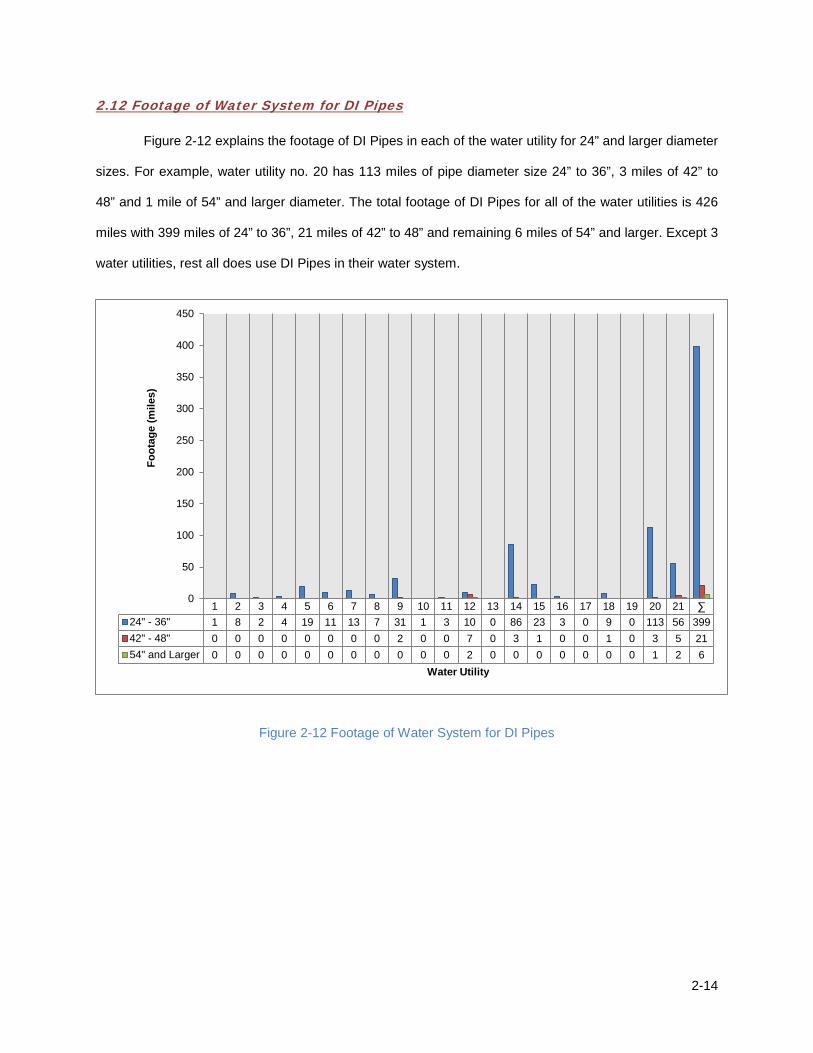
2.12 Footage of Water System for DI Pipes
Figure 2-12 explains the footage of DI Pipes in each of the water utility for 24” and larger diameter
sizes. For example, water utility no. 20 has 113 miles of pipe diameter size 24” to 36”, 3 miles of 42” to
48” and 1 mile of 54” and larger diameter. The total footage of DI Pipes for all of the water utilities is 426
miles with 399 miles of 24” to 36”, 21 miles of 42” to 48” and remaining 6 miles of 54” and larger. Except 3
water utilities, rest all does use DI Pipes in their water system.
Figure 2-12 Footage of Water System for DI Pipes
1 2 3 4 5 6 7 8 9 10 11 12 13 14 15 16 17 18 19 20 21 ∑ 24" - 36" 1 8 2 4 19 11 13 7 31 1 3 10 0 86 23 3 0 9 0 113 56 39942" - 48" 0 0 0 0 0 0 0 0 2 0 0 7 0 3 1 0 0 1 0 3 5 2154" and Larger 0 0 0 0 0 0 0 0 0 0 0 2 0 0 0 0 0 0 0 1 2 6
0
50
100
150
200
250
300
350
400
450
Foot
age
(mile
s)
Water Utility
2-15
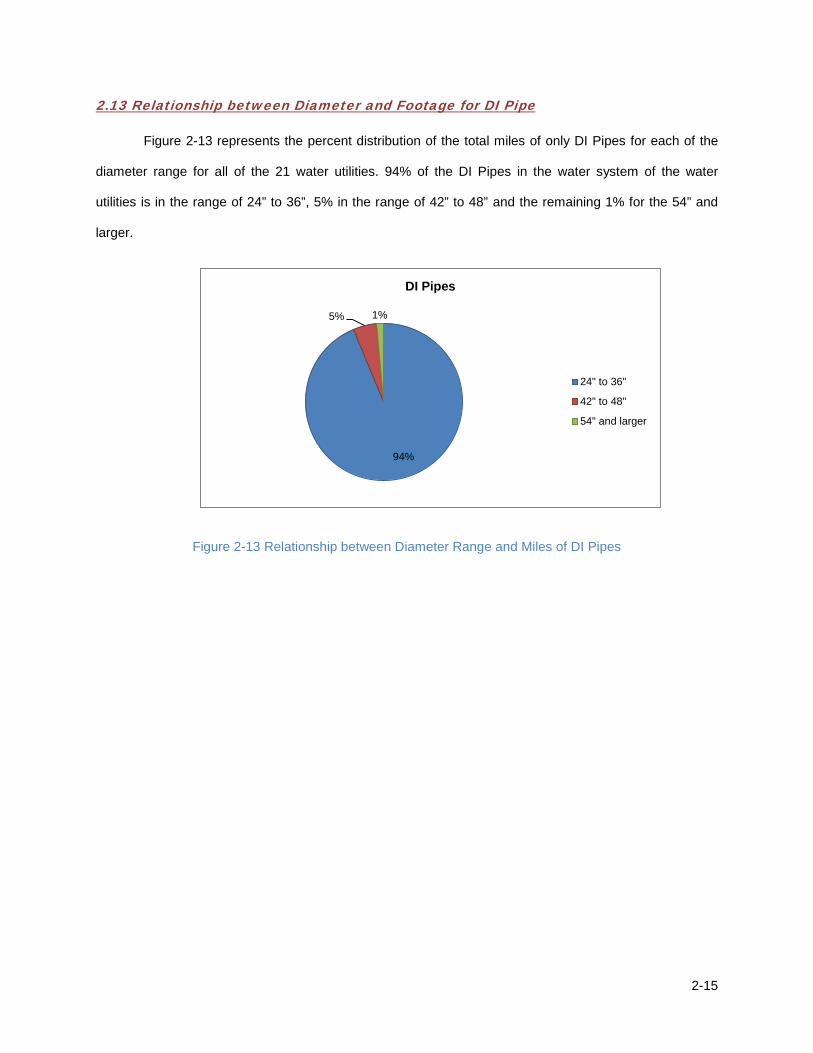
2.13 Relationship between Diameter and Footage for DI Pipe
Figure 2-13 represents the percent distribution of the total miles of only DI Pipes for each of the
diameter range for all of the 21 water utilities. 94% of the DI Pipes in the water system of the water
utilities is in the range of 24” to 36”, 5% in the range of 42” to 48” and the remaining 1% for the 54” and
larger.
Figure 2-13 Relationship between Diameter Range and Miles of DI Pipes
94%
5% 1%
DI Pipes
24" to 36"
42" to 48"
54" and larger
2-16
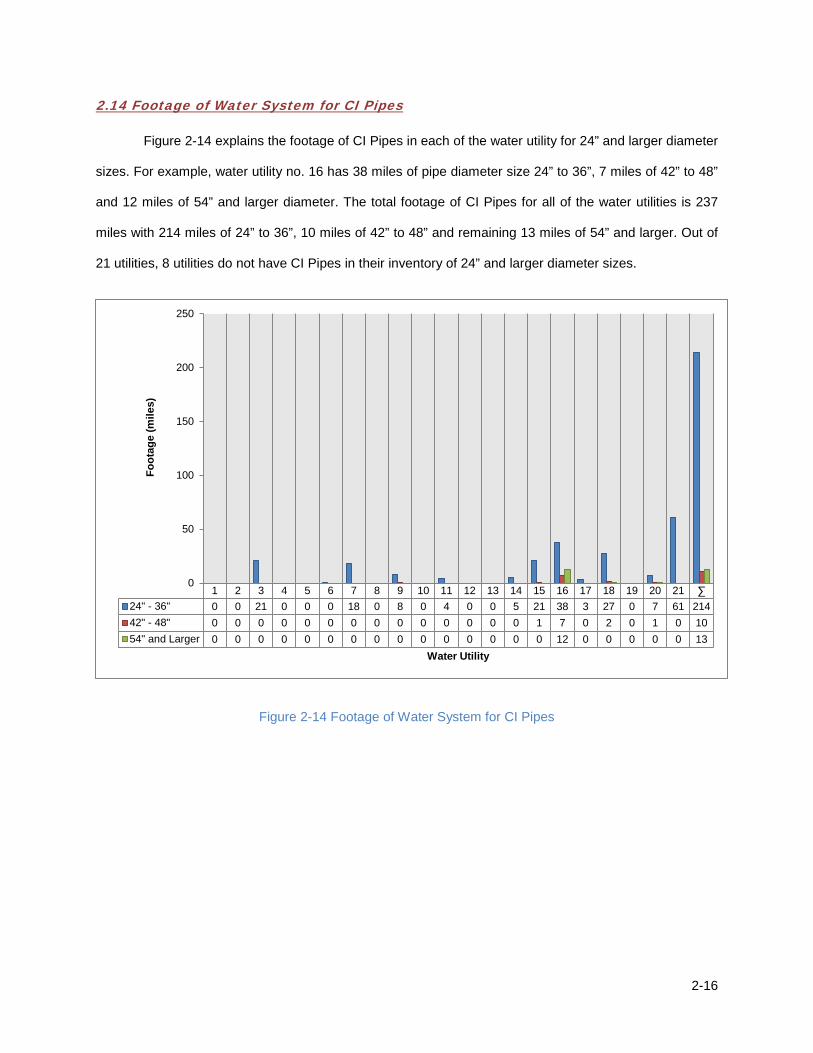
2.14 Footage of Water System for CI Pipes
Figure 2-14 explains the footage of CI Pipes in each of the water utility for 24” and larger diameter
sizes. For example, water utility no. 16 has 38 miles of pipe diameter size 24” to 36”, 7 miles of 42” to 48”
and 12 miles of 54” and larger diameter. The total footage of CI Pipes for all of the water utilities is 237
miles with 214 miles of 24” to 36”, 10 miles of 42” to 48” and remaining 13 miles of 54” and larger. Out of
21 utilities, 8 utilities do not have CI Pipes in their inventory of 24” and larger diameter sizes.
Figure 2-14 Footage of Water System for CI Pipes
1 2 3 4 5 6 7 8 9 10 11 12 13 14 15 16 17 18 19 20 21 ∑ 24" - 36" 0 0 21 0 0 0 18 0 8 0 4 0 0 5 21 38 3 27 0 7 61 21442" - 48" 0 0 0 0 0 0 0 0 0 0 0 0 0 0 1 7 0 2 0 1 0 1054" and Larger 0 0 0 0 0 0 0 0 0 0 0 0 0 0 0 12 0 0 0 0 0 13
0
50
100
150
200
250
Foot
age
(mile
s)
Water Utility
2-17
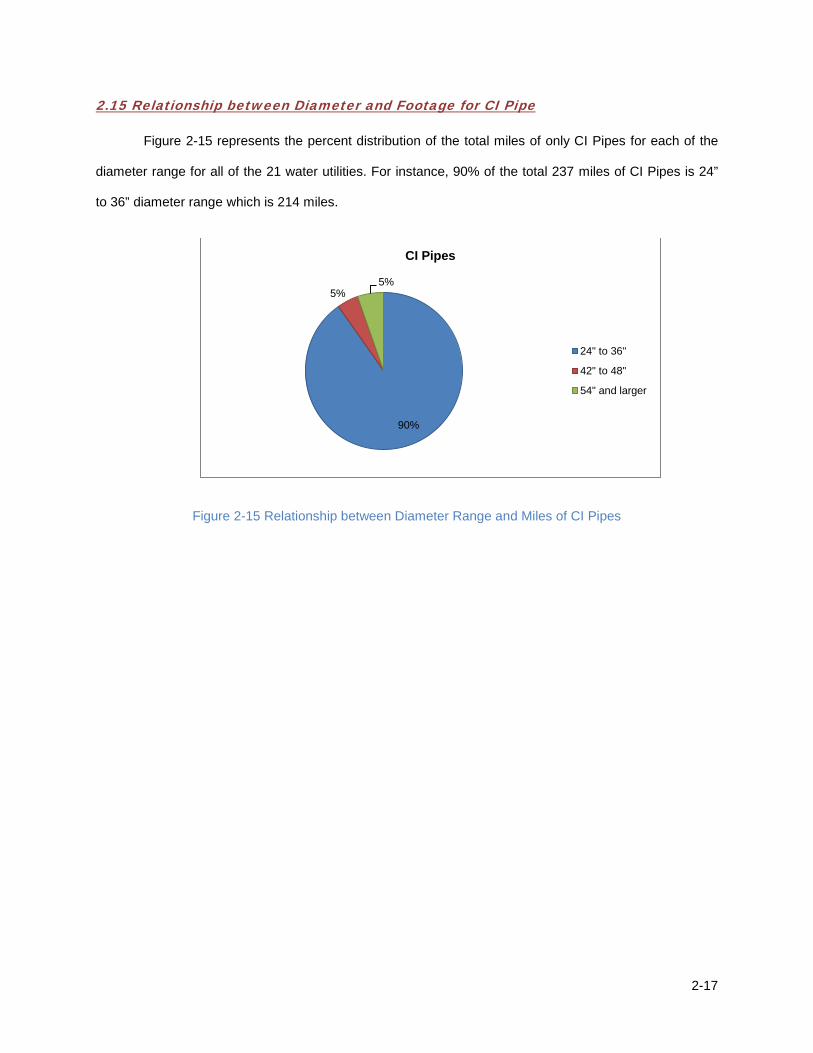
2.15 Relationship between Diameter and Footage for CI Pipe
Figure 2-15 represents the percent distribution of the total miles of only CI Pipes for each of the
diameter range for all of the 21 water utilities. For instance, 90% of the total 237 miles of CI Pipes is 24”
to 36” diameter range which is 214 miles.
Figure 2-15 Relationship between Diameter Range and Miles of CI Pipes
90%
5% 5%
CI Pipes
24" to 36"
42" to 48"
54" and larger
2-18
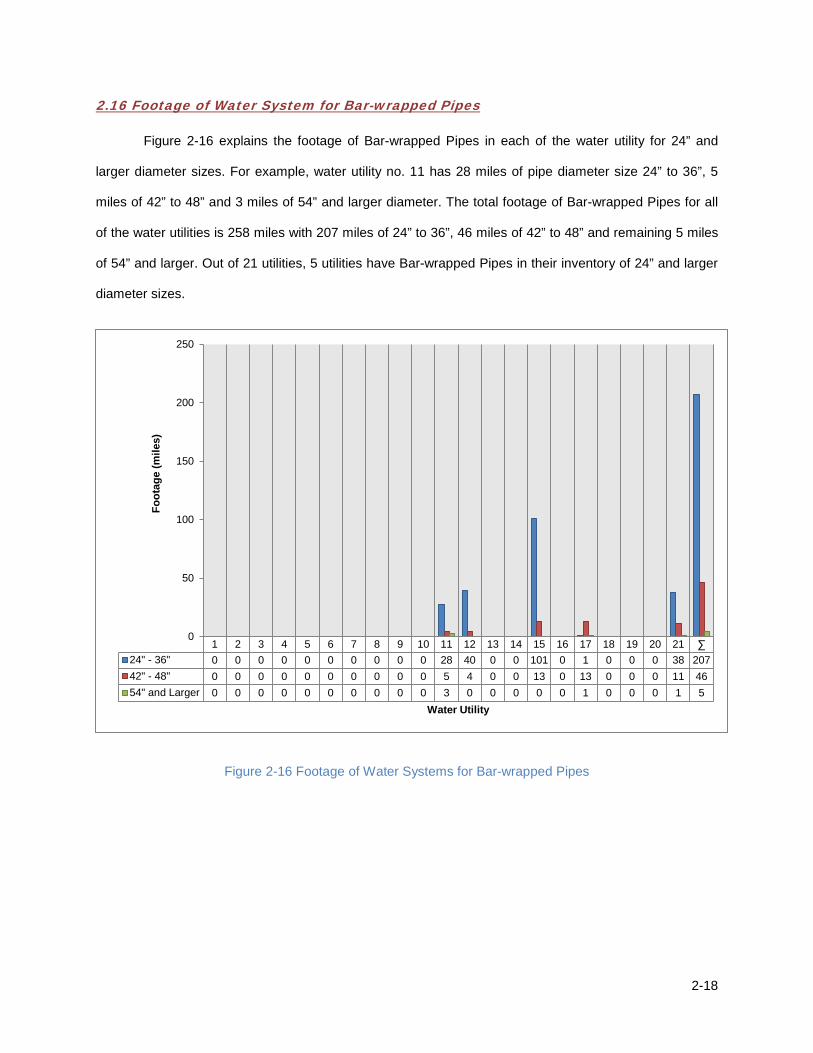
2.16 Footage of Water System for Bar-wrapped Pipes
Figure 2-16 explains the footage of Bar-wrapped Pipes in each of the water utility for 24” and
larger diameter sizes. For example, water utility no. 11 has 28 miles of pipe diameter size 24” to 36”, 5
miles of 42” to 48” and 3 miles of 54” and larger diameter. The total footage of Bar-wrapped Pipes for all
of the water utilities is 258 miles with 207 miles of 24” to 36”, 46 miles of 42” to 48” and remaining 5 miles
of 54” and larger. Out of 21 utilities, 5 utilities have Bar-wrapped Pipes in their inventory of 24” and larger
diameter sizes.
Figure 2-16 Footage of Water Systems for Bar-wrapped Pipes
1 2 3 4 5 6 7 8 9 10 11 12 13 14 15 16 17 18 19 20 21 ∑ 24" - 36" 0 0 0 0 0 0 0 0 0 0 28 40 0 0 101 0 1 0 0 0 38 20742" - 48" 0 0 0 0 0 0 0 0 0 0 5 4 0 0 13 0 13 0 0 0 11 4654" and Larger 0 0 0 0 0 0 0 0 0 0 3 0 0 0 0 0 1 0 0 0 1 5
0
50
100
150
200
250
Foot
age
(mile
s)
Water Utility
2-19
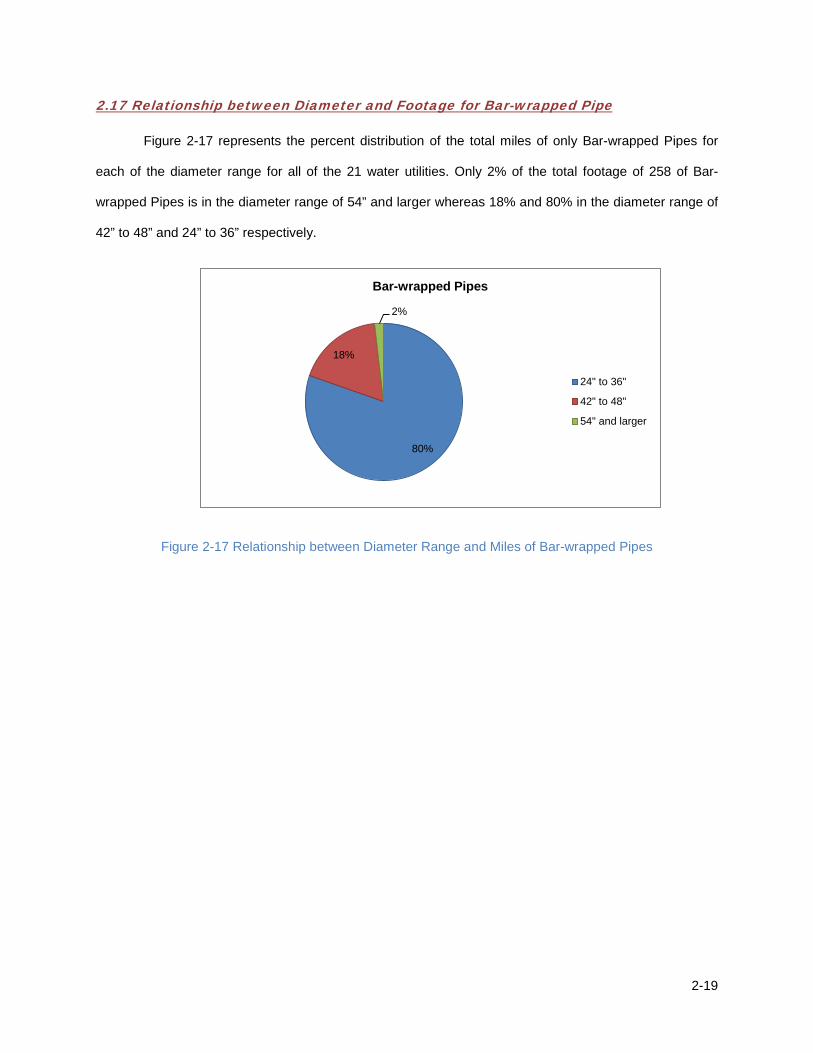
2.17 Relationship between Diameter and Footage for Bar-wrapped Pipe
Figure 2-17 represents the percent distribution of the total miles of only Bar-wrapped Pipes for
each of the diameter range for all of the 21 water utilities. Only 2% of the total footage of 258 of Bar-
wrapped Pipes is in the diameter range of 54” and larger whereas 18% and 80% in the diameter range of
42” to 48” and 24” to 36” respectively.
Figure 2-17 Relationship between Diameter Range and Miles of Bar-wrapped Pipes
80%
18%
2%
Bar-wrapped Pipes
24" to 36"
42" to 48"
54" and larger
2-20
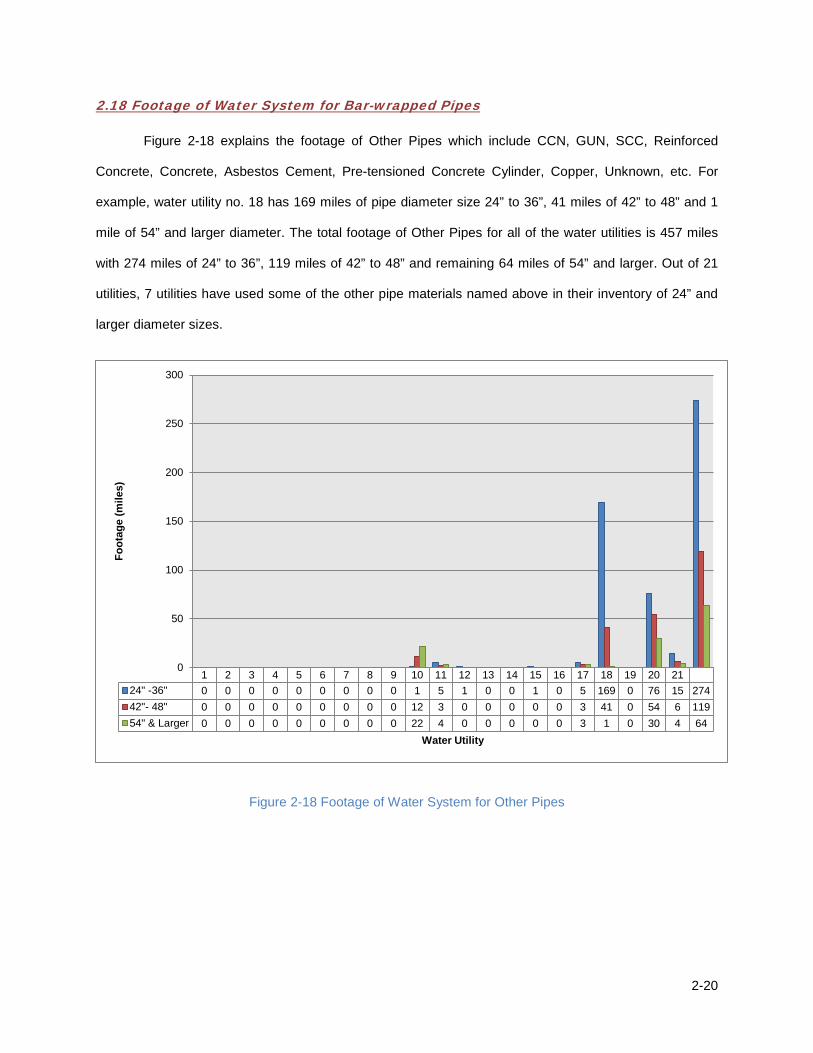
2.18 Footage of Water System for Bar-wrapped Pipes
Figure 2-18 explains the footage of Other Pipes which include CCN, GUN, SCC, Reinforced
Concrete, Concrete, Asbestos Cement, Pre-tensioned Concrete Cylinder, Copper, Unknown, etc. For
example, water utility no. 18 has 169 miles of pipe diameter size 24” to 36”, 41 miles of 42” to 48” and 1
mile of 54” and larger diameter. The total footage of Other Pipes for all of the water utilities is 457 miles
with 274 miles of 24” to 36”, 119 miles of 42” to 48” and remaining 64 miles of 54” and larger. Out of 21
utilities, 7 utilities have used some of the other pipe materials named above in their inventory of 24” and
larger diameter sizes.
Figure 2-18 Footage of Water System for Other Pipes
1 2 3 4 5 6 7 8 9 10 11 12 13 14 15 16 17 18 19 20 2124" -36" 0 0 0 0 0 0 0 0 0 1 5 1 0 0 1 0 5 169 0 76 15 27442"- 48" 0 0 0 0 0 0 0 0 0 12 3 0 0 0 0 0 3 41 0 54 6 11954" & Larger 0 0 0 0 0 0 0 0 0 22 4 0 0 0 0 0 3 1 0 30 4 64
0
50
100
150
200
250
300
Foot
age
(mile
s)
Water Utility
2-21
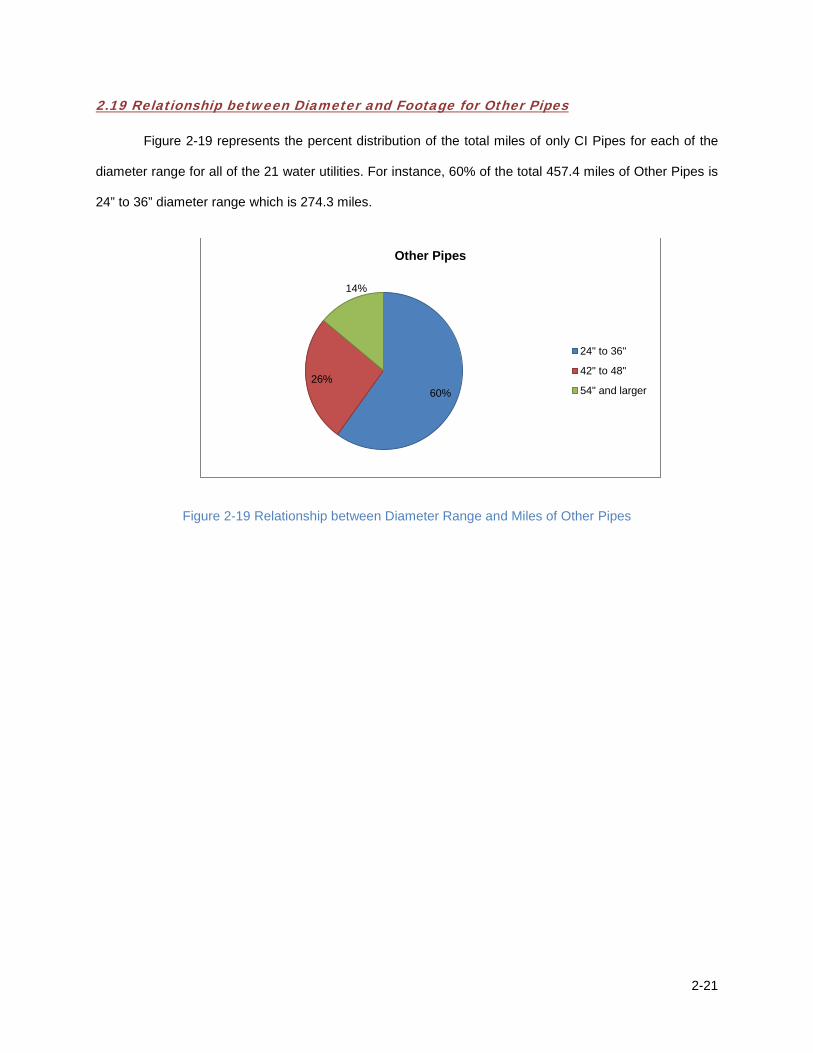
2.19 Relationship between Diameter and Footage for Other Pipes
Figure 2-19 represents the percent distribution of the total miles of only CI Pipes for each of the
diameter range for all of the 21 water utilities. For instance, 60% of the total 457.4 miles of Other Pipes is
24” to 36” diameter range which is 274.3 miles.
Figure 2-19 Relationship between Diameter Range and Miles of Other Pipes
60% 26%
14%
Other Pipes
24" to 36"
42" to 48"
54" and larger
2-22
2.20 Summary Table
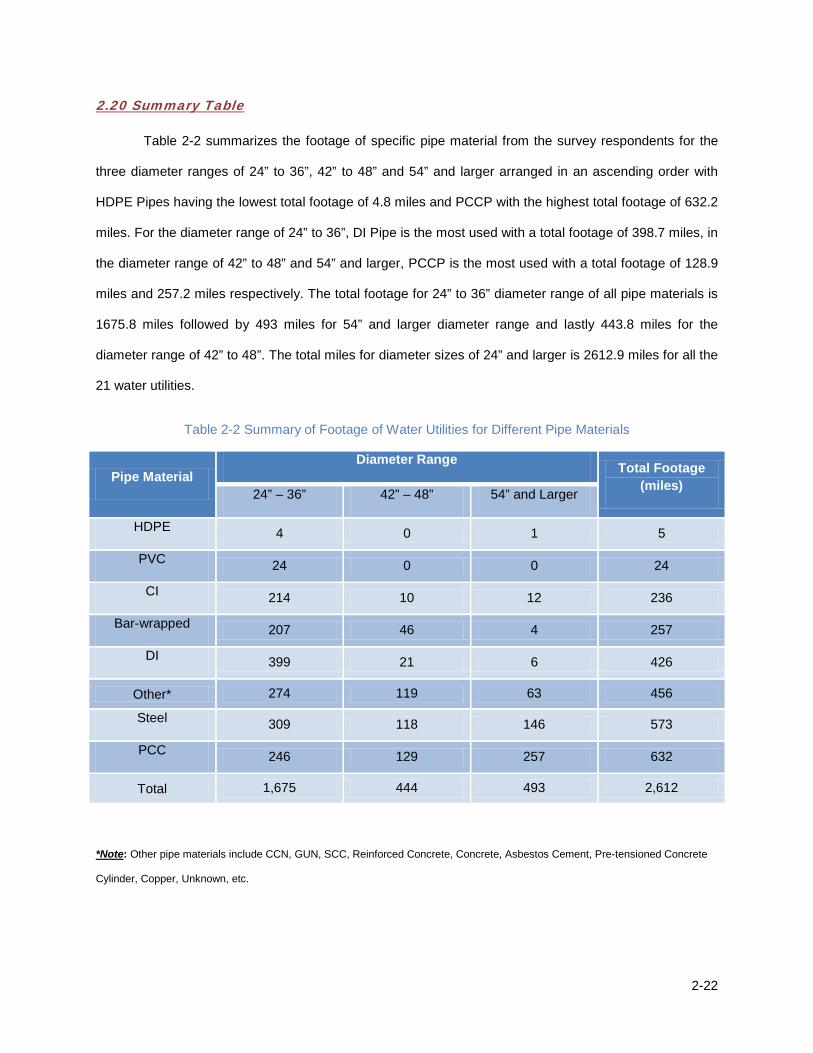
Table 2-2 summarizes the footage of specific pipe material from the survey respondents for the
three diameter ranges of 24” to 36”, 42” to 48” and 54” and larger arranged in an ascending order with
HDPE Pipes having the lowest total footage of 4.8 miles and PCCP with the highest total footage of 632.2
miles. For the diameter range of 24” to 36”, DI Pipe is the most used with a total footage of 398.7 miles, in
the diameter range of 42” to 48” and 54” and larger, PCCP is the most used with a total footage of 128.9
miles and 257.2 miles respectively. The total footage for 24” to 36” diameter range of all pipe materials is
1675.8 miles followed by 493 miles for 54” and larger diameter range and lastly 443.8 miles for the
diameter range of 42” to 48”. The total miles for diameter sizes of 24” and larger is 2612.9 miles for all the
21 water utilities.
Table 2-2 Summary of Footage of Water Utilities for Different Pipe Materials
Pipe Material Diameter Range Total Footage
(miles) 24” – 36” 42” – 48” 54” and Larger
HDPE 4 0 1 5
PVC 24 0 0 24
CI 214 10 12 236
Bar-wrapped 207 46 4 257
DI 399 21 6 426
Other* 274 119 63 456
Steel 309 118 146 573
PCC 246 129 257 632
Total 1,675 444 493 2,612
*Note: Other pipe materials include CCN, GUN, SCC, Reinforced Concrete, Concrete, Asbestos Cement, Pre-tensioned Concrete
Cylinder, Copper, Unknown, etc.
3-1
CHAPTER 3. RELATIONSHIP BETWEEN INVENTORY AND AGE OF EACH PIPE
MATERIAL
This section explains the relationship between inventory and age of each pipe material for 24”
and larger diameter sizes. The age of the pipe materials is considered from the date of installation till the
date of survey response. It is divided in four categories as follows:
1. Less than 25 years old
2. Between 25 to 50 years old
3. Between 50 to 75 years old
4. More than 75 years old
3-2
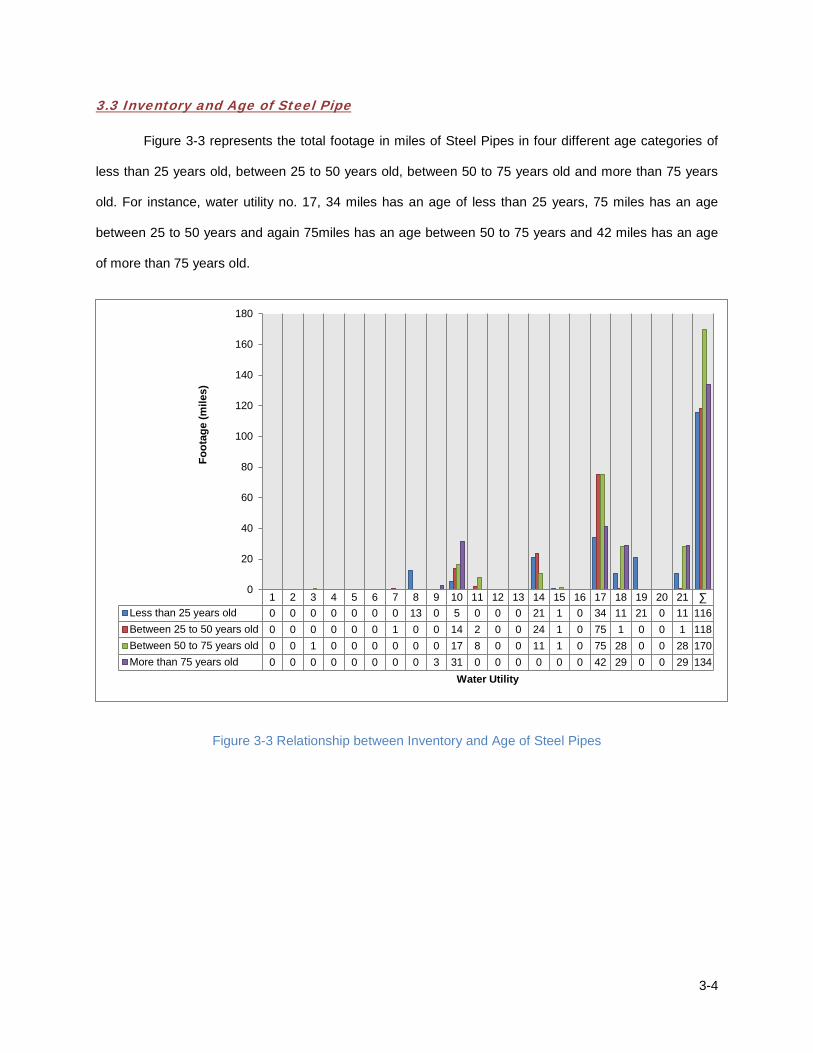
3.1 Inventory and Age of PCCP
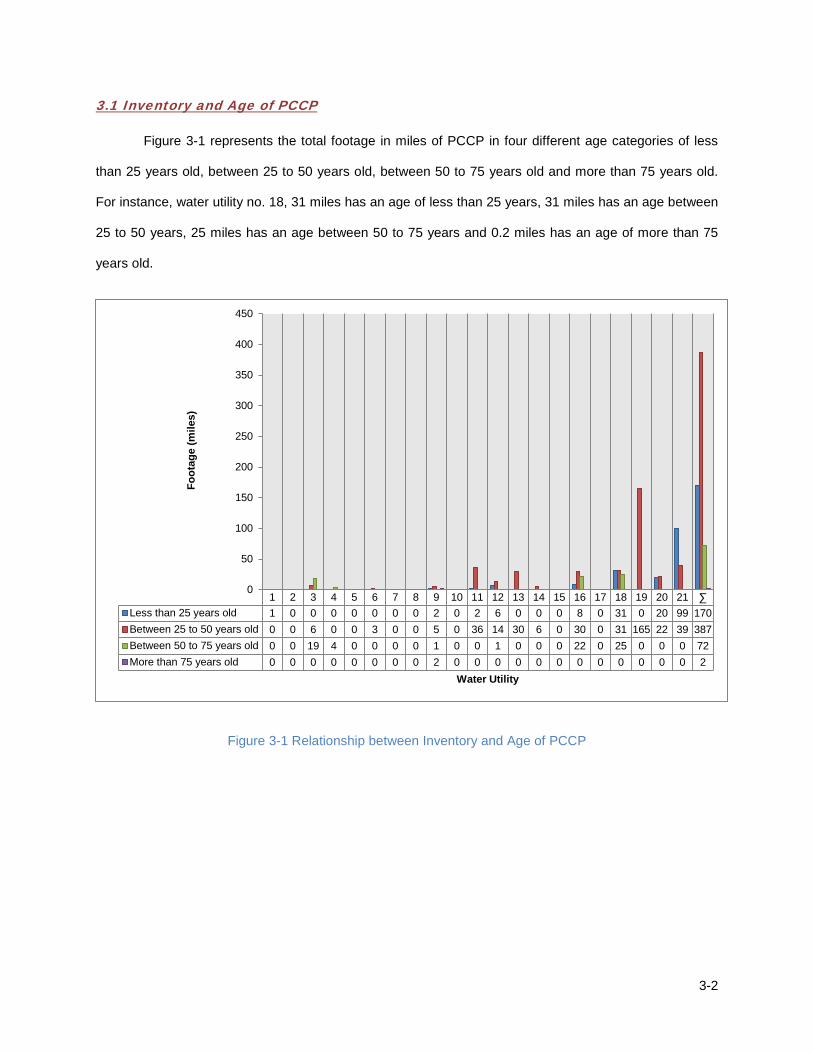
Figure 3-1 represents the total footage in miles of PCCP in four different age categories of less
than 25 years old, between 25 to 50 years old, between 50 to 75 years old and more than 75 years old.
For instance, water utility no. 18, 31 miles has an age of less than 25 years, 31 miles has an age between
25 to 50 years, 25 miles has an age between 50 to 75 years and 0.2 miles has an age of more than 75
years old.
Figure 3-1 Relationship between Inventory and Age of PCCP
1 2 3 4 5 6 7 8 9 10 11 12 13 14 15 16 17 18 19 20 21 ∑ Less than 25 years old 1 0 0 0 0 0 0 0 2 0 2 6 0 0 0 8 0 31 0 20 99 170Between 25 to 50 years old 0 0 6 0 0 3 0 0 5 0 36 14 30 6 0 30 0 31 165 22 39 387Between 50 to 75 years old 0 0 19 4 0 0 0 0 1 0 0 1 0 0 0 22 0 25 0 0 0 72More than 75 years old 0 0 0 0 0 0 0 0 2 0 0 0 0 0 0 0 0 0 0 0 0 2
0
50
100
150
200
250
300
350
400
450
Foot
age
(mile
s)
Water Utility
3-3
3.2 Relationship between Diameter Range and Age of PCCP
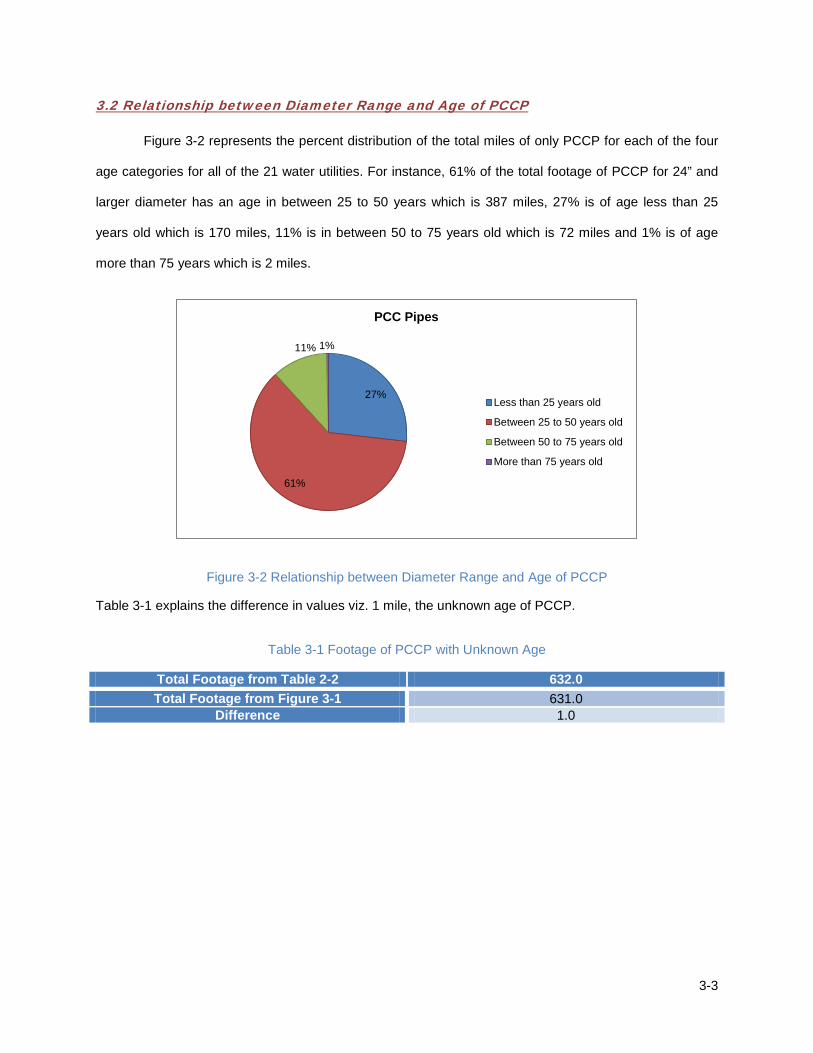
Figure 3-2 represents the percent distribution of the total miles of only PCCP for each of the four
age categories for all of the 21 water utilities. For instance, 61% of the total footage of PCCP for 24” and
larger diameter has an age in between 25 to 50 years which is 387 miles, 27% is of age less than 25
years old which is 170 miles, 11% is in between 50 to 75 years old which is 72 miles and 1% is of age
more than 75 years which is 2 miles.
Figure 3-2 Relationship between Diameter Range and Age of PCCP
Table 3-1 explains the difference in values viz. 1 mile, the unknown age of PCCP.
Table 3-1 Footage of PCCP with Unknown Age
Total Footage from Table 2-2 632.0 Total Footage from Figure 3-1 631.0
Difference 1.0
27%
61%
11% 1%
PCC Pipes
Less than 25 years old
Between 25 to 50 years old
Between 50 to 75 years old
More than 75 years old
3-4
3.3 Inventory and Age of Steel Pipe
Figure 3-3 represents the total footage in miles of Steel Pipes in four different age categories of
less than 25 years old, between 25 to 50 years old, between 50 to 75 years old and more than 75 years
old. For instance, water utility no. 17, 34 miles has an age of less than 25 years, 75 miles has an age
between 25 to 50 years and again 75miles has an age between 50 to 75 years and 42 miles has an age
of more than 75 years old.
Figure 3-3 Relationship between Inventory and Age of Steel Pipes
1 2 3 4 5 6 7 8 9 10 11 12 13 14 15 16 17 18 19 20 21 ∑ Less than 25 years old 0 0 0 0 0 0 0 13 0 5 0 0 0 21 1 0 34 11 21 0 11 116Between 25 to 50 years old 0 0 0 0 0 0 1 0 0 14 2 0 0 24 1 0 75 1 0 0 1 118Between 50 to 75 years old 0 0 1 0 0 0 0 0 0 17 8 0 0 11 1 0 75 28 0 0 28 170More than 75 years old 0 0 0 0 0 0 0 0 3 31 0 0 0 0 0 0 42 29 0 0 29 134
0
20
40
60
80
100
120
140
160
180
Foot
age
(mile
s)
Water Utility
3-5
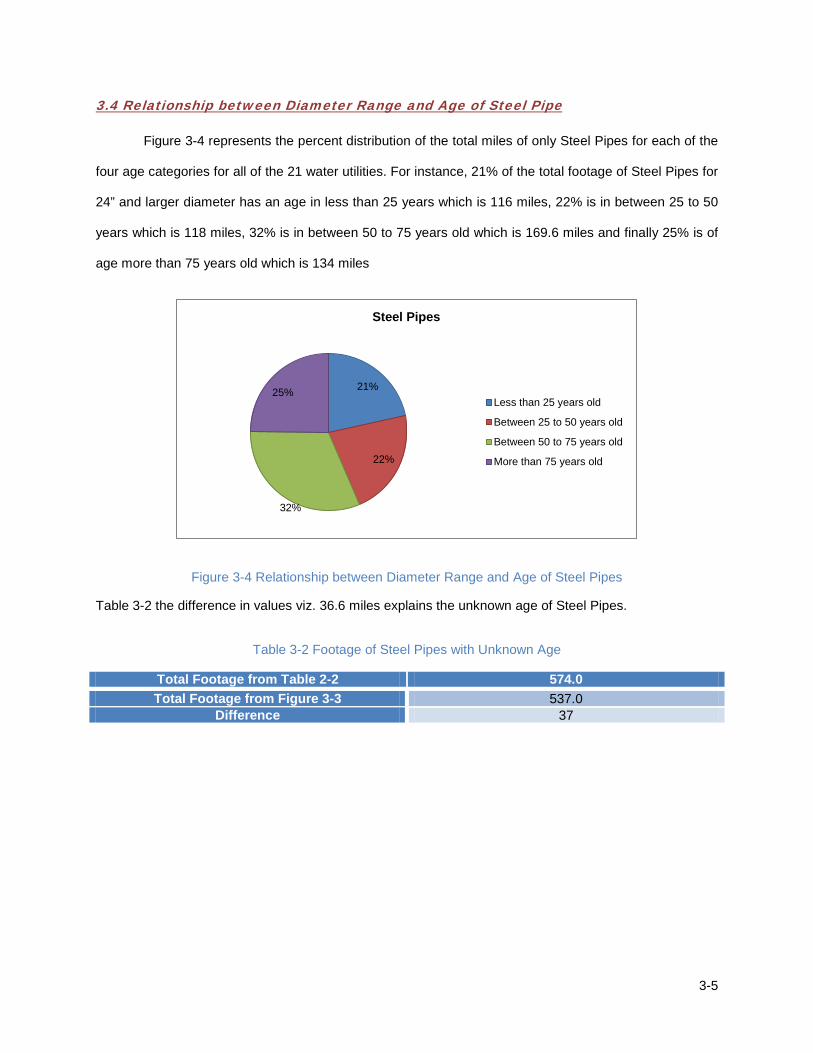
3.4 Relationship between Diameter Range and Age of Steel Pipe
Figure 3-4 represents the percent distribution of the total miles of only Steel Pipes for each of the
four age categories for all of the 21 water utilities. For instance, 21% of the total footage of Steel Pipes for
24” and larger diameter has an age in less than 25 years which is 116 miles, 22% is in between 25 to 50
years which is 118 miles, 32% is in between 50 to 75 years old which is 169.6 miles and finally 25% is of
age more than 75 years old which is 134 miles
Figure 3-4 Relationship between Diameter Range and Age of Steel Pipes
Table 3-2 the difference in values viz. 36.6 miles explains the unknown age of Steel Pipes.
Table 3-2 Footage of Steel Pipes with Unknown Age
Total Footage from Table 2-2 574.0 Total Footage from Figure 3-3 537.0
Difference 37
21%
22%
32%
25%
Steel Pipes
Less than 25 years old
Between 25 to 50 years old
Between 50 to 75 years old
More than 75 years old
3-6
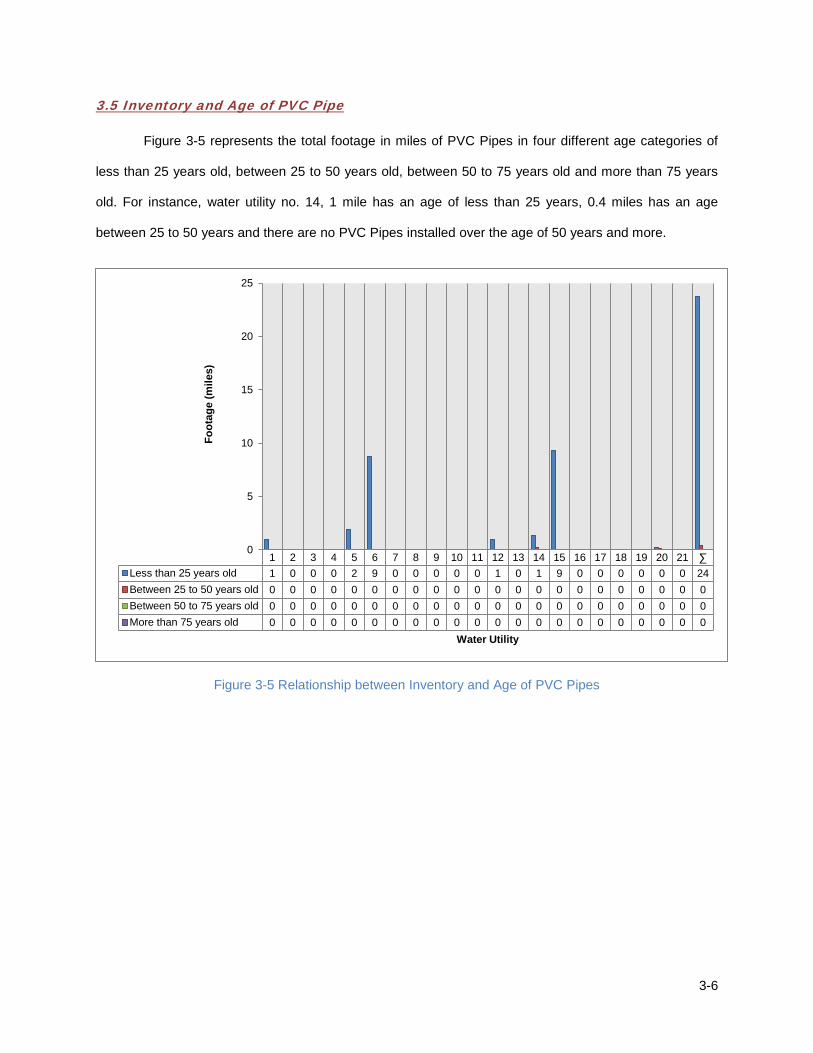
3.5 Inventory and Age of PVC Pipe
Figure 3-5 represents the total footage in miles of PVC Pipes in four different age categories of
less than 25 years old, between 25 to 50 years old, between 50 to 75 years old and more than 75 years
old. For instance, water utility no. 14, 1 mile has an age of less than 25 years, 0.4 miles has an age
between 25 to 50 years and there are no PVC Pipes installed over the age of 50 years and more.
Figure 3-5 Relationship between Inventory and Age of PVC Pipes
1 2 3 4 5 6 7 8 9 10 11 12 13 14 15 16 17 18 19 20 21 ∑ Less than 25 years old 1 0 0 0 2 9 0 0 0 0 0 1 0 1 9 0 0 0 0 0 0 24Between 25 to 50 years old 0 0 0 0 0 0 0 0 0 0 0 0 0 0 0 0 0 0 0 0 0 0Between 50 to 75 years old 0 0 0 0 0 0 0 0 0 0 0 0 0 0 0 0 0 0 0 0 0 0More than 75 years old 0 0 0 0 0 0 0 0 0 0 0 0 0 0 0 0 0 0 0 0 0 0
0
5
10
15
20
25
Foot
age
(mile
s)
Water Utility
3-7
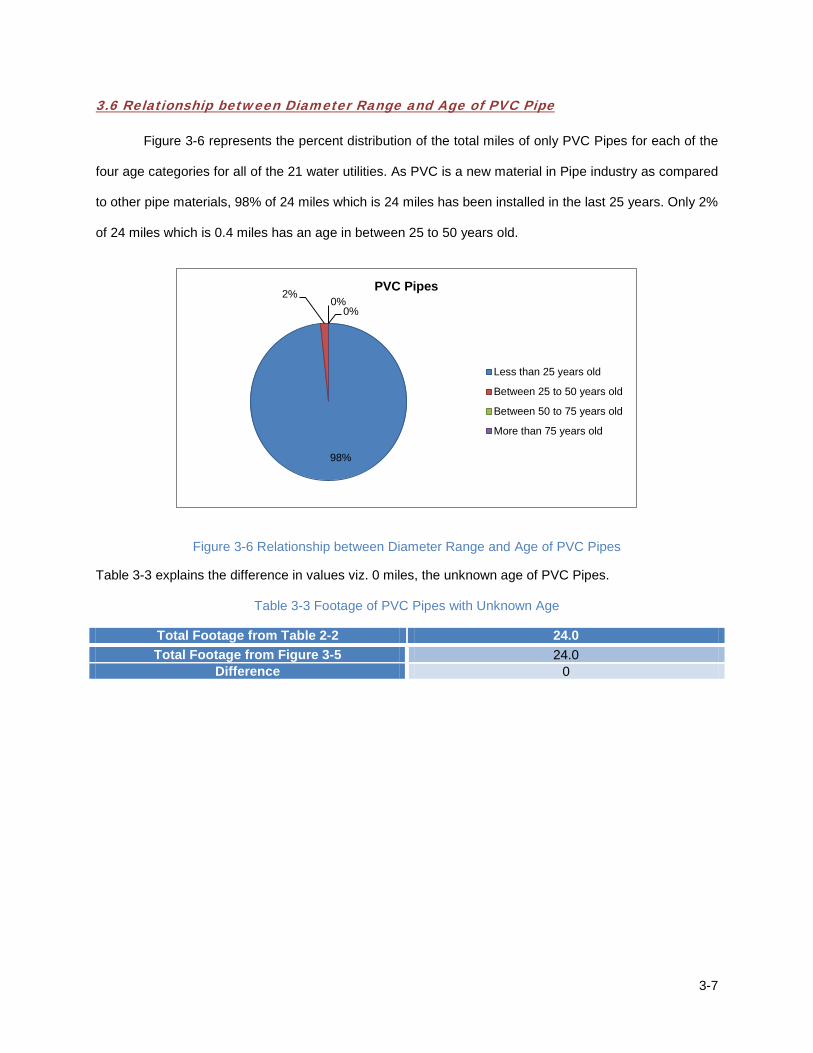
3.6 Relationship between Diameter Range and Age of PVC Pipe
Figure 3-6 represents the percent distribution of the total miles of only PVC Pipes for each of the
four age categories for all of the 21 water utilities. As PVC is a new material in Pipe industry as compared
to other pipe materials, 98% of 24 miles which is 24 miles has been installed in the last 25 years. Only 2%
of 24 miles which is 0.4 miles has an age in between 25 to 50 years old.
Figure 3-6 Relationship between Diameter Range and Age of PVC Pipes
Table 3-3 explains the difference in values viz. 0 miles, the unknown age of PVC Pipes.
Table 3-3 Footage of PVC Pipes with Unknown Age
Total Footage from Table 2-2 24.0 Total Footage from Figure 3-5 24.0
Difference 0
98%
2% 0%
0% PVC Pipes
Less than 25 years old
Between 25 to 50 years old
Between 50 to 75 years old
More than 75 years old
3-8
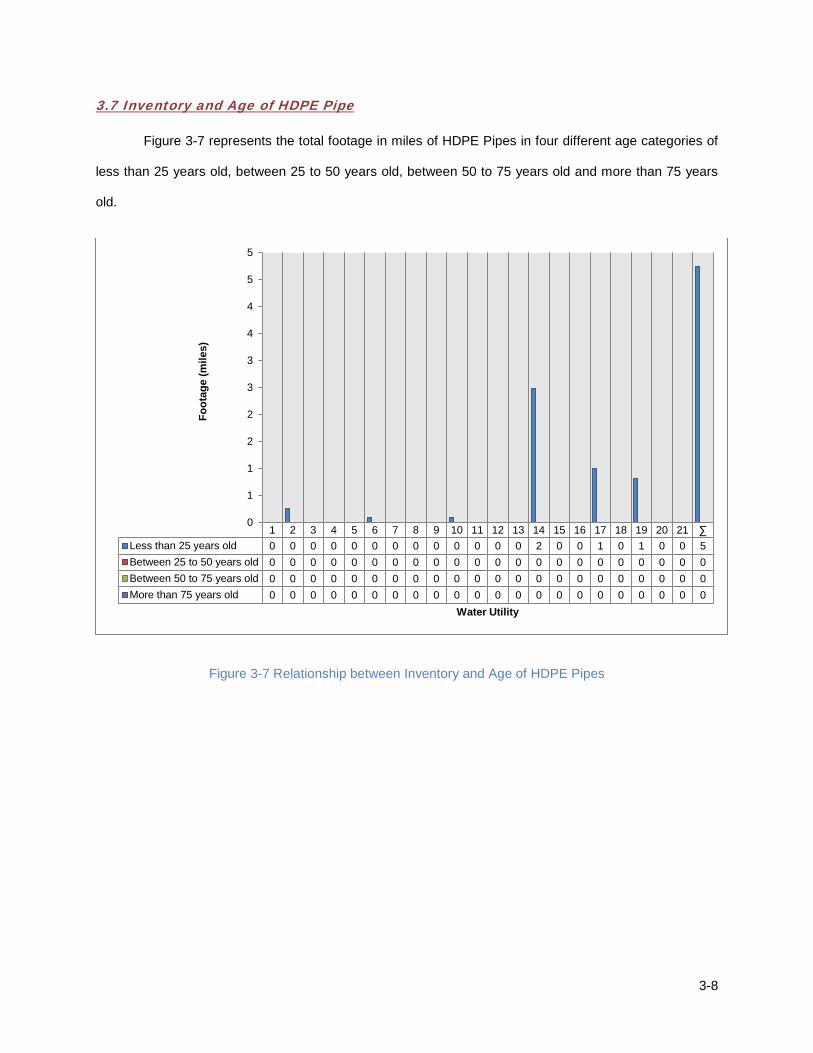
3.7 Inventory and Age of HDPE Pipe
Figure 3-7 represents the total footage in miles of HDPE Pipes in four different age categories of
less than 25 years old, between 25 to 50 years old, between 50 to 75 years old and more than 75 years
old.
Figure 3-7 Relationship between Inventory and Age of HDPE Pipes
1 2 3 4 5 6 7 8 9 10 11 12 13 14 15 16 17 18 19 20 21 ∑ Less than 25 years old 0 0 0 0 0 0 0 0 0 0 0 0 0 2 0 0 1 0 1 0 0 5Between 25 to 50 years old 0 0 0 0 0 0 0 0 0 0 0 0 0 0 0 0 0 0 0 0 0 0Between 50 to 75 years old 0 0 0 0 0 0 0 0 0 0 0 0 0 0 0 0 0 0 0 0 0 0More than 75 years old 0 0 0 0 0 0 0 0 0 0 0 0 0 0 0 0 0 0 0 0 0 0
0
1
1
2
2
3
3
4
4
5
5
Foot
age
(mile
s)
Water Utility
3-9
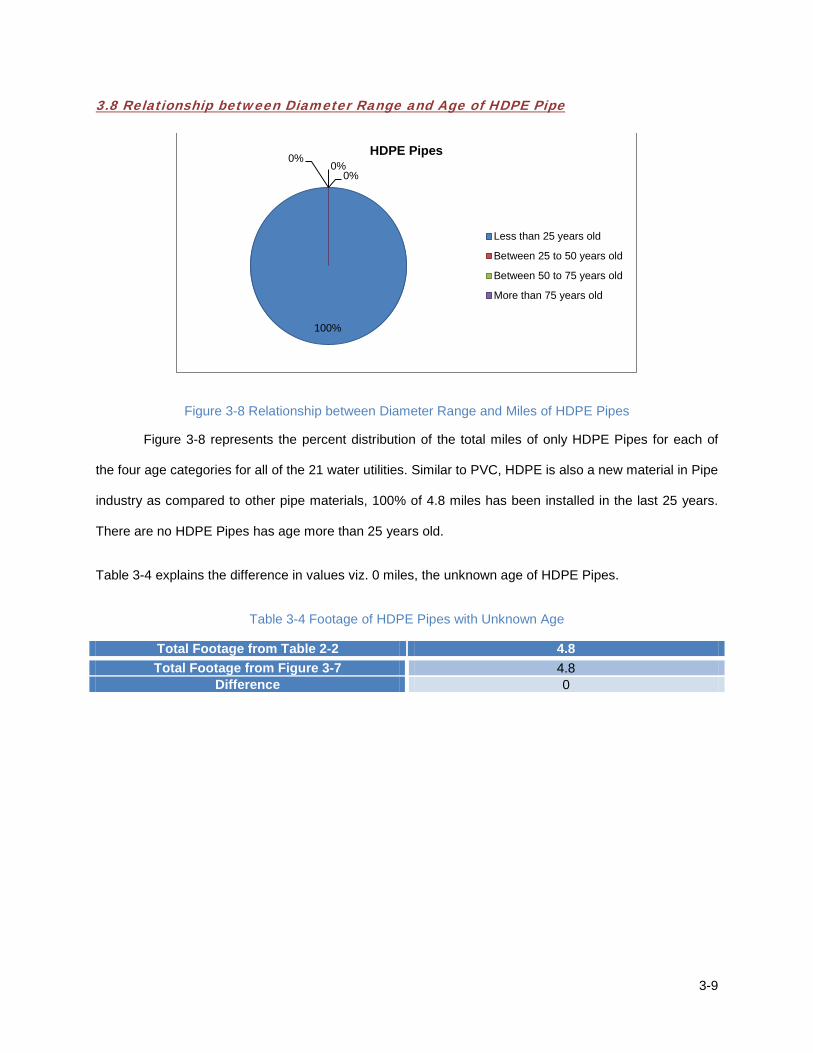
3.8 Relationship between Diameter Range and Age of HDPE Pipe
Figure 3-8 Relationship between Diameter Range and Miles of HDPE Pipes
Figure 3-8 represents the percent distribution of the total miles of only HDPE Pipes for each of
the four age categories for all of the 21 water utilities. Similar to PVC, HDPE is also a new material in Pipe
industry as compared to other pipe materials, 100% of 4.8 miles has been installed in the last 25 years.
There are no HDPE Pipes has age more than 25 years old.
Table 3-4 explains the difference in values viz. 0 miles, the unknown age of HDPE Pipes.
Table 3-4 Footage of HDPE Pipes with Unknown Age
Total Footage from Table 2-2 4.8 Total Footage from Figure 3-7 4.8
Difference 0
100%
0% 0%
0% HDPE Pipes
Less than 25 years old
Between 25 to 50 years old
Between 50 to 75 years old
More than 75 years old
3-10
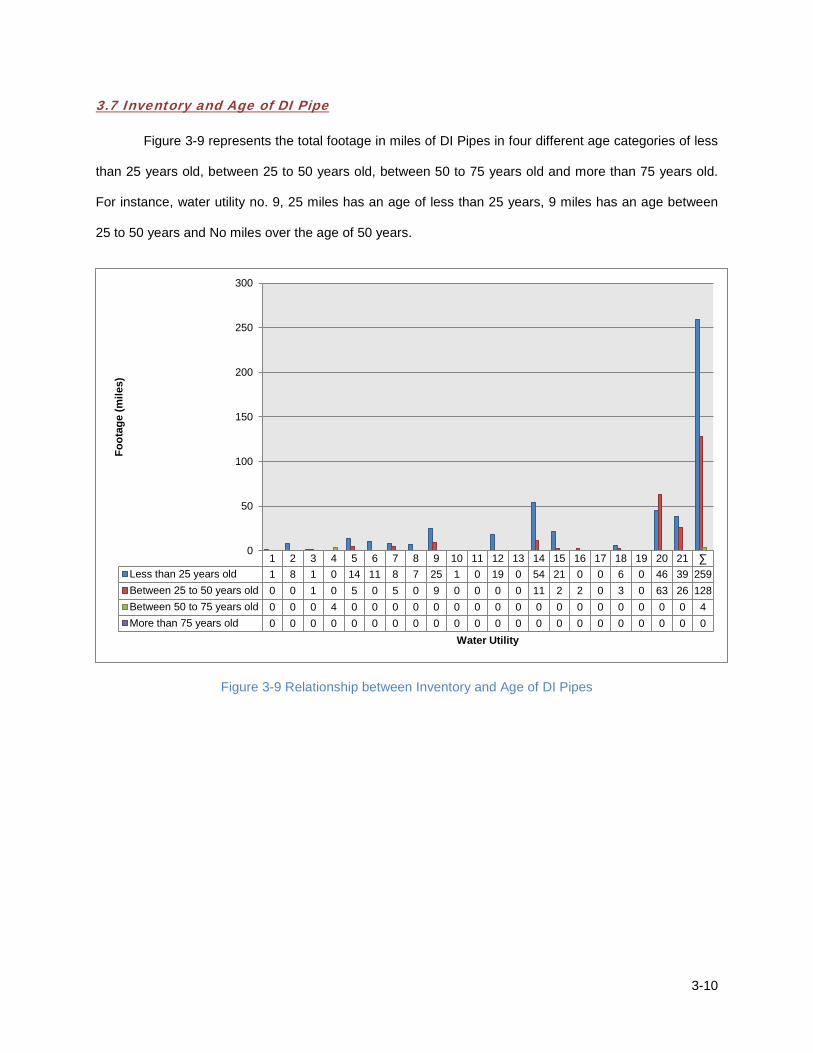
3.7 Inventory and Age of DI Pipe
Figure 3-9 represents the total footage in miles of DI Pipes in four different age categories of less
than 25 years old, between 25 to 50 years old, between 50 to 75 years old and more than 75 years old.
For instance, water utility no. 9, 25 miles has an age of less than 25 years, 9 miles has an age between
25 to 50 years and No miles over the age of 50 years.
Figure 3-9 Relationship between Inventory and Age of DI Pipes
1 2 3 4 5 6 7 8 9 10 11 12 13 14 15 16 17 18 19 20 21 ∑ Less than 25 years old 1 8 1 0 14 11 8 7 25 1 0 19 0 54 21 0 0 6 0 46 39 259Between 25 to 50 years old 0 0 1 0 5 0 5 0 9 0 0 0 0 11 2 2 0 3 0 63 26 128Between 50 to 75 years old 0 0 0 4 0 0 0 0 0 0 0 0 0 0 0 0 0 0 0 0 0 4More than 75 years old 0 0 0 0 0 0 0 0 0 0 0 0 0 0 0 0 0 0 0 0 0 0
0
50
100
150
200
250
300
Foot
age
(mile
s)
Water Utility
3-11
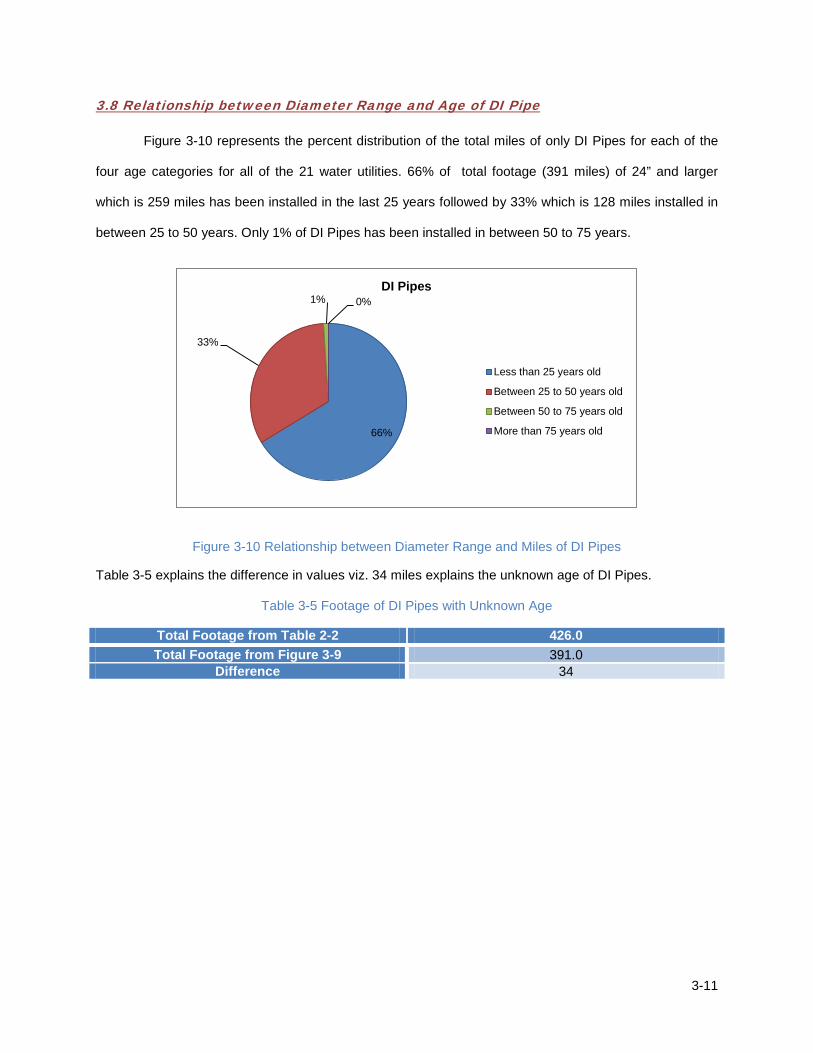
3.8 Relationship between Diameter Range and Age of DI Pipe
Figure 3-10 represents the percent distribution of the total miles of only DI Pipes for each of the
four age categories for all of the 21 water utilities. 66% of total footage (391 miles) of 24” and larger
which is 259 miles has been installed in the last 25 years followed by 33% which is 128 miles installed in
between 25 to 50 years. Only 1% of DI Pipes has been installed in between 50 to 75 years.
Figure 3-10 Relationship between Diameter Range and Miles of DI Pipes
Table 3-5 explains the difference in values viz. 34 miles explains the unknown age of DI Pipes.
Table 3-5 Footage of DI Pipes with Unknown Age
Total Footage from Table 2-2 426.0 Total Footage from Figure 3-9 391.0
Difference 34
66%
33%
1% 0% DI Pipes
Less than 25 years old
Between 25 to 50 years old
Between 50 to 75 years old
More than 75 years old
3-12
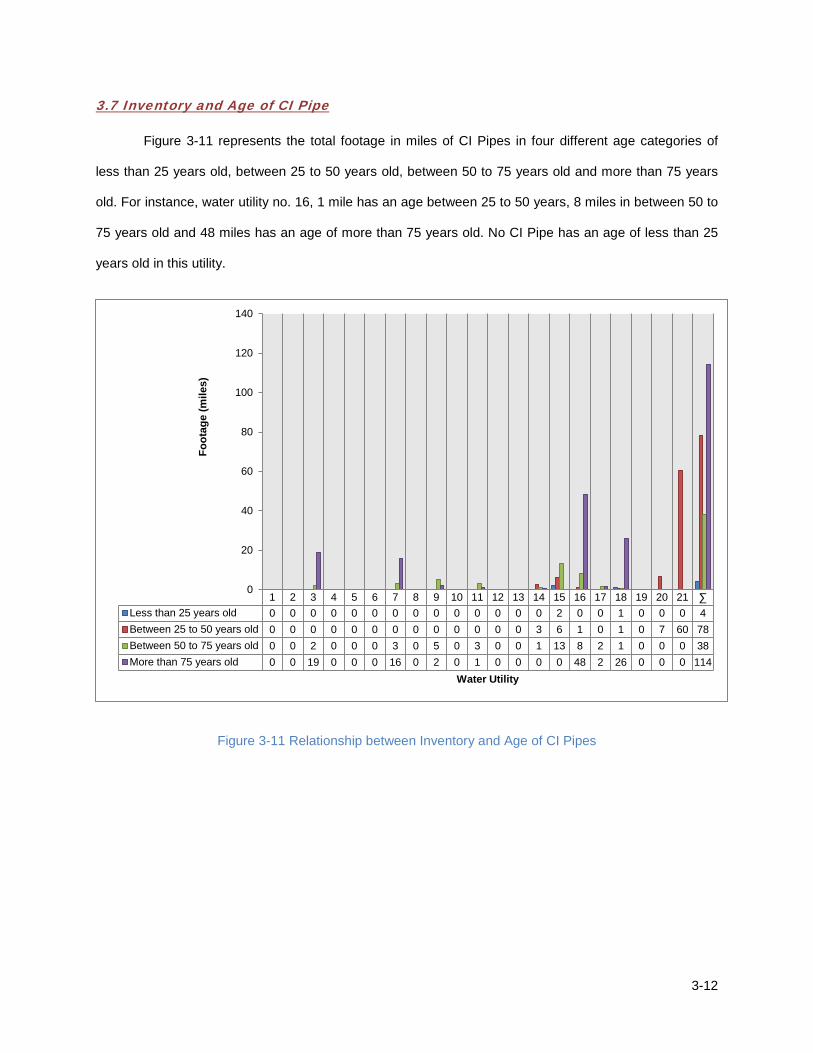
3.7 Inventory and Age of CI Pipe
Figure 3-11 represents the total footage in miles of CI Pipes in four different age categories of
less than 25 years old, between 25 to 50 years old, between 50 to 75 years old and more than 75 years
old. For instance, water utility no. 16, 1 mile has an age between 25 to 50 years, 8 miles in between 50 to
75 years old and 48 miles has an age of more than 75 years old. No CI Pipe has an age of less than 25
years old in this utility.
Figure 3-11 Relationship between Inventory and Age of CI Pipes
1 2 3 4 5 6 7 8 9 10 11 12 13 14 15 16 17 18 19 20 21 ∑ Less than 25 years old 0 0 0 0 0 0 0 0 0 0 0 0 0 0 2 0 0 1 0 0 0 4Between 25 to 50 years old 0 0 0 0 0 0 0 0 0 0 0 0 0 3 6 1 0 1 0 7 60 78Between 50 to 75 years old 0 0 2 0 0 0 3 0 5 0 3 0 0 1 13 8 2 1 0 0 0 38More than 75 years old 0 0 19 0 0 0 16 0 2 0 1 0 0 0 0 48 2 26 0 0 0 114
0
20
40
60
80
100
120
140
Foot
age
(mile
s)
Water Utility
3-13
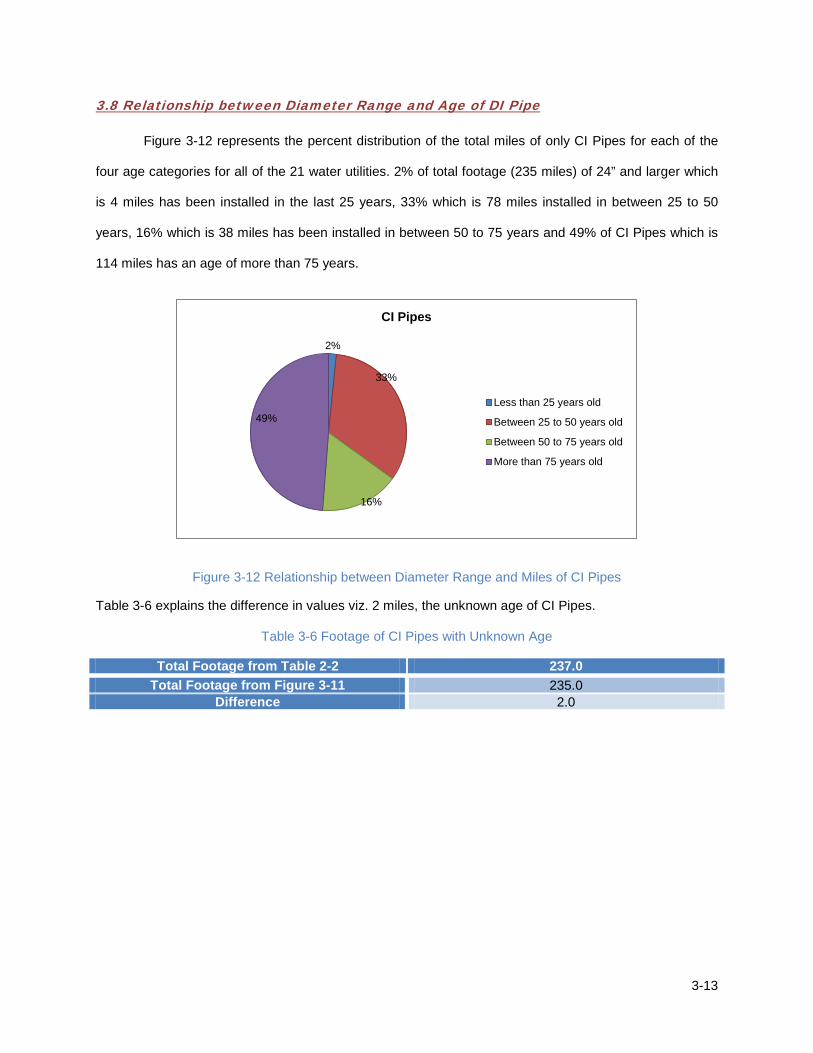
3.8 Relationship between Diameter Range and Age of DI Pipe
Figure 3-12 represents the percent distribution of the total miles of only CI Pipes for each of the
four age categories for all of the 21 water utilities. 2% of total footage (235 miles) of 24” and larger which
is 4 miles has been installed in the last 25 years, 33% which is 78 miles installed in between 25 to 50
years, 16% which is 38 miles has been installed in between 50 to 75 years and 49% of CI Pipes which is
114 miles has an age of more than 75 years.
Figure 3-12 Relationship between Diameter Range and Miles of CI Pipes
Table 3-6 explains the difference in values viz. 2 miles, the unknown age of CI Pipes.
Table 3-6 Footage of CI Pipes with Unknown Age
Total Footage from Table 2-2 237.0 Total Footage from Figure 3-11 235.0
Difference 2.0
2%
33%
16%
49%
CI Pipes
Less than 25 years old
Between 25 to 50 years old
Between 50 to 75 years old
More than 75 years old
3-14
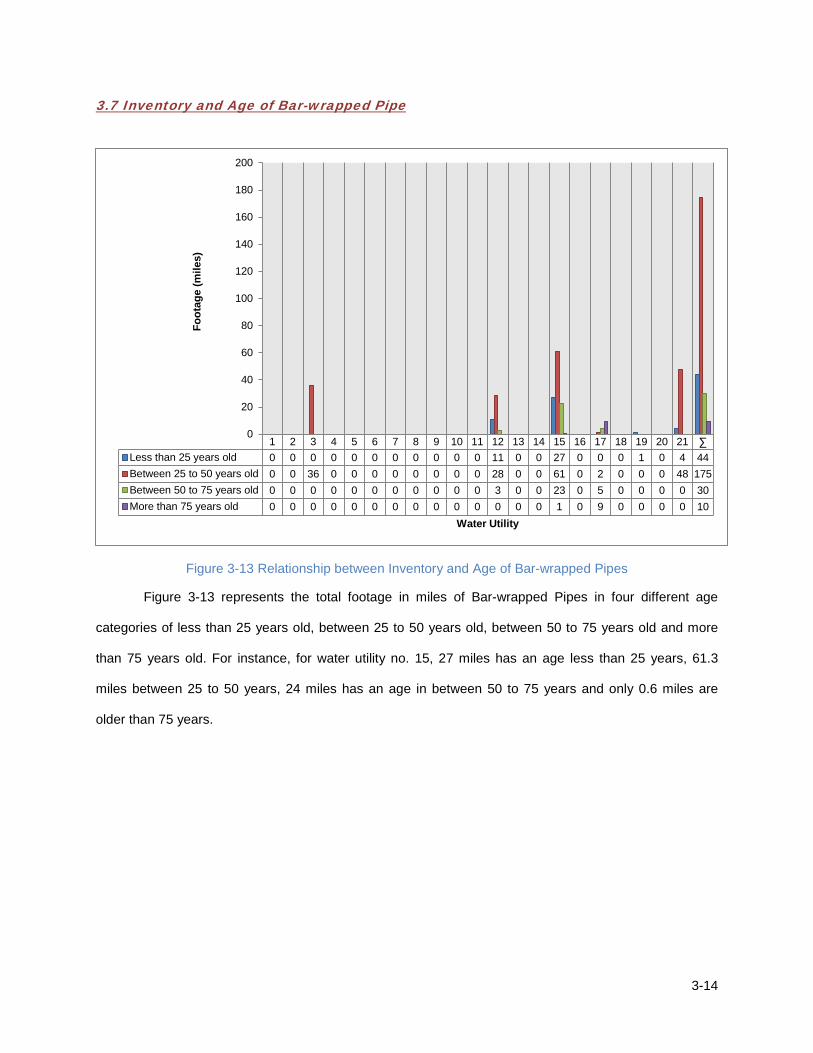
3.7 Inventory and Age of Bar-wrapped Pipe
Figure 3-13 Relationship between Inventory and Age of Bar-wrapped Pipes
Figure 3-13 represents the total footage in miles of Bar-wrapped Pipes in four different age
categories of less than 25 years old, between 25 to 50 years old, between 50 to 75 years old and more
than 75 years old. For instance, for water utility no. 15, 27 miles has an age less than 25 years, 61.3
miles between 25 to 50 years, 24 miles has an age in between 50 to 75 years and only 0.6 miles are
older than 75 years.
1 2 3 4 5 6 7 8 9 10 11 12 13 14 15 16 17 18 19 20 21 ∑ Less than 25 years old 0 0 0 0 0 0 0 0 0 0 0 11 0 0 27 0 0 0 1 0 4 44Between 25 to 50 years old 0 0 36 0 0 0 0 0 0 0 0 28 0 0 61 0 2 0 0 0 48 175Between 50 to 75 years old 0 0 0 0 0 0 0 0 0 0 0 3 0 0 23 0 5 0 0 0 0 30More than 75 years old 0 0 0 0 0 0 0 0 0 0 0 0 0 0 1 0 9 0 0 0 0 10
0
20
40
60
80
100
120
140
160
180
200
Foot
age
(mile
s)
Water Utility
3-15
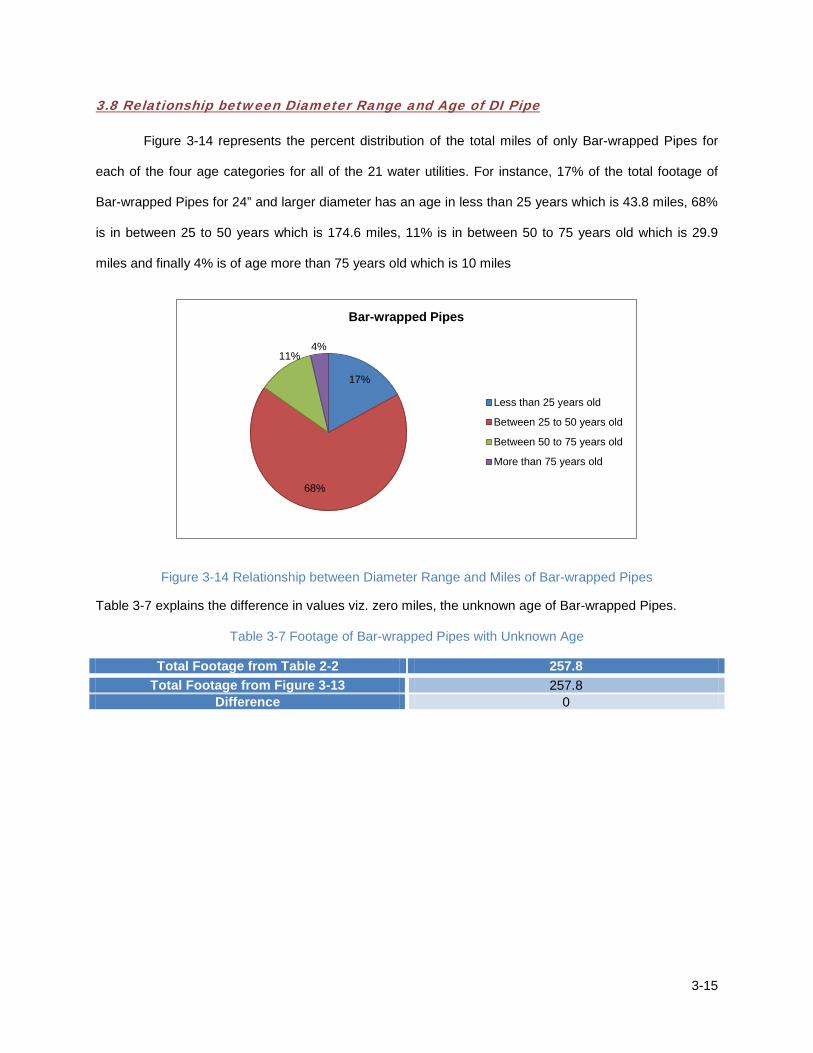
3.8 Relationship between Diameter Range and Age of DI Pipe
Figure 3-14 represents the percent distribution of the total miles of only Bar-wrapped Pipes for
each of the four age categories for all of the 21 water utilities. For instance, 17% of the total footage of
Bar-wrapped Pipes for 24” and larger diameter has an age in less than 25 years which is 43.8 miles, 68%
is in between 25 to 50 years which is 174.6 miles, 11% is in between 50 to 75 years old which is 29.9
miles and finally 4% is of age more than 75 years old which is 10 miles
Figure 3-14 Relationship between Diameter Range and Miles of Bar-wrapped Pipes
Table 3-7 explains the difference in values viz. zero miles, the unknown age of Bar-wrapped Pipes.
Table 3-7 Footage of Bar-wrapped Pipes with Unknown Age
Total Footage from Table 2-2 257.8 Total Footage from Figure 3-13 257.8
Difference 0
17%
68%
11% 4%
Bar-wrapped Pipes
Less than 25 years old
Between 25 to 50 years old
Between 50 to 75 years old
More than 75 years old

3-16
3.9 Inventory and Age of Other Pipe
Figure 3-15 represents the total footage in miles of Other Pipes in four different age categories of
less than 25 years old, between 25 to 50 years old, between 50 to 75 years old and more than 75 years
old. For instance, for water utility no. 18, 24 miles has an age less than 25 years, 24 miles between 25 to
50 years, 45 miles has an age in between 50 to 75 years and 95 miles are older than 75 years.
Figure 3-15 Relation between Inventory & Age of Other Pipes
1 2 3 4 5 6 7 8 9 10 11 12 13 14 15 16 17 18 19 20 21 ∑ Less than 25 years 0 0 0 0 0 0 0 0 0 0 0 0 0 0 0 0 0 24 0 13 2 40Between 25 to 50 years 0 0 0 0 0 0 0 0 0 0 9 0 0 0 1 0 5 24 0 59 3 102Between 50 to 75 Years 0 0 0 0 0 0 0 0 0 9 0 0 0 0 1 0 5 45 0 56 0 117More than 75 years 0 0 0 0 0 0 0 0 0 23 0 0 0 0 0 0 0 95 0 11 0 129
0
20
40
60
80
100
120
140
Foot
age
(mile
s)
Water Utility
3-17
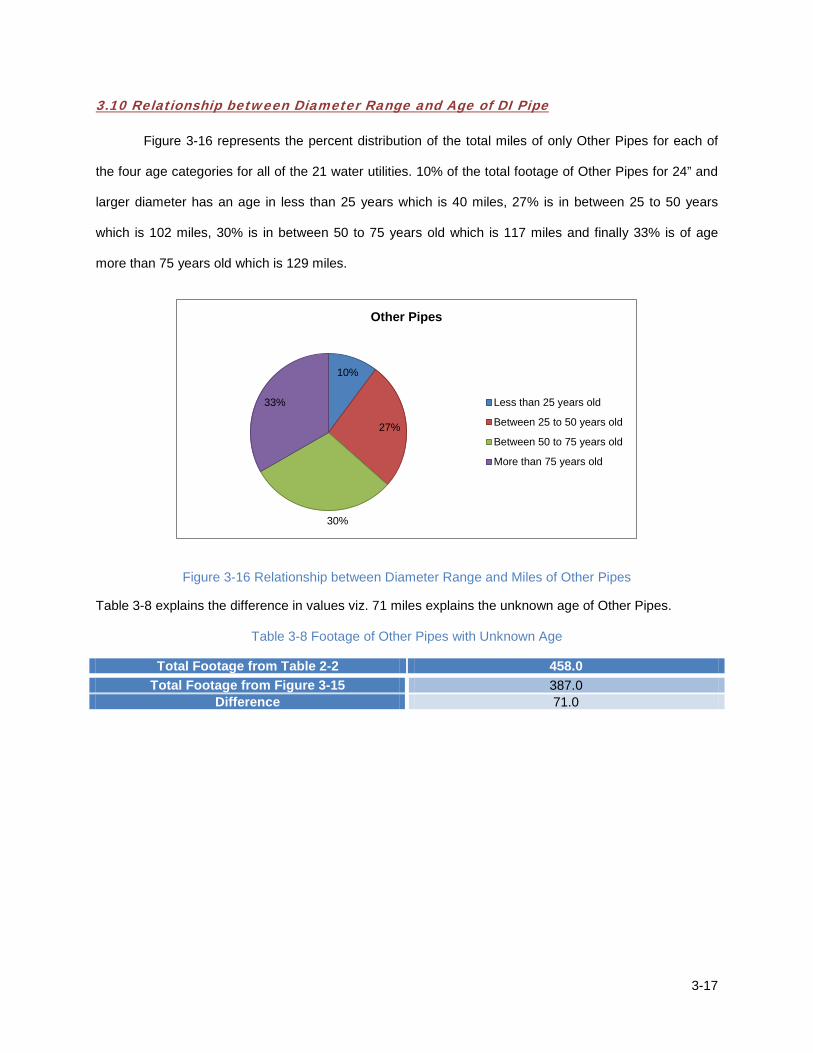
3.10 Relationship between Diameter Range and Age of DI Pipe
Figure 3-16 represents the percent distribution of the total miles of only Other Pipes for each of
the four age categories for all of the 21 water utilities. 10% of the total footage of Other Pipes for 24” and
larger diameter has an age in less than 25 years which is 40 miles, 27% is in between 25 to 50 years
which is 102 miles, 30% is in between 50 to 75 years old which is 117 miles and finally 33% is of age
more than 75 years old which is 129 miles.
Figure 3-16 Relationship between Diameter Range and Miles of Other Pipes
Table 3-8 explains the difference in values viz. 71 miles explains the unknown age of Other Pipes.
Table 3-8 Footage of Other Pipes with Unknown Age
Total Footage from Table 2-2 458.0 Total Footage from Figure 3-15 387.0
Difference 71.0
10%
27%
30%
33%
Other Pipes
Less than 25 years old
Between 25 to 50 years old
Between 50 to 75 years old
More than 75 years old
3-18
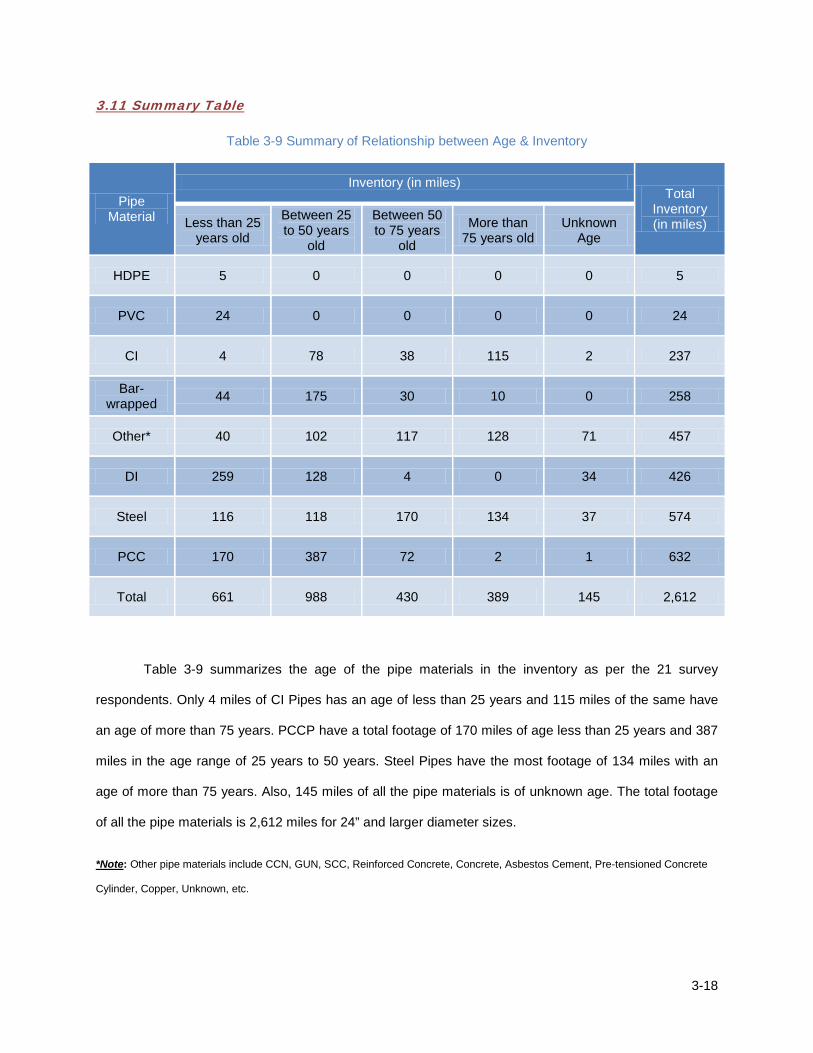
3.11 Summary Table
Table 3-9 Summary of Relationship between Age & Inventory
Pipe Material
Inventory (in miles) Total
Inventory (in miles) Less than 25
years old
Between 25 to 50 years
old
Between 50 to 75 years
old
More than 75 years old
Unknown Age
HDPE 5 0 0 0 0 5
PVC 24 0 0 0 0 24
CI 4 78 38 115 2 237
Bar-wrapped 44 175 30 10 0 258
Other* 40 102 117 128 71 457
DI 259 128 4 0 34 426
Steel 116 118 170 134 37 574
PCC 170 387 72 2 1 632
Total 661 988 430 389 145 2,612
Table 3-9 summarizes the age of the pipe materials in the inventory as per the 21 survey
respondents. Only 4 miles of CI Pipes has an age of less than 25 years and 115 miles of the same have
an age of more than 75 years. PCCP have a total footage of 170 miles of age less than 25 years and 387
miles in the age range of 25 years to 50 years. Steel Pipes have the most footage of 134 miles with an
age of more than 75 years. Also, 145 miles of all the pipe materials is of unknown age. The total footage
of all the pipe materials is 2,612 miles for 24” and larger diameter sizes.
*Note: Other pipe materials include CCN, GUN, SCC, Reinforced Concrete, Concrete, Asbestos Cement, Pre-tensioned Concrete
Cylinder, Copper, Unknown, etc.
4-1
CHAPTER 4. CAUSES OF FAILURE
This section talks about the various causes and modes of failure experienced by the responding
21 water utilities in their water system. Also, the reasons for restrictions on usage of these pipe materials
are mentioned in this section.
4.1 Causes of failure – PCCP
• Corrosion
• Wire Break
• Joint Failure
• Third Party Damage
• Water Hammer
• Operational Damage
• Embrittlement
• Inadequate Thrust Restraint
• Manufacturing Defect
4.2 Causes of failure – Steel Pipes
• Corrosion
• Coating Problem
• Third Party Damage
• Lateral Ground Movement
4.3 Causes of failure – PVC Pipes
• Joint Failure
• Joint Deflection
• Third Party Damage
• Buckling
4-2
4.4 Causes of failure – HDPE Pipes
• Joint Failure
4.5 Causes of failure – DI Pipes
• Corrosion
• Third Party Damage
• Settling of Soil
• Deterioration
• Deflection
• Water Temperature
4.6 Causes of failure – CI Pipes
• Corrosion
• Age
• Settling of Soil
• Deterioration
• Deflection
• Water Temperature
4.7 Causes of failure – Bar-wrapped Pipes
• Corrosion
• Joint/ Mortar Failure
• Cement Mortar Coating Problem
• Buckling
• Third Party Damage
5-1
CHAPTER 5. MODES OF FAILURE
5.1 Modes of failure – PCCP
• Beam Break
• Blowout
• Service Leak
• Hole
• Blown Gasket
• Pipe Explosion
5.2 Modes of failure – Steel Pipes
• Beam Break
• Hole
• Leak
5.3 Modes of failure – DI Pipes
• Puncture during Third Party construction work
• Circumferential Split
• Longitudinal Split
• Shear
• Beam Break
• Service Leak
• Blown Gasket
• Blowout
5-2
5.4 Modes of failure – CI Pipes
• Joint Leak
• Joint Failure
• Break
• Circumferential Split
• Longitudinal Split
• Blowout
• Bell Crack
5.5 Modes of failure – Bar-wrapped Pipes
• Hole
• Cylinder Crack
6-1
CHAPTER 6. CONSIDERATIONS FOR USAGE
Following are the considerations provided by different water utilities for not using a particular pipe
material.
6.1 Considerations – PCCP
• Requires welder and contractor to perform repairs causing delay to get pipe back in service
• More susceptible to damage during installation
• Has been used in the past. Not currently in specifications
• Not economical; Contradictory, another utility believes that PCC typically beats other materials in
cost
6.2 Considerations – Steel Pipes
• Similar characteristics to concrete cylinder pipe
• High water table
• Not economical
• Difficult to tap or repair
• Unfamiliar with the pipe material and its usage
• Requires ductile for lining type
6.3 Considerations – PVC Pipes
• Not suitable for high pressure and volume
• Not approved for large diameter
• Availability
• Concern over life of product vs. Concrete/metal pipe
• Prone to dig-in damage
• Lower safety factor
• Failure of a PVC transmission main would be catastrophic
6-2
6.4 Considerations – HDPE Pipes
• Hard to handle and install for 24” and larger pipe size
• Cost
• Large diameter don’t meet pressure ratings
• Being evaluated
• Thermal co-efficient
• Difficult to repair or tap
• Pressure and depth
6.5 Considerations – DI Pipes
• Corrosive soil conditions found on city west side
6.6 Considerations – CI Pipes
• Corrosion
• System age
• High cold weather performances
• No longer manufactured
6.7 Considerations – Bar-wrapped Pipes
• Not approved pipe material for diameters greater than 42”
• New to our department
• Not economical
• Unstable at that size
7-1
CHAPTER 7. PERFORMANCES
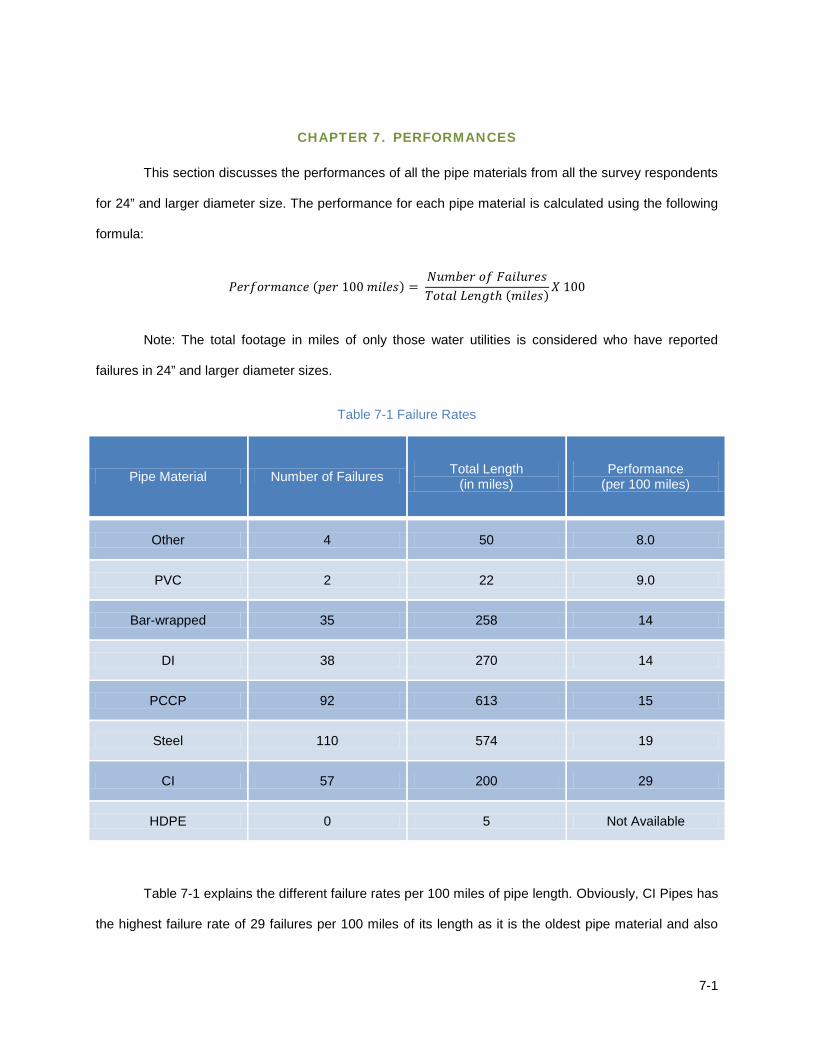
This section discusses the performances of all the pipe materials from all the survey respondents
for 24” and larger diameter size. The performance for each pipe material is calculated using the following
formula:
𝑃𝑒𝑟𝑓𝑜𝑟𝑚𝑎𝑛𝑐𝑒 (𝑝𝑒𝑟 100 𝑚𝑖𝑙𝑒𝑠) = 𝑁𝑢𝑚𝑏𝑒𝑟 𝑜𝑓 𝐹𝑎𝑖𝑙𝑢𝑟𝑒𝑠𝑇𝑜𝑡𝑎𝑙 𝐿𝑒𝑛𝑔𝑡ℎ (𝑚𝑖𝑙𝑒𝑠)𝑋 100
Note: The total footage in miles of only those water utilities is considered who have reported
failures in 24” and larger diameter sizes.
Table 7-1 Failure Rates
Pipe Material Number of Failures Total Length (in miles)
Performance (per 100 miles)
Other 4 50 8.0
PVC 2 22 9.0
Bar-wrapped 35 258 14
DI 38 270 14
PCCP 92 613 15
Steel 110 574 19
CI 57 200 29
HDPE 0 5 Not Available
Table 7-1 explains the different failure rates per 100 miles of pipe length. Obviously, CI Pipes has
the highest failure rate of 29 failures per 100 miles of its length as it is the oldest pipe material and also

7-2
the most used. It is followed by Steel Pipes with a failure rate of 19 failures per 100 miles followed by
PCCP at 15 then DI and Bar-wrapped Pipes at 14. PVC Pipes has the lowest failure rate of 9.0 failures
per 100 miles of its length. The water utilities which use HDPE Pipes didn’t report any failure and hence
the failure rate for this pipe material couldn’t be calculated. Also, the failure rate for Other Pipes is 8.0
failures per 100 miles.
7-3
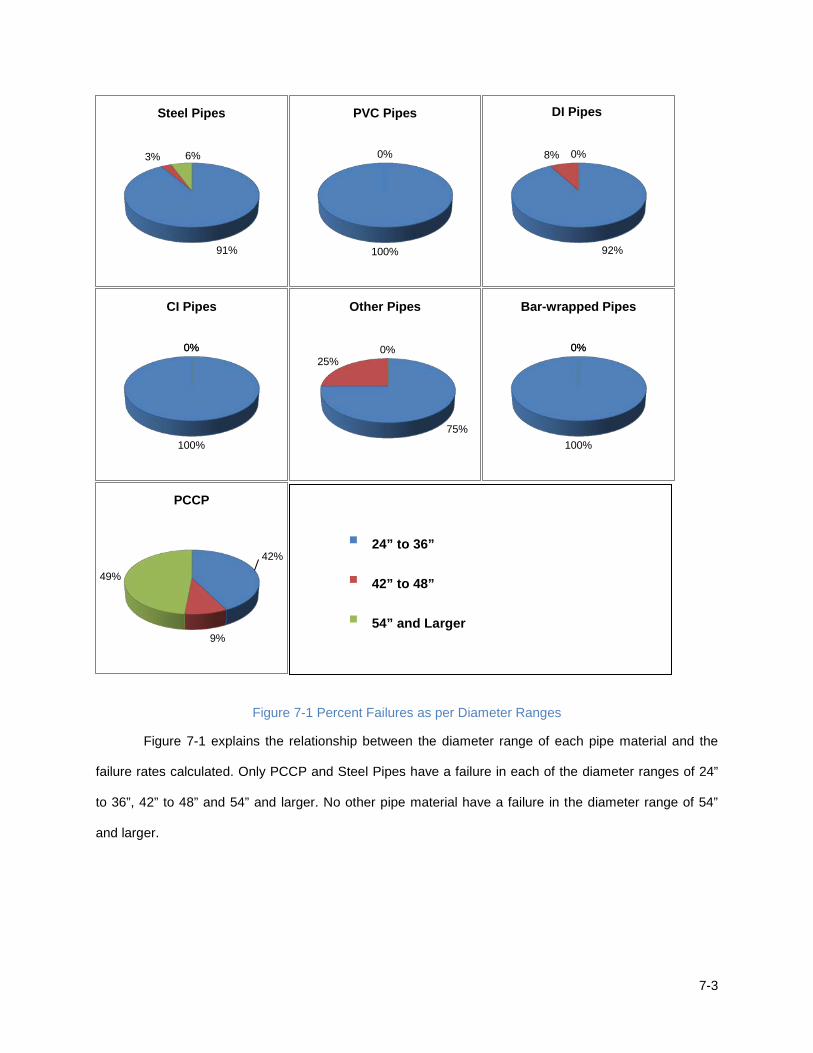
Figure 7-1 Percent Failures as per Diameter Ranges
Figure 7-1 explains the relationship between the diameter range of each pipe material and the
failure rates calculated. Only PCCP and Steel Pipes have a failure in each of the diameter ranges of 24”
to 36”, 42” to 48” and 54” and larger. No other pipe material have a failure in the diameter range of 54”
and larger.
91%
3% 6%
Steel Pipes
100%
0%
PVC Pipes
92%
8% 0%
DI Pipes
100%
0% 0%
CI Pipes
75%
25% 0%
Other Pipes
100%
0% 0%
Bar-wrapped Pipes
42%
9%
49%
PCCP
24” to 36”
42” to 48”
54” and Larger
8-1
CHAPTER 8. CONCLUDING REMARKS
• A total of 21 water utilities serving a population of 13,892,502 having a combined footage of 2612
miles for 24’ and larger diameter sizes. The lowest population of the survey respondent was
12,000 and the largest population was 3,000,000.
• 5319 people are served per mile of 24” and larger diameter sizes.
• According to 12 water utilities out of 21 which provided footage of both less than 24” and more
than 24” diameter sizes, less than 6% accounts for 24” and larger diameter sizes.
• 1676 miles are in between the diameter size range 24” to 36”, 444 miles are between 42” to 48”
and lastly 493 miles are in between the range 54” and larger.
• A total of 64% out of 2,612 miles is in between 24” – 36” diameter range, 17% for 42” – 48” and
remaining 19% for 54” and larger.
• Out of total footage of 2612 miles, HDPE pipes have footage of 5 miles, PVC pipes have 24
miles, CI pipes have 237 miles, Bar-wrapped pipes have 258 miles, other pipes which include
CCN, GUN, SCC, Reinforced Concrete, Concrete, Asbestos Cement, Pre-tensioned Concrete
Cylinder, Copper and Unknown have 457 miles, Steel pipes have 574 miles and finally PCCP
have the most footage of 632 miles.
8-2
• The maximum inventory for all 21 water utilities is in between 25 to 50 years of age which is 988
miles followed by less than 25 years of age which is 661 miles, between 50 to 75 years of age
430 miles and for more than 75 years of age 388 miles. Total footage from these four categories
of age 2468 miles but total footage for 24” and larger diameter reported by all 21 water utilities is
2611 mile, which gives us an unknown age for 143 miles of all pipe materials.
• A total of 25% of the total inventory is less than 25 years old, 38% is in between 25 to 50 years
old, 16% is in between 50 to 75 years old, 15% is more than 75 years old and 6% of the total
inventory is of unknown age.
• Failure rate per 100 miles for PVC pipes is 9, for PCCP is 15, Bar-wrapped pipes is 14, DI pipes
is 14, Steel pipes is 19 and for CI pipes it is 29.The failure rate for HDPE pipes is not available.
Also, failure rate for other pipes which include CCN, GUN, SCC, Reinforced Concrete, Concrete,
Asbestos Cement, Pre-tensioned Concrete Cylinder, Copper and Unknown is 8.0.
• PVC, CI, Bar-wrapped pipes have failure only in diameter range of 24” to 36”, DI and Other pipes
have failure in 24” to 36” and 42” to 48” diameter range, Steel and PCCP have failure in all of the
three diameter ranges.

APPENDIX A
SURVEY QUESTIONNAIRE FORM
The University of Texas at Arlington
Center for Underground Infrastructure Research and Education (CUIRE)
Phone: 817- 272- 0507 Fax: 817- 272- 2630
E-mail: [email protected]; Web site : www.cuire.org
Large Diameter* (24 in. and Larger) Water Pipe Questionnaire
Project Overview
The Center for Underground Infrastructure Research and Education (CUIRE) at The University of Texas at Arlington is working on a major project
regarding failure modes, causes and rates of 24 in. and larger water pipelines. The primary objective of this project is to gain an understanding of
pipe material performance under different environmental, loadings and operational conditions.
The below national survey is critical as a first step to achieve these objectives, since it will provide valuable information regarding the inventory
and conditions of 24-in. and larger water pipes. To show our appreciation for your time and efforts to complete this survey, we will send you a
copy of the research findings upon completion, scheduled for Summer 2012.
Alternatively, instead of completing the survey; you may send us a report or
a database file of your water pipe inventory, conditions and failure rates
**The average time to complete this survey is estimated to be 20 minutes**
If you have any questions or concerns, please feel free to contact CUIRE at 817-272-9177 or the Principal Investigator of this project, Dr.
Mohammad Najafi at 817-272-0507 or [email protected].
a) Contact Person’s Name Position:
b) Name of the organization City State Zip
c) Address
d) E-mail
e) Phone: Fax:
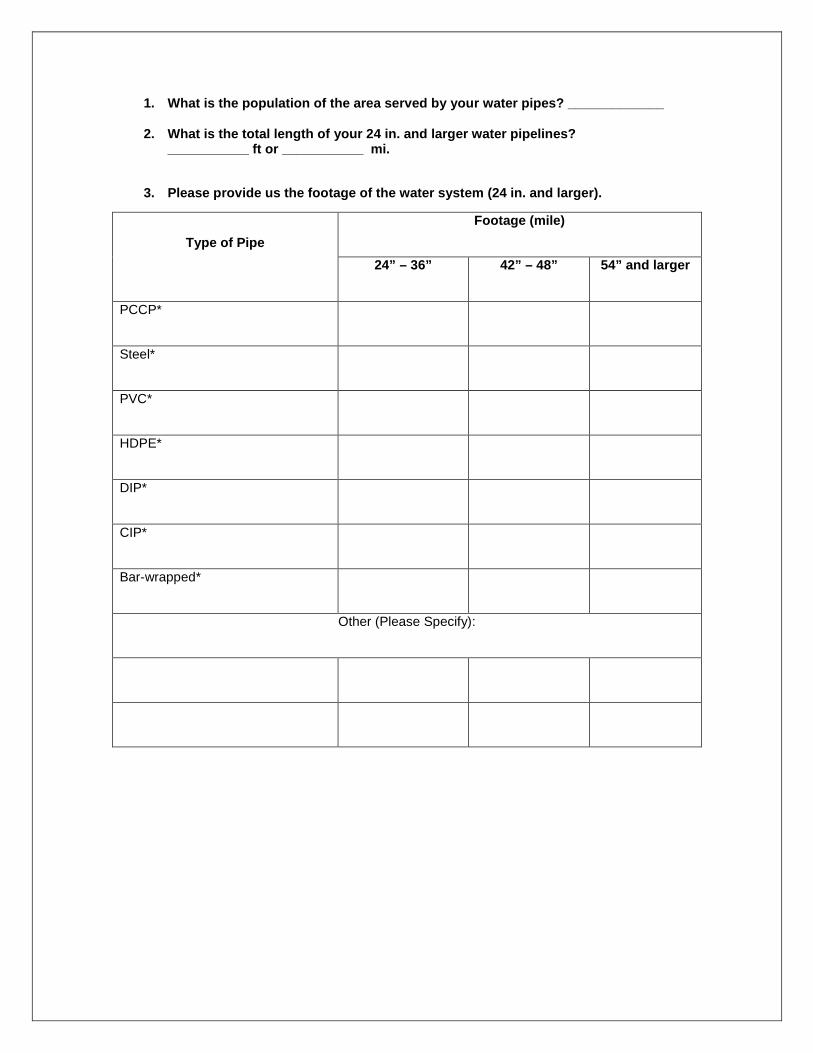
1. What is the population of the area served by your water pipes? _____________
2. What is the total length of your 24 in. and larger water pipelines? ___________ ft or ___________ mi.
3. Please provide us the footage of the water system (24 in. and larger).
Type of Pipe Footage (mile)
24” – 36” 42” – 48” 54” and larger
PCCP*
Steel*
PVC*
HDPE*
DIP*
CIP*
Bar-wrapped*
Other (Please Specify):

4. In your large diameter* water pipe (24 in. and larger) inventory, what footage is:
Type of Pipe
Total Inventory (mile)
Less than 25
years old
Between 25 to
50 years old
Between 50 to
75 years old
More than 75
years old
PCCP*
Steel*
PVC*
HDPE*
DIP*
CIP*
Bar-wrapped*
Other (Please Specify):
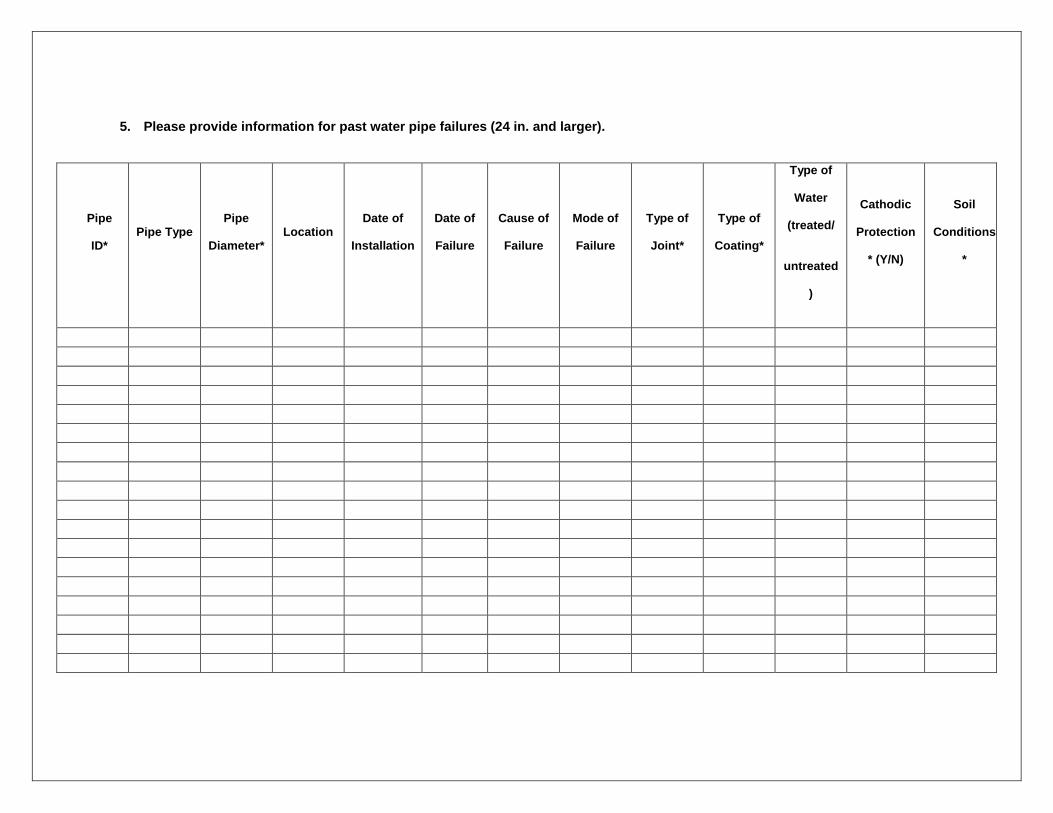
5. Please provide information for past water pipe failures (24 in. and larger).
Pipe
ID* Pipe Type
Pipe
Diameter* Location
Date of
Installation
Date of
Failure
Cause of
Failure
Mode of
Failure
Type of
Joint*
Type of
Coating*
Type of
Water
(treated/
untreated
)
Cathodic
Protection
* (Y/N)
Soil
Conditions
*
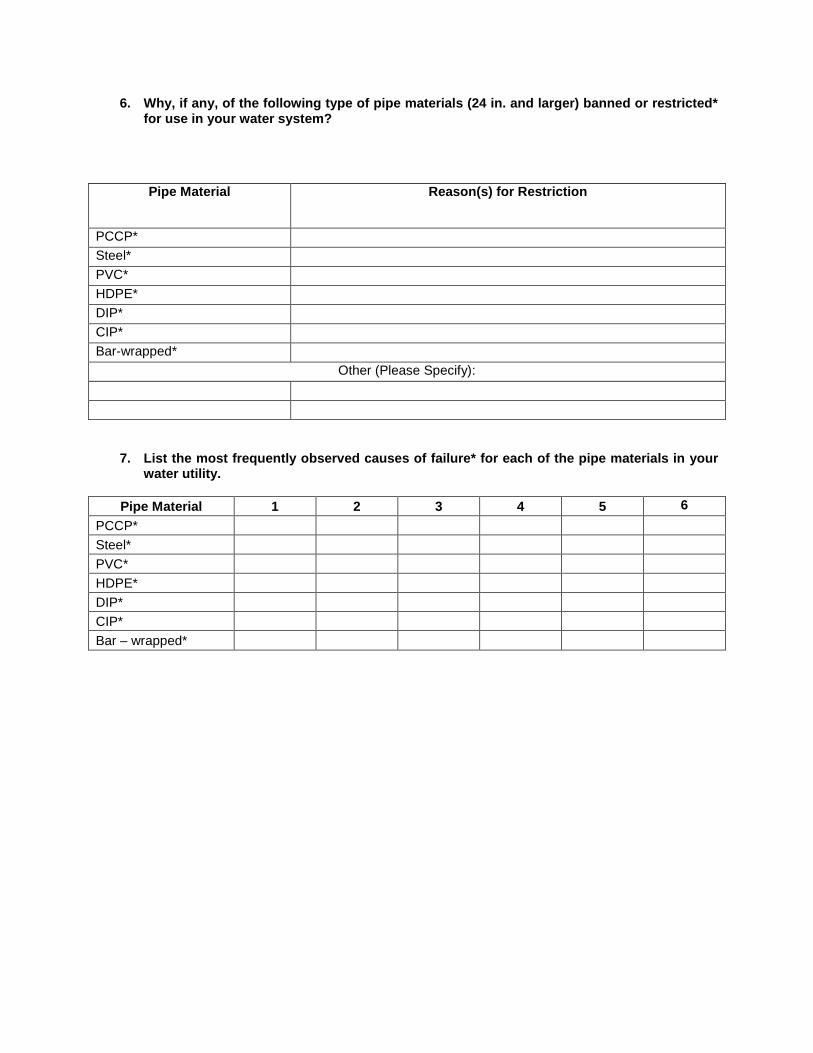
6. Why, if any, of the following type of pipe materials (24 in. and larger) banned or restricted* for use in your water system?
Pipe Material Reason(s) for Restriction
PCCP*
Steel*
PVC*
HDPE*
DIP*
CIP*
Bar-wrapped*
Other (Please Specify):
7. List the most frequently observed causes of failure* for each of the pipe materials in your water utility.
Pipe Material 1 2 3 4 5 6 PCCP* Steel* PVC* HDPE* DIP* CIP* Bar – wrapped*

8. Please provide any comments/suggestions, or feel free to send us any case study or pipeline failure report.
____________________________________________________________________________________
Once again, thank you very much for your time. We will get back with you with the survey results in Fall
2012. If you have any questions or concerns, please feel free to contact Pradip Deshmukh, CUIRE
Graduate Research Student, at 817-313-0716 or [email protected] or the Principal
Investigator of this project, Dr. Mohammad Najafi at 817-272-0507 or [email protected]
Dr. Mohammad Najafi, P.E., F. ASCE CUIRE Director
Editor-in-Chief, ASCE Journal of Pipeline Systems Department of Civil Engineering—The University of Texas at Arlington
Box 19308—428 Nedderman Hall Arlington, TX 76019-0308
CUIRE Office: 817-272-9177 Fax: 817-272-2630
Email: [email protected] www.cuire.org
Definitions
General Definitions
• Age of the Pipe: The number of years the pipe has been installed. • Asbestos Cement Pipe: A concrete pipe made of mixture of Portland cement & asbestos fiber. • Bar Wrapped: Bar-Wrapped Cylinder Concrete Pipe combines the strength of steel with the
corrosion resistance and durability of concrete. It is comprised of a welded steel cylinder that serves as a watertight membrane and works together with steel reinforcing bars wrapped under tension around the cylinder to provide strength.
• Cast Iron Pipe: A hard, brittle, nonmalleable iron-carbon alloy, cast into shape, containing 2 to 4.5 percent carbon, 0.5 to 3 percent silicon, and lesser amounts of sulfur, manganese, and phosphorus.
• Cathodic Protection: Preventing corrosion of pipeline by using special cathodes (and anodes) to circumvent corrosive damage by electric current.
• Diameter: Diameter here refers to the outer dimension of the pipe. • DIP: Ductile Iron Pipe is an improvement to the Cast Iron Pipe. In DIP, the majority of the pools of
graphite are in the form of spheroids. This distinctive shape significantly reduces the occurrence of points of stress concentration.
• Failure of Pipe: Fracture, Breakage, Upset, Lining/Coating problems, Loss of Capacity, Leakage. • HDPE: A plastic resin made by the copolymerization of ethylene and a small amount of another
hydrocarbon. The resulting base resin density, before additives or pigments, is greater than 0.941 g/cm.
• PCCP: Pre-stressed Concrete Cylinder Pipe (PCCP) consists of a concrete core, a thin steel cylinder, high tensile pre-stressing wires and a mortar coating.
• Pipe ID: Unique identity of pipe. • Population: The whole number of people or inhabitants in a region or country. • PVC: A polyvinyl chloride (PVC) is made from a plastic and vinyl combination material. The pipes
are durable, hard to damage, and long lasting. • Repair: Fixing a section of pipeline to make the pipeline back in working condition without
increasing the design life. • Replacement: The act of installing a new pipeline in the place of old pipeline or renewing the
pipeline with new design life. • Restricted: The pipe material could not be used due to certain difficulties. • Steel Pipe: Steel pipe is a material made from an alloy of iron and carbon.
Causes of Failure
• Buckling: Unpredictable deformation observed in the pipe as a result of instability of pipe due to the increasing loads which might lead to complete loss in carrying capacity of pipe.
• Coating: Coating is applied to the surface of the pipe to protect it from corrosion. For e.g. Three layer PE (3LPE), three layer PP (3LPP), fusion bonded epoxy (FBE or Dual FBE), coal tar enamel (CTE), asphalt enamel and polyurethane (PUR).
• Corrosion: The destruction of materials or its properties because of reaction with its (environment) surroundings.
• Excessive Dead Loads: Weight of all materials on pipe. Generally expressed in terms of weight per unit length. Static load throughout the design life of the pipe. For large pipes with full flow, the contents can be considered to be dead loads because their weights and locations are very predictable. E.g. Soil load. Excessive term is used if the dead loads result in pipe failure.
• Excessive Internal Pressure: Force exerted circumferentially on the pipe from inside per square unit area of the pipe is internal pressure. Excessive term is used if it results in pipe failure.
• Excessive Live Loads: Live loads change in position or magnitude. E.g. Vehicular loads. Excessive term is used if the live loads result in pipe failure.
• External Corrosion: Corrosion observed in pipe due to external sources like soil, groundwater. • Installation Problems: The difficulties faced during the laying of pipe in the ground. • Internal Corrosion: Corrosion observed in pipe due to the materials it carries. • Joint: The means of connecting sectional length of pipeline system into a continuous line using
various type of jointing materials. • Manufacturing Defects: An error or flaw in a pipe, introduced during the manufacturing rather
than the design phase. • Over Deflection: Deflection is the vertical or horizontal curvature or combination of both
observed in pipe. Over deflection is defined as the deflection at which the pipe fails. • Oxidation: The erosion damage observed in the pipe due to its surrounding environment. • Permeation: Permeation of piping materials and non-metallic joints can be defined as the
passage of contaminants external to the pipe, through porous, non-metallic materials, into the drinking water. The problem of permeation is generally limited to plastic, non-metallic materials.
• Third Party Damage: Damage caused by someone other than pipeline operator and owner.

APPENDIX B
ACRONYMS and ABBREVIATIONS
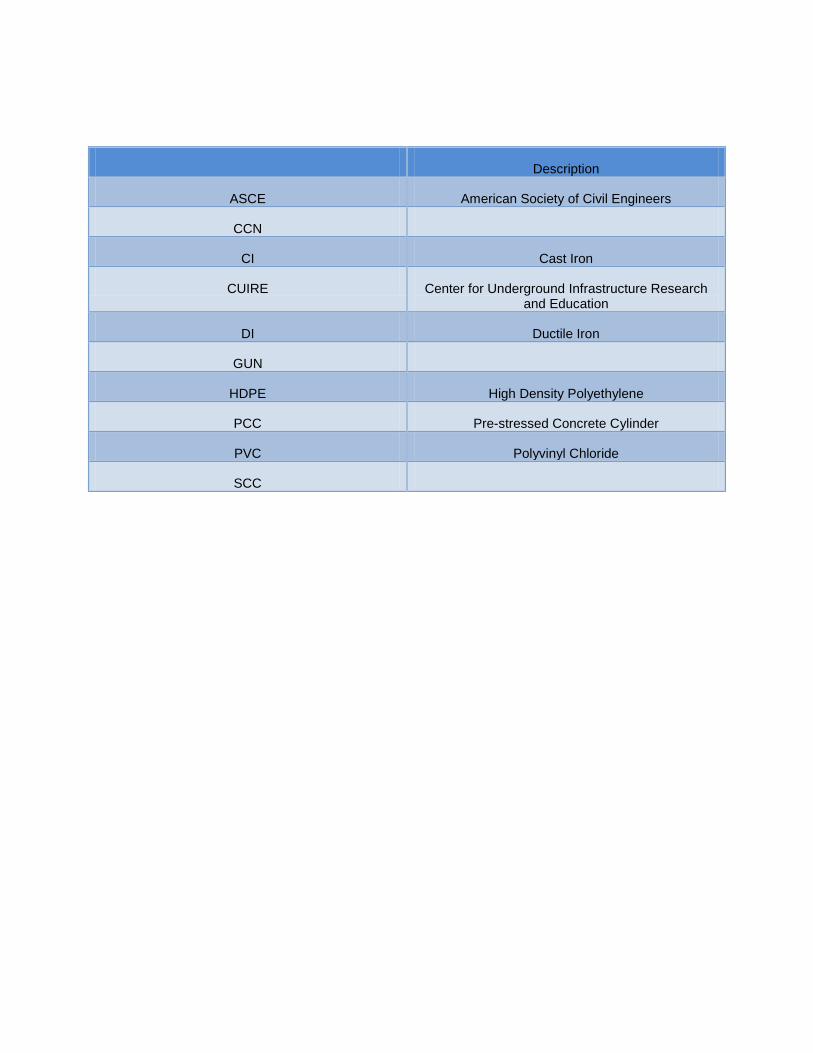
Description
ASCE American Society of Civil Engineers
CCN
CI Cast Iron
CUIRE Center for Underground Infrastructure Research and Education
DI Ductile Iron
GUN
HDPE High Density Polyethylene
PCC Pre-stressed Concrete Cylinder
PVC Polyvinyl Chloride
SCC
REFERENCES
Center for Sustainable Systems, University of Michigan. 2011. “U.S. Water Supply and Distribution Fact
Sheet.” Pub. No. CSS05-17.
Rajani, B., and Kleiner Y. (2010). Fracture failure of large diameter cast iron water mains. Water
Research Foundation, Denver Colorado.
Report card for America’s infrastructure (2009). American Society of Civil Engineers, Virginia.