Embed Size (px)
Citation preview

©U S Departmentof Transportation
Federal Railroad
Administration
Investigation of Rail
Fastener PerformanceRequirements
Office of Research andDevelopmentWashington, DC 20590
DOT/FRA/ORD-82/10 March 1982Interim Report
This document is available to the
U.S. public through the National
Technical Information Service,
Springfield, Virginia 22161.

NOTICE
The United States Government does not endorseproducts or manufacturers. Trade or manufacturers'names appear herein solely because they are con-sidered essential to the object of this report.
NOTICE
This document is disseminated under the sponsorshipof the Department of Transportation in the interestof information exchange. The United States Govern-ment assumes no liability for its contents or usethereof.

Technical Report Documentation Pc-
1. Report No.
FRA/0R&D-82/10
2. Government Accession No. 3. Recipient's Cotolog No.
4. Title and Subtitle
Investigation of Rail Fastener PerformanceRequirements
5. Report Date
March 1982
6. Performing Organization Code
Battel!
e
7. Author's)
8. Performing Organization Report No.
Francis E. Dean
9. Performing Organization Name and Address
Battelle Columbus Laboratories505 King AvenueColumbus, Ohio 43201
10. Work Unit No. (TRAIS)
11. Controct or Gront No.
DOT-FR-9162
12. Sponsoring Agency Nome and Address
Federal Railroad AdministrationOffice of Research and Development400 Seventh Street SWWashington, DC 20590
13. Type of Report ond Period Covered
Interim ReportOctober 1980 - June 1981
14. Sponsoring Agency Code
FRA
15. Supplementary Notes
16. Abstroct
An investigation was conducted to develop qualification requirementswhich rel iably duplicate the service performance of rail fasteners.
The study included a review of available data from qualification tests,measurements of rail/tie deflections and fastener clip strains at the
Facility for Accelerated Service Testing (FAST), and laboratory testsat Battelle which simulated the FAST environment. Several aspects ofservice performance at FAST were successfully duplicated in thelaboratory tests. Recommendations are made for the design of improvedfastener qualification tests.
17. Key Words
Rail Fasteners, Fastener Performance
Railroad Track
18. Distribution Statement
Document is available to the U.S.
public through the National TechnicalInformation Service, Springfield, VA22161.
19. Security Clossif. (of this report)
Unclassified
20. Security Classif. (of this page)
Unclassified
21. No. of Pages
70
22. Price
Form DOT F 1700.7 (8-72) Reproduction of completed page authorized
i

DCOQ-UJCC
CO
U•r—
U+->
cu
CD
-t->
fO
.ao
EE
E3.
S- (L)
cu C_)
-t-j
01 00
E c CDS- •i
—
o <L>
<u r— +J S-4-> I— 3 enO)
:Ecu2:
CU
o4->
<DCo
aa»co
i
+j4->
O
s-CU+->
CU
c cO •!-
5 s-cu +->
2: co
QUJCO
COh-1—
1
co(—
<
_I
z:UJ
u.oco
.a
CMCO
00 CM^ 00 1
«^- *3-
CO • •s* Ll_• ID •
CM «3"
00 00^1- in r—
CO loCO CO r-«.
en
LO
O r—
UJ
o 00•1—
CXI
4-
Q. I c3.
cu
-M
CL
4->•^cu.cc
*—* cucu S-u -cj- fO
u_4-
00cu
•
.
-a cuCO -t-> .c c: J-+J O 3 cx>r— O sz cuC u. >—
1
a.
o00
CO
O -a JZcO 3 C
00 1
—
1—
1
4-> Q_ "^ c•r— 11 1
0 •r—
C -*-> c toID a. Z3 i-
•r- O +J"O ^ u. Q_ COC1J
c•r-
-QEOc_>
n

PREFACE
This report completes an investigation to identify improvements in
performance requirements for rail fasteners used in U.S. mainline service.Battel le Columbus Laboratories conducted the study under Contract DOT-FR-9162 entitled "Tie and Fastener Verification Studies." The overall programwas sponsored by the Improved Track Structures Research Division of theFederal Railroad Administration (FRA). In a related phase of the sameprogram, Battel le investigated the effects of tie pad stiffness on theattenuation of dynamic loads in concrete ties installed on the NortheastCorridor track.
Mr. Howard G. Moody of the FRA served as the Contracting Officer'sTechnical Representative and contributed significantly to this effort byobtaining timely delivery of test materials and by editing the suggestionsof the reviewers in preparation of the final draft. Several representativesof railroads and suppliers provided meticulous reviews of the draft report.The efforts of all of these people are greatly appreciated.
m

Digitized by the Internet Archive
in 2012 with funding from
University of Illinois Urbana-Champaign
http://archive.org/details/investigationofr8210dean

TABLE OF CONTENTS
Page
PREFACE iii
INTRODUCTION 1
Review of Fastener Performance Problems 2
Wood Tie Fasteners 2
Concrete Tie Fasteners 5
FASTENER PERFORMANCE SPECIFICATIONS 7
REVIEW OF EXISTING FASTENER TEST DATA 14
Rail Clip Force-Deflection Properties 14
Tie Pad Stiffness 14
Fastener Longitudinal Restraint 16
Fastener Lateral/Rollover Restraint 17
Lateral and Longitudinal Restraint of WoodTie Fasteners 18
FASTENER PERFORMANCE EXPERIMENTS 21
Track Measurements at FAST 21
Clip Force-Deflection-Strain Characteristics 23Comparison With Track Measurements 23Method of Determining Clip Yield Load 25
Tie Pad Compression Tests 26Longitudinal Restraint Tests 33Lateral/Rollover Restraint Tests 36Fastener Fatigue Tests 41
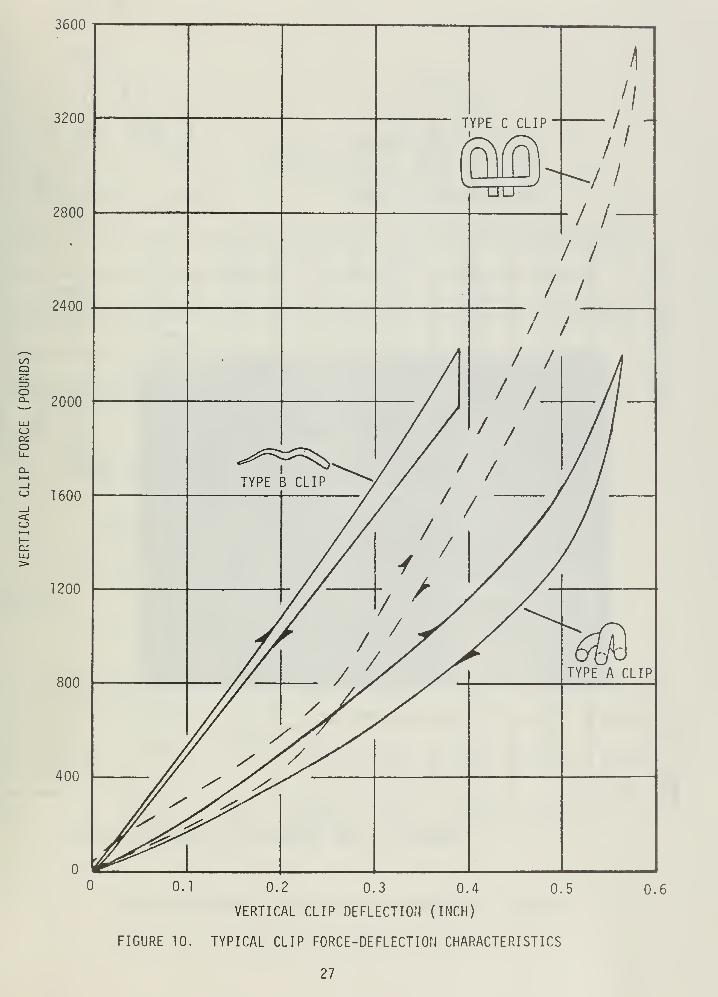
Concrete Tie Fastener Fatigue Test 42Wood Tie Fastener Fatigue Test 47
DISCUSSION AND RECOMMENDATIONS 50
APPENDIX A - DATA FROM EXISTING FASTENER PERFORMANCE TESTS 54
APPENDIX B - STRAIN-VOLTAGE RELATIONSHIP OF INSTRUMENTED CLIPS 61
APPENDIX C - LABORATORY TESTS OF INDIVIDUAL CLIPS 66
REFERENCES 69

LIST OF ILLUSTRATIONS
Figure Page
1 Examples of Nonconventional Wood Tie Fasteners 4
2 Examples of Concrete Tie Fasteners 6
3 Clip Force-Deflection Properties 14
4 Two Methods for Measuring Tie Pad Stiffness 15
5 Measurement of Longitudinal Restraint 17
6 Measurement of Fastener Lateral and Rollover Restraint .... 17
7 Comparison of Longitudinal Resistance With and WithoutRail Vibration 20
8 Field Measurements at FAST: Fastener Types and DisplacementComponents 22
9 Vertical Clip Deflection Vs. Clip Strain From TrackMeasurements and Two Laboratory Tests 24
10 Typical Clip Force-Deflection Characteristics 27
11 Determination of Clip Yield Point for Two Clips 28
12 Loading Arrangement for Tie Pad Compression Tests 29
13 Vertical Load-Deflection Characteristics for thePolyethylene Pad 30
14 Effect of Cycle Rate on Load-Deflection Characteristicof Grooved "Duraflex" Pads 31
15 Effect of Cycle Rate on Load-Deflection Characteristic of
Grooved Synthetic Rubber Pad 32
16 Loading Fixtures Used for Longitudinal Restraint Tests .... 34
17 Influence of Pads and Insulators on LongitudinalRestraint of Concrete Tie Fasteners 35
18 Longitudinal Restraint of Wood Tie Fastener System 37
19 Loading and Measurement Schematic for Lateral/RolloverRestraint Tests 38
20 Applied Load Vs. Displacement for Lateral Restraint Testsat 20 and 30 Degrees, Hard Polyethylene Pad 39
21 Applied Load Vs. Displacement for Lateral Restraint Testsat 20 and 30 Degrees, Grooved Synthetic Rubber Pad 40
22 Loading Schematic for Concrete Tie Fastener Fatigue Test ... 43
23 Typical Load-Deflection and Strain-Deflection Plots FromFatigue Test of Concrete Tie Fastener 45
24 Locations of Clip Cracks Developed During Concrete TieFatigue Test 46
vi

LIST OF ILLUSTRATIONS (Continued)
Figure Page
25 Loading Schematic for Wood Tie Fastener Fatigue Test 48
B-l Schematic of Type A Clip Instrumentation 63
B-2 Measurement of Clip Response Voltage Vs. Deflection in
Laboratory Fixture 65
C-l Fixture for Measurement of Clip Force-Deflection-StrainProperties 68
Table
LIST OF TABLES
1 Summary of AREA and Amtrak Fastener PerformanceSpecifications 8
2 Amtrak and AREA Fastener Qualification TestSequence 13
3 Results of Gauge Widening and Longitudinal Restraints Tests
on Four-Tie Panels of Wood Ties 19
A-l Fastener Clip Force-Deflection Properties 55
A-2 Fastener System Uplift Properties 56
A-3 Tie Pad Compression Load-Deflection Properties 57
A-4 Fastener Longitudinal Restraint Properties 58
A-5 Fastener Lateral Restraint Properties 59
A-6 Fastener Rollover Restraint Properties 60
vn


INTRODUCTION
This investigation was conducted to identify potential improvementsin performance requirements for rail fasteners. Improvements are needed to
reduce the greater tie and fastener maintenance demands which have emergedwith increased levels of lateral and vertical track loading.
Maintenance problems on highly loaded wood tie track (tie platecutting and spike killing of the ties, rapid deterioration of surface andalignment) have led to two developments: (1) the trial use of nonconventionalfasteners on wood ties, and (2) the introduction and expanding use of con-crete ties. While some of the new systems have brought improvements in thecritical area of gauge widening, many have experienced additional problems.
These include the failure of components (concrete tie fastener clips, tiepads and insulators, wood tie plates and holddown spikes), the lack of ade-quate longitudinal restraint, and the cracking of concrete ties.
Performance specifications for concrete tie fasteners have beendeveloped by several railway associations and rail transit authorities. In
most cases, the specifications require a series of qualification tests in
which the fastener system is subjected to static and dynamic loads. Theretention of fastener strength and resistance to permanent deformation aredetermined by static measurements before and after fatigue tests. While suchtests have served to differentiate among candidate systems, they have oftennot provided reliable indications of performance in track. The value of thetests is limited by a lack of information about the fastener serviceenvironment.
To develop fastener performance requirements which better representthe service environment, a research program was carried out in the followingphases:
a. A review of fastener performance problems, existingperformance requirements and available data fromlaboratory tests was conducted. This review is pre-sented in Reference [1].
b. To define a representative fastener loading environment,a field test program was carried out at the Facilityfor Accelerated Service Testing (FAST). Measurements ofrail/tie deflection and fastener clip strains were madeon 5-degree curves of wood and concrete tie track.Results of the field measurements and supporting labora-tory tests are reported in Reference [2].
c. A laboratory study was conducted to:
(1) define more realistic fastener fatigue tests.This was accomplished by subjecting two of the
1

fastener systems to simulated service environ-ments (based on the measured fastener deflections andstrains) and comparing the results with observedperformance at FAST.
(2) improve the determination of basic fastener per-
formance characteristics. These included thefastener yield load and the stiffness of a con-
crete tie pad.
This report summarizes the preliminary review, presents theessential results of the field measurements at FAST, and describes the sub-
sequent laboratory tests. On the basis of this investigation, recommenda-tions are made for changes to current qualification tests of concrete tiefasteners. If adopted, the changes will provide for:
a. more realistic tests of fastener resistance to fatigueloads
b. the definition of pad stiffness over the range of pad
loads expected in service
c. elmination or simplification of other tests used in the
current specifications.
Review of Fastener Performance Problems
Wood Tie Fasteners
The conventional wood tie fastener in U.S. service consists of:
a. a tie plate to transfer loads from the rail to the tie
b. cut spikes to constrain the plate and rail against gaugewidening and to constrain the rail against rollover
c. rail anchors—spring steel clamps which, when attached to
the rail base, constrain longitudinal rail-to-tiemovement.
Vertical uplift motion of the rail is allowed through the development of freeplay between the rail base and the rail line spikes. The amount of free playis adjusted naturally as the rail deflects upward in front of the passingwheels and the line spikes yield slightly from their original anchorage in
the tie. Tie pumping is held to a minimum by this development of free play.

This basic fastener has been in use for many years and remainspredominant in U.S. track. However, the introduction of 100-ton cars withroller bearings and long unit trains has caused rapid gauge widening, tie
plate cutting and spike killing of ties with the conventional fastener.Wear begins in the form of spike pullout and enlargement of spike holes,causing lateral yielding of the tie plate and rotation of the rail. Oftenthe track must be regauged by plugging or filling the spike holes and redriv-ing the spikes. The process accelerates with repeated maintenance andeventually necessitates tie replacement. Finally, frequent transposing andrelaying of rail on curves require removal of the line spikes and contributeto spike kill ing.
Various modifications of the conventional fastener have beenintroduced to alleviate these problems. These include:
a. additional spikes
b. additional spikes with larger tie plates
c. special screw or locking type spikes as holddown fasteners.
Some railroads have installed test sections of wood tie fasteners,which represent a major departure from the conventional plate-and-spikefastener system. Examples are shown in Figure 1.
The greatest departure from conventional design consists of the useof elastically deforming clips to constrain the rail. The clips may bedetachable from the tie plate, may be anchored through the plate by screwspikes or other holddown devices, or may be integral with or permanentlyfixed to a pair of spikes. One major objective in the use of such clips is
to eliminate rail anchors. Wood tie fastener test data shown later indicatethat some fastener designs actually exceed the longitudinal restraint of rail
anchors, but to date this has not been verified in the field.
Rigid clip designs have also been introduced. Some of these pro-vide a gap between the clip and the rail base to permit rail uplift andthereby reduce pumping. Since the gap eliminates longitudinal restraint by
the clip, rail anchors are required. However, detachable clips of either therigid or elastic type have a major advantage in that the rail can be trans-posed or replaced without respiking.
Tests of nonconventional wood tie fasteners in revenue servicehave provided early evidence of improved performance [3]. However, tests atFAST under severe and accelerated conditions have produced the followingproblems [4]:
a. elastic clips broken or loose
b. tie plates broken at clip attachments
|Refer to References

00LxJ
I—<c_JQ_
I—
I
OLUQ.O0
o
Q-
O
I—oo
QoO
o
oo
o
X
ID
c. screw spikes broken off in the tie
d. spikes pul led out.
Concrete Tie Fasteners
Fastening systems for concrete ties generally consist of:
a. a pair of detachable clips, either elastic or rigid
b. clip anchorages or shoulders either embedded in the concreteor inserted into a threaded sleeve
c. a pair of insulators in the form of separate pieces insertedbetween the clip and the rail or of material bonded to the fastener shoulders
d. a pad of elastomeric, rubber or composite material to providevertical resilience and prevent tie abrasion.
Examples of concrete tie fasteners are shown in Figure 2.
Problems identified at FAST and in revenue service test segments ofconcrete ties have included:
a. dislocation, fall-out and fracture of elastic clips (pri-marily at the inside-gauge position of the FAST Section 17
five-degree curve)
b. cracking, dislocation and deterioration of pads andinsulators
c. excessive tie skewing
d. shoulder loosening (Northeast Corridor).
Problems in skewing of concrete ties are aggravated by the factthat rail anchors are not commonly part of the fastener system except whererigid clips are used with a clip-to-rail gap. However, rail anchors wereintroduced at FAST to prevent skewing and bunching at the bottom of a 2-per-cent grade in the 5-degree curve of Section 17. Since concrete tie fastenersystems are already \iery expensive, it is expected that rail anchors wouldonly be used in the most severe loading environments.
There is one major performance problem which is peculiar to con-crete tie track. Concrete tie construction creates a track with much highervertical stiffness than does wood tie construction on a similar roadbed.This must be compensated by the resilience of the rail pad. The JapaneseNational Railway (JNR) has determined that for its service requirements,this vertical stiffness must be maintained below rather restrictive levelsto prevent excessive ballast settlement, ballast particle degradation,growth of rail corrugations and transmission of noise into the passingvehicle [5,6].
5

aLUQ_ir>o3ZOO
QUJI—<C_J=DOO
eno
oo
LUoo
Q<:
eno
LU
oo
LUOO •—
i
< i—-JLU LU
h-LUa:oz.ooLl_oooLU_J
onOC^
1— 5c£ X_l LUr>ooz •
•-^ CM
LU LU»— cm
2< i—
i
Q. U_LUOO
az<c
O-
o
oo
q.oo

Low vertical stiffness on concrete tie track can only be attainedwith a pad specifically designed for this purpose. However, many soft pads
(stiffness about 500,000 - 1,000,000 pounds/inch) are less durable thanharder alternatives (stiffness about 3-5 million pounds/inch). This conflictbetween requirements for low stiffness vs. durability constitutes one of theprincipal challenges in the production of cost-effective concrete tiefasteners.
The continued occurrence of service performance problems for theimproved, or nonconventional , designs of wood and concrete tie fastenersindicate the need for the development of laboratory tests which can predictperformance to be expected in the field.
FASTENER PERFORMANCE SPECIFICATIONS
Chapter 10 of the AREA manual [7] provides specifications for con-crete ties and fasteners. Other agencies and railroads, most notably Amtrak,have incorporated the basic AREA fastener tests into an expanded set ofrequirements which feature the sequenced repetition of several tests [8]. In
Table 1 the performance tests of both the AREA and Amtrak specifications aresummarized and compared. Table 2 defines the testing sequence of the Amtrakspecification.
Both specifications require static and dynamic tests on thefastener systems and components to determine the following characteristics:
a. Strength of the fastener anchorage
b. Resistance to permanent deformation after cycling throughcompression and uplift loads
c. Resistance to fatigue loading
d. Longitudinal strength against rail creep after the applicationof cycl ic loads
e. Stiffness against gauge widening and rail rollover undervertical and lateral loads
f. Vertical resilience
g. Electrical impedance.
Other than the requirements of the FRA Track Safety Standards in the
maintenance of track geometry limits, there are no performance specificationsfor wood tie fasteners. Chapter 5 of the AREA manual specifies requirementsfor the strength and durability of plates and spikes. However, it is theinteraction of these components with the tie which causes most wood tieproblems. Since many nonconventional wood tie fastener components are alsoused on concrete ties, their design is affected by specifications for concretetie fasteners.
7

o-LU
OO
O
c_>LU
oo
<_>
z.<cs:QiOU_OCLUCL
Q£LU
LUI—oo
a:
Q
LU
>-on
oo
S-
toc
O OJ. -I- +J
+->+-> cut- TO S-cu E uW i. ccoo•r- 4- U
<D4- "O 4-O O
*->
(U C OlDid) C03 C -r-
Q. ro -^O- E U•i— S- 03r- <U S-to Q. uO O O
s
co
o4-Ol-a
O)cEs-
cuQ.
ai
cus-ocoo
S- +-> 4-O 5- O
CD
o c C
03 4-+J oos- co
o03
o cJ
CO
S-
ai
c
cc:cutooo
CL
+JcO)c:oa.Eou>>cto
4-OCUs-
+-)
CJ03s-4-
CUI/)
tOa>
'a5-
(0S-
LUa:
oocc
4- +JO </>
to
-a cu03 i
—
oi— +j
to
to ~ao i—•i- o+-> .c:
i- l/>
CU "O cu> c +->
to Z5>> c
f (/I •!-
O. O- ECL-f-
LUon
CO
<
-Q 4JI— :3
I C4- EO COLOCM 4->
I/)
4- to
O CU
acr 03s_
o -o+-> I—
o>>-£-
"0.-0o_ c<C 03
LUa:
CO
1-0
to tos- otO 1—a,cu cuto to
«3-a cu03 1—Q. CU
S- CL
cu -ac 03•1- oE r-s-cu c+-> ocu •<-
Q 4->
CuLO
4-o"O •
03 toO Q-
Xto o
>> oc— +->
0.a. o-
cu
^
g
to L
CM
COLU
CCLU00
"%i1
oLOCM
-o03
O
00
^ 4->•—
•
3C3
°^ r—"-< 32^ Cu
00
I/)
CU
CUzsa-i~o
l-H -(-)
1 <oQ. s_
ZD 03O.
CT cuZ 001—
1
Z -aLU 03
I— CLOO=c II

oo
o
LU
oo
C_3
§£
oll-
cs:
ujQ.
00
a;
UJa:
>-
oc_)
CO
Ej=
.
4->
iO o C ^o tJl 1 CD o O ^^ V
o o ao o Q. Q.
§ §C\J <>J E soo O o +?1— +-> V o o a
CO<T3
ai3ft) c
^1a ^O "!*
LU i
—
N fO ciQi t-1 . ^Or—i—
i
ID tO ^ O O °^ °ao- en o o ciLU CD cJ CD CO a a cn-s;CC o
s:
S-Z3 |
•5 o ci -K>
"c a a<o « +-> V ^s a ><+-> V Q. a.CO ^ 3CO
s ^ COCD o o OS O J^CC c* z: z ^ c{ S en
. . .^rCD -O tsl
3: to •
Ll_
H- aU_
s- s- c: c ^ -^§
O C\J o ^ ^ CiCD CD •> »p- n3 a 3 <2> r— «^ ^ S ^J-C 4-> r— E -4-> O s; vO CJ +-> 1
—
O CrCD <0 tO CO cj -a Cj O C CO N") O ,
-t-> 3 > LO -i- 'VCO O i— CO V oo
V O CD «+- £= O -Q a3v^o
•^-1— O ia >« ^ a. cirn C E CDM- •>- CD S- S- -CS -^\ s- o a o
A3 4 t/)
j=4_>
° cr. ^ -a
S- O CD $) -o - i1 aCD CO M- i— <rf ^sd
•r- S_ S- -r- ^ <5j P OtO i—CL CO O
COCO ^ 1 t
+-> 3 CD • <a -0 < w a. 5) *e CD +J >> CD ^ cjo ^5
—J <Z> 1 O• •ty sx <} CO i— u i
—
T-^ <VCD -S= M- 31 1 O "W U.+-> n3 O V «CD CO O 4-> « 3 •<
i— S- CO 1 =\J CQ.S- 3 „ r- d ~C c
3 td S ft) Z5 ^TD CO C^^ CD a^ cJ
LU$
-3
) *e
ra CD O CO S-
4->
.3 oc3 ~a
C£. eo o r •>- <> ^ *e O «Cll i— CD i— ^ fO c3 v =* <3 . tQ .c> w «rD Ot--C^ fO S N CI tj -s; os •r- CO •!— S- .3 ^> "<* «-^ t3Q
>, •— o a ts <3 isi
-x! n3 =5 E O O) I •$ c3LU 5- OO Q. a<_) CD i— i— CD CJ O =N> s: . C OO E N-) •> sO 1/1X1 C S~ «3'VQ cO ~Q
s- E •>- >> 3 Poo ;> sS «JS CD tO - CD ^W-
cJa; ^ r^ C O >> . +-> ^ S- <— U~l LTlo_ CDCD-Cr— CO 0~CS'- O Cj r- *— i— ^**
=N>S^- 2b.cs.t2 . Ci C^l
E co +j a. re S S o ^ ao. a a;^ r- ^*-Eco-1-Q.CD £S!+J cj •<? CD • a. co tO a ^ ^•—i to 3 io IE t—>•>?<:i OC « 2 -Q — QQ. < • Q. < ^j- fi
V v:«=t < i! <£ s LU tx.
CC h~<c s < S< <
(
"V_^J~1— co
* oo a.• LU •!-
I- ^s—"NCOLU1— H _ j hC\1&
,.
D-Q *J3 O<C ' oo -^
r?^ )*Slo o V ^0
>v \
h-ooLU
QLU
n *— sOLU 1 VI— JV^ \-
1 1 1 ^ ^v
:
^s ( >~ '
1— s:>O
3D_ \
I—
t
1 LU °
< H Uh Ha: o
CNJ
CDz:
•—i — i—
i
<
<
h-C_) "*
LU ac «s .o_l "*— —LU
3 «^ <:
S s2 <
oo tT

o
=cCJ
c_>
OO
C_)
ou_CCLUD_
cc
oo
cc
<:
<CUJCC<c
>-CC<c
oCJ
CQ<c
T3C CO ;<a +-> i
—
- c Ci LTl^3- a cd
<a ET3 •
S SI""o
CD CD CD.C CJ S ^ sJ
CO
<T3 COSZ CD CD+-> cn+J
4->
COZ3
fO
•- a.fO CO
^•^J•^
2^ '3 2
t—
LU CD
ro _3a. c:Q.'i-"" E
-Sl/> LO ^
Eu)
S- -r-
-o •
SuCJCJ ~CS
LUcc
fO CO r
CD CD
CCDE •
CD — «*cd <a "^2 S-r—
O CJT3 cJ
l-H S- +-> 1— cj CD = -u) CD *< o <3_0
LUcc
CD 13 r
CCD T-cr> E
CO ,i->
o -o
> 00O s-s.
E r-
cd +-> -a
r— CDCD O
ro t— S- ^ CD C U CD X S O -cQ.O0 +-> CD <y <s> ra C CO CD V -y C> CJQ. -r- -a Cjr- C -O C jJ1 '!— "O 'I—
CD ra
CD O «3 «CO -C fo ra cJ
O CD §i— CO•r- CO
ct- ,— C4- •.- c ^^O -r- fO CD •i— fO ra ci
s^ ^j cj s;^ S ^ J- oo CC .— Q L U fX O o Sl-y
T3 1 V COCO = .c 1 s:
COra CD 5 s CD 00
C r— O r— 3 3 3"O CD 3 S- ra
s .s; cj
ra CO 5- cj • NO CO -C s- W cJo ra CD cl tj) o »-o M CD • S*ti cj1
—
-Qra •• «J C
CO CD -u> +J •-J « •g s<3
3 Q. CD CO ra C o SL cJ •oCD ^ CO • Sc. <3
•r- CJ^: x
CLr— •!-
•i- oS cj*j •^-o-
*•£+-> ra ' ra CO cJ -J^ cJ •o o CD Ji£ CD CL s ^ ~C! cJra i- "> CD W •w o
(
—
+-> t3 O • ^f <rf SCDCD-
CD
O t- cJ <3 *?y s
c5 dLO WD
• C ra o -<? ciQ. cJ
^1CD n3 3 r- T3 O CD O -r- O CJ -Q O o c>C. C -P ItJ ^ -Q ^C3 S>. cr +-> E CM E — • . O CJ V —
LUCC
O)
• •!— U CD a) cJ O Ci) Ci) CDa. >rs o
M- r^ +->
O CD ra o-u)
CD ii3ow+5 ts
LU Ct-
lo M- <d ""ci Si. <rfO i— CD CD cj Si. cJCi) 3
ET3 TD O CD i E
CD 2 5 V *cs •<>
5 8CJ O
CJ ra O T3 (O O !rf V fO CD j^j ra *-> O j^ S_ 3 cJ « +v ^ cjO "3" s- en o -q ^U O CO \ O C O •r- O ^ til o sq: E C\J o CD *e -o S
t- O 2. WW r— ra 3 i— CO ra 3 3 tj ao Cj CJ CJ~SQ. S- C|— S JD Cr- S- +-> cy o~ •y £ ^^o • >> ^ 3 Ci) o >, O >> CD CO CJ CD
CJ*"".
-QSi.
^ cJ
s_ to Q-r-LO -t-> Ci) ~c$ ft)
ra s <3 s: § ° CLT-*e
Q.,— CO«e s- US s
^CD CD a. o CD M- « O W -s; s; Q. n3 o Q_ o CD o o Sl v-= o Q. s; ^^Q. +-> <c -c : \— w <C S- 2 < LS. 2 z < O "^ <W
V # , V # 4 ic ii< •< =C < < < cC •<LU P2 LU (M LU CC LU CXCC h- o; r~ QC \~ DX K< < =c < < < < <
h- Q. a b.Z vjpW.t—
i
_j ^ n V^el < >^- Jq; ZZl 5
I w^S^^_J1^V^-\ I—i— 1—
1
i— —L,<~Cz&^ M ^'li /? 00oo Q oo JX^X vS g; fk ( LULU ID LU /\J •Z Vx> r—Ct (— 1— -1
1
i^ >*^
_1i—
i
CD Q I— h-in 2:o **
<c z: <c ^ oo 2L +-> c" o 1—i ^z o o LU Cit—
i
c CNJr—
1—
1
_l _l ^1 LU <x. CD C_) IYQ LU C_> CC E C LU ^^^ 1 •s.
1—C_) ZD
00CD>
oLu _^p —/
(— •—
i
_i oo LU O +J LU I /F^"—^^mt
\oo CD a. zz CC s: ra Q \—l \LU ^ U~) <C +-> \1— O
I
C3
p—i q: Qo_J
rOi-0)
oCC
Q<CO_l
*OT
^.
Z ^-/J* 4-> •^~i—
i
^T" _1 fO n3 QZ. s^^ K <c _l oct cCLU CC Cl.1— I— LUoo oo 1— ,—
^
*—^. LUCC LULU h-
cC fO JD—
1
CO
10

o
§
o
(_)
en
<ou_
LxJ
ex.
UJ
>-on
oc_>
CO
UJ
IS
*ev=
*e .
o 3C71 a)s; si
3 o
3•v OSi
ino S-2 «
ft) S -Q
OH
aUJooCX,
ai
ECDs_
O"QJ
on
<
+->
cuE(Ui-
CTO)i-
<
c:0)
EQJi-
cr
s-
on
00
11

o\o
s u-> tsi
O o\Q V *-~ -^ *•« -Q
=vj s;
£ s; <rf o s;<3 o -u . so
O T3 -Ed
ti ci) OHV cJ-V
«v S? _, cj -o ^ -o
-s; <^ W < s: « ooo £ x -w o ' sx o o sx •
1— •>> Cl)
«rf 'fiA^ -CosLU O V « O ^i — V tj (J cJ
s: •^ O <C <N> -Q O O OLU s;en cj "tJ1—
1
i'V^IID -a <Q o
OO o-s .§ 5 2=n» ^ x*c -vdu~i
S cj cj <v +? ^•z. LUO a; o o *e oo o^-<> 3ss:
c cJ . , SX -^ cJ +v
»—
t
•>) sx1— <? O S<c •<> Si. o
co -v oc_)1—
1
i—
t
s i ~c ^ 2 o »i Ts *eo O NO^O "=*• cJ tt)^: S . a) oLU C_) O O ^-*e p."Od *~ *e sQ-00
LUO -s;z. 3 ~§<c tis: 3 - ^ s;
q: cj «oU- 3 3"S • -5 -T3o: cj O c;
o 2 si S •LU S a) oQ_ cj oo <^> •^ S ti 2 s;
c^ o <? aOL ti cJLU • c^ • Oz. +-> sx~cs VLU sz -o cJ S3 <)^ Si. Ci)
1—oo LU
a)E
o =^5
O cj O
a) C '^ «N>~C3 'vj cj . -£J S=
-Ci O s; cj«C a: CDu_ CD s- ~CS +V O »o "CJ
^ QLU Z3 oJ s: ci) ^ ^4- cj -W t- cO
c^ ^ d d) ^ §a: o N a 3h- ai S- "§3 3 X3 S2_ « so D_ ^s: Q_<c o ci) ci cj
c* ^> SS Si. cj cj Si. cJ
Q •
Z Csj
<C < < Ci)
<C LU e* «n)LU q; P -Qa: < s ,«d< <
>.uo
r-
Ll_ s:O[q s >,
•v
>- E "Ci
cc <+- <D CD -Q Cl)
<=C o n3 CO •- E s;
s: CO +J CD •vs: ••
I/) O "3 CO S3ZD 4-> +J (T3 CO Cj
00 - to CDO
"d
(ro s
COsz
CD C•i- CD <D •^
• s o I— +-) "O C+J u Q. 10 CD CD cJ
c Q. (O •r- +-> Oo l— ^// * CD CO 4- i— CO s;O 00 » * U "^^ CL fC cJ
LU I / c CO CD Q.4- d1— s
<1J • i— ra Cr-, \ J /
rs o *-> CD cj
>- v^ ^s * cr +J U3 i— -<?
LU _J00
^^^^^^^^^^™~b
CDto
CDr— -M
1 CD_1
^^ VCQ (— s: CD •r—
3< oo LU * +J CO i
—
CO CO1— LU OO / i / CO +-> Q. -»-> v
I— OO 1 V 0) co E CO "Oe£ +-> CD O CD C v
s*00' A\ I— u 1— fO •<O y^ ^y^\\m * < tv^ LU i—t—
i
^ CH • • s^ V < fC -Q -<LU S
h- "«
00 V • •
<C S ooLl_ . LU
I—. o
,
—
z1
12

NOTE:
TABLE 2. AMTRAK AND AREA FASTENER QUALIFICATION TEST SEQUENCES
(a) Amtrak Sequence
Toe load measurements are to be made before and after all tests in
the sequence below. Tests will be performed on both rail seats ofa tie/fastener assembly. Fastening Insert Test will be performed onone rail seat prior to beginning the sequence.
Fastening assembly test
Rail clip load/deflection test
Tie pad load/deflection test
1.
2.
3.
4.
5.
6.
7.
8.
9.
10.
11.
12.
13.
14.
15.
Electrical impedance test
Fastening uplift test
Fastening longitudinal restraint test
Fastening repeated loads test
Fastening uplift test
Fastening longitudinal restraint test
Fastening push-pull test
Fastening uplift test
Fastening longitudinal restraint test
Electrical impedance test
Rail clip load/deflection test
Tie pad load/deflection test
(b) AREA Sequence
(1) Tests on a Completely Equipped Tie (2) Tests on a Tie Block
a. Fastening Insert Test
b. Fastening Uplift Test
a. Fastening Repeated Load Test
c. Electrical Resistance andImpedance Test
b. Fastening LongitudinalRestraint Test
c. Fastening Lateral
Restraint Test
13

REVIEW OF EXISTING FASTENER TEST DATA
Available data from the preceding qualification tests and otherstudies were reviewed to determine the areas where performance improvementsappear most needed. Data summary tables are compiled in Appendix A. Themajor problems indicated by the data are discussed in the following sections
Rail Clip Force-Deflection Properties
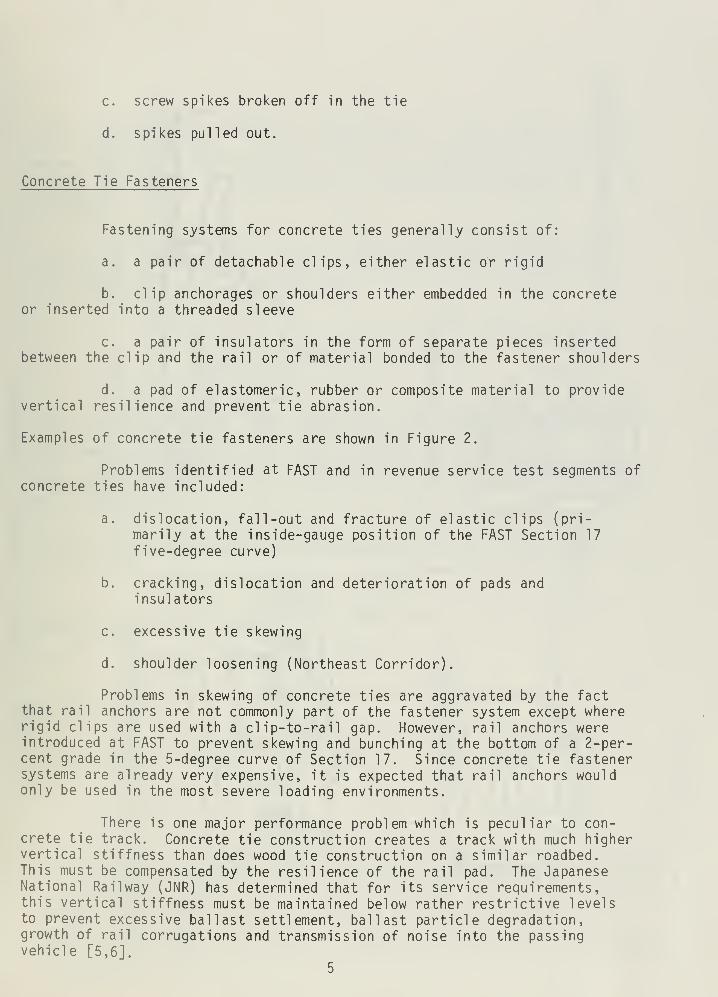
SPRING RATE AT1WSTAUEP PEFLECT10M
[Data In Table, A- 1
)
VERTICAL CLIP QUIICTIOH (INCH
FIGURE 3. CLIP FORCE-DEFLECTION PROPERTIES
A large and uniform clip force (toe load) is required at installeddeflection to prevent longitudinal rail/tie creep. Therefore, the nominalclip toe load should be sufficiently below the yield point of the clip to
assure that dynamic displacements and construction tolerances will not causeyielding. For two clip designs, clip force-deflection data are availablefrom tests conducted before and after repeated loads tests (Table A-l).
Permanent deformation is indicated in both cases by a loss of toe load and a
reduction of the clip deflection produced by installation. The results showa definite need to identify the force at which the clip yields and for a
criterion which limits the nominal clip toe load to a percentage of yield
load.
Tie Pad Stiffness
Figure 4 illustrates two current methods of measuring tie pad
stiffness. There is an uplift test requirement in both the AREA and Amtrakseries; the Amtrak tests develop a compressive curve up to 44 kips plus the
14

precompression load but apply no spring rate requirement to it. The compres-sive spring rate is being used as an index of compressive stiffness for aninvestigation of the effect of pad stiffness on the attenuation of impactstrains in concrete ties [9]. Experience to date indicates that neither ofthe two methods provides a good predictor of the other. Pad stiffness foreither method can vary substantially with load and rate of application.
Spiing Rate. ~ noo •
(Data In Tables A- 2 and A- 3)
CompJieAA4,v&
Spring Roto.
PAP
10AP
(LB)
VERTICAL UPLIFT PEFLECTION (INCH
PAP COMPRESSIONSPRING RATE
PAP PEFLECTION (INCH
FIGURE 4. TWO METHODS FOR MEASURING TIE PAD STIFFNESS
Several conflicting issues are involved in the selection of an
optimum pad stiffness for a given track and traffic. All of the issuesinvolve the compressive load-deflection properties of the pad, either for
normal wheel passage or for abnormal wheel load conditions. The issues are:
a. Protection of concrete ties against cracking . Recent discover-
ies of rail seat cracks in concrete ties on the Northeast Corridor (NEC) andin other revenue service test segments have made protection against crackinqan issue. Rail seat cracking occurs where conditions of track support andtraffic combine to produce high levels of impact strain in the ties. The
15

cracks can lead to tie failure. In a concurrent Battel le study, it has beendetermined that a flexible pad can significantly attenuate impact-producedtie strain [9]. Such pads must have a dynamically measured* compressivespring rate between 500,000 and 1,000,000 lb/in compared with a value of5 million lb/in for the EVA tie pad currently used on the NEC.
In general, the compressive spring rate of Figure 4 has provided a
good indicator of impact strain attenuation. However, where the pad is
shaped so that its load-deflection curve turns sharply upward in the regionabove 10,000 pounds, the attenuation of large impact loads will be much lessthan expected based on data from the compression test. Therefore, whereimpact loads are a principal issue, spring rates measured at a highpad load range (40,000 - 50,000 pounds) may be required.
b. Maintenance of ballast support conditions . The JNR [5] hasestablished criteria for tie pad stiffness based on the rate at which sur-facing maintenance is required. Its recommended stiffness for the NECtrack is approximately one-fifth that of the present NEC pad. The JNR measuresstiffness between compressive loads of 1 and 10 metric tons (2200 - 22,000pounds)
.
c. Limiting Rail/Tie Deflection . Laboratory tests of pad stiff-ness vs. rail/tie deflection show a sharp interdependence where tests areconducted on a single fastener system. In this case the bending and torsionof the rail cannot resist the deflection and distribute load to adjacentfasteners. However, the results of measurements on the 5-degree curveof concrete tie track at FAST [2] indicate that pad stiffness may have \/ery
little effect on the magnitudes of rail/tie deflections. Although data fromother locations are required to verify this finding, it is possible that
this issue is much less important than commonly believed.
d. Pad Durabil ity . In general, the hard pad materials (polyethylene,polyurethane, EVA, hard Neoprene) are more resistant to permanent compression,abrasion, and tearing than are most softer materials (soft Neoprene and
rubber). The grooving and shaping of pads, which is often required to producespring rates below 1,000,000 lb/in, may also contribute to pad deterioration,especially where rail rollover causes loading of the pad by the edge of the
rail. A grooved pad has less area to resist this concentrated load.
Fastener Longitudinal Restraint
Specifications of longitudinal restraint tests for concrete tiefasteners require the fastener system to sustain 2400 pounds without slip.
Data in Table A-4 show that some fastener systems cannot consistently meetthis requirement, particularly after being subjected to the repeated loadsand push-pull tests of the Amtrak series. In addition, there are indications
* Slope of the load-deflection curve between 4,000 and 20,000 pounds forloading applied at 9-10 cycles per second.
16

from experience on the South African Railway (SAR) that even higher levels of
restraint are required to prevent tie skewing and rail creep under severeconditions in service [10]. The SAR cites a significant improvement in
fastener performance when the average toe load was increased from 1800-1900
pounds to 2600 pounds. The longitudinal restraint produced by a pair of
clips usually approximates the toe load of a single clip. Figure 5 is a
schematic of the method for measuring longitudinal restraint.
{Data -in Table. A-
4
LONGITUDINALLOAD
DISPLACEMENTTRANSDUCERS
FIGURE 5. MEASUREMENT OF LONGITUDINAL RESTRAINT
Fastener Lateral/Rollover Restraint
LATERALRESTRAINT TEST
VERTICAL APPLIED LOAD(VARIABLE)
20.5 Kips
ROLLOVER RESTRAINTTEST
[data -in Tables A- 5 and k-6\
FIGURE 6. MEASUREMENT OF FASTENER LATERAL AND ROLLOVER RESTRAINT
The final test of the AREA series (No. 6 of Table 1) applies loads(Figure 6) to a rail segment which is mounted on a tie block oriented at an L/Vangle of 30 degrees. Lateral displacement of the rail base is limited to 1/8inch at a load of 41 kips, while the rollover displacement (difference betweenrail head and rail base lateral displacements) is limited to 1/4 inch at20.5 kips. The data of Tables A-5 and A-6 show that: (1) the lateral dis-placement of the rail base was easily constrained by all systems tested, and
(2) the rollover displacement requirements were also met by all systemstested, but rollover results were highly dependent on pad stiffness and onthe geometry of the rail cross-section. However, the field measurements atFAST (discussed later) show that there is not necessarily a direct dependencebetween pad stiffness and rail/tie displacement in track.
17

This test would constitute a determining factor in the qualifica-tion of a fastener system only if a clip were to break under the high roll-
over displacements imposed during the qualification for lateral rail basedisplacement. This test requires loads up to 41 kips, and Table A-5 showsthat it caused rollover displacements up to 0.4 inches. Most clips will
yield under much lower displacements [2].
Lateral and LongitudinalRestraint of Wood Tie Fasteners
Table 3 presents results of lateral and longitudinal restrainttests conducted on a 4-tie panel of wood ties. The fastener systems rangefrom the standard 4 cut spikes per plate to several advanced configurationswhich incorporate elastic or rigid clips and screw or lock spikes. One con-figuration includes rail anchors on two of the four ties in the panel.Longitudinal restraint loads, developed before the rail slipped by one inch,range from the expected near-zero levels for cut spikes without anchors to
6310 pounds per rail seat for a combination of rigid clips and screw spikes.The configuration with rail anchors produced only 3735 pounds per rail seat.It is significant that 6 of the 8 nonconventional systems without rail anchorsproduced restraint loads higher than this level, ranging from 7 to 68 percent.However, these results do not reflect the demonstrated loss of restraintloads by clip-type fasteners when installed in track.
To measure lateral restraint, the test panel was subjected to rail-to-rail lateral load until the gauge was widened by 1 inch. An exception wasmade in the test of the K-fastener, where the test was suspended at a total
load of 31,500 pounds with a lateral deflection of 0.58 inches. The deflectionwas caused by the tie bending rather than by fastener failure. The maximumload was more than three times the load which failed Configuration 1, thestandard arrangement of four cut spikes per plate. In contrast to the per-formance of the K-fastener, five of the nonconventional configurationsproduced inceases in resistance over the standard fastener ranging from 41 to
64 percent. These values can be compared with a 27 percent addition producedby the addition of a single cut spike.
Figure 7 shows the results of tests conducted in Europe [12] whereit was demonstrated that the application of a single static load may be a
poor measure of longitudinal restraint under vibration simulating train action.Tests involved a common elastic clip fastener with a hard masonite pad placedover a steel tie plate on a wood tie. A vibrator was attached to the rail to
simulate rail vibration in parallel with the statically applied vertical and
lateral wheel loads. Results with and without vibration are shown in Fig-ure 7. The vibration had the effect of reducing the mean longitudinal load
at the initiation of slip from about 1600 kg to about 800 kg (3500 to
1750 pounds). If this effect should be consistently produced in the labora-tory, the addition of vibration to the longitudinal restraint test shouldbe seriously considered.
18

Si
-i S
— LU O O2 W Q.01
«t CO
h-oo
00
<:q;h-ooLUcc:
00J—00
o =
IB 3
c_3
41a. -o
co co<_> 01
0) r—UJ Ol oS
COb
- n ' $i- -* «* uOl -i- Q. C5 00
•r- <4-* cj cCO jtITJ 0> cu. J- O co
u r- Ol:*: co l/l -^
CO •>-
11Ol Q.i. CO
1-CD CD
O 3O <_>
— * cm 1*1
Ifl
OlCO
TJ 0)J£
CL a. CL. -r-CL D-CO : CO
CJ 01 CJ CO cos >* se B 01 >— Olo cc O co O 1/1 E. , C
•r- Ol ,- O) u 1 owi -* l/l CO CO CO
l/l c l/l -»- i/i •»- a. a.o> 1- O) a O) Q.
i- CO C CO
e f a. CLE 4->
CJ £ CJ E o S-
O ITJ O 3 O 3 LU 0) UJ OfCJ CJ <_> CJ O CD O CD a. =c
CM CM CM CM <— CM CM M- CM *3" cm co
l/l (/I
Ol o>
O c: -Q
10 <uoi i-i— +j
QZ OO<t LU
I—
I
C3H-•—
i Q2:0LU OOSO
LUCD O0
CC LU
U_0_oLU
00 1—1
I— I—__1 I
OOLUZ
CO
CO
00I—00
OLI—O0LUen
1—
1
IT)
I—1—
1
CD
o
CJ
00Q. Z>- =1_l O tdco a. •VJ(— 1 r^
1— C>UJ <£CJ UJCC COOCl 1
-J <a: a:z•— ceO UJ ro=3 O. CD
a;•1—
\— cC\J
M- 1
O Ca> ca 1
—
rr 1
ro +->
+J COCO ro
•1
—
1
—
CO 1
—
ai roCC CO
s *
L.1
i-
OCO U 1/1
101 J= 01 -C
1/1 01 O 1/1 01 (^ t. - <-> c_ —
:
M CO JC Ol C -^ T3 Ol O CO ' -i- C •i- cOl •- CL Cl CL O f— 4) -r- ID H JC Ol C _l < —1 <tc a.01 CO #— 1/1 2^
•>- C O^ < 31C D01 CO . CL
cc 1- x:
* IT)
' 1 1 1 1
+-> cj 01 CJ CJ «J
— 01
„ c
<C —1<— C Ol
co x _* 1 co S 1 1 c * •r- J)*; 2 1 1/) CO t/1 t/1
03 0) Sa c c « Ol ' ' <: c S_ •!- Ol c 1 CU CD 01 01U. c O co O CO U. c \A t/> IC CL CL l/l c (/I -* -^ ^L -^
*- CI t- o> — 01 Cc (J 01 Ol r— D_ CO CO CL CJ •1- 01i^ CO (/I L/l Ji m -i- LT> CO ,S!
Cc 1" -i«: Ji -r- 1_ 1- CO (/> ^£ 1 CC CL CL CLto C l/> -r- •r- •!- 10 +J r— C O l/l •»- CO CO CO CO
c c ai •- Ol O. 01 CL C CJ c •- c CL Q- or U1 O ••- -C CJ c to CD CLITS (O c 0. t. CO 1- CO m <a »— (O co co a C Q. U to 01 I- CO 1 4-> +-> 4-> 4-»
EE CL Ci*j
Cc ElJE CJ E C h- T3 l_ C E a Q. Cc 3 3 3 3E f E 4-> *J 4-> n- c -^ <: cu c E -^ 4-1 I CJ CJ CJ O
Ol 01 O « O 3 O 3 Ol Ol UJ 01 3 3 10 c fO *o • 01 a O 1— 3CD CD
CM «3-
CJ ICM CM
CJCJ
CM CM
CJ CJ
CM ro
CD O CD
f— f— «T
Q CD
cm *r
CJ CJ Cc •.-
CM CM CM
a- dz 1
CM CO
Q CD
CM <J"
CO CJ CJ CJ
.— CM
CM CO CM CM
II 1 1 «
19

1
l— \ \lt—
i
3 \ \\Q
\ \\o_l 1
l\\-J<
*v1—4QZD Aj\
"—
t~ ZM*^ o
<-D _ in . 1
00 n*—' Ci uu '. \ IH
m\ ___ro D.
O _J
< d; z 1
1
>- LU 2 \\ a o-j<oi—
i
i—
i—
y 1-LUCO
Oh.
,
1 1«l
1 t
ooIT)
oooCM
ooU">
oooooLO
(6>|) 3DcJ0J d33U3
QOro t O3
LUs: zLU oC_>
<t C£-J — LUQ. ID ZCO O LU
CM —
>
n: i—a I— u-iHH<D_ 3U_LULU Q D_C£. z: —.O <t _i
<_>31
i— 1— OH^ 1-^
3 1—CO
LU <£O _lZ LU<1— u_
O OO O1—
(
CO COLU 1—Q£ CO
LU_J h-<z zt-.cCQ LU=> Q.1— Oi—i OLCD ID
IT) Z LUO^—_1 zu_ oO i-"
1—ZcCOQ£
^d-CO QQi—i •—
i
Cd ><D 1
*^^ 2: •—P o«=tfc <_> Q£
—ID.CO
C\J i—
i
oQ_LULUq:o
(6l) 30d0d d33cJD
20

FASTENER PERFORMANCE EXPERIMENTS
In an effort to develop fastener qualification requirements whichwould provide correlation between observed laboratory and service performance,Battel le conducted an experimental program in three phases:
a. Rail/tie deflections and fastener clip strains weremeasured at FAST to define representative, severefastener loading environments. This effort is
described in Reference 1
.
b. Static measurements of fastener load-deflectioncharacteristics were conducted in the laboratoryto:
(1) determine the load combinations requiredto reproduce the maximum strains anddeflections measured at FAST
(2) compare the track-measured strains and
deflections with those produced duringconduct of current qualification tests
(3) examine the current methods of determiningbasic clip and pad characteristics.
c. Fatigue tests were conducted on one concrete tie
fastener system and one wood tie fastener system,both of which are among the types used at FAST.
This was done to compare the results of the testswith performance observed in service.
The following sections discuss the results of these experiments as theyrelate to the development of fastener performance requirements.
Track Measurements at FAST
To define severe fastener loading environments which could besimulated in the laboratory, rail/tie deflections and fastener clip strainswere measured on 5-degree curves of concrete and wood tie track at FAST.Two concrete tie fasteners and two wood tie fasteners were examined,Figures 8(a) and 8(b). Measurements were made at three sites in eachfastener subsection. Each fastener used an elastic clip to constrain thera i 1
.
Deflection measurements, Figure 8(c), consisted of three verticalrail/tie deflections at the rail base, one lateral at the rail base, onelateral at the rail head, and one longitudinal. In one subsection of eachtype of track where a common clip (Type A) was installed, fastener clipstrains were also measured. The instrumentation of clips to measure strainis described in Appendix B.
21

Type A Clip Elastic Clip/Spike Type A Clip
(a) Concrete Tie Fasteners (b) Wood Tie Fasteners
/ !
lf>_<
I' j
Attaakrmnt to T-le.
/ i
/ /
B-
(c) Rail/Tie Deflection Measurements
FIGURE 8. FIELD MEASUREMENTS AT FAST: FASTENER TYPES
AND DISPLACEMENT COMPONENTS
22

Train loads were produced by a consist of two locomotives andtwenty loaded 100-ton hopper cars. Train runs were made in both clockwiseand counterclockwise directions for measurements in the concrete tie section,where a 2-percent grade contributed to greater deflections for counterclock-wise (upgrade) travel. Only clockwise runs were made over the wood tiesection where the grade and its effect were much lower.
The major results of the track measurements were:
a. Peak lateral deflections between the rail head and tie approached0.100 inches on both types of track.
b. Vertical rail/tie deflections of rail clips in the concretetie section approached 0.040 inches in both gauge side uplift and field sidecompression.
c. Measurements in the concrete tie section were made in a sub-section containing a very rigid polyethylene pad (7.5 million lb/in springrate) and in a subsection containing a relatively flexible pad (1.3 millionlb/in spring rate). Peak deflections were about 30 percent higher for thehard pad than for the soft pad.
d. Vertical rail/tie deflections in the wood tie section reached0.100 inches in field side compression. However, where the fastener clipwas attached to the tie plate (Type A clip), most of the vertical deflectiontook place through tie plate bending rather than through clip deflection.
The peak vertical rail /tie deflections at the fastener clips werecalculated from the three vertical deflection measurements illustrated in
Figure 8(c). The data points in Figure 9 summarize the peak vertical deflec-tions and the simultaneously occurring peak clip strains for the Type A
clip. The next section compares the measured data with the strain-deflectionrelationships measured in the laboratory and also shown in Figure 9.
Clip Force-Deflection-Strain Characteristics
Comparison With Track Measurements
Track measurements of clip strain vs. clip deflection were comparedwith similar data produced by two laboratory methods:
Method 1 - by vertical loading of an individual clip, as
described in Appendix C
Method 2 - by loading through a rail segment to simulatethe lateral and vertical components experiencedin track. The lateral restraint fixture used for
this purpose is shown later in Figure 19.
23

(1 Volt = 166 microinches/inch)
-5
-6
-7
Ctip StucU.n-Ve.file.cXAjjn ToAt
— [hleXhod 1) — TRACK MEASUREMENTS
O Gauge Clip
Field Clip
60 -50 -40 -30 -20 -10 10 20 30 40 50 60 70
CLIP DEFLECTION (MILS)
FIGURE 9. VERTICAL CLIP DEFLECTION VS. CLIP STRAIN FROM TRACK MEASUREMENTS
AND TWO LABORATORY TESTS
24

Figure 9 shows schematics of the two loading arrangements and the threestrain-deflection relationships. The results show that:
a. The peak clip strain level was found in the track atvertical deflections between 0.030 inches and 0.037inches of vertical rail/tie deflection
b. The reproduction of this peak clip strain required over0.060 inches of vertical clip deflection by Method 1 butonly 0.038 inches by Method 2. The clip strain-deflectionrelationship obtained from Method 2 correlates with the
field results much better than does that of Method 1.
It can be concluded that the clip receives substantialstrain from lateral loading as well as from verticalloading when installed in track. Thus, the verticalrail/tie deflection of the clip will not provide a goodindicator of the level of clip strain.
The data in Figure 9 can be used to explain an apparent anomalybetween the field measurements of rail/tie deflection and the results offatigue tests conducted by the clip manufacturer [13]. It is known thatsubstantial numbers of these clips have fractured in service on the 5-degreecurve of the concrete tie section at FAST. Therefore, the clip strainsexperienced in track must exceed the fatigue limit of the clip.
The manufacturer subjected the clip to fatigue tests with a loadingarrangement equivalent to that of Method 1. Tests were conducted by imposingcyclic vertical deflections (measured relative to the nominal installed clipposition) at levels of 0.020 to 0.060 inches in 0.010-inch increments. Witha 2000-pound toe load and cyclic deflection of 0.050 inches, the clips didnot fail in tests up to 15 million cycles. With the same toe load and cyclicdeflection of 0.060 inches, the clips failed in less than one million cycles.An increase in toe load to 2400 pounds caused failures within one millioncycles at 0.040 inches of cyclic deflection.
Clip toe loads measured by the manufacturer at FAST did not exceed1580 pounds [14]. The vertical rail /tie deflections measured under thisprogram did not exceed 0.037 inches. However, the fatigue limit of many ofthe clips in track was exceeded. The apparent anomaly between service per-formance and the manufacturer's fatigue tests can be explained by observingthe differences in strain levels produced by the previously described lab-
oratory Methods 1 and 2. It is evident that the clip strain levels imposedby combined vertical and lateral loads, either in track or simulated in thelaboratory (Method 2) do exceed the fatigue limit of some of the Type Aclips. This limit is reached at 3.0-3.5 volts clip strain on the scale of Fig-ure 9, or 0.050-0.060 inches deflection by Method 1.
Method of Determining Clip Yield Load
A simple and repeatable method for determining the vertical yieldload of an individual clip was suggested by a manufacturer* and duplicated
*Portec, Inc.
25

at Battel le. The method requires a fixture for the vertical loading of anindividual clip, such as the arrangement described in Appendix C, and a
vernier caliper or dial gauge capable of displacement measurements to 0.001inches. The following procedure is used:
a. Place the clip on a flat surface and measure theheight of the clip toe or other characteristicdimension.
b. Select a value of vertical force which is knownto be less than the yield load. Apply the verticalload to this point and release it. Typical load-deflection curves are shown in Figure 10.
c. Repeat step a.
d. Repeat step b with the load increased by 100-200 pounds.
This process is continued until the characteristic dimension beginsto change and several post-yield points are collected. Straight-line curvefits of pre-yield and post-yield data will intersect at the yield load.Typical data for 2 types of clips are illustrated in Figure 11.
The clip yield load should be compared with the nominal toe loadof the clip. A sufficient margin between toe load and yield load should be
maintained to assure that yield will not occur under the worst combinationsof displacements produced by train loads and construction/assembly tolerances.
Tie Pad Compression Tests
The fixture shown in Figure 12 has been used to perform both staticand dynamic compression load tests on a wide variety of pads which differ in
material, thickness and shape factor (grooving or molding to reduce stiffness).Examples of pad stiffness are shown in Figure 13 through 15. Some generaltrends from the tests were:
a. Compressive stiffness is highly dependent on the rate of loadingfor some pads but almost independent of loading rate for others. Extremes areshown in Figure 14 (dependent) and Figure 15 (independent). In general, thehard pad materials (polyethylene, polyurethane, EVA) have stiffnesses whichare relatively independent of loading rate. Neoprene is relatively independentexcept where severe shaping causes a sharp change in stiffness as the pad is
compressed. A loading rate of 10 cycles per second is recommended.
b. Load-deflection curves should never be recorded until at leastseveral complete load cycles have been applied, even when the load applica-tion is quasistatic. Load cycles should vary from low load to the maximumdesired, rather than from zero load to maximum load. Substantial differenceswill occur in any definition of the "zero" load-deflection point.
c. Shaping of pads to achieve flexibility (lower stiffness) canbe detrimental to the objective of tie impact load attenuation if the shaping
26
3600
3200
2800
2400
Q
2 2000
Oo
1600
1200
800
400
FIGURE 10.
0.2 0.3 0.4
VERTICAL CLIP DEFLECTION (INCH)
TYPICAL CLIP FORCE-DEFLECTION CHARACTERISTICS
27
0.5 0.6

1.585
c_>
cd 1.580i—
i
LU
LUO
1.575
14
CLIP TOE HEIGHTCLIPLOAD
>^^~
^"^
•\ r^
— c^ ^ J ^-> ^J
. ._ . l
16 18 20 22 24 26 28
MAXIMUM CLIP LOAD FOR EACH TEST (HUNDREDS OF POUNDS)
5 0.090
uj enCD LU
0.080
0.070
23 0.060
14
z^yCLIP CENTER HEIGHT
16 18 20 22 24 26
MAXIMUM CLIP LOAD FOR EACH TEST (HUNDREDS OF POUNDS)
FIGURE 11. DETERMINATION OF CLIP YIELD POINT FOR TWO CLIPS
28

FIGURE 12. LOADING ARRANGEMENT FOR TIE PAD COMPRESSION TESTS
29

35
30
25
2.0
QO
o
15
10
1 c YCLE/MIN O.i i CYCLES/SEC 1 CYCLE/SEC
— t
11
CO 1
1
I
°-l
i
J 1r
i0.010"
COMPRESSIVE DEFLECTION
FIGURE 13. VERTICAL LOAD-DEFLECTION CHARACTERISTICSFOR THE POLYETHYLENE PAD
30

COQ
ooo
oCOi—
i
C£LU
<"-^. J—co oLUDC 2(_) «=rz re•—
1
ozz oo h-
*
t—
1
1—»— oo LULU _l-J u.LU- LULU oQ 1QO <x< oD. _J
_l 7"<C oo
CJ>-oLu.o\—
(sdi>i) avtn avd ivoiib3A
31

40
30
c
<O
w 20
toioLJ
Q-s:oo
10
COMPRESSIVE DEFLECTIW
FIGURE 15. EFFECT OF CYCLE RATE ON LOAD-DEFLECTION
CHARACTERISTICS OF GROOVED SYNTHETIC RUBBER PAD
32

does not allow for the gradual transition of stiffness with increase in
compression. The pad shown in Figure 14 is made of moderate durometer mate-rial and is grooved to achieve a radical shape factor. However, the padgrooves "bottom" at less than 15,000 pounds. The effectiveness of this pad inattenuating large impact loads is quite low in comparison to other pads withapproximately the same average stiffness [9]. This experimental pad shape hasbeen abandoned by the manufacturer.
Longitudinal Restraint Tests
Longitudinal restraint tests were conducted to determine whether a
dependence could be found between longitudinal restraint and either (1) tiepad stiffness, or (2) the presence or lack of external insulators. It wasquickly discovered that the dependence of longitudinal restraint on any singletest factor was very difficult to isolate. Problems encountered in thedevelopment of an acceptable test procedure are discussed as follows.
Early trials with the fixture of Figure 16(a) revealed that thefastener clips could not be depended upon to provide consistent toe loads.
Successive tests with the same pad resulted in losses of longitudinal slipload by up to 15 percent. The installation and removal of clips caused clipdeformation and wear of the fastener shoulders and insulators. Whereinsulators were not used, the clip toe and rail base became polished. There-fore, it was necessary to devise a method of applying controlled verticalloads to the clip toe areas of the rail base. This was done with the fixtureshown in Figure 16(b). Controlled vertical loads were applied by a mechan-ical test machine to a fixture with two bearing surfaces which simulated toeloads. The vertical load was applied through rollers to prevent reactionof longitudinal load by the vertical load fixture. Also, the vertical fix-ture was constrained against longitudinal displacement by reaction of thefixture against the fastener shoulders. Longitudinal load was applied andmeasured by placing a hand-pumped hydraulic cylinder in line with the loadcell.
After vertical load control was established, it was found that testrepetitions with the same pad and insulator would not consistently providethe same results. A sequence of tests yielded a general downward drift oflongitudinal restraint under identical test inputs. To maintain comparablevalues of slip load, it was necessary to change the test specimens (pads andinsulators) after each measurement. This process was continued until threevalues of slip load were obtained for each combination of pad, insulatorand vertical applied load. The mean of slip loads obtained with identicaltest inputs was used to form comparisons.
Figure 17 presents the results of tests conducted on two pads whichrepresent extremes in pad stiffness and coefficient of friction among thosetested. The two pads also produced extremes in longitudinal slip load as a
function of vertical applied load. Tests were run with and without insulatorsof the metal -plastic shim type. The tests with insulators yielded higherloads for both pads, but the difference with and without insulators was muchgreater for the rigid pad than for the flexible pad. It is possible that thedifference in longitudinal stiffness of the two pads causes the insulators tointeract differently.
33

(a) Toe Load Provided by Clips
(b) Toe Load Provided by Test Machine
FIGURE 16. LOADING FIXTURES USED FOR LONGITUDINAL RESTRAINT TESTS
34

(
//
/GROOVED DURAFLEX PAD
WITH INSULATORS —
x
i i X/o /
/
W I THOU T INSULATORS •»—^
™
y/
^ /
/ l/
>y
/
&/r// -
>\
if
A
ft1 y
i!\ ,<\ POLYETHYLENE f>AD
<&y /* >
*A
o xy*
vT.WITH INSULATORS
ITHOUT INSULATORS
(£////
r
/Y
/
Fa
y/t S
y
//V S/
/
s/
fss
1000 2000 3000 4000
VERTICAL LOAD (LB)
5000 6000
FIGURE 17. INFLUENCE OF PADS AND INSULATORS ON LONGITUDINALRESTRAINT OF CONCRETE TIE FASTENERS
35

While the two pads vary widely in stiffness, they also differ in
the shape and texture of the bearing surfaces. The polyethylene pad has
solid and very smooth bearing surfaces. The Duraflex pad is made of a softpolymer with a comparatively rough surface texture and is grooved to lowerstiffness. Typically, the Duraflex pad would permit about twice the longi-tudinal rail -tie deflection before the onset of slip (0.010 inches vs. 0.005inches for 4000-pound vertical load). This longitudinal flexibility couldbe a significant factor in the creep resistance of installed ties. The FASTmeasurements described earlier showed that longitudinal rail/tie deflectionsunder train loads did not exceed 0.010 inches.
Similar longitudinal restraint results are shown in Figure 18 forthe wood tie fastener which uses a Type A clip. The restraint at a givenvertical load falls between those of the concrete tie fasteners shown in theprevious figure. However, it should be noted that the onset of slip is
almost instantaneous for this case where the rail contacts a steel tie plate.Most measured deflections before slip fell below 0.0002 inches. The system hasno flexibility to permit longitudinal rail/tie deflection without slip.
Lateral /Roll over Restraint Tests
Lateral/rollover tests were conducted with a range of L/V anglesfrom 20 to 30 degrees and with pads of varying stiffness. The primary pur-
pose of this effort was to determine the combinations of load and L/V anglewhich could most closely simulate the maximum rail/tie deflections and clipstrains found in the FAST measurements. This also provided an opportunityto evaluate the current qualification tests for lateral/rollover restraint and
repeated loads.
The fixture used to vary the L/V angle, apply vertical loads, andmeasure rail/tie deflections is illustrated in Figure 19. Curves for rail
head lateral displacement and gauge clip uplift are shown in Figure 20 forthe rigid polyethylene pad and in Figure 21 for the flexible synthetic rubber
pad. These pads were installed in the FAST concrete tie subsections wherefield measurements were made.
The data display strong influences of both L/V angle and pad stiff-ness on rail head lateral displacement and gauge clip uplift. Since rail
base lateral displacements were relatively small, the rail head lateraldisplacement provides a good indicator of rail rollover. The load range waslimited to avoid destroying the clips. However, the data indicate that the
flexible pad may not have limited the rail to the rollover restriction of
0.25 inches rollover displacement with the vertical load of 20.5 kips appliedat a 30-degree angle. It should be noted that this rubber pad is not among
36

4000
50001000 2000 3000 4000
TOTAL VERTICAL LOAD (LB)
FIGURE 18. LONGITUDINAL RESTRAINT OF WOOD TIE FASTENER SYSTEM
37
6000

rrcr/
zzzzzr
o.
o
FIGURE 19 LOADING AND MEASUREMENT SCHEMATIC FOR
LATERAL/ROLLOVER RESTRAINT TESTS
38

I
VQQ. (vr ""
,_.r^.o y _#^C^^^
—
LU: ^•^^^"v V^
i
—
_lQ.> ZL
'^>-<^^^ x\_v" _z A1 O
i—
i
< T D
LU I— >» \ ..^ ^^ ' _2T OLU LU _i ^^_J _l>- U_ __.-,
n: LUl— QLU>- _) __l <O C_Q_ LU
I—<Q
-
<cz: LUo DC
I
«t t—
I
C_) <I—
I
c_ __,
_lQ_Q-<c -
Q<O_J
oLUQ
Io^ eno1—
1
z 1—o ot—
1
LU2t 1— _l LU\o o u_ CJ3 \ _
LU LU r_> _X1— _1 Q
<=C \<c U_ cs 2:C_) LU 1 «_
1—
1
Q < _i i—
i
_l CtL<=C h-
D_ LU LU c_>
Q_ CJ3 1— i—I LU __,
<<:
I— —Icm u_Q
_-f
o1—1
LU LU
o "_i" <:_l o
1—
1
LUIE
o h- _lLU ai i—
i
1
LU> c_oCM
1
^^ ___
'
J _____ - — -. — —
—
_____-1 —7^>T-^
1 1i— 1
—
— I I II I |
LOCvl
Ocm
LD
OO
C_CD
OCO
<oC\J
00I—
c_I—00LUC_
c_
o
c_> _r<C lu_i 5:Q_ LUo w
.— .-. <• Q _l
Q. Q_J OO «C<| I—1 Q.c— q
OO LU> _l>-Q DC< I—O LU
o oLU Q.
C_>
loo _i Qa. c_Q- <C
oCM
o o00
oCM
(sdi>i) avoi a3nddv
39

1 —
^ -1 rcC=**= Vw-Q \>^< y^\t~LU
UJ
LU
br% —
-8!1"':
O^^ ^i\J V
LU v^21 1 s^
1*\
»-*
\ V", —\ <J>
\ v*r^ \ -i
Ot—
t
-h- \ ^
2:\ ^ _
i—
<
»—
*
\ c£1— 1
Q\ ^
CJ\ v"-
"LU " \ «3-_l < \ -Ju_LU a \ C3O sCO \ <*-
\ vjJ
_J 1
\ ^<Cd2
• \ -i ~LU CD \ ri|
—
LU \ <*-
<c O \ ^1O
co S \< *"* \LU V-,:r ^ \
"»» _i . -^ \
^^>—1<
\ £ \\ ^ \ -
2^">.
\ ^ VO \ \i—
1
1— z \*««* \ ** \
1—
1
1—
1
^^ \ y. \_1 1— *»». \ c^> \Q_ ^ \ uJ \ ^D_ LU \ \ y \< _J
U_ \ \ \O LU v \ \<O Q \\ V
1 LUCD \ _
CDZD V s \
LUO1
CD
_l \N \OCsl \ \ \
1—
H
f- \ -\ \ "cnUJ \ \\
1
>
r ~~i i
" 1 ~ r -1- -•— h-^l — 11 1 rv^
LT;
CM
o(XI
LT)
oo
DCCD
oCO
oCXI
«=c
I/O
I—l>0
l—00LUDC
dc
LU ccCJ< u__lO. 1— _OO ^st—4 1 1 1 <ca
LU_i u^<£ <r lua: _1 CD
' LU Q_ CQ• 1— *" 2
-=c •-. OC_l
LIED
LOAD
VS.
D
OVED
SYNTHETIC
LO CL OO Q. OHd CD
C\J
LUDC
CD
O OCO
OC\J
(Sdix) avoi cmiddv
40

the most flexible pads in use on mainline railroads in Europe and Japan. For
adequate attenuation of impact strain under high speed traffic, it may be
necessary to use a much softer pad [9]. The results show a need for the
evaluation of the gauge widening and rollover allowed by very flexible padson curved track under 100-ton traffic. This would provide the informationrequired for selection of rollover restraint criteria which assured tracksafety without representing an unnecessary restriction on the use of flexiblepads.
The most important information in Figures 20 and. 21 concerns the
specifications for repeated loads tests (Test 4 of Table 1). The AREArepeated load test is conducted at an L/V angle of 20 degrees, while the
effective L/V angle for the Amtrak test is 18 degrees. From Figure 20 it
can be seen that a test conducted at the 20-degree L/V angle to a maximumload of 30 kips produced about 0.015 inches of rail head lateral deflection.The results in Figure 21 for the flexible pad produced very little vertical
rail/tie deflection, although substantial rail head lateral deflectionoccurred (80 mils at 30 kips). Most of this deflection resulted from
lateral translation of the rail segment.
The vertical displacement is partially compensated in the AREAtests by the uplift load of 0.6 x pad separation load. However, the strain-deflection results presented in the next section show that the uplift loadprimarily affects field clip uplift deflection while the compressive loadprimarily affects gauge clip uplift deflection. Uplift loads were required
for the fatigue tests to produce a balance of the peak-to-peak verticalrail-to-tie deflections on the field and gauqe sides.
The lateral restraint tests indicate that the repeated loads cur-rently conducted at a 20-degree loading angle do not provide rail /tie dis-placements representative of a severe loading environment for rigid pads.
The tests also indicate that rail /tie displacements are highly sensitive to
L/V angle and pad stiffness. Given these sensitivities, it is reasonable to
assume that the tests can be affected by the details of test fixtures whichapply the same nominal loads. For example, a variation of the height of theloading rod attachment to the rail segment or the presence of pivot frictionwould change the load-deflection relationship. These problems led to theapproach, described in the following section, by which the fatigue environ-ment is directly monitored through rail/tie deflections.
Fastener Fatigue Tests
One of the major objectives of this program was to define fastenerqualification tests which could simulate the service environments of fast-eners. To define the service environments in a way which could be repro-duced in the laboratory, rail /tie deflection measurements were made on fourfastener systems installed at FAST.
Two of the fastener systems, one on concrete ties and one on woodties, had required substantial replacements of components. Each system used
41

the Type A clip. The concrete tie system had experienced clip fallouts andfractures. In addition, where flexible pads of grooved synthetic rubber orcorded rubber were installed on the concrete tie track, some abrasive wearand delamination of the pads occurred. On the wood tie system, a few of thetie plates and many of the screw spikes used with the Type A system hadfractured. The cause of all component fractures was fatigue loading.
The following subsections describe fatigue tests conducted on oneconcrete tie fastener system and one wood tie system, both of which use theType A clip. Loads and L/V angles were adjusted so that the loading arrange-ment (using an available fixture) reproduced the range of two importantrail/tie deflections measured at FAST. In each case, the tests resulted in
fatigue failures identical to some of those which have occurred at FAST.
Concrete Tie Fastener Fatigue Test
Figure 22 shows a schematic of the loading and deflection measure-ment arrangement used for the concrete tie fastener test. Details of theloading fixture are provided in Appendix A. A trial and error search wasconducted to determine the combination of L/V angle and load range whichwould most closely duplicate the rail head lateral deflection and verticalclip deflections measured at FAST.
No attempt was made to conform to the loading geometry of the AREAtest which is conducted in an approximately similar manner. It should bepointed out that in no case are the loads applied to a single fastener usinga short rail segment equivalent to the wheel/rail loads experienced in
track. Through bending and torsional resistance, the rail in track acts to
distribute loads to several adjacent ties and fasteners.
The objective of the loading arrangement was to simulate, as
closely as possible, the following combination of rail /tie deflections for
both rigid and flexible pads:
a. Gauge and field clip vertical deflection: 0.040 inchespeak-to-peak
b. Rail head lateral deflection: 0.100 inchespeak-to-peak
After initial trials with L/V angles between 20 and 27 degrees, a final
selection of 24 degrees was made. To simulate the deflection goals withinapproximately 10 percent, the following ranges of loads were required for
hard and soft pads:
a. Rigid polyethylene pad: 20 kips compression, 2400 pounds uplift
b. Flexible synthetic rubber*or grooved Duraflex pad: 13 - 16 kips compression, 1600 -
2000 lb uplift.
*This is the flexible pad used in Subsections 17-J2 and -Kl of the FAST 3-
degree curve.
42

ooono
I—
oQo
C\JC\J
CJ3
43

During the early stages of fatigue testing, frequent minor adjust-ments of load levels were required to maintain the desired deflection levels.Two changes to the loading fixture were made during this period:
a. The clevis holes were honed and a pin of hardened 4340steel was substituted for the original mild steel pin.
b. Grease fittings were added to the clevis.
These measures stabilized the loading arrangement so that the deflectionsproduced by given load levels would remain stable for 8 - 10 hours. Greasingwas performed at a maximum interval of 8 hours. A load rate of 2 cyclesper second was maintained throughout the initial trials and tests. Thisrate could have been doubled or halved without significantly affecting theshort-term load-deflection relationship. However, a slight heat buildup(about 5 degrees on the rail segment) developed at the 2 Hz rate. Thisprevented an increase in loading rate, and economics prevented a decrease in
the rate. .
Three pads were used during the test. The flexiblesynthetic rubber pad was used through 20,000 cycles when a routine inspectionwas made. The pad was badly abraded where it contacted the field side edgeof the rail base. The hard polyethylene pad was substituted and maintaineduntil 160,000 cycles were completed. No damage occurred. Finally, a flexiblegrooved Duraflex pad was inserted and retained for the duration of the test(653,000 cycles). The loads were changed as indicated previously to maintainconstant rail/tie deflections. An inspection after test completion revealedthat this pad had also compressed and abraded where it contacted the fieldside rail base. An additional circular worn area about 1 inch in diameterwas caused by a rough spot of the tie surface.
Figure 23 shows typical load-deflection and strain deflectionrelationships recorded with the Duraflex pad. These were collected bytemporary substitution of instrumented clips during shut-downs for inspectionsThe desired peak-to-peak clip vertical deflections were very nearly maintainedThe rail head lateral deflection was recorded along with the load levels on
a strip chart. The lateral peak-to-peak deflection varied between 105 and
115 mils.
At 653,000 cycles it was discovered that the clip had cracked in
the location 1 shown on Figure 24. Subsequent microscopic examination re-
vealed that a second crack had formed at location 2. Clips in track had
fractured at both of these locations. The test was terminated at this point.
-fiThe FAST train, which produced 33 x 10" MGT per axle, would develop
21.5 MGT by the passage of 653,000 axles. The first group of clip failuresin track began about 40 MGT after installation. After the track rebuild at
425 MGT, clips from two different batches began to fail immediately. Thetest clip came from one of the latter batches. The test represented a severeloading environment since the deflection levels applied in the lab occurredfor only a small percentage of axles in track. Considering possible varia-tions in clip properties and loading conditions, the degree of representationof track performance can be judged acceptable.
44

T-14Gauge Clip Field Clip
-40 30 -20 -10
(1 Volt = 166 we)
10
r£ 3
C1—
V
o 2>c
Q.
Gauge
C
o
y\
—
-1
-40 -30 -20 -10 10
s— Up-tc^ CompA..
Gauge Clip VerticalDeflection (mils)
-20 -10 10 20
- UpLL^t CompxzA6<Lcn—
*
Field Clip VerticalDeflection (mils)
FIGURE 23. TYPICAL LOAD-DEFLECTION AND STRAIN-DEFLECTION PLOTSFROM FATIGUE TEST OF CONCRETE TIE FASTENER
45

Location 1
Location
FIGURE 24. LOCATIONS OF CLIP CRACKS DEVELOPEDDURING CONCRETE TIE FATIGUE TEST
46

Wood Tie Fastener Fatigue Test
Figure 25 shows the loading schematic for the wood tie fatigue test.
The desired vertical deflections were relatively large compared to those forconcrete tie track. The rail/tie deflection goals were:
a. Rail-to-tie vertical deflection at
gauge and field clips: 0.100 inches peak-to-peak
b. Rail head lateral deflection: 0.100 inches peak-to-peak.
It was also necessary to induce most of the vertical deflection through bend-ing of the tie plate rather than through flexing of the clips. A clip strain
limit of about 1.5 volts had been seen in the track. A goal of 2 volts peak-
to-peak (about 333 microinches/inch at the measurement location) was adoptedto remain well below the strain limit of the clips (about 3.6 volts upliftstrain above the installed strain).
Loading trials with the new tie block revealed that those deflec-tion levels could not be reached within reasonable load limits withoutseverely flexing the clips. This necessitated a partial adzing of the tie
at the rail seat to reproduce the conditions observed in track, where mostof the vertical deflection took place through flexing of the tie plate overthe irregular surfaces of the service ties. The adzing was sufficient to
produce the following conditions:
a. Field clip vertical deflection: 88 mils peak-to-peak
b. Gauge clip vertical deflection: 50 mils peak-to-peak
c. Rail head lateral deflection: 60 mils peak-to-peak.
This condition was adopted since it reproduced the essential phenomena oftie-plate bending at the field side. Greater deflections would have requiredsignificantly higher loads. The loads under these conditions were:
Compression: 16 kips
Uplift: 800 pounds.
As the test proceeded, the tie surface compressed and the deflections grad-
ually increased to the following maximum values:
a. Field clip vertical deflection: 97 mils peak-to-peak
b. Gauge clip vertical deflection: 60 mils peak-to-peak
c. Rail head lateral deflection: 70 mils peak-to-peak.
The screw spikes required tightening about eyery 200,000 cycles.
47
CD
i—
Li_
00
QOO
OOt—
I
o
C3
Qo
C\J
UJen
48

The test was terminated at 1,090,000 cycles when it was discoveredthat the tie plate had fractured across its width at the location shown in
Figure 25. This was the same type of failure which had occurred in serviceat FAST [4]. However, the test simulated only 36 MGT of traffic, while theplate failures began in track at 155 MGT. The partial adzing of the tierail seat probably created more bending strain than occurred at FAST underthe same deflection levels. The test represented loading events whichoccurred in track only a small percentage of the time, but was successfulin reproducing two principal performance problems (plate fracture and spikeloosening)
.
The plate used in this study has since been redesigned andstrengthened where the fractures occurred. None of the redesigned plateshas yet been tested at FAST.
49

DISCUSSION AND RECOMMENDATIONS
The results of this study have led to recommendations for modifications,deletions, additions or retention in current form of the AREA/Amtrak fastenersystem qualification tests listed in Table 1. The recommendations are presentedand discussed as follows.
1
.
Fastening Insert Test
Retain in current form.
2. Fastening Uplift Test
The fastening uplift test provides a good indicator of the abilityof the clips to absorb uplift load and to provide a continuous level of rail
clamping force while flexing under train action. To better define fasteneruplift capacity, the following changes are recommended:
a. Clip dimensional checks of the type illustrated in Figure 11
should be made before and after the test. Retention of theoriginal clip dimension should be required within 0.005 inches.
b. The maximum uplift point should be specified in terms of an upliftdisplacement past pad separation, in a manner similar to theprocedure of the current Amtrak test. The value of 0.050 inchesuplift displacement is recommended. The tests under severeconditions at FAST revealed no requirement exceeding this value.In addition, the test should not proceed past the maximum loadof 6000 pounds. This limit will prevent the bias of the testagainst rigid fasteners.
c. For each test run, the pad separation load should be determinedas the mean of at least three successive trials. This meanload should not be allowed to vary more than 20 percent formeasurements before and after the repeated loads tests, as is
currently in the Amtrak series.
d. The current Amtrak test requires the measurement of an upliftspring rate which must fall within a specified range. Pad springrate is of interest because it indicates the ability of the pad
to absorb impact loads. However, there is no correlation betweenthe relatively low uplift loads used to measure uplift springrate and the ability of pad to absorb impact. It is recommendedthat this requirement for a uplift spring rate be deleted andthat a requirement for a compressive spring rate, measured duringthe pad compression test, be substituted.
50

3. Fastening Repeated Loads Test
The results of this study show that the current repeated loads tests
do not represent the worst fastener loading conditions identified on the FAST
track. The AREA test is conducted at an L/V angle of 20 degrees and the Amtraktest involves an effective L/V angle of 18.4 degrees. The lateral restrainttests conducted as part of this study show that such angles produce rail head
lateral deflections and vertical clip deflections much smaller than the maximumvalues found at FAST. It is recommended that the L/V angle of the repeatedloads test be set to reproduce the maximum rail-to-tie deflections expectedin service. The values used for the concrete tie fastener repeated loads testdescribed in this report were 0.040 inches peak-to-peak vertical clip deflectionand 0.100 inches peak-to-peak rail head lateral deflection. These deflectionscould be reproduced in either of the following ways:
a. Beginning with the nominal loads application of the Amtraktest, lower the vertical load until the maximum deflectionsreach the desired levels.
b. Beginning with the nominal loads application of the AREAtest, raise the plane of incline of the fastener testfixture until the desired displacement levels are attained.
4. Fastening Longitudinal Restraint Test
The current longitudinal restraint test is adequate to establishthe relative longitudinal resistance of fastener systems to thermal loadingof unoccupied track. Some improvements in test procedures are needed. Arequirement for two dial indicators [7] should be removed and replaced witha requirement for a displacement device accurate to 0.0005 inches and mountedon the centerline of the load actuator, at the opposite end of the test rail
segment. To obtain this sensitivity, the limit of slip displacement should
be defined at 0.10 inches, rather than at the current limit of 0.25 inches.
The maximum longitudinal restraint load is normally obtained with a few
mils of longitudinal displacement.
The longitudinal load should be applied to the point of slippage
or to maximum load attainment, whichever requires the higher load. The
current test stops at 2400 pounds. The extension will provide a factor for
the relative evaluation of fastener systems.
Further study is needed of the effect of vibratory loading on the
longitudinal restraint of fasteners. If vibratory loading changes the per-
formance ranking of a representative selection of fasteners, then an inde-
pendent test of longitudinal restraint under vibratory loading should be
considered.
5. Lateral Load Restraint Test
This AREA test applies loads to the test rail segment at an L/V angle
of 30 degrees. An initial load cycle to 20 kips removes the slack which may
51

exist between the rail base and the field side fastener shoulder. The firstpart of the test examines rail base lateral restraint by applying the verticalload through a wooden block to a maximum of 41 kips. This test is adequateto assess the structural integrity of the insulator and fastener shoulder.
The second part of the test examines the restraint of the fastenersystem to rollover displacement (difference between rail head and rail baselateral displacement). Rollers are used to eliminate any lateral restraintbetween the load actuator and the rail head. Rollover displacement is restrictedto 1/4 inch under a load of 20.5 kips.
The results shown earlier in Figure 21 indicate that fasteners usingflexible pads (static stiffness below about 1.4 million pounds per inch) may be
unable to restrict the rollover displacement to the required 1/4 inch. Themeasurements at FAST indicated that rail head lateral displacements in trackare a yery weak function of pad stiffness. On the other hand, the initialdisplacements in the laboratory setup are a s/ery strong function of pad stiffness,which controls rollover restraint until the upper corner of the rail baselifts off the pad. At this point the stiffness and strength of the clip beginto contribute significantly to rollover restraint. Thus, a flexible pad mayrequire a stronger clip to meet the requirements of this test. Because the
laboratory test shows a strong dependence of pad stiffness on rollover dis-placement while the track measurements do not, it is recommended that thistest be deleted.
6. Tie Pad Load/Deflection Test
Recent discoveries of rail seat bending cracks in concrete ties in-
stalled on the Northeast Corridor and in several revenue service test segmentshave led to an investigation of the effect of pad stiffness on the levels oftie bending strain produced by impacts from wheel irregularities [9J. Thestudy has provided several important conclusions:
a. Where ties are installed with rigid pads, the maximum tie
bending strains produced by wheel irregularities on high-speedtraffic can far exceed the levels required to cause rail seatbending cracks.
b. The occurence of crack-producing impact strain levels can be
reduced or eliminated by major reductions in tie pad stiffness.For example, laboratory tests showed that a reduction in
dynamically measured compressive pad stiffness from 5 millionpounds per inch to 500,000 pounds per inch can attenuatemaximum impact strains by 40 percent.
c. The compressive stiffness of some pad materials is significantlyaffected by the rate of load application.
On the other hand, it should be pointed that there are some loadingenvironments where pad stiffness is not a major concern. Some ties on the FAST
track have endured almost 600 MGT of heavy-haul traffic without cracking. The
FAST track and train are regularly maintained, and the maximum speed of the trainis 45 mph. Other test segments have been in revenue service for several yearswithout significant cracking. Finally, there are some loading environments where
cracked ties can remain in service for many years without impairment of function.
52

Cracked ties from the Kansas Test Track have seen almost 600 MGT of service atFAST without further deterioration.
Therefore, it is recommended that the selection of an appropriatetie pad stiffness for a given railroad application be based on a knowledgeof the track loading environment. The selection should be based upon thefrequency with which crack-producing wheel/rail loads or tie strains areexpected to occur. Data for such determination will be available from currentsupporting investigations. Data from the Northeast Corridor track [15] containthe highest frequency of crack-producing tie strains yet found in U. S. revenueservice. Bending strains above the level which can cause cracking at railseats were found to occur at a typical site about 0.1 percent of the time.This represents an average frequency of occurrence of one event with thepotential to produce a crack about every 1 to 2 days.
As a general guideline, it can be stated that the dynamicallymeasured compressive stiffness of new tie pads should not exceed 1 millionpounds per inch where any of the following conditions are expected to exist:
a. the speeds of normally maintained freight and passengertraffic will exceed 60 mph. "Normal" maintenance will permitadvanced wheel irregularities to develop.
b. track defects such as severe engine burns exist.
c. special track work (grade crossings, turnouts) may produceunusual dynamic loading.
It is recommended that a guideline of this type be included in fastener qualificationspecifications, and that the dynamic compressive tie pad stiffness be includedas part of tie pad load/deflection test.
53

APPENDIX A
DATA FROM EXISTING FASTENER PERFORMANCE TESTS
54

TABLE A-l. FASTENER CLIP FORCE-DEFLECTION PROPERTIES
SPRING RATE ATINSTALLED DEFLECTION
VERTICAL CLIP DEFLECTION (INCH
FASTENER CLIP TYPE
VaXaSowice.
1
INSTALLEDDEFLECTION
(INCH)
CLIP FORCE ATINSTALLED DEFL.
(LB)
SPRING RATE ATINSTALLED DEFL.
(LB/IN)
PANDROL 601
A
A. DESIGN CURVE
B. QUALIFICATION TESTS
INITIAL TESTS* - MEAN
RANGE
FINAL TESTS* - MEAN
RANGE
A-l.590
.598
.562- .637
.590
.570- .637
2200
2290
1750- 2780
1940
1530-2350
5640
4840
3820-6120
5160
3485 - 6980
HIXSOH (QUALIFICATION TEST) A-2 .400 2800 7270
VSD (QUALIFICATION TEST)
INITIAL TEST
FINAL TEST
A-3.449
.412- .478
.306
.286- .326
2520
2250 - 2860
1425
1270- 1580
6800
6580- 7210
5330
5240 - 5420
SPRINGLOCK (MANUF. DATA)
CS3 CLIP
CS5 CLIP
A-4
.41
.41
1700
2500
<&.:>& V,'«^'-
4100 (Avg.)
6100 (Avg.)
DE-SPRINGCLIP (MANUF. DATA)
RANGE
A-4
.394 1650- 2650 4200- 6720
RN - CLIP (MANUF. DATA) A-4
.157 1800
:lHi|£4
El = 2460
(< .161")
E2 = 7480(> .161")
SIDEWINDER (TEST DATA) A-5 No data 2042 - 2884 No data
Between initial and final clip force-deflection tests, tie pad load-deflection, fastening uplift,
longitudinal restraint, repeated loads, and push-pull tests were conducted.
55

TABLE A-2. FASTENER SYSTEM UPLIFT PROPERTIES
VERTICAL UPLIFT VET-LECTIOH (INCH)
FASTENER TYPEData
SouAcet
PAD SEPARATION
FORCE I DEFLECTION(LB)
I(INCH)
MAXIMUM
FORCE
(LB)
DEFLECTION(INCH)
UPLIFTSPRING RATE
(LB/IN)
PANDROL 601A/ EVA PAD (QUALIFICATION TESTS)
INITIAL TESTS* - MEAN
FINAL TESTS* - MEAN
A-l4830
4065
.0172
.0175
6080
5370
, ,,' ... iHIVJU
2,310,000
1,940,000
HIXSON/ GROOVED RUBBER PAD A-2 4000-5400
.018-
.0428500 .17 235,000
VSD/ 6 mm NEOPRENE PAD (QUALIFICATION TESTS)
INITIAL TESTS* - MEAN
FINAL TESTS* - MEAN
A-3
6860 .027
4290 .024
8690
6745
1,509,000
678,000
SIDEWINDER/ POLYURETHANE PADA-
5
5545 No data 11,090 I No data No data
Between initial and final uplift tests, longitudinal restraint, repeated loads and
push-pull tests were conducted.
56

TABLE A-3. TIE PAD COMPRESSION LOAD-DEFLECTION PROPERTIES
PAD
LOAP
(LB)
PAP COMPRESSIONSPRING RATE
///)//// f t/iiif///PAD DEFLECTION (INCH
FASTENER TYPEVaXa.
SouA.ce.
INSTALLEDLOAD(LB)
INSTALLEDDEFLECTION
(INCH)
PADSPRING RATE
(LB/IN)
DUPONT VINYL EVA PAD (WITH PANDROL CLIP) A-l
INITIAL TEST - MEAN 4915 .0033 3,700,000
FINAL TEST - MEAN 4210 .0060 3,850,000
PANDROL TESTS (TO 4500 LB ONLY) A-4POLYETHYLENE PAD 4000 .0020 4,100,000
FLAT NEOPRENE PAD 4000 .0051 2,800,000
GROOVED NEOPRENE PAD 4000 .0087 1,800,000
PANDROL SPECIFICATION (AT 20 METRIC TONS,CURVES INTERSECT .
BOUNDARY4 and .8 mm)
4000(ASSUMED)
.0034-.0114
2,300,000 -
1,230,000
VSD/6 mm NEOPRENE PAD A-3
INITIAL TESTS - MEAN 5180 .0214 865,000
FINAL TEST* (ONE TEST) 4000 .0220 770,000
MANUFACTURER'S DATA 4000(ASSUMED)
.0044 825,000
SHINKANSEN DATA ENVELOPE A-6 4000(ASSUMED)
.0035 -
.0112
740,000 -
840,000
Between initial and final pad compression tests, fastening uplift, longitudinal restraint,repeated load, push-pull and rail clip load-deflection tests were conducted.
57

TABLE A-4. FASTENER LONGITUDINAL RESTRAINT PROPERTIES
LONGITUDINALLOAD
DISPLACEMENTTRANSDUCERS
FASTENER TYPEDataSouAce.
PANDROL 601 A/ EVA PAD
FASTENER SYSTEM 1 - INITIAL*
- FINAL*
FASTENER SYSTEM 2 - INITIAL
- FINAL
PANDROL 601A WITH EXTERNAL INSULATOR(Mean of 2 Tests)
A-l
A-7
POLYETHYLENE PAD
FLAT NEOPRENE PADGROOVED NEOPRENE PAD
PANDROL 601A WITH INTERNAL INSULATOR
(Mean of 2 Tests)
POLYETHYLENE PAD lni M}j
d '
FLAT NEOPRENE PAD SHouLdeA
GROOVED NEOPRENE PAD II
PANDROL 401 WITH EXTERNAL ?n,sulatqr
(Mean of 2 Tests)
POLYETHYLENE PADFLAT NEOPRENE PADGROOVED NEOPRENE PAD
HIXSON/ GROOVED RUBBER PAD A-2
VSD/ 6 mm NEOPRENE PAD
TWO INITIAL TESTS
TWO FINAL TESTS
A-3
SIDEWINDER/ POLYURETHANE PAD MAX LOAD A-5
DE SPRINGCLIP/MASONITE PAD
(ON STEEL TIE PLATE & WOOD TIE)
MEAN OF 3 TESTS
A-8
LONGITUDINALLOAD(LB)
2400
1690
1620
1710
395040004000
330049504650
365037003650
2400
3100
2400
1900, 2000
3100
3480
3580
SLIPPAGE
(INCH)
.016
CONTINUOUS
CONTINUOUS
CONTINUOUS
SLIPSLIPSLIP
SLIPSLIP
SLIP
SLIPSLIP
SLIP
.020 - .024
CONTINUOUS
.038 - .0385
CONTINUOUS
START SLIP
START SLIP
CONTINUOUS
TOE LOAD BEFORE TEST(AVG. OF 2 CLIPS)
(LB)
2370
2150
2350
2085
2800
2100, 2940
1490
2200 (Nominal)
Between initial and final longitudinal restraint tests, repeated loads, uplift,
and push-pull tests were conducted.
58
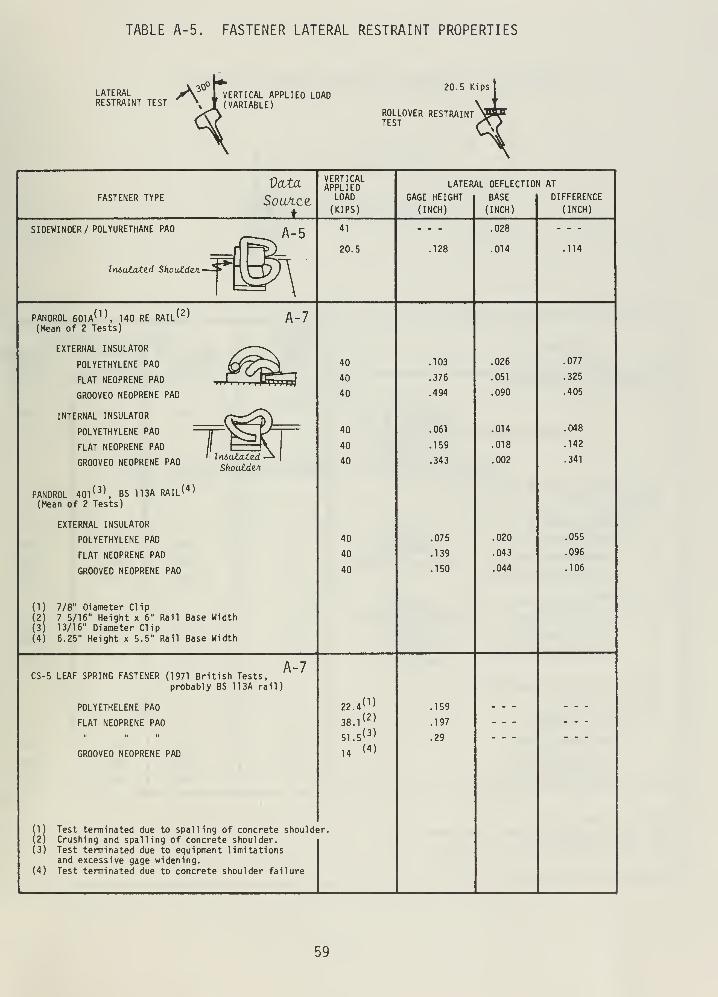
TABLE A-5. FASTENER LATERAL RESTRAINT PROPERTIES
LATERALRESTRAINT TEST
VERTICAL APPLIED LOAD(VARIABLE)
20.5 Kips
ROLLOVER RESTRAINTTEST
FASTENER TYPE
Data.
Sou/icet_
VERTICALAPPLIED
LOAD
(KIPS)
LATERAL DEFLECTION AT
GAGE HEIGHT
(INCH)
BASE
(INCH)
DIFFERENCE
(INCH)
SIDEWINDER/ POLYURETHANE PAD
Tniulattd ShowidzA-
A-541
20.5 .128
.028
.014 .114
PANDROL 601
A
(1) 140 RE RAIL 1
T.niuJLaXe.d
ShouldeA
(Mean of 2 Tests)
EXTERNAL INSULATOR
POLYETHYLENE PAD
FLAT NEOPRENE PAD
GROOVED NEOPRENE PAD
INTERNAL INSULATOR
POLYETHYLENE PAD
FLAT NEOPRENE PAD
GROOVED NEOPRENE PAD
PANDROL 401(3)
, BS 113A RAIL (4)
(Mean of 2 Tests)
EXTERNAL INSULATOR
POLYETHYLENE PAD
FLAT NEOPRENE PAD
GROOVED NEOPRENE PAD
(1) 7/8" Diameter Clip
(2) 7 5/16" Height x 6" Rail Base Width
(3) 13/16" Diameter Clip
(4) 6.25" Height x 5.5" Rail Base Width
A-7
40
40
40
40
40
40
40
40
40
.103
.376
.494
.061
.159
.343
.075
.139
.150
.026
.051
.090
.014
.018
.002
.020
.043
.044
.077
.325
.405
.048
.142
.341
.055
.096
.106
CS-5 LEAF SPRING FASTENER (1971 British Tests,probably BS 113A rail)
POLYETHELENE PAD
FLAT NEOPRENE PAD
GROOVED NEOPRENE PAD
A-7
22.4^38.1^)
51.5< 3 >
14<«>
(1) Test terminated due to spalling of concrete shoulder.(2) Crushing and spalling of concrete shoulder.
(3) Test terminated due to equipment limitationsand excessive gage widening.
(4) Test terminated due to concrete shoulder failure
.159
.197
.29
59

TABLE A-6. FASTENER ROLLOVER RESTRAINT PROPERTIES
MAX LOAD = 20.5 KIPS
ROLLOVER RESTRAINTTEST
FASTENER TYPE
VERTICALAPPLIED
LOAD
(KIPS)
LATERAL DEFLECTION AT
GAGE HEIGHT
(INCH)
BASE
(INCH)
DIFFERENCE
(INCH)
SIDEWINDER/ PCLYUkCTHANE PAD
ItUmtaAcd ShouldeA
PANDROL 601A (1), 140 RE RAIL^
(Mean of 2 Tests)
EXTERNAL INSULATOR
POLYETHYLENE PAD
FLAT NEOPRENE PAD
GROOVED NEOPRENE PAD
INTERNAL INSULATOR
POLYETHYLENE PAD
FLAT NEOPRENE PAD
GROOVED NEOPRENE PAD
PANDROL 401(3)
, BS 11 3A RAIL^(Mean of 2 Tests)
EXTERNAL INSULATOR
POLYETHYLENE PAD
FLAT NEOPRENE PAD
GROOVED NEOPRENE PAD
A-7
hUtutatzdShoatdcA
20.5
20
20
20
20
20
20
20
20
20
,128
.056
.097
.148
,032
.037
.081
.024
.054
.070
,014
.017
,022
.048
.009
.011
.010
.007
,026
.029
.114
.039
.075
.100
.023
.026
.071
.017
.028
,041
(1) 7/8" Diameter Clip
(2) 7 5/1 b" Height x 6" Rail Base 'Width
(3) 13/16" Diameter Clip
(4) 6.25" Height x 5.5" Rail Base Width
60

APPENDIX B
STRAIN-VOLTAGE RELATIONSHIP OF INSTRUMENTED CLIPS
61

APPENDIX B
STRAIN-VOLTAGE RELATIONSHIP OF INSTRUMENTED CLIPS
Figure B-l shows the schematic of the 4-arm bridge containing twoactive gauges and two completion resistors. Changes in resistance of the activegauges produce response en according to the equation
eo 1 T
AR1
AR2 1 (
R = 120"' nominal f°r/ R— =
4 |_-p- p-J• all arms of bridge) \V-\)
The linear strain at each gauge is related to the fractional change in resist-ance of the gauge by
AR, aR?-~ = GF ey -£ =GFe
2. (B-2)
A ratio between e, and t, was established in laboratory tests conducted in
preparation for the field measurements described in Reference [14]. For bi-
axial gauges placed at the position indicated in Figure B-l, it was consistentlyfound that
e2
= -0.44 E] • (B-3)
Thus an effective Poisson ratio of 0.44 was found. Substitution of (B-2) and
(B-3) into (B-l) yields
*f= f (1.44) e}
. (B-4)
Shunt resistance R placed across two opposite arms of the bridgeill produce the following ratio of response to excitation voltage
o 1 R
wi
e
Amplification of e yields
e 2 R + Rc
T= K T = lRTr- < B" 5 )
62

Red
[Colon* k<l{vi toCUmplifaeA dOYlYiddULOYUi .
)
120 fi
Black
App/ioXsLmato. Location o& KulxajolI Gauge.
FIGURE B-l. SCHEMATIC OF TYPE A CLIP INSTRUMENTATION
63

Because the installation strain and dynamic strain were of such differentmagnitude, two separate shunt resistances were used. To determine K in eachcase, the amplification was adjusted so that
_£ = i = 1. B-5e 5
Then the two amplification factors were determined as follows:
a. Installati on Strain: R = 24,900c
K. ,- 2(120
;24,900) . 417 ,
„_ 5inst. 120
b. Dynamic Strain : R = 100,000
„ . 2(120 + 100,000 ) lc7n R cKdyn " T20
= 167 °- B " 5
Finally, the linear strain at Sauge 1 can be expressed in terms of outputvoltage as
-4
Fel
'
K GF (1.44) e o B-6
a. Installation Strain :
el (417)(2)(1.44)(5)
Eo
= °- 000666 Eo
(1n/in) B" 6
= 666 E (yin/in).
b. Dynamic Strain
£1
=
(1670)(2)(1.44)(5)Eo
= °- 000166 Eo
(in/in) B " 6
= 166 E (yin/in) .
To determine the relationship between strain gauge bridge output and
vertical clip deflection, the clips were subjected to the laboratory tests il-
lustrated in Figure B-2. An arbitrary strain "zero" was established with a
vertical clip load of 1700 pounds. The load was then cycled between 1400 and
2000 pounds. The slope of the curve of strain (volts) vs. deflection (inches)was reasonably linear and very consistent, as shown in the figure. The meanslope of the two clips illustrated is 0.0173 inches per volt, when the clipsare given shunt calibrations equivalent to those applied for dynamic measurementsin the field.
64
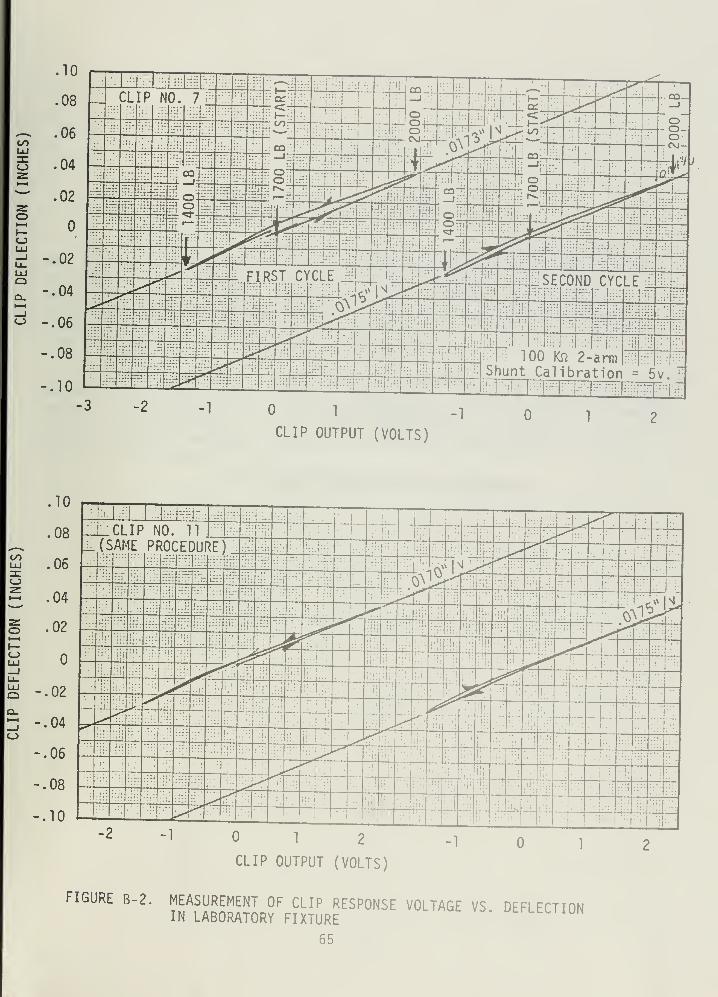
.10
.08
_ .06COLxJ
.04z—
<
—.02
2:
•—<
h-OUJ
1 -.02LUOa.
-.041—
1
—j-.06
-.08
-.10
-3 -21 -1
CLIP OUTPUT (VOLTS)
00LU
o2:
2Tot—
I
oLU_JLULUQC_1—
t
—IC_3
1 2
CLIP OUTPUT (VOLTS)
FIGURE B-2. MEASUREMENT OF CLIP RESPONSE VOLTAGE VS. DEFLECTIONIN LABORATORY FIXTURE
65

APPENDIX C
LABORATORY TESTS OF INDIVIDUAL CLIPS
66

APPENDIX C
LABORATORY TESTS OF INDIVIDUAL CLIPS
The fixture illustrated in Figure C-l was constructed to permit the
measurement of vertical load-strain and load-displacement relationships of
individual clips. Loading is applied through a vertical push rod which is
supported by a ball bushing. The ball bushing was required to overcomefriction created by a lateral component of the clip toe load. This lateral
component is produced because the contact with the clip toe is made througha small segment of rail base which has slope of 1:4.
The fixture can be used with any combination of load cell and actuatorDeflection is measured with a DCDT as illustrated. Strain of the Type A clipwas measured as described in Appendix B. The fixture is adaptable to a varietyof clips by interchange of clip inserts. The stem of the insert passes througha slotted hole in the lower horizontal plate and is constrained by a ringcontaining set screws.
67

VERTICAL LOAD
—
/ / / / / // ////////
FIGURE C-l FIXTURE FOR MEASUREMENT OF CLIP FORCE-DEFLECTION-STRAIN PROPERTIES
68

REFERENCES
[1] Dean, F.E., "Research Plan for the Development of Improved Rail
Fastener Performance Requirements," report by Battelle's ColumbusLaboratories to the Improved Track Structures Research Division,Federal Railroad Administration, Contract DOT-FR-9162, April 1980.
[2] Dean, F.E. , "Measurements of Rail/Tie Deflections and Fastener ClipStrains at the Facility for Accelerated Service Testing," report by
Battelle's Columbus Laboratories for the Improved Track StructuresResearch Division, Federal Railroad Administration, Contract DOT-FR-9162, March 1981.
[3] "What Fastening System for Use on Curves?," Railway Track and
Structures , June 1978.
[4] Moody, H.G., "Comparison of Wood Tie Fastener Performance at FAST,"
paper presented at the January 1980 meeting of the TransportationResearch Board.
[5] Takahara, Kiyosuke, "Track Degradation Prediction for the NEC,"
July 31, 1979. Author is Deputy Director, Information SystemsDepartment, Japanese National Railways.
[6] Yasuo, Y., and Kakegawa, H., "Effects of Rubber-Pad Under ConcreteTie on Pulverization of Ballast, Vibration and Noise," JNR QuarterlyReports, Vol. 18, No. 1, pp 10-14, 1977.
[7] "Manual for Railway Engineering," American Railway EngineeringAssociation, Chicago, Illinois (Revised 1981).
[8] Ball, C.G., "Amtrak Qualification Tests of Prorail VSD FastenerSystem," Portland Cement Association, Research and Development,Construction Technology Laboratories, 5420 Old Orchard Road, Skokie,Illinois 60077, August 1978.
[9] Dean, F.E. and Harrison, H.D., "Effect of Tie Pad Stiffness on the
Attenuation of Impact Strains in Concrete Ties," report by BattelleColumbus Laboratories to the Improved Track Structures ResearchDivision, Federal Railroad Administration, Contract DOT-FR-9162,FRA/ORD-82/19, May 1982.
[10] Lombard, P.C. and Wildenberger, L.A., "Concrete Sleepers and Fasteningson the South African Railways," Civil Engineering Department, TrackDevelopment, Report No. 24.597/08/09.
[11] Letter with Attachments from W.S. Autry, Chief Engineer, Santa Fe
Railway, to H.G. Moody, FRA, February 6, 1980.
[12] "Report on Static and Pulsating Creep and Torsion Tests Carried Outon the DE-Springclip (Clamping Force 1000 kp)," Institut fur Bau von
Landverkehrswegen der TU Munchen, Report No. 524a, February 7, 1972.
69

[13] "Pandrol Rail Clips Type PR601A - Stability of Properties withDynamic Loading," Report No. 380, Pandrol, Inc., Holborn, London,EC1N2NE.
[14] Hadden, J. A., Prause, R.H., and Harrison, H.D., "Tests for theStructural Evaluation of Pandrol Rail Fasteners in Section 17 at FAST,"report by Battelle's Columbus Laboratories to U.S. Department ofTransportation, Transportation Systems Center, Contract No. DOT-TSC-1595, March 1979.
[15] Tuten, J.M., "Technical Memo on Analysis of Dynamic Loads and StrainData from the northeast Corridor Track," by Battelle's ColumbusLaboratories to the Federal Railroad Administration, ImprovedTrack Structures Research Division, Contract D0T-FR-9162, May 1981.
[A-l] Hanna,A. N., and Ball, C.G. "Amtrak Qualification Testing of ConcreteTies and Fastenings - Testing of Fastenings," report to Santa Fe
Pomeroy/San Vel Concrete Corporation Joint Venture, by Portland CementAssociation, Research and Development, Construction TechnologyLaboratories, July 1978.
[A-2] Lai, J.S., "A Summary Report for Evaluation of Hixson Concrete Cross-Tie Fastening System*" report to Transit Products Company, Inc., from
School of Engineering, Georgia Institute of Technology, Atlanta,Georgia, October 11, 1978.
[A-3] Ball, C.G., "Amtrak Qualification Tests of Prorail VSD FastenerSystem," Portland Cement Association, Research and Development,Construction Technology Laboratories, 5420 Old Orchard Road, Skokie,Illinois 60077, August 1978.
[A-4] "Elasticity of Fasteners," Attachment A of a report by Bechtel , Inc.
on fastener performance (undated).
[A-5] Letter to W.R. Hamilton, Portec, Inc., from John W. Weber, PortlandCement Association, March 22, 1976.
[A-6] Kiyosuke, Takahara, "Track Degradation Prediction for the NEC,"
July 31, 1979. Author is Deputy Director, Information SystemsDepartment, Japanese National Railways.
[A-7] Way, G.H. , "Developmental Tests of Concrete Tie and Tie FasteningSystems," report by C&0/B&0 Railway Co. to Department of Transportation,Office of Research, Development and Testing, Contract No. D0T-FR-20015, May 4, 1973.
[A-8] "Report on Static and Pulsating Creep and Torsion Tests Carried Outon the DE-Springclip (Clamping Force 1000 kp)," Institute fur Bau von
Landverkehrswegen der TU Muchen, Report No. 524a, February 7, 1972.
70