Embed Size (px)
Citation preview
UNIVERSITY OF OTTAWA Department of Chemical and Biological Engineering
Performance Improvement of Latex-Based PSAs
using Polymer Microstructure Control
by
Lili Qie
A thesis submitted to the Faculty of Graduate and Postdoctoral Studies
in partial fulfillment of the requirements for the degree of
Doctor of Philosophy in Chemical Engineering
© Lili Qie, Ottawa, Canada, 2011
Preface
ii
STATEMENT OF CONTRIBUTIONS OF COLLABORATORS
I hereby declare that I am the sole author of this thesis. I performed all the polymerization
experiments, polymer characterization and pressure-sensitive adhesive (PSA)
performance testing as well as the associated data analysis. The PSA’s surface images
were characterized by Dr. Gabriela Fonseca with Atomic Force Microscopy (AFM) at the
University of Ottawa. PSA film surface tension measurements and latex particle size
analysis were carried out by me in the Department of Chemical and Biological
Engineering at the University of Ottawa.
The scientific guidance throughout the project and editorial comments of the
written work were provided by my thesis supervisor Dr. Marc A. Dubé of the Department
of Chemical and Biological Engineering at the University of Ottawa.
Name: Lili Qie
Date: January/2011
Preface
iii
ABSTRACT
This thesis aims to improve the performance of latex-based pressure-sensitive adhesives
(PSAs). PSA performance is usually evaluated by tack, peel strength and shear strength.
Tack and peel strength characterize a PSA’s bonding strength to a substrate while shear
strength reflects a PSA’s capability to resist shear deformation. In general, increasing
shear strength leads to a decrease in tack and peel strength. While there are several
commercial PSA synthesis methods, the two most important methods consist of either
solvent-based or latex-based techniques. While latex-based PSAs are more
environmentally compliant than solvent-based PSAs, they tend to have much lower shear
strength, at similar tack and peel strength levels. Therefore, the goal in this thesis was to
greatly improve the shear strength of latex-based PSAs at little to no sacrifice to tack and
peel strength.
In this study, controlling the polymer microstructure of latexes or their
corresponding PSA films was used as the main method for improving the PSA
performance. The research was sub-divided into four parts. First, the influence of chain
transfer agent (CTA) and cross-linker on latex polymer microstructure was studied via
seeded semi-batch emulsion polymerization of butyl acrylate (BA) and methyl
methacrylate (MMA). Three techniques were used to produce the latexes: (1) adding
CTA only, (2) adding cross-linker only, and (3) adding both CTA and cross-linker. It was
found that using CTA and cross-linker simultaneously allows one to expand the range of
latex microstructural possibilities. For example, latexes with similar gel contents but
Preface
iv
different Mc (molecular weight between cross-links) and Mw (molecular weight of sol
polymers) could be produced if CTA and cross-linker concentration are both increased.
However, for the corresponding PSAs with similar gel contents, the relationship between
their polymer microstructure and performance was difficult to establish as almost all of
the medium and high gel content PSAs showed very low tack and peel strength as well as
extremely large shear strength readings.
In the second part of this thesis, in order to improve the tack and peel strength of
medium and high gel content PSAs, the monomer composition and emulsifier
concentration were varied. It was found that changing the monomer mixture from
BA/MMA to BA/acrylic acid (AA)/2-hydroxyethyl methacrylate (HEMA) while
simultaneously decreasing emulsifier concentration dramatically improved the
corresponding PSAs’ shear strength as well as tack and peel strength. The addition of
polar groups to the PSA increased its cohesive strength due to the presence of strong
hydrogen bonding; meanwhile, PSA films’ surface tension increased.
In the third part, two series of BA/AA/HEMA latexes were generated by varying
the amounts of CTA either in the absence or presence of cross-linker. The latexes
produced in the absence of cross-linker exhibited significantly larger Mc and Mw
compared to their counterparts with similar gel contents prepared with cross-linker. The
PSAs with the larger Mc and Mw showed much larger shear strengths due to improved
entanglements between the polymer chains.
In the final part of the thesis, the performance of the BA/AA/HEMA PSAs was
further improved by post-heating. Compared with original latex-based PSAs with similar
gel contents, heat-treated PSAs showed not only significantly improved shear strengths,
Preface
v
but also much larger tack and peel strengths. The different shear strengths were related to
the PSAs’ gel structures, which were discrete in the original PSAs but continuous in the
heat-treated PSAs. The improved tack and peel strengths were related to the PSA films’
surface smoothness. During the post-heating process, the PSA polymer flowed, resulting
in much smoother surfaces than the original PSA films. In addition, the effect of post-
heating was related to the polymer microstructure of the untreated PSAs. Decreasing the
amount of very small or very big polymers or simultaneously increasing Mc and Mw
could lead to post-treated PSAs with significantly better performance. Moreover, it was
found that by optimizing the polymer microstructure of the original latex-based PSAs, it
was possible to obtain a treated PSA with similar or even better performance than a
solvent-based PSA with similar polymer microstructure.
Our original objective was surpassed: in two cases, not only was shear strength
greatly improved, but so were tack and peel strength due to the simultaneous
modification of PSA bulk and surface properties.
Preface
vi
RÉSUMÉ
Cette thèse vise à améliorer la performance des adhésifs sensibles à la pression (ASP) à
base de latex. La performance des ASPs est généralement évaluée par leur habileté à
adhérer à une surface. L’adhérance à coller et la résistance au décollement caractérisent
une force de liaison d’ASP à un substrat tandis que la résistance au cisaillement reflète la
capacité d'un ASP à résister à la déformation de coupe. En général, ce qui augmente la
résistance au cisaillement conduit à une diminution de l’adhérance à coller et la résistance
au décollement. Bien qu'il existe plusieurs méthodes de synthèse commerciale d’ASP, les
deux méthodes les plus importantes diffèrent par milieu de fabrication: à base de solvant
ou à base de latex. Alors que les ASP à base de latex sont plus conformes aux normes
environnementales que les ASP à base de solvant, ils ont tendance à avoir une résistance
au cisaillement beaucoup plus faible. Par conséquent, l'objectif de cette thèse était
d'améliorer considérablement la résistance au cisaillement des ASPs à base de latex sans
sacrifier leur adhérance et leur résistance au décollement.
Dans cette étude, le contrôle de la microstructure des polymères de latex ou des
films de l’ASP a été utilisé comme la méthode principale pour améliorer la performance
de l’ASP. La recherche a été sous-divisée en quatre parties. Premièrement, l'influence de
l'agent de transfert de chaîne (ATC) et de réticulation sur la microstructure du polymère
de latex a été étudiée par polymérisation d'acrylate de butyle (AB) et de méthacrylate de
méthyle (MAM) en émulsion ensemencée semi-continu. Trois techniques ont été utilisées
pour produire le latex: (1) en ajoutant que de l’ATC, (2) en ajoutant seulement l’agent de
Preface
vii
réticulation, et (3) en ajoutant les deux. Il a été constaté que l'utilisation simultanée
d’ATC et d’agent de réticulation permet d’élargir l'éventail des possibilités de la
microstructure du latex. Par exemple, les latex avec des contenus de gel similaires, mais
avec des différentes valeurs de Mc (poids moléculaire entre réticulations) et de Mw (poids
moléculaire de polymères sol) peuvent êtres produits si les concentrations de l’ATC et de
l’agent de réticulation sont augmentées. Toutefois, pour les ASPs correspondant à une
teneur en gel similaire, il a été difficile d'établir la relation entre leur microstructure du
polymère et de la performance parce que presque la totalité des ASPs à moyen et à haut
contenu en gel a montré une très faible habileté à coller et de résister au décollement,
ainsi que des mesures très grandes de résistance au cisaillement.
Dans la deuxième partie de cette thèse, afin d'améliorer l’habileté à coller et la
résistance au décollement des ASPs avec des moyens et hauts contenus en gel, la
composition de monomères et la concentration d’émulsifiant ont été variées. Il a été
constaté que la modification du mélange de monomères de AB/MAM à AB/acide
acrylique (AA)/2-hydroxyéthyl méthacrylate (HEMA) simultanément avec la diminution
de la concentration d’émulsifiant, ont considérablement amélioré la résistance au
cisaillement des ASPs ainsi que leur habileté à coller et de résister au décollement.
L'ajout de groupes polaires sur l’ASP a accru sa force de cohésion en raison de la
présence d’une liaison d’hydrogène forte, et en même temps, la tension de surface des
films ASP a augmenté.
Dans la troisième partie, deux séries de latex avec AB/AA/HEMA ont été
générées en variant les quantités d’ATC, soit en l'absence ou la présence d’agent de
réticulation. Le latex produit en absence d’agent de réticulation a montré un niveau plus
Preface
viii
large du Mc et Mw, comparativement à leurs homologues ayant les mêmes teneurs en gel
préparé avec agent de réticulation. Les ASPs avec les plus grands Mc et Mw ont montré
une résistance supérieure au cisellement la plus grande en raison de l'augmentation de
l’enchevêtrement entre les chaînes de polymères.
Dans la dernière partie de la thèse, la performance des ASPs du AB/AA/HEMA a
été encore améliorée par post-chauffage. Par comparaison avec les ASPs d’origine à base
de latex avec des teneurs similaires de gel, les ASPs traités avec la chaleur ont montré
non seulement une considérable amélioration à la résistance au cisaillement, mais aussi
une plus grande habileté à coller et à résister au décollement. Les différentes résistances
au cisaillement ont été liées aux structures de gel, qui ont été discrets dans les ASP
originaux, mais continues dans les ASPs avec traitement thermique. L'augmentation de
l’habileté à coller et la résistance au décollement a été liée à la rugosité de surface des
films d’ASPs. Au cours du processus de post-chauffage, le polymère ASP a coulé,
entraînant des surfaces beaucoup plus lisses que les films d’ASP originaux. En plus,
l'effet de post-chauffage est lié à la microstructure du polymère des ASP non-traitées. La
diminution de la quantité des polymères très petits ou très grands ou en augmentant
simultanément le Mc et le Mw pourrait conduire aux ASPs post-traitées avec de biens
meilleures performances. D’ailleurs, il a été constaté que par l'optimisation de la
microstructure du polymère des ASPs à base de latex originaux, il a été possible d'obtenir
un ASP avec des performances similaires ou encore mieux que l’ASP à base de solvant
avec une microstructure similaire.
Notre objectif initial a été surpassé: dans deux cas, non seulement la résistance au
cisaillement a été améliorée grandement, mais aussi l’habilité à coller et la résistance au
Preface
ix
décollement en raison à la modification simultanée des propriétés en vrac et des surfaces
des ASPs.
Preface
x
TABLE OF CONTENTS
Statement of Contributions of Collaborators ii
Abstract iii
Résumé vi
Table of Contents x
List of Figures xviii
List of Tables xxiii
Nomenclature xxvi
List of Abbreviations xxviii
List of Molecular Formulae xxx
Acknowledgements xxxi
1. Introduction 1
1.1 Objectives of the Research 6
1.2 Structure of the Thesis 7
1.3 References 11
2. Theoretical Background and Research Methodology 14
2.1 Theoretical Background 14
2.1.1 Emulsion polymerization 14
Preface
xi
2.1.2 Control of latexes’ polymer microstructure 20
2.1.3 Control of the polymer microstructure of latex-based PSAs 22
2.1.4 Pressure sensitive adhesives 23
2.2 Research Methodology 27
2.2.1 Materials 27
2.2.2 Polymer latex preparation 28
2.2.3 Latex particles characterization 30
2.2.4 Latex solid content calculation 30
2.2.5 Monomer conversion characterization 30
2.2.6 Latex polymer characterization 31
2.2.7 Latex-based PSAs 36
2.3 References 40
3. Manipulation of Chain Transfer Agent and Cross-Linker Concentration to
Modify Latex Polymer Microstructure for Pressure-Sensitive Adhesives 45
3.1 Introduction 47
3.2 Experimental Methods 49
3.2.1 Materials 49
3.2.2 Latex preparation 50
3.2.3 Polymer latex characterization 51
3.2.4 Glass transition temperature measurement 55
3.2.5 PSA performance testing 55
Preface
xii
3.2.6 Testing PSAs’ viscoelastic properties
with dynamic mechanical analysis 56
3.3 Results and Discussion 57
3.3.1 Experimental design 57
3.3.2 Empirical model building 59
3.3.3 Influence of CTA and cross-linker concentrations
on latex particle size 61
3.3.4 Influence of CTA and cross-linker concentration
on monomer conversion 63
3.3.5 Latex polymer composition 65
3.3.6 Influence of CTA and cross-linker
on polymer latex properties 66
3.3.7 Influence of AA on BA/MMA/AA latex polymer properties 71
3.3.8 Bulk properties of PSA film made from latexes 1 and 11 72
3.3.9 PSA Performance 74
3.4 Conclusions 82
3.5 Acknowledgements 83
3.6 References 83
4. The Influence of Butyl Acrylate/Methyl Methacrylate/2-Hydroxy
Ethyl Methacrylate/Acrylic acid Latex Properties
on Pressure Sensitive Adhesive Performance 87
4.1 Introduction 89
Preface
xiii
4.2 Experimental Procedures 91
4.2.1 Materials 91
4.2.2 Latex preparation 92
4.2.3 Characterization 93
4.3 Results and Discussion 95
4.3.1 Effect of AMA cross-linker 95
4.3.2 Effect of feeding time 97
4.3.3 Influence of BA/MMA weight ratio 100
4.3.4 Influence of HEMA in the absence of CTA and cross-linker 105
4.3.5 Effect of HEMA when 0.2 phm CTA was added 110
4.3.6 Effect of HEMA on PSA performance 111
4.3.7 Effect of HEMA on latex viscosity and
emulsifier migration during PSA film formation 121
4.3.8 Effect of adding AA and HEMA plus decreasing
the amount of emulsifier 121
4.4 Conclusions 123
4.5 Acknowledgements 125
4.6 References 125
5. Manipulating Latex Polymer Microstructure using
Chain Transfer Agent and Cross-linker to Modify
PSA Performance and Viscoelasticity 130
5.1 Introduction 132
Preface
xiv
5.2 Experimental Methods 135
5.2.1 Materials 135
5.2.2 Polymerization procedure 135
5.2.3 Characterization 138
5.3 Results and Discussion 140
5.3.1 Influence of CTA and cross-linker on the
polymerization process and latex properties 140
5.3.2 Influence of latex pH and PSA microstructure
on PSA viscoelastic properties 147
5.3.3 PSA performance 156
5.3.4 Additional results and discussion shown in Appendix 165
5.4 Conclusions 165
5.5 Acknowledgements 166
5.6 References 167
6. Influence of Polymer Microstructure of Latex-based
Pressure Sensitive Adhesives on the Performance of
Post-treated PSAs 170
6.1Introduction 172
6.2 Experimental Methods 174
6.2.1 Materials 174
6.2.2 Latex Preparation 175
6.2.3 Preparation of original and post-treated PSA films 175
Preface
xv
6.2.4 Characterization method 176
6.3 Results and Discussion 177
6.3.1 Polymer microstructure and performance changes during
the post-treatment process of gel-free PSA 1B 180
6.3.2 Comparison of the performance of post-treated PSAs
generated from PSA 1B to those of original latex-based
PSAs 3B and 4B 184
6.3.3 Influence of very small sol polymers in the gel-free or
low gel content latex-based PSAs on the performance
of their treated PSAs 186
6.3.4 Influence of simultaneously increasing the Mc and Mw
of latex-based PSAs on the performance of their treated PSAs 189
6.3.5 Influence of increasing the amount of very small
sol polymers in gel-containing latex-based PSAs
on the performance of their treated PSAs 196
6.3.6 Influence of the amount of very large sol polymer
in gel-containing latex-based PSAs on the performance
of their treated PSAs 200
6.3.7 Comparison of the performance of post-treated latex-based PSAs
and solvent-based PSAs with similar microstructure 205
6.4 Conclusions 209
6.5 Acknowledgements 210
6.6 References 210
Preface
xvi
7. General Discussion and Recommendations 212
7.1 Main Contributions and Findings 215
7.1.1 Using CTA and cross-linker simultaneously to modify
latexes’ polymer microstructure (Chapter 3) 215
7.1.2 Improving the Performance of latex-based PSAs by modifying
the monomer mixture and the amount of emulsifier (Chapter 4) 216
7.1.3 Improving the performance of latex-based PSAs by controlling
their polymer microstructures (Chapter 5) 217
7.1.4 Improving the performance of latex-based BA/AA/HEMA PSAs
by optimizing their polymer microstructure
and post-treatment (Chapter 6) 218
7.1.5 Publications 220
7. 2 Recommendations for Future Research 220
7.3 Final Remarks 224
7.4 References 224
Appendix 226
1 Monomer conversion calculation for Run 1 from Chapter 3 227
1.1 Polymerization formulation 232
1.2 Added Reactants in the reactor during the polymerization process 228
1.3 Solid content of sample latexes taken during
the polymerization of Run 1 230
Preface
xvii
1.4 Calculate the instantaneous and overall monomer conversion
during the polymerization process of Run 1 231
2 Study on the influence of latex pH on their corresponding PSA
performance 233
3 Study on the influence of contact area on PSA shear strength 234
4 PSA films’ surface tension and chemical interaction energy between
the surfaces of PSA films and stainless steel testing panels 237
4.1 Calculation of the surface tension for PSA films 237
4.2 Calculation of the chemical interaction energy between the surfaces
of PSA films and stainless steel testing panels 238
4.3 Calculation result 239
5 Explanation about storage modulus (G’), loss modulus (G”) and composite
modulus (G*) 239
6 Reference 240
Preface
xviii
LIST OF FIGURES
Figure Description Page
Chapter 1
1.1 Polymer microstructures of PSA films and latex-based PSA
film formation process 4
1.2 Schematic overview of research methodology 7
Chapter 2
2.1 Scheme of batch emulsion polymerization process 16
2.2 Influence of molecular weight on a PSA’s performance 27
Chapter 3
3.1 Gel swelling and Mc changes with swelling time 54
3.2 Latex particle size and size distribution change during
polymerization (Run 1) 62
3.3 Evolution of instantaneous and overall monomer conversion 65
3.4 DSC thermograms for latex polymers from Run 2 and 9 66
3.5 Mw change for latex 1, 4 and 5 67
3.6 Mw of latexes with similar gel content (40 wt%) 70
3.7 Storage modulus (G’) of PSA 1 and 11 73
3.8 Loss modulus (G”) of PSA 1 and 11. 73
Preface
xix
3.9 The performance of gel-free BA/MMA PSAs vs.
their Mw/Me ratio 74
3.10 Performance of PSAs 10 and 10TK 78
3.11 Influence of AA concentration on PSA performance
at a CTA concentration of 0.4 phm 79
3.12 Influence of AA concentration on PSA performance
at a CTA concentration of 0.2 phm 80
Chapter 4
4.1 Performance of PSA films 4, 5, and 6.
(PSA film thickness: 60 μm) 102
4.2 Storage modulus (G’) vs. frequency at 23°C for PSA 4, 5 and 6 102
4.3 Loss modulus (G”) vs. frequency at 23°C for PSA 4, 5 and 6 103
4.4 DMA temperature sweep curves of PSA 5 and 9 107
4.5 Frequency sweep master curve of PSA 9 108
4.6 Gel content prediction for latex 9 110
4.7 Performance of PSA film 5, 7, 8 and 9.
(PSA film thickness: 60 μm) 112
4.8 Performance of PSA film 10-13. (PSA film thickness: 60 μm) 112
4.9
Storage modulus of high gel content (PSA 5 and 9) and low gel
content (PSA 10 and 13) PSAs. (Bonding and debonding
frequency corresponds to PSA film thickness of 60 μm) 114
Preface
xx
4.10
Loss modulus of high gel content (PSA 5 and 9) and low gel
content (PSA 10 and 13) PSAs. (Bonding and debonding
frequency corresponds to PSA film thickness of 60 μm) 114
4.11
Viscoelastic properties of PSAs 5 and 14. (Bonding and
debonding frequency corresponds to PSA film thickness of 33
μm) 123
Chapter 5
5.1 Particle growth trajectories for Run 1, 4 and 6 141
5.2 Instantaneous vs. overall monomer conversion for Runs 3
through 5 142
5.3 Molecular weight distribution of the sol polymers of latex 4
through 7 147
5.4 Storage moduli of PSAs 3B through 7B 148
5.5 Loss moduli of PSAs 3B through 7B 149
5.6 tanδ of PSAs 3B through 7B 149
5.7 Performance of PSA films 1A through 5A 156
5.8 Performance of PSAs 4B through 7B 159
5.9. Performance of PSAs 3B and 6B 160
Preface
xxi
Chapter 6
6.1
Schematic representation of the polymer microstructures of
PSA films as well as the latex-based PSA film formation
process. (a: solvent-based PSA film, b: latex particles, c: latex-
based PSA film, d: post-treated latex-based PSA film.)
180
6.2
A-Gel content change with heating time during the heating
process of PSA 1B; B, C, D-performance changes with gel
content for the original and heated PSA 1B 182
6.3 Performance of PSA films 3B, 4B, 1B-H126/16 and
1B-H120/30 185
6.4 Performance of PSA films 1B-H120/30 and 2B-H126/16 187
6.5
Schematic representation of the polymer microstructures of a
latex-based PSA film with very small sol polymer (size < 2Me)
as well as its post-treated counterpart. (a: original PSA film;
b: post-treated PSA film)
189
6.6 Scheme of the Mc change during the post-treatment process of
PSA 5B. (a: before post-treatment, b: after post-treatment) 191
6.7
Surface images of PSA films 5B, 7B and their heated
counterparts, 5B-H126/11 and 7B-126/11. (a-d are 3-D height
images. a: 5B, b: 5B-H126/11, c: 7B, d: 7B-H126/11; e is the
2-D image height image of PSA 7B)
194
6.8
Scheme of formation of PSA films 4B and 4B-H126/21.
(a: Latex, b: Latex-based PSA film 4B; c: Post-treated
PSA film 4B-H126/21) 203
6.9 Performance of solvent-based PSA TK2-H126/11 and post-
treated latex-based PSA 5B-H126/11 208
Preface
xxii
Chapter 7
7.1
Polymer microstructure of latexes produced by varying the
CTA concentration at a constant cross-linker concentration
(i.e., 0.2 phm) (a: 0 phm CTA, b: 0.2 phm CTA, c: 0.4 phm
CTA)
216
7.2 Influence of latex’s solid content on PSA film (a: Drawn image,
b and c: 3-D height image by AFM, d: phase image by AFM) 222
Appendix
A1 Influence of contact area on shear strength 235
Preface
xxiii
LIST OF TABLES
Figure Description Page
Chapter 3
3.1 Experimental design and BA/MMA latex properties
(BA/MMA weight ratio: 90/10) 58
3.2 Influence of AA on BA/MMA/AA copolymer properties
(BA/(MMA+AA) weight ratio: 90/10) 59
3.3 Experimental data for developing Model A 60
3.4 Polymer properties of gel-free BA/MMA latexes 74
3.5 Performance of gel-containing BA/MMA PSAs 82
Chapter 4
4.1 Formulation for latexes production 93
4.2 Latexes and PSAs related to Run 1-3 (BA/MMA weight ratio:
90/10) 95
4.3
Latexes and PSAs related to Run 4-6 ( BA/MMA weight ratio
was varied) and Run 14 (BA/MMA for initial charge, and
BA/AA/HEMA for feeding) 98
4.4 Polymer properties of latex samples taken during Run 4 99
4.5 Polymerization conditions and latex polymer properties for Run
5, 7-9. (No NDM; BA/MMA/HEMA weight ratio was varied) 105
Preface
xxiv
4.6
Polymerization conditions and latex polymer properties
for Run 10-13. (0.2 phm NDM; BA/MMA/HEMA weight
ratio was varied) 111
4.7 G’ and G” changes by adding ~4 phm HEMA 117
Chapter 5
5.1 Polymerization formulations for Run 1-7 137
5.2 CTA (NDM) and cross-linker (AMA) concentrations for producing
latexes 1-7 as well as the polymer microstructure of latexes 1-7. 137
5.3 Viscoelastic properties of PSA 3B-7B 162
Chapter 6
6.1 Polymer properties of BA/AA/HEMA (weight ratio: 96/2/2)
latexes 178
6.2 Polymer microstructures of the original and heated PSA 1B 181
6.3 Polymer properties of PSA films 3B, 4B, 1B-H126/16
and 1B-H120/30 184
6.4 Polymer properties of the PSA 1B and 2B as well as their
heated counterparts 186
6.5 Polymer properties and performance of PSA 5B, 7B and their
heated counterparts 190
6.6 Contact angle measurement data for PSA 5B and 5B-H126/11 193
6.7 Polymer properties and performance of PSA 4B, 6B and their
heated counterparts as well as 5B 196
Preface
xxv
6.8 Polymer properties and performance of PSA 4B, 5B and their
heated counterparts 201
6.9 Polymer properties and performance of PSA 4B, TK1 and their
heated counterparts 205
6.10 Polymer properties of PSAs 5B, TK2 and their heated
counterparts 208
Appendix
A1 Polymerization formulation of Run 1 from Chapter 3 228
A2 Weight of added reactants for Run 1 from Chapter 3 229
A3 Solid content of sample latexes of Run 1 from Chapter 3 230
A4 Instantaneous and overall monomer conversion
(Run 1 from Chapter 3) 232
A5 Influence of latex pH on corresponding PSA performance 234
A6 Contact angle measurement data for PSA 5B and 5B-H126/11 239
Preface
xxvi
NOMENCLATURE
CMC = Critical micelle nucleation
= Storage modulus (Pa)
= Loss modulus (Pa)
G* = Composite modulus (Pa)
[I] = Initiator concentration
J = Creep compliance (Pa-1)
kP = Propagation rate coefficient
[M] = Monomer concentration
Mc = Molecular weight between crosslink points (g mol-1)
Me = Molecular weight between entanglements (g mol-1)
Mw = Weight-average molecular weight of sol polymers (g mol-1)
Mn = Number-average molecular weight of sol polymers (g mol-1)
= average number of radicals per particle
NA = Avogadro’s number (mol-1)
R = Universal ideal gas constant, [cm3 bar mol-1 K-1]
RI = Rate of radical generation (or initiation)
RP = Rate of polymerization
T = temperature (K)
Tg = Glass transition temperature (°C)
xn = number-average degree of polymerization
Preface
xxvii
Greek symbols
τ = Relaxation time
ω1 = Debonding frequency of peel strength testing (Hz)
ω2 = Bonding frequency of peel strength testing (Hz)
χ = Polymer and solvent interaction parameter ((cal cm-3)1/2)
ρ = Density (g cm-3)
δ = Polymer’s solubility parameter ((cal cm-3)1/2)
θ = Contact angle (o)
γ = Surface tension (N m-1)
Preface
xxviii
LIST OF ABBREVIATIONS
AA = Acrylic acid
AFM = Atomic force microscopy
AMA = Allyl methacrylate
BA = Butyl acrylate
CTA = Chain transfer agent
DLS = Dynamic light scattering
DMA = Dynamic mechanical analysis
DSC = Differential scanning calorimetry
EHA = 2-Ethyl hexyl acrylate
GPC = Gel permeation chromatography
HEMA = 2-Hydroxy ethyl methacrylate
HQ = Hydroquinone
KPS = Potassium persulfate
MAA = Methacrylic acid
MMA = Methyl methacrylate
MWD = Molecular weight distribution
NDM = n-Dodecyl mercaptan
PDI = Polydispersity index
phm = parts per hundred parts of monomer
Preface
xxix
PSA = Pressure sensitive adhesive
PSD = Particle size distribution
PTFE = Polytetrafluoroethylene
SDS = Sodium dodecyl sulphate
THF = Tetrahydrofuran
Preface
xxx
LIST OF MOLECULAR FORMULAE
Acrylic acid: CH2=CHCOOH
Allyl methacrylate: CH2=C(CH3)-COO-CH2-CH=CH2
Butyl acrylate: CH2=CH-COO-(CH2)3-CH3
n-Dodecyl mercaptan: CH3-(CH2)11-SH
2-Hydroxy ethyl methacrylate: CH2=C(CH3)-COO-(CH2)2-OH
Hydroquinone: HO-(C6H4)-OH
Methyl methacrylate: CH2=C(CH3)-COO-CH3
Potassium persulfate: K2(SO4)2
Sodium bicarbonate: NaHCO3
Sodium dodecyl sulfate: CH3-(CH2)11-(SO4)-Na
Preface
xxxi
ACKNOWLEDGMENTS
I would like very much to thank all the people that have helped, supported and inspired
me during my doctoral studies.
First, I want to express my sincere gratitude to my supervisor, Dr. Marc A. Dubé,
for accepting me in his research group and also for his continuous encouragement,
patience and guidance over the years. He has taught me a lot about how to do research
and write research papers. In addition, Dr. Dubé has been very supportive. I had a baby
during my PhD study, and for about two years I was in Ottawa alone with my daughter.
When she was sick, I could not make it to school. Dr. Dubé was very understanding and
supportive regarding this. I have to say that without Dr. Dubé, I would not have been able
to finish my studies.
Secondly, I want to thank my committee members, Dr. Arturo Macchi, Dr. Jules
Thibault, and Dr. Christopher Lan for their constructive feedback. I am also grateful to
other professors, as well as the office and technical staff of the Department of Chemical
and Biological Engineering at the University of Ottawa. In particular, I thank Louis
Tremblay, Franco Ziroldo and Gérard Nina for their technical help.
Third, I thank the National Science and Engineering Research Council of Canada
and Omnova Solutions Inc for their financial support.
Fourth, I thank my colleagues for their kind help. Especially, I would like to
express my appreciation to Dr. Gabriela Fonseca for her sincere help with experiments,
valuable research discussions, as well as her genuine, moral support. Whenever my
experiments were running late, she would give me a hand and babysit my daughter.
Lastly, I want to thank my husband Jinsheng Zhou for his encouragement and support.

CHAPTER 1
INTRODUCTION
________________________________________________
Chapter 1
2
A pressure sensitive adhesive (PSA) can adhere immediately to a substrate upon
application of light pressure.[1] PSAs are viscoelastic, usually polymeric, materials, and
their performance is mainly evaluated by three properties: tack, peel strength and shear
strength. Tack reflects a PSA’s capability to deform and adhere quickly. Peel strength
shows its ability to resist removal by peeling. Shear strength measures its ability to resist
flow under shear forces and is mostly related to the cohesive strength of the PSA. In
general, it is not possible to increase shear strength simultaneously with tack and peel
strength. The reason is that in order to increase shear strength, the cohesive strength of
the PSAs must be enhanced; however, this will lower the PSA’s capability to deform and
flow, and accordingly its capability to wet the substrate.
PSAs are used widely in many commonplace articles such as tapes, labels and
shoes to high technology products such as electronic parts and controlled drug delivery
systems. PSAs can be classified into four categories based on their mode of production:
latex-based, solvent-based, hot melt and radiation cured PSAs.[2] Among these PSAs,
latex-based and solvent-based PSAs are more widely used. Moreover, lately latex-based
PSAs have become dominant in the PSA market due to their environmental compliance
and lower production cost. However, in some applications where very large shear
strength is needed, latex-based PSAs still cannot compete with solvent-based PSAs. The
reason is that in general, latex-based PSAs have much lower cohesive strength and
consequently much smaller shear strength, compared with solvent-based PSAs.
It is known that PSA performance is strongly related to its bulk properties (or
viscoelastic properties) as well as surface properties such as surface tension and surface
smoothness.[3-7] PSA viscoelastic properties can be measured via dynamic mechanical
Chapter 1
3
analysis (DMA) and these properties are controlled by the PSA’s polymer properties; for
example, the PSA’s copolymer composition, glass transition temperature (Tg) as well as
its polymer microstructure (i.e., gel content, molecular weight of sol polymers (Mw),
molecular weight between cross-linking points (Mc) and molecular weight between
entanglement points (Me)).[8-11] For PSAs with similar bulk properties, increasing their
surface tension and smoothness will lead to higher tack and peel strength.[12] In addition,
for PSAs with similar surface properties and composition, increasing their gel content
will result in larger shear strength but smaller tack and peel strength. Moreover, for
similar gel content PSAs with the same composition, the one having a continuous gel
network will have a larger cohesive strength and consequently, larger shear strength
compared to the one with the discontinuous network.[9-10] Although much research has
been done in the past to study the influence of PSAs’ polymer microstructure on their
performance, most of the work has focused on either latex-based or solvent-based PSAs.
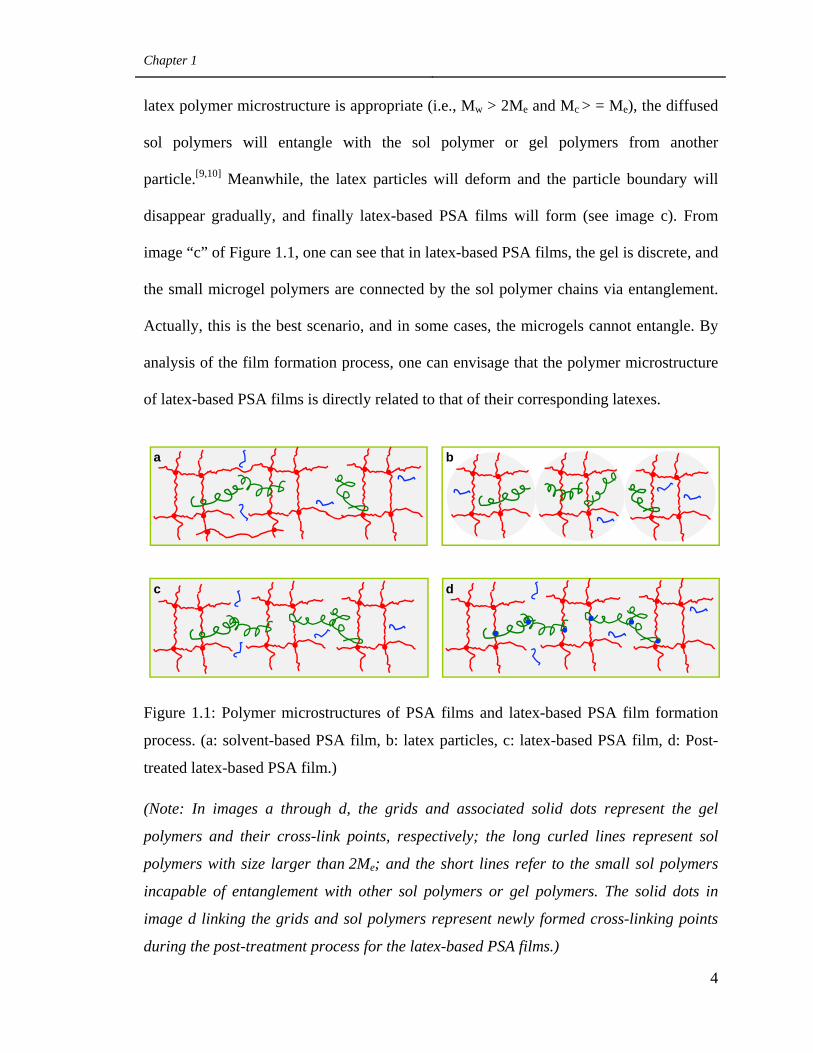
To our knowledge, only Tobing et al.[8,9] have systematically studied the polymer
microstructure difference between these two kinds of PSAs. They pointed out that the gel
network is discrete in latex-based PSAs, but continuous in solvent-based PSAs (see
image “a” and “b” of Figure 1.1). The discontinuous gel network endows latex-based
PSAs with a lower cohesive strength and accordingly, a lower shear strength.
The polymer microstructure of latex-based PSA films is related to the process for
forming these films. Images “b” and “c” of Figure 1.1 provide a good illustration of this
process. First, latexes are cast on a backing film (see image b for an example of latex’s
polymer microstructure). Then, the water in the latexes evaporates and at the same time,
some sol polymers of one latex particle will diffuse across the particle boundary. If the
Chapter 1
4
latex polymer microstructure is appropriate (i.e., Mw > 2Me and Mc > = Me), the diffused
sol polymers will entangle with the sol polymer or gel polymers from another
particle.[9,10] Meanwhile, the latex particles will deform and the particle boundary will
disappear gradually, and finally latex-based PSA films will form (see image c). From
image “c” of Figure 1.1, one can see that in latex-based PSA films, the gel is discrete, and
the small microgel polymers are connected by the sol polymer chains via entanglement.
Actually, this is the best scenario, and in some cases, the microgels cannot entangle. By
analysis of the film formation process, one can envisage that the polymer microstructure
of latex-based PSA films is directly related to that of their corresponding latexes.
Figure 1.1: Polymer microstructures of PSA films and latex-based PSA film formation
process. (a: solvent-based PSA film, b: latex particles, c: latex-based PSA film, d: Post-
treated latex-based PSA film.)
(Note: In images a through d, the grids and associated solid dots represent the gel
polymers and their cross-link points, respectively; the long curled lines represent sol
polymers with size larger than 2Me; and the short lines refer to the small sol polymers
incapable of entanglement with other sol polymers or gel polymers. The solid dots in
image d linking the grids and sol polymers represent newly formed cross-linking points
during the post-treatment process for the latex-based PSA films.)
d
a b
c
Chapter 1
5
By comparing the polymer microstructures of latex-based and solvent-based
PSAs, one can see that in order to improve the performance of latex-based PSAs to the
same level as that of solvent-based PSAs, their discrete microgel structure must be
changed into a continuous gel network. One possible way to achieve this is to produce
latex-based PSA films with functional groups and then post-treat these films. Tobing et
al.[9] reported that for gel free latex-based PSAs, if the Mw was larger than 2Me, then the
sol polymers could entangle with each other; for gel-containing PSAs, if Mc was larger
than Me and Mw was larger than 2Me but smaller than 20Me, then the sol polymers could
entangle with the microgels. After post-treating these two types of latex-based PSAs
under suitable conditions, some of the entanglement points could become cross-linking
points if there were functional groups in their vicinity able to react during the post-
treatment process. As a result, a continuous gel network could form in the post-treated
latex-based PSA films (see image d of Fig. 1), and consequently the shear strength could
be greatly increased. The post-treatment method was also used in other studies, but these
studies focused on optimizing the functional groups.[13-17] Up to now, even post-treated
latex-based PSAs still have a much lower shear strength compared to solvent-based PSAs
with similar properties such as gel content, Mc and Mw. Hence, more research is still
needed in order to improve the performance of latex-based PSA films.
The present study aimed to improve the performance of latex-based PSA films by
controlling their polymer microstructure. By verifying the microstructure of post-treated
latex-based PSAs, it was found that although their gel network is continuous, it is not
uniform. Weak points often exist around the edges of the original microgels in the treated
PSAs if the microgels are not connected by a sufficient number of cross-linking points.
Chapter 1
6
The presence of these weak points can lead to lower cohesive strength of the treated PSA
films and accordingly, lower shear strengths for these PSAs. The elimination of these
weak points could be accomplished in two steps: (1) Optimize the latex polymer
microstructure, so that a sufficient number of sol polymers entangle the microgels in the
latex-based PSA films; (2) post-treat the latex-based PSA films with good polymer
entanglements under appropriate conditions to ensure that a sufficient number of
entanglement points become cross-linking points in the gel network of the treated PSAs.
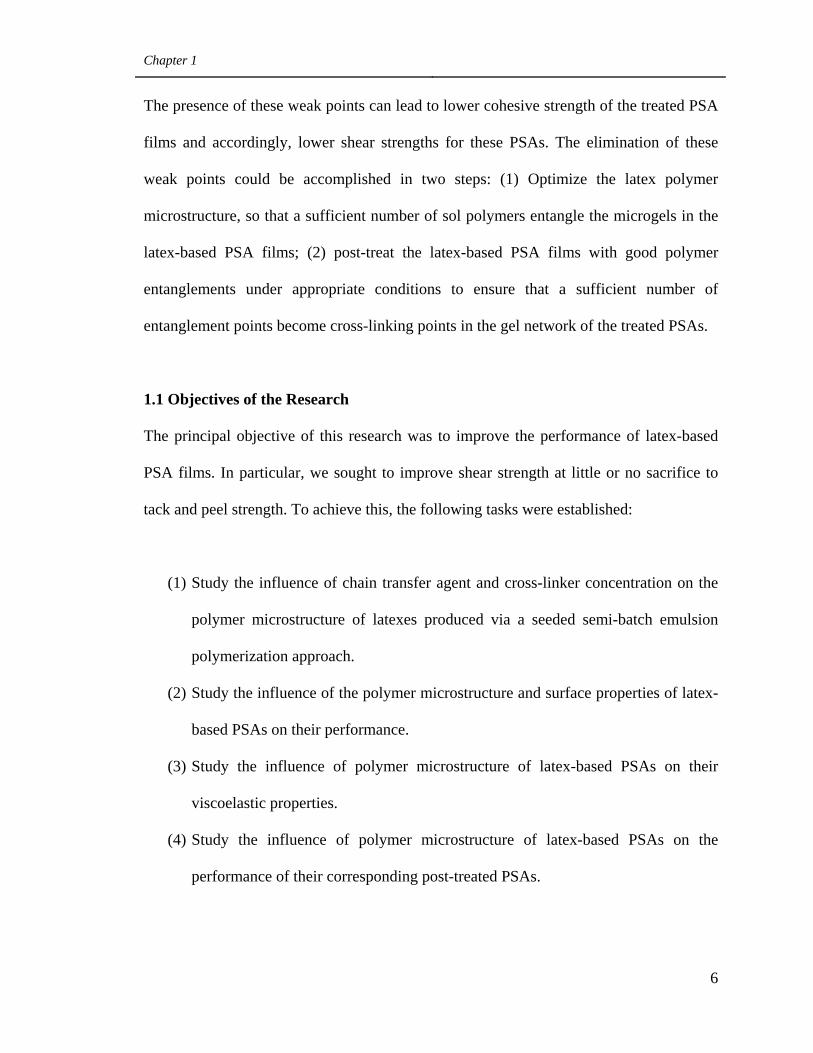
1.1 Objectives of the Research
The principal objective of this research was to improve the performance of latex-based
PSA films. In particular, we sought to improve shear strength at little or no sacrifice to
tack and peel strength. To achieve this, the following tasks were established:
(1) Study the influence of chain transfer agent and cross-linker concentration on the
polymer microstructure of latexes produced via a seeded semi-batch emulsion
polymerization approach.
(2) Study the influence of the polymer microstructure and surface properties of latex-
based PSAs on their performance.
(3) Study the influence of polymer microstructure of latex-based PSAs on their
viscoelastic properties.
(4) Study the influence of polymer microstructure of latex-based PSAs on the
performance of their corresponding post-treated PSAs.
Chapter 1
7
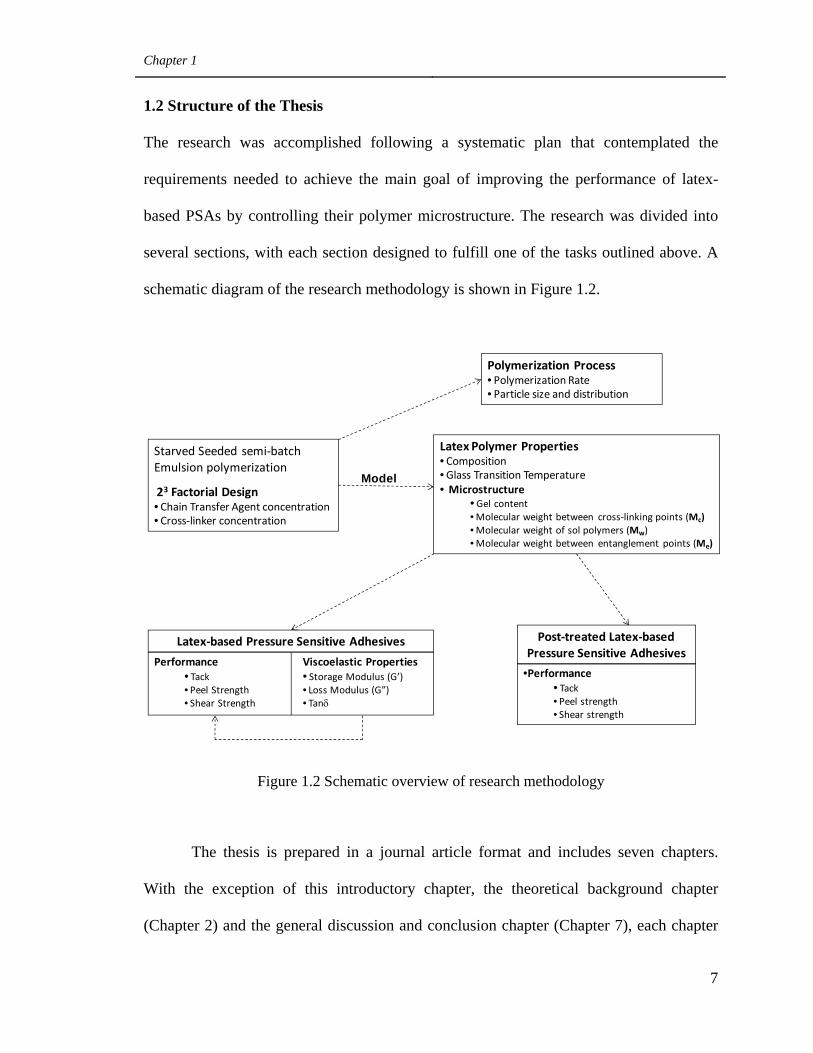
1.2 Structure of the Thesis
The research was accomplished following a systematic plan that contemplated the
requirements needed to achieve the main goal of improving the performance of latex-
based PSAs by controlling their polymer microstructure. The research was divided into
several sections, with each section designed to fulfill one of the tasks outlined above. A
schematic diagram of the research methodology is shown in Figure 1.2.
Figure 1.2 Schematic overview of research methodology
The thesis is prepared in a journal article format and includes seven chapters.
With the exception of this introductory chapter, the theoretical background chapter
(Chapter 2) and the general discussion and conclusion chapter (Chapter 7), each chapter
Starved Seeded semi‐batch Emulsion polymerization
23 Factorial Design• Chain Transfer Agent concentration• Cross‐linker concentration
Polymerization Process• Polymerization Rate• Particle size and distribution
Latex Polymer Properties• Composition•Glass Transition Temperature• Microstructure
• Gel content•Molecular weight between cross‐linking points (Mc)•Molecular weight of sol polymers (Mw)•Molecular weight between entanglement points (Me)
Latex‐based Pressure Sensitive Adhesives
Performance• Tack• Peel Strength• Shear Strength
Viscoelastic Properties• Storage Modulus (G’)• Loss Modulus (G”)• Tanδ
Model
Post‐treated Latex‐based Pressure Sensitive Adhesives
•Performance• Tack• Peel strength • Shear strength
Chapter 1
8
is associated with a section in the research plan shown in the scheme. In addition, each
chapter corresponds to an independent publication that has been or will be submitted to a
scientific journal. The details of each chapter are provided below.
Chapter 2: Theoretical Background and Research Methodology
This chapter provides the reader with concise background and fundamental information
necessary for understanding the subsequent chapters. It covers the principles of emulsion
polymerization as well as information related to PSA performance. This chapter also
includes a research methodology section. The section contains detailed information on
polymerization and characterization methods, which may not be provided in the
following chapters due to the concise nature of journal publications. Citations to thorough
reviews are also given for those readers who wish to expand their knowledge on emulsion
polymerization and latex-based PSAs.
Chapter 3: Manipulation of Chain Transfer Agent and Cross-linker Concentration
to Modify Latex Polymer Microstructure for Pressure Sensitive Adhesives. Qie L.,
Dubé M. A., European Polymer Journal 2010, 46(6): 1225-1236.
In this chapter are presented the results regarding the influence of CTA and cross-linker
concentration on the latexes’ polymer microstructure as well as the influence of the
latexes’ polymer microstructure on the corresponding PSAs’ performance. A starved
seeded semi-batch emulsion polymerization approach was used to produce butyl acrylate
(BA)/methyl methacrylate (MMA) latexes. During the polymerization process, the CTA
and cross-linker were added in three ways: (1) only CTA, (2) only cross-linker, (3) both
Chapter 1
9
CTA and cross-linker. The focus was on using both CTA and cross-linker to adjust latex
polymer microstructure. A range of BA/MMA latexes with differing polymer
microstructures was produced. However, the relationship between polymer
microstructure and PSA performance was difficult to establish for PSAs with similar gel
content, because almost all of medium and high gel content PSAs showed very low tack
and peel strength as well as extremely large shear strength readings.
Chapter 4: The Influence of Butyl Acrylate/Methyl Methacrylate/2-Hydroxy Ethyl
Methacrylate/Acrylic Acid Latex Properties on Pressure Sensitive Adhesive
Performance, Qie L., Dubé M. A., International Journal of Adhesion and Adhesives
2010, 30(7): 654-664.
This chapter describes our aims to resolve the poor PSA performance of the latexes
described in Chapter 3. More specifically, improving the tack and peel strength at no or
small sacrifice of the shear strength for medium and high gel content PSAs. For this
purpose, the CTA, cross-linker and emulsifier concentrations as well as the monomer
mixture composition were manipulated to produce latexes with versatile polymer
microstructures and compositions. The influence of the latexes’ polymer microstructure
and composition on the corresponding PSAs’ performance and viscoelasticity were
reported.
Chapter 5: Manipulating Latex Polymer Microstructure using Chain Transfer
Agent and Cross-linker to Modify PSA Performance and Viscoelasticity. Qie L.,
Dubé M. A., accepted by Macromolecular Reaction Engineering, in 2010.
Chapter 1
10
The similar gel content BA/AA (acrylic acid)/HEMA (2-hydroxy ethyl methacrylate)
latexes were produced via two different techniques and the results of this effort are
presented in Chapter 5. One technique was to vary the amount of CTA in the absence of
cross-linker, and the other was to use both CTA and cross-linker during a starved, seeded,
semi-batch emulsion polymerization process. The polymer microstructures of these
latexes were compared. In addition, the influence of the latexes’ polymer microstructure
on the corresponding PSAs’ viscoelastic properties and performance was studied.
Chapter 6: Influence of the Polymer Microstructures of Latex-based Pressure
Sensitive Adhesives on the Performance of their Post-treated PSAs. Qie L., Dubé M.
A. This chapter will be submitted to the Journal of Applied Polymer Science.
This chapter reports on a study of the influence of the polymer microstructures of
BA/AA/HEMA latexes (or their corresponding latex-based PSAs) on the performance of
the corresponding post-treated PSAs. More specifically, gel-free or very low gel content
latexes were used to study the influence of the amount of very small sol polymers (i.e.,
size < 2Me) in the original PSAs on the performance of the treated PSAs, under the
condition that the original PSAs had Mw larger than 2Me. For gel-containing latex-based
PSAs, the influence of the amount of either very small or very large sol polymers (i.e.,
size < 2Me or size > 20Me) in the original PSAs on the performance of post-treated PSAs
was studied under the condition that original PSAs had Mc larger than Me and also Mw
larger than 2Me but smaller than or close to 20Me. The possibility of simultaneously
increasing the Mc and Mw of the original latex-based PSAs on improving the performance
of their corresponding post-treated PSAs was also explored under the condition that the
Chapter 1
11
original PSAs had Mc larger or close to Me and also Mw larger than 2Me but smaller than
20Me In addition, the treated latex-based PSAs were compared with original latex-based
PSAs and solvent-based PSAs, under the condition of similar polymer properties (e.g.,
gel content, Mw and Mc) with respect to their gel network and PSA performance.
Chapter 7: General Discussion and Conclusions
This final chapter presents a general discussion relating all aspects of the thesis. A
summary of several possible ways for achieving this objective is provided.
1.3 References
1. Benedek I., Pressure-sensitive Adhesives and Applications 2004, 2nd Edition, Marcel
Dekker Inc., New York.
2. Jovanovic R., Dubé M. A., Journal of Macromolecular Science. Polymer Reviews
2004, C44: 1-51.
3. Deplace F., Carelli C., Mariot S., Journal of Adhesion 2009, 85: 18-54.
4. Lakrout H., Sergot P., Creton C., Journal of Adhesion 1999, 69: 307-359.
5. Qie L., Dubé M. A., International Journal of Adhesion and Adhesives 2010, 30(7):
654-664.
6. Zosel A., Journal of Adhesion 1994, 44: 1-16.
7. Li L., Tirrell M., Korba G. A., Journal of Adhesion 2001, 76: 307-334.
8. Tobing S. D., Klein A., Journal of Applied Polymer Science 2001, 79: 2230-2244.
9. S. D. Tobing, A. Klein, Journal of Applied Polymer Science 2001, 79: 2558-2564.
10. S. D. Tobing, A. Klein, Journal of Applied Polymer Science 2001, 81: 2109-2117.
Chapter 1
12
11. Zosel A., International Journal of Adhesion and Adhesives 1998, 18: 265-271.
12. Yang H. W. H., Journal of Applied Polymer Science 1995, 55: 645-652.
13. Papsin J., George A., Patent No.: US 6281298B1.
14. Kavanagh M. A., Anderson K.S., Erdogan B., Patent No.: US 7652103B2.
15. Krepski L.R., Filiatrault T. D., Mccracken S. D., Patent No.: US 7714076.
16. Filiatrault T. D., Kavanagh M. A., Anderson K. S., Patent No.: US 7652095.
17. Farwaha R., Boutillier D. N., Phan L., Patent No.: US 6541566.
CHAPTER 2
THEORETICAL BACKGROUND
AND RESEARCH METHODOLOGY
________________________________________________
Chapter 2
14
This chapter includes two sections. The first section covers the principles of emulsion
polymerization as well as the basic knowledge needed to understand PSA performance.
The second part provides detailed information about the research methodology employed
in this study.
2.1 Theoretical Background
2.1.1 Emulsion polymerization
Emulsion polymerization is a widely used process for producing synthetic latexes. It is a
chain growth reaction initiated by free radicals. It has an important feature of
heterogeneity: multiple phases (e.g., organic and inorganic phases) exist during the whole
polymerization process.[1]
The main ingredients for conducting emulsion polymerization include monomers,
water, emulsifier, and water-soluble initiator. In addition, chain transfer agent (CTA) and
cross-linker are often used in order to modify the latexes’ polymer properties.[1]
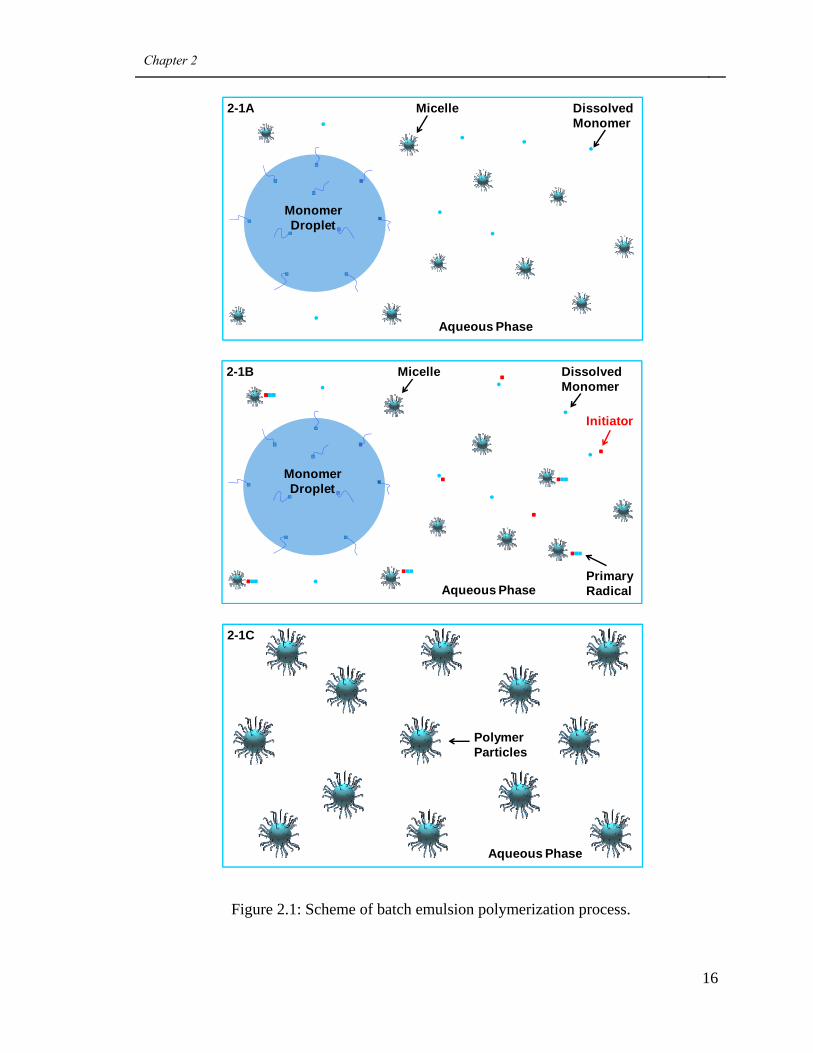
Emulsion polymerizations can be carried out in several ways; e.g., via a batch
process or a seeded semi-batch process. A schematic diagram of a batch process is shown
in Figure 2.1. In the batch process, usually water and emulsifier are first added to the
reactor and mixed. The amount of emulsifier equivalent to the critical micelle
concentration (CMC) will dissolve in the water, but any amounts beyond the CMC will
aggregate and form micelles. Next, monomer (or a monomer mixture) is added. Most of
the monomer will form large droplets (e.g., micrometer size) with emulsifier on their
Chapter 2
15
surface to stabilize them. The monomer will partition between the water phase, the
monomer droplets and the micelles (e.g., nanometer size) (see image 2-1A). The reactants
are heated to the desired temperature and, at that point, water-soluble initiator is added to
the reactor. The initiator dissociates in the aqueous phase and forms highly reactive free
radicals, which will polymerize the monomer dissolved in water, and thereafter become
primary radicals (see image 2-1B). Once these primary radicals reach a size where they
become hydrophobic, they will begin to migrate into the monomer-swollen micelles and
initiate the polymerization therein. At this point, the “nucleated micelle” is referred to as
a growing latex particle containing both monomer and polymer. As the polymerization
proceeds, the number of micelles decreases and the number of growing latex particles
increases until micelles are no longer present in the reaction mixture. After that, the
number of growing latex particles is constant. Under these conditions, the main locus of
polymerization is inside the growing latex particles. The monomer from the droplets
diffuses into the growing latex particles until the droplets disappear. After that point, the
number of latex particles remains constant, but the monomer concentration in the latex
particles gradually decreases with time. At the end of the polymerization, essentially all
of the monomer inside the latex particles is polymerized (although under a variety of
instances, residual monomer may be present). Hence, the final product, latex, consists of
polymer particles stabilized with emulsifiers and suspended in water (see image 2-1C).
Chapter 2
16
Figure 2.1: Scheme of batch emulsion polymerization process.
Monomer Droplet
Dissolved Monomer
Micelle
Aqueous Phase
2-1A
Monomer Droplet
Dissolved Monomer
Initiator
Micelle
Primary RadicalAqueous Phase
2-1B
Polymer Particles
Aqueous Phase
2-1C
Chapter 2
17
It is known that the polymerization rate is associated with the number of latex
particles (N), the monomer concentration in the growing particle ([M]) as well as the rate
coefficient for propagation (kP), which depends on both the monomer composition and
polymerization temperature (see Equation 2-1[1]).
2 1
In Equation 2-1, is the average number of radicals per particle, and NA is Avogadro’s
number.
The molecular weight of the latex polymer is related to the number of latex
particles (N), the rate coefficient for propagation (kP), and the initiator and monomer
concentrations (see Equation 2-2[1]).
2 2
In Equation 2-2, xn is the number-average degree of polymerization, which is associated
with the size of the latex polymer chains; and RI is the rate of radical generation, which is
related to the initiator concentration as well as the polymerization temperature. (Note:
The effect of CTA and cross-linker concentration on the size of the latex polymer chains
is not considered in Equation 2-2.)
As mentioned earlier, during batch emulsion polymerization, the monomer
concentration in the growing latex particles [M] is not constant for the whole process.
Chapter 2
18
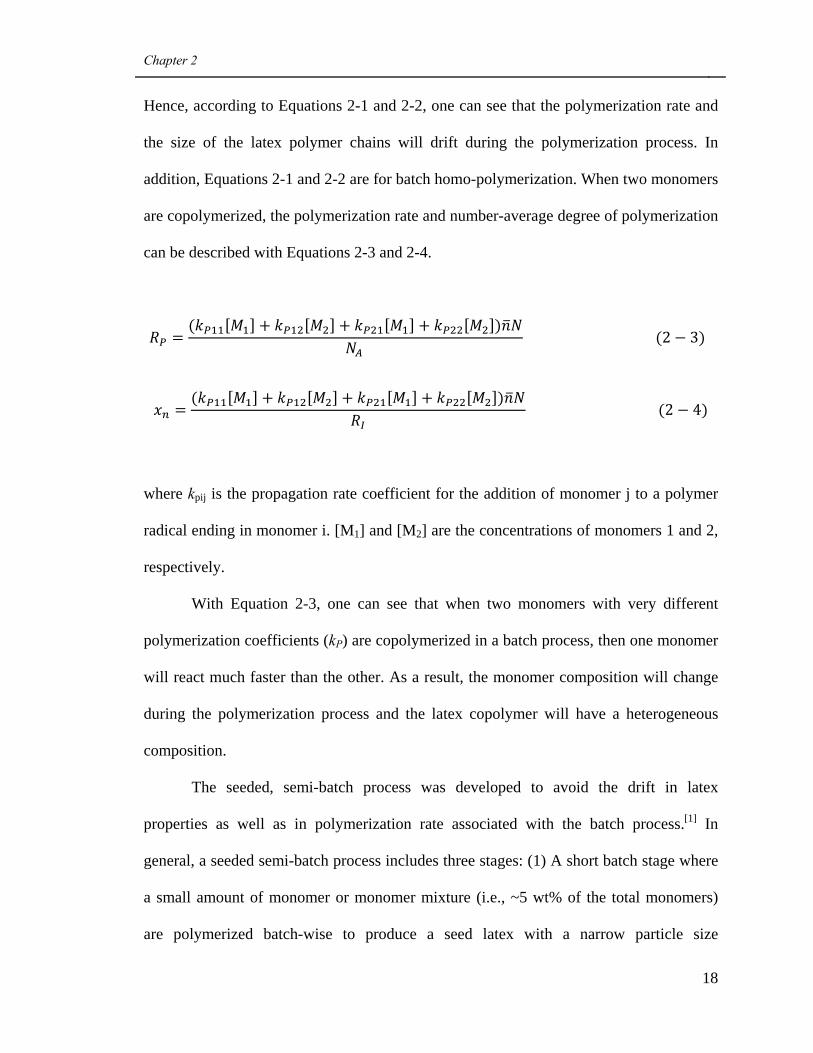
Hence, according to Equations 2-1 and 2-2, one can see that the polymerization rate and
the size of the latex polymer chains will drift during the polymerization process. In
addition, Equations 2-1 and 2-2 are for batch homo-polymerization. When two monomers
are copolymerized, the polymerization rate and number-average degree of polymerization
can be described with Equations 2-3 and 2-4.
2 3
2 4
where kpij is the propagation rate coefficient for the addition of monomer j to a polymer
radical ending in monomer i. [M1] and [M2] are the concentrations of monomers 1 and 2,
respectively.
With Equation 2-3, one can see that when two monomers with very different
polymerization coefficients (kP) are copolymerized in a batch process, then one monomer
will react much faster than the other. As a result, the monomer composition will change
during the polymerization process and the latex copolymer will have a heterogeneous
composition.
The seeded, semi-batch process was developed to avoid the drift in latex
properties as well as in polymerization rate associated with the batch process.[1] In
general, a seeded semi-batch process includes three stages: (1) A short batch stage where
a small amount of monomer or monomer mixture (i.e., ~5 wt% of the total monomers)
are polymerized batch-wise to produce a seed latex with a narrow particle size
Chapter 2
19
distribution; (2) A substantially longer feeding stage during which a monomer emulsion
and aqueous initiator solution are often added very slowly to grow the seed latex without
generating new particles (Note: Monomer emulsion generally includes monomers, water,
emulsifiers, and in some cases CTA and/or cross-linker); (3) A short cook stage to fully
react the remaining monomer in the latex particles. From the above description, one can
see that almost all of the latex polymers are produced in the feeding stage during a seeded
semi-batch emulsion polymerization process. In addition, compared with the batch
process, the seeded semi-batch process offers improved latex polymer property control.
For example, if a proper polymerization formulation and feeding rates are adopted, then
no coagulation between latex particles or formation of secondary latex particles will
occur. Hence the number of latex particles (N) will be constant. Meanwhile, if the
feeding rates of the monomer emulsion and initiator solution are constant, then the
monomer and initiator concentrations in the growing latex particles will be constant
during the whole feeding stage. Under this condition (i.e., constant number of latex
particles as well as constant monomer and initiator concentrations), the latex polymers
produced during the feeding stage will have consistent polymer properties (see Equation
2-4). Moreover, compared with the batch process, seeded semi-batch processes can also
offer better control of the latex copolymer composition. For example, if the monomer
emulsion and initiator solution are fed slowly enough (i.e., a monomer-starved feed
condition), then the fed monomers will be able to react more or less instantaneously.
Hence, under this condition, even though monomers with different reactivity are present,
the resulting latex copolymer will have a homogeneous composition equal to the
composition of the monomer mixture in the monomer emulsion feed. One should keep in
Chapter 2
20
mind that the starved-feed condition results in high polymer concentrations throughout
the polymerization and a higher propensity for branching and cross-linking reactions may
exist. This is sometimes a desirable property but may also be deleterious to the eventual
polymer properties.
Since the seeded semi-batch emulsion polymerization process has so many
advantages over the batch process, it is more widely used in industry. In addition, it is
also used in this study to produce latexes for making latex-based PSA films.
2.1.2 Control of latexes’ polymer microstructure
In a polymer material, the size of polymer chains varies a lot (e.g., from small movable
and dissolvable sol polymers to very larger polymer network (or gel polymer)). Polymer
microstructure is often used to describe the size and packing of the polymer chains in a
polymer material. It covers molecular weight of sol polymers (Mw), gel content and
structure, molecular weight between cross-linking points (Mc) and molecular weight
between entanglement points (Me). Polymer microstructure greatly affects the polymer
material’s bulk properties (or viscoelastic properties) as well as the performance of the
final products (e.g., PSAs).[2-16] Hence, in the past, much research has been done on
manipulating the latexes’ polymer microstructures. The method used including varying
initiator, CTA and cross-linker concentrations, initiator and monomer feed rates,
monomer composition, and seed properties, during a seeded semi-batch emulsion
polymerization process.[17-24]
Among the above mentioned polymerization conditions, CTA and cross-linker
concentrations are the two most effective and commonly used factors for tailoring
Chapter 2
21
emulsion polymer microstructural properties. It is well known that adding CTA can
decrease Mw in the case of gel-free latex, or in the case of gel-containing latex, decrease
gel content.[18,21,25-26] Adding cross-linker can increase gel content, but decrease Mc and
Mw.[19] In any of these two cases, it is not possible to manipulate the gel content
independently of the Mw. In contrast, the effect of combining CTA and cross-linker is not
well studied. Chauvet et al.[22] reported some unique phenomena caused by combining
CTA and cross-linker in a seeded semi-batch emulsion polymerization of butyl acrylate
(BA) and acrylic acid (AA). They showed how gel content and Mw could be increased
simultaneously at the same cross-linker concentration by decreasing the concentration of
CTA. However, the latexes produced with both CTA and cross-linker covered a narrow
gel content range from 71 to 88%. Kajtna et al.[27] also studied the effect of combining
CTA and cross-linker but in a batch suspension polymerization of ethyl-hexyl acrylate
and ethyl acrylate. They reported that at the same cross-linker concentration, the addition
of CTA could lead to a lower gel content and higher Mw. The trend in Mw is
contradictory to what was reported by Chauvet et al. In addition, they found the polymer
molecular weight distribution (MWD) of the sol polymer was very broad when CTA and
cross-linker were combined; i.e., the polydispersity ranged from 21 to 27. The molecular
weight between cross-linking points (Mc), which has a crucial influence on the properties
of high gel content polymer, was not reported in either of the above two studies.
Based on the above information regarding manipulating latexes’ polymer
microstructure, it was decided to use three techniques in this study to produce latexes
with versatile polymer microstructure via a seeded semi-batch emulsion polymerization
approach. The three techniques were using CTA only, using cross-linker only, as well as
Chapter 2
22
using both CTA and cross-linker. My research focused on studying the polymer
microstructures of the latexes produced with the third technique. More specifically, our
goal was to study the Mc and Mw change over a broad gel content range for latexes
produced by simultaneously using CTA and cross-linker. In addition, the latexes
produced with the three different techniques were compared with respect to their polymer
microstructures, their corresponding polymer materials’ bulk properties (or viscoelastic
properties) as well as their corresponding final products’ (i.e., PSAs’) performance. This
way, the better polymer microstructures of latexes for improving the performance of
latex-based PSAs could be identified.
2.1.3 Control of the polymer microstructure of latex-based PSAs
Besides controlling the latexes’ polymer microstructure, post-treating a latex-based PSA
is another effective way to manipulate a PSA’s polymer microstructure.[12,13] For
example, it is well known that if post-treating gel-containing latex-based PSAs with
proper polymer microstructure, their discrete microgel structure can be transformed into a
continuous gel network, which can lead to great improvement in the PSA’s
performance.[12,13] In this study, post-treating latex-based PSAs was also used to modify
their polymer microstructure. In addition, the influence of the original PSAs’ polymer
microstructures on the treated PSAs’ polymer microstructures and performance was also
studied. Information on how to optimize the polymer microstructures of latex-based
PSAs in order to get treated PSAs with better performance is provided.
Chapter 2
23
2.1.4 Pressure sensitive adhesives
Pressure sensitive adhesives (PSAs) are viscoelastic materials. They are permanently
tacky and can stick to a substrate even under light, finger pressure. The performance of
PSAs is typically evaluated by tack, peel strength and shear strength. Tack reflects the
adhesive’s capability to deform and adhere quickly. Peel strength refers to its ability to
resist removal by peeling. Shear strength is a measure of its ability to resist flow under
shear forces.[28]
To achieve desirable performance, commercial PSAs are commonly produced
using at least two monomers.[28] One monomer, such as butyl acrylate (BA) and 2-ethyl
hexyl acrylate (EHA), will yield a polymer with a low glass transition temperature (Tg)
(e.g., <-40°C), and therefore impart good deformability and flow ability to the PSA. In
contrast, the other monomer, such as methyl methacrylate (MMA), methacrylic acid
(MAA), and acrylic acid (AA), will lead to a polymer with a high Tg (e.g., >100°C), and
accordingly endow the PSA with sufficient cohesive strength. In this study, BA/MMA,
BA/MMA/HEMA (2-hydroxy ethyl methacrylate), and BA/AA/HEMA were chosen as
the monomer systems.
Commercial PSAs are often produced via three techniques: hot-melt techniques,
solution polymerization and emulsion polymerization.[29] The first method uses melt
copolymer to make PSA films, the second uses polymer organic solutions, and the third
one uses latex, which is polymer particles stabilized by emulsifiers and suspended in
water. Among these three methods, the emulsion polymerization technique is considered
more environmental friendly, since the production and application of latex and latex-
based PSA involve water instead of organic solvents. Latex-based PSAs have become
Chapter 2
24
dominant in the PSA market due to their environmental compliance and lower production
costs. However, they still cannot replace solvent-based PSAs in some applications where
very large shear strength is required, since at similar tack and peel strength, solvent-based
PSAs usually have much larger shear strength, compared with latex-based PSAs.[12-13]
The better performance of solvent-based PSAs is due to their continuous gel network; in
latex-based PSAs, the gel is present as discrete microgels.[12-13] Thus, the performance of
latex-based PSAs must be improved in order to expand their range of applications, and
the effective way to achieve this is to optimize their polymer microstructure.
It is well known that the PSA performance is related to surface properties as well
as bulk properties (or viscoelastic and/or rheological properties).[30-33] For example,
increasing a PSA’s surface tension and smoothness as well as decreasing the amount of
impurity (e.g., emulsifier) on a PSA’s surface could lead to higher tack and peel strength.
In addition, a PSA’s rheological properties in the small strain regime have been
characterized with dynamic mechanical analysis (DMA) at small strain (e.g., ~1%). It
was found that the larger the storage modulus (G’), the larger the PSA’s capability to
resist deformation and consequently the larger its shear strength.[34] The peel strength was
proportional to the ratio of the loss modulus at the debonding test frequency to the
storage modulus at the bonding test frequency (i.e., G”(ω1)/G’(ω2)) as shown in Equation
2-5.[35]
2 5
Chapter 2
25
Equation 2-5 was established according to the peel strength test procedure, which
involves both a bonding and debonding process. If a PSA’s storage modulus at the
bonding frequency is smaller, then the PSA can deform and flow more easily, leading to
better wetting of the PSA on a substrate during the bonding process and consequently,
larger peel strength. If a PSA’s loss modulus at the debonding frequency is larger, then
the PSA can dissipate more energy during the debonding process. In order to peel such a
PSA off the substrate, a larger force will be needed, and therefore the PSA shows larger
peel strength.
A PSA’s elastic properties have been characterized with a tensile test, which
involves a much larger strain scale than for the DMA test and is related to the PSA’s peel
strength.[35-36] If a PSA experiences a larger strain during the tensile test, then it is very
possible that it would form longer fibrils during the debonding processing of a tack and
peel strength test. Consequently, it would experience larger strain during the debonding
process, dissipate more energy, and therefore exhibit larger tack and peel strength.
A PSA’s bulk properties depend on their composition, Tg and polymer
microstructure. At similar Tg and polymer microstructure, compared with a PSA with a
non-polar group, a PSA with polar groups tends to have larger cohesive strength, due to
the larger interaction force between the polymer chains. Consequently, it will exhibit
larger shear strength.[28] At similar polymer microstructure, increasing the Tg of a PSA
will lead to larger cohesive strength and consequently larger shear strength. The influence
of polymer microstructure on a PSA’s bulk properties and consequently, its performance,
has attracted much more research interest, compared with that of composition and Tg.
The reason is that the polymer microstructure is very versatile, and therefore
Chapter 2
26
manipulating a PSA’s microstructure is a very effective way to modify its bulk properties
and performance.
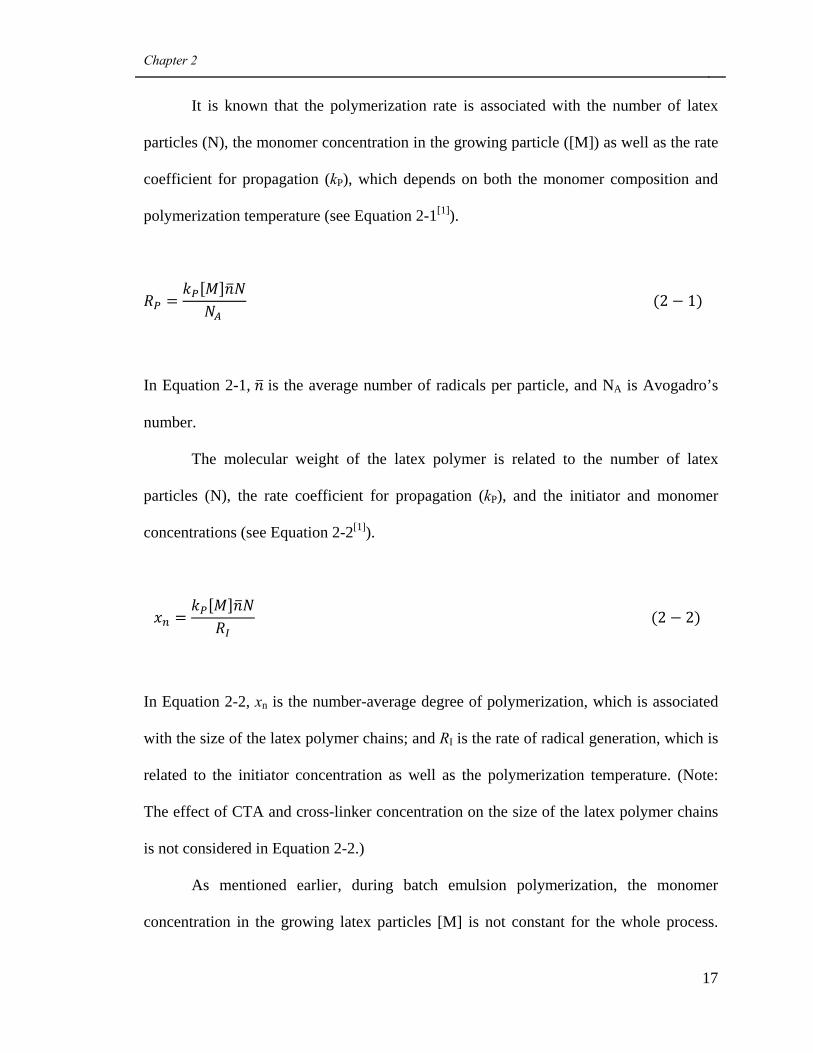
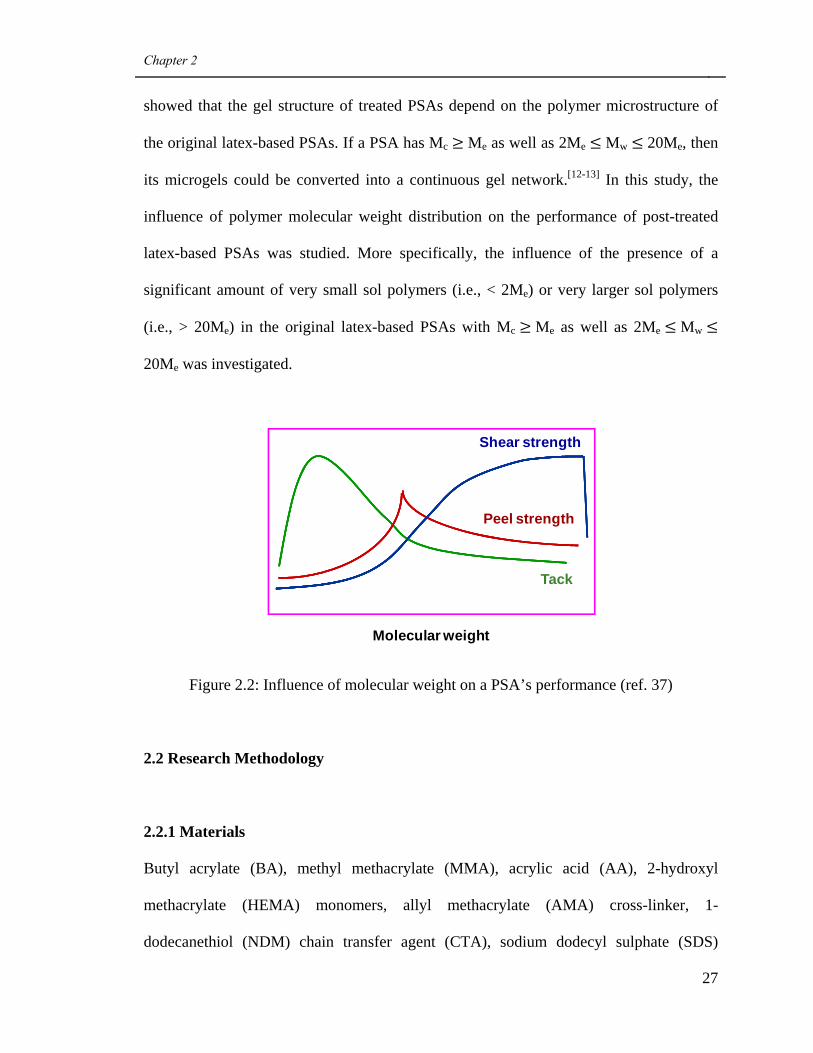
Hereafter, the effect of polymer microstructure is summarized for PSAs made
with polymer generated using traditional methods (i.e., using only CTA, only cross-linker
or neither). For gel free or low gel content PSAs, with increasing molecular weight, their
cohesive strength will increase while deformability and flow ability will decrease. As a
result, their shear strength increases, but tack and peel strength will exhibit a maximum
point then decrease (see Figure 2.2). Gel content is usually the dominant factor among all
the polymer microstructure properties (e.g., gel content, Mc, Mw and Me) with respect to
their influence on a PSA’s bulk properties and performance. In general, increasing gel
content tends to increase a PSA’s cohesive strength while decreasing their deformability.
Consequently, with the increase in gel content, shear strength increases, while tack and
peel strength decrease. Prior to our research, latex polymers with similar composition and
gel contents, which were generated using traditional methods, were never compared for
microstructural properties to those generated with the simultaneous use of CTA and
cross-linker. Moreover, the influence of their polymer microstructure on their PSAs’
viscoelastic properties and performance have never been studied either.
A PSA’s gel structure plays an important role on bulk properties and
performance. For example, at similar gel contents, a continuous gel structure will endow
a PSA with significantly larger shear strength compared with discrete one possessing a
microgel structure.[12-13] In latex-based PSAs, the gel is present as a discrete microgel.
Thus, in order to improve their performance, the microgel structure should be
transformed into a continuous gel network by post-treating the PSAs. Tobing et al.
Chapter 2
27
showed that the gel structure of treated PSAs depend on the polymer microstructure of
the original latex-based PSAs. If a PSA has Mc Me as well as 2Me Mw 20Me, then
its microgels could be converted into a continuous gel network.[12-13] In this study, the
influence of polymer molecular weight distribution on the performance of post-treated
latex-based PSAs was studied. More specifically, the influence of the presence of a
significant amount of very small sol polymers (i.e., < 2Me) or very larger sol polymers
(i.e., > 20Me) in the original latex-based PSAs with Mc Me as well as 2Me Mw
20Me was investigated.
Figure 2.2: Influence of molecular weight on a PSA’s performance (ref. 37)
2.2 Research Methodology
2.2.1 Materials
Butyl acrylate (BA), methyl methacrylate (MMA), acrylic acid (AA), 2-hydroxyl
methacrylate (HEMA) monomers, allyl methacrylate (AMA) cross-linker, 1-
dodecanethiol (NDM) chain transfer agent (CTA), sodium dodecyl sulphate (SDS)
Molecular weight
Shear strength
Peel strength
Tack
Chapter 2
28
surfactant, sodium bicarbonate (NaHCO3) buffer, potassium persulfate (KPS) initiator
and hydroquinone (HQ) inhibitor were all obtained from Sigma Aldrich and were used as
supplied. All the above materials were reagent grade except HEMA, which had a purity
of 97 wt%. Distilled deionized water (DI-H2O) was used throughout the study. Ammonia
(30 wt% in H2O for pH control) was obtained from British Drug House. All solvents used
in the polymer characterization such as tetrahydrofuran (THF, HPLC grade, EMD
Chemicals), toluene (99.8%, Fisher Scientific) and di-iodomethane (99%, Sigma-Aldrich)
were also used as supplied by the manufacturer. Nitrogen gas (Linde Canada) was used to
purge the reactor. PTFE porous membranes with pore size of 0.2 μm, for use in gel
content measurements, were purchased from Cole-Parmer Canada.
2.2.2 Polymer latex preparation
All latexes were produced via a starved seeded semi-batch emulsion polymerization
approach. The polymerization process includes three stages. The first stage was a batch
seed production step, the second was a continuous stage involving feeding a monomer
mixture and initiator stock solution, and the third stage was a batch finishing stage to
increase the monomer conversion to completion.
For the initiator stock solution, 0.8996 g KPS was dissolved into 90 g DI-H2O.
The amount of KPS fed to the reaction was 0.26 parts per hundreds parts monomer (phm)
for all runs. The monomer emulsion stock solution consisted of 6.7 g SDS dissolved into
89 g DI-H2O, along with 338.4 g monomer mixture. The composition of the monomer
mixture was not the same for all runs. Varying amounts of the chain transfer agent,
Chapter 2
29
NDM, and cross-linker, AMA, were added to the monomer emulsion stock solution prior
to the reaction.
A homogeneous aqueous solution containing 202 g DI-H2O, 0.048 g NaHCO3,
and 0.45 g SDS was charged into a one-litre Mettler-Toledo LabMax™ reactor. The
stainless steel reaction vessel was equipped with an anchor stirring blade and various feed
and sampling ports. The stirring speed was maintained at 250 rpm throughout the runs.
The reactor was purged with N2 and the reactor temperature was increased to 70˚C within
30 min. An initiator solution containing 0.45 g KPS and 15 g DI-H2O and a monomer
mixture containing 12 g monomer mixture were charged to the reactor to form the seed
latex. The composition of the monomer mixture was not the same for all runs. The
temperature was then raised to 75˚C within 5 min and the seed polymerization was
continued for an additional 10 min. At that point, the initiator and monomer emulsion
stock solutions were added slowly to the reactor using two separate metering pumps
(Model: Prominent gamma G/4b; Prominent Fluid Controls Inc.). The feeding times for
the initiator and the monomer emulsion stock solutions were 3.5 and 3.0 h, respectively,
for some experiments, or 3 and 2.5 h, respectively, for the others. After the feed was
completed, the reaction was allowed to proceed for an additional 50 min to increase
monomer conversion. The latex was then cooled to below 30°C, and NH4OH (30 wt.%)
was added to increase the pH to about 3.5 or 5.5 in order to enhance the shelf stability of
the latex.
Chapter 2
30
2.2.3 Latex particles characterization
The latexes’ particle size and size distribution were measured using a Dynamic Light
Scattering (DLS) instrument (Malvern NanoS Zetasizer) with an angle of 176°. One drop
of the latex was diluted with 2 mL DI-H2O in a 4 mL polystyrene cuvette. The reported
diameter is an intensity-weighted average particle size. The polydispersity index values
(PDI) given by the instrument reflect a narrower distribution with PDI values closer to
0.01. Latexes having a PDI smaller than 0.4 were considered to have a narrow particle
size distribution. The detection range of the instrument was 0.6 nm to 6 μm.
2.2.4 Latex solid content
A gravimetric method was used to calculate latex solid content. About 1 g latex was
weighed and put in an aluminum dish, then the dish was dried in a fume hood at room
temperature for a week and then in an vacuum oven at 30°C for 2 days to get dry
polymers. The solid content (S) was calculated with the following equation.
2 6
In the above equation, WDLS is the weight of the dry latex sample; WLS is the
weight of the latex sample.
2.2.5 Monomer Conversion Characterization
Instantaneous monomer conversion was calculated based on the total amount of
monomer added to the reactor up to the sampling time; while overall monomer
Chapter 2
31
conversion was calculated based on the total amount of monomer in the polymerization
recipe. The calculation was complicated, and used the information about both the
polymerization (i.e., formulation and feeding rate) and latex (i.e., solid content). In the
Appendix, the detailed calculation procedure for Run 1 from Chapter 3 is provided. In
this chapter, only two basic equations are provided for calculating the monomer
conversions as follows:
,,
, 2 7
,, 2 8
In the above two equations, xI,t and xO,t are the instantaneous and overall
monomer conversion at feeding time t, respectively; WP,t is the amount of polymer
produced in the reactor up to feeding time t; WTM, t is the total amount of monomer added
to the reactor up to the sampling time; and WTM is the total amount of monomer in the
formulation, which is the same as the total amount of monomer added to the reactor up to
the end of polymerization.
2.2.6 Latex polymer characterization
Gel content
For gel content measurement, a modification of the method by Tobing and Klein14] was
used. Around 0.03 g dry polymer was weighed and sealed in a PTFE coated membrane
pouch. Then the membrane pouch was immersed into 25 mL THF in a 100 mL glass
Chapter 2
32
bottle. The bottle was then tightly capped and put on a shaker for 24 h. The membrane
pouch was then removed and dried in a fume hood until it reached a constant weight. The
weight of the remaining dry gel was measured and the gel content was calculated using:
2 9
In the above equation, WDG and WDP are the weight of the dry gel and dry
polymer, respectively.
Weight- and number-average molecular weight of the sol polymers (Mw and Mn)
The THF solution remaining from the gel content test was concentrated, if necessary, and
analyzed for sol polymer molecular weight (i.e., Mw and Mn). The solution was filtered
using a 0.45 μm syringe PTFE filter (Pall Corporation) and then analyzed with a Waters
Gel Permeation Chromatography (GPC) instrument equipped with a Differential
Refractive Index detector, a manual injector and three Waters Styragel columns (HR6,
HR4 and HR3) in series. THF was used as the eluent and the flow rate was set at 0.3
mL/min. The internal temperature was set at 37°C. The data were analyzed using
Empower 2 software from Waters. The calibration curve included a set of 12 polystyrene
standards (EasiCal from Polymer Laboratories) with a range of 162 to 6,035,000 g/mol.
In the Mark-Houwink equation ( ), the k and α parameters of the latex
copolymers were calculated according to their composition. For example, the Mark-
Houwink parameters, K and α, for BA and MMA are 1.1 x 10⁻⁴ dL/g and 0.708, and 1.28
x 10-4 dL/g and 0.690, respectively.[41] If the copolymer composition was BA/MMA
Chapter 2
33
(weight ratio: 90/10), then the K and α would be 1.12 x 10⁻⁴ dL/g and 0.706. For the
copolymer having a very large amount of BA and a small and negligible amount of
HEMA and/or AA, the K and α of the copolymer were taken as that of the polyBA.
Measurement of the molecular weight between cross-linking points (Mc)
To measure Mc, a new method was established. About 0.03 g of dry gel polymer was
weighed and put in a 15 mL glass vial with a diameter of ~10 mm, and then 10 mL
toluene was added. The bottle was then tightly sealed with a plastic cap and put on a
shaker for a range of times (0.5, 1, 5 and 20 h). Next, the toluene was removed using a
glass pipette, and the solvent-swelled gel was weighed. It was found that the amount of
toluene absorbed by the dry gel did not change significantly with swelling time. Thus, the
shortest swelling time, 0.5 h, was chosen for future Mc tests. To calculate Mc, the
following Equation was used:[14]
/2
1 2 10
In the above equation, V1 is the molar volume of toluene, 106.3 cm3/mol;[14] and
ρP is the density of copolymer. The density was calculated according to the copolymer
composition. For example, given that the density of PBA and PMMA are 1.06 g/cm3 and
1.19 g/cm3, respectively,[1] the density of BA/MMA (weight ratio: 90/10) copolymer is
1.073g/cm3. φ is the volume fraction of gel polymer in the swollen gel and can be
calculated as:[14]
Chapter 2
34
2 11
In the above equation, WP and WS are the weight fractions of the gel polymer and solvent
(toluene) in the swollen gel, respectively. ρS and ρP are the densities of solvent (0.8669
g/cm3) and copolymer (1.073 g/cm3), respectively.[14]
In Equation 2-10, χ is the copolymer and solvent interaction parameter calculated
as:[14]
0.34 2 12
δ1 is the solubility parameter of the copolymer. It was calculated accordingly to the
composition of the copolymer. For example, given that the solubility parameters for
polyBA and polyMMA are 8.9 and 9.2 (cal/cm3)1/2, respectively, the solubility parameter
of BA/MMA (weight ratio: 90/10) copolymer is calculated as 8.93 (cal/cm3)1/2. δ2 is the
solubility parameter for toluene, 8.9 (cal/cm3)1/2.[1,14]
Molecular weight between entanglement points (Me)
All of the latex copolymer produced in this study had a polydisperse molecular weight
distribution. Their molecular weight between entanglement points (Me or Me, polydisperse)
was calculated with the plasticizer model:[38]
Chapter 2
35
,,
. 2 13
Me,monodisperse is the entanglement molecular weight for copolymers with narrow
molecular weight distribution, and it can be obtained with the copolymer composition.
For example, given that the Me,monodisperse for polyBA and polyMMA are 20773 and 10013
g/mol, respectively,[14,39] the Me,monodisperse for BA/MMA (weight ratio: 90/10) copolymer
is calculated as 19697 g/mol. For gel free copolymers, φ is the weight percentage of the
sol polymers having size larger than Me,monodisperse, and this value can be obtained with the
molecular weight distribution curve from GPC measurement. For gel containing
copolymers, φ is the total weight percentage of the sol polymers having size larger than
Me,monodisperse and the gel polymers having Mc larger than Me,mondisperse.
Glass transition temperature (Tg)
Two methods were used to measure Tg: Differential Scanning Calorimetry (DSC) and
dynamic mechanical analysis (DMA), the latter to be described in the DMA test section
below. A DSC Model Q1000 from TA Instruments was used. It was equipped with an
auto sampler, a refrigerated cooling system and nitrogen as the purge gas. For the
measurement, ~0.04 g of dry polymer was weighed into standard DSC hermetic
aluminum sample pans. The analysis was performed using a modulated DSC method
with modulation amplitude of ±1°C every 60 s. The sample was cooled to -80°C and
followed by a heating ramp of 3°C/min until the sample reached 150°C for BA/MMA
and BA/MMA/HEMA copolymers or 80oC for BA/AA/HEMA copolymers. The lower
Chapter 2
36
temperature of 80oC was adopted for BA/AA/HEMA copolymers in order to avoid
possible reaction between AA and HEMA at high temperature (e.g., >100oC). The Tg was
calculated from the inflection point in the Reversed Heat Flow curve using the software
provided.
2.2.7 Latex-based PSAs
PSA films preparation
In this study, there were two kinds of latex-based PSA films: the original ones and their
post-treated counterparts. To prepare the original PSA films, two steps were taken. First,
latexes were coated on a 50 μm thick Mylar sheet with either a 30# or 60# Meyer rod to
make PSA films with thicknesses of either ~33 μm or 60 μm. Then, the films were dried
and conditioned for 24 h at 23oC and relative humidity of 50% before being tested. To
prepare the post-treated PSA films, the conditioned films with thickness of ~33 μm were
heated via two steps: (1) heating at 90oC for 10 min in order to remove the remaining
water in the PSAs; (2) heating at a higher temperature (e.g., 120 or 126oC) in order to
react the carboxyl and hydroxyl groups from AA and HEMA units. The post-treated PSA
films were also conditioned for 24 h at 23oC and relative humidity of 50% prior to
testing.
Testing the performance of latex-based PSA films
Tack, peel strength and shear strength were measured at 23oC and relative humidity of
50% according to the Pressure Sensitive Tape Council standards PSTC-6, PSTC-1 and
PSTC-7, respectively.[40] A Universal Instron tester was used to evaluate loop tack and
Chapter 2
37
peel strength. For tack, a strip of 25.4 mm x 177.8 mm was cut from the film and was
formed into a loop with the adhesive side facing outward. Approximately 25.4 mm at
both ends of the strip was masked with tape and inserted into the upper grip. The
instrument moved the upper grip downward at a speed of 300 m/min until an area of 25.4
mm x 25.4 mm came into contact with the stainless steel substrate mounted into the lower
grip. Next, the tester moved the upper grip upwards at the same speed while recording the
force needed to de-bond the loop from the substrate. The maximum force per unit length
of the contact area necessary to remove the adhesive was reported as loop tack. PSTC-1
Test Method A evaluates peel strength at a peel angle of 180°. A PSA film specimen of
25.4 mm x 304.8 mm was cut. The strip was laminated onto a stainless steel substrate
with the help of a 2040 g roll coater. The roll coater was passed through the film front to
back twice (i.e., along the length of the film). The dwell time did not exceed one minute.
The substrate and the strip were inserted into the grips and the upper grip was set to move
upward at a speed of 300 mm/min. The average force per unit length of the contact area
required to peel the strip from the substrate was recorded and reported as peel strength.
Lastly, PSTC-7 measures shear strength. A specimen of 25.4 mm x 152.4 mm of the film
was cut. The strip was laminated onto a stainless steel substrate with a contact area of
25.4 mm x 25.4 mm and then placed in the home-built shear tester using a C-clamp. A
500 g weight was suspended at the end of the strip. The time needed for the PSA films to
fall off the testing panel was recorded automatically using Labview™ software as the
shear strength. In addition, some PSA films had shear strengths too large to be measured
within a practical time period with a contact area of 25.4 mm x 25.4 mm. Hence a
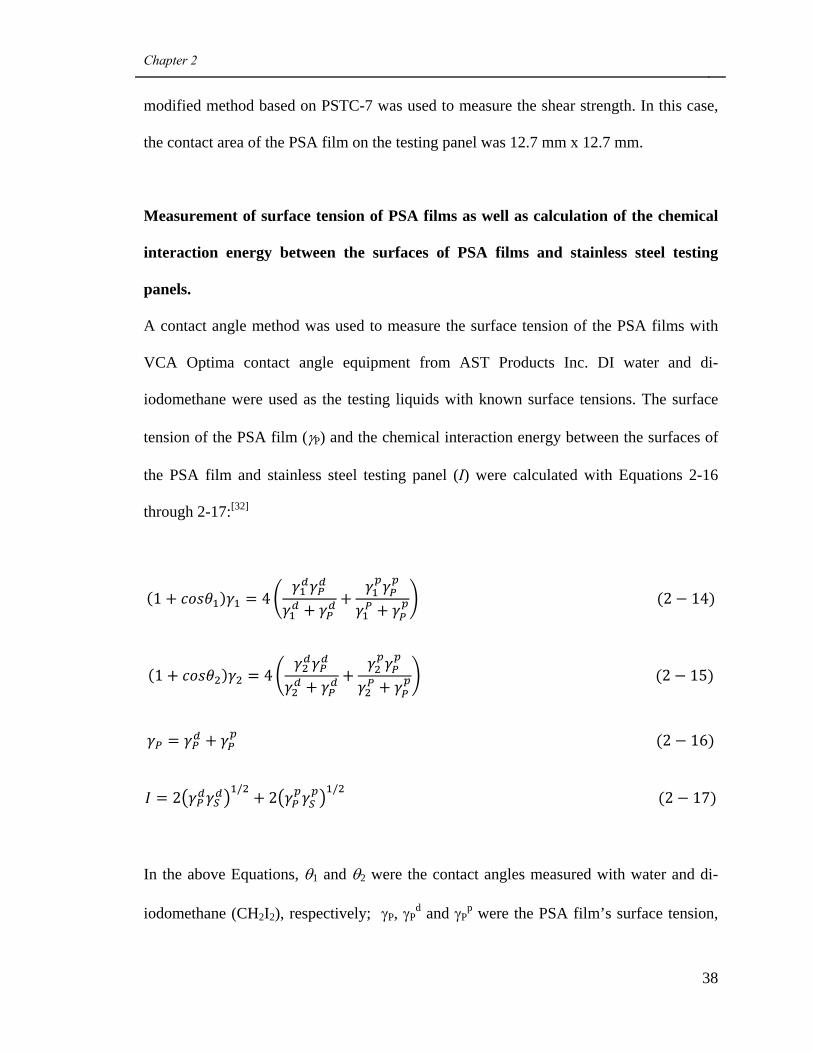
Chapter 2
38
modified method based on PSTC-7 was used to measure the shear strength. In this case,
the contact area of the PSA film on the testing panel was 12.7 mm x 12.7 mm.
Measurement of surface tension of PSA films as well as calculation of the chemical
interaction energy between the surfaces of PSA films and stainless steel testing
panels.
A contact angle method was used to measure the surface tension of the PSA films with
VCA Optima contact angle equipment from AST Products Inc. DI water and di-
iodomethane were used as the testing liquids with known surface tensions. The surface
tension of the PSA film (γP) and the chemical interaction energy between the surfaces of
the PSA film and stainless steel testing panel (I) were calculated with Equations 2-16
through 2-17:[32]
1 4 2 14
1 4 2 15
2 16
2 / 2 / 2 17
In the above Equations, θ1 and θ2 were the contact angles measured with water and di-
iodomethane (CH2I2), respectively; γP, γPd and γP
p were the PSA film’s surface tension,
Chapter 2
39
its dispersion and polar components; γ1 (72.8 dyne/cm), γ1d (22.1 dyne/cm) and γ1
p (50.7
dyne/cm) are the surface tension of water, its dispersion and polar components,
respectively; γ2 (50.8 dyne/cm), γ2d (44.1 dyne/cm) and γ2
p (6.7 dyne/cm) are surface
tension of di-iodomethane, its dispersion and polar components, respectively; γSd (29
dyne/cm) and γSp (15 dyne/cm) are the dispersion and polar component of the surface
tension of the stainless steel testing panel.[32] (Note: 1 dyne/cm = 10-3 N/m)
Characterization of the surface of PSA films with Atomic Force Microscopy (AFM)
The PSA film surfaces were imaged by AFM in tapping mode using a Multimode
Scanning Probe Microscope (Veeco Instruments) and silicon cantilevers (Vistaprobes
from NanoScience Instruments). The tip of the cantilever had a pyramidal geometry and
the tip radius was 10 nm. The cantilevers had a resonant frequency of 300 kHz with a
spring constant of 40 N/m. Height and phase images were taken in air at ambient
temperature. The scan speed was 0.9 Hz and the scanned area was about 5 μm x 5 μm.
Measurement of the viscoelastic properties of PSA films
The viscoelastic properties of PSA films were characterized using DMA with a RDA III
rheometer (TA Instruments). The geometry used was a pair of parallel plates with
diameter of 25 mm, and the PSA sample thickness was 1.8+/-0.2 mm. The PSA samples
were prepared as follows: First, a certain amount of latexes were put in home-made
silicon release paper dishes (3.5 cm x 3.5 cm). Then, the latexes were dried for 4 weeks
to obtain PSA films with constant weight as well as a thickness of about 0.6 mm. Finally,
Chapter 2
40
three of these films were pressed together with the DMA plates to form one PSA sample
with a thickness of ~1.8 mm.
The DMA measurements were done in two ways to measure the PSA films’
storage modulus (G’) and loss modulus (G”): temperature sweep and frequency sweep.
Both measurements were done under a compression mode and with a small and constant
strain of 1%. The temperature sweep curves were measured by heating the PSA sample
from -30 to 180°C (or 150oC) at a rate of 3°C/min and under a shear frequency of 1.591
Hz. The PSA copolymers’ Tg could also be obtained via temperature sweep. It is the
temperature corresponding to the maximum point of the tanδ curve. The frequency sweep
tests were performed in two ways: (1) In order to get a frequency master curve, frequency
sweeps were carried out at different temperatures including -35, -23, 0, 23, 50 and 80°C;
for each temperature, the frequency sweep data were obtained at 0.05, 0.1, 0.2, 0.5, 1, 2,
5, 10, 20 and 50 Hz. The frequency master curve was built with the 23oC frequency
sweep as reference. (2) The frequency sweep tests were performed at 23 and 83°C over a
frequency range of about 80 to 0.02 Hz. A frequency master curve was built using the
time-temperature superposition method and with the data at 23oC as the reference. It was
found that the frequency master curves generated for a PSA film via the above two
methods were identical. In addition, compared with the former method, the latter method
was easier.
2.3 References
1. Lovell P. A., El-Aasser M. S., Emulsion Polymerization and Emulsion Polymers
1997, John Wiley & Sons, New York.
Chapter 2
41
2. Elizalde O., Vicente M., Leiza J. R., Polymer Reaction Engineering 2002, 10(4): 265-
283.
3. Elizalde O., Vicente M., Plessis C., Journal of Coatings Technology and Research
2004, 1(1): 45-51.
4. Gower M. D., Shanks R. A., Macromolecular Chemistry and Physics 2004, 205(16):
2139-2150.
5. Gower M. D., Shanks R. A., Journal of Applied Polymer Science 2004, 93(6): 2909-
2917.
6. Gower M. D., Shanks R. A., Macromolecular Chemistry and Physics 2005, 206(10):
1015-1027.
7. Gower M. D., Shanks R. A., Journal of Polymer Science Part B-Polymer Physics
2006, 44(8): 1237-1252.
8. Jovanovic R., McKenna T. F., Dubé M. A., Macromolecular Materials and
Engineering 2004, 289(5): 467-474.
9. Jovanovic R., Ouzineb K., McKenna T. F., Dubé M. A., Macromolecular Symposium
2004, 206: 43-56.
10. Jovanovic R., Dubé M. A., Industrial and Engineering Chemistry Research 2005,
44(17): 6668-6675.
11. Jovanovic R., Dubé M. A., The Canadian Journal of Chemical Engineering 2007,
85(3): 341-349.
12. Tobing S. D., Klein A., Sperling L.H., Journal of Applied Polymer Science 2001,
81(9): 2109-2117.
Chapter 2
42
13. Tobing S. D., Klein A., Journal of Applied Polymer Science 2001, 79(14): 2558-
2564.
14. Tobing S. D., Klein A., Journal of Applied Polymer Science 2001, 79(12): 2230-
2244.
15. Zosel A., Ley G., Macromolecules 1993, 26(9): 2222-2227.
16. Zosel A., International Journal of Adhesion and Adhesives 1998, 18(4): 265-271.
17. Plessis C., Arzamendi G., Leiza J. R., Macromolecules 2000, 33(14): 5041-5047.
18. Plessis C., Arzamendi G., Leiza J. R., Journal of Polymer Science Part A: Polymer
Chemistry 2001, 39(7): 1106-1119.
19. Bouvier-Fontes L., Pirri R., Asua J. M., Journal of Polymer Science Part A: Polymer
Chemistry 2005, 43(20): 4684-4694.
20. Bouvier-Fontes L., Pirri R., Magnet S, Asua J. M., Macromolecules 2005, 38(7):
2722-2728.
21. Shen H. Z., Zhang J. Y., Liu S. J., Journal of Applied Polymer Science 2008, 107(3):
1793-1802.
22. Chauvet J., Asua J. A., Leiza J. R., Polymer 2005, 46(23): 9555-9561.
23. Elizalde O., Arzamendi G., Leiza J. R., Industrial and Engineering Chemistry
Research 2004, 43(23): 7401-7409.
24. Plessis C., Arzamendi G., Agnely M., Journal of Polymer Science Part A: Polymer
Chemistry 2002, 40(16): 2878-2883.
25. Barudio I., Guillot J., Fevotte G., Journal of Polymer Science Part A: Polymer
Chemistry 1998, 36(1): 157-168.
Chapter 2
43
26. Former C., Castro J., Fellows C. M., Journal of Polymer Science Part A: Polymer
Chemistry 2002, 39(20): 3335-3349.
27. Kajtna J., Golob J., Krajnc M., International Journal of Adhesion and Adhesives
2009, 29(2): 186-194.
28. István B., Pressure-Sensitive Adhesives and Applications 2004, Marcel Dekker Inc.,
New York.
29. Jovanovic R., Dubé M. A., Journal of Macromolecular Science. Polymer Reviews
2004, C44(1): 1-51.
30. Flanigan C. M., Crosby A. J., Shull K. R., Macromolecules 1999, 32(21): 7251-7262.
31. Li L. H., Tirrell M., Korba G. A., Journal of Adhesion 2001, 76(4): 307-334.
32. Yang H. W. H., Chang E. P., Trends in Polymer Science 1997, 5(11): 380-384.
33. Zosel A., Colloid and Polymer Science 1985, 263(7): 541-553.
34. Chang E. P., Journal of Adhesion 1991, 34, 189-200.
35. Deplace F., Carelli C., Mariot S., Journal of Adhesion 2009, 85, 18-54.
36. Lakrout H., Sergot P., Creton C., Journal of Adhesion1999, 69, 307-359.
37. Satas D., Handbook of Pressure Sensitive Adhesive Technology 1989, 2nd Edition,
Van Nostrand Reinhold, New York.
38. Wool R. P., Polymer Interfaces, Structure, and Strength 1995, Hanser/Gardner
Publications, Cincinnati.
39. Fetters L. J., Lohse D. J., Richter D., Macromolecules 1994, 27(17): 4639-4647.
40. Pressure Sensitive Tape Council, Test Methods for Pressure Sensitive Adhesive
Tapes 2004, Northbrook, Illinois.
Chapter 2
44
41. Brandrup J., Immergut E.H., Grulke E.A., Polymer Handbook 1999, 4th Edition, John
Wiley & Sons.
CHAPTER 3
MANIPULATION OF CHAIN TRANSFER AGENT AND
CROSS-LINKER CONCENTRATION TO MODIFY LATEX
POLYMER MICROSTRUCTURE FOR PRESSURE
SENSITIVE ADHESIVES
________________________________________________
Chapter 3
46
Manipulation of Chain Transfer Agent and Cross-linker Concentration to Modify
Latex Polymer Microstructure for Pressure Sensitive Adhesives
Lili Qie and Marc A. Dubé
Department of Chemical and Biological Engineering,
University of Ottawa, 161 Louis Pasteur Pvt., Ottawa, Ontario, Canada K1N 6N5
Abstract
N-dodecyl mercaptan (NDM) chain transfer agent and allyl methacrylate (AMA) cross-
linker were used to manipulate latex properties in a starved seeded semi-batch emulsion
polymerization of butyl acrylate (BA) and methyl methacrylate (MMA) or with a third
monomer, acrylic acid (AA). Latexes with higher gel content and lower sol polymer
molecular weight (Mw) were produced by adding only AMA. On the other hand, latexes
with lower gel content and Mw were produced by adding only NDM. In addition, at a
constant AMA concentration (0.2 phm), the addition of NDM (0.2 phm) decreased gel
content, increased molecular weight between cross-linking points (Mc), and decreased
Mw. Adding more NDM (to a total of 0.4 phm) further decreased the gel content, while
decreasing the tested Mc and increasing Mw. It was also found that using higher
concentrations of both AMA and NDM could produce latex with similar gel content, but
smaller Mc and Mw, compared to the latex produced at lower concentrations of both
NDM and AMA. Regarding the influence of AA, gel content was increased and Mw was
significantly decreased with an increase in AA concentration and a decrease in MMA
Chapter 3
47
concentration. The performance of the latexes was evaluated for application as a pressure
sensitive adhesive (PSA).
3.1 Introduction
Emulsion polymers are becoming increasingly important due to their environmental
compliance.[1] They are widely used in many applications such as pressure sensitive
adhesives (PSA),[2] coatings,[3,4] paints and binders. The performance of these products
greatly depends on the latex polymer properties such as composition, glass transition
temperature (Tg), gel content and structure, molecular weight between cross-linking
points (Mc), molecular weight of sol polymers (Mw), and molecular weight between
entanglement points (Me).[5-9]
Acrylic monomers are extensively used to produce latex; usually two or more
monomers are copolymerized via a seeded semi-batch approach to provide latexes with
desirable properties. With this approach, much research has been performed on
manipulating polymer properties by using different reaction conditions such as initiator,
chain transfer agent (CTA) and cross-linker concentrations,[10-15] initiator and monomer
feed rates,[10] monomer composition,[11,16] seed properties,[17] etc.
Among the above mentioned polymerization conditions, CTA and cross-linker
concentrations are the two most effective and commonly used factors for tailoring
emulsion polymer micro-structural properties. It is well known that adding CTA can
decrease Mw in the case of gel-free latex, or in the case of gel-containing latex, decrease
gel content.[11,14,18-19] Adding cross-linker can increase gel content, but decrease Mc and
Mw.[12] In any event, it is not possible to manipulate the gel content independently of the
Chapter 3
48
Mw. However, the effect of combining CTA and cross-linker is not well studied.[15,20]
Chauvet et al. reported some unique phenomena caused by combining CTA and cross-
linker in a seeded semi-batch emulsion polymerization of butyl acrylate (BA) and acrylic
acid (AA).[15] They showed how gel content and Mw could be increased simultaneously at
the same cross-linker concentration by decreasing the concentration of CTA. However,
the latexes produced with both CTA and cross-linker covered a narrow gel content range
from 71 to 88%. Kajtna et al. also studied the effect of combining CTA and cross-linker
but in a batch suspension polymerization of ethyl-hexyl acrylate and ethyl acrylate.[20]
They reported that at the same cross-linker concentration, the addition of CTA could lead
to a lower gel content and higher Mw. The trend in Mw is contradictory to what was
reported by Chauvet et al.[15] In addition, they found the polymer molecular weight
distribution (MWD) of the sol polymer was very broad when CTA and cross-linker were
combined; for example, the polydispersity ranged from 21 to 27. The molecular weight
between cross-linking points (Mc), which has a crucial influence on the properties of high
gel content polymer, was not reported in either study.
In the present study, the combined influence of CTA and cross-linker on various
polymer micro-structural properties was studied via starved seeded semi-batch emulsion
polymerizations of BA/methyl methacrylate (MMA) and BA/MMA/AA. Our goal was to
explore a broad gel content range, measure the Mc, and test bulk polymer properties using
dynamic mechanical analysis (DMA) in order to produce latexes with similar gel contents
but differing Mc and Mw. The influence of AA on the polymer micro-structural properties
was also studied.
Chapter 3
49
The BA/MMA or BA/(MMA + AA) weight ratio was set at 90/10 in order to
produce latexes for use as PSAs. PSAs are viscoelastic materials and can stick to a
surface even under very light pressure. They are usually polymerized from two or more
monomers, one with a low Tg (e.g., BA) to provide tackiness and the other with a high Tg
(e.g., MMA and AA) to provide cohesive strength. The performance of PSAs is usually
evaluated by tack, peel strength and shear strength. Tack measures how easily a PSA can
stick to a substrate, peel strength tests how difficult a PSA can be removed from a
substrate by peeling, and shear strength reflects the cohesive strength of the PSA and is
defined as the time needed for a PSA to fall from a testing panel under a certain vertical
shear force.
Up to now, many studies have been focused on studying the influence of polymer
micro-structural properties on PSA performance.[5-9] Armed with a better understanding
of the combined effects of CTA and cross-linker on polymer micro-structural properties,
in this study, we attempted to relate the PSA performance to these properties.
3.2 Experimental Methods
3.2.1 Materials
The monomers including BA (reagent grade), MMA (reagent grade), AA (reagent grade),
and allyl methacrylate (AMA, reagent grade), the chain transfer agent, 1-dodecanethiol
(NDM, reagent grade), the surfactant, sodium dodecyl sulphate (SDS, GC grade), the
buffer, sodium bicarbonate (NaHCO3), the initiator, potassium persulfate (K2S2O8) and
the inhibitor hydroquinone (HQ) were obtained from Sigma Aldrich and were used as
supplied. Distilled deionized water (DDI-H2O) was used throughout the study. Ammonia
Chapter 3
50
(30% by weight in H2O) was obtained from British Drug House. All solvents used in the
polymer characterization such as tetrahydrofuran (THF, HPLC grade, EMD Chemicals)
and toluene (99.8%, Fisher Scientific), were also used as supplied by the manufacturer.
Nitrogen gas (Linde Canada) was used to purge the reactor. PTFE porous membranes
with pore size of 0.2 μm, for use in gel content measurements, were purchased from
Cole-Parmer Canada.
3.2.2 Latex preparation
All runs were performed as seeded semi-batch emulsion polymerizations in three stages.
The first stage was a batch seed production step, the second was a continuous stage
involving feeding a monomer mixture and initiator stock solution, and the third stage was
a batch finishing stage to increase the monomer conversion to completion.
For the initiator stock solution, 0.8996 g KPS was dissolved into 90 g DDI-H2O.
The amount of KPS fed to the reactor was 0.26 parts per hundreds parts monomer (phm)
for all runs. The monomer emulsion stock solution consisted of 6.7 g SDS dissolved into
89 g DDI-H2O, along with 304.6 g BA and 33.8 g MMA. Varying amounts of the chain
transfer agent, NDM, and cross-linker, AMA, were added to the monomer emulsion stock
solution prior to the reaction.
To start the polymerization, a homogeneous aqueous solution containing 202 g
DDI-H2O, 0.048 g NaHCO3, and 0.45 g SDS was charged into a one-liter Mettler-Toledo
LabMax™ reactor. The stainless steel reaction vessel was equipped with an anchor
stirring blade and various feed and sampling ports. The stirring speed was maintained at
250 rpm throughout the runs. The reactor was purged with N2 and the reactor temperature
Chapter 3
51
was increased to 70 oC within 30 min. Then an initiator solution containing 0.45 g KPS
and 15 g DDI-H2O and a monomer mixture containing 10.8 g BA and 1.2 g MMA were
charged to the reactor to form the seed latex. The temperature was then raised to 75 oC
within 5 min and the seed polymerization was continued for an additional 10 min. At that
point, the stock initiator solution and monomer emulsion were added slowly to the reactor
using two separate metering pumps (Model: Prominent gamma G/4b; Prominent Fluid
Controls Inc.). The feeding times for the initiator and the monomer emulsion stock
solutions were 3.5 and 3.0 h, respectively. After the feed was completed, the reaction was
allowed to proceed for an additional 50 min to increase monomer conversion. The latex
was then cooled to below 30°C, and NH4OH (30 wt%) was added to increase the pH to
about ~3.5 in order to enhance the shelf stability of the latex.
3.2.3 Polymer latex characterization
Particle sizes were measured using a Dynamic Light Scattering (DLS) instrument
(Malvern NanoS Zetasizer) with an angle of 176°. One drop of the latex was diluted with
2 mL DDI-H2O in a 4 mL polystyrene cuvette. The reported diameter is an intensity-
weighted average particle size. The polydispersity index values (PDI) given by the
instrument reflect a narrower distribution with PDI values closer to 0.01. Latexes having
a PDI smaller than 0.4 were considered to have a narrow particle size distribution. The
detection range of the instrument was from 0.6 nm to 6 μm.
A standard gravimetric method was used to calculate the monomer conversion to
polymer. The calculation was complicated, and used the information of both the
polymerization (i.e., formulation and feeding rates) and the latex (i.e., solid content). The
Chapter 3
52
detailed monomer conversion calculation procedure is provided in the Appendix of this
thesis. To calculate latex solid content, around 1 g of latex sample was weighed and put
in an aluminum dish, then the dish was dried in a fume hood at room temperature and
then in an vacuum oven at 30°C for 2 days to remove the unreated monomer and water.
The solid content was the weight ratio of the dry latex to wet latex.
For the measurement of gel content, a modification of the method by Tobing and
Klein[6] was used. Around 0.03 g dry polymer was weighed and sealed in a PTFE coated
membrane pouch. Then the membrane pouch was immersed into 25 mL THF in a 100
mL glass bottle. The bottle was then tightly capped and put on a shaker for 24 h. The
membrane pouch was then removed and dried in a fume hood until it reached a constant
weight. The weight of the remaining dry gel was taken and the gel content was calculated
using:
3 1
In the above equation, WDG and WDP are the weight of dry gel and dry polymer,
respectively.
The THF solution remaining from the gel content test was concentrated, if
necessary, and analyzed for sol polymer molecular weight. The solution was filtered
using a 0.45 μm syringe PTFE filter (Pall Corporation) and then analyzed with a Waters
Gel Permeation Chromatography (GPC) instrument equipped with a Differential
Refractive Index detector, a manual injector and three Waters Styragel columns (HR6,
HR4 and HR3) in series. THF was used as the eluent and the flow rate was set at 0.3
Chapter 3
53
mL/min. The internal temperature was set at 37°C. The data were analyzed using
Empower 2 software from Waters. The calibration curve included a set of 12 polystyrene
standards (EasiCal from Polymer Laboratories) with a range of 162 to 6,035,000 g/mol.
The Mark-Houwink parameters, K and α, for BA and MMA are 1.1 x 10⁻⁴ dL/g and
0.708, and 1.28 x 10⁻⁴ dL/g and 0.690, respectively.[44]
To measure Mc, a new method was established. About 0.03 g of dry gel polymer
was weighed and put in a 15 mL glass vial with a diameter of ~10 mm, and then 10 mL
toluene was added. The bottle was then tightly sealed with a plastic cap and put on a
shaker for a range of times (0.5 h, 1 h, 5 h and 20 h). Next the toluene was removed using
a glass pipette, and the solvent-swelled gel was weighed. It can be seen from Figure 3.1
that the amount of toluene absorbed by the dry gel did not change significantly with
swelling time. Thus, the shortest swelling time, 0.5 h, was chosen for future Mc tests. To
calculate Mc, the following Equation was used:
/2
ln 1 3 2
where V1 is the molar volume of toluene, 106.3 cm3/mol;[6] and ρP is the density of
polymer (1.06 g/cm3 and 1.19 g/cm3 for PBA and PMMA respectively,[1] 1.073g/cm3 for
the BA/MMA (90/10 by weight) copolymer). φ is the volume fraction of gel polymer in
the swollen gel and can be calculated as follows:
3 3
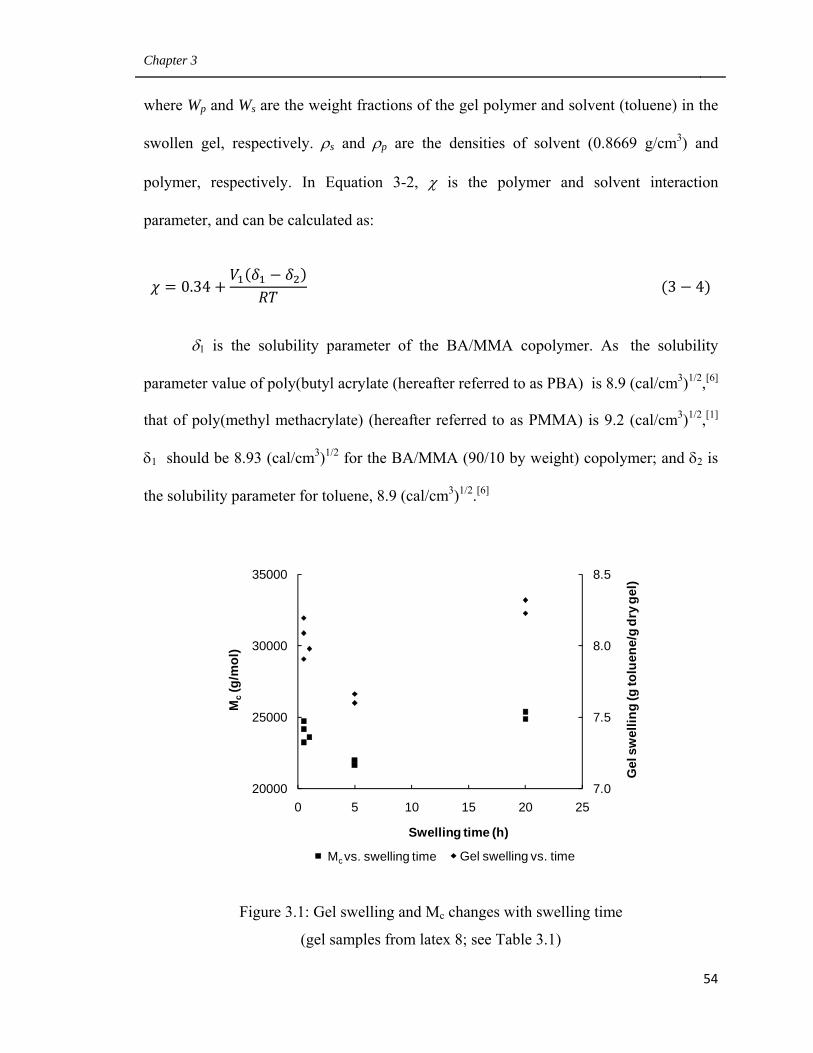
Chapter 3
54
where Wp and Ws are the weight fractions of the gel polymer and solvent (toluene) in the
swollen gel, respectively. ρs and ρp are the densities of solvent (0.8669 g/cm3) and
polymer, respectively. In Equation 3-2, χ is the polymer and solvent interaction
parameter, and can be calculated as:
0.34 3 4
δ1 is the solubility parameter of the BA/MMA copolymer. As the solubility
parameter value of poly(butyl acrylate (hereafter referred to as PBA) is 8.9 (cal/cm3)1/2,[6]
that of poly(methyl methacrylate) (hereafter referred to as PMMA) is 9.2 (cal/cm3)1/2,[1]
δ1 should be 8.93 (cal/cm3)1/2 for the BA/MMA (90/10 by weight) copolymer; and δ2 is
the solubility parameter for toluene, 8.9 (cal/cm3)1/2.[6]
Figure 3.1: Gel swelling and Mc changes with swelling time
(gel samples from latex 8; see Table 3.1)
7.0
7.5
8.0
8.5
20000
25000
30000
35000
0 5 10 15 20 25
Gel
sw
ellin
g (g
tolu
ene/
g dr
y ge
l)
Mc
(g/m
ol)
Swelling time (h)
Mc vs. swelling time Gel swelling vs. timeMc vs. swelling time

Chapter 3
55
3.2.4 Glass transition temperature measurement
Two methods were used to test the polymers’ glass transition temperatures (Tg):
differential scanning calorimetry (DSC) and dynamic mechanical analysis (DMA), the
latter to be described in the DMA test section below.
A differential scanning calorimeter (DSC) Model Q1000 from TA Instruments
was used. It was equipped with an auto sampler, a refrigerated cooling system and
nitrogen as the purge gas. To do the test, about 0.04 g of dry polymer was weighed into
standard DSC hermetic aluminum sample pans. The analysis was performed using a
modulated DSC method with modulation amplitude of ±1°C every 60 s. The sample was
cooled to -80°C and followed by a heating ramp of 3°C/min until the sample reached
150°C. The Tg was calculated from the inflection point in the Reversed Heat Flow curve
using the software provided.
3.2.5 PSA performance testing
Tack, peel strength and shear strength were measured according to the Pressure Sensitive
Tape Council standards PSTC-6, PSTC-1 and PSTC-7, respectively.[21] The latex was
filtered using glass wool and cast onto a 50 um Mylar® sheet with a 30# Meyer rod. The
cast film was dried at room temperature and conditioned for 24 h at standard conditions
of temperature and humidity (23 ±1°C and 50% ±5 Relative Humidity). A Universal
Instron tester was used to evaluate loop tack and peel strength. For tack, a strip of 25.4
mm x 177.8 mm was cut from the film and was formed into a loop with the adhesive side
facing outward. Approximately 25.4 mm at both ends of the strip was masked with tape
Chapter 3
56
and inserted into the upper grip. The instrument moved the upper grip downward at a
speed of 300 m/min until an area of 25.4 mm x 25.4 mm came into contact with the
stainless steel substrate mounted into the lower grip. Next, the tester moved the upper
grip upwards at the same speed while recording the force needed to de-bond the loop
from the substrate. The maximum force per unit length of the contact area necessary to
remove the adhesive was reported as loop tack. PSTC 1 Test Method A evaluates peel
strength at a peel angle of 180°. A PSA film specimen of 25.4 mm x 304.8 mm was cut.
The strip was laminated onto a stainless steel substrate with the help of a 2040 g roll
coater. The roll coater was passed through the film front to back twice (i.e., along the
length of the film). The dwell time did not exceed 1 minute. The substrate and the strip
were inserted into the grips and the upper grip was set to move upward at a speed of 300
mm/min. The average force per unit length of the contact area required to peel the strip
from the substrate was recorded and reported as peel strength. Lastly, PSTC 7 measures
shear strength. A specimen of 25.4 mm x 152.4 mm of the film was cut. The strip was
laminated onto a stainless steel testing panel with a contact area of 25.4 mm x 25.4 mm,
and then placed in the home-built shear tester using a C-clamp. A 500 g weight was
suspended at the end of the strip. The time needed for a PSA film to fall off the testing
panel was recorded automatically using Labview™ software as its shear strength.
3.2.6 Testing PSAs’ viscoelastic properties with dynamic mechanical analysis
The viscoelastic properties of the PSAs were characterized via a RDA III rheometer (TA
Instruments) with 25 mm-diameter parallel plate geometry. The sample thickness was
1.7+/-0.2 mm. The DMA measurements were done by heating the sample from -40° C to
Chapter 3
57
150°C at a rate of 3°C/min and under a shear frequency of 1.591 Hz. The Tg was also
obtained from the maximum of the tanδ curve.
3.3 Results and Discussion
3.3.1 Experimental design
In this study, BA, MMA, and in some cases, AA, were used as the monomers. For the
BA/MMA system, a 32 factorial design consisting of 10 runs (1 replicates) with two
factors (NDM and AMA concentrations) and three levels (0, 0.2 and 0.4 phm) were
carried out (see Table 3.1). (Note: NDM was CTA, and AMA was cross-linker.) For all
these runs, the BA/MMA weight ratio was 90/10. An empirical model relating gel
content with NDM and AMA concentrations was established. Table 3.1 summarizes the
experimental design and final latex properties (i.e., gel content, Mw, Mn, and Mc) for 13
runs, which also includes three additional runs. Run 11 was carried out in order to
validate the model’s predictive power and also produce a latex with similar gel content as
that from Run 1 of the factorial design; Runs 10 and run 12 were performed to expand the
range of factorial design. They used 0.5 phm and 0.11 phm NDM, respectively, and
resulted in two additional gel-free latexes.
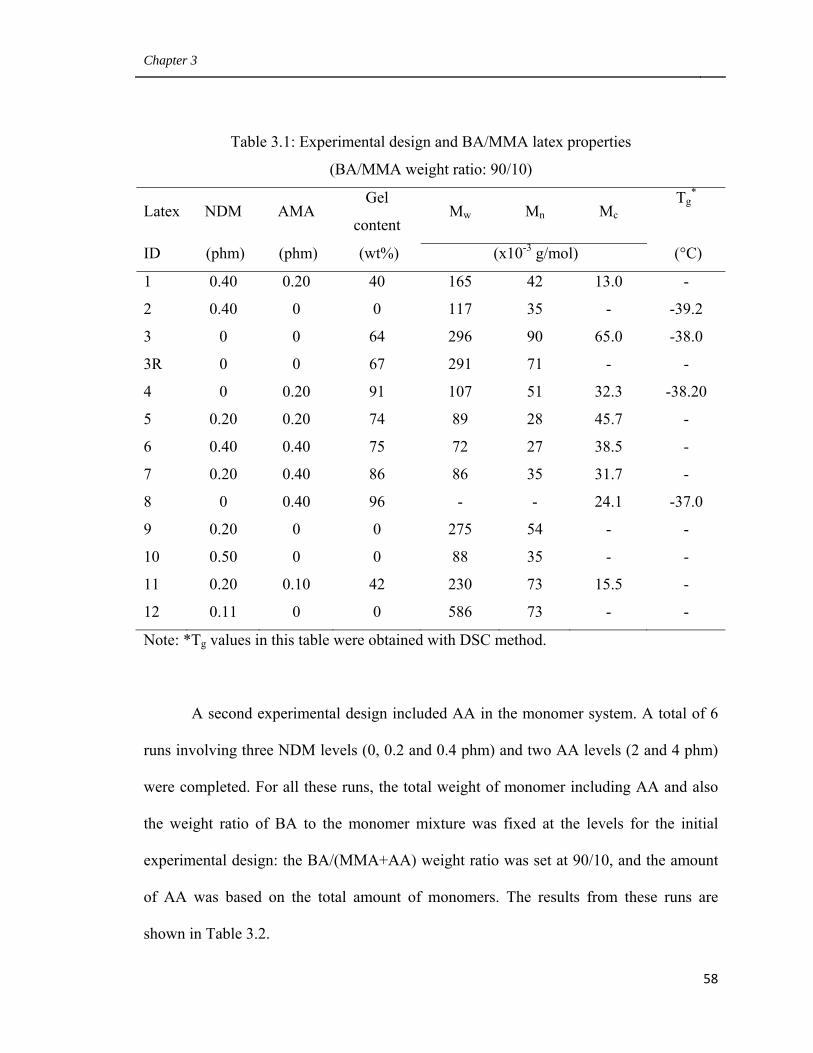
Chapter 3
58
Table 3.1: Experimental design and BA/MMA latex properties
(BA/MMA weight ratio: 90/10)
Latex NDM AMA Gel
content Mw Mn Mc
Tg*
ID (phm) (phm) (wt%) (x10-3 g/mol) (°C)
1 0.40 0.20 40 165 42 13.0 -
2 0.40 0 0 117 35 - -39.2
3 0 0 64 296 90 65.0 -38.0
3R 0 0 67 291 71 - -
4 0 0.20 91 107 51 32.3 -38.20
5 0.20 0.20 74 89 28 45.7 -
6 0.40 0.40 75 72 27 38.5 -
7 0.20 0.40 86 86 35 31.7 -
8 0 0.40 96 - - 24.1 -37.0
9 0.20 0 0 275 54 - -
10 0.50 0 0 88 35 - -
11 0.20 0.10 42 230 73 15.5 -
12 0.11 0 0 586 73 - -
Note: *Tg values in this table were obtained with DSC method.
A second experimental design included AA in the monomer system. A total of 6
runs involving three NDM levels (0, 0.2 and 0.4 phm) and two AA levels (2 and 4 phm)
were completed. For all these runs, the total weight of monomer including AA and also
the weight ratio of BA to the monomer mixture was fixed at the levels for the initial
experimental design: the BA/(MMA+AA) weight ratio was set at 90/10, and the amount
of AA was based on the total amount of monomers. The results from these runs are
shown in Table 3.2.
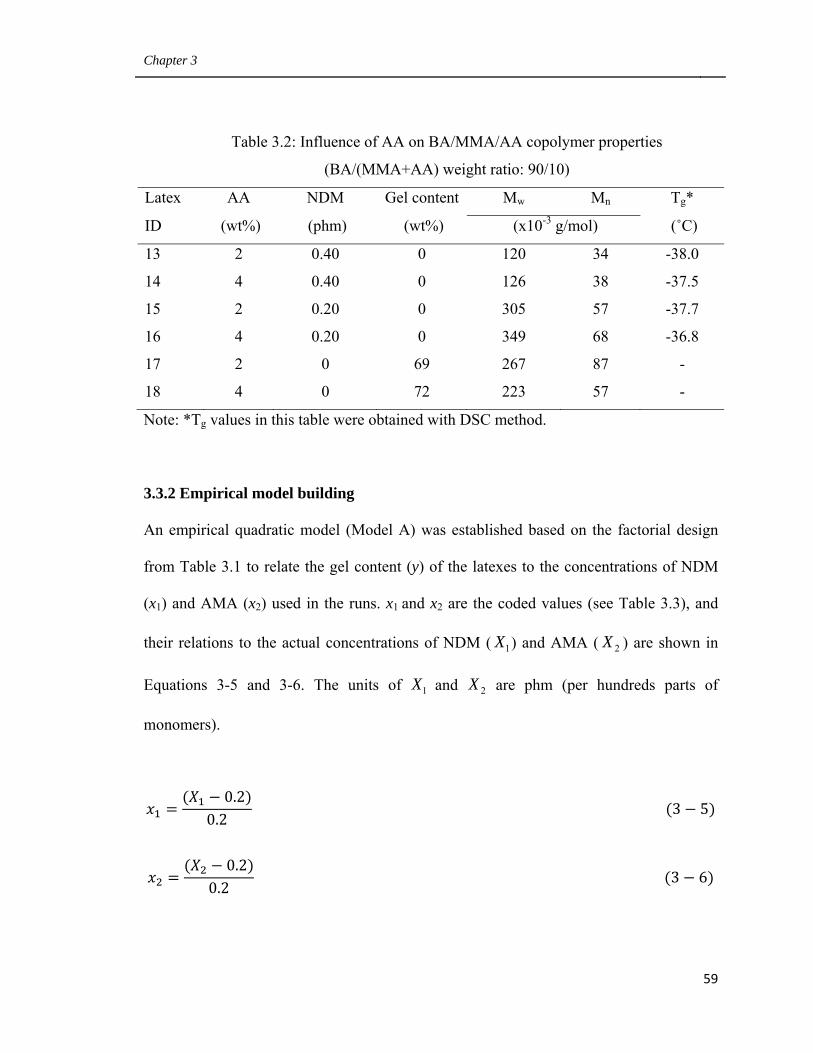
Chapter 3
59
Table 3.2: Influence of AA on BA/MMA/AA copolymer properties
(BA/(MMA+AA) weight ratio: 90/10)
Latex AA NDM Gel content Mw Mn Tg*
ID (wt%) (phm) (wt%) (x10-3 g/mol) (˚C)
13 2 0.40 0 120 34 -38.0
14 4 0.40 0 126 38 -37.5
15 2 0.20 0 305 57 -37.7
16 4 0.20 0 349 68 -36.8
17 2 0 69 267 87 -
18 4 0 72 223 57 -
Note: *Tg values in this table were obtained with DSC method.
3.3.2 Empirical model building
An empirical quadratic model (Model A) was established based on the factorial design
from Table 3.1 to relate the gel content (y) of the latexes to the concentrations of NDM
(x1) and AMA (x2) used in the runs. x1 and x2 are the coded values (see Table 3.3), and
their relations to the actual concentrations of NDM ( 1X ) and AMA ( 2X ) are shown in
Equations 3-5 and 3-6. The units of 1X and 2X are phm (per hundreds parts of
monomers).
0.20.2 3 5
0.20.2 3 6
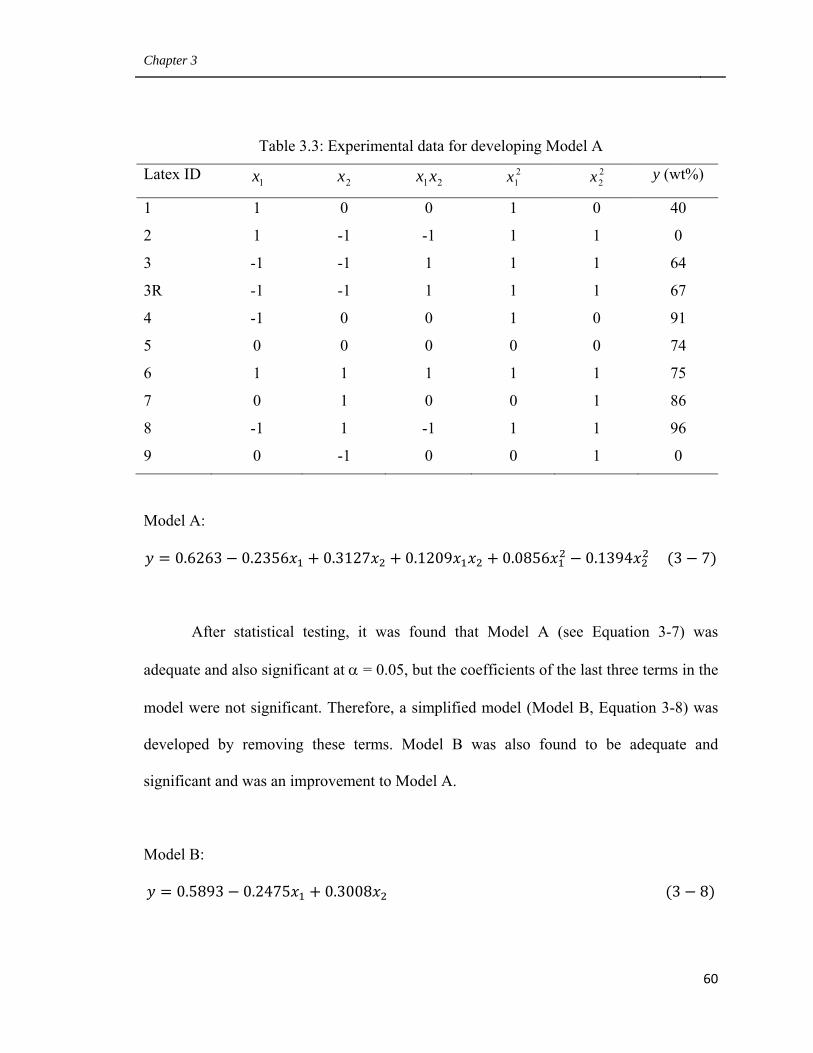
Chapter 3
60
Table 3.3: Experimental data for developing Model A
Latex ID 1x 2x 21xx 21x 2
2x y (wt%)
1 1 0 0 1 0 40
2 1 -1 -1 1 1 0
3 -1 -1 1 1 1 64
3R -1 -1 1 1 1 67
4 -1 0 0 1 0 91
5 0 0 0 0 0 74
6 1 1 1 1 1 75
7 0 1 0 0 1 86
8 -1 1 -1 1 1 96
9 0 -1 0 0 1 0
Model A:
0.6263 0.2356 0.3127 0.1209 0.0856 0.1394 3 7
After statistical testing, it was found that Model A (see Equation 3-7) was
adequate and also significant at α = 0.05, but the coefficients of the last three terms in the
model were not significant. Therefore, a simplified model (Model B, Equation 3-8) was
developed by removing these terms. Model B was also found to be adequate and
significant and was an improvement to Model A.
Model B:
0.5893 0.2475 0.3008 3 8
Chapter 3
61
Using Model B, a new run (Run 11) was designed in order to produce a latex with
gel content similar to the latex from Run 1, but using less cross-linker. The NDM and
AMA concentrations for Run 11 were chosen as 0.20 and 0.10 phm, respectively. The gel
content of the latex from Run 11 was 42 wt%, which compared well to the predicted gel
content of 43.5 wt% using Model B.
3.3.3 Influence of CTA and cross-linker concentrations on latex particle size
During seeded semi-batch emulsion polymerization, secondary nucleation and particle
coagulation may occur depending on polymerization conditions. These two phenomena
may not only affect the polymerization rate but also the final latex properties such as
composition, Mw and gel content.[22] In this study, we wanted to avoid secondary
nucleation and particle coagulation, and therefore we monitored the particle growth
during the polymerization process. It is known that secondary nucleation can be caused
by several factors, but it is in particular, governed by the emulsifier concentration.[23,1] In
the event of desorption of radicals from particles due to transfer to CTA reactions, new
particles can also be nucleated. Such an effect is uncommon when NDM is used as CTA
in the range used in this study.[11,24-25] Elevated levels of cross-linker, well beyond those
used in this work, have also been reported to induce secondary particle nucleation.[26]
Particle coagulation can be caused by low emulsifier concentrations, and can be
influenced by CTA and cross-linker concentrations. Figure 3.2 shows a typical
progression in the particle size distribution as demonstrated for Run 1.
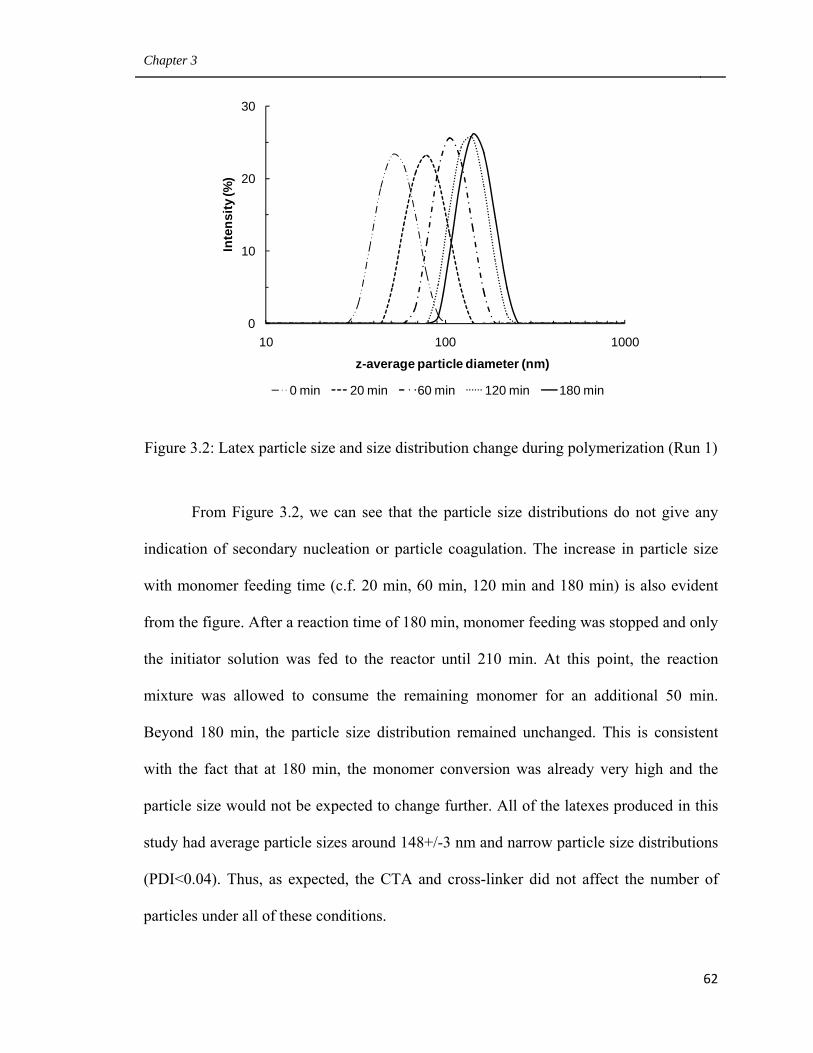
Chapter 3
62
Figure 3.2: Latex particle size and size distribution change during polymerization (Run 1)
From Figure 3.2, we can see that the particle size distributions do not give any
indication of secondary nucleation or particle coagulation. The increase in particle size
with monomer feeding time (c.f. 20 min, 60 min, 120 min and 180 min) is also evident
from the figure. After a reaction time of 180 min, monomer feeding was stopped and only
the initiator solution was fed to the reactor until 210 min. At this point, the reaction
mixture was allowed to consume the remaining monomer for an additional 50 min.
Beyond 180 min, the particle size distribution remained unchanged. This is consistent
with the fact that at 180 min, the monomer conversion was already very high and the
particle size would not be expected to change further. All of the latexes produced in this
study had average particle sizes around 148+/-3 nm and narrow particle size distributions
(PDI<0.04). Thus, as expected, the CTA and cross-linker did not affect the number of
particles under all of these conditions.
0
10
20
30
10 100 1000
Inte
nsity
(%)
z-average particle diameter (nm)
0 min 20 min 60 min 120 min 180 min
Chapter 3
63
3.3.4 Influence of CTA and cross-linker concentration on monomer conversion
Latex samples withdrawn from the reactor were analyzed gravimetrically to calculate the
overall monomer conversion (based on the total amount of monomer in the formulation)
and the instantaneous monomer conversion (based on the total amount of monomer added
up to the sampling time). The monomer conversion calculation is complicated, and the
detailed procedure is provided in the Appendix of this thesis. Basically, the instantaneous
and overall monomer conversions were calculated according to Equations 3-9 and 3-10.
,,
, 3 9
,, 3 10
In the above two equations, xI,t and xO,t are the instantaneous and overall
monomer conversion at sampling time t, respectively; WP,t is the amount of polymer
produced in the reactor up to sampling time t; WTM, t is the total amount of monomer
added to the reactor up to the sampling time t; and WTM is the total amount of monomer in
the formulation, which is the same as the total amount of monomer added to the reactor
up to the end of polymerization.
The instantaneous monomer conversion can be affected by many factors, such as
the amounts of initiator and surfactant, monomer to initiator ratio, monomer mixture and
initiator solution feeding rates, as well as the CTA and cross-linker concentrations. In this
study, all factors, except for the CTA and cross-linker concentrations, were fixed. Figure
Chapter 3
64
3.3 shows the instantaneous and total monomer conversions for Runs 1, 2, 3, 8 and 9,
which covers the entire range of CTA and cross-linker concentrations. All runs in our
factorial design gave nearly identical conversion profiles. Thus, the CTA and cross-linker
concentrations did not appear to influence monomer conversion. This is consistent with
the findings of Chauvet et al..[15] From Figure 3.3, it can also be seen that the
instantaneous monomer conversion was high (greater than 90 wt%) for a large part of the
time, which is typical of monomer-starved conditions, and the final overall monomer
conversion was between 99.2 to 99.8 wt%, which gave the latexes a solid content of
about 47 wt%. In addition, the instantaneous conversion was seen to slightly increase
during the monomer feed period (i.e., from 20 to 180 min). As there was no secondary
particle nucleation, as concluded from the particle size measurements, this increase was
not caused by secondary nucleation. Rather, as Plessis et al.[11] observed, the growth in
particle size likely led to a decrease in the rate of radical exit from the particles, and
accordingly, the number of radicals per particle increased, so the instantaneous
conversion increased as well.
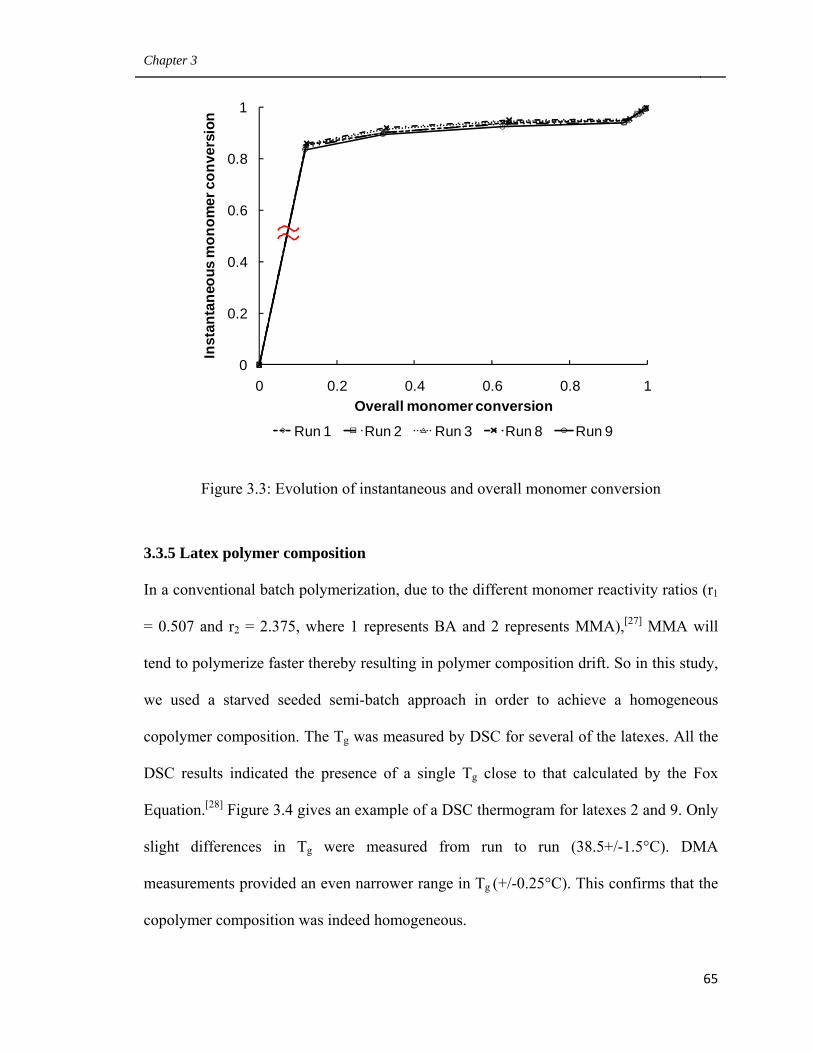
Chapter 3
65
Figure 3.3: Evolution of instantaneous and overall monomer conversion
3.3.5 Latex polymer composition
In a conventional batch polymerization, due to the different monomer reactivity ratios (r1
= 0.507 and r2 = 2.375, where 1 represents BA and 2 represents MMA),[27] MMA will
tend to polymerize faster thereby resulting in polymer composition drift. So in this study,
we used a starved seeded semi-batch approach in order to achieve a homogeneous
copolymer composition. The Tg was measured by DSC for several of the latexes. All the
DSC results indicated the presence of a single Tg close to that calculated by the Fox
Equation.[28] Figure 3.4 gives an example of a DSC thermogram for latexes 2 and 9. Only
slight differences in Tg were measured from run to run (38.5+/-1.5°C). DMA
measurements provided an even narrower range in Tg (+/-0.25°C). This confirms that the
copolymer composition was indeed homogeneous.
0
0.2
0.4
0.6
0.8
1
0 0.2 0.4 0.6 0.8 1
Inst
anta
neou
s m
onom
er c
onve
rsio
n
Overall monomer conversion
Run 1 Run 2 Run 3 Run 8 Run 9
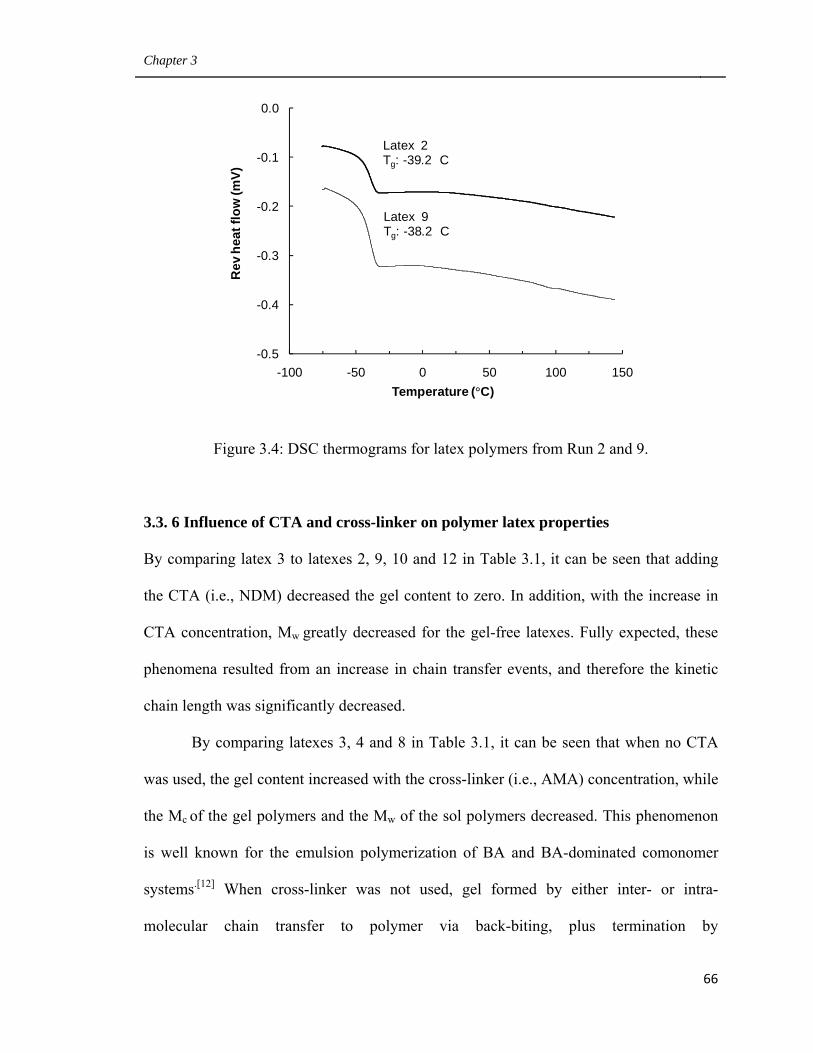
Chapter 3
66
Figure 3.4: DSC thermograms for latex polymers from Run 2 and 9.
3.3. 6 Influence of CTA and cross-linker on polymer latex properties
By comparing latex 3 to latexes 2, 9, 10 and 12 in Table 3.1, it can be seen that adding
the CTA (i.e., NDM) decreased the gel content to zero. In addition, with the increase in
CTA concentration, Mw greatly decreased for the gel-free latexes. Fully expected, these
phenomena resulted from an increase in chain transfer events, and therefore the kinetic
chain length was significantly decreased.
By comparing latexes 3, 4 and 8 in Table 3.1, it can be seen that when no CTA
was used, the gel content increased with the cross-linker (i.e., AMA) concentration, while
the Mc of the gel polymers and the Mw of the sol polymers decreased. This phenomenon
is well known for the emulsion polymerization of BA and BA-dominated comonomer
systems.[12] When cross-linker was not used, gel formed by either inter- or intra-
molecular chain transfer to polymer via back-biting, plus termination by
-0.5
-0.4
-0.3
-0.2
-0.1
0.0
-100 -50 0 50 100 150
Rev
hea
t flo
w (m
V)
Temperature (°C)
Latex 2Tg: -39.2 C
Latex 9Tg: -38.2 C
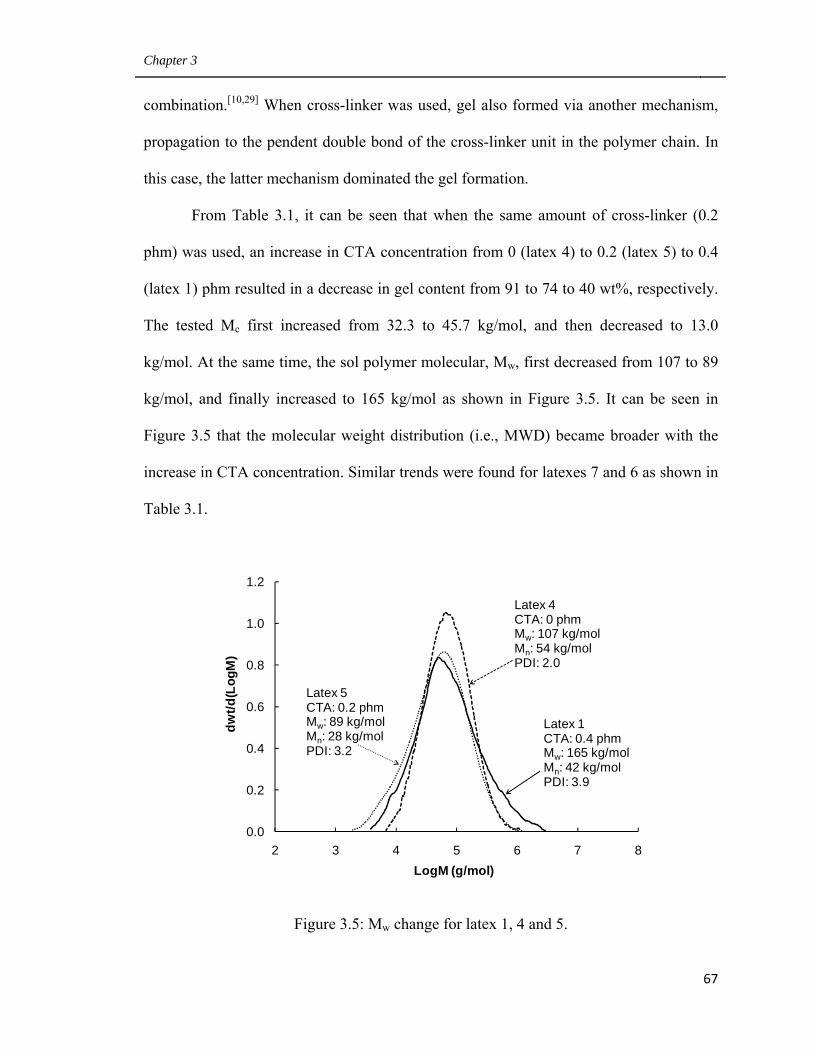
Chapter 3
67
combination.[10,29] When cross-linker was used, gel also formed via another mechanism,
propagation to the pendent double bond of the cross-linker unit in the polymer chain. In
this case, the latter mechanism dominated the gel formation.
From Table 3.1, it can be seen that when the same amount of cross-linker (0.2
phm) was used, an increase in CTA concentration from 0 (latex 4) to 0.2 (latex 5) to 0.4
(latex 1) phm resulted in a decrease in gel content from 91 to 74 to 40 wt%, respectively.
The tested Mc first increased from 32.3 to 45.7 kg/mol, and then decreased to 13.0
kg/mol. At the same time, the sol polymer molecular, Mw, first decreased from 107 to 89
kg/mol, and finally increased to 165 kg/mol as shown in Figure 3.5. It can be seen in
Figure 3.5 that the molecular weight distribution (i.e., MWD) became broader with the
increase in CTA concentration. Similar trends were found for latexes 7 and 6 as shown in
Table 3.1.
Figure 3.5: Mw change for latex 1, 4 and 5.
0.0
0.2
0.4
0.6
0.8
1.0
1.2
2 3 4 5 6 7 8
dwt/d
(Log
M)
LogM (g/mol)
Latex 1CTA: 0.4 phmMw: 165 kg/molMn: 42 kg/molPDI: 3.9
Latex 4CTA: 0 phmMw: 107 kg/molMn: 54 kg/molPDI: 2.0
Latex 5CTA: 0.2 phmMw: 89 kg/molMn: 28 kg/molPDI: 3.2
Chapter 3
68
The seemingly contradictory changes in Mc and Mw warrant further discussion.
Chauvet et al. reported on the evolution of gel content for the emulsion copolymerization
of BA and AA under starved seeded semi-batch emulsion polymerization condition (i.e.,
conditions similar to that in this study).[15] They demonstrated that the gel contents were
almost constant for most of the polymerization process (from ~20% overall monomer
conversion to almost complete conversion of monomer) and only slightly increased
during the cooking period when AMA and NDM were used separately or together. In
addition, the gel content was increased by adding AMA. This implies that NDM and
AMA can simultaneously affect the latex properties during whole polymerization process
even though AMA has two non-symmetric double bonds. Hence, we can divide the
polymerization process into two sub-processes: (1) the formation of polymers with
kinetic chain length, which are here defined as “primary” polymers; and (2) the further
growth of some of the primary polymer chains, either at the labile tertiary hydrogen
points of the BA units via chain transfer to polymer (a.k.a. back-biting) or at the pendent
double bonds of the cross-linker units. When cross-linker is used, the latter growth
mechanism dominates. Larger primary polymer chains have a higher probability to
engage in further chain growth; and once their sizes become sufficiently large after
further growth, they become gel; otherwise they will remain as sol polymers.
Based on the above mechanism, one can surmise that at constant AMA
concentration (0.2 phm), an increase in NDM from 0 to 0.2 phm resulted in the formation
of much shorter primary polymer chains, so Mw decreased as expected. At the same time,
the gel content decreased because the shortened primary polymer chains decreased the
probability for primary polymers to transfer to gel by further growth. Finally, the
Chapter 3
69
formation of a looser gel network was because NDM can also terminate some of the
chain growth at the cross-linker points.
When the NDM was further increased to 0.4 phm, the primary polymer chains
should become much smaller. As expected, this resulted in a decrease in the gel content,
due to the reasons outlined earlier. However, the Mw increased, which contradicted our
expectations. It is likely that small primary polymer chains, possessing cross-linker in
their backbones, underwent further growth. However, some of these polymers did not
reach the size of gel, so they were not gel but rather, highly branched sol polymers. This,
in turn, resulted in higher than expected Mw. As for the change in Mc, this was possibly
due to the imperfect structure of the gel formed under this condition. The formed gel in
this case had many branches and very few cross-linking points, which implies that the
actual Mc was very large. The formation of such a gel structure was possible because
although chain growth could still occur at the pendent double bond points of the cross-
linker, many of growing side chains were terminated by NDM and therefore became
branches. The mechanical strength of this kind of gel is very weak, and it could easily
break and collapse during swelling. The collapse causes significant solvent loss, which
resulted in a lower swelling ratio. Thus, if calculated with Equation 3-2, the Mc would be
smaller. In this case, the calculated Mc from the gel swelling model cannot describe the
gel structure.
We can further confirm the explained Mw change by comparing latex 1 to latex 2.
Latex 1 was produced with 0.4 phm CTA and 0.2 phm cross-linker; in contrast, latex 2
was produced with the same amount of CTA as that for latex 1, but without cross-linker.
When no CTA was used, with the addition of cross-linker, we would expect the gel
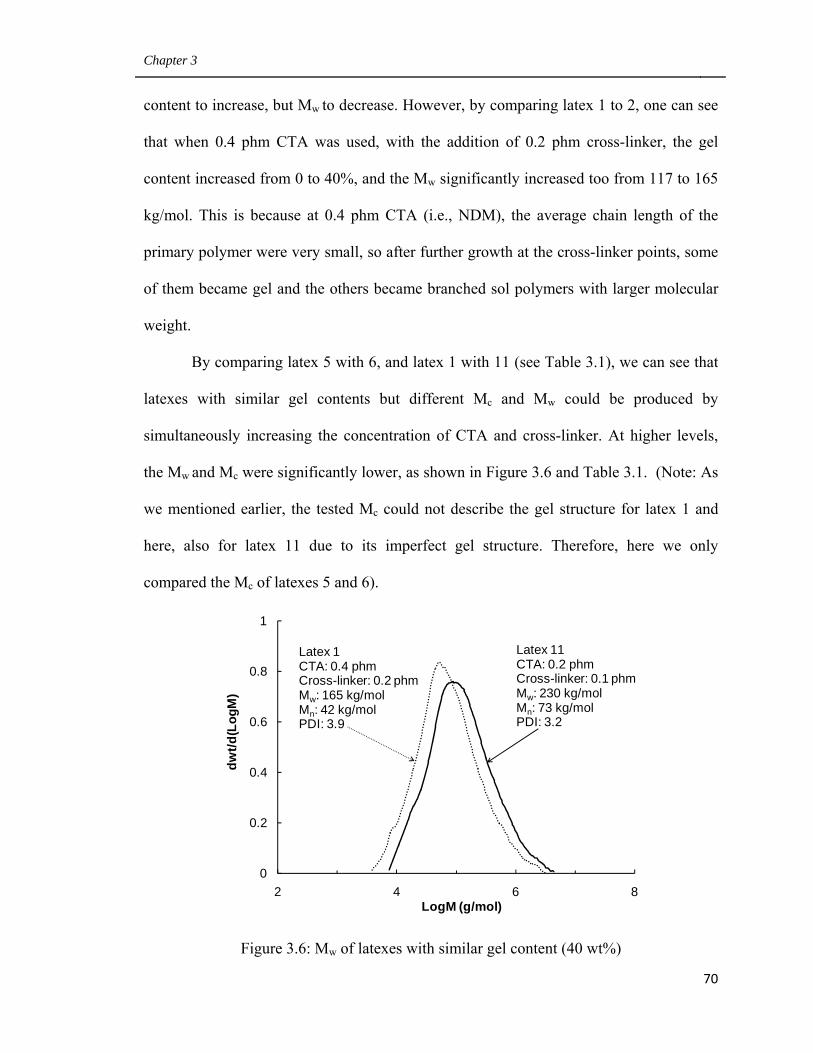
Chapter 3
70
content to increase, but Mw to decrease. However, by comparing latex 1 to 2, one can see
that when 0.4 phm CTA was used, with the addition of 0.2 phm cross-linker, the gel
content increased from 0 to 40%, and the Mw significantly increased too from 117 to 165
kg/mol. This is because at 0.4 phm CTA (i.e., NDM), the average chain length of the
primary polymer were very small, so after further growth at the cross-linker points, some
of them became gel and the others became branched sol polymers with larger molecular
weight.
By comparing latex 5 with 6, and latex 1 with 11 (see Table 3.1), we can see that
latexes with similar gel contents but different Mc and Mw could be produced by
simultaneously increasing the concentration of CTA and cross-linker. At higher levels,
the Mw and Mc were significantly lower, as shown in Figure 3.6 and Table 3.1. (Note: As
we mentioned earlier, the tested Mc could not describe the gel structure for latex 1 and
here, also for latex 11 due to its imperfect gel structure. Therefore, here we only
compared the Mc of latexes 5 and 6).
Figure 3.6: Mw of latexes with similar gel content (40 wt%)
0
0.2
0.4
0.6
0.8
1
2 4 6 8
dwt/d
(Log
M)
LogM (g/mol)
Latex 11CTA: 0.2 phmCross-linker: 0.1 phmMw: 230 kg/molMn: 73 kg/molPDI: 3.2
Latex 1CTA: 0.4 phmCross-linker: 0.2 phmMw: 165 kg/molMn: 42 kg/molPDI: 3.9
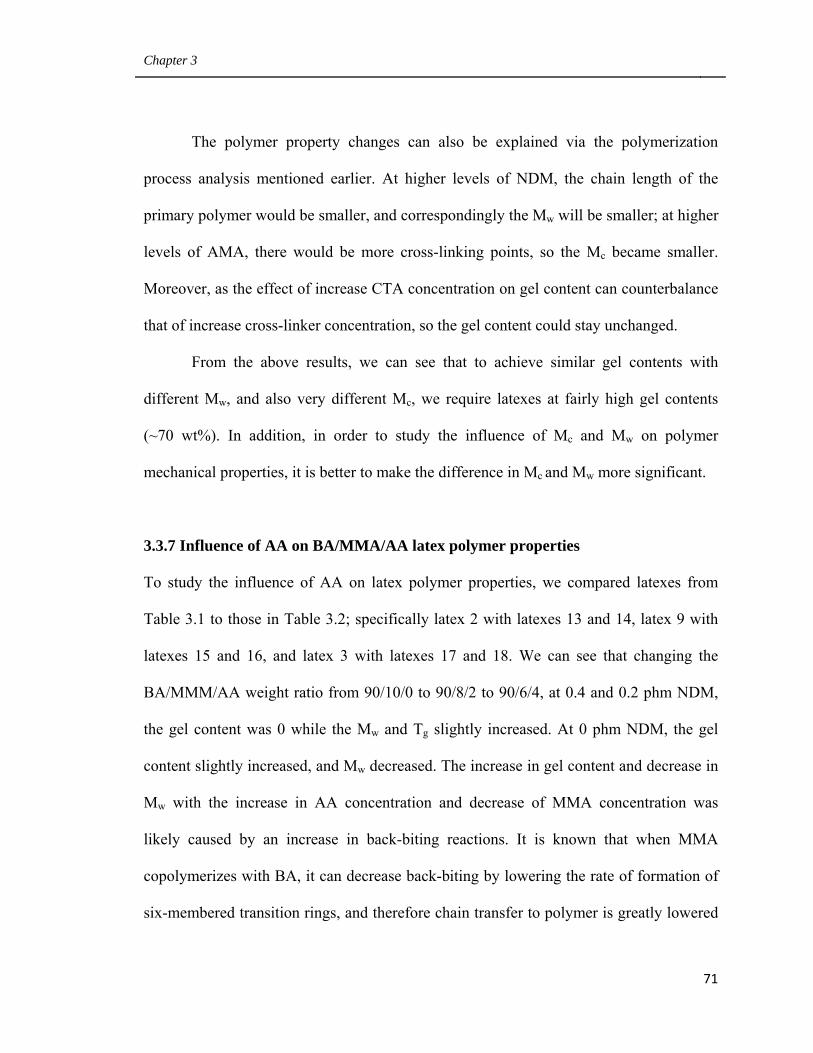
Chapter 3
71
The polymer property changes can also be explained via the polymerization
process analysis mentioned earlier. At higher levels of NDM, the chain length of the
primary polymer would be smaller, and correspondingly the Mw will be smaller; at higher
levels of AMA, there would be more cross-linking points, so the Mc became smaller.
Moreover, as the effect of increase CTA concentration on gel content can counterbalance
that of increase cross-linker concentration, so the gel content could stay unchanged.
From the above results, we can see that to achieve similar gel contents with
different Mw, and also very different Mc, we require latexes at fairly high gel contents
(~70 wt%). In addition, in order to study the influence of Mc and Mw on polymer
mechanical properties, it is better to make the difference in Mc and Mw more significant.
3.3.7 Influence of AA on BA/MMA/AA latex polymer properties
To study the influence of AA on latex polymer properties, we compared latexes from
Table 3.1 to those in Table 3.2; specifically latex 2 with latexes 13 and 14, latex 9 with
latexes 15 and 16, and latex 3 with latexes 17 and 18. We can see that changing the
BA/MMM/AA weight ratio from 90/10/0 to 90/8/2 to 90/6/4, at 0.4 and 0.2 phm NDM,
the gel content was 0 while the Mw and Tg slightly increased. At 0 phm NDM, the gel
content slightly increased, and Mw decreased. The increase in gel content and decrease in
Mw with the increase in AA concentration and decrease of MMA concentration was
likely caused by an increase in back-biting reactions. It is known that when MMA
copolymerizes with BA, it can decrease back-biting by lowering the rate of formation of
six-membered transition rings, and therefore chain transfer to polymer is greatly lowered
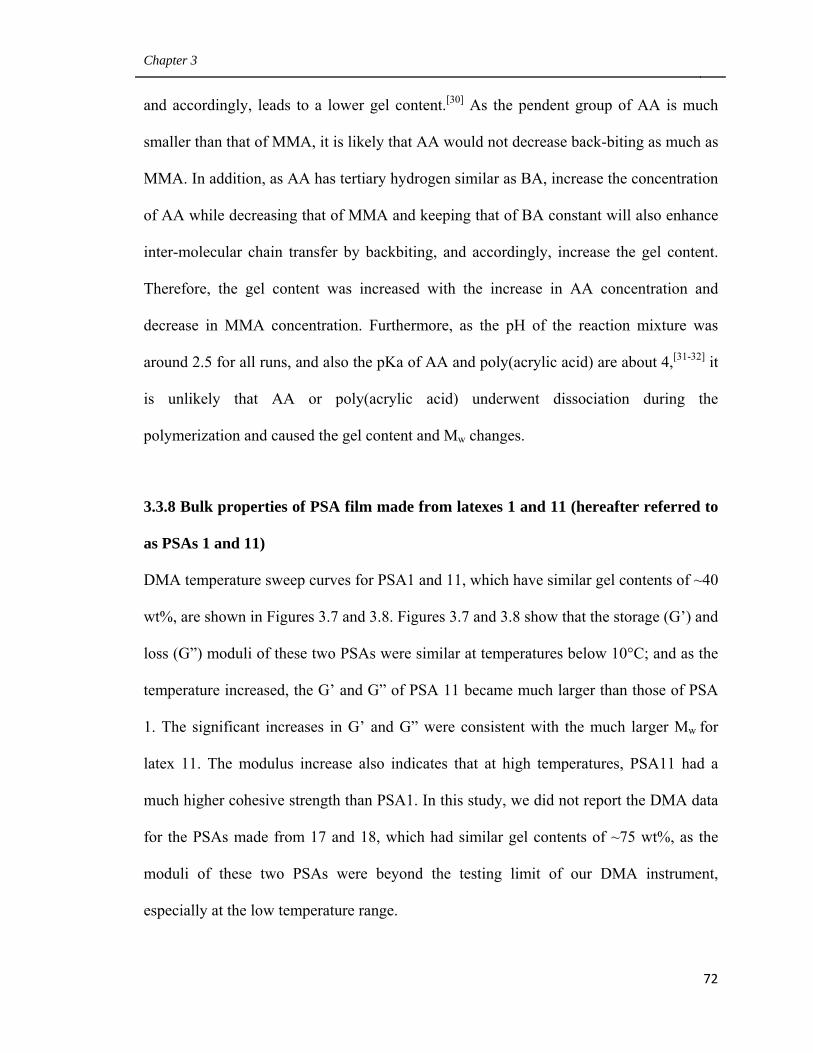
Chapter 3
72
and accordingly, leads to a lower gel content.[30] As the pendent group of AA is much
smaller than that of MMA, it is likely that AA would not decrease back-biting as much as
MMA. In addition, as AA has tertiary hydrogen similar as BA, increase the concentration
of AA while decreasing that of MMA and keeping that of BA constant will also enhance
inter-molecular chain transfer by backbiting, and accordingly, increase the gel content.
Therefore, the gel content was increased with the increase in AA concentration and
decrease in MMA concentration. Furthermore, as the pH of the reaction mixture was
around 2.5 for all runs, and also the pKa of AA and poly(acrylic acid) are about 4,[31-32] it
is unlikely that AA or poly(acrylic acid) underwent dissociation during the
polymerization and caused the gel content and Mw changes.
3.3.8 Bulk properties of PSA film made from latexes 1 and 11 (hereafter referred to
as PSAs 1 and 11)
DMA temperature sweep curves for PSA1 and 11, which have similar gel contents of ~40
wt%, are shown in Figures 3.7 and 3.8. Figures 3.7 and 3.8 show that the storage (G’) and
loss (G”) moduli of these two PSAs were similar at temperatures below 10°C; and as the
temperature increased, the G’ and G” of PSA 11 became much larger than those of PSA
1. The significant increases in G’ and G” were consistent with the much larger Mw for
latex 11. The modulus increase also indicates that at high temperatures, PSA11 had a
much higher cohesive strength than PSA1. In this study, we did not report the DMA data
for the PSAs made from 17 and 18, which had similar gel contents of ~75 wt%, as the
moduli of these two PSAs were beyond the testing limit of our DMA instrument,
especially at the low temperature range.
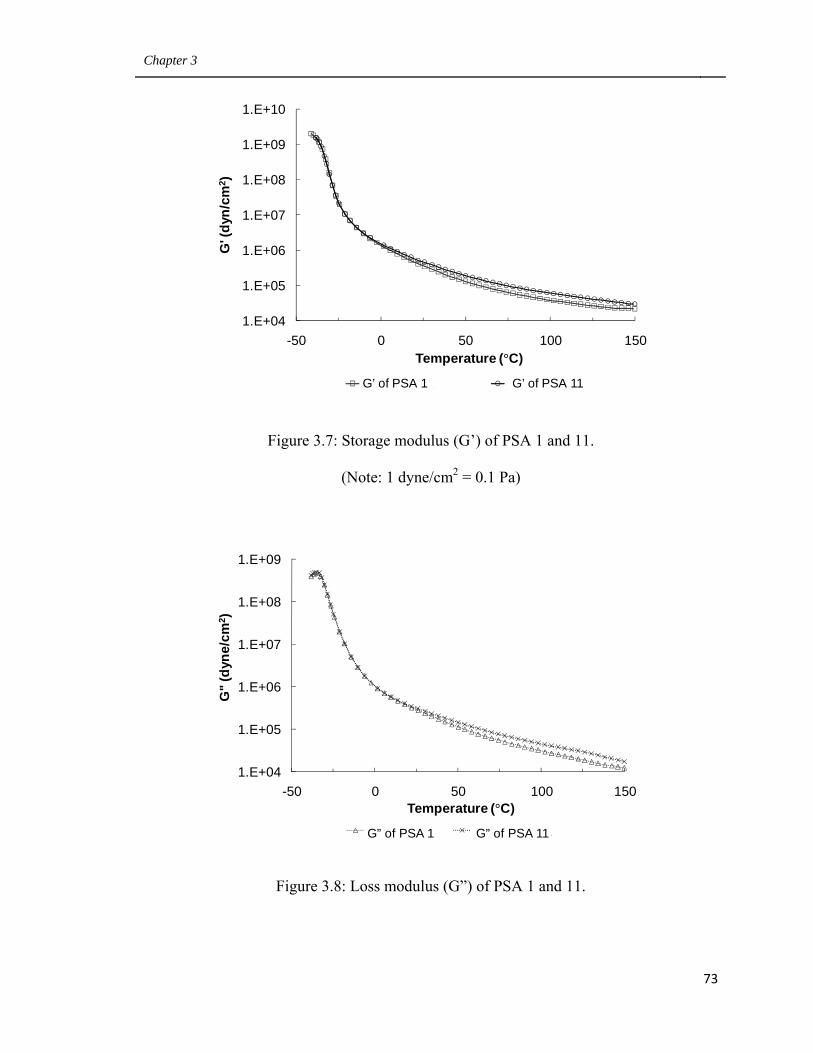
Chapter 3
73
Figure 3.7: Storage modulus (G’) of PSA 1 and 11.
(Note: 1 dyne/cm2 = 0.1 Pa)
Figure 3.8: Loss modulus (G”) of PSA 1 and 11.
1.E+04
1.E+05
1.E+06
1.E+07
1.E+08
1.E+09
1.E+10
-50 0 50 100 150
G' (
dyn/
cm2 )
Temperature (°C)
G' of latex 1 G' of latex 11G’ of PSA 1 G’ of PSA 11
1.E+04
1.E+05
1.E+06
1.E+07
1.E+08
1.E+09
-50 0 50 100 150
G"
(dyn
e/cm
2 )
Temperature (°C)G" of latex 1 G" of latex11G” of PSA 1 G” of PSA 11
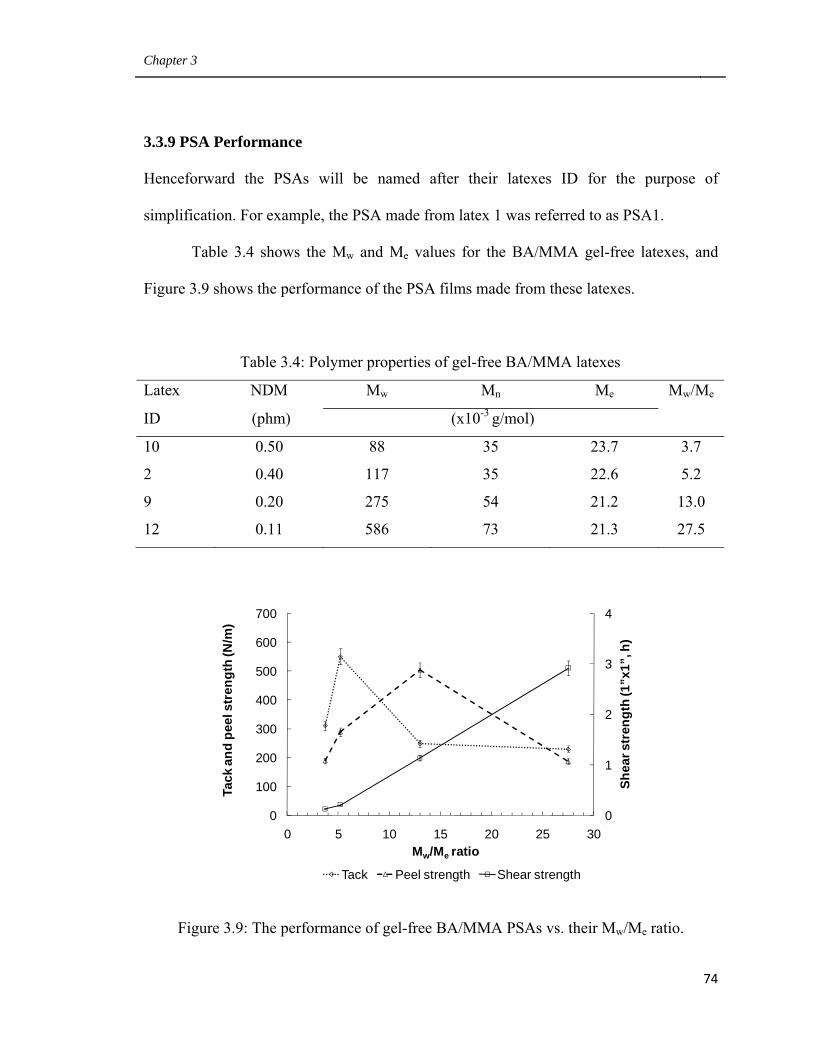
Chapter 3
74
3.3.9 PSA Performance
Henceforward the PSAs will be named after their latexes ID for the purpose of
simplification. For example, the PSA made from latex 1 was referred to as PSA1.
Table 3.4 shows the Mw and Me values for the BA/MMA gel-free latexes, and
Figure 3.9 shows the performance of the PSA films made from these latexes.
Table 3.4: Polymer properties of gel-free BA/MMA latexes
Latex NDM Mw Mn Me Mw/Me
ID (phm) (x10-3 g/mol)
10 0.50 88 35 23.7 3.7
2 0.40 117 35 22.6 5.2
9 0.20 275 54 21.2 13.0
12 0.11 586 73 21.3 27.5
Figure 3.9: The performance of gel-free BA/MMA PSAs vs. their Mw/Me ratio.
0
1
2
3
4
0
100
200
300
400
500
600
700
0 5 10 15 20 25 30
Tack
and
pee
l str
engt
h (N
/m)
Tack Peel strength Shear strength
Shea
r str
engt
h (1
”x1”
, h)
Mw/Me ratio
Chapter 3
75
The values of Me in Table 3.4 were obtained as follows: (1) Calculate the Me of
monodisperse copolymer of BA/MMA with weight ratio of 90/10 with Equation 3-11.
, , ,
, 3 11
where the Me of monodisperse poly(butyl acrylate) (referred to as PBA) is 20773
g/moL,[6] Me of monodisperse poly(methyl methacrylate) (referred to as PMMA) is about
10013 g/mol,[33] so
, , 0.9 20773 0.1 10013 19697 3 12
(2) Calculate the Me for our polydisperse polymers using the following plastic
model: [34]
,,
. 3 13
where φ is the weight fraction of polymer chains having size greater than the Me of the
monodisperse sample, and its values can be obtained with the sol polymer molecular
distribution curves measured with GPC.
Figure 3.9 shows that tack greatly increased when the Mw/Me ratio increased from
3.7 to 5.2, then greatly decreased when the Mw/Me ratio changed to 13.0 and 27.5. Peel
strength greatly increased when the Mw/Me ratio increased from 3.7 to 5.2 to 13.0, and
Chapter 3
76
then greatly decreased when the Mw/Me further increased to 27.5. Shear strength
increased with Mw/Me. The change in PSA performance can be explained as follows. For
gel-free PSAs, with the increase in Mw or Mw/Me ratio, the deformability of the PSA
would decrease, and at the same time, the cohesive strength would increase. As shear
strength is mainly related to the cohesive strength of the PSA, it increased with the
increase in the Mw/Me ratio. As for tack and peel strength, it is known that their tests
involve both a bonding and debonding procedure.[9,35-38] For a PSA film to have high tack
and peel strength, it must stick well to the testing panel during the bonding process via
deformation and flow, and also dissipate a lot of energy during the debonding process.
Accordingly to Zosel, only when Me is larger than 10 kg/mol, can fibrils be formed
during the debonding process and therefore dissipate a significant amount of energy [9].
In addition, Lackout et al. reported that when Mw was low, fibrils only formed in the
lateral direction during debonding, and in this case, only a small amount of energy was
dissipated; however, with the growth in Mw, fibrils formed not only in this direction but
also in the elongation direction, so in this case, a lot of energy was dissipated [39]. Based
on this, it is likely that at a certain Mw/Me ratio, an optimum condition can be reached
under which the PSA film could adhere well to the testing panel during bonding and also
a lot of energy could be dissipated during debonding. In Figure 3.9, one can see that the
maximum tack occurred at a lower Mw/Me ratio than the maximum peel strength. This is
because the loop tack test uses a shorter bonding time and smaller contact force than the
peel strength test. Therefore, in order to bond well during the loop tack test, the PSA
must deform and flow better, which corresponds to a lower Mw/Me value.
Chapter 3
77
Given the information displayed in Figure 3.9 and the analysis regarding the
deformability and cohesive strength of PSAs, we can conclude that any PSA having
lower cohesive strength than that of PSA10 would give lower tack, peel strength and
shear strength than those of PSA10. This was confirmed with a PSA reported by Tobing
and Klein, which we named PSA10TK.[6] The Mw and Me of PSA10TK were 97 and 24
kg/mol respectively, which are very similar to that of our PSA10. But PSA10TK was
produced using BA/AA (97.5/2.5) and its Tg was ~-50°C, which was much lower than
that of PSA10 (~-38°C). Therefore, the cohesive strength of PSA10TK should be much
lower than that of PSA10. Figure 3.10 shows that PSA10TK did have lower tack, peel
strength and shear strength than PSA 10. One should note that the shear strength of
PSA10TK was reported to be “<< 0.1 min” with a contacting area of 1/2”x1/2”. In this
study, all the shear strength measurements were completed with a contact area of 1”x1”,
so the reported shear strength of PSA10TK was converted to a corresponding value at
1”x1” contact area using the following Equation.[40]
2 3 14
where T is the shear strength, L is the length of contact area between PSA and testing
panel, W is the width of the contact area, η is the zero shear viscosity of the PSA, t is the
thickness of the PSA film, M is load for testing shear strength and g is the gravitational
constant. When converting the shear strength from 1/2”x1/2” to 1”x1” using Equation 3-
14, only L and W doubled, and all the other factors remained unchanged, so the shear
strength at 1”x1” should be:
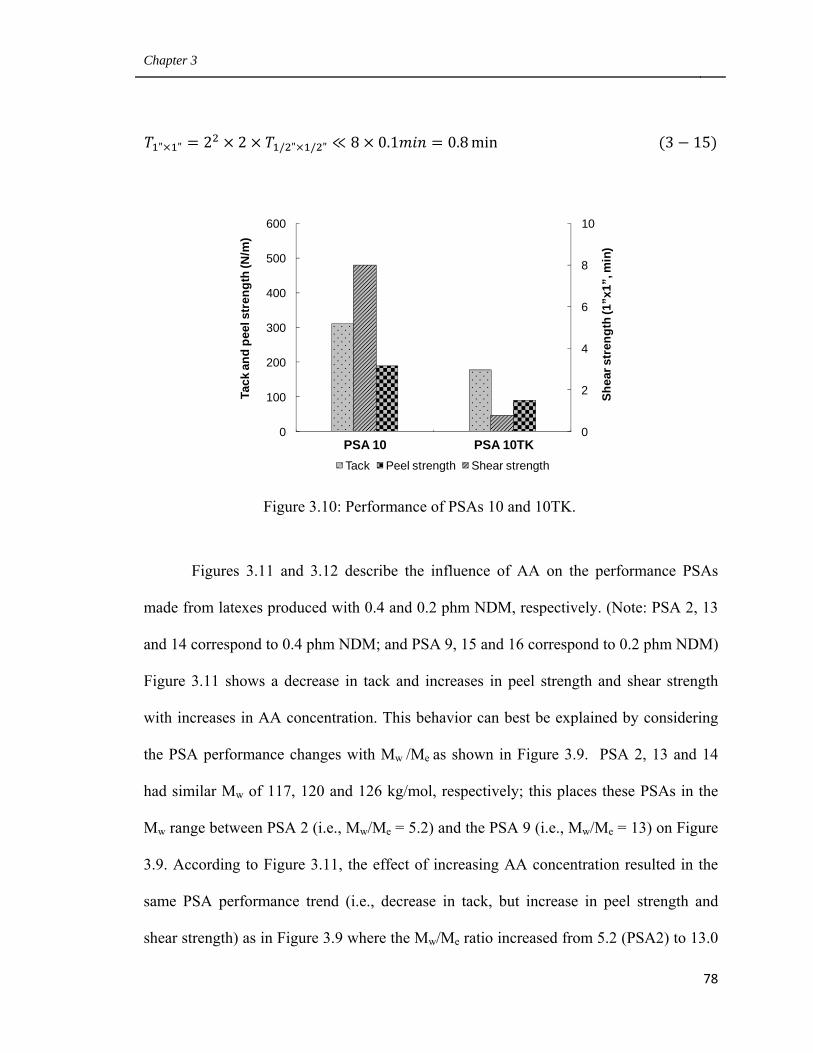
Chapter 3
78
" " 2 2 / " / " 8 0.1 0.8 min 3 15
Figure 3.10: Performance of PSAs 10 and 10TK.
Figures 3.11 and 3.12 describe the influence of AA on the performance PSAs
made from latexes produced with 0.4 and 0.2 phm NDM, respectively. (Note: PSA 2, 13
and 14 correspond to 0.4 phm NDM; and PSA 9, 15 and 16 correspond to 0.2 phm NDM)
Figure 3.11 shows a decrease in tack and increases in peel strength and shear strength
with increases in AA concentration. This behavior can best be explained by considering
the PSA performance changes with Mw /Me as shown in Figure 3.9. PSA 2, 13 and 14
had similar Mw of 117, 120 and 126 kg/mol, respectively; this places these PSAs in the
Mw range between PSA 2 (i.e., Mw/Me = 5.2) and the PSA 9 (i.e., Mw/Me = 13) on Figure
3.9. According to Figure 3.11, the effect of increasing AA concentration resulted in the
same PSA performance trend (i.e., decrease in tack, but increase in peel strength and
shear strength) as in Figure 3.9 where the Mw/Me ratio increased from 5.2 (PSA2) to 13.0
0
2
4
6
8
10
0
100
200
300
400
500
600
1 2
Tack
and
pee
l str
engt
h (N
/m)
Tack Peel strength Shear strength
Shea
r str
engt
h (1
”x1”
, min
)
Latex 10 Latex 10-RePSA 10 PSA 10TK
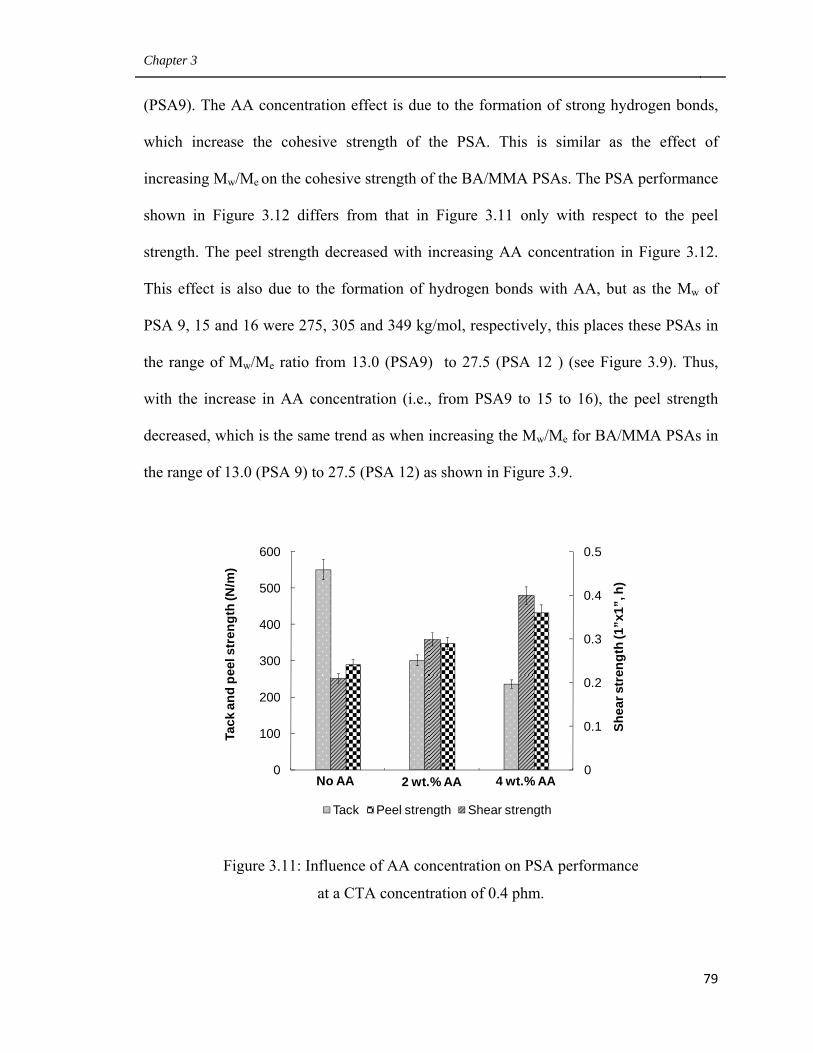
Chapter 3
79
(PSA9). The AA concentration effect is due to the formation of strong hydrogen bonds,
which increase the cohesive strength of the PSA. This is similar as the effect of
increasing Mw/Me on the cohesive strength of the BA/MMA PSAs. The PSA performance
shown in Figure 3.12 differs from that in Figure 3.11 only with respect to the peel
strength. The peel strength decreased with increasing AA concentration in Figure 3.12.
This effect is also due to the formation of hydrogen bonds with AA, but as the Mw of
PSA 9, 15 and 16 were 275, 305 and 349 kg/mol, respectively, this places these PSAs in
the range of Mw/Me ratio from 13.0 (PSA9) to 27.5 (PSA 12 ) (see Figure 3.9). Thus,
with the increase in AA concentration (i.e., from PSA9 to 15 to 16), the peel strength
decreased, which is the same trend as when increasing the Mw/Me for BA/MMA PSAs in
the range of 13.0 (PSA 9) to 27.5 (PSA 12) as shown in Figure 3.9.
Figure 3.11: Influence of AA concentration on PSA performance
at a CTA concentration of 0.4 phm.
0
0.1
0.2
0.3
0.4
0.5
0
100
200
300
400
500
600
1 2 3
Tack
and
pee
l str
engt
h (N
/m)
Tack Peel strength Shear strength
Shea
r str
engt
h (1
”x1”
, h)
No AA 2 wt.% AA 4 wt.% AA
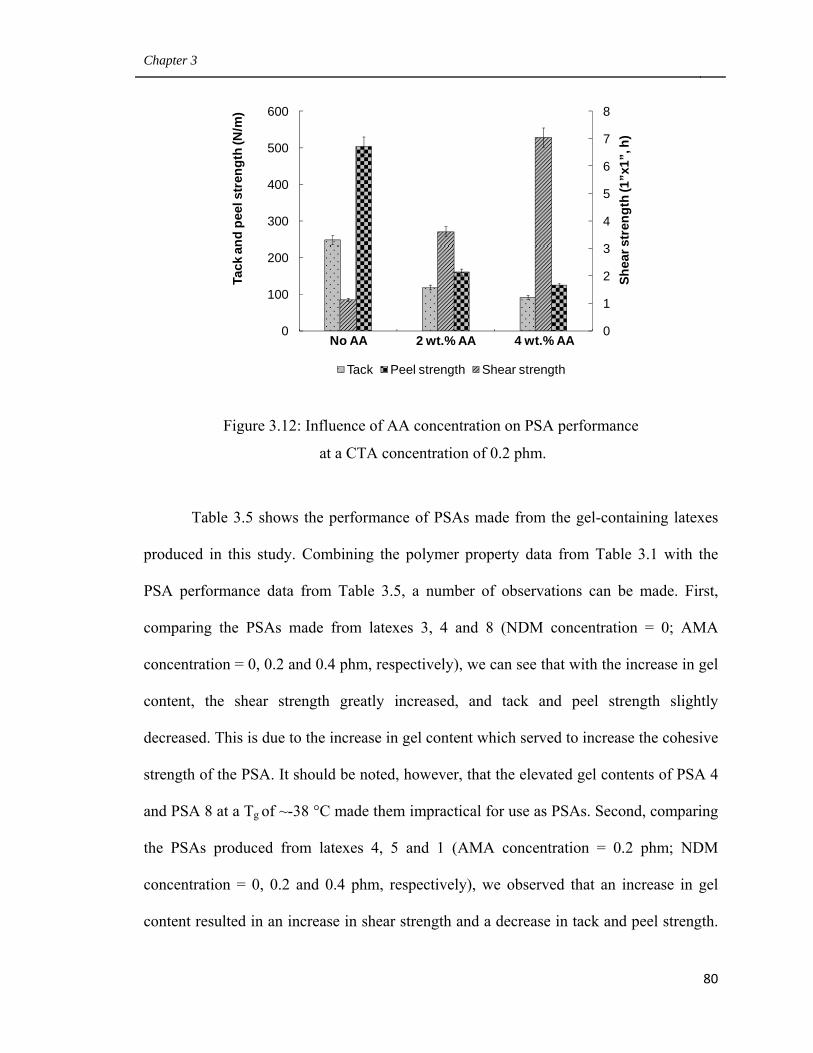
Chapter 3
80
Figure 3.12: Influence of AA concentration on PSA performance
at a CTA concentration of 0.2 phm.
Table 3.5 shows the performance of PSAs made from the gel-containing latexes
produced in this study. Combining the polymer property data from Table 3.1 with the
PSA performance data from Table 3.5, a number of observations can be made. First,
comparing the PSAs made from latexes 3, 4 and 8 (NDM concentration = 0; AMA
concentration = 0, 0.2 and 0.4 phm, respectively), we can see that with the increase in gel
content, the shear strength greatly increased, and tack and peel strength slightly
decreased. This is due to the increase in gel content which served to increase the cohesive
strength of the PSA. It should be noted, however, that the elevated gel contents of PSA 4
and PSA 8 at a Tg of ~-38 °C made them impractical for use as PSAs. Second, comparing
the PSAs produced from latexes 4, 5 and 1 (AMA concentration = 0.2 phm; NDM
concentration = 0, 0.2 and 0.4 phm, respectively), we observed that an increase in gel
content resulted in an increase in shear strength and a decrease in tack and peel strength.
0
1
2
3
4
5
6
7
8
0
100
200
300
400
500
600
1 2 3
Tack
and
pee
l str
engt
h (N
/m)
Tack Peel strength Shear strength
Shea
r str
engt
h (1
”x1”
, h)
No AA 2 wt.% AA 4 wt.% AA
Chapter 3
81
The polymer materials from latexes 4 and 5 cannot be used as PSAs due to their high gel
contents at a Tg of about -38°C. In the above mentioned two cases, the influence of gel
content on PSA performance overshadows any effects due to Mw or Mc. Thus, to study
the influence of Mc and Mw on PSA performance, it will be necessary to study PSAs with
similar gel contents. Finally, comparing PSAs with similar gel contents and similar Mc,
those from latexes 1 and 11, we observe a slight decrease in tack and peel strength and a
significant increase in shear strength with an increase in Mw. This is consistent with the
change in G’ and G” moduli as shown in Figures 3.7 and 3.8 for PSA 1 and 11. These
findings concur with the report that the shear strength is related to the modulus at high
temperature (127°C), and the bigger the modulus, the larger the shear strength.[41] The
fact that the increases in tack and peel strength are small is because tack and peel strength
are proportional to the G” at debonding frequency/G’ at bonding frequency,[38] and
Figure 3.7 and 3.8 clearly show both G’ and G” increased with Mw at the same
magnitude. Latex 5 has similar gel content as latex 6, but larger Mc and Mw values (see
Table 3.1), and from Table 3.5 we can see that the influence of Mc and Mw on PSA
performance are not observable. This is because the polymer material from these two
latexes no longer satisfied the Dahlquist contact criterion[42] due to combination of high
gel content and high Tg. In a future study, we will modify the polymer composition to
lower the Tg, and thus be able to use higher gel content latexes as PSAs.
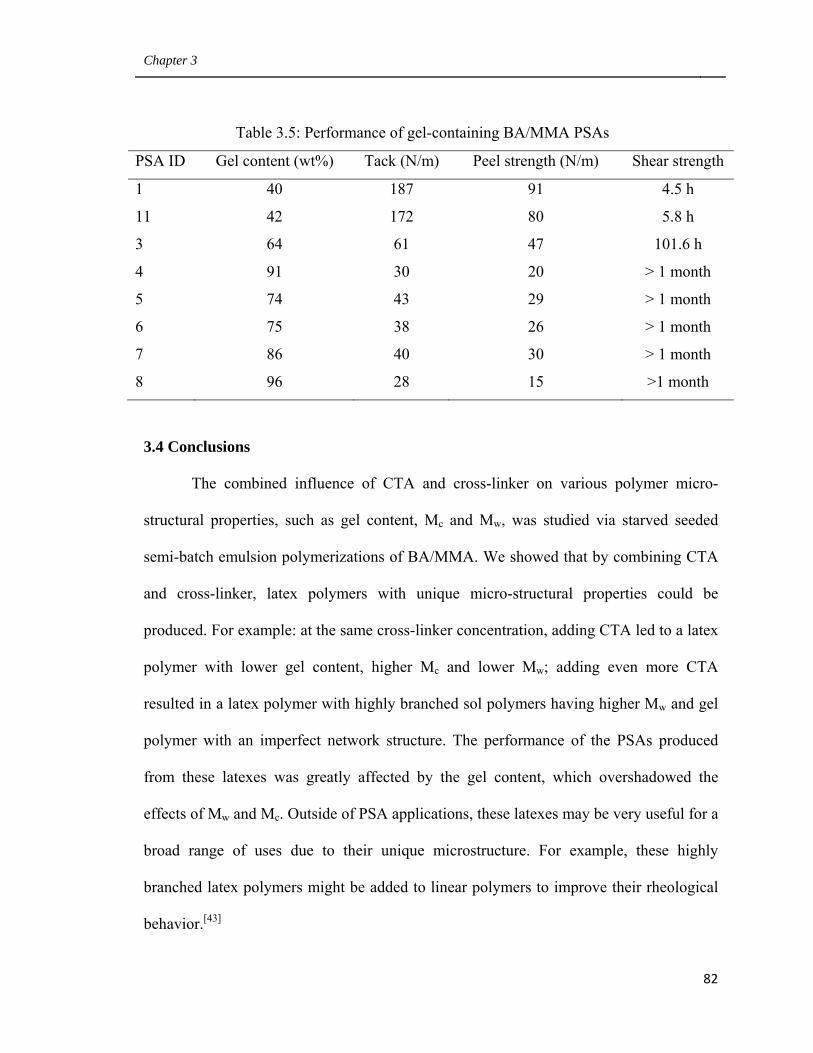
Chapter 3
82
Table 3.5: Performance of gel-containing BA/MMA PSAs
PSA ID Gel content (wt%) Tack (N/m) Peel strength (N/m) Shear strength
1 40 187 91 4.5 h
11 42 172 80 5.8 h
3 64 61 47 101.6 h
4 91 30 20 > 1 month
5 74 43 29 > 1 month
6 75 38 26 > 1 month
7 86 40 30 > 1 month
8 96 28 15 >1 month
3.4 Conclusions
The combined influence of CTA and cross-linker on various polymer micro-
structural properties, such as gel content, Mc and Mw, was studied via starved seeded
semi-batch emulsion polymerizations of BA/MMA. We showed that by combining CTA
and cross-linker, latex polymers with unique micro-structural properties could be
produced. For example: at the same cross-linker concentration, adding CTA led to a latex
polymer with lower gel content, higher Mc and lower Mw; adding even more CTA
resulted in a latex polymer with highly branched sol polymers having higher Mw and gel
polymer with an imperfect network structure. The performance of the PSAs produced
from these latexes was greatly affected by the gel content, which overshadowed the
effects of Mw and Mc. Outside of PSA applications, these latexes may be very useful for a
broad range of uses due to their unique microstructure. For example, these highly
branched latex polymers might be added to linear polymers to improve their rheological
behavior.[43]
Chapter 3
83
Latexes with similar gel contents were produced by simultaneously increasing the
CTA and cross-linker concentrations. At a moderate gel content range (~40 wt%), the
latex produced at higher CTA and cross-linker levels had a lower Mw, and a similar Mc,
which was due to the imperfect gel structure. The performance of PSA films cast from
these latexes correlated well with DMA data. Under similar conditions (i.e., higher CTA
and cross-linker levels) but at higher gel contents (~75 wt%), the latex had both a lower
Mw and Mc. These higher gel content latex polymers could not be employed as PSAs due
to combination of high gel content and high Tg. In addition, all the medium and high gel
content PSAs produced in this study showed very low tack and peel strength. This is also
due to the high Tg of these polymers. Therefore, the monomer mixture should be
modified in future study so as to lower the Tg of the corresponding latex polymers, and
accordingly generate adequate PSAs at medium or high gel content.
3.5 Acknowledgements
We thank the Natural Science and Engineering Research Council (NSERC) of Canada
and Omnova Solutions Inc. for financial support.
3.6 References
1. Lovell P. A., El-Aasser M. S., Emulsion Polymerization and Emulsion Polymers
1997, New York, John Wiley & Sons.
2. Jovanovic R., Dubé M. A., Journal of Macromolecular Science. Polymer Reviews
2004, C44(1): 1-51.
Chapter 3
84
3. El-Aasser M. S., Tang J. S., Wang X. R., Journal of Coatings Technology 2001, 73:
51-63.
4. Nakayama Y., Progress in Organic Coatings 2004, 51(4): 280-299.
5. Tobing S., Klein A., Sperling L. H., Journal of Applied Polymer Science 2001,
81(9): 2109-2117.
6. Tobing S. D., Klein A., Journal of Applied Polymer Science 2001, 79(12): 2230-
2244.
7. Tobing S. D., Klein A., Journal of Applied Polymer Science 2001, 79(14): 2558-
2564.
8. Zosel A., Ley G., Macromolecules 1993, 26(9): 2222-2227.
9. Zosel A., International Journal of Adhesion and Adhesives 1998, 18(4): 265-271.
10. Plessis C., Arzamendi G., Leiza J. R., Macromolecules 2000, 33(14): 5041-5047.
11. Plessis C., Arzamendi G., Leiza J. R., Journal of Polymer Science Part A: Polymer
Chemistry 2001, 39(7): 1106-1119.
12. Bouvier-Fontes L., Pirri R., Asua J. M., Journal of Polymer Science Part A:
Polymer Chemistry 2005, 43(20): 4684-4694.
13. Bouvier-Fontes L., Pirri R., Magnet S., Macromolecules 2005, 38(7): 2722-2728.
14. Shen H. Z., Zhang J. Y., Liu S. J., Journal of Applied Polymer Science 2008,
107(3): 1793-1802.
15. Chauvet J., Asua J. A., Leiza J. R., Polymer 2005, 46(23): 9555-9561.
16. Elizalde O., Arzamendi G., Leiza J. R., Industrial and Engineering Chemistry
Research 2004, 43(23): 7401-7409.
Chapter 3
85
17. Plessis C., Arzamendi G., Agnely M., Journal of Polymer Science Part A: Polymer
Chemistry 2002, 40(16): 2878-2883.
18. Barudio I., Guillot J., Fevotte G., Journal of Polymer Science Part A: Polymer
Chemistry 1998, 36(1): 157-168.
19. Former C., Castro J., Fellows C. M., Journal of Polymer Science Part A: Polymer
Chemistry 2002, 39(20): 3335-3349.
20. Kajtna J., Golob J., Krajnc M., International Journal of Adhesion and Adhesives
2009, 29(2): 186-194.
21. Pressure Sensitive Tape Council, Test Methods for Pressure Sensitive Adhesive
Tapes 2004, Northbrook, Illinois.
22. Odian G., Principles of Polymerization 2004, Willey, Hoboken, New Jersey.
23. Tang J. S., Ding T. H., Daniels E. S., Journal of Applied Polymer Science 2003,
88(1): 30-41.
24. Maxwell I. A., Morrison B. R., Napper D. H., Makromolekulare Chemie-
Macromolecular Chemistry and Physics 1992, 193(2): 303-313.
25. Sayer C., Lima E. L., Pinto J. C., Journal of Polymer Science Part A: Polymer
Chemistry 2000, 38(2): 367-375.
26. Bajpai S., Rai J. S. P., Nigam I., Journal of Applied Polymer Science 2009, 112(4):
2374-2382.
27. Dubé M. A., Penlidis A., Polymer 1995, 36(3): 587-598.
28. Robeson L., Polymer Blends: A Comprehensive Review 2007, Munich, Germany.
29. Plessis C., Arzamendi G., Leiza J. R., Macromolecules 2000, 33(1): 4-7.
30. Gonzalez I., Asua J. A., Leiza J. R., Polymer 2007, 48(9): 2542-2547.
Chapter 3
86
31. Perrin D., Dempsey B., Serjeant E. P., pKa Predictions for Organic Acids and Bases
1981, Chapman & Hall, London.
32. Lee J. W., Kim S. Y., Kim S. S., Journal of Applied Polymer Science 1999, 73(1):
113-120.
33. Fetters L. J., Lohse D. J., Richter D., Macromolecules 1994, 27(17): 4639-4647.
34. Wool R. P. Polymer Interfaces, Structure, and Strength. Cincinnati 1995, Hanser
Gardner Publications, Cincinnati.
35. Chang E. P., Journal of Adhesion 1991, 34(1-4): 189-200.
36. Chang E. P., Journal of Adhesion 1997, 60(1-4): 233-248.
37. Tse M. F., Jacob L., The Journal of Adhesion 1996, 56(1-4): 79-95.
38. Yang H. W. H, Chang E. P., Trends in Polymer Science 1997, 5(11): 380-384.
39. Lakrout H., Creton C., Ahn D. C., Macromolecules 2001, 34(21): 7448-7458.
40. Dahlquist C. A., Handbook of Pressure Sensitive Adhesives 1989, Van Nostrand
Reinhold, New York.
41. Dale W. C., Paster M. D., Haynes J. K. Journal of Adhesion 1989, 31(1): 1-20.
42. Satas D., Handbook of Pressure Sensitive Adhesive Technology 1989, Van
Nostrand Reinhold, New York.
43. Brigitte I. V., Albena L., Chemistry Reviews 2009, 109: 5924-5973.
44. Brandrup J., Immergut E.H., Grulke E.A., Polymer Handbook 1999, 4th Edition,
John Wiley & Sons.
CHAPTER 4
THE INFLUENCE OF BUTYL ACRYLATE/METHYL
METHACRYLATE/2-HYDROXY ETHYL
METHACRYLATE/ACRYLIC ACID LATEX PROPERTIES
ON PRESSURE SENSITIVE ADHESIVE PERFORMANCE
________________________________________________
Chapter 4
88
The Influence of Butyl Acrylate/Methyl Methacrylate/2-Hydroxy Ethyl
Methacrylate/Acrylic Acid Latex Properties
on Pressure Sensitive Adhesive Performance
Lili Qie and Marc A. Dubé*
Department of Chemical and Biological Engineering,
Centre for Catalysis Research and Innovation,
University of Ottawa, 161 Louis Pasteur Pvt., Ottawa, Ontario, Canada K1N 6N5
Abstract
Pressure sensitive adhesives (PSAs) were produced using latexes synthesized via a
starved seeded semi-batch emulsion polymerization process with butyl acrylate (BA),
methyl methacrylate (MMA), and sometimes additional monomers, 2-hydroxy ethyl
methacrylate (HEMA) and/or acrylic acid (AA). For the BA/MMA comonomer latexes,
the amount of cross-linker (allyl methacrylate), monomer emulsion and initiator solution
feeding times, and the BA/MMA weight ratio were manipulated to vary the polymer
properties. The performance of PSA films cast from these latexes was evaluated by tack,
peel strength and shear strength. The effect of polymer properties on PSA performance
was related to the viscoelastic properties of the PSAs. For BA/MMA latexes, it was not
possible to greatly improve the peel strength even at great sacrifice of shear strength for
PSAs with gel contents of ~60 wt% or higher. This was because the ratio of the loss
modulus at debonding frequency to the storage modulus at bonding frequency did not
vary significantly for the conditions studied. The addition of HEMA provided a
Chapter 4
89
significant influence on latex polymer properties as well as PSA performance for both
high (>60 wt%) and low (~20 wt%) gel contents. For some cases, tack, peel strength and
shear strength were simultaneously and greatly improved by the addition of HEMA.
Adding both AA and HEMA while decreasing the amount of emulsifier, also resulted in a
PSA with much better performance (i.e., higher tack, peel strength and shear strength)
than a BA/MMA PSA with similar gel content (~60 wt%).
4.1 Introduction
Pressure sensitive adhesives (PSAs) are viscoelastic materials. They are permanently
tacky and can adhere to solid surfaces under light pressure and short contact time.[1] PSAs
are widely used in many applications such as tape, label, protection film, and medical
products.[2] Furthermore, they are broadly applied as assembling tools where precise
positioning and instant adhesion are required.[3] PSAs can be produced via hot-melt,
solution polymerization and emulsion polymerization techniques. Recently, the latter has
attracted much interest due to its relatively more environmental friendly process. Hence,
the focus of the current study is on latex-based PSAs.
PSA performance is usually evaluated by tack, peel strength and shear strength.
Since each PSA application has its own unique performance requirements, much research
has been carried out in order to understand what affects this performance. It is known that
PSA performance is strongly related to its polymer properties such as composition, glass
transition temperature (Tg), and microstructure (e.g., gel content, molecular weight of sol
polymers (Mw))[4-19] as well as the work of adhesion (or surface interaction energy)
between the PSA and its substrate.[20-23] It is very challenging to develop PSAs, especially
Chapter 4
90
latex-based PSAs, suitable for applications that require high tack, peel strength and shear
strength. The reason is that these PSAs often require high gel contents to provide them
with high cohesive strength, and correspondingly high shear strength. However, tack and
peel strength usually decrease with gel content. Therefore, high shear strength usually
corresponds to low tack and peel strength.[1,16-17] This conundrum was encountered in a
previous study where most of the high gel content (> ~60 wt%) polymer materials
produced were unsuitable for use as PSAs due to their extremely high shear strength and
low tack and peel strength.[24] Considering this, an approach for significantly improving
tack and peel strength at small sacrifice of shear strength, or if possible increasing tack,
peel strength and shear strength simultaneously, is needed.
To achieve the above goal, a starved seeded semi-batch emulsion polymerization
process was employed, as it can provide improved process and polymer property control
(i.e., polymerization rate, heat release rate, polymer composition and particle
morphology), compared with batch polymerization.[25-28] The butyl acrylate (BA)/methyl
methacrylate (MMA) copolymer system was selected due to its wide use in commercial
PSA production. Cross-linker (allyl methacrylate, AMA) concentration, feeding rates,
and BA/MMA weight ratio were varied to provide a range of properties. With these
BA/MMA polymers, we studied if decreasing gel content, cross-linking density, and/or
glass transition temperature (Tg) could significantly increase tack and peel strength at a
small sacrifice of shear strength.
The effect of adding 2-hydroxy ethyl methacrylate (HEMA) to the BA/MMA
monomer mixture on the polymerization process, latex polymer properties, and PSA
performance was also studied. HEMA is widely used for making latex-based PSAs, as it
Chapter 4
91
can help stabilize latex particles and improve surface properties.[29-31] In this study, it was
desired to: (1) modify PSA bulk properties by introducing strong hydrogen bonds,
changing Tg, etc., and (2) modify PSA surface properties by introducing polar hydroxyl
groups at the surface of the PSA films. These PSA surface hydroxyl groups might form
strong hydrogen bonds with the polar groups of a substrate. Hence the work of adhesion
between the PSA and substrate could be greatly improved. Thus, with BA/MMA/HEMA
PSAs, there is potential to improve tack, peel strength and shear strength simultaneously
by manipulating PSA bulk and surface properties concurrently. The BA/MMA/HEMA
PSA polymers were produced by manipulating the HEMA concentration while
maintaining the BA/MMA weight ratio and by varying the concentration of chain transfer
agent (1-dodecanethiol, NDM). Finally, in order to further improve the PSA surface
properties, acrylic acid (AA) was also added to the recipe while reducing the emulsifier
concentration.
4. 2 Experimental procedures
4.2.1 Materials
Butyl acrylate (BA, reagent grade), methyl methacrylate (MMA, reagent grade), acrylic
acid (AA, reagent grade) , and 2-hydroxy methacrylate (HEMA, 97%) monomers, allyl
methacrylate (AMA, reagent grade) cross-linker, 1-dodecanethiol (NDM, reagent grade)
chain transfer agent, sodium dodecyl sulphate (SDS, reagent grade) surfactant, sodium
bicarbonate (NaHCO3) buffer, potassium persulfate (KPS, reagent grade) initiator and
hydroquinone (HQ) inhibitor were all obtained from Sigma Aldrich and were used as
supplied. Distilled deionized water (DI-H2O) was used throughout the study. Ammonia
Chapter 4
92
(30 wt% in H2O) was obtained from British Drug House. Tetrahydrofuran (THF, HPLC
grade from EMD Chemicals) solvent was used in the polymer characterization. Nitrogen
gas (Linde Canada) was used to purge the reactor. PTFE porous membranes with pore
size of 0.2 μm, for use in gel content measurements, were purchased from Cole-Parmer
Canada.
4.2.2 Latex preparation
All runs were performed via a seeded semi-batch emulsion polymerization process. The
seed was prepared batch-wise using the initial charge formulation as shown in Table 4.1.
To prepare the seed, all the reactants except the initiator solution and monomer mixture
were charged to a one-litre Mettler-Toledo LabMax™ reactor at room temperature. The
stainless steel reactor vessel was equipped with an anchor stirring blade and various feed
and sampling ports. The stirring speed was maintained at 250 rpm throughout the
polymerization process. The temperature of the reactants was increased to 70oC within 30
min, and the monomer mixture and initiator solution were added in two separate shots to
the reactor to make the seed. The temperature was then raised to 75oC within 5 min and
the seed polymerization was continued for an additional 10 min. At this point, the
initiator feed solution and monomer emulsion, as shown in Table 4.1, were added slowly
to the reactor using two separate metering pumps. The feed times of the initiator solution
and the monomer emulsion were manipulated to modify the polymer properties as
reported in the Results and Discussion section. After the feeding was completed, the
reaction was allowed to proceed for an additional 50 min to increase monomer
conversion. The latex was then cooled to below 30oC, then HQ was added to stop the
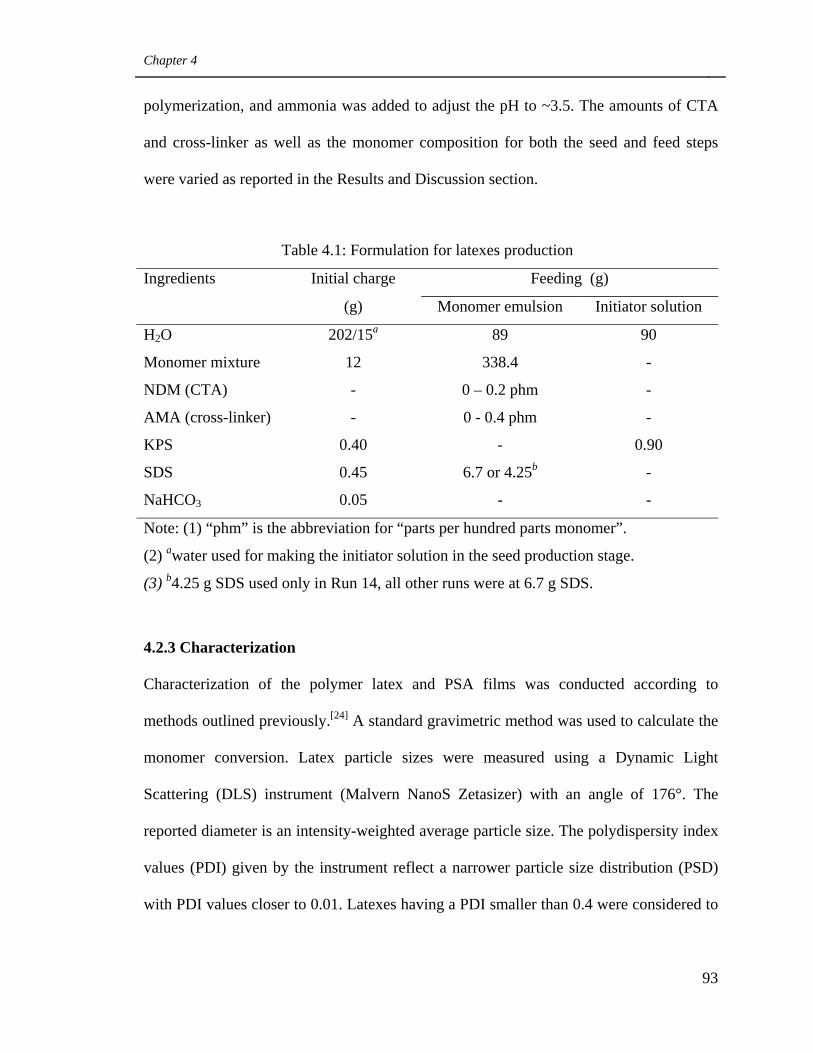
Chapter 4
93
polymerization, and ammonia was added to adjust the pH to ~3.5. The amounts of CTA
and cross-linker as well as the monomer composition for both the seed and feed steps
were varied as reported in the Results and Discussion section.
Table 4.1: Formulation for latexes production
Ingredients Initial charge Feeding (g)
(g) Monomer emulsion Initiator solution
H2O 202/15a 89 90
Monomer mixture 12 338.4 -
NDM (CTA) - 0 – 0.2 phm -
AMA (cross-linker) - 0 - 0.4 phm -
KPS 0.40 - 0.90
SDS 0.45 6.7 or 4.25b -
NaHCO3 0.05 - -
Note: (1) “phm” is the abbreviation for “parts per hundred parts monomer”.
(2) awater used for making the initiator solution in the seed production stage.
(3) b4.25 g SDS used only in Run 14, all other runs were at 6.7 g SDS.
4.2.3 Characterization
Characterization of the polymer latex and PSA films was conducted according to
methods outlined previously.[24] A standard gravimetric method was used to calculate the
monomer conversion. Latex particle sizes were measured using a Dynamic Light
Scattering (DLS) instrument (Malvern NanoS Zetasizer) with an angle of 176°. The
reported diameter is an intensity-weighted average particle size. The polydispersity index
values (PDI) given by the instrument reflect a narrower particle size distribution (PSD)
with PDI values closer to 0.01. Latexes having a PDI smaller than 0.4 were considered to
Chapter 4
94
have a narrow particle size distribution. The detection range of the instrument was 0.6 nm
to 6 μm.
A modification of the method by Tobing and Klein[16] was used to measure gel
content.[24] The THF solution remaining from the gel content test was concentrated, as
necessary, and analyzed for sol polymer molecular weight using Gel Permeation
Chromatography (GPC). The calibration curve included a set of 12 polystyrene standards
(EasiCal from Polymer Laboratories) with a range of 162 to 6,035,000 g/mol. The
universal calibration method was used based on the BA/MMA composition with the
Mark-Houwink parameters, K and α, for BA and MMA are 1.1 x 10⁻⁴ dL/g and 0.708,
and 1.28 x 10⁻⁴ dL/g and 0.690, respectively.[32]
Tack, peel strength and shear strength were measured according to the Pressure
Sensitive Tape Council standards PSTC-6, PSTC-1 and PSTC-7, respectively.[33] Further
details of these methods were given previously.[24]
The viscoelastic properties of the PSAs were characterized using a RDA III
rheometer (TA Instruments) with 25 mm parallel plate geometry. The sample thickness
was 1.7+/-0.2 mm. Three types of measurements were done: (1) room temperature
frequency sweep. This test was carried out at 23°C, the frequency range was from
0.031848 to 80 Hz, and there were 5 data points within each decade of the log frequency;
(2) frequency sweep at various temperatures. In order to get a frequency master curve,
frequency sweeps were carried out at different temperatures including -35, -23, 0, 23, 50
and 80oC; for each temperature, the frequency sweep data were obtained at 0.05, 0.1, 0.2,
0.5, 1, 2, 5, 10, 20 and 50 Hz. The frequency master curve was built with the 23oC
frequency sweep as reference; and (3) temperature sweep. The measurements were from -
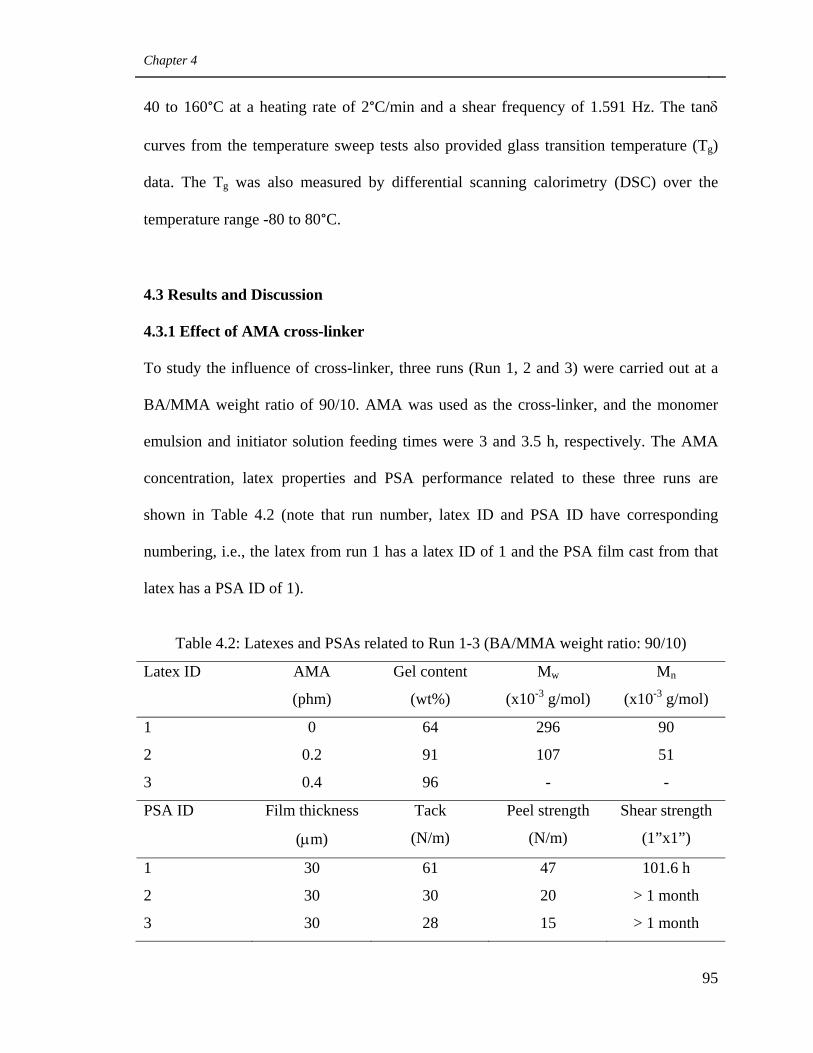
Chapter 4
95
40 to 160°C at a heating rate of 2°C/min and a shear frequency of 1.591 Hz. The tanδ
curves from the temperature sweep tests also provided glass transition temperature (Tg)
data. The Tg was also measured by differential scanning calorimetry (DSC) over the
temperature range -80 to 80°C.
4.3 Results and Discussion
4.3.1 Effect of AMA cross-linker
To study the influence of cross-linker, three runs (Run 1, 2 and 3) were carried out at a
BA/MMA weight ratio of 90/10. AMA was used as the cross-linker, and the monomer
emulsion and initiator solution feeding times were 3 and 3.5 h, respectively. The AMA
concentration, latex properties and PSA performance related to these three runs are
shown in Table 4.2 (note that run number, latex ID and PSA ID have corresponding
numbering, i.e., the latex from run 1 has a latex ID of 1 and the PSA film cast from that
latex has a PSA ID of 1).
Table 4.2: Latexes and PSAs related to Run 1-3 (BA/MMA weight ratio: 90/10)
Latex ID AMA Gel content Mw Mn
(phm) (wt%) (x10-3 g/mol) (x10-3 g/mol)
1 0 64 296 90
2 0.2 91 107 51
3 0.4 96 - -
PSA ID Film thickness Tack Peel strength Shear strength
(μm) (N/m) (N/m) (1”x1”)
1 30 61 47 101.6 h
2 30 30 20 > 1 month
3 30 28 15 > 1 month
Chapter 4
96
The three latexes had similar z-average particle diameters (~150 nm). In addition,
the PSD of these latexes was very narrow with PDI < 0.04 with no apparent secondary
peaks or shoulders at either the low or high particle size ranges. This is consistent with
the assumption that neither secondary particle nucleation nor coagulation occurred during
the polymerization.
All three runs were carried out under monomer-starved conditions with the
instantaneous monomer conversion beyond 90 wt% for most of the polymerization
process. The solids contents of these three latexes were each ~47 wt%. It was found that
AMA did not significantly affect the polymerization rate.
Table 4.2 shows that with an increase in AMA concentration, the gel content
increased and the Mw decreased. This phenomenon is well known.[34-35] While
polymerizing a BA-rich monomer mixture in the absence of cross-linker, gel is formed by
chain transfer mechanism, and it involves two steps: (1) branch radical formation via
either intra-molecular chain transfer by backbiting or inter-molecular chain transfer to
polymer, due to the presence of labile tertiary hydrogen in the BA unit of the polymer
chains;[36-39] (2) gel formation through combination termination between the branched
polymer radicals.[40] In the presence of cross-linker, the pendent double bonds of the
cross-linker unit in the polymer chains can also result in the formation of branched
radicals via propagation. The termination by combination of these branched radicals will
also result in the formation of gel. This is the main gel formation mechanism.[41] Since
the number of pendent double bonds increased with the AMA concentration, the gel
content increased. In addition, as longer polymer chains have more pendent double
Chapter 4
97
bonds, they are more likely to incorporate into gel polymer, and accordingly Mw
decreases with the increase in gel content.
All three PSAs showed adhesive (as opposed to cohesive) failure during both tack
and peel strength tests. Table 4.2 shows that with the increase in gel content, tack and
peel strength decreased while shear strength increased. The increase in gel content led to
higher cohesive strength and a larger shear strength. At the same time, the resulting lower
deformability and flow ability of the PSA weakened the bonding between the PSA and
substrate, causing lower tack and peel strength.[1] In all cases in Table 4.2, the tack and
peel strength values of the PSAs were very low.
4.3.2 Effect of feeding time
In order to improve tack and peel strength, the monomer emulsion and initiator feeding
times of Run 1 were reduced by 0.5 h each. Thus, Run 4 was identical to Run 1 except for
the feeding times. Run 4 was also carried out under monomer-starved condition. All
remaining runs were conducted using these shortened feeding times of 2.5 h for the
monomer emulsion and 3 h for the initiator solution.
The polymer properties and PSA performance of Run 4 are shown in Table 4.3.
By comparing the data of Run 4 to that of Run 1 (see Table 4.2), one observes a slight
decrease in gel content from 64 wt% to 60 wt%, and a slight increase in Mw from 296,000
to 328,000 g/mol. The particle size and Tg were not significantly affected by the feeding
times. The PSD of latex 4 was very narrow with a z-average diameter close to that of
latex 1, i.e., ~150 nm. The Tg values obtained via DMA were -27°C and -28°C,
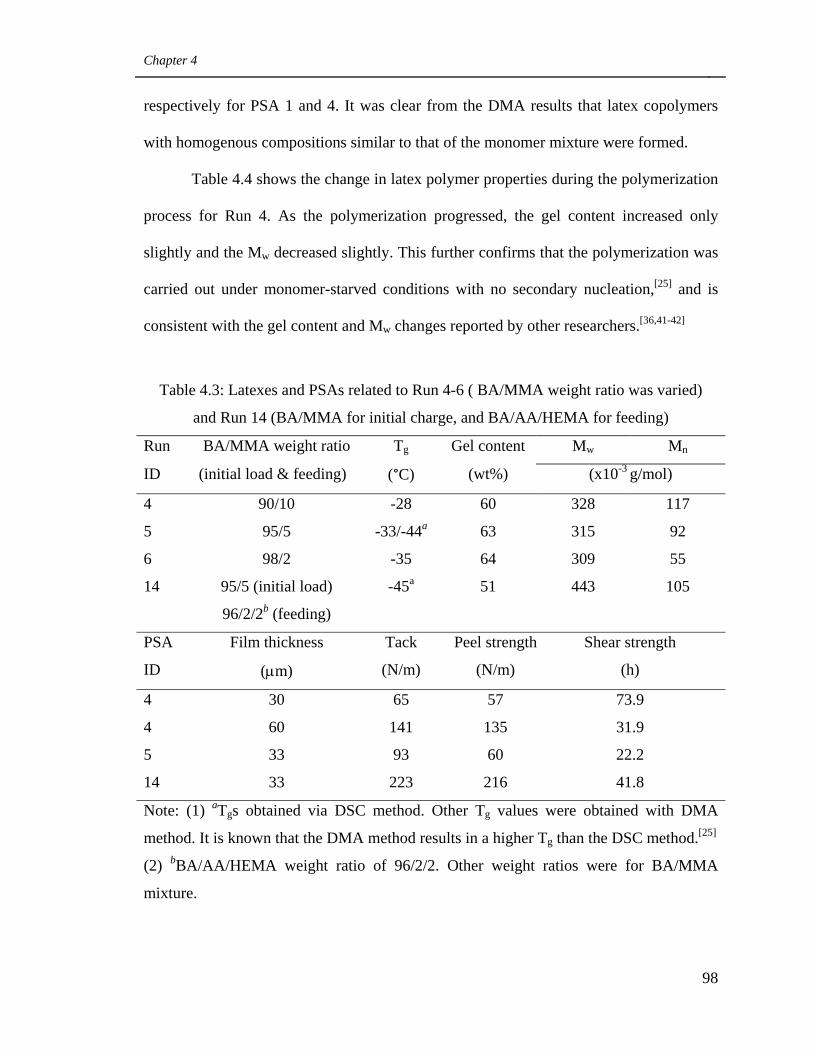
Chapter 4
98
respectively for PSA 1 and 4. It was clear from the DMA results that latex copolymers
with homogenous compositions similar to that of the monomer mixture were formed.
Table 4.4 shows the change in latex polymer properties during the polymerization
process for Run 4. As the polymerization progressed, the gel content increased only
slightly and the Mw decreased slightly. This further confirms that the polymerization was
carried out under monomer-starved conditions with no secondary nucleation,[25] and is
consistent with the gel content and Mw changes reported by other researchers.[36,41-42]
Table 4.3: Latexes and PSAs related to Run 4-6 ( BA/MMA weight ratio was varied)
and Run 14 (BA/MMA for initial charge, and BA/AA/HEMA for feeding)
Run BA/MMA weight ratio Tg Gel content Mw Mn
ID (initial load & feeding) (°C) (wt%) (x10-3 g/mol)
4 90/10 -28 60 328 117
5 95/5 -33/-44a 63 315 92
6 98/2 -35 64 309 55
14 95/5 (initial load) -45a 51 443 105
96/2/2b (feeding)
PSA Film thickness Tack Peel strength Shear strength
ID (μm) (N/m) (N/m) (h)
4 30 65 57 73.9
4 60 141 135 31.9
5 33 93 60 22.2
14 33 223 216 41.8
Note: (1) aTgs obtained via DSC method. Other Tg values were obtained with DMA
method. It is known that the DMA method results in a higher Tg than the DSC method.[25]
(2) bBA/AA/HEMA weight ratio of 96/2/2. Other weight ratios were for BA/MMA
mixture.
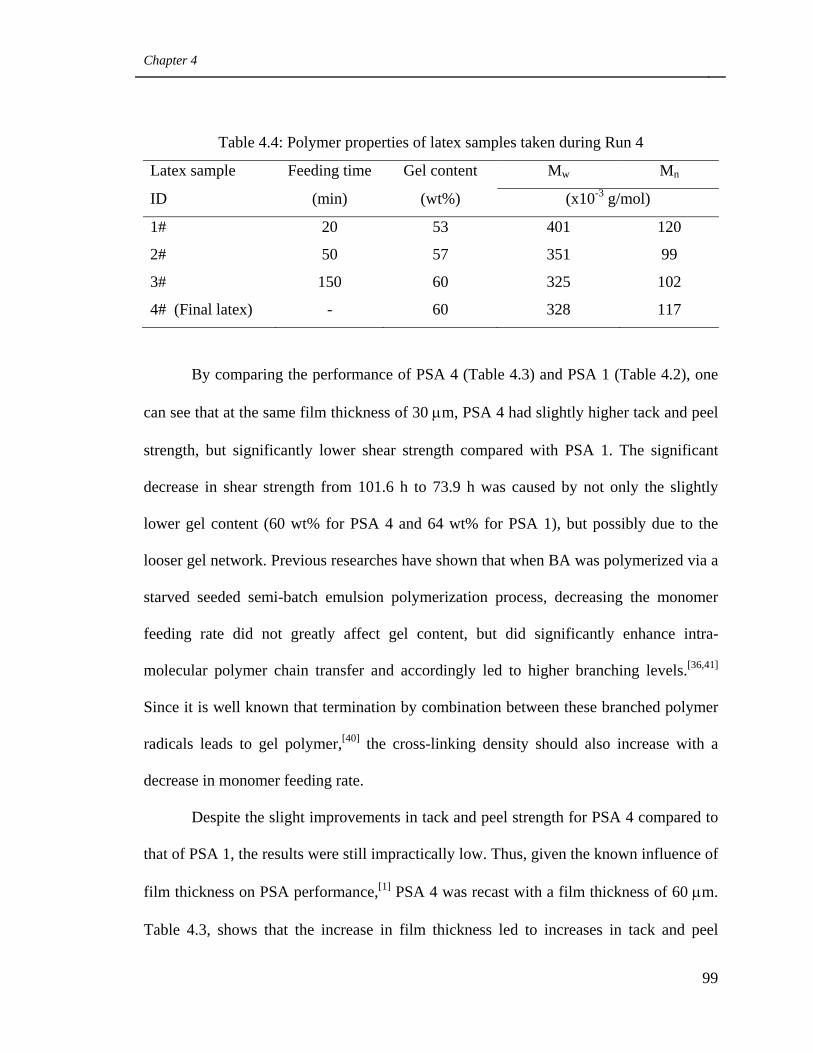
Chapter 4
99
Table 4.4: Polymer properties of latex samples taken during Run 4
Latex sample Feeding time Gel content Mw Mn
ID (min) (wt%) (x10-3 g/mol)
1# 20 53 401 120
2# 50 57 351 99
3# 150 60 325 102
4# (Final latex) - 60 328 117
By comparing the performance of PSA 4 (Table 4.3) and PSA 1 (Table 4.2), one
can see that at the same film thickness of 30 μm, PSA 4 had slightly higher tack and peel
strength, but significantly lower shear strength compared with PSA 1. The significant
decrease in shear strength from 101.6 h to 73.9 h was caused by not only the slightly
lower gel content (60 wt% for PSA 4 and 64 wt% for PSA 1), but possibly due to the
looser gel network. Previous researches have shown that when BA was polymerized via a
starved seeded semi-batch emulsion polymerization process, decreasing the monomer
feeding rate did not greatly affect gel content, but did significantly enhance intra-
molecular polymer chain transfer and accordingly led to higher branching levels.[36,41]
Since it is well known that termination by combination between these branched polymer
radicals leads to gel polymer,[40] the cross-linking density should also increase with a
decrease in monomer feeding rate.
Despite the slight improvements in tack and peel strength for PSA 4 compared to
that of PSA 1, the results were still impractically low. Thus, given the known influence of
film thickness on PSA performance,[1] PSA 4 was recast with a film thickness of 60 μm.
Table 4.3, shows that the increase in film thickness led to increases in tack and peel
Chapter 4
100
strength, but a significant decrease in the shear strength. All future PSA films were cast at
a thickness of 60 μm, unless otherwise mentioned.
4.3.3 Influence of BA/MMA weight ratio
Since the tack and peel strength were not significantly improved by shortening the
monomer feeding rate, the BA/MMA monomer weight ratio was manipulated to achieve
this goal. Considering that the Tg of poly(butyl acrylate) (PBA, -45°C) is much lower than
that of poly(methyl methacrylate) (PMMA, 105°C),[25] the BA/MMA weight ratio was
adjusted to 95/5 and 98/2 for Runs 5 and 6, respectively. The polymerization conditions
of these two runs were otherwise exactly the same as for Run 4.
The PSDs of latexes 5 and 6 were very narrow and did not show evidence of
secondary nucleation or coagulation. The particle diameters of latexes 5 and 6 were
similar to that of latex 4. The instantaneous monomer conversions for Runs 5 and 6 were
monitored and no significant differences from that of Run 4 were detected, although it is
well known that the polymerization reactivity ratio of MMA is almost 5 times of that of
BA (rBA = 0.507 and rMMA = 2.375).[43] This is due to the fact that the BA/MMA weight
ratio was changed only slightly and that monomer-starved conditions were used. In this
case, polymerization rate was mainly controlled by the monomer feeding rate. This is
consistent with the results of Elizalde et al. who studied the influence of BA/MMA
weight ratio on polymerization rate under monomer-starved conditions. In their case, they
examined a much broader BA/MMA weight ratio range and they observed only slight
decreases in instantaneous monomer conversion from ~91% to ~88% to ~85%, when the
Chapter 4
101
BA/MMA weight ratio was changed form 90/10 to 70/30 to 50/50 (Figure 6a of ref.
40).[44]
The polymer properties of the latexes form these three runs are shown in Table
4.3. As expected, increasing the amount of BA led to decreased Tg and slightly increased
gel contents. The latter was likely due to increased backbiting related to the higher BA
concentrations.[40]
The performance of PSA films 4, 5 and 6 is shown in Figure 4.1. Increasing the
BA concentration led to increases in tack and peel strength and a significant decrease in
shear strength. The decrease in shear strength was obviously due to the lower cohesive
strength of the PSA related to its lower Tg.[1] To explain the change in peel strength with
the increase in BA content, the viscoelastic properties of the three PSAs were measured.
Figures 4.2 and 4.3 show the storage and loss moduli, respectively, obtained via
frequency sweeps at 23°C for the three PSAs. One can observe that the storage modulus
curves of PSAs 4, 5 and 6 (see Figure 4.2) were nearly parallel to each other as were the
loss modulus curves (see Figure 4.3). This similarity in viscoelastic properties was likely
caused by the similar polymer microstructures of these PSAs. As mentioned earlier, these
PSAs had similar gel contents and Mw. Furthermore, it is likely that the Mc (molecular
weight between the cross-linking points) were also similar, considering the minor
composition differences between these three PSAs. Thus, similar polymer
microstructures enabled the PSAs to store (G’) and dissipate (G”) energy similarly under
the same dynamic force and the ratios of stored energy to dissipated energy were similar.
In addition, Figures 4.2 and 4.3 show that the values of the modulus decreased with the
increase of the amount of BA in the copolymer; this was due to the lower Tg.

Chapter 4
102
Figure 4.1: Performance of PSA films 4, 5, and 6. (PSA film thickness: 60 μm)
Figure 4.2: Storage modulus (G’) vs. frequency at 23°C for PSA 4, 5 and 6.
0
5
10
15
20
25
30
35
0
50
100
150
200
250
300
88 90 92 94 96 98 100
Shea
r str
engt
h (h
)
Tack
and
pee
l str
engt
h (N
/m)
BA content (wt%)Tack Peel strength Shear strength
1E+4
1E+5
1E+6
1E-2 1E-1 1E+0 1E+1 1E+2
Stor
age
mod
ulus
G' (
Pa)
Frequency (Hz)
PSA 4PSA 5PSA 6
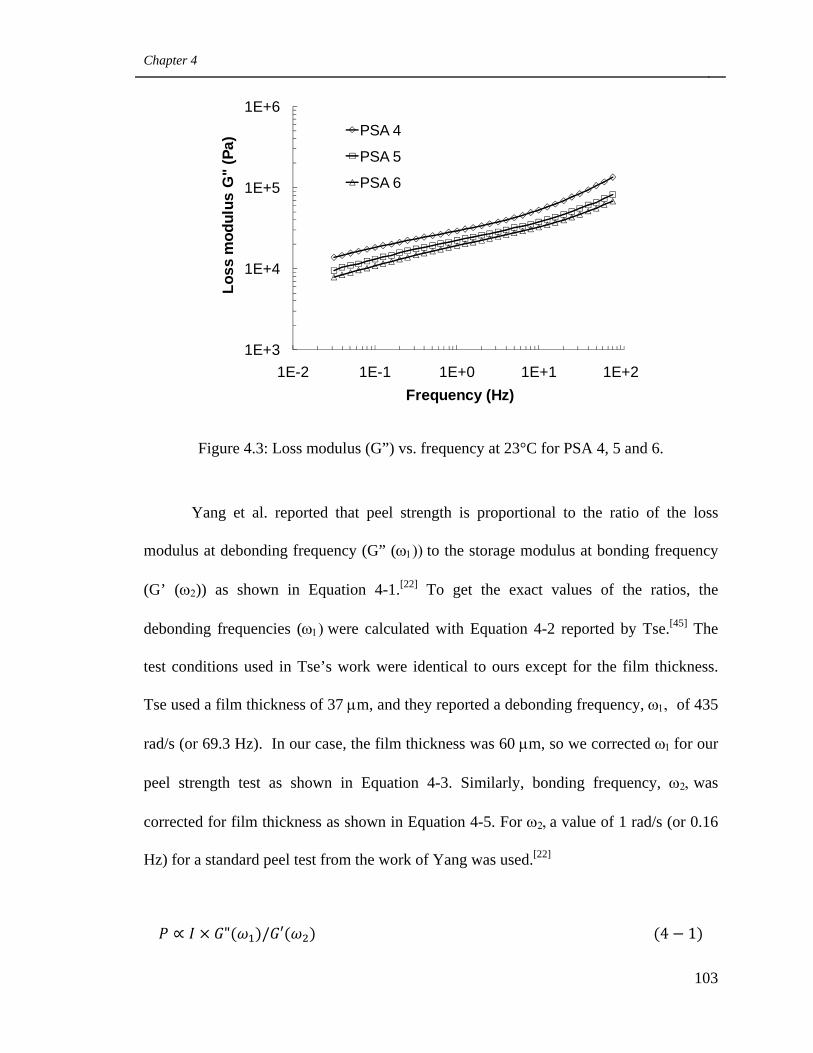
Chapter 4
103
Figure 4.3: Loss modulus (G”) vs. frequency at 23°C for PSA 4, 5 and 6.
Yang et al. reported that peel strength is proportional to the ratio of the loss
modulus at debonding frequency (G” (ω1)) to the storage modulus at bonding frequency
(G’ (ω2)) as shown in Equation 4-1.[22] To get the exact values of the ratios, the
debonding frequencies (ω1) were calculated with Equation 4-2 reported by Tse.[45] The
test conditions used in Tse’s work were identical to ours except for the film thickness.
Tse used a film thickness of 37 μm, and they reported a debonding frequency, ω1, of 435
rad/s (or 69.3 Hz). In our case, the film thickness was 60 μm, so we corrected ω1 for our
peel strength test as shown in Equation 4-3. Similarly, bonding frequency, ω2, was
corrected for film thickness as shown in Equation 4-5. For ω2, a value of 1 rad/s (or 0.16
Hz) for a standard peel test from the work of Yang was used.[22]
" / 4 1
1E+3
1E+4
1E+5
1E+6
1E-2 1E-1 1E+0 1E+1 1E+2
Loss
mod
ulus
G"
(Pa)
Frequency (Hz)
PSA 4
PSA 5
PSA 6
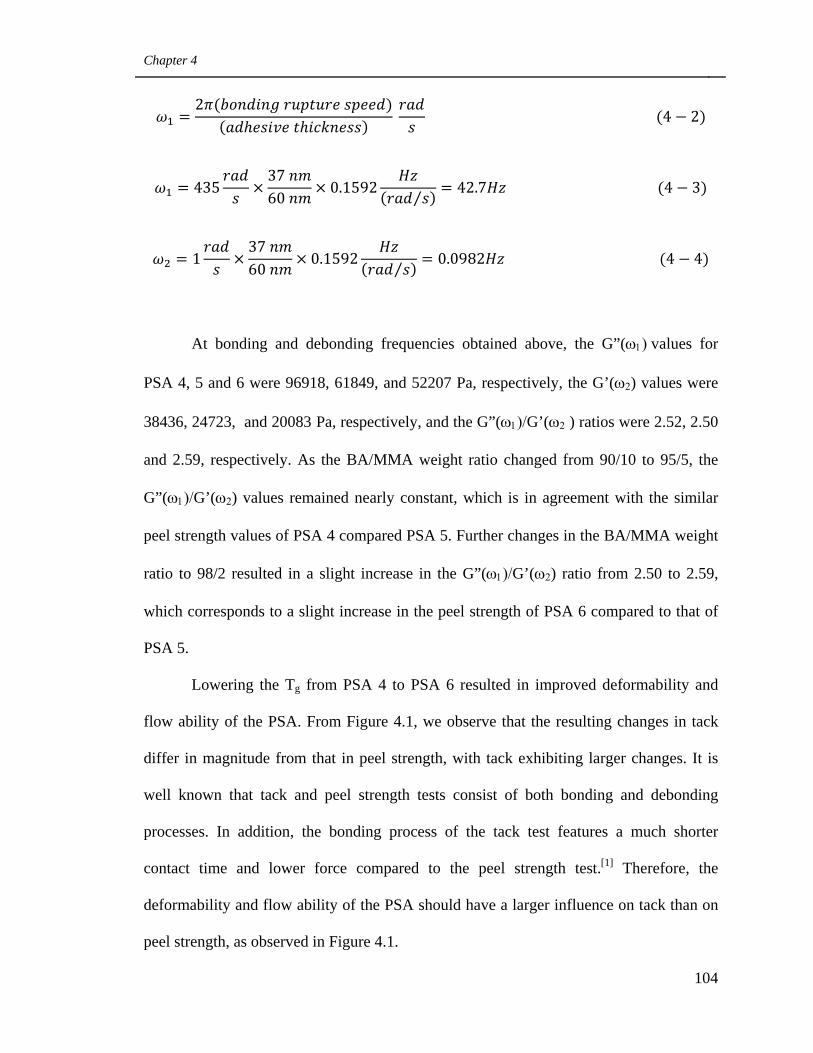
Chapter 4
104
2 4 2
43537 60 0.1592 ⁄ 42.7 4 3
137 60 0.1592 ⁄ 0.0982 4 4
At bonding and debonding frequencies obtained above, the G”(ω1) values for
PSA 4, 5 and 6 were 96918, 61849, and 52207 Pa, respectively, the G’(ω2) values were
38436, 24723, and 20083 Pa, respectively, and the G”(ω1)/G’(ω2 ) ratios were 2.52, 2.50
and 2.59, respectively. As the BA/MMA weight ratio changed from 90/10 to 95/5, the
G”(ω1)/G’(ω2) values remained nearly constant, which is in agreement with the similar
peel strength values of PSA 4 compared PSA 5. Further changes in the BA/MMA weight
ratio to 98/2 resulted in a slight increase in the G”(ω1)/G’(ω2) ratio from 2.50 to 2.59,
which corresponds to a slight increase in the peel strength of PSA 6 compared to that of
PSA 5.
Lowering the Tg from PSA 4 to PSA 6 resulted in improved deformability and
flow ability of the PSA. From Figure 4.1, we observe that the resulting changes in tack
differ in magnitude from that in peel strength, with tack exhibiting larger changes. It is
well known that tack and peel strength tests consist of both bonding and debonding
processes. In addition, the bonding process of the tack test features a much shorter
contact time and lower force compared to the peel strength test.[1] Therefore, the
deformability and flow ability of the PSA should have a larger influence on tack than on
peel strength, as observed in Figure 4.1.
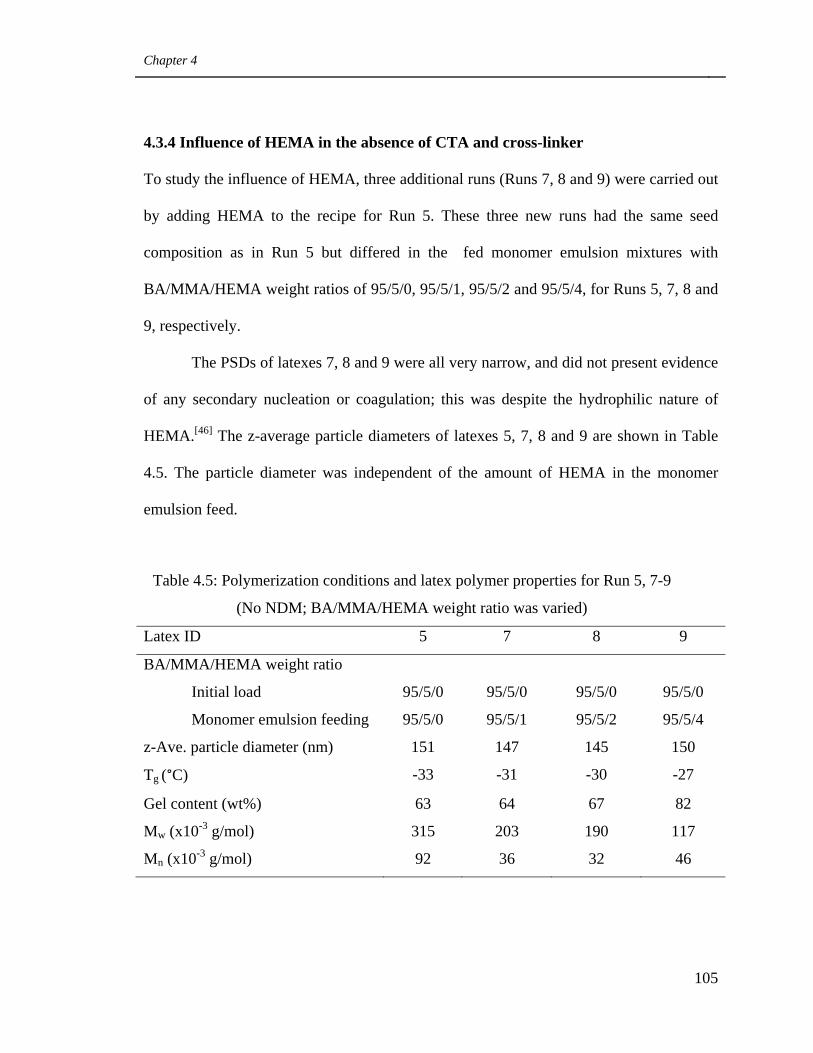
Chapter 4
105
4.3.4 Influence of HEMA in the absence of CTA and cross-linker
To study the influence of HEMA, three additional runs (Runs 7, 8 and 9) were carried out
by adding HEMA to the recipe for Run 5. These three new runs had the same seed
composition as in Run 5 but differed in the fed monomer emulsion mixtures with
BA/MMA/HEMA weight ratios of 95/5/0, 95/5/1, 95/5/2 and 95/5/4, for Runs 5, 7, 8 and
9, respectively.
The PSDs of latexes 7, 8 and 9 were all very narrow, and did not present evidence
of any secondary nucleation or coagulation; this was despite the hydrophilic nature of
HEMA.[46] The z-average particle diameters of latexes 5, 7, 8 and 9 are shown in Table
4.5. The particle diameter was independent of the amount of HEMA in the monomer
emulsion feed.
Table 4.5: Polymerization conditions and latex polymer properties for Run 5, 7-9
(No NDM; BA/MMA/HEMA weight ratio was varied)
Latex ID 5 7 8 9
BA/MMA/HEMA weight ratio
Initial load 95/5/0 95/5/0 95/5/0 95/5/0
Monomer emulsion feeding 95/5/0 95/5/1 95/5/2 95/5/4
z-Ave. particle diameter (nm) 151 147 145 150
Tg (°C) -33 -31 -30 -27
Gel content (wt%) 63 64 67 82
Mw (x10-3 g/mol) 315 203 190 117
Mn (x10-3 g/mol) 92 36 32 46
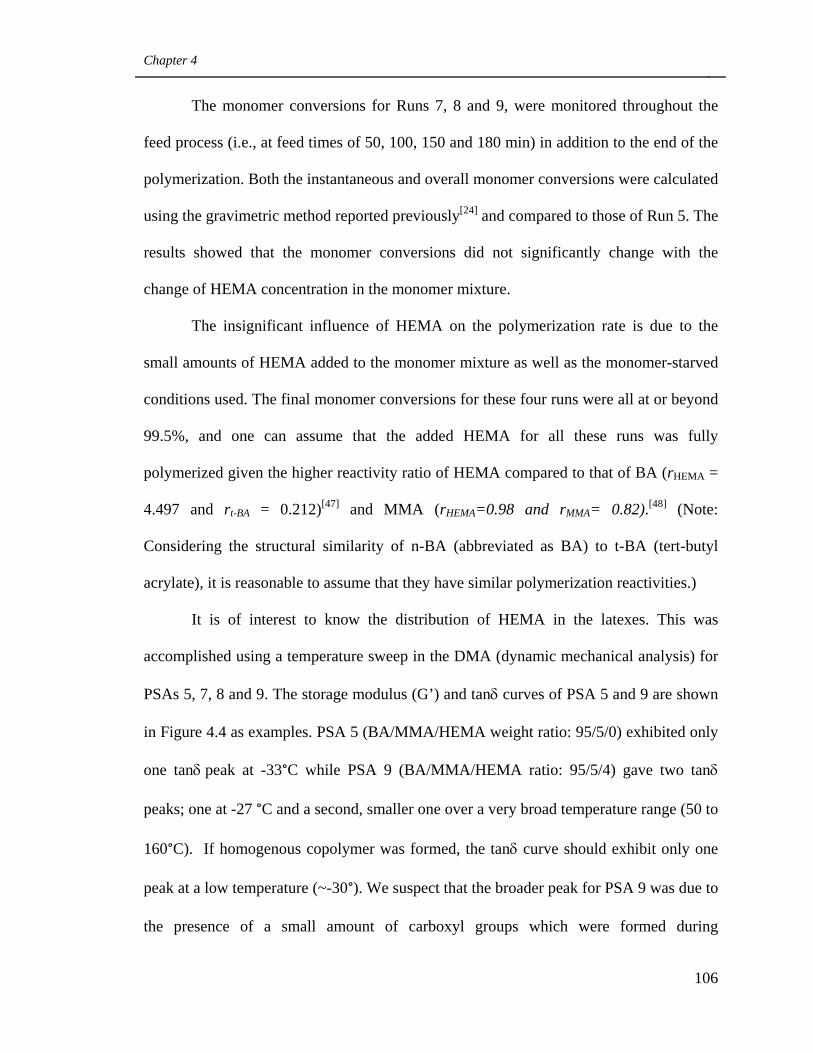
Chapter 4
106
The monomer conversions for Runs 7, 8 and 9, were monitored throughout the
feed process (i.e., at feed times of 50, 100, 150 and 180 min) in addition to the end of the
polymerization. Both the instantaneous and overall monomer conversions were calculated
using the gravimetric method reported previously[24] and compared to those of Run 5. The
results showed that the monomer conversions did not significantly change with the
change of HEMA concentration in the monomer mixture.
The insignificant influence of HEMA on the polymerization rate is due to the
small amounts of HEMA added to the monomer mixture as well as the monomer-starved
conditions used. The final monomer conversions for these four runs were all at or beyond
99.5%, and one can assume that the added HEMA for all these runs was fully
polymerized given the higher reactivity ratio of HEMA compared to that of BA (rHEMA =
4.497 and rt-BA = 0.212)[47] and MMA (rHEMA=0.98 and rMMA= 0.82).[48] (Note:
Considering the structural similarity of n-BA (abbreviated as BA) to t-BA (tert-butyl
acrylate), it is reasonable to assume that they have similar polymerization reactivities.)
It is of interest to know the distribution of HEMA in the latexes. This was
accomplished using a temperature sweep in the DMA (dynamic mechanical analysis) for
PSAs 5, 7, 8 and 9. The storage modulus (G’) and tanδ curves of PSA 5 and 9 are shown
in Figure 4.4 as examples. PSA 5 (BA/MMA/HEMA weight ratio: 95/5/0) exhibited only
one tanδ peak at -33°C while PSA 9 (BA/MMA/HEMA ratio: 95/5/4) gave two tanδ
peaks; one at -27 °C and a second, smaller one over a very broad temperature range (50 to
160°C). If homogenous copolymer was formed, the tanδ curve should exhibit only one
peak at a low temperature (~-30°). We suspect that the broader peak for PSA 9 was due to
the presence of a small amount of carboxyl groups which were formed during
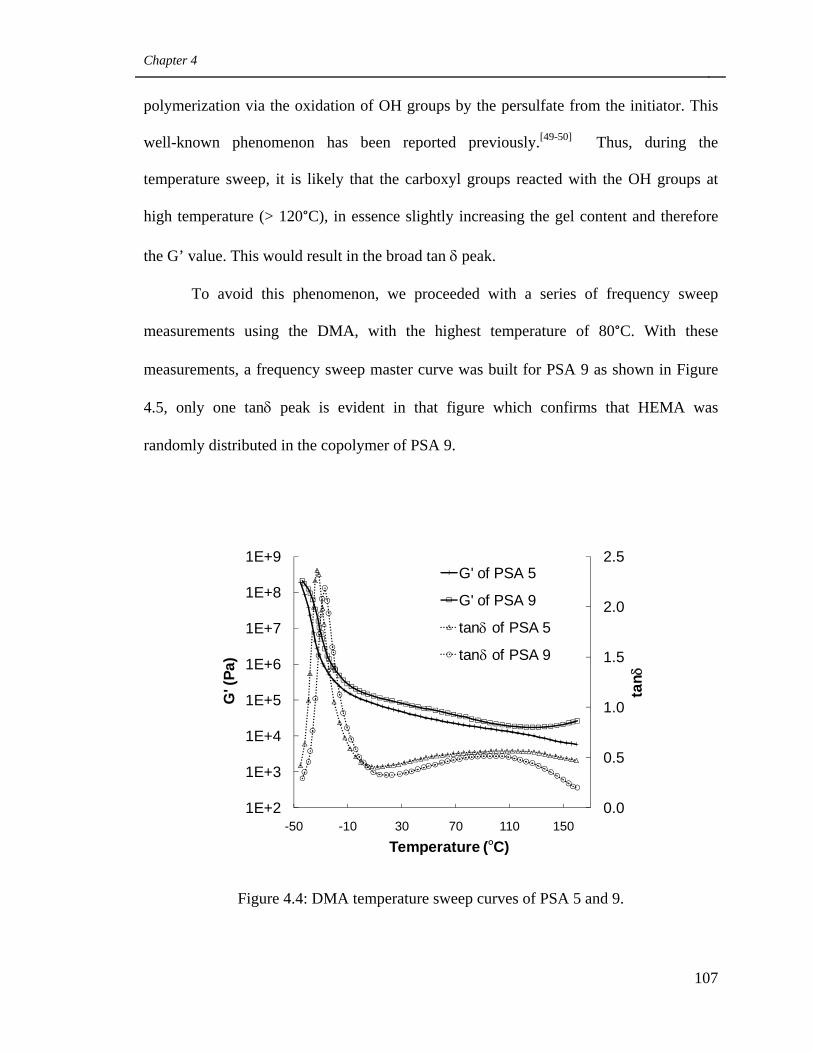
Chapter 4
107
polymerization via the oxidation of OH groups by the persulfate from the initiator. This
well-known phenomenon has been reported previously.[49-50] Thus, during the
temperature sweep, it is likely that the carboxyl groups reacted with the OH groups at
high temperature (> 120°C), in essence slightly increasing the gel content and therefore
the G’ value. This would result in the broad tan δ peak.
To avoid this phenomenon, we proceeded with a series of frequency sweep
measurements using the DMA, with the highest temperature of 80°C. With these
measurements, a frequency sweep master curve was built for PSA 9 as shown in Figure
4.5, only one tanδ peak is evident in that figure which confirms that HEMA was
randomly distributed in the copolymer of PSA 9.
Figure 4.4: DMA temperature sweep curves of PSA 5 and 9.
0.0
0.5
1.0
1.5
2.0
2.5
1E+2
1E+3
1E+4
1E+5
1E+6
1E+7
1E+8
1E+9
-50 -10 30 70 110 150
tanδ
G' (
Pa)
Temperature (OC)
G' of PSA 5
G' of PSA 9
tan of PSA 5
tan of PSA 9δ
δ
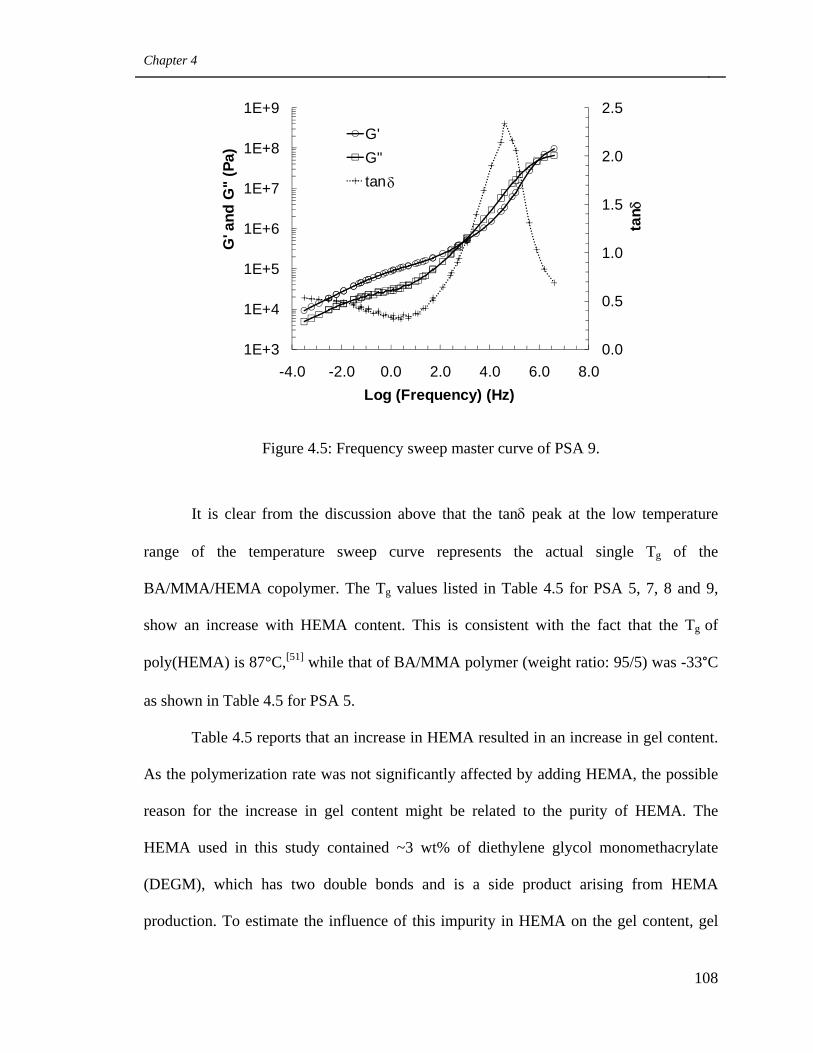
Chapter 4
108
Figure 4.5: Frequency sweep master curve of PSA 9.
It is clear from the discussion above that the tanδ peak at the low temperature
range of the temperature sweep curve represents the actual single Tg of the
BA/MMA/HEMA copolymer. The Tg values listed in Table 4.5 for PSA 5, 7, 8 and 9,
show an increase with HEMA content. This is consistent with the fact that the Tg of
poly(HEMA) is 87°C,[51] while that of BA/MMA polymer (weight ratio: 95/5) was -33°C
as shown in Table 4.5 for PSA 5.
Table 4.5 reports that an increase in HEMA resulted in an increase in gel content.
As the polymerization rate was not significantly affected by adding HEMA, the possible
reason for the increase in gel content might be related to the purity of HEMA. The
HEMA used in this study contained ~3 wt% of diethylene glycol monomethacrylate
(DEGM), which has two double bonds and is a side product arising from HEMA
production. To estimate the influence of this impurity in HEMA on the gel content, gel
0.0
0.5
1.0
1.5
2.0
2.5
1E+3
1E+4
1E+5
1E+6
1E+7
1E+8
1E+9
-4.0 -2.0 0.0 2.0 4.0 6.0 8.0
tanδ
G' a
nd G
" (P
a)
Log (Frequency) (Hz)
G'G"tan δ
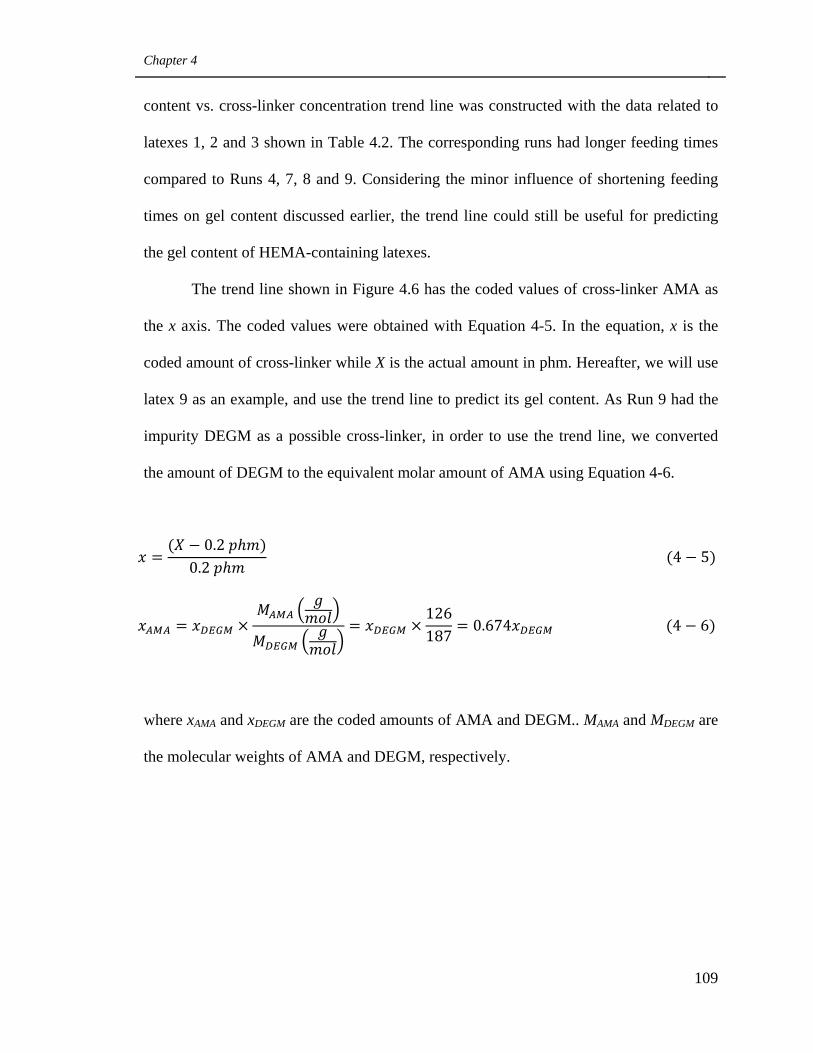
Chapter 4
109
content vs. cross-linker concentration trend line was constructed with the data related to
latexes 1, 2 and 3 shown in Table 4.2. The corresponding runs had longer feeding times
compared to Runs 4, 7, 8 and 9. Considering the minor influence of shortening feeding
times on gel content discussed earlier, the trend line could still be useful for predicting
the gel content of HEMA-containing latexes.
The trend line shown in Figure 4.6 has the coded values of cross-linker AMA as
the x axis. The coded values were obtained with Equation 4-5. In the equation, x is the
coded amount of cross-linker while X is the actual amount in phm. Hereafter, we will use
latex 9 as an example, and use the trend line to predict its gel content. As Run 9 had the
impurity DEGM as a possible cross-linker, in order to use the trend line, we converted
the amount of DEGM to the equivalent molar amount of AMA using Equation 4-6.
0.2 0.2 4 5
126187 0.674 4 6
where xAMA and xDEGM are the coded amounts of AMA and DEGM.. MAMA and MDEGM are
the molecular weights of AMA and DEGM, respectively.
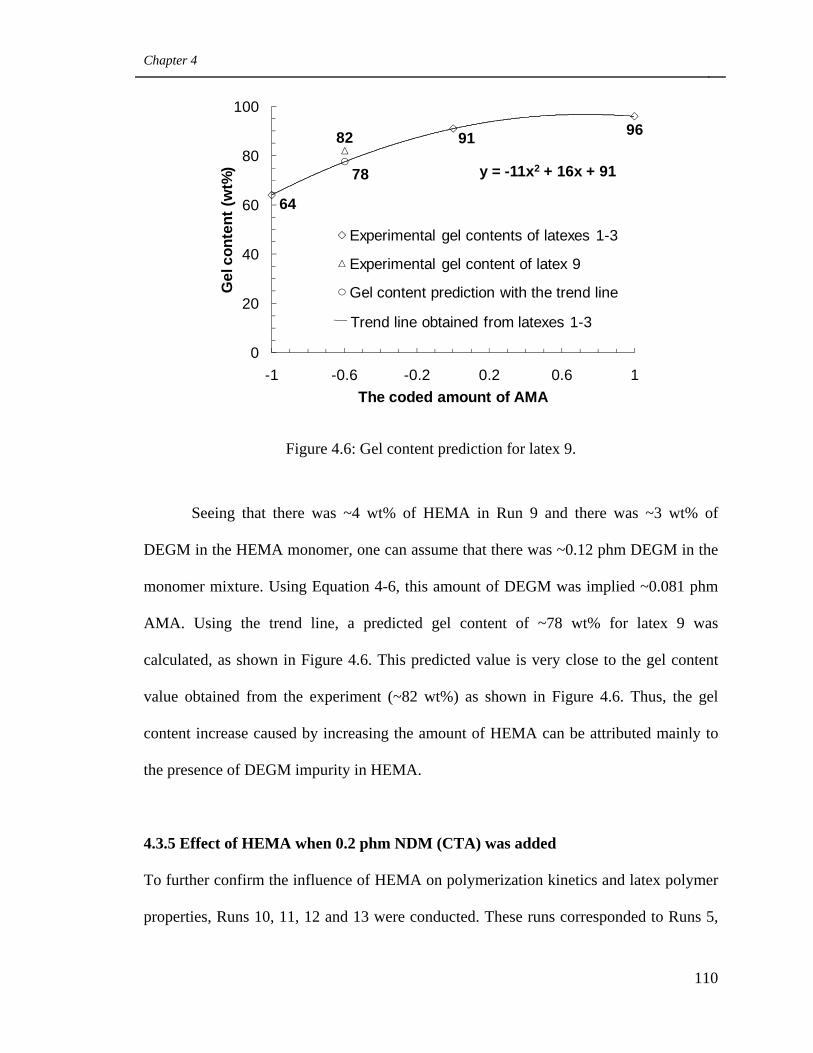
Chapter 4
110
Figure 4.6: Gel content prediction for latex 9.
Seeing that there was ~4 wt% of HEMA in Run 9 and there was ~3 wt% of
DEGM in the HEMA monomer, one can assume that there was ~0.12 phm DEGM in the
monomer mixture. Using Equation 4-6, this amount of DEGM was implied ~0.081 phm
AMA. Using the trend line, a predicted gel content of ~78 wt% for latex 9 was
calculated, as shown in Figure 4.6. This predicted value is very close to the gel content
value obtained from the experiment (~82 wt%) as shown in Figure 4.6. Thus, the gel
content increase caused by increasing the amount of HEMA can be attributed mainly to
the presence of DEGM impurity in HEMA.
4.3.5 Effect of HEMA when 0.2 phm NDM (CTA) was added
To further confirm the influence of HEMA on polymerization kinetics and latex polymer
properties, Runs 10, 11, 12 and 13 were conducted. These runs corresponded to Runs 5,
64
91 9682
78 y = -11x2 + 16x + 91
0
20
40
60
80
100
-1 -0.6 -0.2 0.2 0.6 1
Gel
con
tent
(wt%
)
The coded amount of AMA
Experimental gel contents of latexes 1-3
Experimental gel content of latex 9
Gel content prediction with the trend line
Trend line obtained from latexes 1-3
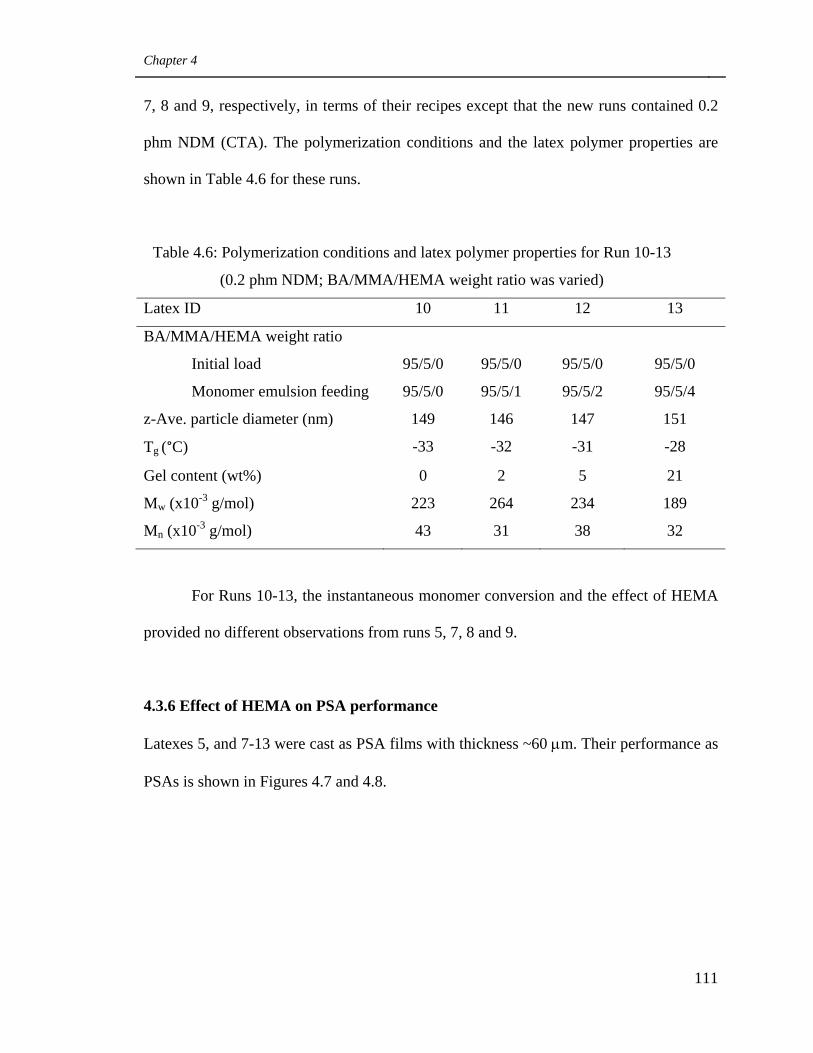
Chapter 4
111
7, 8 and 9, respectively, in terms of their recipes except that the new runs contained 0.2
phm NDM (CTA). The polymerization conditions and the latex polymer properties are
shown in Table 4.6 for these runs.
Table 4.6: Polymerization conditions and latex polymer properties for Run 10-13
(0.2 phm NDM; BA/MMA/HEMA weight ratio was varied)
Latex ID 10 11 12 13
BA/MMA/HEMA weight ratio
Initial load 95/5/0 95/5/0 95/5/0 95/5/0
Monomer emulsion feeding 95/5/0 95/5/1 95/5/2 95/5/4
z-Ave. particle diameter (nm) 149 146 147 151
Tg (°C) -33 -32 -31 -28
Gel content (wt%) 0 2 5 21
Mw (x10-3 g/mol) 223 264 234 189
Mn (x10-3 g/mol) 43 31 38 32
For Runs 10-13, the instantaneous monomer conversion and the effect of HEMA
provided no different observations from runs 5, 7, 8 and 9.
4.3.6 Effect of HEMA on PSA performance
Latexes 5, and 7-13 were cast as PSA films with thickness ~60 μm. Their performance as
PSAs is shown in Figures 4.7 and 4.8.
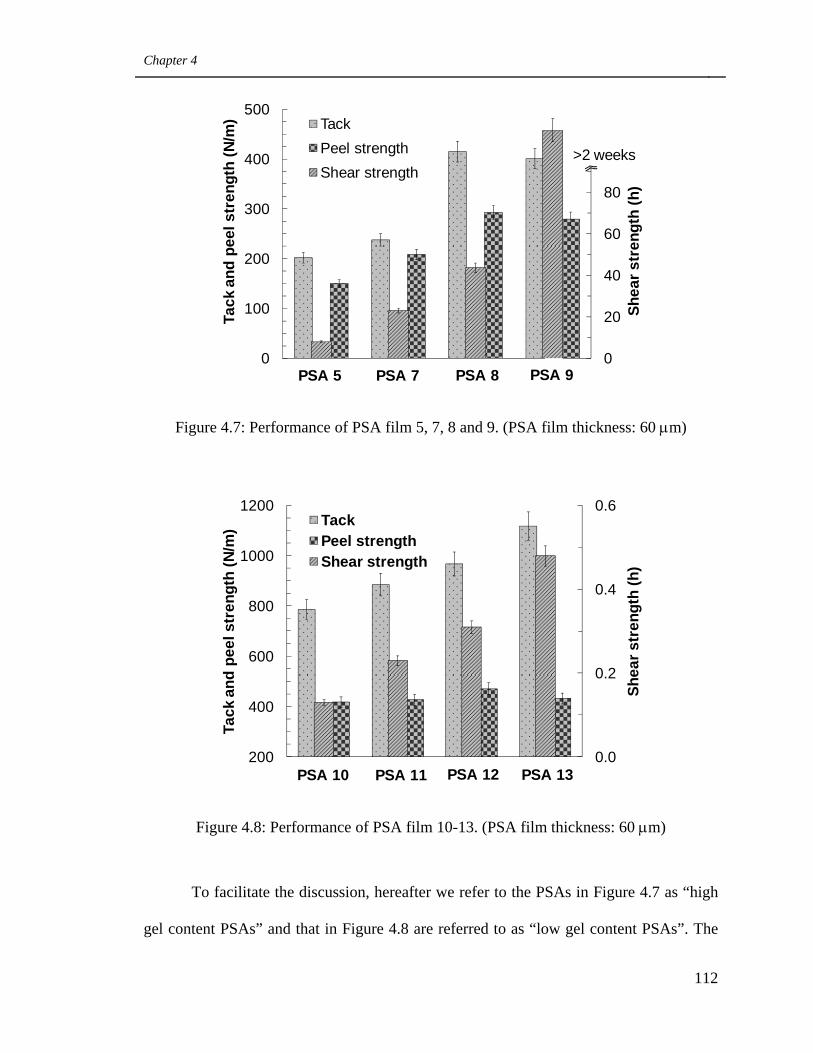
Chapter 4
112
Figure 4.7: Performance of PSA film 5, 7, 8 and 9. (PSA film thickness: 60 μm)
Figure 4.8: Performance of PSA film 10-13. (PSA film thickness: 60 μm)
To facilitate the discussion, hereafter we refer to the PSAs in Figure 4.7 as “high
gel content PSAs” and that in Figure 4.8 are referred to as “low gel content PSAs”. The
0
20
40
60
80
100
120
0
100
200
300
400
500
1 2 3 4
Shea
r str
engt
h (h
)
Tack
and
pee
l str
engt
h (N
/m) Tack
Peel strengthShear strength
PSA 5 PSA 7 PSA 8 PSA 9
>2 weeks
0.0
0.2
0.4
0.6
200
400
600
800
1000
1200
1 2 3 4
Shea
r str
engt
h (h
)
Tack
and
pee
l str
engt
h (N
/m) Tack
Peel strengthShear strength
PSA 10 PSA 11 PSA 12 PSA 13
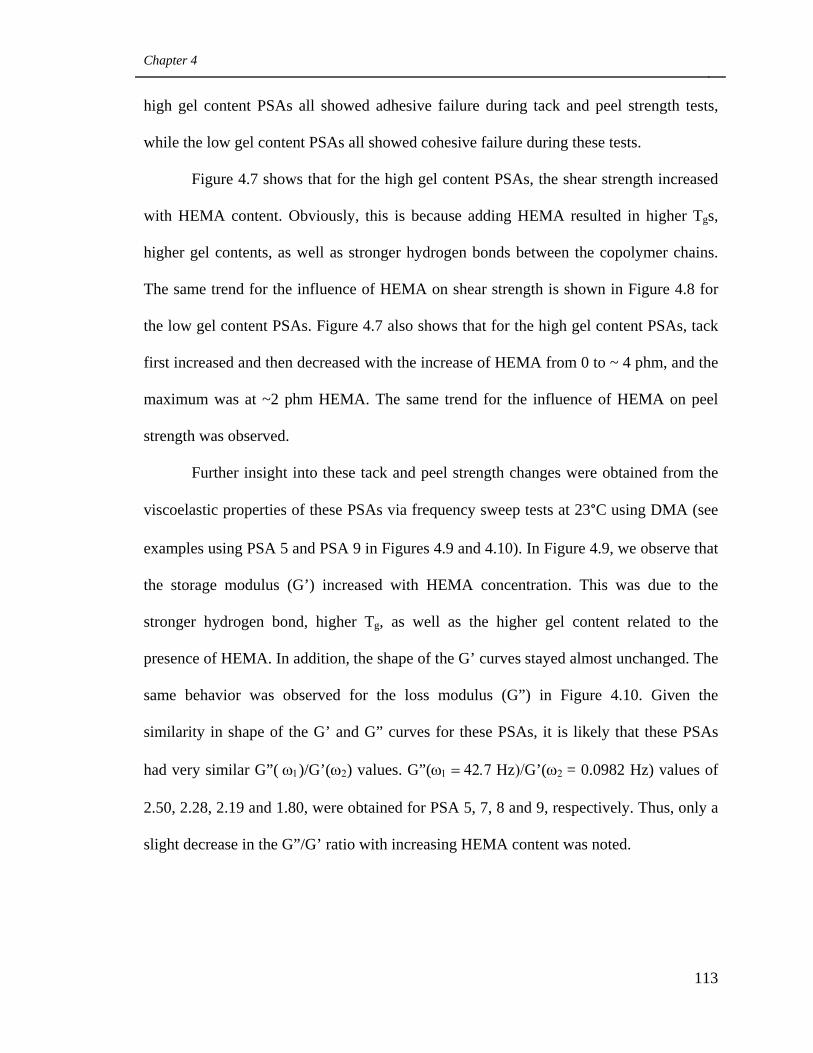
Chapter 4
113
high gel content PSAs all showed adhesive failure during tack and peel strength tests,
while the low gel content PSAs all showed cohesive failure during these tests.
Figure 4.7 shows that for the high gel content PSAs, the shear strength increased
with HEMA content. Obviously, this is because adding HEMA resulted in higher Tgs,
higher gel contents, as well as stronger hydrogen bonds between the copolymer chains.
The same trend for the influence of HEMA on shear strength is shown in Figure 4.8 for
the low gel content PSAs. Figure 4.7 also shows that for the high gel content PSAs, tack
first increased and then decreased with the increase of HEMA from 0 to ~ 4 phm, and the
maximum was at ~2 phm HEMA. The same trend for the influence of HEMA on peel
strength was observed.
Further insight into these tack and peel strength changes were obtained from the
viscoelastic properties of these PSAs via frequency sweep tests at 23°C using DMA (see
examples using PSA 5 and PSA 9 in Figures 4.9 and 4.10). In Figure 4.9, we observe that
the storage modulus (G’) increased with HEMA concentration. This was due to the
stronger hydrogen bond, higher Tg, as well as the higher gel content related to the
presence of HEMA. In addition, the shape of the G’ curves stayed almost unchanged. The
same behavior was observed for the loss modulus (G”) in Figure 4.10. Given the
similarity in shape of the G’ and G” curves for these PSAs, it is likely that these PSAs
had very similar G”( ω1)/G’(ω2) values. G”(ω1 = 42.7 Hz)/G’(ω2 = 0.0982 Hz) values of
2.50, 2.28, 2.19 and 1.80, were obtained for PSA 5, 7, 8 and 9, respectively. Thus, only a
slight decrease in the G”/G’ ratio with increasing HEMA content was noted.
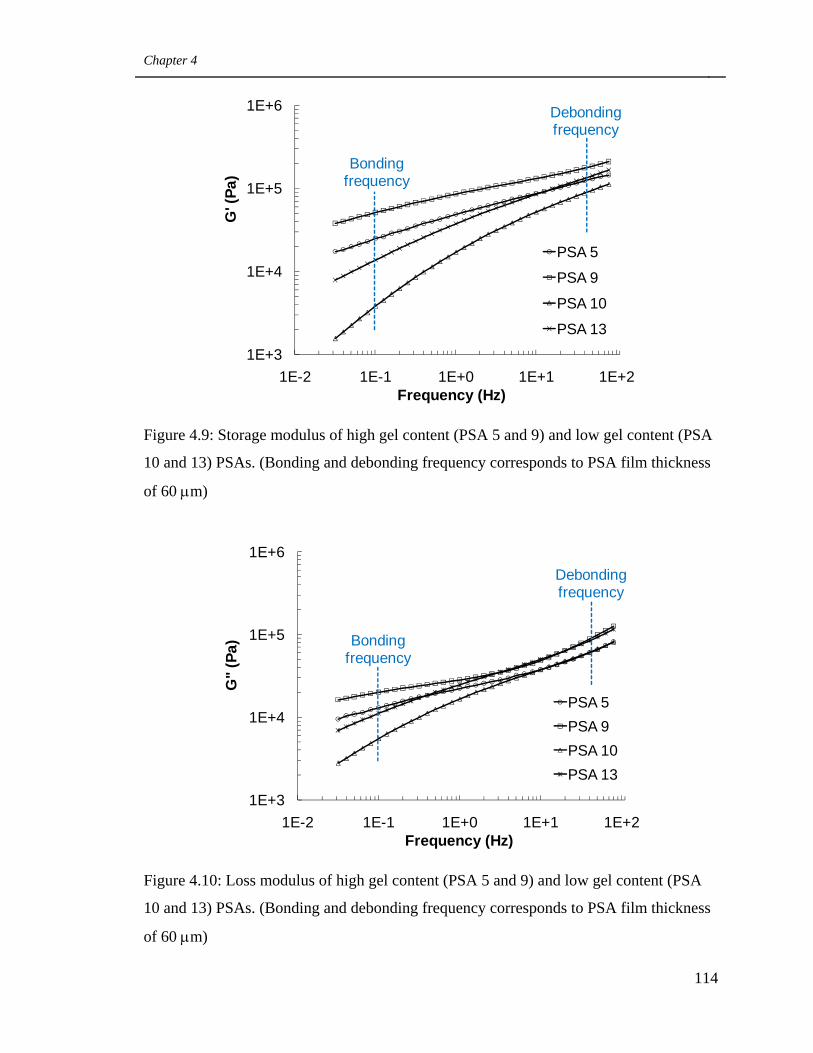
Chapter 4
114
Figure 4.9: Storage modulus of high gel content (PSA 5 and 9) and low gel content (PSA
10 and 13) PSAs. (Bonding and debonding frequency corresponds to PSA film thickness
of 60 μm)
Figure 4.10: Loss modulus of high gel content (PSA 5 and 9) and low gel content (PSA
10 and 13) PSAs. (Bonding and debonding frequency corresponds to PSA film thickness
of 60 μm)
1E+3
1E+4
1E+5
1E+6
1E-2 1E-1 1E+0 1E+1 1E+2
G' (
Pa)
Frequency (Hz)
PSA 5
PSA 9
PSA 10
PSA 13
Bondingfrequency
Debonding frequency
1E+3
1E+4
1E+5
1E+6
1E-2 1E-1 1E+0 1E+1 1E+2
G"
(Pa)
Frequency (Hz)
PSA 5PSA 9PSA 10PSA 13
Bonding frequency
Debonding frequency
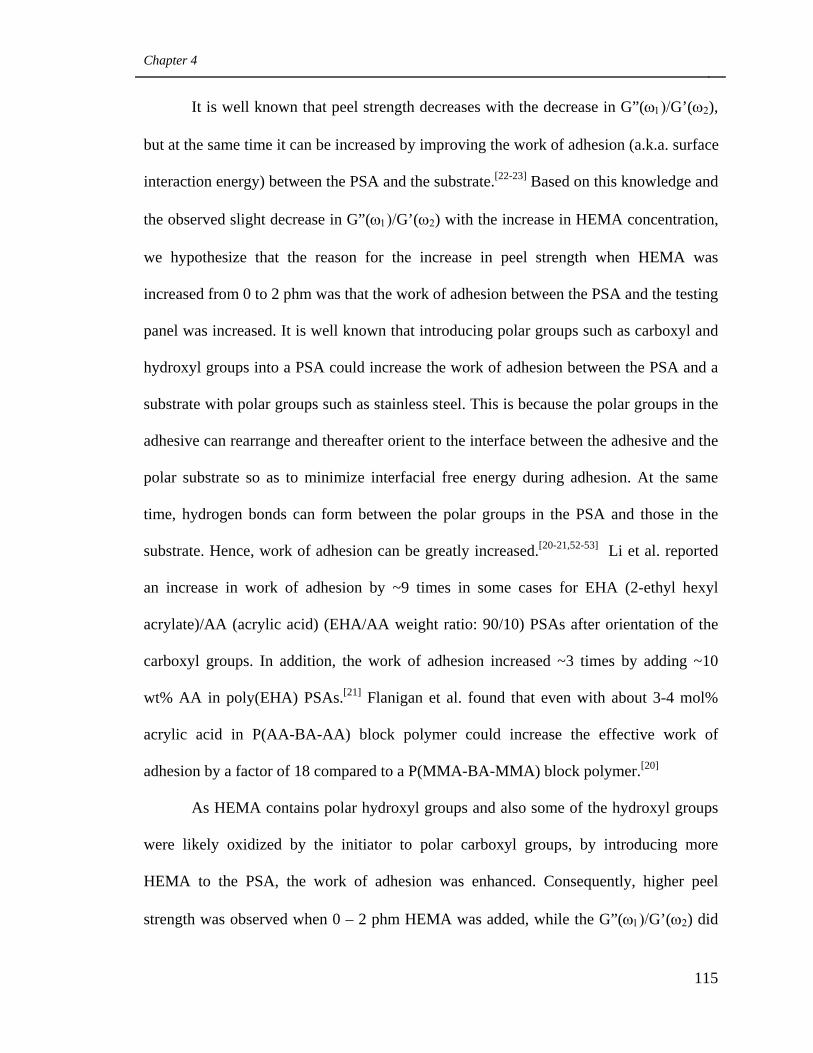
Chapter 4
115
It is well known that peel strength decreases with the decrease in G”(ω1)/G’(ω2),
but at the same time it can be increased by improving the work of adhesion (a.k.a. surface
interaction energy) between the PSA and the substrate.[22-23] Based on this knowledge and
the observed slight decrease in G”(ω1)/G’(ω2) with the increase in HEMA concentration,
we hypothesize that the reason for the increase in peel strength when HEMA was
increased from 0 to 2 phm was that the work of adhesion between the PSA and the testing
panel was increased. It is well known that introducing polar groups such as carboxyl and
hydroxyl groups into a PSA could increase the work of adhesion between the PSA and a
substrate with polar groups such as stainless steel. This is because the polar groups in the
adhesive can rearrange and thereafter orient to the interface between the adhesive and the
polar substrate so as to minimize interfacial free energy during adhesion. At the same
time, hydrogen bonds can form between the polar groups in the PSA and those in the
substrate. Hence, work of adhesion can be greatly increased.[20-21,52-53] Li et al. reported
an increase in work of adhesion by ~9 times in some cases for EHA (2-ethyl hexyl
acrylate)/AA (acrylic acid) (EHA/AA weight ratio: 90/10) PSAs after orientation of the
carboxyl groups. In addition, the work of adhesion increased ~3 times by adding ~10
wt% AA in poly(EHA) PSAs.[21] Flanigan et al. found that even with about 3-4 mol%
acrylic acid in P(AA-BA-AA) block polymer could increase the effective work of
adhesion by a factor of 18 compared to a P(MMA-BA-MMA) block polymer.[20]
As HEMA contains polar hydroxyl groups and also some of the hydroxyl groups
were likely oxidized by the initiator to polar carboxyl groups, by introducing more
HEMA to the PSA, the work of adhesion was enhanced. Consequently, higher peel
strength was observed when 0 – 2 phm HEMA was added, while the G”(ω1)/G’(ω2) did
Chapter 4
116
not change much. As for the more or less constant peel strength when HEMA was
increased from about 2 phm to about 4 phm, the reason might be that the positive effect
on the peel strength caused by improving the work of adhesion could no longer
counterbalance the negative effect caused by the decrease in G”(ω1)/G’(ω2). Taking into
account that the change in tack with the increase of HEMA is very similar to that in peel
strength as mentioned earlier, it is reasonable to hypothesize that the above explanation
for the change in peel strength should also apply to the change in tack.
Figure 4.8 shows that for the low gel content BA/MMA/HEMA PSAs, tack
increased with HEMA concentration; however, the peel strength remained more or less
constant. This trend differs from what was observed for the high gel content PSAs. We
therefore referred to the viscoelastic properties for these low gel content
BA/MMA/HEMA PSAs via frequency sweeps at 23°C using DMA. The G’ and G”
curves of PSAs 10 and 13 are shown in Figures 4.9 and 4.10 as examples. It was found
that the change in G’ curves with the increase in HEMA content for the low gel content
PSAs was very different from that for the high gel content PSAs. These low gel content
PSAs showed a much steeper increase in G’ in the lower frequency range (near or below
the bonding frequency) than in the higher frequency range (near or above the debonding
frequency), with the increase in HEMA content (see, for example, Table 4.7).
Consequently, the shape of the G’ curves of these low gel content PSAs were no longer
similar. The same changes in the G” curves for the low gel content PSAs were observed.
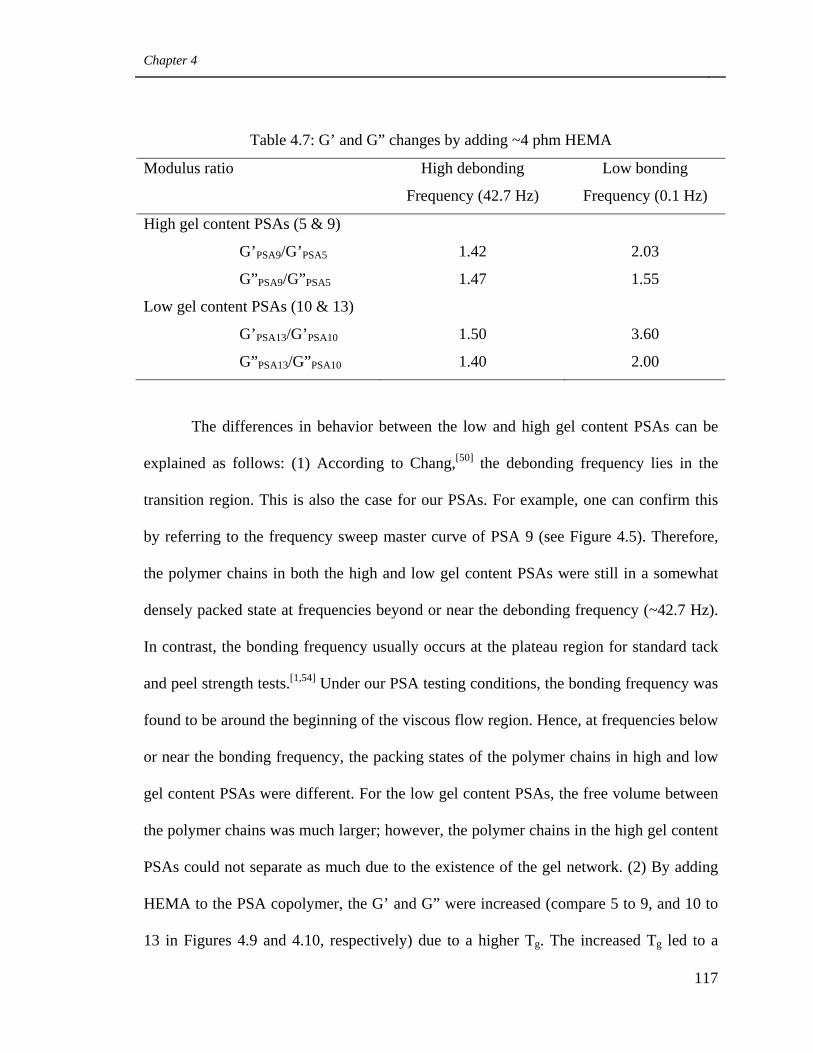
Chapter 4
117
Table 4.7: G’ and G” changes by adding ~4 phm HEMA
Modulus ratio High debonding Low bonding
Frequency (42.7 Hz) Frequency (0.1 Hz)
High gel content PSAs (5 & 9)
G’PSA9/G’PSA5 1.42 2.03
G”PSA9/G”PSA5 1.47 1.55
Low gel content PSAs (10 & 13)
G’PSA13/G’PSA10 1.50 3.60
G”PSA13/G”PSA10 1.40 2.00
The differences in behavior between the low and high gel content PSAs can be
explained as follows: (1) According to Chang,[50] the debonding frequency lies in the
transition region. This is also the case for our PSAs. For example, one can confirm this
by referring to the frequency sweep master curve of PSA 9 (see Figure 4.5). Therefore,
the polymer chains in both the high and low gel content PSAs were still in a somewhat
densely packed state at frequencies beyond or near the debonding frequency (~42.7 Hz).
In contrast, the bonding frequency usually occurs at the plateau region for standard tack
and peel strength tests.[1,54] Under our PSA testing conditions, the bonding frequency was
found to be around the beginning of the viscous flow region. Hence, at frequencies below
or near the bonding frequency, the packing states of the polymer chains in high and low
gel content PSAs were different. For the low gel content PSAs, the free volume between
the polymer chains was much larger; however, the polymer chains in the high gel content
PSAs could not separate as much due to the existence of the gel network. (2) By adding
HEMA to the PSA copolymer, the G’ and G” were increased (compare 5 to 9, and 10 to
13 in Figures 4.9 and 4.10, respectively) due to a higher Tg. The increased Tg led to a
Chapter 4
118
shift of the transition zone to a slightly lower frequency range according to the time-
temperature superposition principle.[1,55] Consequently, at the same debonding frequency,
which lies in the transition zone as mentioned earlier, the PSA with the larger amount of
HEMA showed higher G’ and G” values (compare PSAs 9 to 5 and 13 to 10,
respectively). This was also the case for the frequencies still in the transition zone but
greater than the debonding frequency (see Figures 4.9 and 4.10).
The modulus change by adding HEMA can also be explained by referring to the
packing state of the polymer chains. Adding HEMA might be able to make the PSA
polymer chains stay closer, due to the interaction between the hydroxyl groups and
formation of hydrogen bonds. In addition, the effect of adding HEMA should be more
significant for the loosely packed state of polymer chains than the densely packed, as in
the latter, the polymer chains are already very close to each other. Since the polymer
chains of the high gel content PSAs were in a somewhat densely packed state at both the
high and low frequency ranges due to the existence of gel, the contribution of HEMA to
polymer chain packing should be similar in both ranges. Consequently, nearly parallel
modulus curves were obtained for these PSAs (e.g., PSA 5 and 9 in Figures 4.9 and 4.10).
As for the low gel content PSAs, the contribution of HEMA to chain packing should be
significantly larger in the low frequency range considering the loosely packed state of the
polymer chains at lower frequencies and the somewhat densely packed state at higher
frequencies. As a result, the modulus difference was significantly larger in the low
frequency range, and therefore the modulus curves did not remain parallel (e.g., PSA 10
and 13 as shown in Figures 4.9 and 4.10). The influence of the polymer chain packing
state on the modulus can be further confirmed as follows: From Figures 4.9 and 4.10, one
Chapter 4
119
can see that at the high frequency range, the modulus of PSA 5 (BA/MMA/HEMA
weight ratio: 95/5/0; gel content: ~60 wt.%; Tg: -33°C) was smaller than that of PSA 13
(BA/MMA/HEMA: 95/5/4; gel content: ~20%; Tg: -28°C ). This was because at the high
frequency range, the polymer chains of both PSAs were in a somewhat densely packed
state, so the influence of gel content on polymer chain packing was not significant.
Instead, HEMA played a bigger role on affecting the modulus, since it increased the Tg.
In contrast, we can see that in the low frequency range, the modulus of PSA 5 was higher
than that of PSA 13. This was because in this frequency range, the polymer chains in
PSA 13 were much more loosely packed compared to those in PSA 5 due to its
significantly lower gel content. In this case, gel content had a much more significant
influence on the modulus than the Tg, which is related to the HEMA content. For the low
gel content PSAs, the significant difference in shape of the modulus curves between the
PSAs result in very different G” (ω1 = 42.7 Hz)/G’ (ω2 = 0.0982 Hz) ratios: 16.70, 11.52,
6.42 and 5.80, respectively, for PSA 10, 11, 12 and 13. A significant decrease in the
ratios with increasing HEMA content is evident.
As the frequency sweep tests were carried out with a strain of about 1%, the
obtained viscoelastic properties represent the linear region of the PSA deformation.
However, as the low gel content PSAs all showed cohesive failure during the tack and
peel strength tests, the tack and peel strength of these PSAs should definitely be
correlated with the viscoelastic properties from the non-linear region, where large strains
were involved. It is known that the viscoelastic properties measured in these two regions
are different. In addition, these PSAs might have experienced very different strains
during the tack and peel tests. However, since we did not have the actual strain exhibited
Chapter 4
120
by the PSAs during the tack and peel strength tests, we did not carry out frequency tests
for the non-linear region. In any case, results from the linear region allow us to conclude
that decreases in the G”(ω1)/G’(ω2) ratio with increasing HEMA content were much
larger for the low gel content PSAs compared to their high gel counterparts. Therefore,
the expected increase in peel strength caused by the increased work of adhesion between
the PSA and the testing panel due to the additional amounts of HEMA were roughly
balanced by the negative effect on peel strength caused by the decrease in G”(ω1)/G’(ω2).
Thus, the peel strengths of these low gel content PSAs were similar.
The increase in tack with HEMA content for the low gel content PSAs might be
due to the improved work of adhesion caused by the presence of HEMA. The slight
decrease in tack (at ~4 phm HEMA) observed for the high gel content PSAs was not
evident in this case due to the much better deformability of the low gel content PSAs
compared with those of the high gel content ones. In addition, by comparing Figures 4.8
and 4.1, we can see that for both the low gel content BA/MMA/HEMA PSAs (PSA 10,
11, 12 and 13) and the PSAs with various BA/MMA weight ratios (PSA 3, 4 and 5), the
increase in tack was more significant than that in the peel strength. This phenomenon was
explained earlier for PSAs 3, 4, and 5. The same explanation should be applied here for
the low gel content BA/MMA/HEMA PSAs. However, in this case, better bonding
between the PSA and the testing panel was caused by introducing polar hydroxyl and
carboxyl groups in the PSAs; while in the former case it was due to better deformation
and flow ability of the PSA.
Chapter 4
121
4.3.7 Effect of HEMA on latex viscosity and emulsifier migration during PSA film
formation
While filtering the latexes, it was observed that it took a much longer time to filter latexes
containing more HEMA. This implies that the viscosity of the latex increased with
HEMA content. The reason might be that at high solid contents such as 47%, the latex
particles with average particle diameter around 150 nm are densely packed,[56] so that the
polar hydroxyl groups on the particle surface can interact with each other, and therefore
increase viscosity.
It is well known that ionic emulsifier (e.g., SDS) can migrate from the bulk latex
to the surface during the PSA film drying process.[57] Therefore, increasing viscosity by
adding HEMA might decrease the emulsifier migration. Considering the negative
influence of emulsifier on the work of adhesion, and accordingly, on tack and peel
strength,[58] the PSA performance might also be improved by adding HEMA.
4.3.8 Effect of addition of AA and HEMA plus reduction of emulsifier concentration
We have noted above that the addition of HEMA led to a simultaneous increase in tack,
peel strength and shear strength for high gel content PSAs. This was due to
improvements to the PSAs’ surface properties and increases in their cohesive strength. To
confirm this idea, and also to produce PSAs with even better performance, we
manipulated the PSA bulk and surface properties by adding both AA and HEMA in the
monomer mixture and at the same time, greatly decreasing the emulsifier concentration.
The experiment, run 14, was identical to run 5 except for the monomer emulsion
feed composition of BA/AA/HEMA (weight ratio: 96/2/2), SDS (4.25 g) and NDM (0.05
Chapter 4
122
phm) (see Table 4.1 and 4.3) concentrations. The addition of NDM was done to produce
a latex with a similar gel content to that of latex 5, in anticipation of the influence of
adding AA[24] and HEMA (as discussed earlier) to the BA/MMA monomer mixture.
Table 4.3 shows that latex 14 had a similar Tg (-45°C), slightly lower gel content (51
wt%), and higher Mw (443 kg/mol), compared to those of latex 5 (-44°C, 63 wt%, and
315 kg/mol, respectively).
The adhesive performance of PSA 14 was compared to PSA 5; both films were
cast with a film thickness of ~33 μm. The tack, peel strength and shear strength of PSA
14 were all significantly larger than those of PSA 5 (see Table 4.3, i.e., 223 vs. 93 N/m
for tack, 216 vs. 60 N/m for peel strength, and 41.8 vs. 22.2 for shear strength). The
increase in peel strength was much bigger (i.e., 3.6 times) than that resulting from the
addition of HEMA alone (see Figure 4.7, i.e. 1.9 times by comparing PSA 8 with PSA5).
(Note: In Figure 4.7, the PSA performance was obtained at a film thickness of 60 μm
instead of 33 μm). Furthermore, PSA 14 showed similar adhesive performance at a
smaller film thickness of 33 μm compared to PSA 8 at a film thickness of 60 μm (i.e.,
216 vs. 293 N/m for peel strength and 41.8 vs. 43.7 h for shear strength).
The PSA performance differences between PSAs 14 and 5 can be explained via
their viscoelastic properties, shown in Figure 4.11. The bonding (ω2) and debonding
(ω1) frequencies were corrected according to Equation 4-2 with a film thickness of 33 μm
instead of 60 μm. The G”(ω1 =78 Hz) for PSA 14 and 5 were 119292 and 80954 Pa,
respectively, the G’(ω2 = 0.179 Hz) for PSA 14 and 5 were 41214 and 29508,
respectively, and the G”(ω1)/ G’(ω2) were 2.89 and 2.74, respectively. The slightly higher
G”(ω1)/ G’(ω2) for PSA 14 was due to its lower gel content. The tack and peel strength
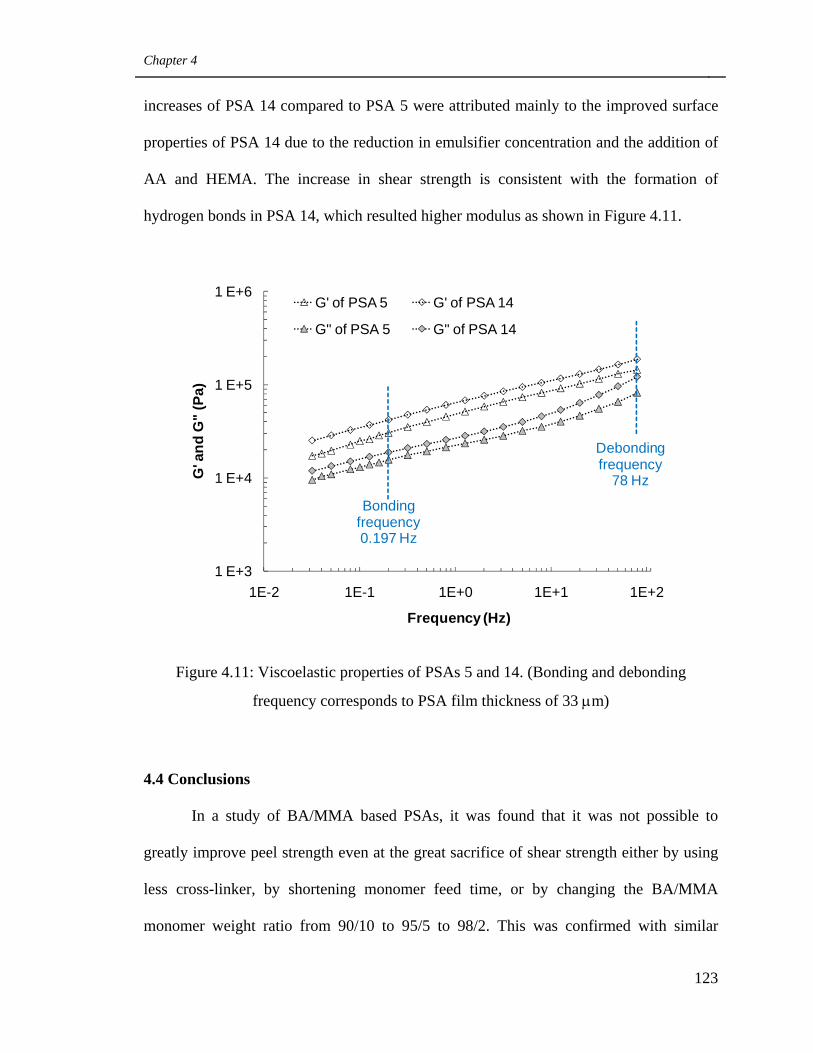
Chapter 4
123
increases of PSA 14 compared to PSA 5 were attributed mainly to the improved surface
properties of PSA 14 due to the reduction in emulsifier concentration and the addition of
AA and HEMA. The increase in shear strength is consistent with the formation of
hydrogen bonds in PSA 14, which resulted higher modulus as shown in Figure 4.11.
Figure 4.11: Viscoelastic properties of PSAs 5 and 14. (Bonding and debonding
frequency corresponds to PSA film thickness of 33 μm)
4.4 Conclusions
In a study of BA/MMA based PSAs, it was found that it was not possible to
greatly improve peel strength even at the great sacrifice of shear strength either by using
less cross-linker, by shortening monomer feed time, or by changing the BA/MMA
monomer weight ratio from 90/10 to 95/5 to 98/2. This was confirmed with similar
1 E+3
1 E+4
1 E+5
1 E+6
1E-2 1E-1 1E+0 1E+1 1E+2
G' a
nd G
" (P
a)
Frequency (Hz)
G' of PSA 5 G' of PSA 14
G" of PSA 5 G" of PSA 14
Bonding frequency 0.197 Hz
Debonding frequency
78 Hz
Chapter 4
124
G”(ω1)/G’(ω2) ratios when the BA content was increased, and the similar G”(ω1)/G’(ω2)
values were likely due to the similar polymer microstructures of these PSAs including gel
content, Mw and possibly Mc, as well as the narrow changes in Tgs.
Adding HEMA to the BA/MMA polymer appeared to be an interesting option.
We found that for high gel content BA/MMA/HEMA PSAs, increases in HEMA content
increased tack and peel strength as well as shear strength, for most cases. The reasons
might be: (1) The G”(ω1)/G’(ω2) ratios did not decrease much with the increase in
HEMA. This was due to the somewhat densely packed state of the PSA polymer chains at
both bonding and debonding frequencies caused by the presence of high amounts of gel.
(2) At the same time, the work of adhesion between the PSAs and the testing panels was
increased by adding HEMA. This work of adhesion increase was due to the presence of
polar hydroxyl and carboxyl groups, which formed via oxidation of the primary hydroxyl
groups of HEMA by the initiator. Furthermore, adding HEMA might also have decreased
the amount of emulsifier on the PSA surface, due to the higher viscosity, and therefore,
the work of adhesion could also have been increased. For low gel content
BA/MMA/HEMA PSAs, the peel strength was not significantly affected by the change in
the amount of HEMA. The reason was that with the increase of HEMA, the
G”(ω1)/G’(ω2) ratio greatly decreased as the PSA polymer chains were much more
loosely packed at the bonding frequency than at the debonding frequency. Therefore, at
the bonding frequency, the influence of HEMA on polymer chain packing and
correspondingly modulus is more significant than at higher frequencies. As a result, the
negative influence of the G”(ω1)/G’(ω2) ratio on peel strength could no longer be
counterbalanced by the positive influence caused by an increase in the work of adhesion.
Chapter 4
125
Improvements to the PSA’s surface properties through the addition of AA and
HEMA (and greatly decreasing the emulsifier concentration) resulted in a PSA with
improved shear strength as well as tack and peel strength. This was even accomplished
using a much lower film thickness (33 vs. 60 μm).
In summary, we can forecast that it is possible to simultaneously increase tack,
peel strength and shear strength for high gel content PSAs, which are very important
commercially. In order to achieve this, we should improve the PSA surface properties
and increase the PSA cohesive strength simultaneously. For example, we can introduce
monomers with polar groups and similar or even higher Tg (compared to that of the
copolymer before adding the polar monomer) in the monomer mixture, and also decrease
the amount of emulsifiers.
4.5 Acknowledgements
We thank the Natural Science and Engineering Research Council (NSERC) of Canada
and Omnova Solutions Inc. for financial support.
4.6 References
1. István B., Pressure-Sensitive Adhesives and Applications 2004, Marcel Dekker
Inc., New York.
2. Jovanovic R, Dubé M. A., Journal of Macromolecular Science. Polymer Review
2004, C44(1): 1-51.
3. Satas D., Handbook of Pressure Sensitive Adhesive Technology 1989, Van
Nostrand Reinhold, New York.
Chapter 4
126
4. Elizalde O., Vicente M., Leiza J. R., Polymer Reaction Engineering 2002, 10(4):
265-283.
5. Elizalde O., Vicente M., Plessis C., Journal of Coating Technology and Research
2004, 1(1): 45-51.
6. Gower M. D., Shanks R. A., Macromolecular Chemistry and Physics 2004,
205(16): 2139-2150.
7. Gower M. D., Shanks R. A., Journal of Applied Polymer Science 2004, 93(6):
2909-2917.
8. Gower M. D., Shanks R. A., Macromolecular Chemistry and Physics 2005,
206(10): 1015-1027.
9. Gower M. D., Shanks R. A., Journal of Polymer Science Part B: Polymer Physics
2006, 44(8): 1237-1252.
10. Jovanovic R., McKenna T. F., Dubé M. A., Macromolecular Materials and
Engineering 2004, 289(5): 467-474.
11. Jovanovic R., Ouzineb K., McKenna T. F., Dubé M. A., Macromolecular Symposia
2004, 206: 43-56.
12. Jovanovic R., Dubé M. A., Industrial and Engineering Chemistry Research 2005,
44(17): 6668-6675.
13. Jovanovic R., Dubé M. A., The Canadian Journal of Chemical Engineering 2007,
85(3): 341-349.
14. Tobing S. D., Klein A., Sperling L. H., Journal of Applied Polymer Science 2001,
81(9): 2109-2117.
Chapter 4
127
15. Tobing S. D., Klein A., Journal of Applied Polymer Science 2001, 79(14): 2558-
2564.
16. Tobing S. D., Klein A., Journal of Applied Polymer Science 2001, 79(12): 2230-
2244.
17. Zosel A., Ley G., Macromolecules 1993, 26(9): 2222-2227.
18. Zosel A., International Journal of Adhesion and Adhesives 1998, 18(4): 265-271.
19. Kajtna J, Golob J., Krajnc M., International Journal of Adhesion and Adhesives
2009, 29(2): 186-194.
20. Flanigan C M., Crosby A. J., Shull K. R., Macromolecules 1999, 32(21): 7251-
7262.
21 Li L. H., Tirrell M., Korba G. A., Journal of Adhesion 2001, 76(4): 307-334.
22. Yang H. W. H., Chang E. P., Trends in Polymer Science 1997, 5(11): 380-384.
23. Zosel A., Colloid and Polymer Science 1985, 263(7): 541-553.
24. Qie L., Dubé M. A., European Polymer Journal 2010, 46(6):1225-1236.
25. Lovell P. A., El-Aasser M. S., Emulsion Polymerization and Emulsion Polymers
1997, John Wiley and Sons, New York.
26. Šebenik U., Golob J., Krajnc M., Polymer International 2003, 52(5):740-748.
27. Šebenik U., Krajnc M., Colloids and Surfaces A: Physicochemical and Engineering
Aspects 2004, 233: 51-62.
28. Sajjadi S., Journal of Applied Polymer Science 2001, 82(10): 2472-2477.
29. Fillatrault T. D., Lewandowski K. M., Anderson K.S., 2008, Patent No.:
US0200587A1
Chapter 4
128
30. Lewandowski K.M., Filiatrault T. D., Anderson K. S., 2010, Patent No.:
US7645827.
31. Yang J., Lu Y., Kropp J., 2000, Patent No.: US006013722A
32. Brandrup J., Immergut E. H., Grulke E. A., Polymer Handbook 1999, John Wiley
and Sons, New York.
33. Sensitive Tape Council, Test Methods for Pressure Sensitive Adhesive Tapes 2004,
Northbrook Illinois.
34. Bouvier-Fontes L., Pirri R., Arzamendi G., Macromolecular Symposia 2004, 206:
149-164.
35. Bouvier-Fontes L., Pirri R., Asua J. A., Macromolecules 2005, 38(4): 1164-1171.
36. Plessis C., Arzamendi G., Leiza J. R., Macromolecules 2000, 33(14): 5041-5047.
37. Plessis C., Arzamendi G., Leiza J. R., Macromolecules 2000, 33(1): 4-7.
38. Farcet C., Belleney J., Charleux B., Macromolecules 2002, 35(13): 4912-4918.
39. Ahmad N. M., Heatley F., Lovell P. A., Macromolecules 1998, 31(9): 2822-2827.
40 Gonzalez I., Asua J. A., Leiza J. R., Polymer 2007, 48(9): 2542-2547.
41. Bouvier-Fontes L., Pirri R., Asua J. M., Journal of Polymer Science Part A:
Polymer Chemistry 2005, 43(20): 4684-4694.
42. Chauvet J., Asua J. A., Leiza J. R., Polymer 2005, 46(23): 9555-9561.
43. Dubé M. A., Penlidis A., Polymer 1995, 36(3): 587-598.
44. Elizalde O., Arzamendi G., Leiza J. R., Industrial and Engineering Chemistry
Research 2004, 43(23): 7401-7409.
45. Tse M. F., Journal of Adhesion Science and Technology 1989, 3(7): 551-570.
46. Pedraza E. P., Soucek M. D., Polymer 2005, 46(24): 11174-11185.
Chapter 4
129
47. He J., Wang Y. F., Lin Q. F., Journal of Macromolecular Science Part A: Pure an
Applied Chemistry 2009, 46(4): 405-411.
48. Hooda S., Goyal A. K., Journal of the Indian Chemical Society 2008, 85(8): 818-
824.
49. Khan A. K., Ray B. C., Maiti J., Pigment and Resin Technology 2009, 38(3): 159-
164.
50. Martin-Rodriguez A., Cabrerizo-Vilchez M. A., Hidalgo-Alvarez R., Colloids an
Surfaces A: Physicochemical and Engineering Aspects 1996, 108(2-3): 263-271.
51. Caykara T., Ozyurek C., Kantoglu M., Polymer Degradation and Stability 2003,
80(2): 339-343.
52. Mahdavi H., Taghizadeh S. M., Iranian Polymer Journal 2005, 14(4): 379-385.
53. Oshibe Y., Ohmura H., Yamamoto T., Journal of Adhesion 1994, 47(1-3): 3-16.
54. Chang E. P., Journal of Adhesion 1997, 60(1-4): 233-248.
55. Ferry J. D., Viscoelastic Properties of Polymers 1980, John Wiley and Sons, New
York.
56. Horsky J., Quadrat O., Porsch B., Colloids an Surfaces A: Physicochemical and
Engineering Aspects 2001, 180(1-2): 75-85.
57. Keddie J. L., Materials Science and Engineering, R 1997, 21(3): 101-170.
58. Zosel A., Schuler B., Journal of Adhesion 1999, 70(1-2): 179-195.
CHAPTER 5
MANIPULATING LATEX POLYMER MICROSTRUCTURE
USING CHAIN TRANSFER AGENT AND CROSS-LINKER
TO MODIFY PSA PERFORMANCE AND
VISCOELASTICITY
________________________________________________
Chapter 5
131
Manipulating Latex Polymer Microstructure using Chain Transfer Agent and
Cross-linker to Modify PSA Performance and Viscoelasticity
Lili Qie and Marc A. Dubé*
Department of Chemical and Biological Engineering,
Centre for Catalysis Research and Innovation,
University of Ottawa, 161 Louis Pasteur Pvt., Ottawa, Ontario, Canada K1N 6N5
Abstract
Two series of butyl acrylate (BA)/acrylic acid (AA)/2-hydroxy ethyl methacrylate
(HEMA) latexes were produced via starved seeded semi-batch emulsion polymerization.
The first series, five latexes with gel contents ranging from 0 to 75 wt%, were generated
by varying the amount of chain transfer agent (CTA, n-dodecyl mercaptan) in the absence
of cross-linker. The second series, two latexes with gel contents of 49 and 74 wt%, were
obtained by manipulating the amount of CTA in the presence of a constant cross-linker
(allyl methacrylate) concentration. Latexes with similar gel contents, one from each
series, were compared with respect to their microstructure, viscoelastic properties and
PSA performance. It was found that at similar gel contents, latexes obtained in the
absence of cross-linker had larger sol polymer molecular weight (Mw) and molecular
weight between cross-linking points (Mc), compared to the latexes generated using both
CTA and cross-linker. The different microstructures of latexes with similar gel contents
resulted in significantly different viscoelastic properties and shear strength of the
pressure-sensitive adhesive (PSA) films cast from the latexes.
Chapter 5
132
5.1 Introduction
Pressure sensitive adhesives (PSAs) are viscoelastic materials. They are permanently
tacky and can stick to a substrate under light, finger pressure. Commercial PSAs can be
produced via hot-melt techniques, solution polymerization and emulsion
polymerization;[1] the latter, being considered more environmental friendly, was used to
produce the PSAs in this study.
The performance of PSAs is typically evaluated by tack, peel strength and shear
strength. Tack reflects the adhesive’s capability to deform and adhere quickly. Peel
strength shows its ability to resist removal by peeling. Shear strength measures its ability
to resist flow under shear forces and is mostly related to the cohesive strength of the
PSA.[2] To achieve desirable performance, commercial PSAs are commonly produced
using at least two monomers. One monomer, such as butyl acrylate (BA) and 2-ethyl
hexyl acrylate (EHA), will yield a polymer with a low glass transition temperature (Tg)
(e.g., <-40°C), and therefore impart good deformability and flow ability to the PSA. In
contrast, the other monomer, such as methyl methacrylate (MMA), methacrylic acid
(MAA), and acrylic acid (AA), will lead to a polymer with a high Tg (e.g., >100°C), and
accordingly endow the PSA with sufficient cohesive strength. In this study, BA/AA/2-
hydroxy ethyl methacrylate (HEMA) was chosen as the monomer mixture as a result of a
previous study.[3] A starved, seeded semi-batch emulsion polymerization approach was
employed in order to ensure homogeneous polymer composition and also constant
polymer properties over the course of the polymerization.[4-6]
Chapter 5
133
PSA performance has been shown to depend on PSAs’ bulk properties (i.e.,
PSAs’ mechanical properties and viscoelastic properties).[3,7-15] PSAs’ bulk properties are
affected by the PSAs’ Tg, composition, morphology and microstructure (e.g., gel content,
molecular weight between cross-linking points (Mc), molecular weight of sol polymers
(Mw) and molecular weight between entanglement points (Me)).[3,9,16-19]
Due to the importance of polymer microstructure, much work has been done to
manipulate it by varying polymerization conditions in a seeded semi-batch emulsion
polymerization process (e.g., polymerization temperature, monomer composition, and
chain transfer agent (CTA), cross-linker and emulsifier concentrations).[5,20-24] The most
effective of these are the CTA and cross-linker concentrations. However, most studies
have reported on the individual effect of using either CTA or cross-linker. It is not
possible to decouple gel content and Mw under these conditions. For example, when
cross-linker is added, high gel content latexes can be produced, and for these latexes, Mw
always decreases with increasing gel content.[5,24] When CTA is used, gel-free to medium
gel content latexes can be obtained. In addition, for these latexes, Mw increases with gel
content.[6,20,24]
There are few reports on the effect of simultaneously using CTA and cross-linker
to manipulate polymer microstructure. Interesting phenomena, different from that
observed while using CTA and cross-linker individually, have been reported.[5,24] For
example, Chauvet et al. found that in the presence of a constant amount of cross-linker,
adding less CTA could yield a latex with a higher gel content together with a higher Mw
over a narrow, high gel content range (i.e., 71 to 88 wt%).[5] In a previous study, we also
simultaneously manipulated CTA and cross-linker concentrations to produce latexes, but
Chapter 5
134
over a broader gel content range (40 - 96 wt%).[24] In addition, we provided estimates of
Mc, which is a main parameter for describing polymer microstructure, besides gel content
and Mw. It was shown, at a constant amount of cross-linker (allyl methacrylate (AMA)),
that an increase in the amount of CTA resulted in a lower gel content and looser gel
network. However, the Mw was shown to first decrease and then increase with decreasing
gel content. Another key finding was that latex with similar gel contents but different Mc
and Mw could be produced by changing the CTA and cross-linker concentrations
simultaneously. Based on the above two studies, one can forecast that latexes with novel
(or unique) microstructures can be produced by using CTA and cross-linker
simultaneously. It is of importance to study these novel microstructures by comparing to
those generated by using either only CTA or cross-linker, since this will provide very
useful information regarding how to improve PSA performance via polymer
microstructure optimization. .
In this study, we report on four important concepts: (1) The influence of CTA and
cross-linker on the polymerization process and latex properties. (2) A comparison of the
microstructures of latexes produced using CTA and cross-linker simultaneously to the
microstructures of latexes produced via varying the amount of CTA in the absence of
cross-linker. To achieve a consistent comparison, the latexes generated from both
techniques should have similar gel contents. This is because microstructure (i.e., Mc and
Mw) also depends on gel content.[24] (3) A study of the viscoelastic properties and
performance of the PSAs produced from both techniques. Many studies did not provide
viscoelastic property measurements for the PSAs, although they are important for
discerning the nature of the PSA microstructure and can give insight into PSA
Chapter 5
135
performance. (4) Our attempts to relate the microstructure, viscoelastic properties and
PSA performance to each other.
5.2 Experimental
5.2.1 Materials Butyl acrylate (BA), acrylic acid (AA), 2-hydroxyl methacrylate
(HEMA), and methyl methacrylate (MMA) monomers, allyl methacrylate (AMA) cross-
linker, 1-dodecanethiol (NDM) chain transfer agent (CTA), sodium dodecyl sulphate
(SDS) surfactant, sodium bicarbonate (NaHCO3) buffer, potassium persulfate (KPS)
initiator and hydroquinone (HQ) inhibitor were all obtained from Sigma Aldrich and
were used as supplied. All the above materials were reagent grade except HEMA, which
had a purity of 97 wt%. Distilled deionized water (DI-H2O) was used throughout the
study. Ammonia (30 wt% in H2O for pH control) was obtained from British Drug House.
All solvents used in the polymer characterization such as tetrahydrofuran (THF, HPLC
grade, EMD Chemicals) and toluene (99.8%, Fisher Scientific), were also used as
supplied by the manufacturer. Nitrogen gas (Linde Canada) was used to purge the
reactor. PTFE porous membranes with pore size of 0.2 μm, for use in gel content
measurements, were purchased from Cole-Parmer Canada.
5.2.2 Polymerization procedure
A seeded semi-batch emulsion polymerization process was adopted to produce all the
latexes in this study. It included three stages: a batch stage to produce seed latexes, a
continuous feeding stage to grow latex particles, and a cook stage to react the remaining
monomers. The polymerization formulation is shown in Table 5.1. The amounts of CTA
Chapter 5
136
and cross-linker were varied as reported in Table 5.2. To start the polymerization, all the
initial charge except for the initiator solution and monomers was added to a one-litre
Mettler-Toledo LabMax™ reactor at room temperature. The reactor vessel was made of
stainless steel, and equipped with an anchor stirring blade as well as several feeding and
sampling ports. The stirring speed was maintained at 250 rpm throughout the
polymerization process. The reactor temperature was then increased to 70°C within 30
min, then the monomer mixture and initiator solution were added. The temperature was
immediately raised to 75˚C within 5 min, and maintained at 75˚C for 10 min for the seed
latex production stage. Next, the monomer emulsion and initiator solution (see Table 5.1)
were fed to the reactor using two separate metering pumps at constant rates and feeding
times of 2.5 and 3 h, respectively. At the completion of the feed stage, the polymerization
was continued for an additional 50 min in order to react the remaining monomers (i.e.,
the cook stage). The latex was then cooled to below 30°C and HQ was added to quench
the polymerization. The latex was then separated into two roughly equal portions. One
portion had its pH adjusted to ~3.0 and the other to ~5.5 with ammonia. The solids
content of the latexes were adjusted to ~45 wt% by adding DI-H2O, in order to modify
the latex viscosity and therefore produce good PSA films.
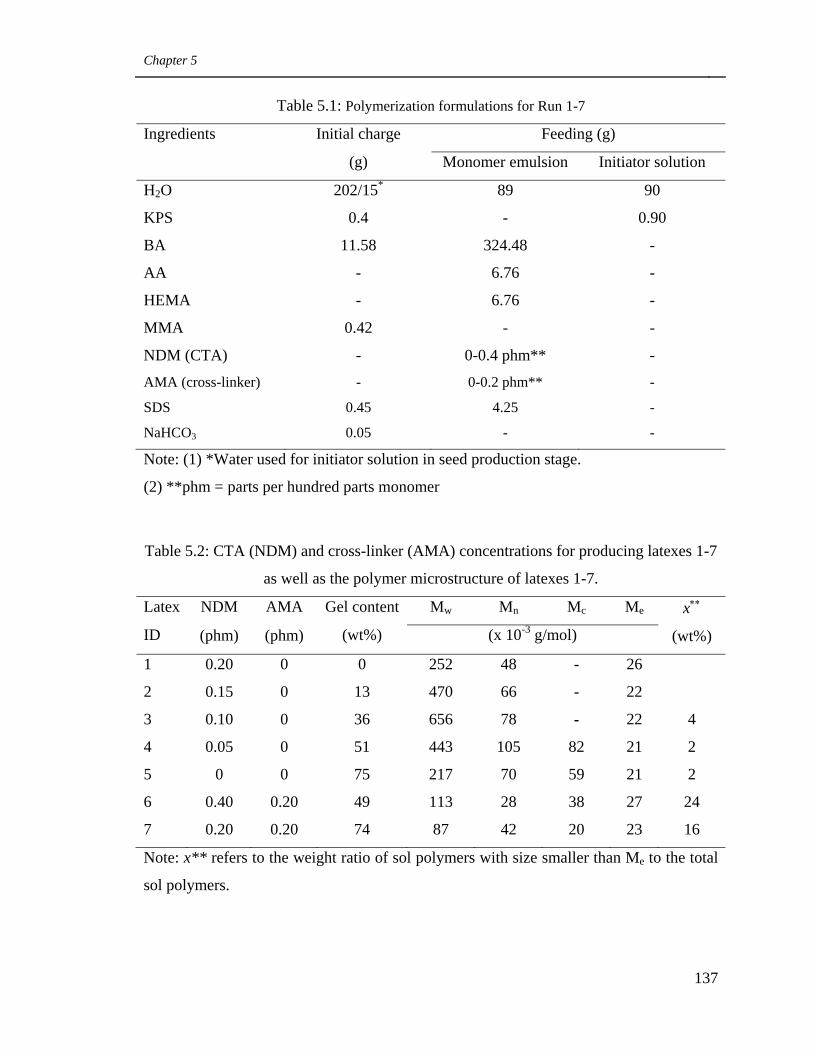
Chapter 5
137
Table 5.1: Polymerization formulations for Run 1-7
Ingredients Initial charge Feeding (g)
(g) Monomer emulsion Initiator solution
H2O 202/15* 89 90
KPS 0.4 - 0.90
BA 11.58 324.48 -
AA - 6.76 -
HEMA - 6.76 -
MMA 0.42 - -
NDM (CTA) - 0-0.4 phm** -
AMA (cross-linker) - 0-0.2 phm** -
SDS 0.45 4.25 -
NaHCO3 0.05 - -
Note: (1) *Water used for initiator solution in seed production stage.
(2) **phm = parts per hundred parts monomer
Table 5.2: CTA (NDM) and cross-linker (AMA) concentrations for producing latexes 1-7
as well as the polymer microstructure of latexes 1-7.
Latex NDM AMA Gel content Mw Mn Mc Me x∗∗
(wt%) ID (phm) (phm) (wt%) (x 10-3 g/mol)
1 0.20 0 0 252 48 - 26
2 0.15 0 13 470 66 - 22
3 0.10 0 36 656 78 - 22 4
4 0.05 0 51 443 105 82 21 2
5 0 0 75 217 70 59 21 2
6 0.40 0.20 49 113 28 38 27 24
7 0.20 0.20 74 87 42 20 23 16
Note: x** refers to the weight ratio of sol polymers with size smaller than Me to the total
sol polymers.
Chapter 5
138
During the polymerization process, samples were taken at feed times of 0, 20, 50,
100, 150, and 180 min, as well as at the end of the polymerization. These samples were
used to monitor particle growth as well as monomer conversion. The final latex was
characterized as discussed below.
5.2.3 Characterization
The polymerization rate during the polymerization process was evaluated by both the
instantaneous and overall monomer conversions, which were measured according to a
standard gravimetric method.[24]
Latex particle size and size distribution (PSD) were measured with a Dynamic
Light Scattering (DLS) instrument (Malvern NanoS Zetasizer). Gel content was tested
with a modification of the membrane method by Tobing and Klein.[24] Mw was measured
using gel permeation chromatography (GPC); the sol polymer was obtained from the
THF solution resulting from the gel content measurement. The GPC calibration curve
was generated from 12 polystyrene standards (EasiCal from Polymer Laboratories; range
= 162 to 6,035,000 g/mol). The Mark-Houwink parameters of the polymers from Run 1
through 7, K and α, for the universal calibration method were chosen as those of the
polyBA, considering the very high BA concentration in the copolymer (96 wt%). The K
and α for polyBA are 1.1 x 10⁻⁴ dL/g and 0.708 respectively.[33]
Mc was tested in accordance with the method reported previously.[24] In the Mc
calculation for polymers from Run 1-7, the polymer density (ρp = 1.06 g/cm3) and
solubility parameter (δ1 = 8.9 (cal/cm3)1/2) of polyBA were used as the latexes were
composed of 96 wt% BA. Me was calculated with a previously reported method (ref. 24)
Chapter 5
139
using the value of monodisperse polyBA, Me = 208 kg/mol, for the calculations. The Tg
was measured with a differential scanning calorimeter (Model Q1000 from TA
Instruments) with a temperature sweep range of -80 to 80°C in order to avoid promoting
reaction between AA and HEMA at elevated temperatures.
PSA performance including loop tack, peel strength and shear strength were
evaluated according to the Pressure Sensitive Tape Council standards PSTC-6, PSTC-1
and PSTC-7, respectively.[25] The PSA film thickness was measured as ~33 μm. Further
details on the measurement methods are reported elsewhere.[24] In addition, shear strength
was also measured using a modified method based on PSTC-7. In this case, the contact
area was changed to ½” x ½”, and the other testing conditions, such as temperature and
shear force, were kept the same.
The PSA viscoelastic properties were characterized using dynamic mechanical
analysis (DMA) with a RDA III rheometer (TA Instruments). The geometry used was a
pair of 25-mm parallel plates, and the sample thickness was 1.8+/-0.2 mm. The PSA
samples were prepared as follows: First, a certain amount of latexes were put in home-
made silicon release paper dishes (3.5 cm x 3.5 cm). Then, the latexes were dried for 4
weeks to obtain PSA films with constant weight as well as a thickness of about 0.6 mm.
Finally, three of these films were pressed together with the DMA plates to form one PSA
sample with a thickness of ~1.8 mm. The frequency sweep tests were performed at 23
and 83°C over a frequency range of about 80 to 0.02 Hz, under a compression mode and
with a strain of 1%. A frequency master curve was built using the time-temperature
superposition method and with the data at 23oC as the reference.
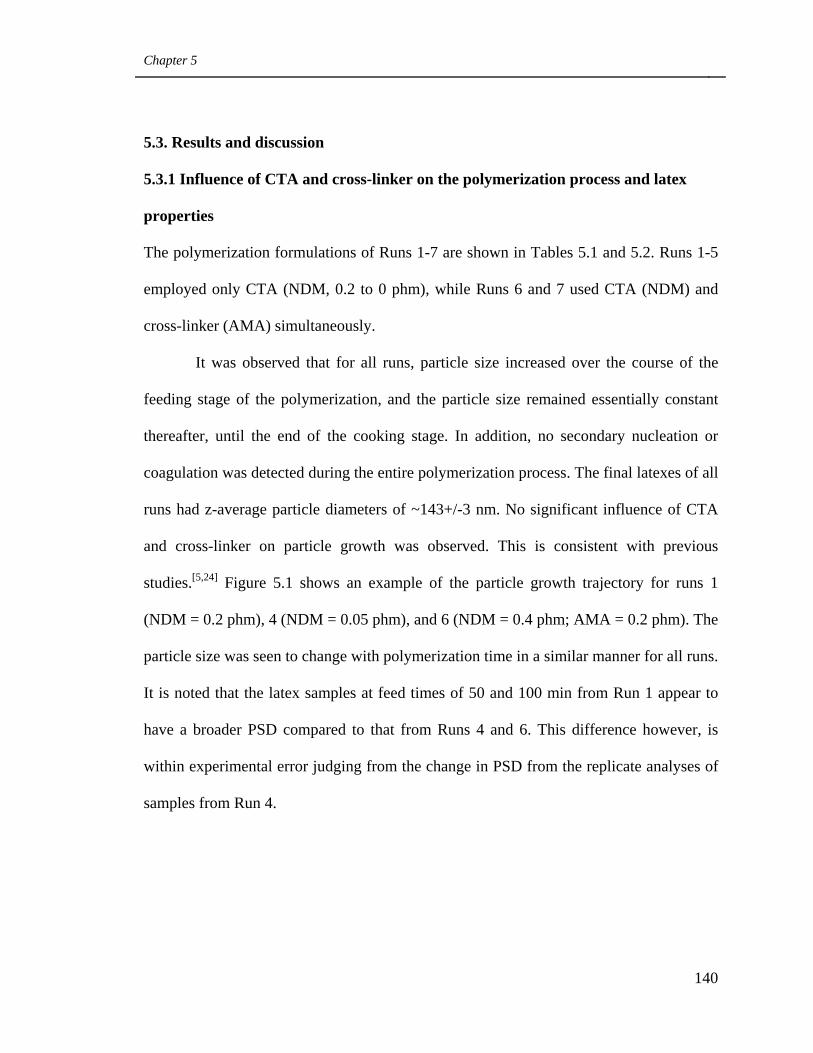
Chapter 5
140
5.3. Results and discussion
5.3.1 Influence of CTA and cross-linker on the polymerization process and latex
properties
The polymerization formulations of Runs 1-7 are shown in Tables 5.1 and 5.2. Runs 1-5
employed only CTA (NDM, 0.2 to 0 phm), while Runs 6 and 7 used CTA (NDM) and
cross-linker (AMA) simultaneously.
It was observed that for all runs, particle size increased over the course of the
feeding stage of the polymerization, and the particle size remained essentially constant
thereafter, until the end of the cooking stage. In addition, no secondary nucleation or
coagulation was detected during the entire polymerization process. The final latexes of all
runs had z-average particle diameters of ~143+/-3 nm. No significant influence of CTA
and cross-linker on particle growth was observed. This is consistent with previous
studies.[5,24] Figure 5.1 shows an example of the particle growth trajectory for runs 1
(NDM = 0.2 phm), 4 (NDM = 0.05 phm), and 6 (NDM = 0.4 phm; AMA = 0.2 phm). The
particle size was seen to change with polymerization time in a similar manner for all runs.
It is noted that the latex samples at feed times of 50 and 100 min from Run 1 appear to
have a broader PSD compared to that from Runs 4 and 6. This difference however, is
within experimental error judging from the change in PSD from the replicate analyses of
samples from Run 4.
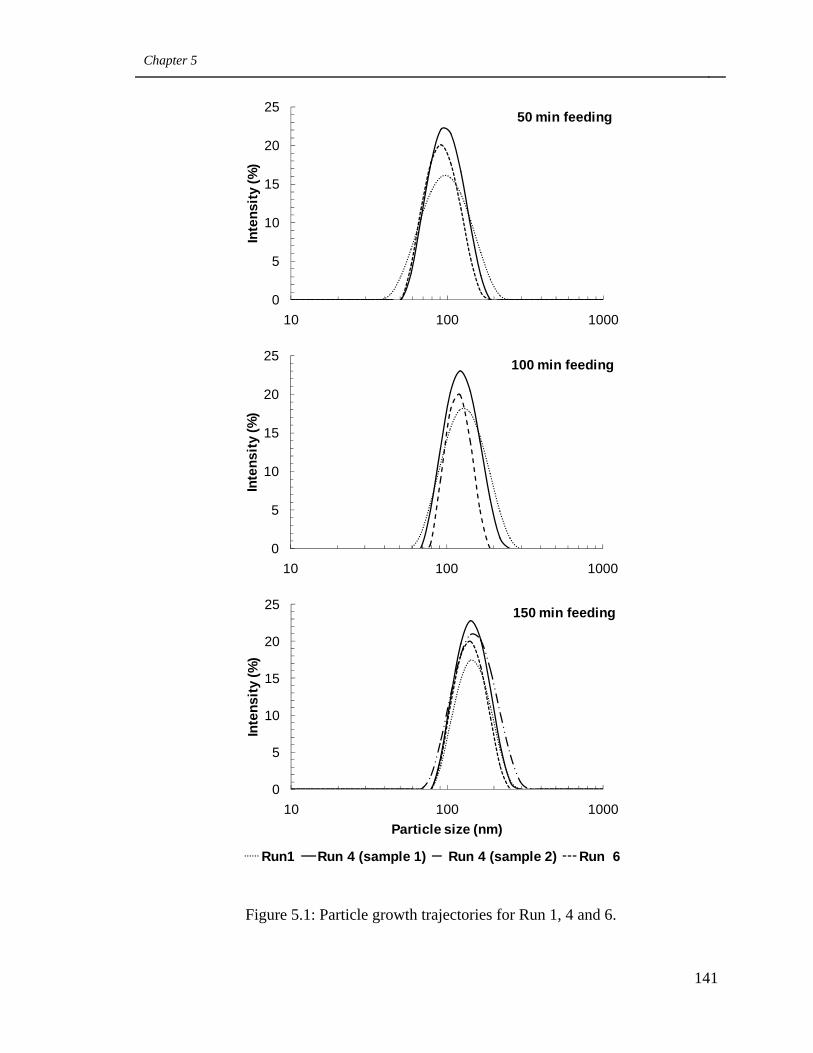
Chapter 5
141
Figure 5.1: Particle growth trajectories for Run 1, 4 and 6.
0
5
10
15
20
25
10 100 1000
Inte
nsity
(%)
50 min feeding
0
5
10
15
20
25
10 100 1000
Inte
nsity
(%)
100 min feeding
0
5
10
15
20
25
10 100 1000
Inte
nsity
(%)
Particle size (nm)
Run1 Run 4 (sample 1) Run 4 (sample 2) Run 6
150 min feeding
Chapter 5
142
The instantaneous vs. overall monomer conversion curves of all the runs were
almost identical. Conversion profiles for Runs 3 through 5 (as examples) are shown in
Figure 5.2. It is clear that CTA and cross-linker had no significant influence on
polymerization rate, as reported elsewhere.[5,24] In addition, all runs were carried out
under monomer-starved conditions, i.e., the instantaneous monomer conversion was > 90
wt% for most of the polymerization process. Thus, a homogeneous polymer composition
was achieved for all runs. This was confirmed by DSC measurements which exhibited
only a single peak (Tg of about -45°C) for the polymer sample tested.
Figure 5.2: Instantaneous vs. overall monomer conversion for Runs 3 through 5.
Polymer microstructure results for the latexes from Runs 1 through 7 are shown in
Table 5.2. (Note: The latexes were named according to their run number.) One should
0.0
0.2
0.4
0.6
0.8
1.0
0.0 0.2 0.4 0.6 0.8 1.0
Inst
anta
neou
s m
onom
er c
onve
rsio
n
Overall monomer conversion
Run 3 Run 4 Run 5
End of the seed stage
End of the feeding stage
Chapter 5
143
recall that latexes 1 through 5 were produced with varying CTA levels with no cross-
linker added, whereas latexes 6 and 7 were produced using both CTA and cross-linker.
The result was a series of latexes with markedly different microstructures.
As noted in a previous study, during a polymerization process there are
principally two kinds of reactions which control the polymer microstructure. One is the
formation of primary polymer chains.[24] The average primary polymer chain size is
usually defined as kinetic chain length, and it decreases with an increase in CTA
concentration. The second reaction type is the formation of either branched sol polymers
or gel polymers. In the absence of cross-linker, some of the primary polymer chains could
undergo further growth at the labile tertiary hydrogen sites from the BA units. This
growth is initiated by inter-molecular chain transfer at the tertiary hydrogen sites
followed by propagation with monomer to produce branched polymer radicals. In the
presence of cross-linker, some of the primary polymer chains can also grow into
branched polymer radicals via another path, which is usually the dominant one. In this
case, the branch growth begins at the pendent double bond sites from the cross-linker
unit. In both cases, once formed, these branched polymer radicals can then terminate
either by chain transfer to CTA or by combining with each other. The resulting polymers
will be gel polymers if their size is sufficiently large. In general, larger primary polymer
chains have a greater probability to become gel polymer since they are more likely to
undergo further growth due to the presence of more tertiary hydrogen and pendent double
bonds in their chains. In contrast, if the resulting polymers are not large enough, they will
become sol polymers. In addition, sol polymers can arise from another source, the
ungrown primary polymer chains.
Chapter 5
144
The effect of CTA on the polymer microstructure is shown in Table 5.2. In the
absence of cross-linker, the decrease in CTA concentration from 0.2 to 0 phm (Runs 1-5)
resulted in an increase in gel content from 0 to 75 wt%, as well as a decrease in Mc. This
was because less CTA led to the generation of larger primary polymer chains and a
correspondingly higher probability for these chains to grow into gel polymers. In
contrast, the Mw first increased from 252 kg/mol (i.e., at 0.2 phm NDM, gel content: 0
wt%) to a maximum of 656 kg/mol (i.e., at 0.1 phm NDM, gel content: 36 wt%) then
decreased to 217 kg/mol (i.e., at 0 phm NDM, gel content: 75 wt%). This change in Mw
can be explained as follows. In the CTA concentration range 0.2 to 0.1 phm, most of the
primary polymers became sol polymers, accounting for the low gel content of the latexes.
Since the primary polymers became larger with the decrease in CTA concentration, the
sol polymer also became larger (i.e., larger Mw). In contrast, when the CTA concentration
is smaller than 0.1 phm, most of the primary polymers, especially the larger ones, became
gel polymers, accounting for the high gel content; while the other, smaller ones became
sol polymers. As with the decrease in CTA concentration, more larger primary polymers
became gel polymers, resulting in higher gel content, therefore the sol polymers became
smaller (i.e., smaller Mw).
The influence of the cross-linker can be seen by comparing the latex
microstructure of Runs 7 and 1, which employed the same amount of CTA (NDM, 0.2
phm), but a different amount of cross-linker (Run 1: 0 phm AMA; Run 7: 0.2 phm
AMA). From Table 5.2, one can observe that the addition of 0.2 phm AMA significantly
increased the gel content from 0 to 74 wt%. At the same time, the Mw greatly decreased
from 252 to 87 kg/mol. These changes, caused by adding cross-linker at identical CTA
Chapter 5
145
concentrations, were similar as those reported changes resulted by adding cross-linker in
the absence of CTA.[4-5,23-24] Thus, the addition of cross-linker significantly increased the
opportunity for primary polymer chains, especially the larger ones, to engage in further
growth due to the introduction of double bonds. Most of these primary polymer chains
grew into gel polymers, and therefore the gel content greatly increased and Mw decreased.
Comparing Run 6 to Run 7 allows us to observe the effect of CTA on the polymer
microstructure in the presence of the same amount of cross-linker (AMA: 0.2 phm). From
Table 5.2, one can observe that increasing the amount of CTA from 0.2 (Run 7) to 0.4
phm (Run 6) led to a decrease in gel content from 74 to 49 wt%, an increase in Mc from
20 to 38 kg/mol, and an increase in Mw from 87 to 113 kg/mol. With a smaller amount of
CTA, the average size of the primary polymer chains in Run 7 was relatively larger than
that in Run 6. Due to their larger average size, most of the primary polymer chains in Run
7 (i.e., the larger ones) underwent further growth and eventually became gel polymers,
while a small amount of these chains (i.e., the smaller ones) became sol polymers. In
contrast, because the primary polymers in Run 6 were significantly smaller, the majority
of the chains did not become gel polymer even after multiple further growths at the
pendent double bonds and then termination. Instead they grew into highly branched
polymers and became sol polymer together with those ingrown small primary polymer
chains. Thus, the Mw of latex 6 was larger than that of latex 7. This presence of branched
sol polymers was also reflected in the breadth of the molecular weight distribution
(MWD): polydispersity index (PDI) for latex 6 = 4.0 and PDI for latex 7 = 2.1.
The larger Mc of the gel of latex 6 can be explained as follows. During the
polymerization, the branched polymer radicals generated via further growth of primary
Chapter 5
146
polymers could be terminated with other branched polymer radicals. In this case, the
double bonds from which the branched radicals grew became cross-linking points, if the
resulted polymer is sufficiently large as gel polymer. The branched polymer radicals
could also be terminated by chain transfer to CTA, and in this case, the corresponding
double bonds connected to the branched radicals will turn into branching points. As Run
6 used more CTA, more double bonds became branching points instead of cross-linking
points. Accordingly, the Mc of the gel of latex 6 was larger than that of latex 7.
Comparing Run 4 to Run 6 and Run 5 to Run 7, one can see that latexes with
similar gel contents but much smaller Mw and Mc can be produced by simultaneously
increasing the CTA and cross-linker concentrations (see Table 5.2). The MWD of the sol
polymers of these latexes are shown in Figure 5.3. To explain these microstructural
changes, one can refer to the polymerization process analysis explained earlier. At higher
CTA concentrations, the average size of the primary polymer chains would be much
smaller and this would lead to a much smaller Mw. At higher cross-linker concentrations,
more pendent double bonds would be present in the primary polymer chains. As a result,
there would be more cross-linking points in the final latex polymers and hence, Mc would
be lower. If one increases the concentrations of CTA and cross-linker simultaneously, the
effect of increasing the CTA concentration could counterbalance that of increasing the
cross-linker concentration with respect to the gel content under appropriate conditions.
Therefore, latexes with similar gel contents could be produced.
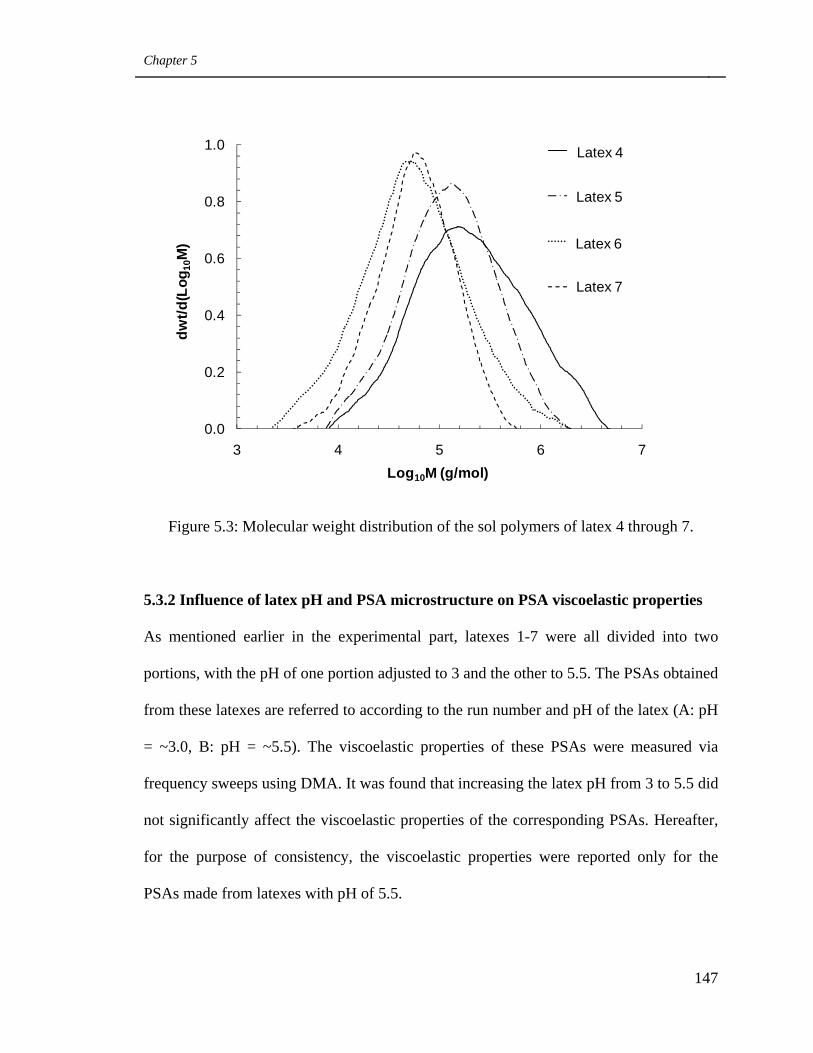
Chapter 5
147
Figure 5.3: Molecular weight distribution of the sol polymers of latex 4 through 7.
5.3.2 Influence of latex pH and PSA microstructure on PSA viscoelastic properties
As mentioned earlier in the experimental part, latexes 1-7 were all divided into two
portions, with the pH of one portion adjusted to 3 and the other to 5.5. The PSAs obtained
from these latexes are referred to according to the run number and pH of the latex (A: pH
= ~3.0, B: pH = ~5.5). The viscoelastic properties of these PSAs were measured via
frequency sweeps using DMA. It was found that increasing the latex pH from 3 to 5.5 did
not significantly affect the viscoelastic properties of the corresponding PSAs. Hereafter,
for the purpose of consistency, the viscoelastic properties were reported only for the
PSAs made from latexes with pH of 5.5.
0.0
0.2
0.4
0.6
0.8
1.0
3 4 5 6 7
dwt/d
(Log
10M
)
Log10M (g/mol)
8 per. Mov. Avg. (Latex 4)8 per. Mov. Avg. (Latex 5)4 per. Mov. Avg. (Latex 6)8 per. Mov. Avg. (Latex 7)
Latex 4
Latex 5
Latex 6
Latex 7
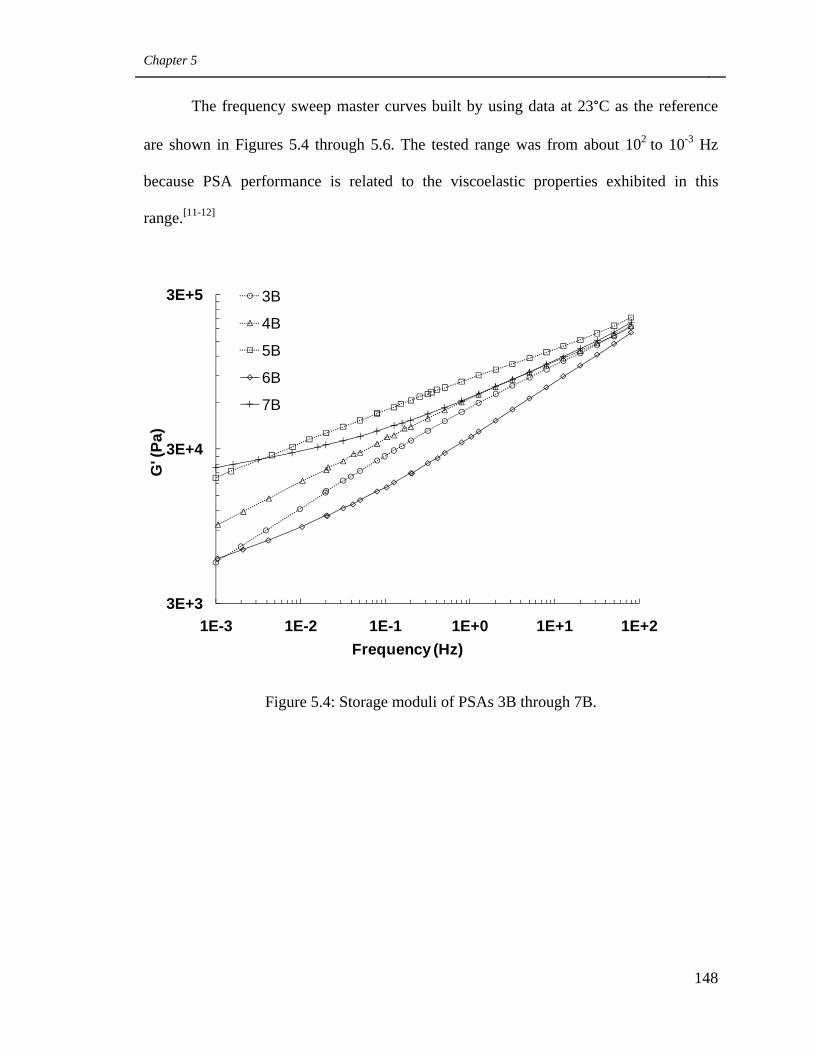
Chapter 5
148
The frequency sweep master curves built by using data at 23°C as the reference
are shown in Figures 5.4 through 5.6. The tested range was from about 102 to 10-3 Hz
because PSA performance is related to the viscoelastic properties exhibited in this
range.[11-12]
Figure 5.4: Storage moduli of PSAs 3B through 7B.
3E+3
3E+4
3E+5
1E-3 1E-2 1E-1 1E+0 1E+1 1E+2
G' (
Pa)
Frequency (Hz)
3B
4B
5B
6B
7B
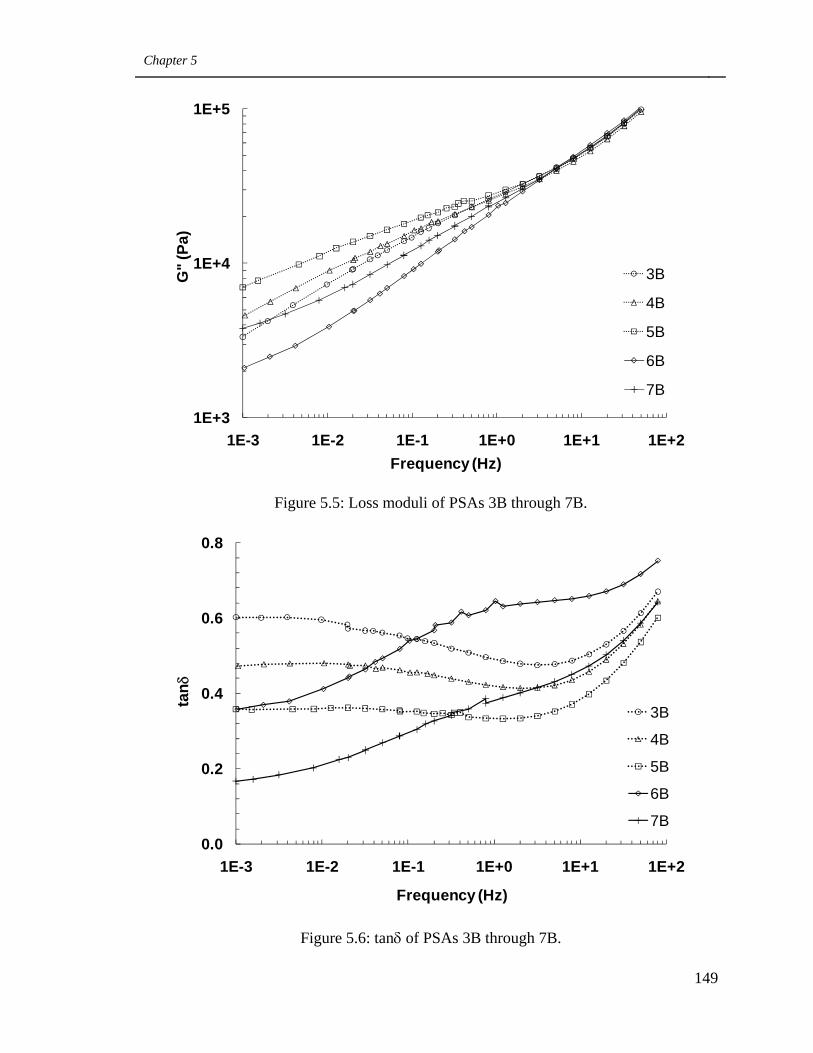
Chapter 5
149
Figure 5.5: Loss moduli of PSAs 3B through 7B.
Figure 5.6: tanδ of PSAs 3B through 7B.
1E+3
1E+4
1E+5
1E-3 1E-2 1E-1 1E+0 1E+1 1E+2
G"
(Pa)
Frequency (Hz)
3B
4B
5B
6B
7B
0.0
0.2
0.4
0.6
0.8
1E-3 1E-2 1E-1 1E+0 1E+1 1E+2
tanδ
Frequency (Hz)
3B
4B
5B
6B
7B
Chapter 5
150
When analyzing viscoelastic data, it is important to be aware of the following five
general principles related to PSAs and the DMA testing method. First of all, higher
frequencies correspond to shorter times when a dynamic force is used. Secondly, PSA
polymers typically contain many movable units of greatly varying sizes. These can be
classified by increasing size as: the chemical bonds in the polymer chains, small polymer
chain segments either at the end or middle of sol and gel polymer chains, large sol and
gel polymer chain segments or even very small whole polymer chains (all <Me), and very
large polymer segments of sol and gel polymers or some whole polymer chains (all >Me).
Each movable unit has its own relaxation time (τ), and the size order shown above
corresponds to increasing relaxation times. In addition, for similar size segments (e.g.,
small end and middle chain segments), those with higher flexibility (i.e., the chain end
segments) correspond to a smaller τ.
Thirdly, the strain experienced by a PSA polymer (γ) is the sum of the individual
strains (γi) of all of the moving units:
∑ , , , (5-1)
where τ is the relaxation time, t is the time the force acts on the PSA, T is the
temperature, and σ is the force exerted on the PSA. From Eq. 5-1, one can note that under
different conditions, the contributions of each moving unit to the total strain may vary. At
constant temperature, if a certain force is exerted on a PSA, the much smaller moving
unit (τ <<t) can reach an equilibrium state within a much shorter period of time but with a
Chapter 5
151
resulting, much smaller equilibrium strain and a correspondingly smaller contribution to
the total strain. For a much larger moving unit (τ >>t), its strain contribution will be
negligible because it does not have sufficient time to move and thereafter develop a
strain. Therefore, the main contribution to strain arises from the moving units which have
relaxation times (τ) close to t.
The fourth principle concerns the various zones of the viscoelastic curve. In the
plateau zone (i.e., ~80 to 0.3 Hz for PSA 5B), large polymer chain segments and very
small whole polymer chains (all <Me) have τ comparable to t. In the terminal region (e.g.,
~0.3 Hz to 0.001 Hz for PSA 5B), very larger chain segments in either gel or sol polymer
(all >Me) and most of the whole polymer chains, have τ comparable to t. We hypothesize
that in general, the above mentioned proximity of the τ of a certain moving unit to the t at
a certain frequency applies even for PSAs without a plateau region but similar Tg. For
example, if a PSA has a very large amount of very small sol polymers, it might not show
a plateau zone due to lack of sufficient entanglements between polymer chains. However,
the very small sol polymers (<Me) in this PSA should still have τ close to t in the plateau
region.
The fifth and last principle is that PSA is a viscoelastic material and under a
dynamic shear force it will show the characteristics of both a solid (elasticity) and a
liquid (viscous flow). The storage modulus (G’) corresponds to the former and measures
the energy stored and recovered, while the loss modulus (G”) corresponds to the latter
and measures the energy dissipated or lost.
With Figures 5.4 through 5.6, we can compare PSAs 3B, 4B and 5B, which had
increasing gel contents, and were all cast with latexes produced in the absence of cross-
Chapter 5
152
linker. At any given frequency, the moduli increased with gel content, and the magnitude
of the increase was larger at lower frequencies, except for G” at the very early stage of
the plateau zone. This phenomenon of moduli change with gel content is well known.[16]
This arises because, with an increase in gel content, the PSA has a greater capacity to
resist deformation by shear forces. The larger moduli differences at lower frequencies
(i.e., 1 x 10⁻³ Hz) compared to that at higher frequencies (i.e., 80 Hz) are related to the
disentanglement of the polymer chains at the lower frequency range, which lies in the
terminal flow region. A PSA containing less gel undergoes greater disentanglement
compared to PSAs with higher gel contents. Hence, its resistance to deformation
decreases much more than the higher gel content PSA. As mentioned earlier, G”
exhibited unique behavior in the range of ~80 to 10 Hz, where the G” of these PSAs were
very similar, and did not exhibit influence from the polymer microstructure. This
phenomenon was probably associated with the well known delayed behavior of G”
compared with that of G’.[16] In the very early stage of the plateau region (i.e., 80 to 10
Hz), G’ already shows the influence of polymer microstructure, while the G” does not
and still behaves as in the glass transition zone. Figure 5.6 shows that the tanδ of PSA 3B
through 5B increased with a decrease in gel content, and the magnitude of the increase
was greater at lower frequencies. The larger tanδ of the lower gel content PSAs was due
to its more liquid-like behavior. The much larger tanδ differences at lower frequencies
also relate to polymer chain disentanglement which occurred in this region. Comparing
PSAs 6B and 7B (see Figures 5.4-5.6), which were generated from latexes produced with
both CTA and cross-linker, one can observe the same influences of gel content on moduli
and tanδ.
Chapter 5
153
The viscoelastic properties of PSAs with similar gel contents, but different Mc and
Mw, have not been reported previously. From Figures 5.4 and 5.5, one can observe that at
similar gel contents, the PSAs produced in the absence of cross-linker (i.e., PSA 4B or
5B) showed much larger G’ and G” than their respective counterparts (6B or 7B) in
almost the entire studied range. The much larger G’ and G” was likely due to better
entanglement between the microgels by sol polymers in PSAs 4B and 6B. The enhanced
entanglements in PSA 4B and 5B, respectively, compared to their counterparts, can be
concluded from the following facts: (1) The Mc and Mw of PSA 4B and 5B are
respectively much larger than those of PSA 6B and 7B. (2) For PSA 7B, the Mc is
smaller than Me, so the connection between the microgels by sol polymers is almost
impossible in this PSA.[27] (3) In PSA 6B, a larger amount of the sol polymers are hyper-
branched, and according to Dealy and Larson, these types of polymer chains generally
cannot provide good entanglement because of the short segments between branch
points.[28] The better entanglement in PSA 4B and 5B led to enhanced cohesive strength
and accordingly, larger moduli. In addition, from Table 5.2 and Figure 5.3, one can see
that the amount of very small sol polymers (i.e., < Me) in PSA 4B and 5B was very low
(i.e., ~2 wt% of the total sol polymers), but much larger in PSA 6B and 7B (i.e., from ~16
wt% to 24 wt% of the total sol polymer). These small sol polymers cannot entangle with
other polymer chains. Besides, they act like plasticizers and greatly decrease a PSA’s
capability to resist deformation. Hence, smaller amounts of very small sol polymers also
contributed to the larger moduli of PSAs produced in the absence of cross-linker. The
slightly lower G’ of PSA 5B, compared to that of PSA 7B at the lower frequency end
(i.e., ~0.001Hz) is related to the disentanglement in this terminal flow region. Since there
Chapter 5
154
are more entanglement points in PSA 5B than 7B if no disentanglement occurred as we
explained earlier, the loss of entanglement points should be larger for PSA 5B than 7B
when disentanglement occurs. Hence, around the lower frequency, the deformation
resistance of PSA 5B decreased to the same level of that of PSA 7B, and led to a similar
G’ at around 0.001 Hz.
From Figure 5.6, one can see that the tanδ curves of PSAs produced by using both
CTA and cross-linker (i.e., PSA 6B and 7B) were very different from that produced in the
absence of cross-linker (i.e., PSA 3B-5B). First, the tanδ of PSAs 3B-5B all showed a
noticeable minimum point (i.e., ~5 Hz), but those of PSAs 6B and 7B did not. The
minimum point is often used to identify the midpoint of the plateau zone, a zone which
only exists for polymer materials having good entanglements and capable of recoverable
stretching. The absence of this minimum point in PSA 6B and 7B further confirmed the
presence of fewer entanglements between polymer chains in the PSAs produced by using
CTA and cross-linker simultaneously. Secondly, the tanδ curves of PSAs produced using
both CTA and cross-linker (i.e., PSA 6B and 7B) were very different from those of PSAs
produced in the absence of cross-linker (i.e., PSA 4B and 5B). At the higher frequency
range (i.e., ~80 to 0.3 Hz), the tanδ value of PSA 4B and 5B are much smaller than their
respective similar gel content counterparts, PSA 6B and 7B. This range roughly
corresponds to the plateau zone. In this range, larger polymer chain segments or very
small sol polymers (all <Me) have τ similar to t, therefore the strain mainly resulted by
their movement. Specifically, for PSA 4B and 5B, the strain was almost totally due to the
large polymer chain segments, while for PSA 6B and 7B, a large portion of the strain was
due to the very small sol polymers. The reason is that there are significant amounts of
Chapter 5
155
very small sol polymers in PSA 6B and 7B (see Table 5.2). The movement of very large
polymer chains (<Me) does not involve disentanglement of polymer chains and therefore
movement between whole polymer chains. As a result, most of the exerted energy on the
PSAs is recoverable, leading to smaller tanδ for PSAs produced in the absence of cross-
linker (i.e., PSA 4B and 5B). In contrast, the movement of very small sol polymer (<Me)
will cause relative movement between whole polymer chains, thereby leading to
unrecoverable strain and correspondingly larger tanδ for PSAs produced by using both
CTA and cross-linker (i.e., PSA 6B and 7B). In the lower frequency region (i.e., ~0.7 to
0.001 Hz), the PSAs produced in the absence of cross-linker (i.e., PSA 4B and 5B)
showed higher tanδ than their similar gel content counterparts. This trend is different
from what was observed in the higher frequency range. The low frequency range roughly
falls in the terminal flow region and disentanglement between polymer chains related to
movement of very large polymer chain segments (>Me) could occur. As the Mw and Mc
of PSAs produced in the absence of cross-linker (e.g., PSA 4B and 5B) were much larger
than their counterparts (i.e., PSA 6B and 7B), PSA 4B and 5B should have experienced
greater disentanglement. It is known that disentanglement could dissipate a significant
amount of energy. Consequently, in the lower frequency range, the tanδ (the ratio of
dissipated energy to stored energy) was larger for the PSAs produced in the absence of
cross-linker than their respective similar gel content counterparts.
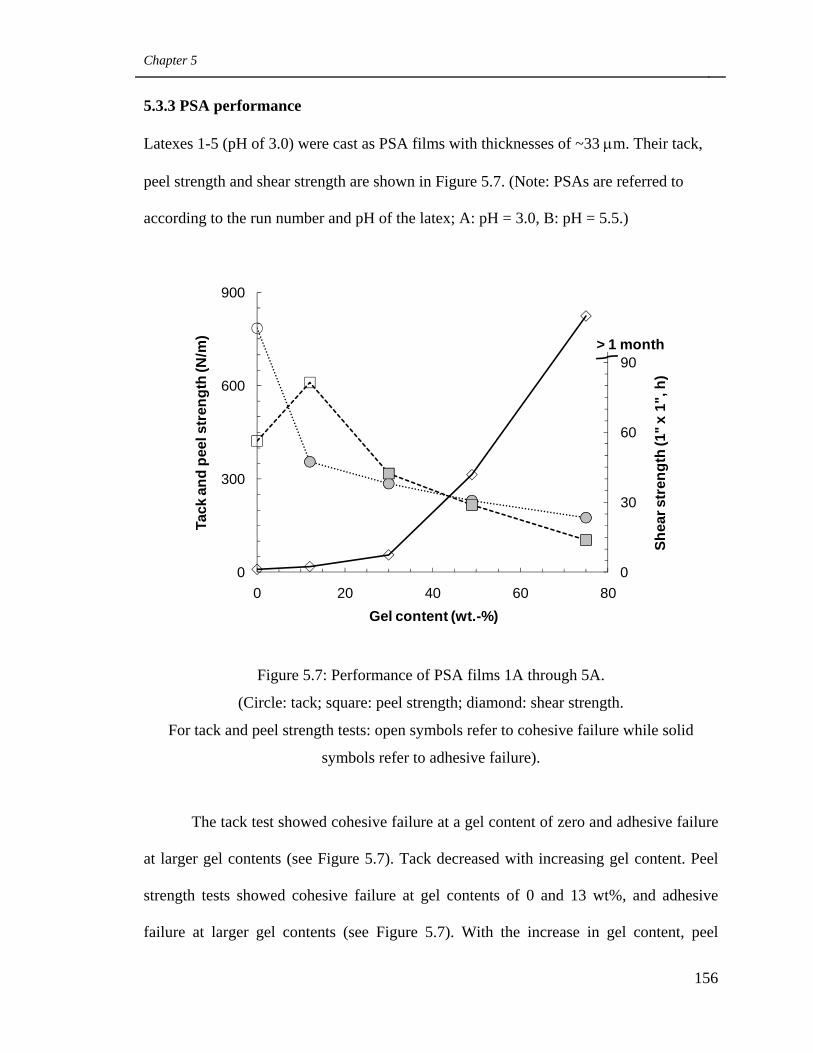
Chapter 5
156
5.3.3 PSA performance
Latexes 1-5 (pH of 3.0) were cast as PSA films with thicknesses of ~33 μm. Their tack,
peel strength and shear strength are shown in Figure 5.7. (Note: PSAs are referred to
according to the run number and pH of the latex; A: pH = 3.0, B: pH = 5.5.)
Figure 5.7: Performance of PSA films 1A through 5A.
(Circle: tack; square: peel strength; diamond: shear strength.
For tack and peel strength tests: open symbols refer to cohesive failure while solid
symbols refer to adhesive failure).
The tack test showed cohesive failure at a gel content of zero and adhesive failure
at larger gel contents (see Figure 5.7). Tack decreased with increasing gel content. Peel
strength tests showed cohesive failure at gel contents of 0 and 13 wt%, and adhesive
failure at larger gel contents (see Figure 5.7). With the increase in gel content, peel
0
30
60
90
120
0
300
600
900
0 20 40 60 80
Shea
r str
engt
h (1
" x 1
", h
)
Tack
and
pee
l str
engt
h (N
/m)
Gel content (wt.-%)
> 1 month
Chapter 5
157
strength showed an initial increase to a maximum at 13 wt% gel content followed by a
decrease. Shear strength increased with gel content. Similar PSA performance with gel
content has been reported previously.[29] Higher gel content endows a PSA with lower
deformation and flow ability as well as higher cohesive strength. It is known that a PSA’s
shear strength is mainly affected by its cohesive strength and that higher cohesive
strength usually results in larger shear strengths.
Peel strength testing involves both a bonding and a debonding process. It is a
function of how well the PSA wets the substrate during the bonding process and how
much energy is dissipated during the debonding process. All things being equal (e.g.,
composition and Tg), a lower gel content endows a PSA with enhanced ability for
deformation and flow, and therefore improved wetting during the bonding process. The
amount of energy dissipated during the debonding process is primarily affected by the
strain experienced by the PSA, which is related to fibril formation and growth; the larger
the strain, the larger the amount of energy dissipated.
Among PSAs 1A to 5A, PSA 2A (gel content: 13 wt%) resulted in a maximum
peel strength, which implies that this PSA should have experienced a maximum strain
during debonding compared to the other PSAs. To confirm this, hereafter we will analyze
the strains in light of the following concepts: (1) Fibril formation is associated with
elongation of PSA polymers in the tensile direction;[8-9] (2) Higher gel contents and
tighter gel networks decrease fibril length.[18] First of all, PSA 2A had a much larger Mw
(~20Me, see Table 5.2) compared to that of PSA 1A (~10Me, see Table 5.2; gel content =
0 wt%) as well as a very loose gel structure. Mc could not be measured for PSA 2A, as its
swollen gel was very fragile and broke during testing. The gel in PSA 2A would not be
Chapter 5
158
expected to affect fibril formation and growth considering its low concentration and very
loose microstructure. Hence, the higher Mw/Me ratio of PSA 2A should have led to longer
fibrils (larger strain) compared to PSA 1A, and accordingly a larger strain. Additional
evidence that maximum strain occurred with PSA 2A can be ascertained by comparing
PSAs 3A, 4A and 5A. With increasing gel content (from 3A to 5A, see Table 5.2) the gel
network became tighter, and beyond a certain gel content (say, >36 wt%), Mw became
smaller. This should result in shorter fibrils and smaller strains with increasing gel
content. PSA 2A showed higher peel strength than PSA 1A, despite the lower gel content
and consequently better wetting during the bonding process of the latter. This was
because the positive effect of larger strain during debonding on peel strength dominated
the negative effect of less wetting during bonding. Comparing PSAs from 2A through
5A, with the increase in gel content, wetting of the substrate became worse and the
dissipated energy also decreased due to the reduction of strain. Therefore, the peel
strength decreased with increasing gel content (see Figure 5.7).
Tack testing also involves both a bonding and a debonding process. However,
compared to the peel strength test, the tack test features a much shorter contact time and a
much smaller applied pressure during the bonding process. Hence, the wetting capability
of a PSA affects tack more than peel strength and as expected, tack decreased with gel
content (see Figure 5.7). No maximum in tack was observed simply because the energy
dissipation effect was not as strong for PSA 2A as in the case of the peel strength test.
To study the influence of polymer microstructure on PSA performance at similar
gel contents, PSA 4B was compared to PSA 6B and PSA 5B was compared to PSA 7B as
shown in Figure 5.8. It can be seen that PSAs with much larger Mc and Mw (i.e., PSA 4B
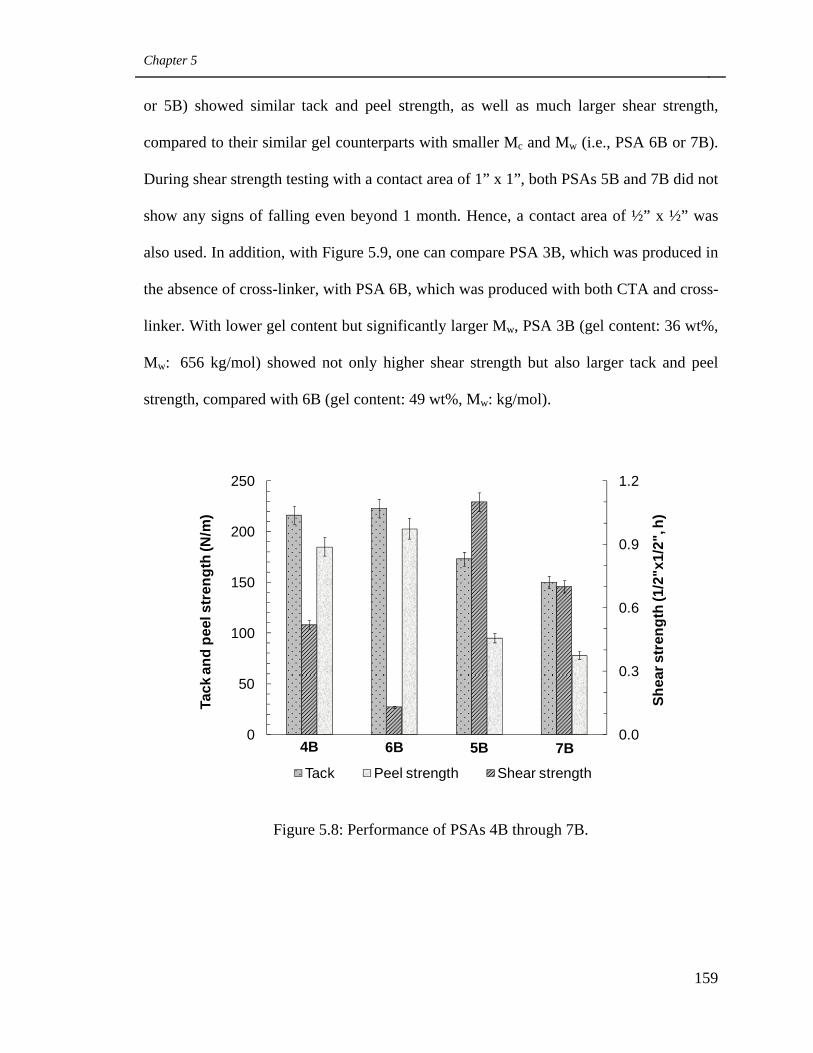
Chapter 5
159
or 5B) showed similar tack and peel strength, as well as much larger shear strength,
compared to their similar gel counterparts with smaller Mc and Mw (i.e., PSA 6B or 7B).
During shear strength testing with a contact area of 1” x 1”, both PSAs 5B and 7B did not
show any signs of falling even beyond 1 month. Hence, a contact area of ½” x ½” was
also used. In addition, with Figure 5.9, one can compare PSA 3B, which was produced in
the absence of cross-linker, with PSA 6B, which was produced with both CTA and cross-
linker. With lower gel content but significantly larger Mw, PSA 3B (gel content: 36 wt%,
Mw: 656 kg/mol) showed not only higher shear strength but also larger tack and peel
strength, compared with 6B (gel content: 49 wt%, Mw: kg/mol).
Figure 5.8: Performance of PSAs 4B through 7B.
0.0
0.3
0.6
0.9
1.2
0
50
100
150
200
250
1 2 3 4
Shea
r str
engt
h (1
/2"x
1/2"
, h)
Tack
and
pee
l str
engt
h (N
/m)
Tack Peel strength Shear strength
5B 7B6B4B
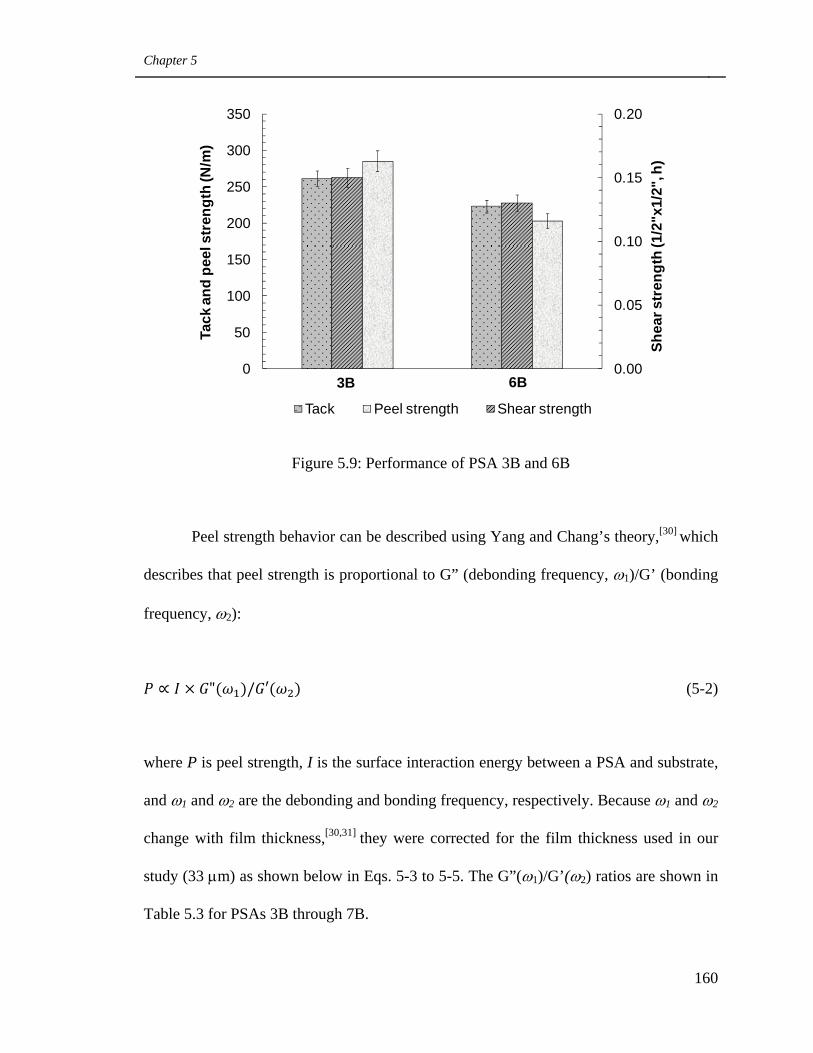
Chapter 5
160
Figure 5.9: Performance of PSA 3B and 6B
Peel strength behavior can be described using Yang and Chang’s theory,[30] which
describes that peel strength is proportional to G” (debonding frequency, ω1)/G’ (bonding
frequency, ω2):
" / (5-2)
where P is peel strength, I is the surface interaction energy between a PSA and substrate,
and ω1 and ω2 are the debonding and bonding frequency, respectively. Because ω1 and ω2
change with film thickness,[30,31] they were corrected for the film thickness used in our
study (33 μm) as shown below in Eqs. 5-3 to 5-5. The G”(ω1)/G’(ω2) ratios are shown in
Table 5.3 for PSAs 3B through 7B.
0.00
0.05
0.10
0.15
0.20
0
50
100
150
200
250
300
350
1 2
Shea
r str
engt
h (1
/2"x
1/2"
, h)
Tack
and
pee
l str
engt
h (N
/m)
Tack Peel strength Shear strength
6B3B
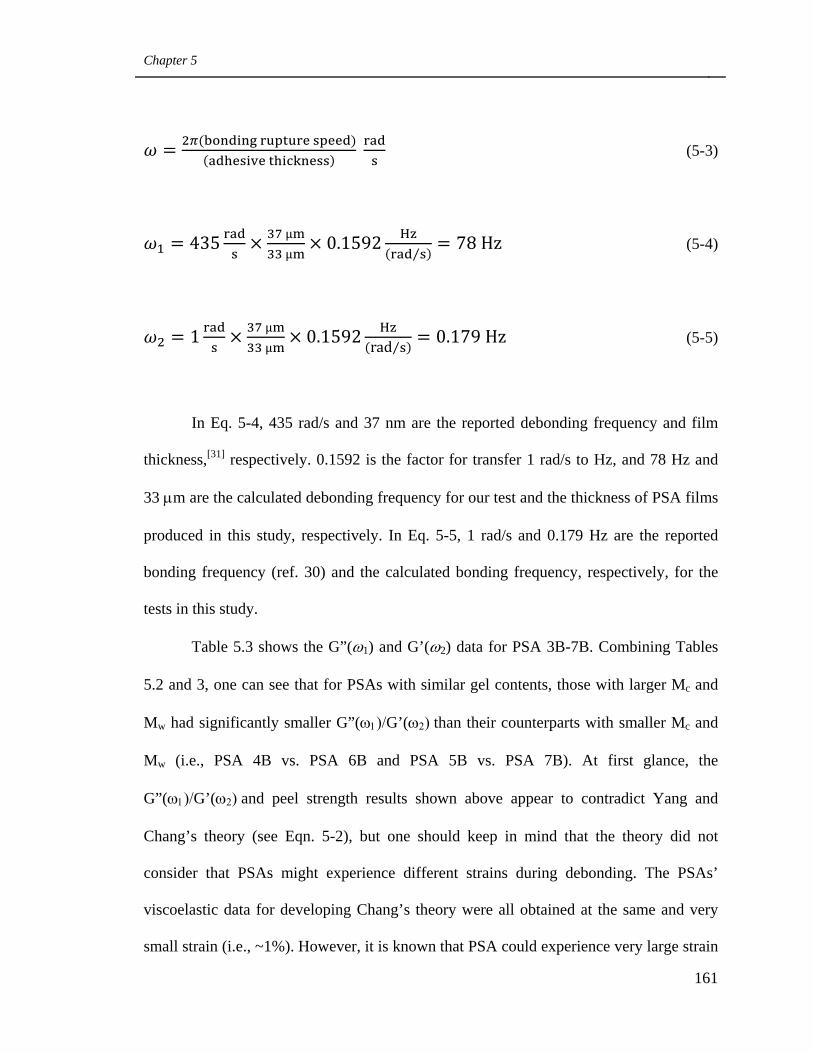
Chapter 5
161
(5-3)
435 µ µ
0.1592 H⁄ 78 Hz (5-4)
1 µ µ
0.1592 Hrad⁄ 0.179 Hz (5-5)
In Eq. 5-4, 435 rad/s and 37 nm are the reported debonding frequency and film
thickness,[31] respectively. 0.1592 is the factor for transfer 1 rad/s to Hz, and 78 Hz and
33 μm are the calculated debonding frequency for our test and the thickness of PSA films
produced in this study, respectively. In Eq. 5-5, 1 rad/s and 0.179 Hz are the reported
bonding frequency (ref. 30) and the calculated bonding frequency, respectively, for the
tests in this study.
Table 5.3 shows the G”(ω1) and G’(ω2) data for PSA 3B-7B. Combining Tables
5.2 and 3, one can see that for PSAs with similar gel contents, those with larger Mc and
Mw had significantly smaller G”(ω1)/G’(ω2) than their counterparts with smaller Mc and
Mw (i.e., PSA 4B vs. PSA 6B and PSA 5B vs. PSA 7B). At first glance, the
G”(ω1)/G’(ω2) and peel strength results shown above appear to contradict Yang and
Chang’s theory (see Eqn. 5-2), but one should keep in mind that the theory did not
consider that PSAs might experience different strains during debonding. The PSAs’
viscoelastic data for developing Chang’s theory were all obtained at the same and very
small strain (i.e., ~1%). However, it is known that PSA could experience very large strain
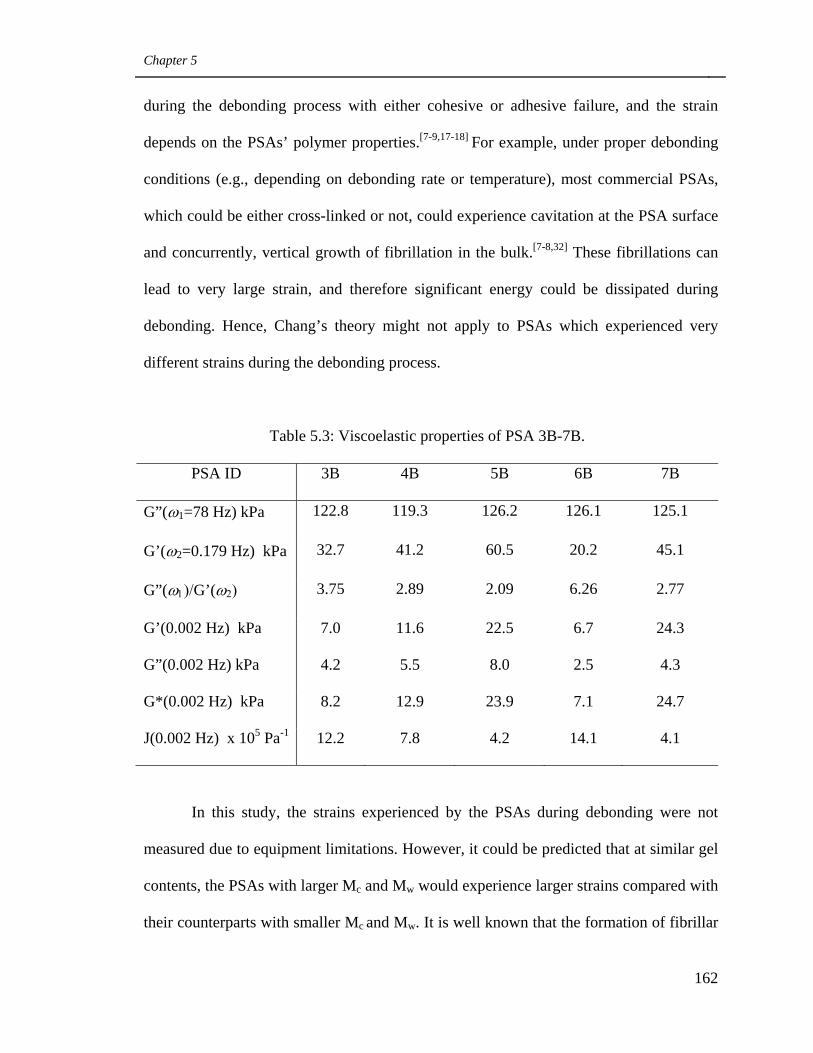
Chapter 5
162
during the debonding process with either cohesive or adhesive failure, and the strain
depends on the PSAs’ polymer properties.[7-9,17-18] For example, under proper debonding
conditions (e.g., depending on debonding rate or temperature), most commercial PSAs,
which could be either cross-linked or not, could experience cavitation at the PSA surface
and concurrently, vertical growth of fibrillation in the bulk.[7-8,32] These fibrillations can
lead to very large strain, and therefore significant energy could be dissipated during
debonding. Hence, Chang’s theory might not apply to PSAs which experienced very
different strains during the debonding process.
Table 5.3: Viscoelastic properties of PSA 3B-7B.
PSA ID 3B 4B 5B 6B 7B
G”(ω1=78 Hz) kPa 122.8 119.3 126.2 126.1 125.1
G’(ω2=0.179 Hz) kPa 32.7 41.2 60.5 20.2 45.1
G”(ω1)/G’(ω2) 3.75 2.89 2.09 6.26 2.77
G’(0.002 Hz) kPa 7.0 11.6 22.5 6.7 24.3
G”(0.002 Hz) kPa 4.2 5.5 8.0 2.5 4.3
G*(0.002 Hz) kPa 8.2 12.9 23.9 7.1 24.7
J(0.002 Hz) x 105 Pa-1 12.2 7.8 4.2 14.1 4.1
In this study, the strains experienced by the PSAs during debonding were not
measured due to equipment limitations. However, it could be predicted that at similar gel
contents, the PSAs with larger Mc and Mw would experience larger strains compared with
their counterparts with smaller Mc and Mw. It is well known that the formation of fibrillar
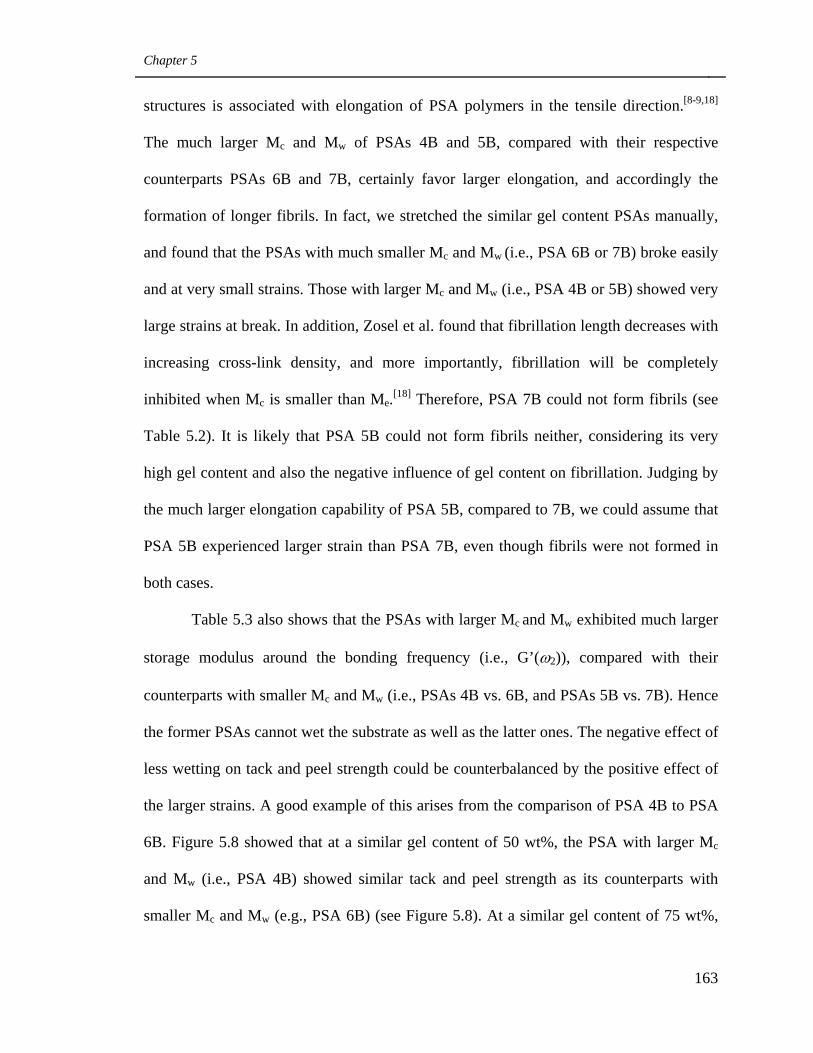
Chapter 5
163
structures is associated with elongation of PSA polymers in the tensile direction.[8-9,18]
The much larger Mc and Mw of PSAs 4B and 5B, compared with their respective
counterparts PSAs 6B and 7B, certainly favor larger elongation, and accordingly the
formation of longer fibrils. In fact, we stretched the similar gel content PSAs manually,
and found that the PSAs with much smaller Mc and Mw (i.e., PSA 6B or 7B) broke easily
and at very small strains. Those with larger Mc and Mw (i.e., PSA 4B or 5B) showed very
large strains at break. In addition, Zosel et al. found that fibrillation length decreases with
increasing cross-link density, and more importantly, fibrillation will be completely
inhibited when Mc is smaller than Me.[18] Therefore, PSA 7B could not form fibrils (see
Table 5.2). It is likely that PSA 5B could not form fibrils neither, considering its very
high gel content and also the negative influence of gel content on fibrillation. Judging by
the much larger elongation capability of PSA 5B, compared to 7B, we could assume that
PSA 5B experienced larger strain than PSA 7B, even though fibrils were not formed in
both cases.
Table 5.3 also shows that the PSAs with larger Mc and Mw exhibited much larger
storage modulus around the bonding frequency (i.e., G’(ω2)), compared with their
counterparts with smaller Mc and Mw (i.e., PSAs 4B vs. 6B, and PSAs 5B vs. 7B). Hence
the former PSAs cannot wet the substrate as well as the latter ones. The negative effect of
less wetting on tack and peel strength could be counterbalanced by the positive effect of
the larger strains. A good example of this arises from the comparison of PSA 4B to PSA
6B. Figure 5.8 showed that at a similar gel content of 50 wt%, the PSA with larger Mc
and Mw (i.e., PSA 4B) showed similar tack and peel strength as its counterparts with
smaller Mc and Mw (e.g., PSA 6B) (see Figure 5.8). At a similar gel content of 75 wt%,
Chapter 5
164
PSA 5B (larger Mc and Mw) and PSA 7B (smaller Mc and Mw) also showed similar tack
and peel strength (see Figure 5.8). In addition, the above reasoning could also explain the
larger peel strength of PSA 3B (36 wt%, Mw 656 kg/mol) compared to that of PSA 6B
(gel content: 49 wt%, Mw: 113 kg/mol) (see Figure 5.9). Only in this case, the positive
effect of larger strain dominated the negative effect of less wetting.
The PSA viscoelastic properties are useful when considering shear strength
differences. Chang reported that shear strength usually increases with G’ at 0.01 rad/s
(~0.002 Hz).[12] Figure 5.4 and Table 5.3 show that at this frequency, the G’ of PSA 4B
was significantly larger than that of PSA 6B, while the G’ of PSA 5B was slightly lower
than that of PSA 7B. At similar gel contents, the much larger shear strength of PSAs with
larger Mc and Mw could be explained by Chang’s theory (e.g., PSA 4B vs. 6B, gel
content: 50 wt%); while this was not the case for greatly differing gel contents (e.g., PSA
5B vs. 7B, gel content: 75 wt%). As G’ only relates to the storage energy, it could not
fully describe a PSA’s resistance to deformation. Creep compliance J(t) should be a
better indicator for predicting shear strength, as it considers both G’ and G”:
√ " (5-6)
From Eq. 5-6, one observes that the smaller is J(t), the larger will be the PSA’s
capability to resist shear force and accordingly, the larger the shear strength
measurement. For example, Table 5.3 shows that at a gel content of 50 wt%, PSA 4B had
a much smaller J(t) than 6B and Figure 5.8 shows the larger shear strength for PSA 4B.
However, at a gel content of 75 wt%, PSA 5B had a very close J(t) to that of 7B, which
Chapter 5
165
still could not explain the much larger shear strength of PSA 5B. This suggests that the
use of a single frequency may not be the best choice. Thus, the G’ and G” between
different PSAs were compared over a wide frequency range from the plateau region to
the terminal flow region (i.e., 80 to 0.001 Hz) as suggested in a previous study.[11] In
Figures 5.4 and 5.5, we note that at similar gel contents, the PSAs with much larger Mc
and Mw (i.e., PSA 4B or 5B) yielded a much larger G’ and G” in practically the entire
region. This was due to the larger number of entanglements possessed by these PSAs
produced in the absence of cross-linker. Accordingly, much longer times would be
needed to separate the entanglements if a constant shear force was applied and larger
shear strengths would result. In addition, the larger shear strength of PSA 3B compared to
that of PSA 6B (see Figure 5.9), is consistent with its larger J(t) at a single frequency
(~0.002 Hz) and also larger G’ and G” over a broader region (i.e., 80 to 0.001 Hz).
5.3.4 Additional results and Discussion shown in Appendix
The influence of latex pH on PSA performance was also studied. In addition, for each
PSA produced in this study, the shear strength were measured with two different contact
areas (i.e., ½” x ½” and 1”x1”). Results of these two effects can be found in the
Appendix of this thesis.
5.4 Conclusion
Using CTA and cross-linker simultaneously, as opposed to manipulating one
concentration at a time, allows one to expand the range of latex microstructural
possibilities. At similar gel contents, the latexes produced by varying the amount of CTA
Chapter 5
166
in the absence of cross-linker showed significantly larger Mc and Mw as well as a much
smaller amount of very small sol polymer (e.g., <Me), compared with their counterparts
obtained by using both CTA and cross-linker. The larger Mc and Mw led to improved
entanglements between the polymer chains in the corresponding PSAs. Accordingly,
these PSAs showed an enhanced capability to resist deformation, as reflected by their
much larger modulus (i.e., G’ and G”) in almost the entire studied frequency range.
Consequently, at similar gel content, PSAs with larger Mc and Mw exhibited much larger
shear strengths than those with smaller Mc and Mw. The tack and peel strength of the
above mentioned similar gel content PSAs were very close, despite their very different
viscoelastic properties. During tack and peel strength tests, the PSAs with larger Mc and
Mw could not wet the substrate as well as their similar gel content counterparts with
smaller Mc and Mw, due to their larger elastic moduli at the bonding frequency (G’(ω2)).
Meanwhile, they could have experienced much larger strains during the debonding
process, due to their improved capability for elongation. This negative effect of less
wetting on tack and peel strength counterbalanced by the positive effect of larger strain,
therefore resulted in similar tack and peel strength readings. In summary, at similar gel
contents, shear strength could be significantly improved at no sacrifice to tack and peel
strength by improving the entanglement between polymer chains in the PSAs.
5.5 Acknowledgements
The authors thank the Natural Science and Engineering Research Council (NSERC) of
Canada and Omnova Solutions Inc. for financial support.
Chapter 5
167
5.6 References
1. Jovanovic R., Dubé, M. A., Journal of Macromolecular Science. Polymer Review
2004, C44(1): 1-51.
2. Benedek I., Pressure-Sensitive Adhesives and Applications 2004, 2nd edition,
Marcel Dekker, Inc., New York.
3. Qie L., Dubé M. A., International Journal of Adhesion and Adhesives 2010, 30:
654-664.
4. Bouvier-Fontes L., Pirri R., Asua J. A., Macromolecules 2005, 38: 1164-1171.
5. Chauvet J., Asua J. A., Leiza J. R., Polymer 2005, 46 : 9555-9561.
6. Plessis C., Arzamendi G., Leiza J. R., Journal of Polymer Science Part A: Polymer
Chemistry 2001, 39: 1106-1119.
7. Verdier C, Piau J. M., Benyahia L., Journal of Adhesion 1998 68: 93-116.
8. Lakrout H., P. Sergot P., C. Creton C., Journal of Adhesion 1999, 69: 307-359.
9. Deplace F., Carelli C., Mariot S., Journal of Adhesion 2009, 85: 18-54.
10. Zosel A., Colloid and Polymer Science 1985, 263: 541-553.
11. Chang E. P., Journal of Ahesion 1997, 60: 233-248.
12. Chang E. P., Journal of Adhesion 1991, 34: 189-200.
13. Christensen S. F., Flint S. C., Journal of Adhesion 2000, 72: 177-207.
14. Gibert F. X., Allal A., Marin G., Journal of Adhesion Science and Technology
1999, 13: 1029-1044.
15. Yarusso D. J., J. Adhesion 1999, 70, p. 299.
16. Ferry J. D., Viscoelastic Properties of Polymers 1980, 3rd edition, John Wiley &
Sons, Inc., New York.
Chapter 5
168
17. Lindner A.; Lestriez B.; Mariot S. J., Journal of Adhesion 2006, 82: 267-310.
18. Zosel A., International Journal of Adhesion and Adhesives 1998, 18: 265-271.
19. Zosel A., Ley G., Macromolecules 1993, 26: 2222-2227.
20. Shen H. Z., Zhang J. Y., S. Liu S. J., Journal of Applied Polymer Science. 2008,
107: 1793-1802.
21. Plessis C., Arzamendi G., Leiza J. R., Macromolecules 2000, 33: 5041-5047.
22. Gower M. D., Shanks R. A., Journal of Applied Polymer Science 2004, 93: 2909-
2917.
23. Bouvier-Fontes L., Pirri R., Asua J. M., Journal of Polymer Science Part A:
Polymer Chemistry 2005, 43: 4684-4694.
24. Qie L., Dubé M. A, European Polymer Journal 2010, 46: 1225-1236.
25. Pressure Sensitive Tape Council, Test Methods for Pressure Sensitive Adhesive
Tapes 2004, Northbrook, Illinois.
26. Bouvier-Fontes L., Pirri L. R., Magnet S., Macromolecules 2005, 38: 2722-2728.
27. Tobing S. D., Klein A., Journal of Applied Polymer Science 2001, 79: 2230-2244.
28. Dealy J. M., Larson R. G., Structure and Rheology of Molten Polymers: From
Structure to Flow Behavior and Back Again 2006, 1st edition, Hanser Gardner
Publications, München, German.
29. Yarusso D. J., Ma J., Rivard R. J., Proceeding of the 22nd Annual Meeting of the
Adhesion Scociety 1999, Panama City Beach, 72.
30. Yang H. W. H., Chang E. P., Trends in Polymer Science 1997, 5: 380-384.
31. Tse M. F., Journal of Adhesion Science and Technology 1989, 3: 551-570.
32. Benyahia L., Verdier C., Piau J. M., Journal of Adhesion 1997, 62: 45-73.
Chapter 5
169
33. Brandrup J., Immergut E.H., Grulke E.A., Polymer Handbook 1999, 4th Edition,
John Wiley & Sons.
CHAPTER 6
INFLUENCE OF POLYMER MICROSTRUCTURE OF
LATEX-BASED PRESSURE SENSITIVE ADHESIVES ON
THE PERFORMANCE OF POST-TREATED PSAS
________________________________________________
Chapter 6
171
Influence of Polymer Microstructure of Latex-based Pressure Sensitive Adhesives
on the Performance of Post-treated PSAs
Lili Qie and Marc A. Dubé*
Department of Chemical and Biological Engineering,
Centre for Catalysis Research and Innovation,
University of Ottawa, 161 Louis Pasteur Pvt., Ottawa, Ontario, Canada K1N 6N5
Abstract
Latex-based butyl acrylate (BA)/acrylic acid (AA)/2-hydroxyethyl methacrylate (HEMA)
pressure sensitive adhesive (PSA) films with various microstructures were heated in
order to improve their performance. The treated PSA films showed significantly better
performance than original latex-based PSA films with similar polymer microstructures.
The effect of the heat treatment depended on the polymer microstructure of the untreated
PSA films. Decreasing the amount of very small sol polymers (i.e., <2Me) or very large
sol polymers (i.e., >20Me) in the untreated PSA films led to treated PSA films with
significantly better performance. In addition, simultaneously increasing the size of the sol
polymer (Mw) as well as the size of the chain segments between cross-linking points (Mc)
of the gel polymer in the original PSAs resulted in treated PSA films with better
performance.
Chapter 6
172
6.1 Introduction
Pressure sensitive adhesives (PSAs) are viscoelastic materials. They can stick to a
substrate even if only a very small force is exerted upon them. PSA performance is
generally evaluated by tack, peel strength and shear strength. Tack measures how well a
PSA can bond to a substrate under very short contact time and very small contact force.
Peel strength evaluates how strong a PSA can bond to a substrate by peeling it off the
substrate. Shear strength characterizes its capability to resist deformation under shear
force. In general, an increase in shear strength corresponds to a decrease in tack and peel
strength. The reason is that to increase shear strength, the cohesive strength of the PSA
must be improved; however, this will lower the PSA’s capability to deform and flow, and
accordingly, the PSA’s capability to wet the substrate.
According to their method of production, PSAs can be classified into three
categories: solvent-based, hot melt, and water-based PSAs. Solvent-based PSA films are
made by casting a polymer solution, hot melt PSAs by casting melt polymers, and water-
based PSAs by casting latexes generated via emulsion or suspension polymerization. It is
well known that solvent-based PSAs tend to have much better performance than latex-
based PSAs (e.g., much larger shear strength at similar tack and peel strength levels).
This is because the gel network is continuous in solvent-based PSAs but discontinuous in
latex-based PSAs.[1] Due to their better performance, solvent-based PSAs are widely used
in some applications where large shear strengths are needed.
Since the production and use of latex-based PSAs is more environmentally
friendly than that of solvent-based PSAs, significant effort has been made in order to
improve the performance of latex-based PSAs so that they can replace their solvent-based
Chapter 6
173
counterparts in some applications. The commonly used method for improving the
performance of latex-based PSAs is to produce PSAs with functional groups and then
post-treat these PSAs to encourage the reaction of these functional groups and transform
the discrete gel into a continuous gel structure. Most efforts have been focused on the
optimization of the functional groups to simplify the post-treatment process.[2-8] The
performance of the post-treated PSA is also related to the polymer microstructure of the
original latex-based PSA. To our knowledge, only two such studies have been
reported.[1,9] In these two publications, Tobing et al.[1,9] studied the influence of Mw
(weight-average molecular weight of sol polymers) and Mc (molecular weight between
two adjacent cross-linking points) of the original latex-based PSAs on the performance of
treated PSAs. It was found that for gel-free latex-based PSAs, if Mw was larger than 2Me,
then a continuous gel network could form in its corresponding treated PSAs. As for gel-
containing PSAs, if they had Mw larger than 2Me but smaller or close to 20Me as well as
Mc larger than Me, then their discrete microgels could become a continuous gel network
by post-treatment. Under the above two conditions, the treated PSAs showed
significantly larger shear strength than the untreated PSAs with similar polymer
microstructure. However, up to now, the performance of the post-treated PSAs has not
been improved to the same level as that of the solvent-based PSAs with similar polymer
properties. Therefore more research is still needed to improve the performance of latex-
based PSAs via post-treatment.
This study focuses on improving the performance of post-treated latex-based PSA
films by optimizing the polymer properties of the original PSAs. Mw is only an average
number and cannot reflect the entire molecular weight distribution of sol polymers. Thus,
Chapter 6
174
the influence of the amount of very small sol polymers and very large sol polymers was
studied. In addition, similar gel content PSAs with different Mc and Mw were used to
study if simultaneously increasing Mc and Mw could lead to the formation of a more
perfect gel network in the treated PSAs, and accordingly, larger shear strengths for the
treated PSAs.
6.2 Experimental methods
6.2.1 Materials
Butyl acrylate (BA), acrylic acid (AA), 2-hydroxyl methacrylate (HEMA), and methyl
methacrylate (MMA) monomers, allyl methacrylate (AMA) cross-linker, 1-dodecanethiol
(NDM) chain transfer agent (CTA), sodium dodecyl sulphate (SDS) surfactant, sodium
bicarbonate (NaHCO3) buffer, potassium persulfate (KPS) initiator and hydroquinone
(HQ) inhibitor were all obtained from Sigma Aldrich and were used as supplied. All the
above materials were reagent grade except HEMA, which had a purity of 97 wt%.
Distilled deionized (DDI) water was used throughout the study. Ammonia (30 wt% in
H2O for pH control) was obtained from British Drug House. All solvents used in the
polymer characterization such as tetrahydrofuran (THF, HPLC grade, EMD Chemicals),
toluene (99.8%, Fisher Scientific) and di-iodomethane (99%, Sigma-Aldrich), were also
used as supplied by the manufacturer. Nitrogen gas (Linde Canada) was used to purge the
reactor. PTFE porous membranes with pore size of 0.2 μm, for use in gel content
measurements, were purchased from Cole-Parmer Canada.
Chapter 6
175
6.2.2 Latex preparation
All the BA/AA/HEMA (weight ratio: 96/2/2) latexes used for making PSA films were
produced via a starved seeded semi-batch emulsion polymerization approach. The
polymerization process included three stages: a short batch stage to make seed latexes, a
long feeding stage to further grow the latex particles, and a short cook stage to fully react
the remaining monomers in the latexes. The detailed polymerization process and recipes
with respect to production of these latexes were provided in Chapter 5. The
microstructure of the latex polymers was controlled by varying the amount of CTA and
cross-linker used during the feeding stage of the polymerization process. After
polymerization, hydroquinone was added to the latex to stop the reaction. A certain
amount of ammonia and DDI-water was added to adjust the pH to ~5.5 and a solids
content of ~45 wt%.
6.2.3 Preparation of original and post-treated PSA films
To prepare the original PSA films, two steps were taken. First, latexes were coated on a
50 μm thick Mylar sheet with a 30# Meyer rod to make PSA films with thicknesses of
~33μm. Then the films were dried and conditioned (24 h at 23oC and relative humidity of
50%) before being tested. To prepare the post-treated PSA films, the conditioned films
were heated via two steps: (1) heating at 90oC for 10 min in order to remove the
remaining water in the PSAs; (2) heating at a higher temperature (e.g., 120 or 126oC) in
order for the carboxyl and hydroxyl groups from AA and HEMA units to react. These
two temperatures were chosen because it was found that at lower temperatures (e.g.,
100oC) the reaction was very slow, while at higher temperatures (e.g., 140oC) visible
Chapter 6
176
shrinkage of the backing material of the PSA film (i.e., Mylar sheet) was observed. The
post-treated PSA films were also conditioned (24 h at 23oC and relative humidity of 50%)
prior to testing.
6.2.4 Characterization Methods
A contact angle method was used to measure the surface tension of the PSA films with
VCA Optima contact angle equipment from AST Products Inc. DDI water and di-
iodomethane were used as the testing liquids with known surface tensions.
The PSA film surfaces were imaged by atomic force microscopy (AFM) in
tapping mode using a Multimode Scanning Probe Microscope (Veeco Instruments) and
silicon cantilevers (Vistaprobes from NanoScience Instruments). The tip of the cantilever
had a pyramidal geometry and the tip radius was 10 nm. The cantilevers had a resonant
frequency of 300 kHz with a spring constant of 40 N/m. Height and phase images were
taken in air at ambient temperature. The scan speed was about 0.9 Hz and the scanned
area was about 5 μm x 5 μm.
The detailed testing procedures for gel content, Mc, Mw and Me measurement
were described previously in Chapter 5. The tack, peel strength and shear strength were
measured according to the Pressure Sensitive Tape Council standards PSTC-6, PSTC-1
and PSATC-7, respectively.[10] Details of the testing procedures were also provided
previously.[11] In this study, the shear strength was measured using two contact areas: 1”
x 1” and ½” x ½”, because it was found that with a contact area of 1” x 1”, most of the
heated PSAs showed shear strengths too large to be measured within a reasonable time
period (e.g., >1 month).
Chapter 6
177
6.3 Results and Discussion
The goal of this study was to improve the performance of post-treated latex-based PSAs
by optimizing the polymer microstructure of the original PSAs. For this purpose, a series
of BA/AA/HEMA latexes with a variety of polymer microstructures was produced for the
preparation of PSA films. The polymer properties of these latexes are shown in Table 6.1.
These latexes were produced via two different techniques: one by varying the amount of
CTA in the absence of cross-linker; the other by using CTA and cross-linker
simultaneously. From Table 6.1, one can see that some of these latexes had very
interesting microstructures (e.g., similar gel content but different Mc and Mw). The
reasons for the formation of such unique latex polymer microstructures were provided
previously in Chapter 5. In this study, the PSA films were named as follows: (1) the
original PSA films were named after their latex ID followed by a “B”, which identifies
that the latex had a pH of ~5.5. “B” was added in order to be consistent with the naming
method used previously in Chapter 5; (2) the post-treated PSA films were named after
their respective latex ID and pH as well as the heating condition. For example, PSA 5B-
H126/11 refers to the PSA film cast from latex 5 with a pH of ~5.5 and heated at 126oC
for 11 min.
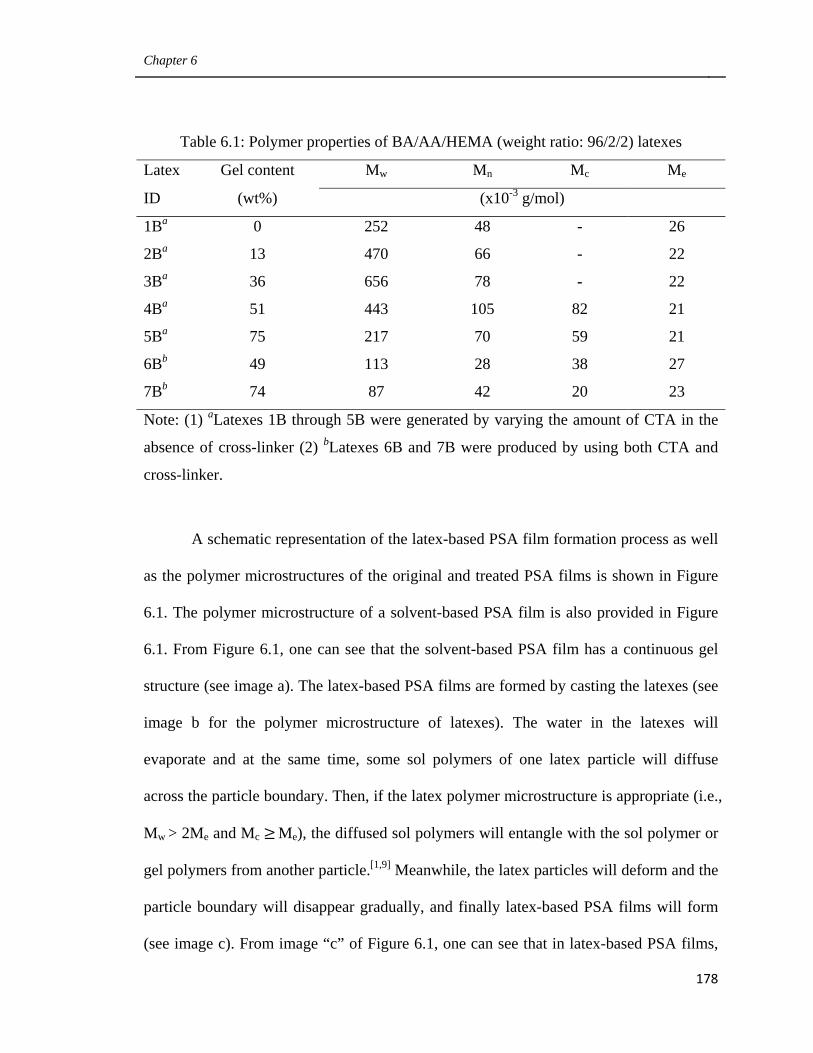
Chapter 6
178
Table 6.1: Polymer properties of BA/AA/HEMA (weight ratio: 96/2/2) latexes
Latex Gel content Mw Mn Mc Me
ID (wt%) (x10-3 g/mol)
1Ba 0 252 48 - 26
2Ba 13 470 66 - 22
3Ba 36 656 78 - 22
4Ba 51 443 105 82 21
5Ba 75 217 70 59 21
6Bb 49 113 28 38 27
7Bb 74 87 42 20 23
Note: (1) aLatexes 1B through 5B were generated by varying the amount of CTA in the
absence of cross-linker (2) bLatexes 6B and 7B were produced by using both CTA and
cross-linker.
A schematic representation of the latex-based PSA film formation process as well
as the polymer microstructures of the original and treated PSA films is shown in Figure
6.1. The polymer microstructure of a solvent-based PSA film is also provided in Figure
6.1. From Figure 6.1, one can see that the solvent-based PSA film has a continuous gel
structure (see image a). The latex-based PSA films are formed by casting the latexes (see
image b for the polymer microstructure of latexes). The water in the latexes will
evaporate and at the same time, some sol polymers of one latex particle will diffuse
across the particle boundary. Then, if the latex polymer microstructure is appropriate (i.e.,
Mw > 2Me and Mc Me), the diffused sol polymers will entangle with the sol polymer or
gel polymers from another particle.[1,9] Meanwhile, the latex particles will deform and the
particle boundary will disappear gradually, and finally latex-based PSA films will form
(see image c). From image “c” of Figure 6.1, one can see that in latex-based PSA films,
Chapter 6
179
the gel is discrete, and the small microgel polymers are connected together by the sol
polymer chains via entanglement. Actually, this is the best scenario, and in some cases,
the microgels cannot be entangled together. The discrete gel structure is the cause for the
lower shear strength of latex-based PSA films, compared with that of solvent-based PSA
films. If the latex-based PSA polymer contains certain functional groups, then by post-
treating the PSA film, some entanglement points can be transformed into cross-linking
points (see image d). As a result, the discrete gel structure will be turned into a more
continuous gel network and the shear strength will be greatly improved. Meanwhile, from
image “d” of Figure 6.1, one can see that the continuous gel structure in the treated PSAs
is not necessarily uniform. Weak points often exist around the edge of the original
microgels in the treated PSAs if the microgels were not originally connected via a
sufficient number of cross-linking points. The presence of these weak points can lead to a
decrease in the cohesive strength of the treated PSA films, and thus a decrease in shear
strength. In order to improve the performance of the treated PSA films, these weak points
in their continuous gel network must be eliminated. The way to achieve this is to
optimize the polymer properties of the untreated PSA films, so that the microgels will be
very well entangled and consequently in the treated PSA films the original microgels will
be connected via a sufficient number of cross-linking points.
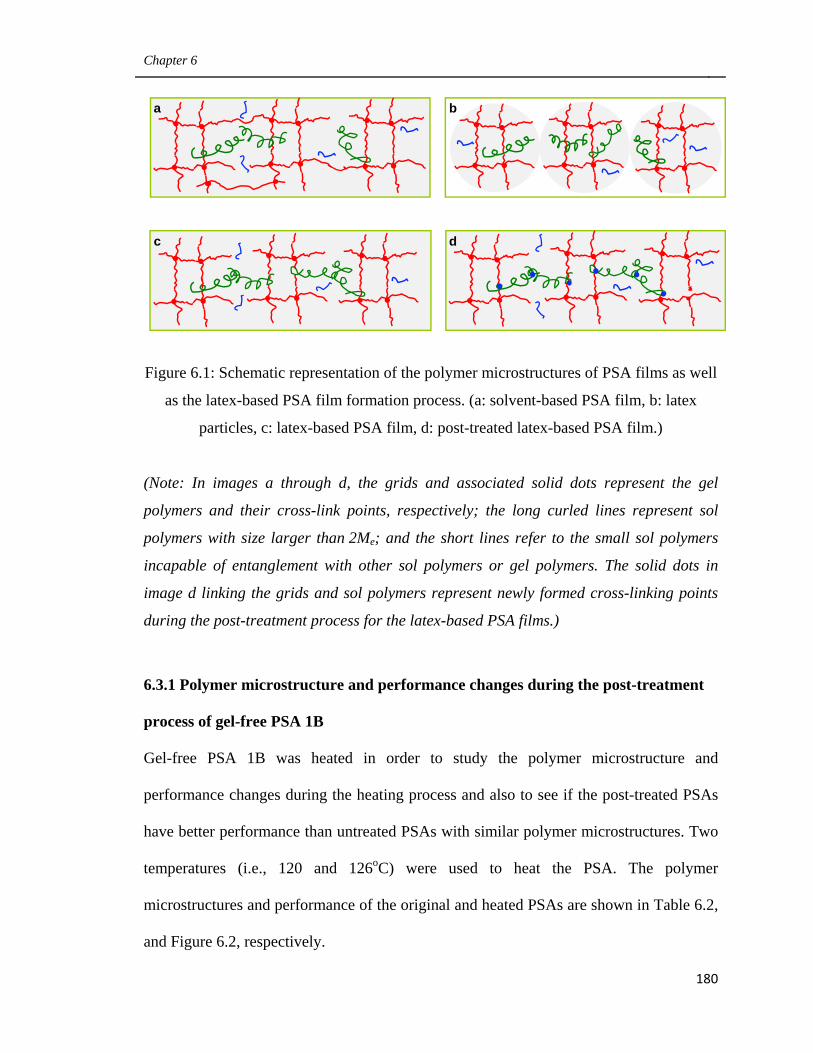
Chapter 6
180
Figure 6.1: Schematic representation of the polymer microstructures of PSA films as well
as the latex-based PSA film formation process. (a: solvent-based PSA film, b: latex
particles, c: latex-based PSA film, d: post-treated latex-based PSA film.)
(Note: In images a through d, the grids and associated solid dots represent the gel
polymers and their cross-link points, respectively; the long curled lines represent sol
polymers with size larger than 2Me; and the short lines refer to the small sol polymers
incapable of entanglement with other sol polymers or gel polymers. The solid dots in
image d linking the grids and sol polymers represent newly formed cross-linking points
during the post-treatment process for the latex-based PSA films.)
6.3.1 Polymer microstructure and performance changes during the post-treatment
process of gel-free PSA 1B
Gel-free PSA 1B was heated in order to study the polymer microstructure and
performance changes during the heating process and also to see if the post-treated PSAs
have better performance than untreated PSAs with similar polymer microstructures. Two
temperatures (i.e., 120 and 126oC) were used to heat the PSA. The polymer
microstructures and performance of the original and heated PSAs are shown in Table 6.2,
and Figure 6.2, respectively.
d
a b
c

Chapter 6
181
Table 6.2: Polymer microstructures of the original and heated PSA 1B
PSA ID Gel content Mw Mn MWD
(wt%) (x10-3 g/mol)
1B 0 252 48 5.2
1B-H120/11 8 532 84 6.3
1B-H120/21 15 643 88 7.3
1B-H120/30 38 425 75 5.7
1B-H126/11 10 534 101 5.3
1B-H126/16 25 424 100 4.2
1B-H126/21 30 382 86 4.4
From Figure 6.2-A, one can see that at a given heating temperature, with the
increase in heating time, the gel content increased (e.g., from 0 to 38 wt% at 120oC).
From Table 6.2, one can see that with the increase in gel content, Mw first increased to a
maximum at a very small gel content (i.e., 15 wt% at 120oC) and then decreased. This
trend in Mw with increasing gel content observed with the heated PSAs was the same as
that observed with the original PSAs (i.e., 1B-5B) discussed in Chapter 5. Through the
reaction between the carboxyl and hydroxyl groups from the AA and HEMA units, two
or more polymer chains could be chemically bonded and form one larger polymer chain.
If the resulting polymer was sufficiently large, it would become gel polymer; otherwise,
it would be sol polymer. If the heating time was not sufficient, most of the sol polymers
grew into larger sol polymers while a small amount of them grew into gel polymers.
Hence, Mw increased with the increase in gel content. Further increasing the heating time,
a significant amount of gel polymers were formed in the treated PSAs, resulting in an
increase in gel content. These gel polymers in the treated PSAs were mainly from the
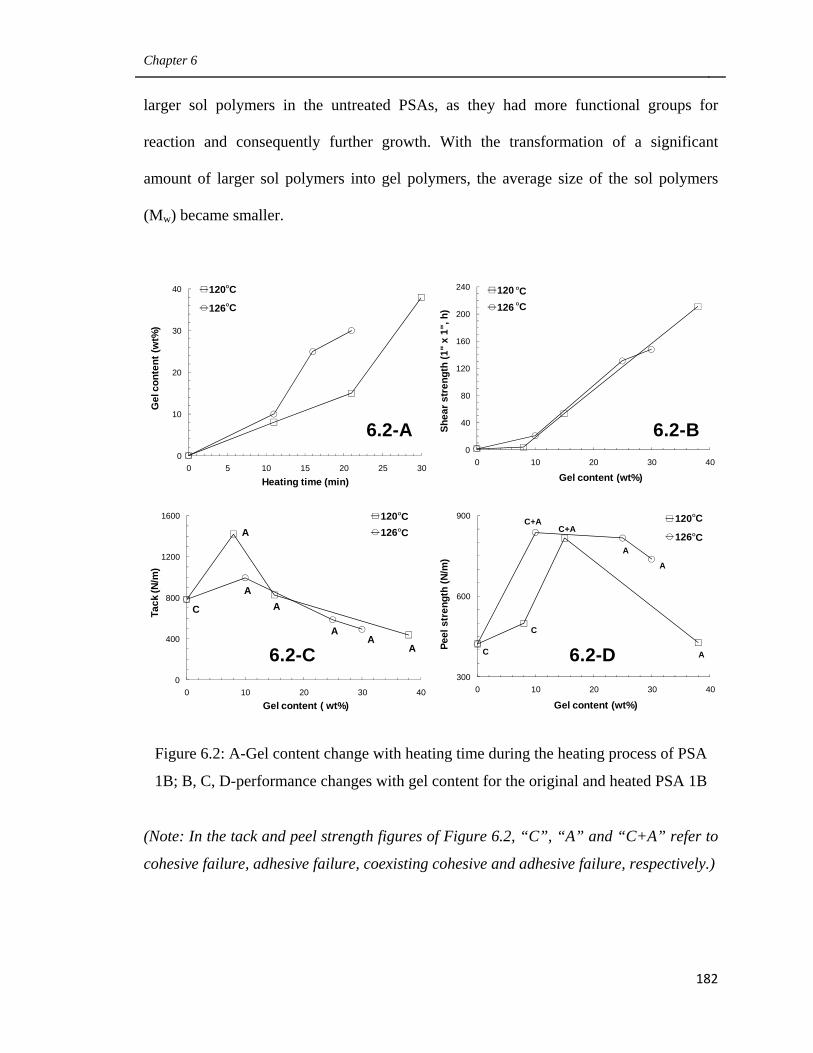
Chapter 6
182
larger sol polymers in the untreated PSAs, as they had more functional groups for
reaction and consequently further growth. With the transformation of a significant
amount of larger sol polymers into gel polymers, the average size of the sol polymers
(Mw) became smaller.
Figure 6.2: A-Gel content change with heating time during the heating process of PSA
1B; B, C, D-performance changes with gel content for the original and heated PSA 1B
(Note: In the tack and peel strength figures of Figure 6.2, “C”, “A” and “C+A” refer to
cohesive failure, adhesive failure, coexisting cohesive and adhesive failure, respectively.)
0
10
20
30
40
0 5 10 15 20 25 30
Gel
con
tent
(wt%
)
Heating time (min)
120
126
OCOC
0
40
80
120
160
200
240
0 10 20 30 40
Shea
r str
engt
h (1
" x
1", h
)
Gel content (wt%)
120126
OCOC
0
400
800
1200
1600
0 10 20 30 40
Tack
(N/m
)
Gel content ( wt%)
120126
OC
C
A
AA
AA
A
OC
300
600
900
0 10 20 30 40
Peel
str
engt
h (N
/m)
Gel content (wt%)
120
126OC
C A
A
C+AC+A
A
C
OC
6.2-A 6.2-B
6.2-C 6.2-D
Chapter 6
183
Figures 6.2-B, 6.2-C and 6.2-D show that with the increase in gel content, the
shear strength increased; while tack and peel strength displayed maxima. This PSA
performance trend with increasing gel content is very similar to that previously observed
with the unheated latex-based PSAs 1B through 5B in Chapter 5. With the increase in gel
content, the cohesive strength of the PSA films was enhanced, resulting in larger shear
strength. Meanwhile, larger cohesive strength decreased the PSAs’ deformability and
flow ability, and led to less wetting of the PSA films on the substrate during the bonding
process. In addition, the higher gel content lowered the PSA’s capability for
elongation,[12] and consequently the PSAs with a larger gel content could experienced a
much smaller strain[13-14], compared to the PSAs with a lower gel content. Accordingly,
the PSAs with larger gel content dissipated a smaller amount of energy during the
debonding process. Less wetting as well as less dissipated energy led to a general
decrease in tack and peel strength with increasing gel content. The special case of tack
and peel strength increases with gel content observed at very low gel contents (e.g., from
0 to 15 wt%) can be explained as follows: (1) due to the very small gel content, the
negative effect of gel on decreasing the PSAs’ elongation capability was negligible; (2)
when the gel content was low, the Mw increased with gel content as discussed earlier. The
increase in Mw endowed the higher gel content PSAs with larger elongation capability
compared to the lower gel content PSAs. Consequently, the larger gel content PSAs
could have experienced larger strain and dissipated a larger amount of energy during the
debonding process. For these very low gel content PSAs, the positive effect of a larger
amount of dissipated energy on tack and peel strength might have counterbalanced the
Chapter 6
184
negative effect of less wetting, hence the tack and peel strength increased with gel
content.
6.3.2. Comparison of the performance of post-treated PSAs generated from PSA 1B
to those of original latex-based PSAs 3B and 4B
The post-treated PSA films (i.e., 1B-H126/16 and 1B-H120/30) were compared to
original PSA films 3B and 4B with respect to their polymer microstructure and
performance in order to see whether the treated PSA films had better performance than
the original ones with similar polymer microstructure. The polymer properties and
performance of these PSAs are shown in Table 6.3 and Figure 6.3, respectively.
Table 6.3: Polymer properties of PSA films 3B, 4B, 1B-H126/16 and 1B-H120/30
PSA Gel content Mw Mn Mc Me
ID (wt%) (x10-3 g/mol)
3B 36 656 78 - 22
4B 51 443 105 82 21
1B-H126/16 25 424 100 - -
1B-H120/30 38 425 75 - -
From Table 6.3 and Figure 6.3, one can see that at a lower gel content, the post-
treated PSA (i.e.,1B-H126/16, 25 wt% gel), showed significantly larger shear strength as
well as larger tack and peel strength than the original PSAs 3B and 4B with higher gel
contents (i.e., 3B: 36 wt%, 4B: 51 wt%). The better performance of the treated PSA was
related to its unique microstructure. Since PSA 1B was gel free and had Mw > 2Me (see
Table 6.1), the gel network in its corresponding treated PSAs should be continuous, while
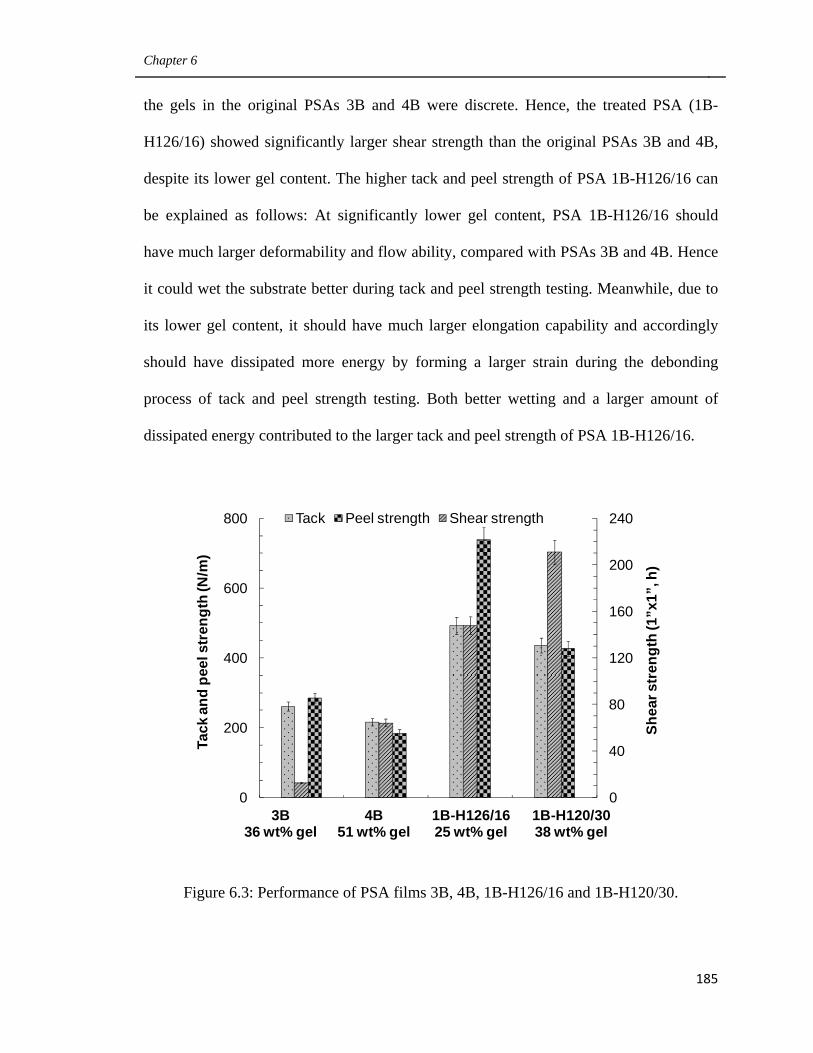
Chapter 6
185
the gels in the original PSAs 3B and 4B were discrete. Hence, the treated PSA (1B-
H126/16) showed significantly larger shear strength than the original PSAs 3B and 4B,
despite its lower gel content. The higher tack and peel strength of PSA 1B-H126/16 can
be explained as follows: At significantly lower gel content, PSA 1B-H126/16 should
have much larger deformability and flow ability, compared with PSAs 3B and 4B. Hence
it could wet the substrate better during tack and peel strength testing. Meanwhile, due to
its lower gel content, it should have much larger elongation capability and accordingly
should have dissipated more energy by forming a larger strain during the debonding
process of tack and peel strength testing. Both better wetting and a larger amount of
dissipated energy contributed to the larger tack and peel strength of PSA 1B-H126/16.
Figure 6.3: Performance of PSA films 3B, 4B, 1B-H126/16 and 1B-H120/30.
0
40
80
120
160
200
240
0
200
400
600
800
1 2 3 4
Tack
and
pee
l str
engt
h (N
/m)
Tack Peel strength Shear strength
Shea
r str
engt
h (1
”x1”
, h)
3B36 wt% gel
4B51 wt% gel
1B-H126/1625 wt% gel
1B-H120/3038 wt% gel
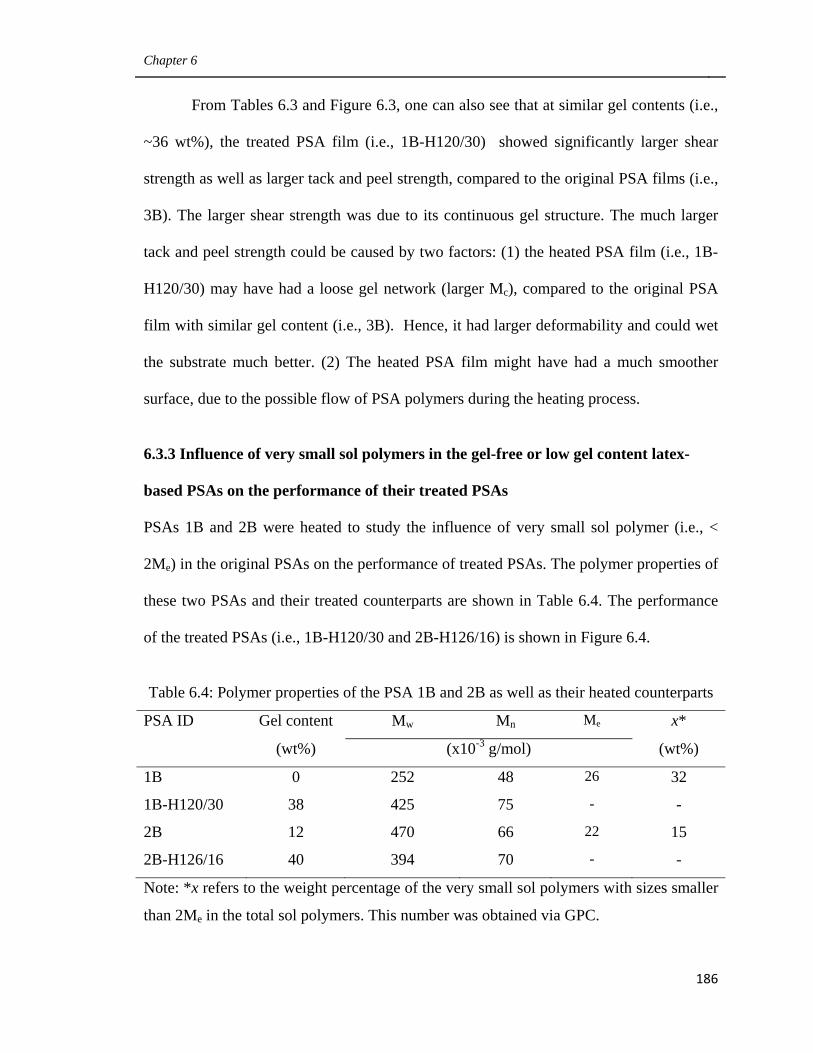
Chapter 6
186
From Tables 6.3 and Figure 6.3, one can also see that at similar gel contents (i.e.,
~36 wt%), the treated PSA film (i.e., 1B-H120/30) showed significantly larger shear
strength as well as larger tack and peel strength, compared to the original PSA films (i.e.,
3B). The larger shear strength was due to its continuous gel structure. The much larger
tack and peel strength could be caused by two factors: (1) the heated PSA film (i.e., 1B-
H120/30) may have had a loose gel network (larger Mc), compared to the original PSA
film with similar gel content (i.e., 3B). Hence, it had larger deformability and could wet
the substrate much better. (2) The heated PSA film might have had a much smoother
surface, due to the possible flow of PSA polymers during the heating process.
6.3.3 Influence of very small sol polymers in the gel-free or low gel content latex-
based PSAs on the performance of their treated PSAs
PSAs 1B and 2B were heated to study the influence of very small sol polymer (i.e., <
2Me) in the original PSAs on the performance of treated PSAs. The polymer properties of
these two PSAs and their treated counterparts are shown in Table 6.4. The performance
of the treated PSAs (i.e., 1B-H120/30 and 2B-H126/16) is shown in Figure 6.4.
Table 6.4: Polymer properties of the PSA 1B and 2B as well as their heated counterparts
PSA ID Gel content Mw Mn Me x*
(wt%) (x10-3 g/mol) (wt%)
1B 0 252 48 26 32
1B-H120/30 38 425 75 - -
2B 12 470 66 22 15
2B-H126/16 40 394 70 - -
Note: *x refers to the weight percentage of the very small sol polymers with sizes smaller
than 2Me in the total sol polymers. This number was obtained via GPC.
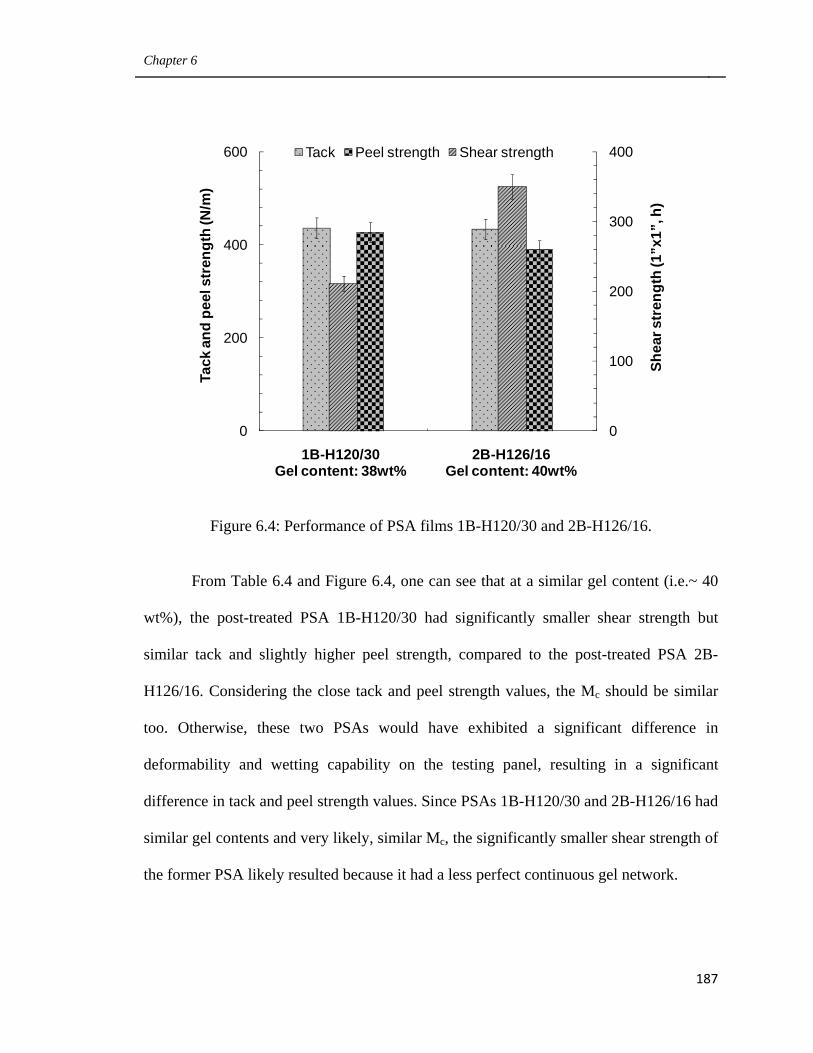
Chapter 6
187
Figure 6.4: Performance of PSA films 1B-H120/30 and 2B-H126/16.
From Table 6.4 and Figure 6.4, one can see that at a similar gel content (i.e.~ 40
wt%), the post-treated PSA 1B-H120/30 had significantly smaller shear strength but
similar tack and slightly higher peel strength, compared to the post-treated PSA 2B-
H126/16. Considering the close tack and peel strength values, the Mc should be similar
too. Otherwise, these two PSAs would have exhibited a significant difference in
deformability and wetting capability on the testing panel, resulting in a significant
difference in tack and peel strength values. Since PSAs 1B-H120/30 and 2B-H126/16 had
similar gel contents and very likely, similar Mc, the significantly smaller shear strength of
the former PSA likely resulted because it had a less perfect continuous gel network.
0
100
200
300
400
0
200
400
600
1 2
Tack
and
pee
l str
engt
h (N
/m)
Tack Peel strength Shear strength
Shea
r str
engt
h (1
”x1”
, h)
1B-H120/30Gel content: 38wt%
2B-H126/16Gel content: 40wt%
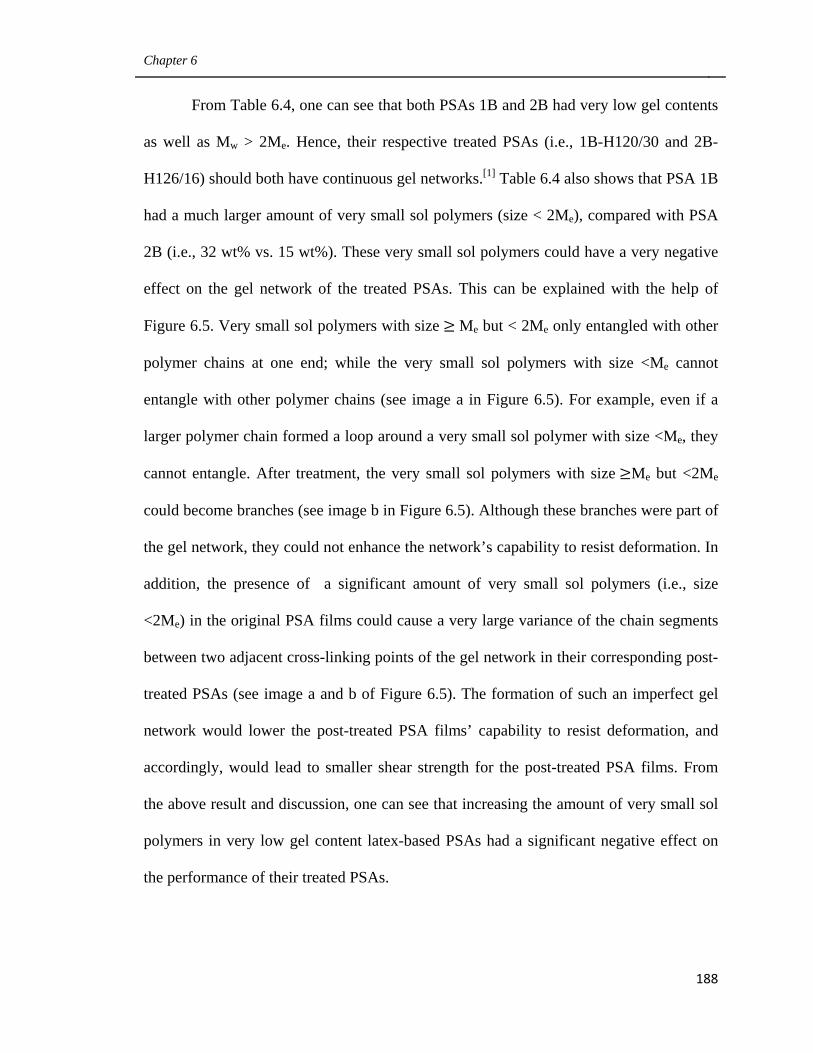
Chapter 6
188
From Table 6.4, one can see that both PSAs 1B and 2B had very low gel contents
as well as Mw > 2Me. Hence, their respective treated PSAs (i.e., 1B-H120/30 and 2B-
H126/16) should both have continuous gel networks.[1] Table 6.4 also shows that PSA 1B
had a much larger amount of very small sol polymers (size < 2Me), compared with PSA
2B (i.e., 32 wt% vs. 15 wt%). These very small sol polymers could have a very negative
effect on the gel network of the treated PSAs. This can be explained with the help of
Figure 6.5. Very small sol polymers with size Me but < 2Me only entangled with other
polymer chains at one end; while the very small sol polymers with size <Me cannot
entangle with other polymer chains (see image a in Figure 6.5). For example, even if a
larger polymer chain formed a loop around a very small sol polymer with size <Me, they
cannot entangle. After treatment, the very small sol polymers with size Me but <2Me
could become branches (see image b in Figure 6.5). Although these branches were part of
the gel network, they could not enhance the network’s capability to resist deformation. In
addition, the presence of a significant amount of very small sol polymers (i.e., size
<2Me) in the original PSA films could cause a very large variance of the chain segments
between two adjacent cross-linking points of the gel network in their corresponding post-
treated PSAs (see image a and b of Figure 6.5). The formation of such an imperfect gel
network would lower the post-treated PSA films’ capability to resist deformation, and
accordingly, would lead to smaller shear strength for the post-treated PSA films. From
the above result and discussion, one can see that increasing the amount of very small sol
polymers in very low gel content latex-based PSAs had a significant negative effect on
the performance of their treated PSAs.
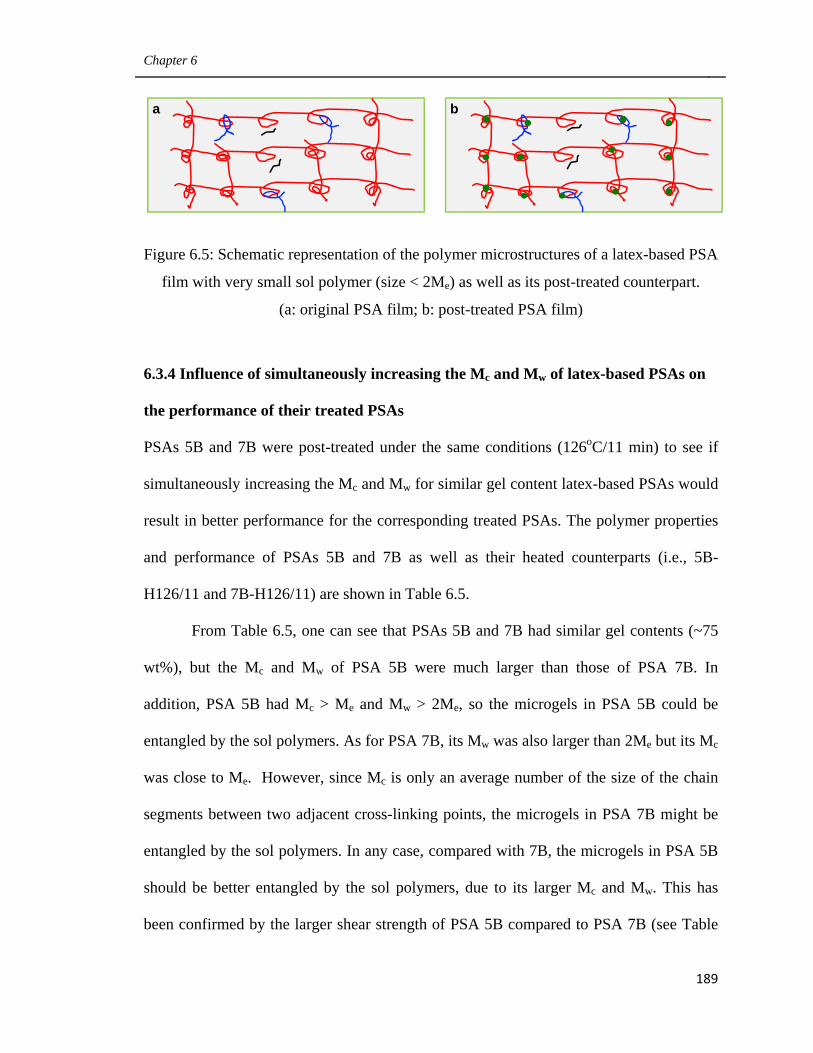
Chapter 6
189
Figure 6.5: Schematic representation of the polymer microstructures of a latex-based PSA
film with very small sol polymer (size < 2Me) as well as its post-treated counterpart.
(a: original PSA film; b: post-treated PSA film)
6.3.4 Influence of simultaneously increasing the Mc and Mw of latex-based PSAs on
the performance of their treated PSAs
PSAs 5B and 7B were post-treated under the same conditions (126oC/11 min) to see if
simultaneously increasing the Mc and Mw for similar gel content latex-based PSAs would
result in better performance for the corresponding treated PSAs. The polymer properties
and performance of PSAs 5B and 7B as well as their heated counterparts (i.e., 5B-
H126/11 and 7B-H126/11) are shown in Table 6.5.
From Table 6.5, one can see that PSAs 5B and 7B had similar gel contents (~75
wt%), but the Mc and Mw of PSA 5B were much larger than those of PSA 7B. In
addition, PSA 5B had Mc > Me and Mw > 2Me, so the microgels in PSA 5B could be
entangled by the sol polymers. As for PSA 7B, its Mw was also larger than 2Me but its Mc
was close to Me. However, since Mc is only an average number of the size of the chain
segments between two adjacent cross-linking points, the microgels in PSA 7B might be
entangled by the sol polymers. In any case, compared with 7B, the microgels in PSA 5B
should be better entangled by the sol polymers, due to its larger Mc and Mw. This has
been confirmed by the larger shear strength of PSA 5B compared to PSA 7B (see Table
a b

Chapter 6
190
6.5). (Note: The detailed explanations for the difference in polymer microstructure,
viscoelastic properties as well as performance between PSA 5B and 7B were provided
previously in Chapter 5.)
Note: aNo sign of shear failure was observed after 2 weeks.
Table 6.5 also shows that the treated PSA from 5B (i.e., 5B-H126/11) had a larger
gel content, smaller Mw and slightly smaller Mc compared to the original PSA 5B.
Similar polymer microstructure difference was observed by comparing PSA 7B-H126/11
to 7B. The decrease in Mw with increase in gel content resulted as larger sol polymers in
the original PSAs were more likely to undergo further growth and thereafter became part
of the gel network during the heating process due to their larger size and consequently,
the larger amount of functional groups present. The very small decrease in Mc observed
after post-treating PSA 5B (i.e., Mc: 59 and 53 kg/mol for 5B and 5B-H126/11,
Table 6.5: Polymer properties and performance of PSA 5B, 7B
and their heated counterparts
PSA ID Gel content Mw Mn Mc Me
(wt%) (x 103 kg/mol)
5B 75 217 70 59 21
5B-H126/11 81 161 78 53 -
7B 74 87 42 20 23
7B-H126/11 79 73 42 22 -
PSA ID Tack (N/m) Peel strength (N/m) Shear strength (h, 1/2” x 1/2”)
5B 176 104 1.10
5B-H126/11 280 190 >336 h (2 weeks)a
7B 154 87 0.70
7B-H126/11 209 118 292.80
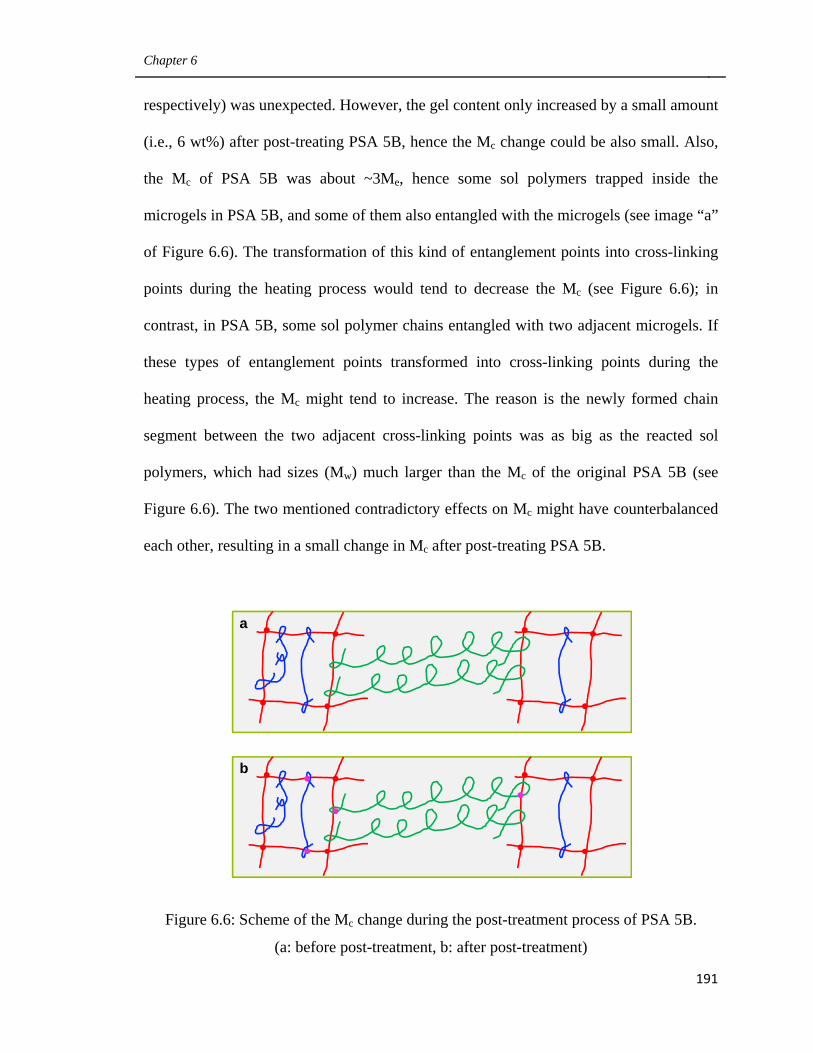
Chapter 6
191
respectively) was unexpected. However, the gel content only increased by a small amount
(i.e., 6 wt%) after post-treating PSA 5B, hence the Mc change could be also small. Also,
the Mc of PSA 5B was about ~3Me, hence some sol polymers trapped inside the
microgels in PSA 5B, and some of them also entangled with the microgels (see image “a”
of Figure 6.6). The transformation of this kind of entanglement points into cross-linking
points during the heating process would tend to decrease the Mc (see Figure 6.6); in
contrast, in PSA 5B, some sol polymer chains entangled with two adjacent microgels. If
these types of entanglement points transformed into cross-linking points during the
heating process, the Mc might tend to increase. The reason is the newly formed chain
segment between the two adjacent cross-linking points was as big as the reacted sol
polymers, which had sizes (Mw) much larger than the Mc of the original PSA 5B (see
Figure 6.6). The two mentioned contradictory effects on Mc might have counterbalanced
each other, resulting in a small change in Mc after post-treating PSA 5B.
Figure 6.6: Scheme of the Mc change during the post-treatment process of PSA 5B.
(a: before post-treatment, b: after post-treatment)
a
b
Chapter 6
192
Table 6.5 shows that after post-treating PSAs 5B and 7B, the shear strength
significantly increased, despite a small gel content change. For example, PSA 5B (gel
content: 75 wt%) had a shear strength of 1.1 h and PSA 5B-H126/11 (gel content: 81
wt%) exhibited a shear strength larger than two weeks at the same contact area. This
indicates that the discrete gel network had been changed into a continuous gel network
after post-treating PSAs 5B and 7B. In addition, from Table 6.5, one can see that at
similar gel content of about 80 wt%, PSA 5B-H126/11 had significantly larger shear
strength, compared to PSA 7B-H126/11, despite its larger Mc (looser gel network).
Clearly, a more perfect gel network was formed in PSA 5B-H126/11, compared to PSA
7B-H126/11. The reason behind this was that simultaneously increasing the Mc and Mw
for similar gel content latex-based PSAs, could let more sol polymers entangle with the
microgels and consequently the connection between the microgels were improved.
Accordingly, a more perfect continuous gel network would form in its corresponding
treated PSA, resulting in higher shear strength.
From Table 6.5, one could also see that after post-treating PSAs 5B and 7B, the
tack and peel strength were also significantly increased. For example, the tack and peel
strength was 170 and 104 N/m, respectively, for PSA 5B, and 280 and 190 N/m,
respectively for PSA 5B-H126/11. This increase in tack and peel strength with gel
content was unexpected, as it was found in a previous study that for BA/AA/HEMA
(weight ratio: 96/2/2) PSAs, the tack and peel strength decreased with increasing gel
content when the gel content was larger than about 15 wt% (see Chapter 5). It is
suspected that the PSA surface tension might have changed after post-treatment, since it
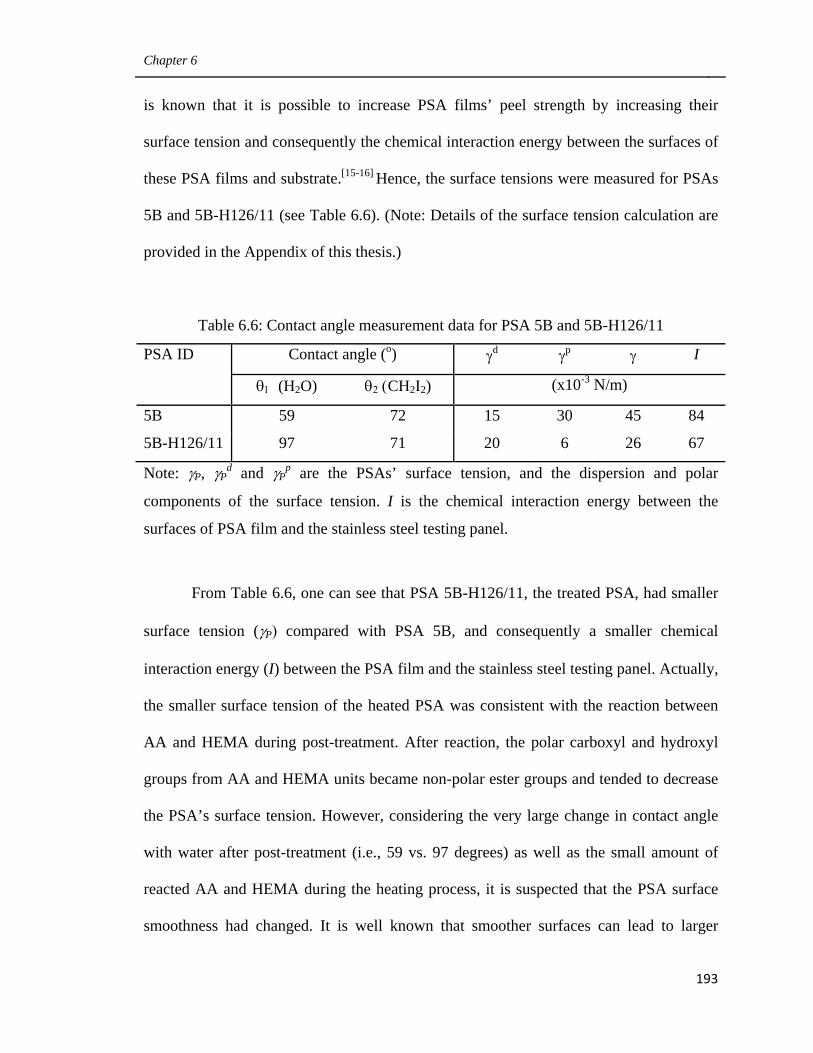
Chapter 6
193
is known that it is possible to increase PSA films’ peel strength by increasing their
surface tension and consequently the chemical interaction energy between the surfaces of
these PSA films and substrate.[15-16] Hence, the surface tensions were measured for PSAs
5B and 5B-H126/11 (see Table 6.6). (Note: Details of the surface tension calculation are
provided in the Appendix of this thesis.)
Table 6.6: Contact angle measurement data for PSA 5B and 5B-H126/11
PSA ID Contact angle (o) γd γp γ I
θ1 (H2O) θ2 (CH2I2) (x10-3 N/m)
5B 59 72 15 30 45 84
5B-H126/11 97 71 20 6 26 67
Note: γP, γPd and γP
p are the PSAs’ surface tension, and the dispersion and polar
components of the surface tension. I is the chemical interaction energy between the
surfaces of PSA film and the stainless steel testing panel.
From Table 6.6, one can see that PSA 5B-H126/11, the treated PSA, had smaller
surface tension (γP) compared with PSA 5B, and consequently a smaller chemical
interaction energy (I) between the PSA film and the stainless steel testing panel. Actually,
the smaller surface tension of the heated PSA was consistent with the reaction between
AA and HEMA during post-treatment. After reaction, the polar carboxyl and hydroxyl
groups from AA and HEMA units became non-polar ester groups and tended to decrease
the PSA’s surface tension. However, considering the very large change in contact angle
with water after post-treatment (i.e., 59 vs. 97 degrees) as well as the small amount of
reacted AA and HEMA during the heating process, it is suspected that the PSA surface
smoothness had changed. It is well known that smoother surfaces can lead to larger
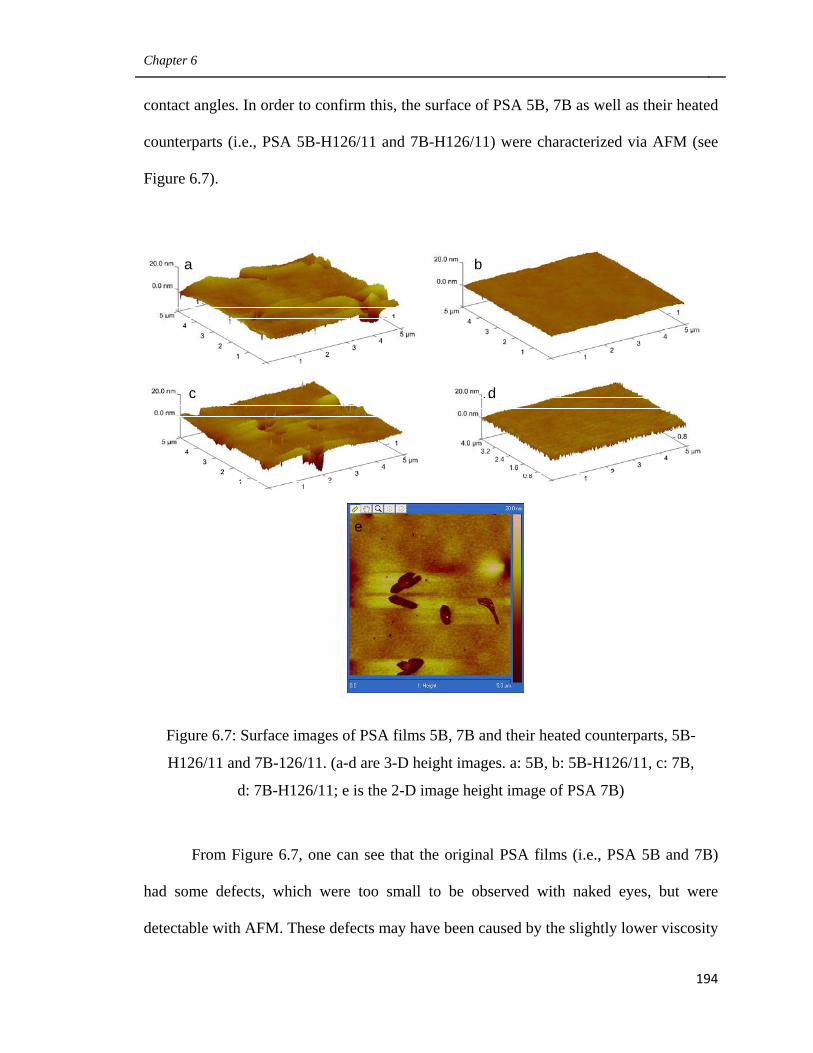
Chapter 6
194
contact angles. In order to confirm this, the surface of PSA 5B, 7B as well as their heated
counterparts (i.e., PSA 5B-H126/11 and 7B-H126/11) were characterized via AFM (see
Figure 6.7).
Figure 6.7: Surface images of PSA films 5B, 7B and their heated counterparts, 5B-
H126/11 and 7B-126/11. (a-d are 3-D height images. a: 5B, b: 5B-H126/11, c: 7B,
d: 7B-H126/11; e is the 2-D image height image of PSA 7B)
From Figure 6.7, one can see that the original PSA films (i.e., PSA 5B and 7B)
had some defects, which were too small to be observed with naked eyes, but were
detectable with AFM. These defects may have been caused by the slightly lower viscosity
d
a b
c
e
d
Chapter 6
195
of the latexes, or a very small amount of coagulated latex, which was too small to be
removed from the latexes via filtration. In contrast, the heated PSAs (i.e., PSA 5B-
H126/11 and 7B-H126/11) did not have these defects. In addition, the surfaces of the
heated PSAs were much smoother than those of the unheated ones. Apparently, the PSA
polymer flowed during the heating process, resulting in a smoother surface after post-
treatment. Hence the post-treated PSAs showed higher tack and peel strength than their
unheated counterparts. Moreover, comparing image “b” and “d” of Figure 6.7, one can
see that the surface of PSA 5B-H126/11 was much smoother, compared to that of PSA
7B-H126/11. This might also have contributed to the higher tack and peel strength of the
former PSA, in addition to their polymer microstructure differences mentioned earlier.
The smoother surface of PSA 5B-H126/11, can be explained as follows: Both PSA 5B
and 7B had a very large amount of gel polymer (~75 wt%), hence the property of their
gel polymers (i.e., Mc) should have a significant influence on the polymer flow during the
heating process. PSA 5B had a much looser gel structure (i.e., Mc: 59 kg/mol), compared
with PSA 7B (i.e., Mc: 20 kg/mol), hence the microgel polymer of PSA 5B should have
expanded more and thereafter flowed much more during the heating process. As a result,
the treated PSA from 5B (i.e., 5B-H126/11) showed a smoother surface, compared with
the treated PSA from 7B (i.e., 7B-H126/11).
From the above results, one can see that post-treatment can greatly improve the
performance of latex-based PSAs. Shear strength can be increased along with tack and
peel strength. In addition, simultaneously increasing the Mc and Mw for similar gel
content latex-based PSAs, could impart better performance of the treated PSAs (e.g.,
larger shear strength as well as larger tack and peel strength).
Chapter 6
196
6.3.5 Influence of increasing the amount of very small sol polymers in gel-containing
latex-based PSAs on the performance of their treated PSAs
PSAs 4B and 6B were post-treated under the same conditions (126oC/10 min) to study if
increasing the amount of very small sol polymer in gel-containing latex-based PSAs (i.e.,
size <2Me) could have a significant influence on the treated PSAs. The polymer
properties and performance of PSA 4B, 6B as well as their heated counter parts (PSA 4B-
H126/11 and 6B-H126/11) are shown in Table 6.7.
Note: (1): *x refers to the weight percentage of the sol polymers with size smaller than
2Me in the total sol polymers. (2) a5B was used as the control sample to compare the
performance of latex-based PSAs with that of the post-treated PSAs.
Table 6.7: Polymer properties and performance of PSA 4B, 6B
and their heated counterparts as well as 5B
PSA ID Gel content Mw Mn Mc Me x*
(wt%) (x 103 kg/mol) (wt%)
4B 51 443 105 82 21 10
4B-H126/11 70 216 73 - - -
6B 49 113 28 38 27 48
6B-H126/11 63 109 43 - - -
5Ba 75 217 70 59 21 -
PSA ID Tack (N/m) Peel strength (N/m) Shear strength (h, 1/2” x 1/2”)
4B 216 185 0.52
4B-H126/11 323 236 11.30
6B 223 203 0.13
6B-H126/11 450 270 5.10
5Ba 176 104 1.10
Chapter 6
197
From Table 6.7, one can see that PSAs 4B and 6B both had Mw larger than 2Me
and Mc larger than Me. Hence the microgels could be entangled by the sol polymers in
both PSAs. In addition, PSAs 4B and 6B had similar gel contents, but PSA 4B had a
much larger Mc and Mw compared to PSA 6B. This is similar to the comparison of PSA
5B to 7B. Another significant difference between PSA 4B and 6B was that PSA 4B had a
much smaller amount of very small sol polymers (i.e., size <2Me) (i.e., 10 wt% vs. 48
wt% of the total sol polymers, see Table 6.7). Obviously, due to the larger Mc and Mw as
well as a much smaller amount of very small sol polymers, PSA 4B should have had a
better entanglement between the sol polymers and microgels, compared to PSA 6B. This
is consistent with the significantly larger shear strength of PSA 4B (i.e., 0.52 h vs. 0.13
h). (Note: The detailed explanations with respect to the different microstructures,
viscoelastic properties and performance between PSAs 4B and 6B were provided in
Chapter 5.)
Table 6.7 also shows that after heating, PSAs 4B and 6B showed increase in gel
content and decreases in Mw. Moreover, from Tables 6.7 and 6.5, one can see that after
heating under the same conditions (126oC/11 min), PSAs 4B and 6B showed much larger
increases in gel content (i.e., 19 wt% and 14 wt%), compared with PSAs 5B and 7B (i.e.,
6 wt% and 5 wt%). This occurred because PSAs 4B and 6B had more sol polymers
available for further growth into gel polymers. In addition, from Table 6.7, one can see
that after heating PSAs 4B and 6B the films showed a significant increase in not only
shear strength but also tack and peel strength. Moreover, from Table 6.7, one can see that
the treated PSAs (4B-H126/11 and 6B-H126/11) showed significantly larger shear
strengths, compared to an original PSA with even much higher gel content (i.e., PSA 5B).
Chapter 6
198
This confirmed that the discrete microgels in PSAs 4B and 6B transformed into
continuous gel networks after post-treatment. In addition, the higher tack and peel
strength of the post-treated PSAs (i.e., 4B-H126/11 and 6B-H126/11) should also be due
to their smoother surfaces, compared with their respective untreated counterparts (i.e., 4B
and 6B).
From Table 6.7, one can see that after heating under the same conditions, PSA 4B
showed a larger increase in gel content (i.e., ~19 wt%), compared to PSA 6B (i.e., ~14
wt%). This was because PSA 6B has a significantly larger amount of very small sol
polymers (i.e., < 2Me), compared to 4B. Some of these very small sol polymers (i.e., <
Me) could not entangle with other polymer chains even at one end. Hence, during the
heating process, they could not react with other polymers and become gel. Table 6.7 also
showed that the heated PSA from 4B (i.e., 4B-H126/11) showed significantly larger shear
strength than the treated PSA from 6B (i.e., 6B-H126/11) (i.e., 11.30 vs. 5.10 h). As the
gel content difference between these two treated PSAs was small (i.e., 7 wt%), the
significantly larger shear strength of PSA 4B-H126/11 should correspond to a more
perfect continuous gel network compared to PSA 6B-H126/11. The formation of a less
perfect continuous gel network in PSA 6B-H126/11 could be explained as follows: The
presence of a significantly larger amount of very small sol polymers (i.e., < 2Me) in PSA
6B should have caused much less entanglement between the sol polymers and the
microgels, compared with PSA 4B. Accordingly, the gel network of the treated PSA from
6B (i.e., 6B-H126/11) had more weak points around the edges of the original microgels
compared to PSA 4B. Moreover, PSA 4B-H126/11 exhibited significantly smaller tack
compared to PSA 6B-H126/11 (323 vs. 450 /m). It is suspected that the larger gel content
Chapter 6
199
of PSA 4B-H126/11 only played a minor role in achieving its much smaller tack, as the
gel content difference between PSA 4B-H126/11 and 6B-H126/11 was very small (i.e., ~
7wt%). The much smaller tack of PSA 4B-H126/11 compared to PSA 6B-H126/11, was
likely due to its significantly higher surface roughness. This can be explained as follows:
There were equal amounts of sol and gel polymer in PSAs 4B and 6B (e.g., gel content:
~50 wt%). Considering the much larger mobility of the sol polymers, compared with the
microgel, the movement of sol polymers occurred during the heating process should have
principally caused the surface change of the PSA films. PSA 6B had a significantly larger
amount of very small sol polymers and these small sol polymers could have involved
much more movement than the larger ones due to their much smaller size and much
greater mobility. Hence, the sol polymer in PSA 6B should have flowed much more
during the heating process, compared to PSA 4B. Consequently, the treated PSA from 4B
(i.e., 4B-H126/11) should have higher surface roughness compared to that of the treated
PSA from 6B (i.e., 6B-H126/11). The peel strength of PSA 4B-H126/11 was only
slightly smaller than that of PSA 6B-H126/11 (i.e., 236 vs. 270 N/m). The much smaller
difference in peel strength observed with PSA 4B-H126/11 and 6B-H126/11 compared
with the difference in tack, was because peel strength is not as sensitive to surface
smoothness of the PSA films as tack. During peel strength testing, a much longer contact
time and also a much larger contact force were used compared to tack testing.
From the above results, one can see that increasing the amount of very small sol
polymers in the original gel-containing latex-based PSAs had a significant negative
influence on the performance of the treated PSAs. Decreasing the amount of very small
sol polymers (i.e., size < 2Me) in the original gel-containing latex-based PSAs could lead
Chapter 6
200
to significantly better performance for the treated PSAs. For example, shear strength
could be greatly increased only at a small sacrifice of peel strength.
6.3.6 Influence of the amount of very large sol polymer in gel-containing latex-based
PSAs on the performance of their treated PSAs
Tobing et al.[1] found that after post-treating a gel-containing latex-based PSA with Mw
(604 kg/mol) of about 30Me (Me: ~20 kg/mol), the PSA’s performance could not be
greatly improved. Hence they pointed out that if the Mw of a gel-containing latex-based
PSA is too large (e.g., > 20Me), then the microgel could not be turned into a continuous
gel network after post-treatment. Since Mw is only an average number, we decided to
study if increasing the amount of very large sol polymer (e.g., size > 20Me) in a latex-
based PSA under the condition of Mc > Me and also 2Me < Mw 20Me will have a
significant influence on the performance of post-treated PSAs. For this purpose, PSAs 4B
and 5B as well as their heated counterparts were studied. Their polymer microstructure
and performance are shown in Table 6.8.
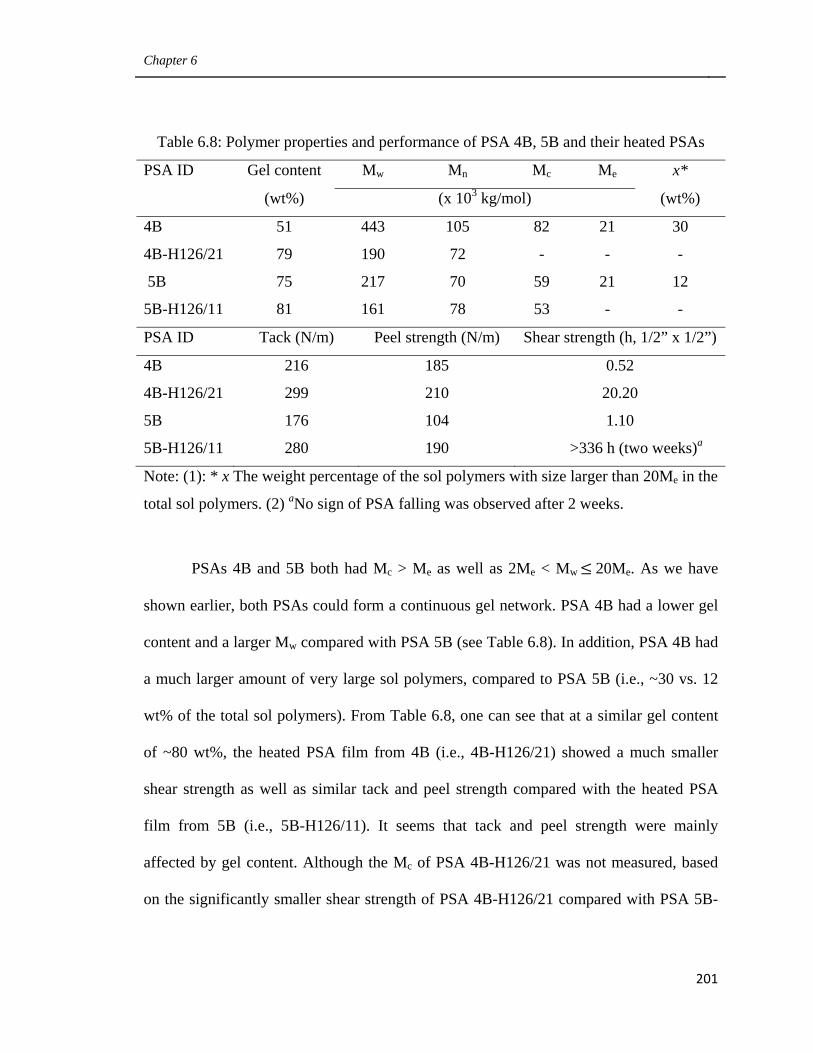
Chapter 6
201
Note: (1): * x The weight percentage of the sol polymers with size larger than 20Me in the
total sol polymers. (2) aNo sign of PSA falling was observed after 2 weeks.
PSAs 4B and 5B both had Mc > Me as well as 2Me < Mw 20Me. As we have
shown earlier, both PSAs could form a continuous gel network. PSA 4B had a lower gel
content and a larger Mw compared with PSA 5B (see Table 6.8). In addition, PSA 4B had
a much larger amount of very large sol polymers, compared to PSA 5B (i.e., ~30 vs. 12
wt% of the total sol polymers). From Table 6.8, one can see that at a similar gel content
of ~80 wt%, the heated PSA film from 4B (i.e., 4B-H126/21) showed a much smaller
shear strength as well as similar tack and peel strength compared with the heated PSA
film from 5B (i.e., 5B-H126/11). It seems that tack and peel strength were mainly
affected by gel content. Although the Mc of PSA 4B-H126/21 was not measured, based
on the significantly smaller shear strength of PSA 4B-H126/21 compared with PSA 5B-
Table 6.8: Polymer properties and performance of PSA 4B, 5B and their heated PSAs
PSA ID Gel content Mw Mn Mc Me x*
(wt%) (x 103 kg/mol) (wt%)
4B 51 443 105 82 21 30
4B-H126/21 79 190 72 - - -
5B 75 217 70 59 21 12
5B-H126/11 81 161 78 53 - -
PSA ID Tack (N/m) Peel strength (N/m) Shear strength (h, 1/2” x 1/2”)
4B 216 185 0.52
4B-H126/21 299 210 20.20
5B 176 104 1.10
5B-H126/11 280 190 >336 h (two weeks)a
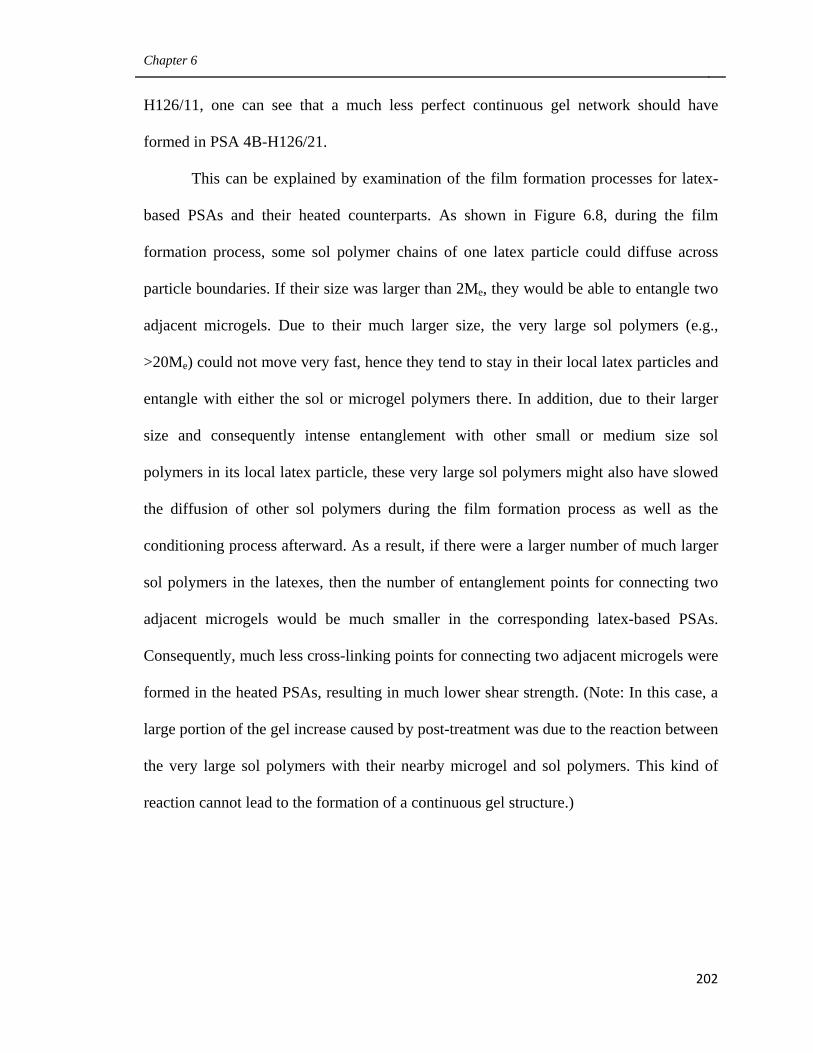
Chapter 6
202
H126/11, one can see that a much less perfect continuous gel network should have
formed in PSA 4B-H126/21.
This can be explained by examination of the film formation processes for latex-
based PSAs and their heated counterparts. As shown in Figure 6.8, during the film
formation process, some sol polymer chains of one latex particle could diffuse across
particle boundaries. If their size was larger than 2Me, they would be able to entangle two
adjacent microgels. Due to their much larger size, the very large sol polymers (e.g.,
>20Me) could not move very fast, hence they tend to stay in their local latex particles and
entangle with either the sol or microgel polymers there. In addition, due to their larger
size and consequently intense entanglement with other small or medium size sol
polymers in its local latex particle, these very large sol polymers might also have slowed
the diffusion of other sol polymers during the film formation process as well as the
conditioning process afterward. As a result, if there were a larger number of much larger
sol polymers in the latexes, then the number of entanglement points for connecting two
adjacent microgels would be much smaller in the corresponding latex-based PSAs.
Consequently, much less cross-linking points for connecting two adjacent microgels were
formed in the heated PSAs, resulting in much lower shear strength. (Note: In this case, a
large portion of the gel increase caused by post-treatment was due to the reaction between
the very large sol polymers with their nearby microgel and sol polymers. This kind of
reaction cannot lead to the formation of a continuous gel structure.)
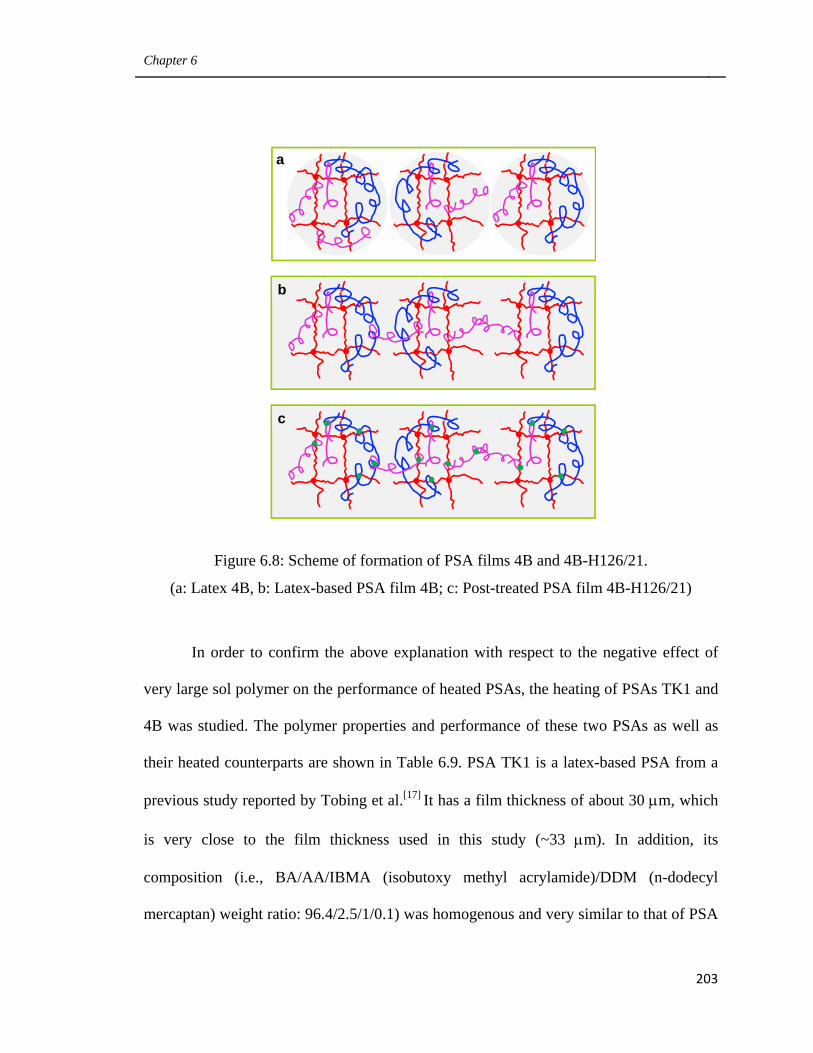
Chapter 6
203
Figure 6.8: Scheme of formation of PSA films 4B and 4B-H126/21.
(a: Latex 4B, b: Latex-based PSA film 4B; c: Post-treated PSA film 4B-H126/21)
In order to confirm the above explanation with respect to the negative effect of
very large sol polymer on the performance of heated PSAs, the heating of PSAs TK1 and
4B was studied. The polymer properties and performance of these two PSAs as well as
their heated counterparts are shown in Table 6.9. PSA TK1 is a latex-based PSA from a
previous study reported by Tobing et al.[17] It has a film thickness of about 30 μm, which
is very close to the film thickness used in this study (~33 μm). In addition, its
composition (i.e., BA/AA/IBMA (isobutoxy methyl acrylamide)/DDM (n-dodecyl
mercaptan) weight ratio: 96.4/2.5/1/0.1) was homogenous and very similar to that of PSA
a
b
c
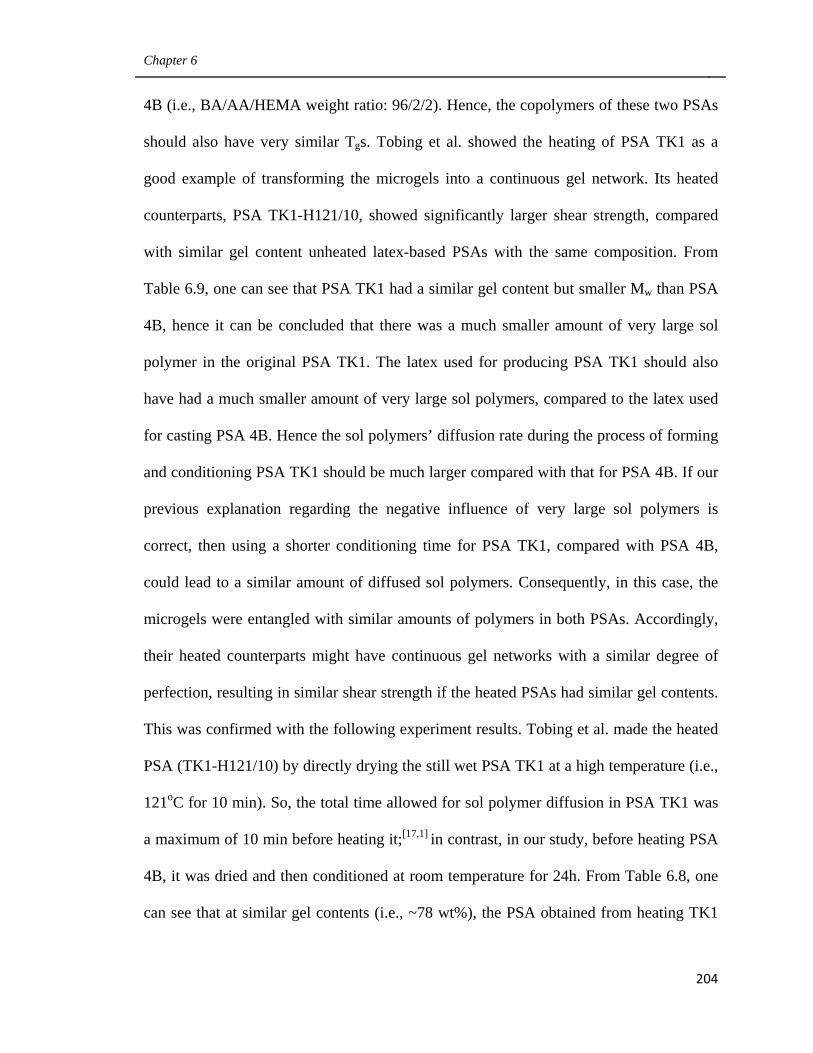
Chapter 6
204
4B (i.e., BA/AA/HEMA weight ratio: 96/2/2). Hence, the copolymers of these two PSAs
should also have very similar Tgs. Tobing et al. showed the heating of PSA TK1 as a
good example of transforming the microgels into a continuous gel network. Its heated
counterparts, PSA TK1-H121/10, showed significantly larger shear strength, compared
with similar gel content unheated latex-based PSAs with the same composition. From
Table 6.9, one can see that PSA TK1 had a similar gel content but smaller Mw than PSA
4B, hence it can be concluded that there was a much smaller amount of very large sol
polymer in the original PSA TK1. The latex used for producing PSA TK1 should also
have had a much smaller amount of very large sol polymers, compared to the latex used
for casting PSA 4B. Hence the sol polymers’ diffusion rate during the process of forming
and conditioning PSA TK1 should be much larger compared with that for PSA 4B. If our
previous explanation regarding the negative influence of very large sol polymers is
correct, then using a shorter conditioning time for PSA TK1, compared with PSA 4B,
could lead to a similar amount of diffused sol polymers. Consequently, in this case, the
microgels were entangled with similar amounts of polymers in both PSAs. Accordingly,
their heated counterparts might have continuous gel networks with a similar degree of
perfection, resulting in similar shear strength if the heated PSAs had similar gel contents.
This was confirmed with the following experiment results. Tobing et al. made the heated
PSA (TK1-H121/10) by directly drying the still wet PSA TK1 at a high temperature (i.e.,
121oC for 10 min). So, the total time allowed for sol polymer diffusion in PSA TK1 was
a maximum of 10 min before heating it;[17,1] in contrast, in our study, before heating PSA
4B, it was dried and then conditioned at room temperature for 24h. From Table 6.8, one
can see that at similar gel contents (i.e., ~78 wt%), the PSA obtained from heating TK1
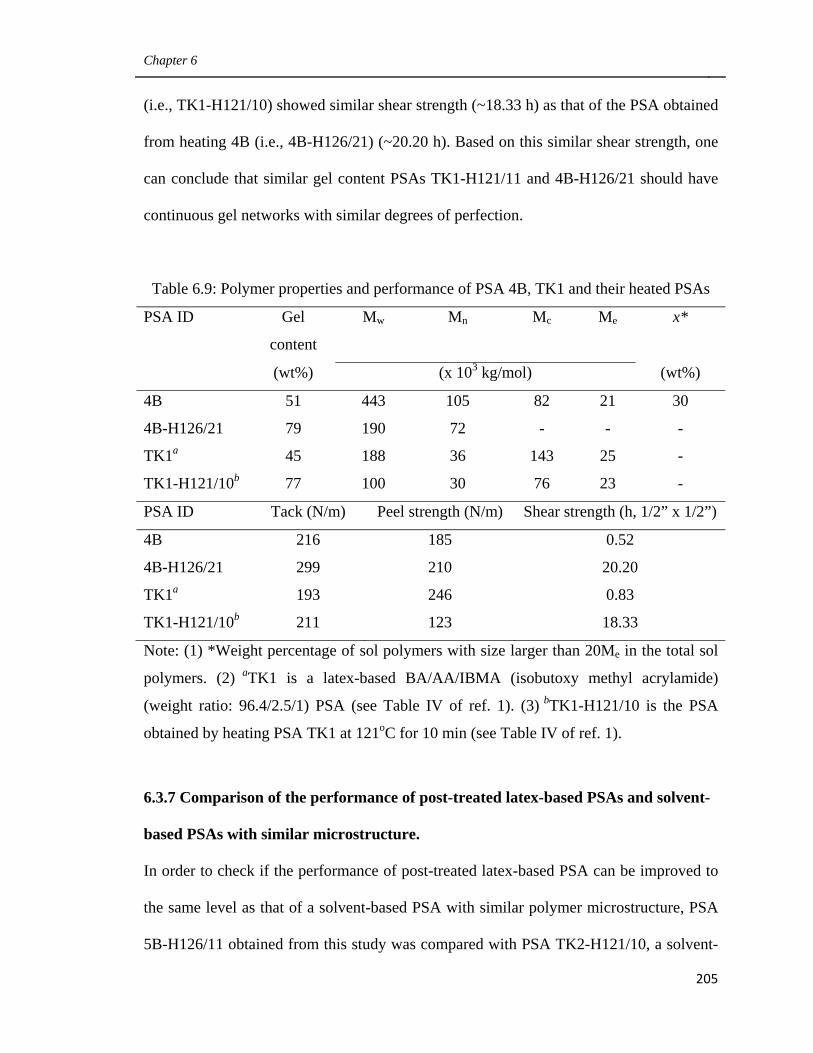
Chapter 6
205
(i.e., TK1-H121/10) showed similar shear strength (~18.33 h) as that of the PSA obtained
from heating 4B (i.e., 4B-H126/21) (~20.20 h). Based on this similar shear strength, one
can conclude that similar gel content PSAs TK1-H121/11 and 4B-H126/21 should have
continuous gel networks with similar degrees of perfection.
Note: (1) *Weight percentage of sol polymers with size larger than 20Me in the total sol
polymers. (2) aTK1 is a latex-based BA/AA/IBMA (isobutoxy methyl acrylamide)
(weight ratio: 96.4/2.5/1) PSA (see Table IV of ref. 1). (3) bTK1-H121/10 is the PSA
obtained by heating PSA TK1 at 121oC for 10 min (see Table IV of ref. 1).
6.3.7 Comparison of the performance of post-treated latex-based PSAs and solvent-
based PSAs with similar microstructure.
In order to check if the performance of post-treated latex-based PSA can be improved to
the same level as that of a solvent-based PSA with similar polymer microstructure, PSA
5B-H126/11 obtained from this study was compared with PSA TK2-H121/10, a solvent-
Table 6.9: Polymer properties and performance of PSA 4B, TK1 and their heated PSAs
PSA ID Gel
content
Mw Mn Mc Me x*
(wt%) (x 103 kg/mol) (wt%)
4B 51 443 105 82 21 30
4B-H126/21 79 190 72 - - -
TK1a 45 188 36 143 25 -
TK1-H121/10b 77 100 30 76 23 -
PSA ID Tack (N/m) Peel strength (N/m) Shear strength (h, 1/2” x 1/2”)
4B 216 185 0.52
4B-H126/21 299 210 20.20
TK1a 193 246 0.83
TK1-H121/10b 211 123 18.33
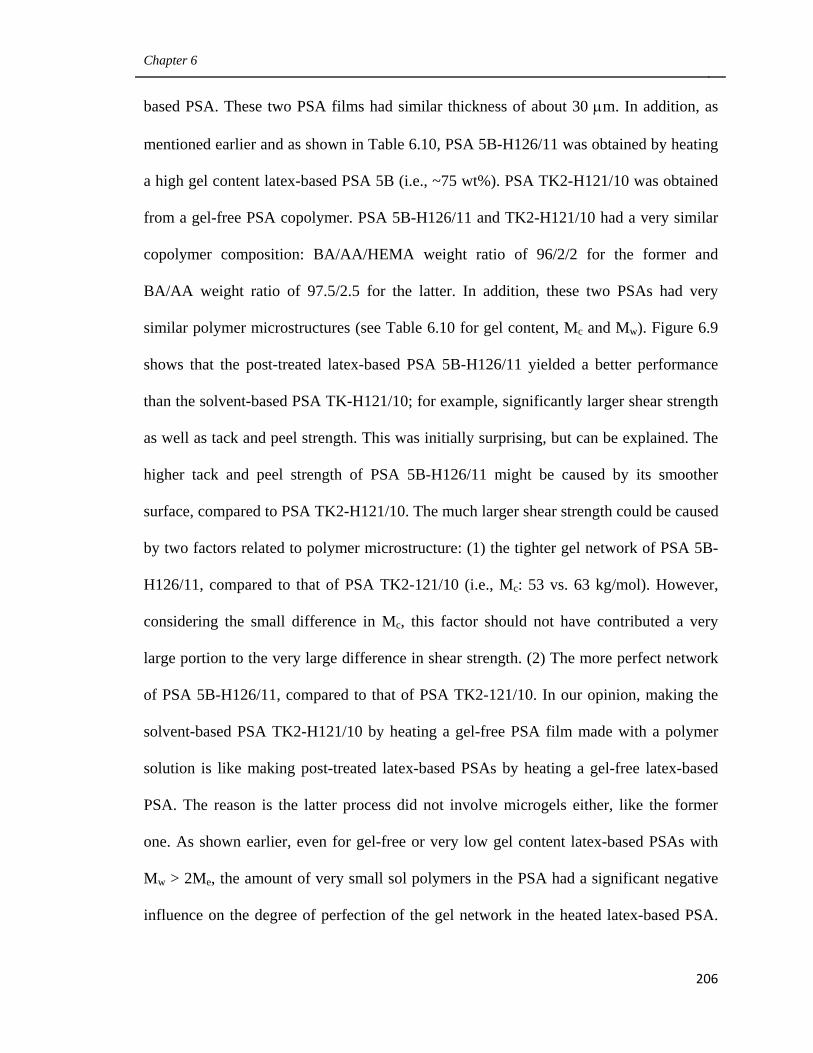
Chapter 6
206
based PSA. These two PSA films had similar thickness of about 30 μm. In addition, as
mentioned earlier and as shown in Table 6.10, PSA 5B-H126/11 was obtained by heating
a high gel content latex-based PSA 5B (i.e., ~75 wt%). PSA TK2-H121/10 was obtained
from a gel-free PSA copolymer. PSA 5B-H126/11 and TK2-H121/10 had a very similar
copolymer composition: BA/AA/HEMA weight ratio of 96/2/2 for the former and
BA/AA weight ratio of 97.5/2.5 for the latter. In addition, these two PSAs had very
similar polymer microstructures (see Table 6.10 for gel content, Mc and Mw). Figure 6.9
shows that the post-treated latex-based PSA 5B-H126/11 yielded a better performance
than the solvent-based PSA TK-H121/10; for example, significantly larger shear strength
as well as tack and peel strength. This was initially surprising, but can be explained. The
higher tack and peel strength of PSA 5B-H126/11 might be caused by its smoother
surface, compared to PSA TK2-H121/10. The much larger shear strength could be caused
by two factors related to polymer microstructure: (1) the tighter gel network of PSA 5B-
H126/11, compared to that of PSA TK2-121/10 (i.e., Mc: 53 vs. 63 kg/mol). However,
considering the small difference in Mc, this factor should not have contributed a very
large portion to the very large difference in shear strength. (2) The more perfect network
of PSA 5B-H126/11, compared to that of PSA TK2-121/10. In our opinion, making the
solvent-based PSA TK2-H121/10 by heating a gel-free PSA film made with a polymer
solution is like making post-treated latex-based PSAs by heating a gel-free latex-based
PSA. The reason is the latter process did not involve microgels either, like the former
one. As shown earlier, even for gel-free or very low gel content latex-based PSAs with
Mw > 2Me, the amount of very small sol polymers in the PSA had a significant negative
influence on the degree of perfection of the gel network in the heated latex-based PSA.
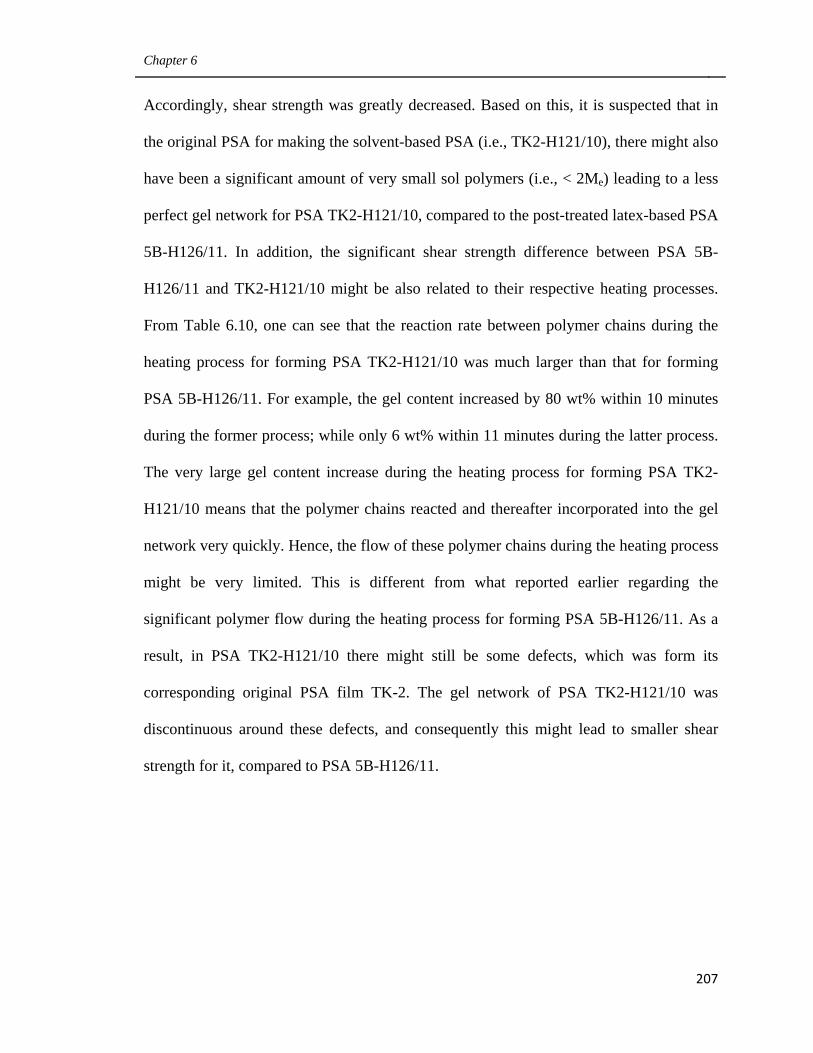
Chapter 6
207
Accordingly, shear strength was greatly decreased. Based on this, it is suspected that in
the original PSA for making the solvent-based PSA (i.e., TK2-H121/10), there might also
have been a significant amount of very small sol polymers (i.e., < 2Me) leading to a less
perfect gel network for PSA TK2-H121/10, compared to the post-treated latex-based PSA
5B-H126/11. In addition, the significant shear strength difference between PSA 5B-
H126/11 and TK2-H121/10 might be also related to their respective heating processes.
From Table 6.10, one can see that the reaction rate between polymer chains during the
heating process for forming PSA TK2-H121/10 was much larger than that for forming
PSA 5B-H126/11. For example, the gel content increased by 80 wt% within 10 minutes
during the former process; while only 6 wt% within 11 minutes during the latter process.
The very large gel content increase during the heating process for forming PSA TK2-
H121/10 means that the polymer chains reacted and thereafter incorporated into the gel
network very quickly. Hence, the flow of these polymer chains during the heating process
might be very limited. This is different from what reported earlier regarding the
significant polymer flow during the heating process for forming PSA 5B-H126/11. As a
result, in PSA TK2-H121/10 there might still be some defects, which was form its
corresponding original PSA film TK-2. The gel network of PSA TK2-H121/10 was
discontinuous around these defects, and consequently this might lead to smaller shear
strength for it, compared to PSA 5B-H126/11.
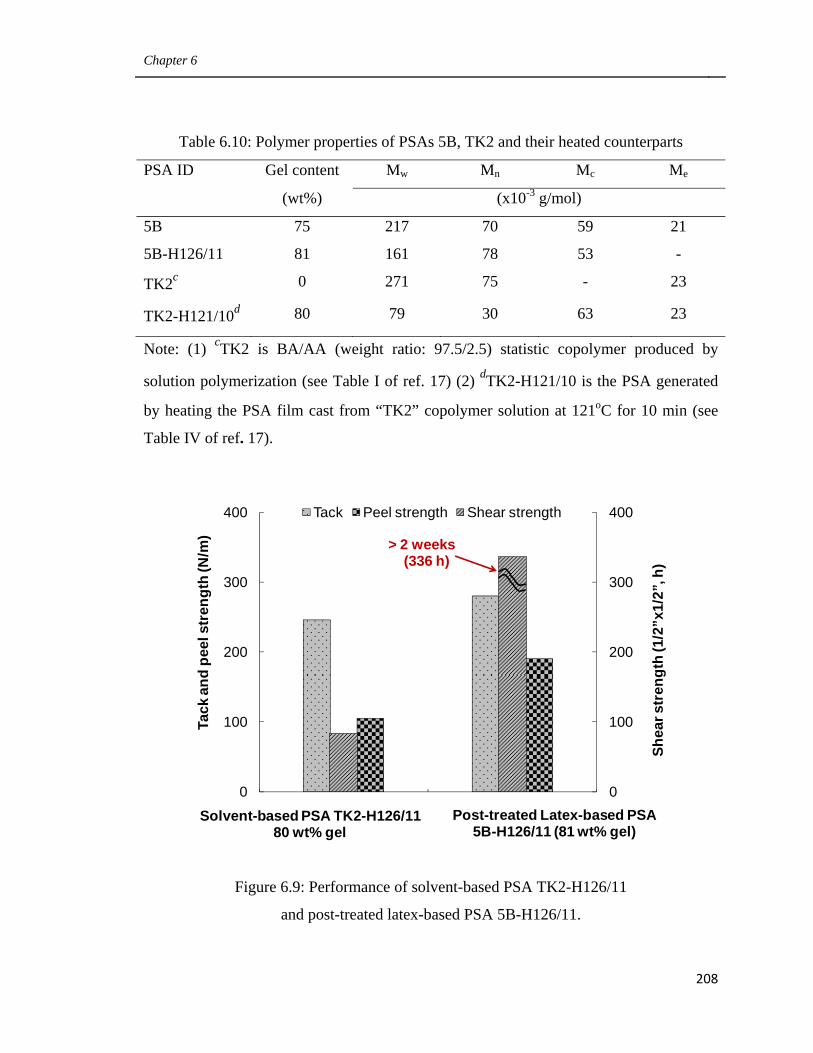
Chapter 6
208
Table 6.10: Polymer properties of PSAs 5B, TK2 and their heated counterparts
PSA ID Gel content Mw Mn Mc Me
(wt%) (x10-3 g/mol)
5B 75 217 70 59 21
5B-H126/11 81 161 78 53 -
TK2c 0 271 75 - 23
TK2-H121/10d 80 79 30 63 23
Note: (1) cTK2 is BA/AA (weight ratio: 97.5/2.5) statistic copolymer produced by
solution polymerization (see Table I of ref. 17) (2) dTK2-H121/10 is the PSA generated
by heating the PSA film cast from “TK2” copolymer solution at 121oC for 10 min (see
Table IV of ref. 17).
Figure 6.9: Performance of solvent-based PSA TK2-H126/11
and post-treated latex-based PSA 5B-H126/11.
0
100
200
300
400
0
100
200
300
400
1 2
Tack
and
pee
l str
engt
h (N
/m)
Tack Peel strength Shear strength
Shea
r str
engt
h (1
/2”x
1/2”
, h)
Solvent-based PSA TK2-H126/1180 wt% gel
Post-treated Latex-based PSA 5B-H126/11 (81 wt% gel)
> 2 weeks(336 h)
Chapter 6
209
6.4 Conclusions
Post-treatment by heating is a very effective way for improving the performance of latex-
based PSAs, and the effect of treatment depends on the polymer microstructures of the
untreated latex-based PSAs. For gel-free or very low gel content latex-based PSAs,
decreasing the amount of very small sol polymers (i.e., size < 2Me) under the condition
that Mw was larger than 2Me, could lead to improved entanglement between the polymer
chains. Consequently, this would lead to the formation of a more perfect continuous gel
network in the post-treated PSA. As a result, the post-treated PSA would exhibit
significantly larger shear strength. As for gel-containing latex-based PSAs, if Mc is larger
than or close to Me and also the Mw is larger than 2Me and smaller or close to 20Me, the
microgels could be connected by the sol polymers. Improving the connection between the
microgels in the latex-based PSAs is the key to get treated PSAs with better performance
(i.e., larger shear strength), as in our case, a more perfect continuous get network would
form in the treated PSAs. Better connection between the microgels in the untreated latex-
based PSAs could be achieved in three ways: (1) simultaneously and properly increasing
the Mc and Mw for similar gel content PSAs; (2) decreasing the amount of very small sol
polymers (i.e., < 2Me). The negative effect of very small sol polymers was due to its
incapability to effectively entangle with the microgels as well as other sol polymers in the
latex-based PSAs; and (3) decreasing the amount of very large sol polymers (i.e., > 20
Me). The negative effect of very large sol polymer was caused by its lower mobility.
Compared to the latex-based PSAs with similar polymer properties, the treated
PSAs showed much better performance. They exhibited not only significantly larger
shear strengths but also much larger tack and peel strengths. The larger shear strength
Chapter 6
210
resulted because the gel network was continuous in the treated PSAs, while discrete in
the untreated PSAs. The larger tack and peel strength was due to the much smoother
surface of the treated PSAs. During the post-treatment process, the PSA polymer could
flow and resulted in a much smoother surface for the treated PSAs compared with those
of the untreated ones. In this study, it was also found that by optimizing the polymer
microstructures of the latex-based PSAs, it was possible to generate a treated latex-based
PSA with even better performance than that of a solvent-based PSA with similar polymer
properties.
6.5 Acknowledgements
The authors thank the Natural Science and Engineering Research Council (NSERC) of
Canada for financial support and Dr. Gabriela Fonseca for assistance with the AFM
measurements.
6.6 References
1. Tobing S. D., A. Klein, Journal of Applied Polymer Science 2001, 79: 2558-2564.
2. Papsin J., George A., Patent No.: US 6281298B1.
3. Kavanagh M. A., Anderson K.S., Erdogan B., Patent No., US 7652103B2.
4. Krepski L. R., Filiatrault T. D., Mccracken S. D., Patent No.: US 7714076.
5. Filiatrault T. D., Kavanagh M. A., Anderson K. S., Patent No.: US 7652095.
6. Farwaha R., Boutillier D. N., Phan L., Patent No.: US 6541566.
7. Bernard M., Patent No.: US 5278227.
8. Keskey W., Schuetz J., Lee D. I., Patent No.: 4474923.
Chapter 6
211
9. Tobing S. D., Klein A., Sperling L. H., Journal of Applied Polymer Science 2001,
81: 2109-2117.
10. Pressure Sensitive Tape Council, Test methods for pressure sensitive adhesive tapes
2004, 14th Edition, Northbrook, Illinois.
11. Qie L., Dubé M. A., European Polymer Journal 2010, 46(6): 1225-1236.
12. Zosel A., Ley G., Macromolecules 1993, 26: 2222-2227.
13. Deplace F., Carelli C., Mariot S., Journal of Adhesion 2009, 85: 18-54.
14. Lakrout H., Sergot P., Creton C., Journal of Adhesion, 1999, 69: 307-359.
15. Qie L., Dubé M. A., International Journal of Adhesion & Adhesives 2010, 30(7):
654-664.
16. Li L., Tirrell M., Korba G. A., Journal of Adhesion 2001, 76: 307-334.
17. Tobing S. D., Klein A., Journal of Applied Polymer Science 2001, 79: 2230-2244.

CHAPTER 7
GENERAL DISCUSSION AND RECOMMENDATIONS
________________________________________________
Chapter 7
213
In the past years, our society has realized the importance of protecting our environment.
Therefore, green products, which are environmental friendly with respect to both their
production and application, are in great need. Pressure sensitive adhesives (PSAs) are widely
used in both our everyday life and in industrial settings. Two of the most important PSAs are
solvent-based and latex-based PSAs.[1] While latex-based PSAs are more environmentally
compliant than solvent-based PSAs, they tend to have inferior performance (e.g., lower
shear strength at similar tack and peel strength).[2,3] Hence the performance of latex-based
PSAs must be improved in order to replace solvent-based PSAs in some applications. The
goal of this thesis was to greatly improve the shear strength of latex-based PSAs at little
to no sacrifice to tack and peel strength.
In this project, controlling the polymer microstructure of the latexes (or their
corresponding PSAs) was used as the main approach for improving the performance of
latex-based PSAs. In addition, modifying the PSAs’ composition and surface properties
were also adopted as supplementary approaches.
This thesis started with modifying the concentrations of chain transfer agent
(CTA) and cross-linker used in starved seeded semi-batch emulsion polymerization
process to produce butyl acrylate (BA)/methyl methacrylate (MMA) latex copolymers
with versatile polymer microstructures. Three techniques were used to produce the
latexes: (1) adding CTA only, (2) adding cross-linker only, and (3) adding both CTA and
cross-linker. The first two methods were widely used and well studied in the past;[4-7]
while the last one was very rarely used and also not well studied.[8-9] Hence in this
research, the influence of simultaneously adding CTA and cross-linker was thoroughly
studied. In addition, in order to gain control over the latexes’ polymer microstructure, a
Chapter 7
214
23 factorial design involving two factors (CTA and cross-linker concentrations) and three
levels was carried out. Based on the design, a model was established relating the
polymerization condition to the latexes’ gel content, which is the most important factor in
a polymer’s microstructure.
The influence of the BA/MMA latexes’ polymer microstructure on the
performance of their corresponding PSAs was studied. However, the relationship
between the polymer microstructure and PSAs’ performance could not be established for
medium and high gel content BA/MMA PSAs, as they showed very low tack and peel
strength as well as extremely large shear strength. In order to solve this problem, the
polymerization factors including the feeding rates of monomer emulsion and initiator
solution, the monomer composition, and emulsifier concentration were modified to
produce latexes applicable for use as PSAs. In some cases, these polymerization
parameters were manipulated simultaneously. Such comprehensive research has never
been reported before, to our knowledge. In addition, the PSA films’ thickness was also
modified in order to increase the PSAs’ tack and peel strength.
With the proper monomer composition and emulsifier concentrations found from
the above study, two series of BA/acrylic acid (AA)/2-hydroxy ethyl methacrylate
(HEMA) latexes were produced by varying the CTA concentration: one in the absence of
cross-linker; the other in the presence of cross-linker. With the PSAs made from these
latexes, the influence of polymer microstructure on PSA performance and viscoelasticity
was studied. In particular, similar gel content latexes obtained with the above two
different methods were compared regarding their corresponding PSA performance and
viscoelastic properties. Such a study has never been reported, to our knowledge.
Chapter 7
215
Finally, the performance BA/AA/HEMA latex-based PSAs was further improved
by post-heating. Tobing et al.[3,10] reported that by properly post-treating latex-based
PSAs with Mc>Me as well as 2Me<Mw<20Me, the performance (i.e., shear strength) of the
PSAs could be greatly improved due to the transformation of a discrete microgel
structure into a continuous gel network. (Note: Mc is the molecular weight between cross-
linking points, Mw is the weight average molecular weight of the sol polymers, and Me is
the molecular weight between entanglement points). In this work, the influence of the
presence of a significant amount of very small or very large sol polymers (i.e., size <2Me
or size >20Me) in the untreated PSAs on the performance of their corresponding treated
PSAs was studied. In addition, the possibility of improving the performance (i.e., shear
strength) of post-treated PSAs by simultaneously increasing the Mc and Mw of the
original latex-based PSAs with similar gel contents was explored. Such studies have
never been reported before, to our knowledge.
7.1 Main Contributions and Findings
7.1.1 Using CTA and cross-linker simultaneously to modify latexes’ polymer
microstructure (Chapter 3)
It was found that using CTA and cross-linker simultaneously allowed one to expand the
range of latex microstructural possibilities as opposed to manipulating one concentration
at a time. For example, similar gel content latex with much smaller Mc and Mw could be
obtained when increasing the CTA and cross-linker concentrations simultaneously. In
addition, the latexes’ polymer microstructure change was studied under the condition of
varying the amount of CTA at a constant amount of cross-linker. It was found that at a
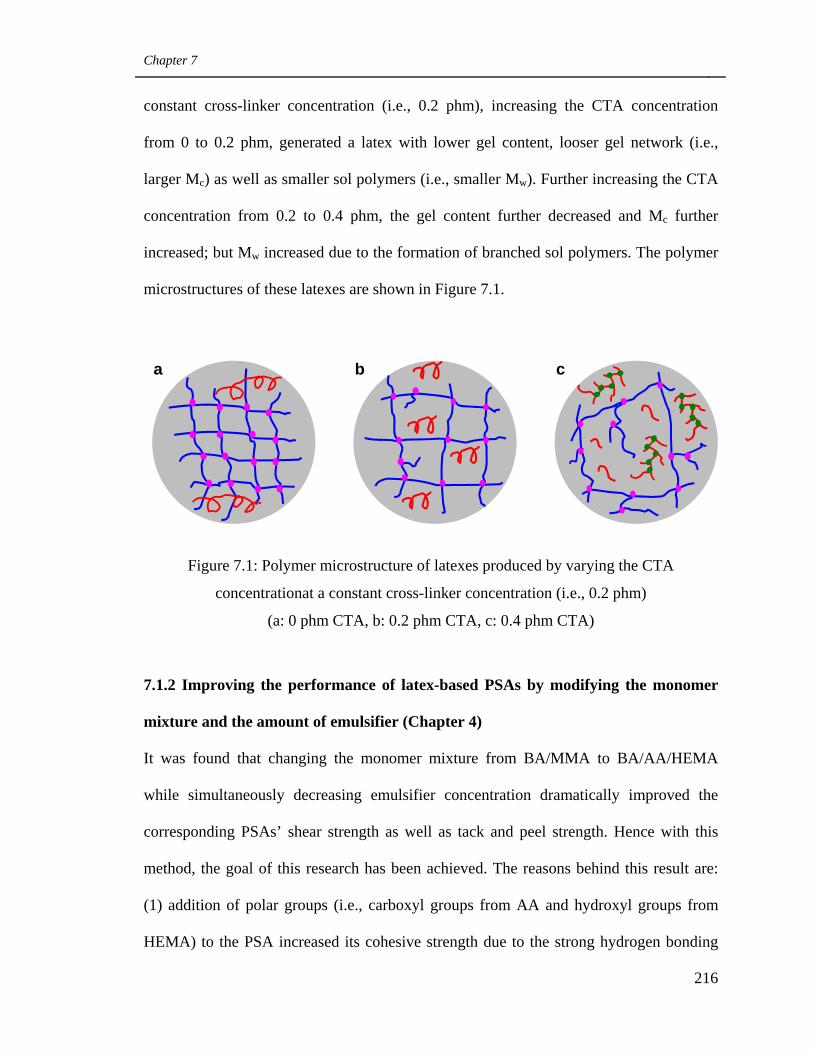
Chapter 7
216
constant cross-linker concentration (i.e., 0.2 phm), increasing the CTA concentration
from 0 to 0.2 phm, generated a latex with lower gel content, looser gel network (i.e.,
larger Mc) as well as smaller sol polymers (i.e., smaller Mw). Further increasing the CTA
concentration from 0.2 to 0.4 phm, the gel content further decreased and Mc further
increased; but Mw increased due to the formation of branched sol polymers. The polymer
microstructures of these latexes are shown in Figure 7.1.
Figure 7.1: Polymer microstructure of latexes produced by varying the CTA
concentrationat a constant cross-linker concentration (i.e., 0.2 phm)
(a: 0 phm CTA, b: 0.2 phm CTA, c: 0.4 phm CTA)
7.1.2 Improving the performance of latex-based PSAs by modifying the monomer
mixture and the amount of emulsifier (Chapter 4)
It was found that changing the monomer mixture from BA/MMA to BA/AA/HEMA
while simultaneously decreasing emulsifier concentration dramatically improved the
corresponding PSAs’ shear strength as well as tack and peel strength. Hence with this
method, the goal of this research has been achieved. The reasons behind this result are:
(1) addition of polar groups (i.e., carboxyl groups from AA and hydroxyl groups from
HEMA) to the PSA increased its cohesive strength due to the strong hydrogen bonding
a b c
Chapter 7
217
between these groups. Hence the shear strength was greatly increased; and (2) adding
polar groups increased the PSA film’s surface tension, and decreasing the amount of
emulsifier enhanced the contact between PSA polymer and substrate. Consequently, the
chemical interaction energy between PSA film and substrate surfaces greatly increased.
As a result, the tack and peel strength were also greatly improved.
7.1.3 Improving the performance of latex-based PSAs by controlling their polymer
microstructures (Chapter 5)
Two series of BA/AA/HEMA latexes were produced via starved seeded semi-batch
emulsion polymerization by varying the amount of CTA either in the absence or presence
of cross-linker. It was found that at similar gel content, the latexes generated in the
absence of cross-linker had significantly larger Mc and Mw as well as a significantly
smaller amount of very small sol polymer (i.e., size <Me).
The performance of the PSA films mainly depended on gel content. In general,
with the increase in gel content, the shear strength increased, while tack and peel strength
decreased. In addition, at similar gel content, the PSAs with larger Mc and Mw showed
significantly larger shear strength as well as similar tack and peel strength, compared to
their counterparts with smaller Mc and Mw. Hence, simultaneously increasing the Mc and
Mw for similar gel content latex-based PSAs was another tool for effectively improving
PSA performance.
The reasons for the similar gel content PSAs’ performance results include: (1) at
similar gel content, increasing the PSAs’ Mc and Mw enhanced the entanglement between
their polymer chains. Consequently the PSAs’ cohesive strength significantly increased,
Chapter 7
218
as has been confirmed by their significantly larger shear moduli measured via dynamic
mechanical analysis (DMA). Accordingly, the PSAs’ shear strength was increased; and
(2) at similar gel content, increasing the PSAs’ Mc and Mw lowered their deformability
and flow ability, as is consistent with their larger shear moduli. As a result, during the
bonding process, PSAs with much larger Mc and Mw could not wet the substrate as well
as its similar gel content counterpart with smaller Mc and Mw during the bonding process
of tack and peel strength testing. This tended to lower its tack and peel strength.[11]
Meanwhile, at similar gel content, increasing the PSAs’ Mc and Mw enhanced their
elongation capability,[12] which endowed the PSA with larger capability to form longer
fibrils during the debonding process of tack and peel strength testing.[13-14] As a result, the
PSA might have experienced much larger strain and consequently dissipated larger
amounts of energy during the debonding process. This tended to increase the PSAs’ tack
and peel strength.[13-14] The positive effect of larger dissipated energy on increasing tack
and peel strength might have counterbalanced the negative effect of less wetting. Hence
PSAs with similar gel content showed similar tack and peel strength.
7.1.4 Improving the performance of latex-based BA/AA/HEMA PSAs by optimizing
their polymer microstructure and post-treatment (Chapter 6)
It was found that post-heating is a very effective way for improving the performance of
latex-based PSAs, and the effect of post-treatment depends on the polymer
microstructures of the untreated latex-based PSAs. For gel-free or very low gel content
latex-based PSAs, decreasing the amount of very small sol polymers (i.e., size <2Me)
under the condition that Mw was larger than 2Me, led to improved entanglement between
Chapter 7
219
the polymer chains. Consequently, this led to the formation of a more perfect continuous
gel network in the post-treated PSA. As a result, the post-treated PSA exhibited
significantly larger shear strength. As for gel-containing latex-based PSAs, if the Mc was
larger than or close to Me and also the Mw was larger than 2Me but smaller than or close
to 20Me, then the microgels could be entangled by the sol polymers in these PSAs.[3] In
this study, it was found that improving the connection between the microgels in the
original latex-based PSAs was the key to improve PSA performance (i.e., larger shear
strength), as in this case, a more perfect continuous get network would form in the treated
PSAs. Better connection between the microgels in the untreated latex-based PSAs could
be achieved in three ways: (1) simultaneously and properly increasing the Mc and Mw for
similar gel content PSAs; (2) decreasing the amount of very small sol polymers (i.e., size
<2Me). The negative effect of these very small sol polymers was due to their incapability
to effectively entangle with the microgels as well as other sol polymers in the latex-based
PSAs; and (3) decreasing the amount of very large sol polymers (i.e., >20 Me). The
negative effect of these very large sol polymers was caused by their lower mobility.
Compared to the latex-based PSAs with similar gel contents, the treated PSAs
showed much better performance. They exhibited not only significantly larger shear
strengths but also much larger tack and peel strengths. The larger shear strength resulted
because the gel network was continuous in the treated PSAs, while it was discrete in the
untreated PSAs. The larger tack and peel strength were due to the much smoother surface
of the treated PSA films. During the post-treatment process, the PSA polymer could flow
and therefore resulted in a much smoother surface for the treated PSAs, compared with
those of the untreated ones.
Chapter 7
220
7.1.5 Publications
This thesis includes four manuscripts for publication in refereed journals. Two have been
published, one has been submitted for publication, and the other is to be submitted
shortly:
(1) Qie L., Dubé M. A., Chapter 3, European Polymer Journal 2010, 46: 1225-1236.
(2) Qie L., Dubé M. A. Chapter 4, International Journal of Adhesion and Adhesives
2010, 30: 654-664.
(3) Qie L., Dubé M. A, Chapter 5, accepted by Macromolecular Reaction
Engineering in 2010.
(4) Qie L., Dubé M. A., Chapter 6, to be submitted to Journal of Applied Polymer
Science.
7. 2 Recommendations for Future Research
In order to further improve the PSA performance gains presented in this thesis, the
following research is recommended.
a) Exploring Methods for Making Better Latex-based PSA Films
The presence of defects such as holes and scratches in PSA films are very common due to
unsuitable latex properties such as viscosity and particle size, casting tools for making
PSA films, or conditions for making the PSA films with latexes or polymer solutions.
The presence of these defects in PSA films can deteriorate their performance, and must
be diminished.
Chapter 7
221
In this study, the latex’s solid content was modified in order to adjust the latex’s
viscosity and consequently, provide good PSA films. However, it was found that it was
very difficult to produce defect-free PSA films. For example, Figure 7.2 shows the PSA
films made by casting BA/AA/HEMA latex with a Meyer bar (see “e” of Figure 7.2 for
the image of a Meyer bar). The latex had an average particle diameter of ~150 nm, a pH
of about 5.5, and a solid content adjusted from 48, to 45, and to 42 wt%, respectively.
One can see that at a latex solid content of 48 wt%, the resulting PSA film had many
visible scratches (see “a” of Figure 7.2). This was because the latex’s viscosity was too
high, therefore the latex could not flow properly to totally diminish the lines left by the
threads of the casting Meyer bar during the PSA film formation process. Decreasing the
latex solid content slightly to 45 wt% resulted in a PSA film with hole-like defects, due to
lower viscosity (see “b” of Figure 7.2). Decreasing the latex solid content further to 42
wt% resulted in an almost discontinuous PSA film, due to very low viscosity (see “c” and
“d” of Figure 7.2). The PSA films made with late having solid content of 45 wt% and 42
wt% looked perfect with naked eye, and the defects were not visible; but the defects
could be detected by atomic force microscopy (AFM). This was due to the very small
size of the defects.
The observed sharp latex viscosity change around solids content of about 45 wt%
for other latexes with average particle diameters of 150 nm has been reported
elsewhere.[15] Thus, in order to solve the problems related with latex viscosity and
produce defect-free PSA films, two methods may be useful: (1) choosing proper
viscosity-adjusting additives for latexes to get better control over the latex viscosity. In
addition, the chosen additives should not have any significant negative influence on PSA
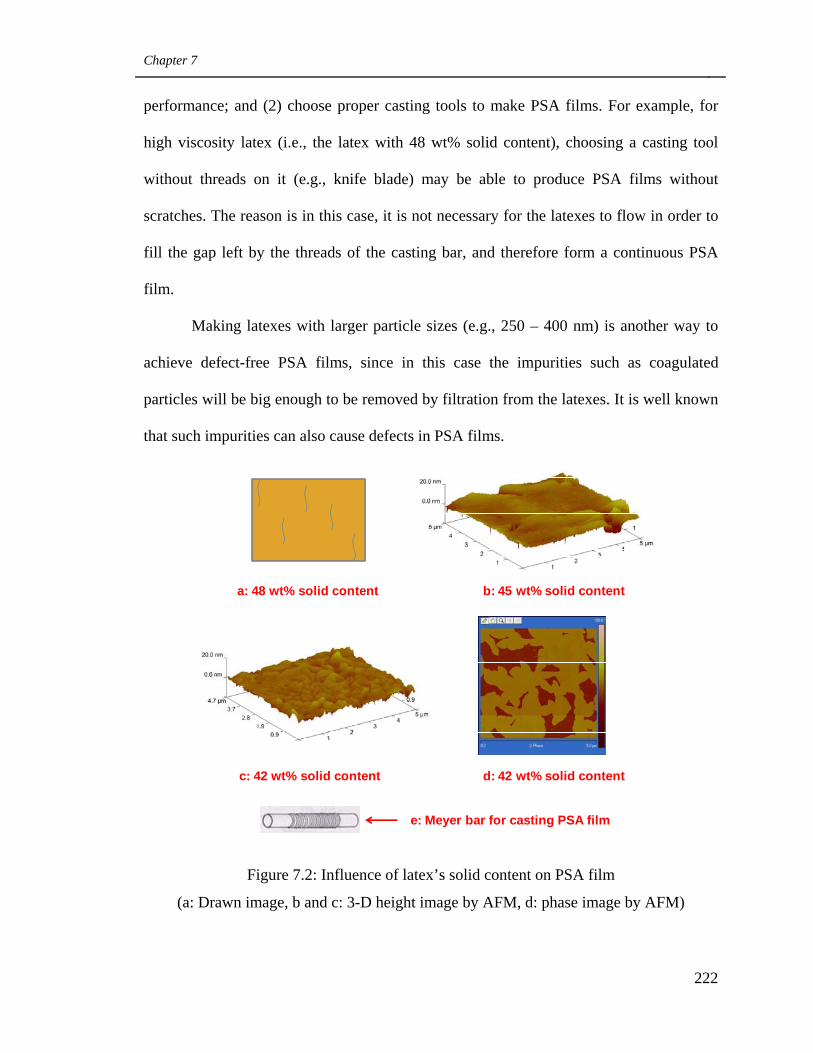
Chapter 7
222
performance; and (2) choose proper casting tools to make PSA films. For example, for
high viscosity latex (i.e., the latex with 48 wt% solid content), choosing a casting tool
without threads on it (e.g., knife blade) may be able to produce PSA films without
scratches. The reason is in this case, it is not necessary for the latexes to flow in order to
fill the gap left by the threads of the casting bar, and therefore form a continuous PSA
film.
Making latexes with larger particle sizes (e.g., 250 – 400 nm) is another way to
achieve defect-free PSA films, since in this case the impurities such as coagulated
particles will be big enough to be removed by filtration from the latexes. It is well known
that such impurities can also cause defects in PSA films.
Figure 7.2: Influence of latex’s solid content on PSA film
(a: Drawn image, b and c: 3-D height image by AFM, d: phase image by AFM)
a: 48 wt% solid content b: 45 wt% solid content
c: 42 wt% solid content d: 42 wt% solid content
e: Meyer bar for casting PSA film
Chapter 7
223
b) Optimizing the amounts of functional groups in the original latex-based PSAs for
improving the performance of post-treated PSAs.
In this study, the amount of functional groups in the original PSA copolymers was fixed.
Varying the amounts of functional groups in the original latex-based PSAs can result in
post-treated PSAs with different polymer microstructures and correspondingly different
performance. Hence, optimizing the amount of functional groups in the original PSAs is
one way to improve the performance of post-treated PSA films.
c) Optimizing the functional groups in the original latex-based PSAs for improving
the performance of post-treated PSAs and simplifying the post-treatment process.
In this study, the functional groups in the latex-based PSAs were chosen as carboxyl
groups from AA and hydroxyl groups from HEMA. The reaction between these two
groups is slow and also only occurs at higher temperatures (e.g., >~110oC). Hence, some
of the entanglement points for connecting the microgels by sol polymers in the original
latex-based PSAs might not have transformed into cross-linking points via reaction
between these two groups during the post-treatment process. Consequently, even though
the resulting gel network in the post-treated PSAs was continuous, it might have some
weak points, which could cause lower shear strength for the treated PSAs. To solve this
problem, the functional groups can be optimized, so that they can react very fast and
effectively.
Moreover, if good original latex-based PSA films can be made by modifying
latexes’ viscosity, particle size, etc., then functional groups able to react at room
temperature can be chosen for the original PSAs. In this case, it is not necessary to use
Chapter 7
224
PSA polymer flow at the high temperature of the post-treatment process to make PSA
films with defects. This way, the post-treatment process will be much easier to carry out
and its cost will be much lower.
7.3 Final Remarks
The main objective of this thesis was to improve the performance of latex-based PSAs,
which are more environmental friendly but have poorer performance, compared to
another type of very important commercial PSA, solvent-based PSAs. With the above
results, one can see that we have surpassed our original objective, which was to greatly
improve the shear strength of latex-based PSAs at small or no sacrifice to tack and peel
strength. In two cases, not only was shear strength greatly improved, but so were tack and
peel strength due to the simultaneous modification of PSA bulk and surface properties.
Another supplementary objective was to study the influence of CTA and cross-
linker concentrations on latexes’ polymer microstructure, to gain better control over the
polymer microstructure of the latexes and their corresponding PSAs. This was also
accomplished.
While our objectives were fulfilled, some very interesting research such as that
recommended above still needs to be done in order to further improve the performance of
latex-based PSAs, and therefore make greener PSA products.
7.4 References
1. Jovanovic R., Dubé M. A., Journal of Macromolecular Science-Polymer Reviews
2004, C44(1): 1-51.
Chapter 7
225
2. Tobing S. D., Klein A., Journal of Applied Polymer Science 2001, 79(12): 2230-
2244.
3. Tobing S. D., Klein A., Journal of Applied Polymer Science 2001, 79(14): 2558-
2564.
4. Shen H. Z., Zhang J. Y., Liu S. J., Journal of Applied Polymer Science 2008,
107(3): 1793-1802.
5. Plessis C., Arzamendi G., Leiza J., Journal of Polymer Science. Part A, Polymer
Chemistry, Vol. 39, 1106–1119 (2001)
6. Bouvier-Fontes L., Pirri R., Asua J. M., Macromolecules 2005, 38: 1164-1171.
7. Bouvier-Fontes L., Pirri R., Asua J. M., Journal of Polymer Science. Part A,
Polymer Chemistry 2005, 43: 4684–4694.
8. Chauvet J., Asua J. A., Leiza J. R., Polymer 2005, 46(23): 9555-9561.
9. Kajtna J., Golob J., Krajnc M., International Journal of Adhesion and Adhesives
2009, 29(2): 186-194.
10. Tobing S. D., Klein A., Sperling L.H., Journal of Applied Polymer Science 2001,
81(9): 2109-2117.
11. István B., Pressure-Sensitive Adhesives and Applications 2004, Marcel Dekker
Inc., New York.
12. Zosel A., Ley G., Macromolecules 1993, 26: 2222-2227.
13. Deplace F., Carelli C., Mariot S., J. Adhesion 2009, 85: 18-54.
14. Zosel A., International Journal of Adhesion and Adhesives 1998, 18: 265-271.
15. Horsky J., Quadrat O., Porsch B., Colloids and Sufaces A: Physicochemical and
Engineering Aspects 2001, 180: 75-85.

APPENDIX
________________________________________________
Appendix
227
This appendix includes five sections: (1) calculation of the instantaneous and overall
monomer conversion for a polymerization process (Run 1 from Chapter 3 was used as an
example); (2) study the influence of latexes’ pH on their corresponding PSAs’
performance with sample latexes 3 and 4 from Chapter 5; (3) study the influence of
contact area on PSAs’ shear strength. (PSA films 1A through 6A from Chapter 5 were
used as samples); (4) calculation of PSA film’s surface tension as well as the chemical
interaction energy between the surfaces of PSA film and substrate. PSA film 5B and its
post-treated counterpart, PSA film 5B-H126/11, were used as samples for this
calculation; (5) Explanation about storage modulus (G’), loss modulus (G”) and
composite modulus (G*)
1 Monomer conversion calculation for Run 1 from Chapter 3
Instantaneous monomer conversion was calculated based on the total amount of
monomer added to the reactor up to the sampling time; in contrast, the overall monomer
conversion was calculated based on the total amount of monomer in the polymerization
formulation. To obtain the monomer conversion values, both the polymerization and
sample latexes information are required. Hereafter, the detailed calculation procedure is
provided.
1.1 Polymerization formulation
The first step for the calculation was to get the polymerization formulation, which is
shown in Table A1.
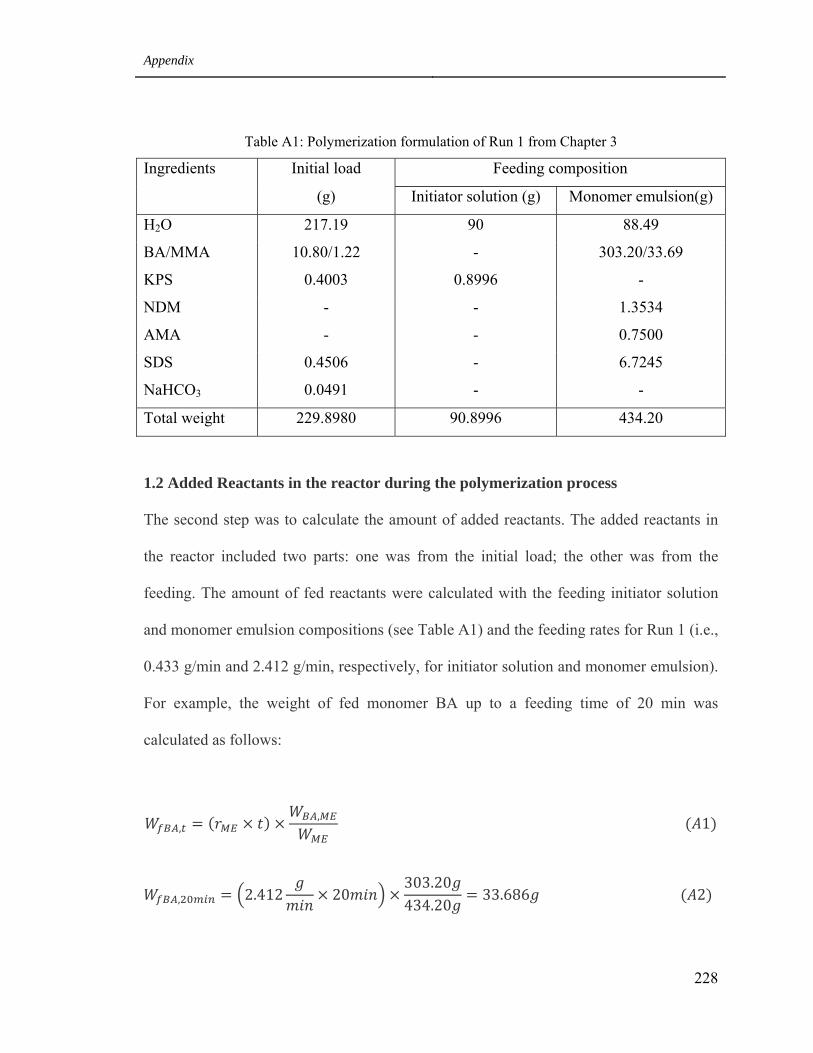
Appendix
228
Table A1: Polymerization formulation of Run 1 from Chapter 3
Ingredients Initial load Feeding composition
(g) Initiator solution (g) Monomer emulsion(g)
H2O 217.19 90 88.49
BA/MMA 10.80/1.22 - 303.20/33.69
KPS 0.4003 0.8996 -
NDM - - 1.3534
AMA - - 0.7500
SDS 0.4506 - 6.7245
NaHCO3 0.0491 - -
Total weight 229.8980 90.8996 434.20
1.2 Added Reactants in the reactor during the polymerization process
The second step was to calculate the amount of added reactants. The added reactants in
the reactor included two parts: one was from the initial load; the other was from the
feeding. The amount of fed reactants were calculated with the feeding initiator solution
and monomer emulsion compositions (see Table A1) and the feeding rates for Run 1 (i.e.,
0.433 g/min and 2.412 g/min, respectively, for initiator solution and monomer emulsion).
For example, the weight of fed monomer BA up to a feeding time of 20 min was
calculated as follows:
,, 1
, 2.412 20303.20434.20 33.686 2
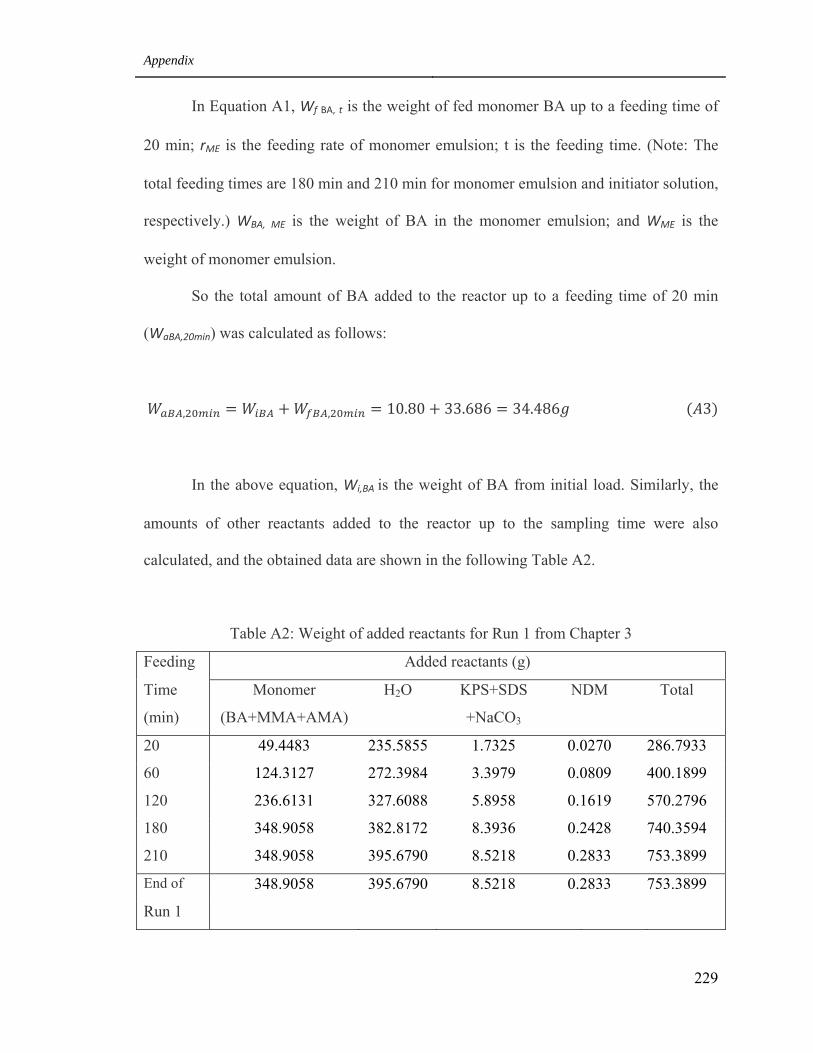
Appendix
229
In Equation A1, Wf BA, t is the weight of fed monomer BA up to a feeding time of
20 min; rME is the feeding rate of monomer emulsion; t is the feeding time. (Note: The
total feeding times are 180 min and 210 min for monomer emulsion and initiator solution,
respectively.) WBA, ME is the weight of BA in the monomer emulsion; and WME is the
weight of monomer emulsion.
So the total amount of BA added to the reactor up to a feeding time of 20 min
(WaBA,20min) was calculated as follows:
, , 10.80 33.686 34.486 3
In the above equation, Wi,BA is the weight of BA from initial load. Similarly, the
amounts of other reactants added to the reactor up to the sampling time were also
calculated, and the obtained data are shown in the following Table A2.
Table A2: Weight of added reactants for Run 1 from Chapter 3
Feeding Added reactants (g)
Time
(min)
Monomer
(BA+MMA+AMA)
H2O KPS+SDS
+NaCO3
NDM Total
20 49.4483 235.5855 1.7325 0.0270 286.7933
60 124.3127 272.3984 3.3979 0.0809 400.1899
120 236.6131 327.6088 5.8958 0.1619 570.2796
180 348.9058 382.8172 8.3936 0.2428 740.3594
210 348.9058 395.6790 8.5218 0.2833 753.3899
End of 348.9058 395.6790 8.5218 0.2833 753.3899
Run 1
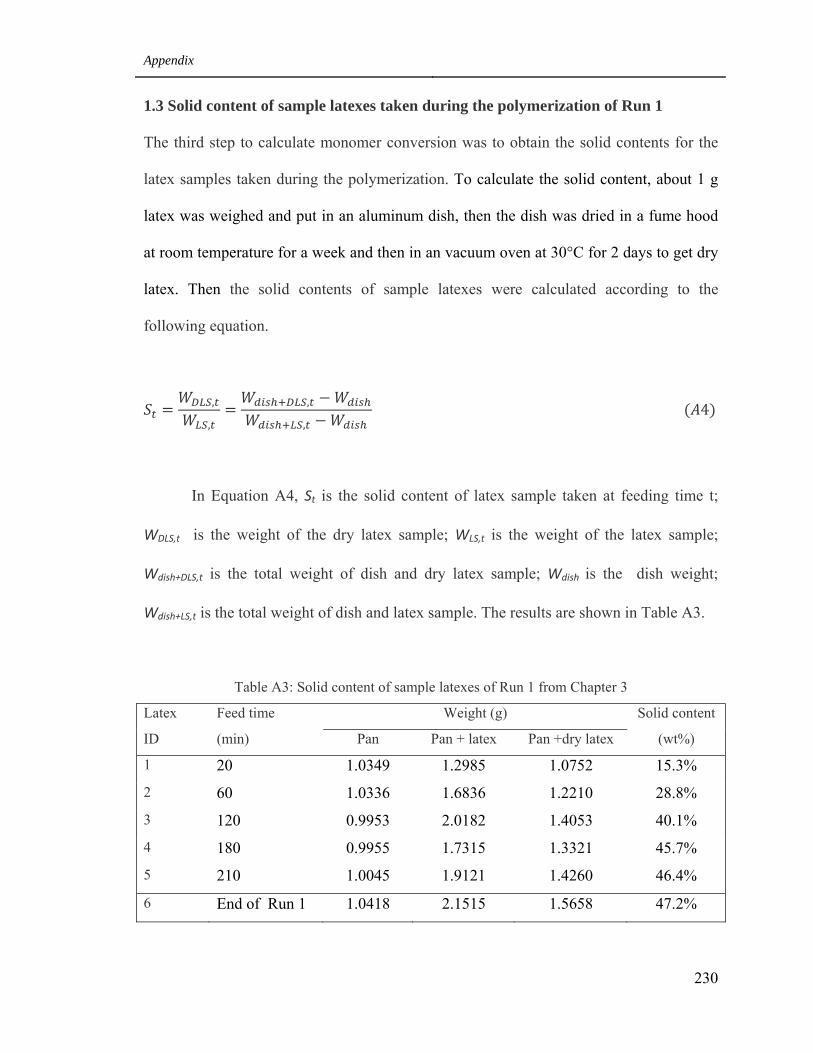
Appendix
230
1.3 Solid content of sample latexes taken during the polymerization of Run 1
The third step to calculate monomer conversion was to obtain the solid contents for the
latex samples taken during the polymerization. To calculate the solid content, about 1 g
latex was weighed and put in an aluminum dish, then the dish was dried in a fume hood
at room temperature for a week and then in an vacuum oven at 30°C for 2 days to get dry
latex. Then the solid contents of sample latexes were calculated according to the
following equation.
,
,
,
, 4
In Equation A4, St is the solid content of latex sample taken at feeding time t;
WDLS,t is the weight of the dry latex sample; WLS,t is the weight of the latex sample;
Wdish+DLS,t is the total weight of dish and dry latex sample; Wdish is the dish weight;
Wdish+LS,t is the total weight of dish and latex sample. The results are shown in Table A3.
Table A3: Solid content of sample latexes of Run 1 from Chapter 3
Latex Feed time Weight (g) Solid content
ID (min) Pan Pan + latex Pan +dry latex (wt%)
1 20 1.0349 1.2985 1.0752 15.3%
2 60 1.0336 1.6836 1.2210 28.8%
3 120 0.9953 2.0182 1.4053 40.1%
4 180 0.9955 1.7315 1.3321 45.7%
5 210 1.0045 1.9121 1.4260 46.4%
6 End of Run 1 1.0418 2.1515 1.5658 47.2%
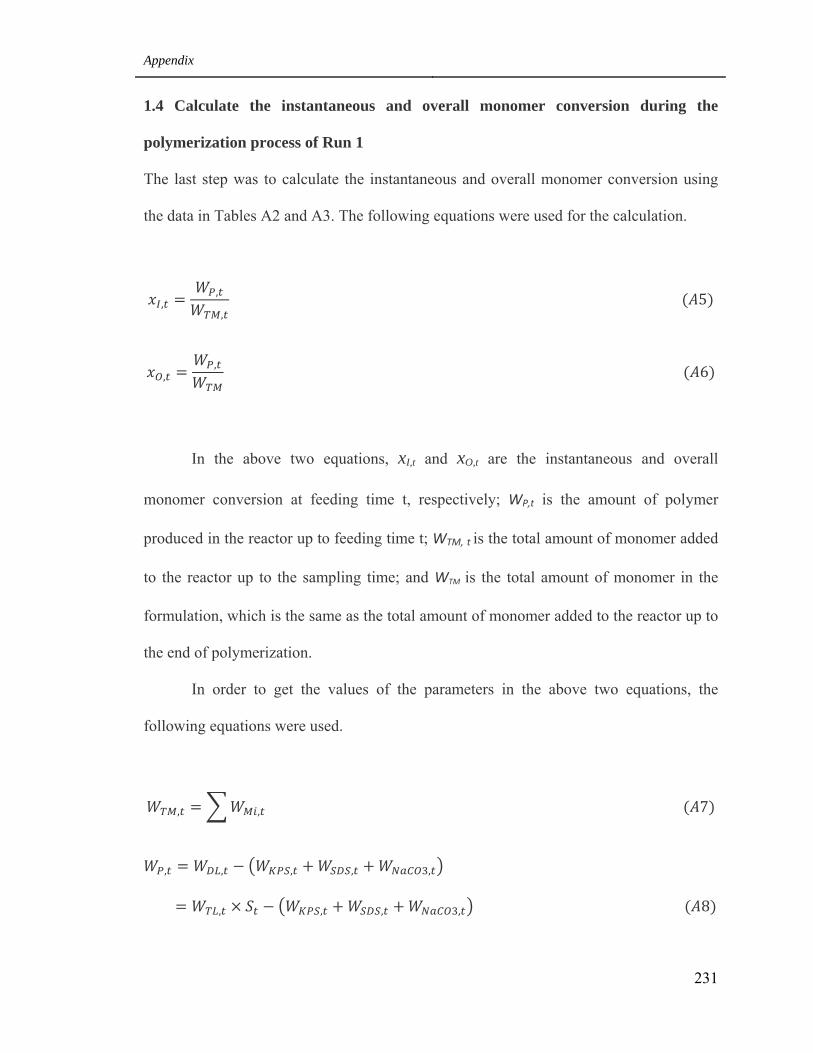
Appendix
231
1.4 Calculate the instantaneous and overall monomer conversion during the
polymerization process of Run 1
The last step was to calculate the instantaneous and overall monomer conversion using
the data in Tables A2 and A3. The following equations were used for the calculation.
,,
, 5
,, 6
In the above two equations, xI,t and xO,t are the instantaneous and overall
monomer conversion at feeding time t, respectively; WP,t is the amount of polymer
produced in the reactor up to feeding time t; WTM, t is the total amount of monomer added
to the reactor up to the sampling time; and WTM is the total amount of monomer in the
formulation, which is the same as the total amount of monomer added to the reactor up to
the end of polymerization.
In order to get the values of the parameters in the above two equations, the
following equations were used.
, , 7
, , , , ,
, , , , 8
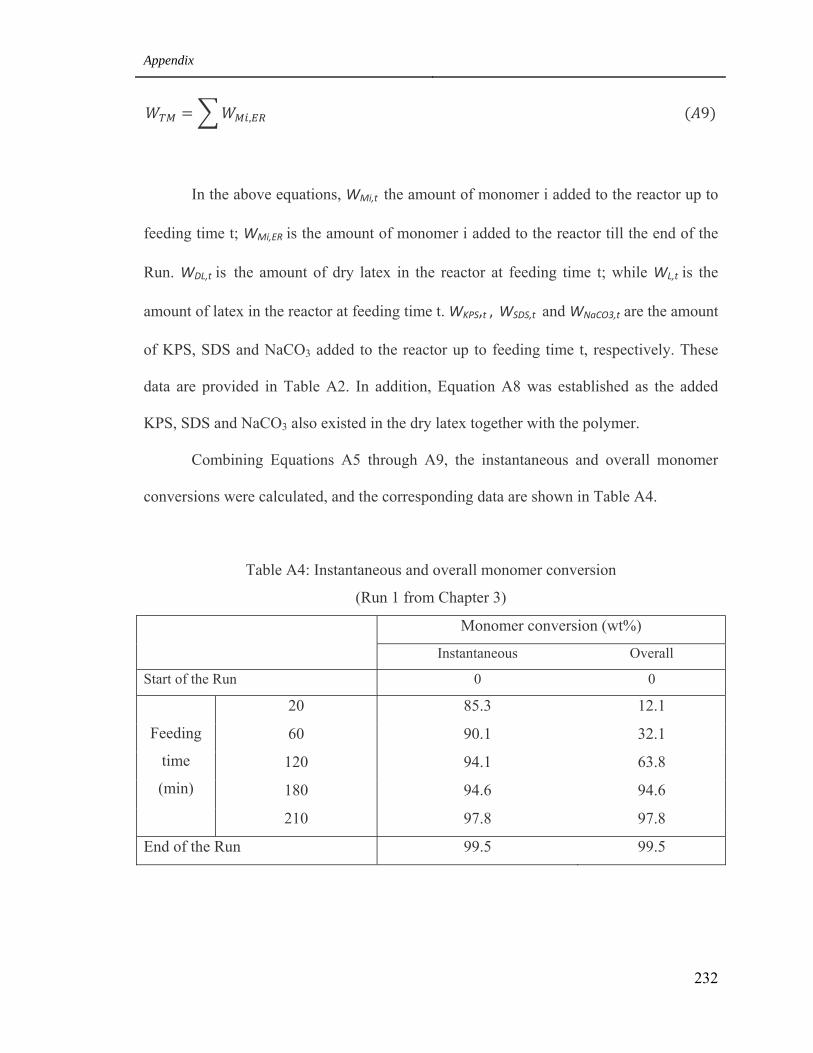
Appendix
232
, 9
In the above equations, WMi,t the amount of monomer i added to the reactor up to
feeding time t; WMi,ER is the amount of monomer i added to the reactor till the end of the
Run. WDL,t is the amount of dry latex in the reactor at feeding time t; while WL,t is the
amount of latex in the reactor at feeding time t. WKPS,t , WSDS,t and WNaCO3,t are the amount
of KPS, SDS and NaCO3 added to the reactor up to feeding time t, respectively. These
data are provided in Table A2. In addition, Equation A8 was established as the added
KPS, SDS and NaCO3 also existed in the dry latex together with the polymer.
Combining Equations A5 through A9, the instantaneous and overall monomer
conversions were calculated, and the corresponding data are shown in Table A4.
Table A4: Instantaneous and overall monomer conversion
(Run 1 from Chapter 3)
Monomer conversion (wt%)
Instantaneous Overall
Start of the Run 0 0
Feeding
time
(min)
20 85.3 12.1
60 90.1 32.1
120 94.1 63.8
180 94.6 94.6
210 97.8 97.8
End of the Run 99.5 99.5
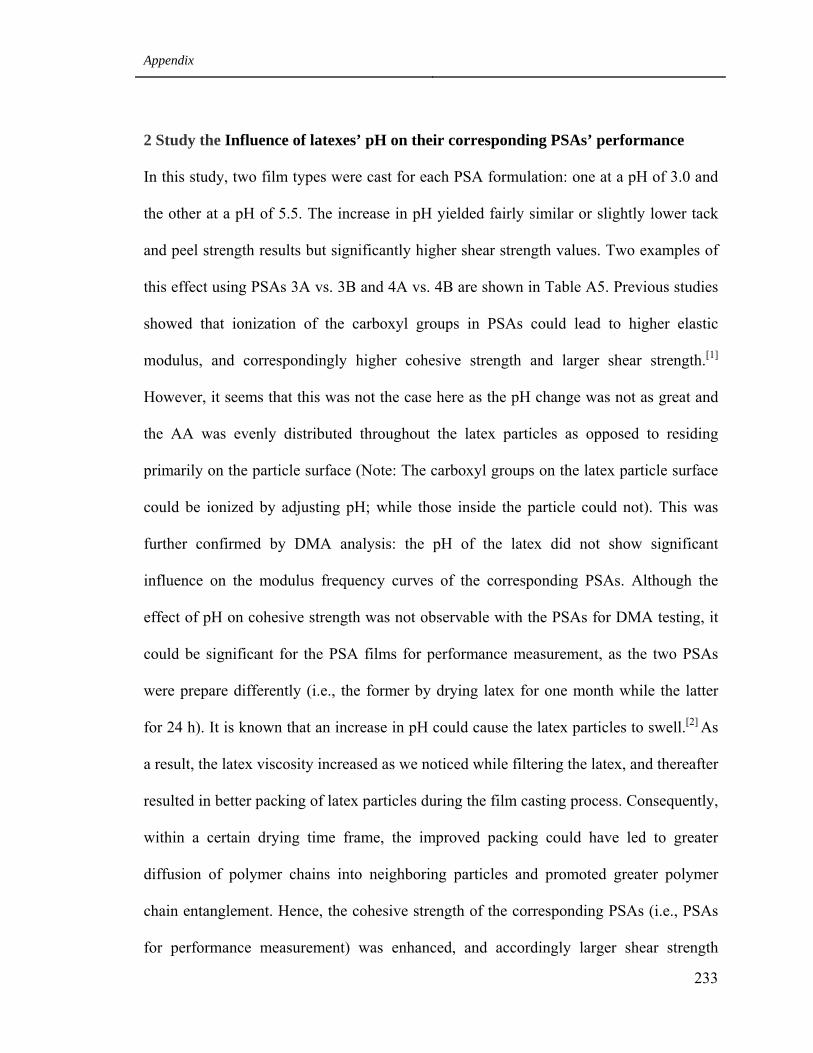
Appendix
233
2 Study the Influence of latexes’ pH on their corresponding PSAs’ performance
In this study, two film types were cast for each PSA formulation: one at a pH of 3.0 and
the other at a pH of 5.5. The increase in pH yielded fairly similar or slightly lower tack
and peel strength results but significantly higher shear strength values. Two examples of
this effect using PSAs 3A vs. 3B and 4A vs. 4B are shown in Table A5. Previous studies
showed that ionization of the carboxyl groups in PSAs could lead to higher elastic
modulus, and correspondingly higher cohesive strength and larger shear strength.[1]
However, it seems that this was not the case here as the pH change was not as great and
the AA was evenly distributed throughout the latex particles as opposed to residing
primarily on the particle surface (Note: The carboxyl groups on the latex particle surface
could be ionized by adjusting pH; while those inside the particle could not). This was
further confirmed by DMA analysis: the pH of the latex did not show significant
influence on the modulus frequency curves of the corresponding PSAs. Although the
effect of pH on cohesive strength was not observable with the PSAs for DMA testing, it
could be significant for the PSA films for performance measurement, as the two PSAs
were prepare differently (i.e., the former by drying latex for one month while the latter
for 24 h). It is known that an increase in pH could cause the latex particles to swell.[2] As
a result, the latex viscosity increased as we noticed while filtering the latex, and thereafter
resulted in better packing of latex particles during the film casting process. Consequently,
within a certain drying time frame, the improved packing could have led to greater
diffusion of polymer chains into neighboring particles and promoted greater polymer
chain entanglement. Hence, the cohesive strength of the corresponding PSAs (i.e., PSAs
for performance measurement) was enhanced, and accordingly larger shear strength
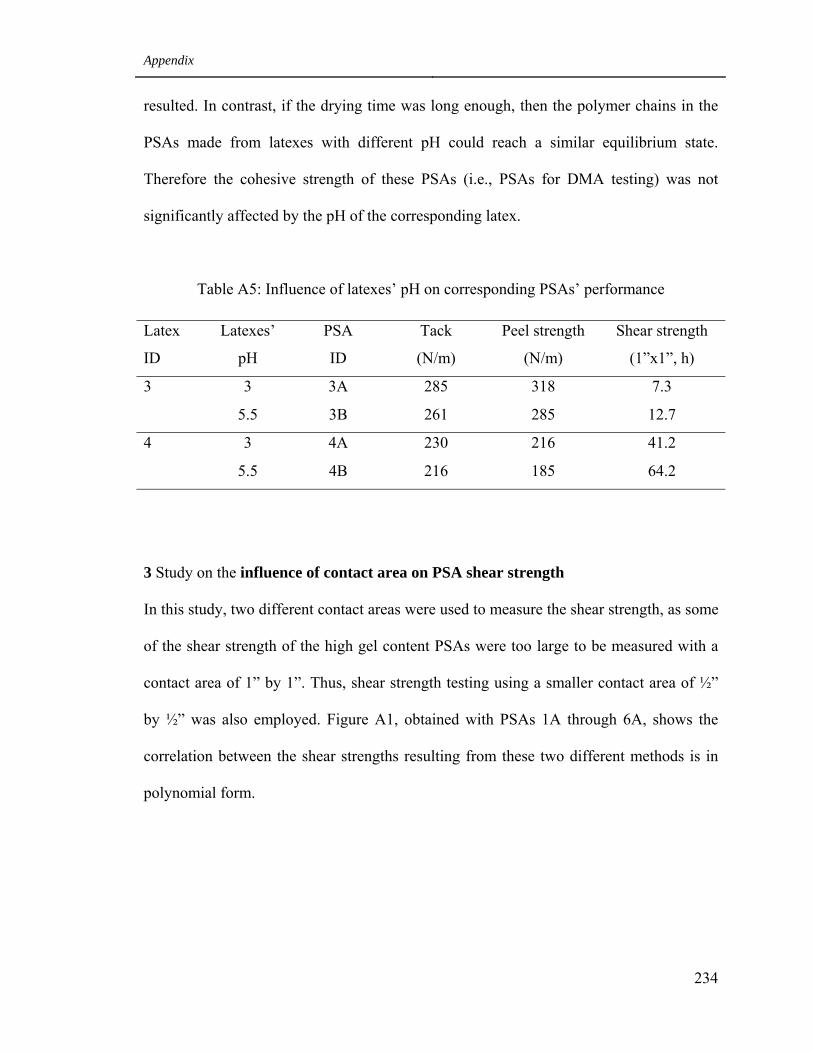
Appendix
234
resulted. In contrast, if the drying time was long enough, then the polymer chains in the
PSAs made from latexes with different pH could reach a similar equilibrium state.
Therefore the cohesive strength of these PSAs (i.e., PSAs for DMA testing) was not
significantly affected by the pH of the corresponding latex.
Table A5: Influence of latexes’ pH on corresponding PSAs’ performance
Latex
ID
Latexes’
pH
PSA
ID
Tack
(N/m)
Peel strength
(N/m)
Shear strength
(1”x1”, h)
3 3 3A 285 318 7.3
5.5 3B 261 285 12.7
4 3 4A 230 216 41.2
5.5 4B 216 185 64.2
3 Study on the influence of contact area on PSA shear strength
In this study, two different contact areas were used to measure the shear strength, as some
of the shear strength of the high gel content PSAs were too large to be measured with a
contact area of 1” by 1”. Thus, shear strength testing using a smaller contact area of ½”
by ½” was also employed. Figure A1, obtained with PSAs 1A through 6A, shows the
correlation between the shear strengths resulting from these two different methods is in
polynomial form.
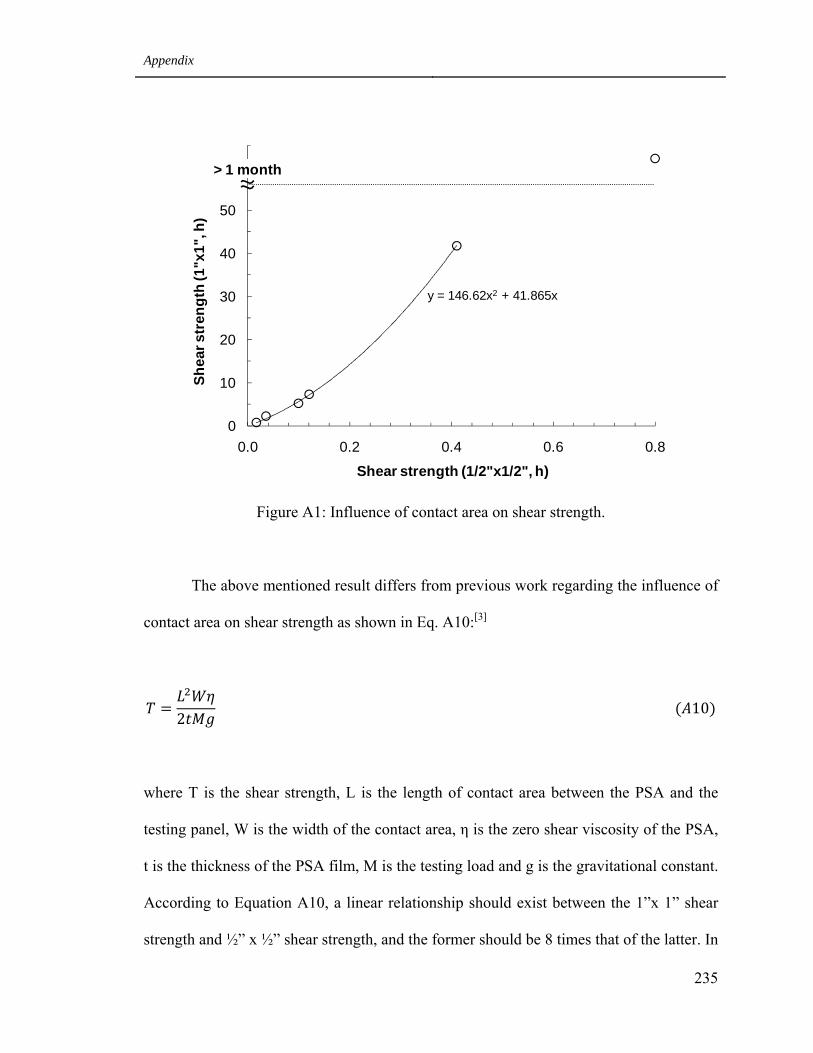
Appendix
235
Figure A1: Influence of contact area on shear strength.
The above mentioned result differs from previous work regarding the influence of
contact area on shear strength as shown in Eq. A10:[3]
2 10
where T is the shear strength, L is the length of contact area between the PSA and the
testing panel, W is the width of the contact area, η is the zero shear viscosity of the PSA,
t is the thickness of the PSA film, M is the testing load and g is the gravitational constant.
According to Equation A10, a linear relationship should exist between the 1”x 1” shear
strength and ½” x ½” shear strength, and the former should be 8 times that of the latter. In
y = 146.62x2 + 41.865x
0
10
20
30
40
50
60
0.0 0.2 0.4 0.6 0.8
Shea
r str
engt
h (1
"x1"
, h)
Shear strength (1/2"x1/2", h)
> 1 month
Appendix
236
addition, the measured 1” x 1” shear strength in our study was far larger than that
predicted by Equation A10. Besides, the larger the ½” x ½” shear strength, the larger was
the difference between our measurement and the Equation A10 prediction using a contact
area of 1” x 1”. The differences likely arose for two reasons. In our study, the PSA
samples are versatile, ranging from gel-free to high gel content PSAs, while the PSAs
used for generating Equation A10 were all gel-free polymers. First, it is suspected that for
the PSAs produced in this study (especially those with medium to high gel contents), the
shear strength change with contact area was affected not only by the area but also by the
accompanying change in the packing state of the polymer chains in the PSA films. It is
known that the time needed for the polymer chains in a PSA to reach an equilibrium state
depends on the PSA’s microstructure. Higher gel contents and smaller Mc should
correspond to longer equilibrium times. Therefore, if all the PSAs were conditioned for
the same time (24 h, in this study), the polymer chains in the low gel content PSAs might
have reached an equilibrium state, whereas those in the high or even medium gel content
PSAs may not have. If the contact area was ½” x ½”, the PSAs fell from the testing panel
within a very short time (from several minutes to about 1 h for the PSAs in this study) in
contrast to when a contact area of 1” x 1” was used (from several hours to more than 1
month). This longer contact period in the case of the 1” x 1” contact area may have
allowed the polymer chains to migrate and form better entanglements during the shear
strength testing, therefore resulting in improved shear strength. This coincides with our
experimental data that revealed how PSAs conditioned for a longer time had significantly
larger shear strengths for the same contact area. For example, after increasing the
conditioning time of PSA 6A (gel content: 75 wt%) from 24 h to 2 weeks, the shear
Appendix
237
strength at ½” x ½” was increased from about 0.8 h to 2 h. Nonetheless, the above
mentioned data also indicated that polymer chain diffusion should make only a minor
contribution to the very large difference between the 1” x 1” shear strength data measured
in our study and those predicted by Equation A10. A second, more compelling reason for
these shear strength differences however, arises from the generation of Equation A10.
The data used to generate Equation A10 were obtained from gel-free PSAs with very low
shear strengths. These PSAs had a more liquid-like behavior relative to the PSAs in our
study. Hence their deformation under a shear force could be roughly explained by
viscosity alone (e.g., not including elasticity) as in Equation A10. In fact, Figure A1
shows that a linear relationship exists between 1” x 1” and ½” x ½” shear strength
measurements at very low shear strength levels. This linear relationship is consistent with
what predicted by Equation A10. Figure A1: Influence of contact area on shear strength.
4 PSA film surface tension and chemical interaction energy between the surfaces of
PSA films and stainless steel testing panels
PSA film 5B and its post-heated counterpart, 5B-H126/11, were used for the relative
measurement and calculation. A contact angle method was used to measure the surface
tension of the PSA films with VCA Optima contact angle equipment from AST Products
Inc. DDI water and di-iodomethane (CH2I2) were used as the testing liquids with known
surface tensions.
4.1 Calculation of the surface tension for PSA films
The surface tension of a PSA film was calculated with the following three equations.[1]
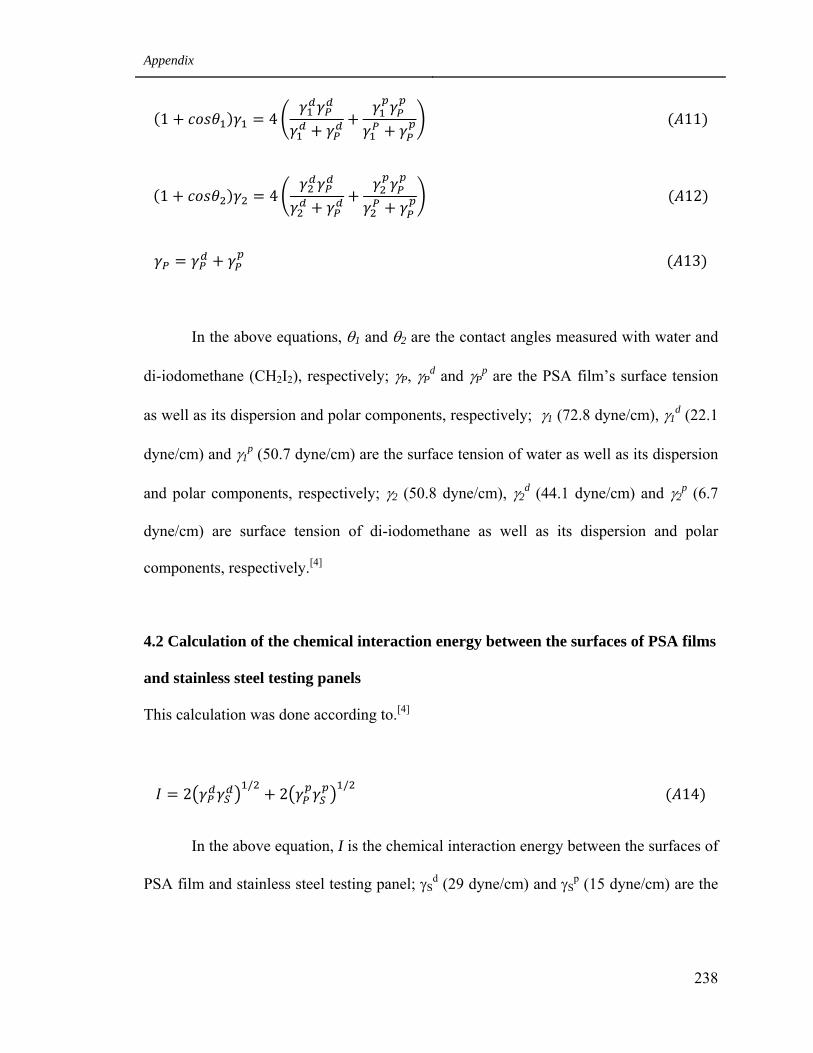
Appendix
238
1 4 11
1 4 12
13
In the above equations, θ1 and θ2 are the contact angles measured with water and
di-iodomethane (CH2I2), respectively; γP, γPd and γP
p are the PSA film’s surface tension
as well as its dispersion and polar components, respectively; γ1 (72.8 dyne/cm), γ1d (22.1
dyne/cm) and γ1p (50.7 dyne/cm) are the surface tension of water as well as its dispersion
and polar components, respectively; γ2 (50.8 dyne/cm), γ2d (44.1 dyne/cm) and γ2
p (6.7
dyne/cm) are surface tension of di-iodomethane as well as its dispersion and polar
components, respectively.[4]
4.2 Calculation of the chemical interaction energy between the surfaces of PSA films
and stainless steel testing panels
This calculation was done according to.[4]
2 / 2 / 14
In the above equation, I is the chemical interaction energy between the surfaces of
PSA film and stainless steel testing panel; γSd (29 dyne/cm) and γS
p (15 dyne/cm) are the
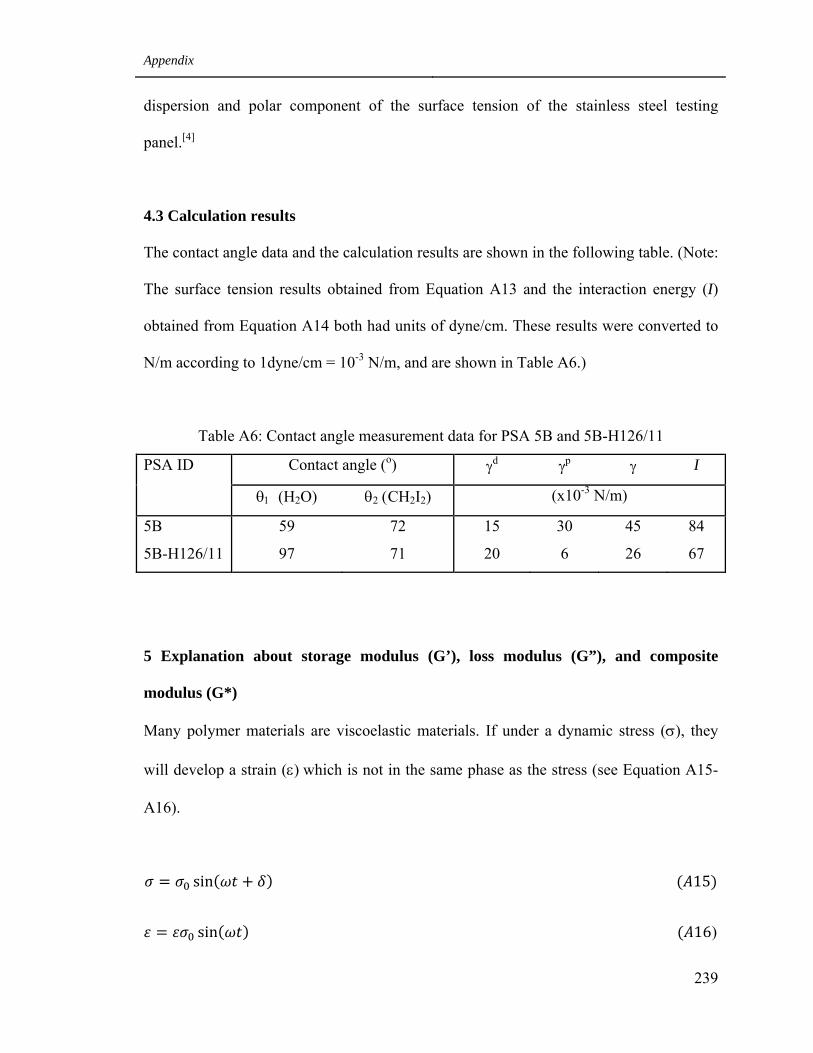
Appendix
239
dispersion and polar component of the surface tension of the stainless steel testing
panel.[4]
4.3 Calculation results
The contact angle data and the calculation results are shown in the following table. (Note:
The surface tension results obtained from Equation A13 and the interaction energy (I)
obtained from Equation A14 both had units of dyne/cm. These results were converted to
N/m according to 1dyne/cm = 10-3 N/m, and are shown in Table A6.)
Table A6: Contact angle measurement data for PSA 5B and 5B-H126/11
PSA ID Contact angle (o) γd γp γ I
θ1 (H2O) θ2 (CH2I2) (x10-3 N/m)
5B 59 72 15 30 45 84
5B-H126/11 97 71 20 6 26 67
5 Explanation about storage modulus (G’), loss modulus (G”), and composite
modulus (G*)
Many polymer materials are viscoelastic materials. If under a dynamic stress (σ), they
will develop a strain (ε) which is not in the same phase as the stress (see Equation A15-
A16).
sin 15
sin 16)
Appendix
240
In the above equations, ω is the frequency of strain oscillation; t is time; δ
is the phase lag between the strain and stress.
The storage and loss modulus (G’ and G”) of viscoelastic materials respectively
measure the stored energy, representing the elastic portion, and the energy dissipated as
heat, representing the viscous portion. The storage and loss moduli are defined as
follows:
17
18
Composite modulus (G*) reflect materials’ capability to resist deformation caused
by stress. It is defined as follows;
19
6 References
1. T. Wang, E. Canetta, T. G. Weerakkody, Acs Appl. Mater. Interface 2009, 1, p. 631-
639.
2. J. Horsky, O. Quadrat, B. Porsch, L. Mrkvickova, Colloid Surfaces A 2001, 180, p.
75-85.
3. D. Satas, Handbook of Pressure Sensitive Adhesive Technology, 2nd edition, Van
Nostrand Reinhold, New York, 1989, p. 105.
4. Yang H. W. H., Chang E. P., Trends in Polymer Science 1997, 5: 380-384.