Embed Size (px)
Citation preview

World Maritime University World Maritime University
The Maritime Commons: Digital Repository of the World Maritime The Maritime Commons: Digital Repository of the World Maritime
University University
World Maritime University Dissertations Dissertations
11-4-2018
Performance evaluation and solutions for port congestion Performance evaluation and solutions for port congestion
focused on the container terminal: a case study of Khalifa bin focused on the container terminal: a case study of Khalifa bin
Salman Port (KBSP) Kingdom of Bahrain Salman Port (KBSP) Kingdom of Bahrain
Mohamed Ebrahim A.S. Alhameedi
Abud Jamal Said
Tri Wahyunita Mudjiono
Follow this and additional works at: https://commons.wmu.se/all_dissertations
Digital
Commons
Network
Logo
Part of the Transport Phenomena Commons
Recommended Citation Recommended Citation Alhameedi, Mohamed Ebrahim A.S.; Said, Abud Jamal; and Mudjiono, Tri Wahyunita, "Performance evaluation and solutions for port congestion focused on the container terminal: a case study of Khalifa bin Salman Port (KBSP) Kingdom of Bahrain" (2018). World Maritime University Dissertations. 688. https://commons.wmu.se/all_dissertations/688
This Dissertation is brought to you courtesy of Maritime Commons. Open Access items may be downloaded for non-commercial, fair use academic purposes. No items may be hosted on another server or web site without express written permission from the World Maritime University. For more information, please contact [email protected].

WORLD MARITIME UNIVERSITY Malmö, Sweden
Performance Evaluation and Solutions for Port Congestion
Focused on the Container Terminal: A Case Study of Khalifa Bin Salman Port (KBSP) Kingdom of Bahrain
By
Mohamed Alhameedi (Bahrain)
Abud Jamal Said (Kenya)
Tri Wahyunita Mudjiono (Indonesia)
A dissertation submitted to the World Maritime University in partial
fulfillment of the requirements for the award of the degree of
MASTER OF SCIENCE
In
MARITIME AFFAIRS
(Shipping Management and Logistics)
(Port Management)
2018
Copyright, Mohamed, Abud & Tri 2018

ii
Dissertation Declaration
We certify that all the material in this dissertation that is not our own work has been
identified, and that no material is included for which a degree has previously been
conferred on us. The contents of this dissertation reflect our own personal views and are
not necessarily endorsed by the University.
Name 1: Mohamed ALHAMEEDI
Signature: ______________
Name 2: Tri Wahyunita MUDJIONO
Signature: ______________
Name 3: Abud Jamal SAID
Signature: ______________
Date:
Supervised by: Professor. Capt. Daniel Moon
Assessor:
Institution/Organization: World Maritime University

iii
Acknowledgments
In the name of Allah, the Compassionate, the Merciful, the King and the Sovereign Lord.
We thank Allah for giving us the support to accomplish our studies in the World Maritime
University (WMU) through the past fourteen months. The support we have received from
our employers and sponsors has been crucial throughout our studies. We would like to
extend our thanks and gratitude to the WMU faculty, administration and staff for their
continuous support and cooperation as they made us feel in a second home far away from
home.
Allah made our group members to meet in this lovely university to know each other and
form the team to perform this work, knowing each other is the best thing we have achieved
in Sweden, and this relationship will remain forever to cooperate in many various aspects
in future. Over the past 14 months; we were able to make friendships with different
colleagues from 47 different countries which can’t be found in any other university around
the world. The World Maritime University is an extraordinary, unique environment, and
we are sure that this experience might not come again in future, but the only thing will be
the everlasting the friendships and professional networks created in this multicultural
environment.
Professor Captain. Daniel Moon, your informative lectures, support, and guidance enabled
us to accomplish this dissertation and being under your supervision is an extreme honor
and privilege as we have gained valuable knowledge that has made us became better
maritime and shipping professionals. Mrs. Sue Jackson and Mrs. Lyndell Lundahl, since
the first day we noticed your care and diligence that is unforgettable and extraordinary,
special thanks from our hearts to both of you and your teams.

iv
Mr. Chris Hoebeke and the library team has also played a vital role in ensuring that we
have the latest and up to date data and that the rich library and databases at WMU are
frequently updated. We cannot thank you enough for going out of your way numerous
times, to facilitate our team research, and for providing a conducive atmosphere at the
library within which we have worked from many times to produce this work.

v
Abstract
Title of Dissertation: Performance Evaluation And Solutions For Port Congestion
Focused on the Container Terminal: A Case Study of Khalifa Bin
Salman Port (KBSP) Kingdom of Bahrain
Degree: Master of Science
This paper contains quantitative and qualitative data analyses where literature review has
been carried out to discuss the importance of ports, how ports are significant in the overall
supply chain, key/port performance indicators and suggestions to mitigate congestion.
Firstly, an analysis of 2 years of key performance indicators (KPIs) for KBSP has been
made to measure KBSP container terminal performance. Secondly, the reseachers have
used regression analysis to forecast future throughput (the dependent variable Y) of KBSP
versus more than 10 (independent variables X1 to X10) followed by an interpretation of
the results generated in the E-views software. Thirdly, the stakeholder’s voice has been
considered, and a minimum of 50 surveys were collected to express port customers’
insights in the analysis and final evaluation. SWOT analysis has also been carried out to
provide an insight into the Bahrain maritime industry and how internal and external factors
are affecting KBSP performance.
The qualitative and quantitative analysis are put together to form a meaningful
interpretation for solid terminal performance evaluation. Thus, a discussion was
performed to analyze and link the result of the port KPIs, E-views regression, SWOT and
the questionnaire for evaluating KBSP performance and coming up with possible
solutions. Finally, a recommendation was written upon the completion of the collective
analysis to set the suitable congestion mitigation measures in order to cope with the
current/future performance trends to meet port customers’ expectation.
Keywords: Analysis, APM Terminals, Bahrain, Concession agreement, E-views,
Regression, Efficiency, Forecast, KBSP, MSP, Port and Maritime Affairs, Port
Congestion, Port performance, KPIs, Questionnaires, SWOT, Port Authority, Ocean
Alliance.

vi
TABLE OF CONTENTS
Dissertation Declaration .................................................................................................. ii
Acknowledgments ........................................................................................................... iii
Abstract ............................................................................................................................. v
List of Figures ................................................................................................................ viii
List of Tables ................................................................................................................... ix
List of Abbreviations ....................................................................................................... x
1. INTRODUCTION ................................................................................................... 1
1.1 Background ...................................................................................................... 1
1.2 Aims and Objectives ........................................................................................ 7
1.3 Methodology ..................................................................................................... 8
1.4 Dissertation Workflow .................................................................................. 10
2. LITERATURE REVIEW ..................................................................................... 13
3. METHODOLOGY ................................................................................................ 21
3.1 Introduction .................................................................................................... 21
3.2 Data Collection Method ................................................................................. 23
3.3 Qualitative Methods ...................................................................................... 23
3.3.1 SWOT Analysis Approach .................................................................... 23
3.3.2 Questionnaires ........................................................................................ 23
3.4 Quantitative Methods .................................................................................... 24
3.4.1 Measuring the Port Key Performance Indicators (KPIs) .................. 24
3.4.2 Regression Analysis to Forecast the Future Throughput .................. 26
4. IN-DEPTH ANALYSIS OF KBSP ....................................................................... 29
4.1 General Overview .......................................................................................... 29
4.1.1 Vessels Calling KBSP ............................................................................ 29
4.1.2 Total Container Vessels Called KBSP 2016/2017 ............................... 30
4.1.3 Understanding the Characteristics of KBSP using SWOT Analysis 32
4.1.4 Stakeholders´ point of view ................................................................... 33
4.2 Results and Finding from the Quantitative Methods ................................. 36

vii
4.2.1 Performance of KBSP ........................................................................... 36
4.2.2 The Future Delineation of KBSP .......................................................... 42
4.3 Discussions: Ramification of the Port Performance ................................... 46
4.4 Implications: Improving KBSP .................................................................... 50
5. CONCLUSION ...................................................................................................... 56
REFERENCES ............................................................................................................... 59
APPENDICES ................................................................................................................ 64

viii
List of Figures
Figure 1: Location of KBSP .............................................................................................. 1 Figure 2: Container terminal of KBSP .............................................................................. 2 Figure 3: Bahrain Import Value by Billion USD from 1995 - 2016 .................................. 4 Figure 4: Research Structure ............................................................................................ 11 Figure 5: Research Design ............................................................................................... 22 Figure 6: Eviews Regression Flowchart .......................................................................... 26 Figure 7: KBSP Vessel by GT. ........................................................................................ 30 Figure 8: KBSP Vessels by Length Overall. ................................................................... 30 Figure 9: KBSP CT Vessels ............................................................................................. 31 Figure 10: KBSP Throughput .......................................................................................... 31 Figure 11: Regression KBSP Throughput Model and Equation ...................................... 43 Figure 12: E-views Forecast Comparison ........................................................................ 46 Figure 13: KBSP TEUs per annum from 1998 - 2017 .................................................... 50 Figure 14: MSP/KBSP Number of Vessels 2005 - 2017. ................................................ 53

ix
List of Tables
Table 1: KBSP main terminal information ........................................................................ 3 Table 2: Methodology Review. ....................................................................................... 21 Table 3: KPIs Used for KBSP CT Analysis .................................................................... 25 Table 4: KBSP TEU throughput Estimation in E-Views. ............................................... 28 Table 5: Independent Variables ....................................................................................... 28 Table 6: Matrix of the SWOT Analysis Results .............................................................. 32 Table 7: Questionnaires Results overview ....................................................................... 33 Table 8: KBSP KPIs Years 2016 / 2017 .......................................................................... 37 Table 9: Significant Variables. ........................................................................................ 42

x
List of Abbreviations
AGBT Average Gross Berthing Time
AIT Average Idle Time
AMT Average Manoeuvring Time
ALOA The average length overall
APMT AP Møller Maersk Terminals
AST Average Service Time
ASTT Average Ship Turnaround Time
APR Average Productive Ratio
ATP Average Time in Port
BOR Berth Occupancy Rate
BSO TEU Per Ship Per Berth Hour
CMA-CGM Compagnie Maritime d'Affrètemen - Compagnie Générale Maritime
CUR Crane Utilization Rate
CT Container Terminal
CY Container Yard
GBP Gross Berth Productivity
GCP Gross Crane Productivity
GT Gross Tonnage
IMO International Maritime Organization
JIT Just In Time
KBSP Khalifa Bin Salman Port
KPIs Key performance indicators
LPC Lifts Per Call
LUR Labour Utilization Ratio
MOL Mitsui OSK Lines
MSP Mina Salman Port

xi
MTT Maritime Transport and Telecommunication
NCP Net Crane Productivity
NYK Nippon Yusen Kabushiki Kaisha
OOCL Orient Overseas Container Line
OPEX Operating Expense
PMA Ports and Maritime Affairs
POD Port Operations Directorate
PPIs Port performance indicators
PSO TEU per Ship per Port Hour
REC Research Ethics Committee
RTG Rubber Tired Gantry crane
STS Ship to Shore Crane
SWOT Strength Weakness Opportunity Threat
TEU Twenty foot Equivalent Unit
TOS Terminal Operating System
TPCH TEU Per Crane Hour
TPSPD TEU Per Ship Per Day
UAE United Arab Emirates
UNCTAD United Nations Conference on Trade and Development
WMU World Maritime University
WSO TEU Per Ship Working Hour

1
1. INTRODUCTION
1.1 Background
In recent years, more port authorities and administrations are moving towards
implementing policies geared towards improving port performance and efficiency. Many
countries and port authorities have seen privatization as an effective tool towards reducing
port congestions, improving efficiency and reducing the financial burden on the
governments, in the form of wages and capital-related expenditure, while bringing an
onboard wealth of technical and commercial expertise in port management and operations.
After the successful privatization in the Kingdom of Bahrain, terminal congestions
increased and challenged the main commercial port in the country Khalifa Bin Salman
Port (KBSP). This resulted in a huge backlash from the port stakeholders as always is the
case where privatization is involved at the port.
Figure 1: Location of KBSP
(Source: MTT, 2018)

2
The new Khalifa bin Salman Port (KBSP) is a multipurpose port and considered
as the primary trade gateway according to Almahmood (2018). The KBSP facilitates the
import of all type of cargoes that are required by the consumers; it also handles some raw
materials required by industries for production (MTT, 2016). The terminal is equipped
with a limited number of equipment namely (4 STS and 12 RTGs) to handle the incoming
containers and general cargo vessels. The table below shows key port information and the
breakdown of the main port handling equipment at the terminal:
Figure 2: Container terminal of KBSP
(Source:MTT, 2018)

3
Table 1: KBSP main terminal information
(Source: APMT, 2018)
This research is, therefore, focused on Khalifa Bin Salman Port (KBSP) to analyze
the container terminal operation, in order to understand and evaluate current KBSP
performance, privatization and make recommendations in order to tackle the congestion
issue raised by the trade in Bahrain and recommend possible ways of improvements
accordingly. According to Undata (as cited by Alhameedi, 2017), the maritime industry
in the Kingdom of Bahrain is a critical element for the national economy; as maritime
shipping is considered as the main transport mode where most of Bahrain’s import and
export are being handled. According to Atlas (2018), Bahrain’s import value by money
increased by 739% from 1.43 billion USD in 1995 to reach 12 billion USD in the year
2016. China, Saudi Arabia, Japan, and the UAE are the main trade partners and import
origins for cargoes imported by Bahrain by sea. Figure 3 shows that the import values are
within 1 to 2 billion USD during the year 2000 when emerging economies started to
develop and removed all trade barriers globally. The government of Bahrain had been
operating the previous commercial port Mina Salman Port (MSP) from 1962 until 2005;
thereafter APM Terminals took over the operations in 2006 after obtaining the 30 years
concession agreement to operate MSP and then KBSP (Almahmood, 2017).

4
However, by early 2000 the MSP superstructure and infrastructure were aging and
deteriorated due to the high utilization caused by the increased traffic that led to port
congestion (Obg, 2007). By then, the government had plans underway to develop the
privatization plan for Bahrain port industry. This led to ceasing any port investment
projects especially infrastructure maintenance including the acquisition of new port
handling equipment (Almahmood, 2018).
The government was keen on building and developing an integrated port facility
and logistics zones to cater for the increasing size of ships as a result of the growth of
global shipping demand (Obg, 2008). As a result, the government decided to privatize the
port and develop KBSP, allowing it to be operated by an experienced global port operator
to improve the port industry and its infrastructure, hence serve port customers better and
at the same time be able to cope with the continuously growing imported cargoes.
According to the U.S. Department of State (2013), in 2001 the first step that was taken by
the government to develop the port sector was to develop the required legislation in order
to include privatization as part of the national law. This was to remove the legal barriers
and call upon international companies to invest in Bahrain ports through developing an
0
5
10
15
20
25
19
95
19
96
19
97
19
98
19
99
20
00
20
01
20
02
20
03
20
04
20
05
20
06
20
07
20
08
20
09
20
10
20
11
20
12
20
13
20
14
20
15
20
16
Bill
ion
Year
Figure 3: Bahrain Import Value by Billion USD from 1995 - 2016
(Source: Atlas, 2018)

5
agreement that would allow for world class management and operation of the port. The
government announced the privatization of Bahrain ports (KBSP) and called upon global
port operators to participate in the port tendering process. As a result, several global
leading port operators including PSA Singapore, DP World from the UAE and APM
Terminals from Denmark participated in the bidding (Almahmood, 2017). APM
Terminals was eventually selected as the winning bidder and given the exclusive rights to
operate KBSP for 30 years through a concession agreement (Almahmood, 2017).
KBSP began operations officially in 2009 (MTT, 2016). According to MTT
(2016), APM terminals was selected to operate, manage and develop the port because it
was classified as one of the top ten global operators that possesses expertise in port
operations. The government believed that the appointment of APM Terminals would
result in a significant development for the port and maritime industry that would lead to
positioning Bahrain as key player in the maritime industry regionally (Legalaffairs, 2006).
The investment that was made by APM Terminals in KBSP was equivalent to sixty-two
million USD to equip the port with the best available technology for providing port-related
services to port customers. Among the key acquisitions made by APMT included port
equipment, such as four ZPMC gantry cranes or shore-to-ship cranes (STS) and twelve
ZPMC rubber-tired gantry cranes (RTG), which were procured brand new from the
manufacturer in China (MTT, 2016). The KBSP yard design was improved to suit the
RTG operations as the old port MSP was operated with different port handling equipment
(straddle carriers) which had the disadvantage of losing ground slot capacity per TEU
(Alsalem, 2017).
Initially, the old port was operated with a container stack of two high which is a
straddle carrier container stack, while KBSP is now operated with RTGs and are able to
stack up to four containers high as a method of increasing capacity hence improving port
performance. The reason for designing KBSP for RTG operation is that the TEU capacity
is currently 1.1 million TEU at phase one and expected to reach 2.5 million TEU with
phase 2 (Almahmood, 2018). Despite the significant achievements made by the

6
government in developing the port and maritime industry through privatization, the
shipping sector in Bahrain is still unsatisfied with the services provided by APM
Terminals at KBSP because of the unreliable performance (Albastaki, 2018). The
stakeholders have claimed that there are delays caused by port congestion in delivering
and receiving cargoes from/to the port. The port stakeholders voiced their concerns to the
government and sent several letters and petitions complaining about the port congestion
issue (Albastaki, 2018). The apex body which represents traders in Bahrain and the
Bahrain Chamber of Commerce (BCCI) approached the port authority and addressed the
port congestion issue in several meetings.
The BCCI representative said that clearing import containers and vessel
turnaround time exceeded some two to three days due to the shortage of laborers and
equipment (BCCI, 2015). This prompted, the researchers to conduct a survey by
questionnaires which were circulated to all the relevant stakeholders including
Government agencies, shipping lines, freight agents and customs brokers in order to gauge
the satisfaction level of the industry. The low productivity caused port congestion and
delay of the cargoes at the terminal, therefore, claims were raised against APM Terminals
by port stakeholders due to the delay of clearing imported containers (Albastaki, 2018).
As a result, several industries, stores, and retailers increased the price of the imported
commodities and merchandise, due to limited inventory and extended lead time caused by
port congestion and consequently, passed on the additional cost incurred due to port delays
to be paid by the ultimate end users. APM Terminals received several complaints and
claims to this effect and had to compensate the affected parties due to the delays and
inconveniences caused by slow clearance of imported shipments (Albastaki, 2018).
Due to its critical role as the only port, any disruptions at KBSP such as congestion
may subsequently affect Bahrain maritime industry as well as the end consumers. It is,
therefore, crucial to appreciate the importance of providing reliable port services to the
country to sustain the businesses as reliable port services will eventually lead to the
development of the national economy. It is, therefore, imperative to have a holistic picture

7
of the supply chain, and to fully consider the importance of all nodes and links in order to
realise supply chain theories such as Just In Time (JIT). The motivation of the researchers
to conduct this research is coming from the importance of the maritime sector of their
respective countries. The maritime industry provides their communities with various types
of essential commodities.
The researchers also believe that any delays in the clearance of cargoes from the
port can have a detrimental impact on the entire industry. This may lead to losing its
reputation and competitiveness in the region. It is also important to mention that one of
the researchers works for the port authority of Bahrain (The Ports and Maritime Affairs –
PMA), and part of his responsibilities is to periodically monitor and report KBSP
performance to the PMA’s Management (MTT, 2016). The importance of the issue at
hand comes from the researcher’s responsibility as a government official; to examine the
problem and come up with the best possible solutions to help in resolving the port
congestion issue.
Port performance is one of the most important issues to be looked into at any port
as it may impact port competitiveness, reputation and hinder ports from reaching a
competitive edge (Moon, 2018). Being a state-of-art facility, KBSP is a developed port
and operated by one of the leading port operating companies, which is capable of
overcoming the port congestion issue. The congestion issue at KBSP should, therefore, be
examined from a theoretical perspective through reviewing literature to know what the
authors and the industry practitioners have said about the port congestion issue and what
are the best available tools that can be used to analyze and resolve port congestion issues.
1.2 Aims and Objectives
Based on the background above, this study aims to provide overall insight into the
container terminal performance and in particular mitigating port congestion issues.
Furthermore, the specific objectives of this research include:
a. To evaluate the current container terminal performance of KBSP.

8
b. To analyze the issues and problems that gave rise to the congestion of KBSP.
c. To make specific, urgent recommendations to mitigate KBSP congestion.
d. To provide insight and contribution to the port authority (PMA) and the
management of APMT and related stakeholder in particular, and for other ports
that face similar problems across the world.
1.3 Methodology
This research utilized mix methods of qualitative and quantitative data collection
that has been employed for analyzing the KBSP container terminal performance. The
results of the analysis for the current port condition will be synthesized through a literature
review, questionnaires and Bahraini maritime industry experts. The resources of the study
and the literature review will include port statistics, WMU materials, academic resources,
and correspondence with Bahraini government officials. In addition, the Assistant
Undersecretary for Port Affairs will also be interviewed, and a copy of the questionnaire
will be provided to him to participate in this research. Port stakeholders will also
participate in the questionnaire to have their opinions in this respect.
The research carried out also involved empirical tests where quantitative data of two
years’ port statistics were collected and analyzed and the main KPIs/PPIs calculated. In
addition, a regression in E-views software was carried out using independent variable
(Y=throughput) and dependent variables (X1 to X10). The regression and forecast in E-
views were made to identify, using thirteen years data, the variables affecting the port
performance (Y) and estimate the KBSP future throughput. The regression and forecast
results are interpreted in order to understand the inferences of the final results and
hypothetically test the problem and come to a logical conclusion of the evaluation
(Alhameedi, 2018). The forecast was carried out in order to predict the future throughput
of KBSP to help in coming up with the appropriate solutions for the congestion issues.
Key port statistical data were been analyzed in the aforesaid analytical tools to calculate

9
KPIs/PPIs, identify variables affecting throughput, predict the future container throughput
and arrive at the best congestion mitigation measures according to the trend concluded.
In order to help to analyze and understand the factors affecting the port’s
performance internally and externally, a preliminary SWOT analysis was developed on
this research in order to create a comprehensive approach and address internal and external
factors that are contributing to the port congestion (Alhameedi, 2018). After that, the
quantitative data interpretation was made as generated from the analysis output by the
analytical tools. The comprehensive SWOT analysis interrelation was made to understand
the relation between the possible causes of the problem and therefore come to a conclusion
to make the best possible recommendations (Alhameedi, 2018).
The research ethics guidelines set by WMU are adhered to because any research
should consider the ethical matters when conducting any research that involves
questionnaires and/or interviews (Alhameedi, 2018). In this regard, the Research Ethics
Committee’s (REC) approval has already been sought for and obtained to enable the
researchers to conduct the research according to WMU’s guidelines in coordination with
the Port Authority of Bahrain. Besides, WMU’s official REC’s consent form was
embedded into the questionnaire form that was sent to the port stakeholders prior to the
beginning of the research (Alhameedi, 2018). Furthermore, the researchers have strictly
adhered to the preliminary timeline developed for the research as agreed and approved by
WMU. The researchers appreciate the academic procedure as stated by the WMU and
therefore followed the dissertation writing guidelines in particular.
The interpretation of the quantitative and qualitative analysis helped the researchers
in developing the best possible solutions for KBSP congestion. Furthermore, various port
congestion solutions were addressed in the recommendations such as investing in human
resources and port laborers, investing in new technologies, equipment, digitalization, and
port re-planning to help mitigate KBSP congestion. The results of the research will form
a basis for further discussions and consultations with the Assistant Undersecretary of PMA
to determine the way forward and any cost involved in implementing these solutions. The

10
role of the port authority is to regulate and monitor the performance of the port operating
company. This relationship between PMA and APM Terminals is regulated as per the port
concession agreement (Legal affairs, 2006). The contract between the government and
APM Terminals may limit the implementation of the solutions mentioned in this research
because of the cost involved for some of the measures. There is a need for improving
KBSP performance in order to retain the main port customers (shipping lines) calling the
port and attract more shipping lines in this fierce competition industry.
1.4 Dissertation Workflow
In order to achieve the objectives of this dissertation, the research is divided and organized
into the following five chapters:
Chapter one covers the background of the research and the congestion problem at KBSP.
Besides, the motivation of the project, aims and objectives have been addressed in this
chapter to indicate the importance of the study and how it is affecting the country in
question. The expected results, assumption and potential limitations have also been
concluded in chapter one.
Chapter two contains an in-depth literature review that is related to the port performance
and congestions to have a better insight into the problem at hand. The literature has also
clarified how ports can measure performance and enhance productivity and efficiency. A
comprehensive literature review was made to address the port congestion problem; and
also this chapter has examined and provided a better understanding of the problem from a
theoretical/academic perspective.
Chapter three provides the research methodology and the conceptual framework
deployed in investigating the research topic. In addition, this chapter has covered the
research design and how the data was collected and analyzed using the analytical tools
explained in chapter one.

11
Chapter four presents the result obtained from the analytical tools that have been used in
the research with the interpretation of different information as per the statistical data,
questionnaires, interviews and port statistical reports. This chapter discussed the potential
solutions that can be utilized in order to enhance the port performance and mitigate port
congestion for KBSP.
Chapter five contains the summary of the study according to the result obtained from the
analysis and the conclusion of the evaluation of KBSP whilst highlighting possible
limitations.
Below is the literature review that discusses the definition of the port and what
importance it has for a country’s national economy. The literature will also discuss how
important reliable port logistics and performance are in mitigating congestion through
managing resources, labor, and information. Besides, the literature also illustrates what
authors and industry practitioners have said about port efficiency and performance
reliability. Furthermore, the literature will also discuss how the port efficiency and
container terminal operations, in particular, is significant for the overall global economy
and the competition that ports create for the nation to compete through port service quality.
• IntroductionChpater 1
• Literature ReviewChapter 2
•MethodologyChapter 3
•AnalysisChapter 4
•ConclusionChapter 5
Figure 4: Research Structure
(Source: Author, 2018)

12
In addition, the researchers will critically analyze and combine the different opinions from
the authors and relate it to KBSP for further understanding.

13
2. LITERATURE REVIEW
According to Moon (2018), ports are critical facilities where ships berth, and
containers, cargoes and passengers interchange takes place. Ports may also refer to
multiple harbors that consist of facilities and shelters for different types of vessels. Other
definitions refer to a port as an organization where the handling and operations of
waterborne traffic are being loaded, unloaded, transhipped, transferred reloaded, stored
and delivered from/to port stakeholders. The port organization normally consist of a port
operator, customs, warehouses, yards, berths, quay walls, quarantine, port handling
equipment and gate (Moon, 2018). The main stakeholders are the shipping lines, clearing
brokers, freight agents, truckers, manufacturers, and consumers. Port logistics in the
context of ports is referred to as the strategic and effective management of various logistics
processes such as communication, flow of information, procurement, storage,
consolidation and dispatching through the assigned communications medium in a cost-
effective manner to achieve organizational goals and mainly profit maximization in
relation to the port functions (Knemeyer, 2006).
Logistics is defined as moving the right thing at the right time at the right place at
the right price, and the R can be further extended as per the business or customer
requirement (Moon, 2018). As such, ports are considered as an interface between the
shippers and the consignees or in other words, it is the central processing node for the
cargo interchange, logistical operations and value-added services from the shipper to the
consignee. Port activities consist of different operations and functions that facilitate
smooth and reliable movement of the cargo and the containers imported/exported through
the port; and may also add value to a particular shipment. Port related support activities

14
include, transportation, packaging, warehousing, cargo/container handling, and
information processing. From the literature, the importance of ports and how they play a
critical role in the national and international trade is highlighted clearly. That is why
Knemeyer (2006) mentioned in his book that flow of cargo and related information should
be organized and managed strategically in a way that profit is maximized to the highest
possible levels. Profit maximization in a port may not be achieved without operational
excellence performance, efficiency and effectiveness. Time also plays a vital part from
the perspective of all stakeholders, including the port operator and authority. Examples
may include vessel turnaround time, container handling time per crane and container pick
up time by a consignee. This should be reduced to the minimum levels possible so that all
the stakeholders are able to make use of the time utilized for that particular operation;
hence improving efficiency and maximizing on profits. Therefore, port congestion or
delays may impact the port logistics and the effect can be cascaded to the port stakeholder
who can be affected along with the end consumers (Moon, 2017).
With ports being the critical nodes, they act as a strategic hub to provide essential
services that add value to the imported and exported products (Kissling, 2007). The
services provided at the ports include loading, offloading, stuffing, de-stuffing,
transporting, storage, sorting, consolidation and dispatching of cargoes (Moon, 2018). The
efficiency in delivering these services is highly essential to all port customers, and it is
imperative that port operators should be able to manage available resources well, in a
manner that will enable the port to deliver world-class services to its customers. Labor
and equipment need to be managed appropriately to achieve performance efficiency in
vessel handling and yard operations that leads to on-time deliveries and ultimately fulfill
customer’s requirement as well as satisfaction (Tang & Lee, 2011; Wang, 2017). It is very
clear from Tang’s and Wang’s literature that service quality is the main driver for retaining
customer and profit maximization which is a win-win situation.
A port needs to offer reliable, efficient and effective services because only then will
it be able to retain its customers, especially in the case of shipping lines where vessel

15
turnaround time needs to be minimized through high performance. Additionally, the
excellence in port performance will lead to generating profits when port services are
performed efficiently and effectively. Customer satisfaction translates to business
continuity, strengthened business relationships between the port and its stakeholders,
more volumes as port provides reliable services and ultimately realizing a win-win
situation for all parties involved. It is critical from the port logistics perspective to
minimize the time taken in providing a service (such as container delivery) for a port
customer as the delay may have financial and economic implications to various parties.
Subsequently, all parties across the supply chain can benefit from minimizing unnecessary
waiting time which will ultimately improve the port efficiency as containers and cargoes
are delivered on time to the customers at the promised time slot allocated by the port.
The importance of ports comes from the role they play and the contribution they
make in developing national economies. Ports are hubs and centers of operations within a
supply chain, and their reliability becomes critical for the whole supply chain.
Furthermore, reliable and efficient port services can help a country’s economic
development through supplying the industries and citizens with the required materials
when needed; and can, therefore, compete with neighboring ports to attract major shipping
lines through the provision of world class services and reliability (Tang et al, 2011b). Port
performance can be impacted by many factors (internal and external) that need to be
addressed by the port authorities and port operating companies and taken into
consideration to lessen the impact in the overall maritime business for the country in
question. For example, port congestion may occur due to force majeure, weather
condition, failure or shortage of equipment and lack of skilled port labors. Consequently,
port operational disruption or poor performance can negatively impact the entire supply
chain and therefore all other parties and port stakeholder’s interests are affected
accordingly (LOH & THAI, 2015).
Tang, Lee and Chew (2017) discussed the importance of the ports within the supply
chain. It can be understood that ports are an important node within the supply chain and

16
all possible efforts should be made in order to maintain port performance levels at the
highest level as possible to satisfy and retain port customers and mainly shipping lines.
Additionally, the port customer will always expect service excellence and efficiency
through provision of various port functions and activities such as vessel maneuvering,
loading, unloading, cargo transfer, storage, and dispatching of cargo. Port capacity,
therefore, needs to be adjusted accordingly in order to improve the weakest link of the
port supply chain as it is known that the chain is only strong as its weakest link (Moon,
2017). Ports should refrain from providing services that exceed their capacities and should
not receive or handle large container vessels unless all the supporting equipment and
infrastructure are equally capable, in terms of capacity, to handle the volumes brought by
incoming vessels (Moon, 2018). Tang, Lee and Chew (2017) stressed on the importance
of the port service quality and its significance in economic growth through revenue
maximization and through reliable and efficient handling of the vessels and cargoes
brought into the terminal.
It is important to note that the amount of container traffic that was handled by the
old port (MSP) has never exceeded 200K TEU annually and the port was handling feeder
vessels only. Since its inauguration in 2009, KBSP has been handling almost triple the
capacity of MSP with volumes ranging between 300K and 500 K TEU annually
(Almahmood, 2018). The dramatic increase in the volumes handled by KBSP is due the
population increase and economic growth of the country. KBSP also experienced an
increase in the number of calls of mother container ships which are loaded with thousands
of containers consigned for Bahrain’s captive market (Almahmood, 2017). APMT
management did not anticipate the large volumes carried by the mother vessels
considering the limited number of port handling equipment. As a result, the increase in
ship size led to an increase in the ships’ waiting time as ships have to wait longer in
anchorage and will have long service time as the port is unable to cope with the traffic
growth.

17
Knemeyer (2006), suggests that information and future planning should be managed
effectively in order for the port to effectively plan and be equipped with adequate
infrastructure and equipment, in anticipation of the growth of traffic volumes, which is
apparently KBSP had overlooked. Tang, Lee and Chew (2011) also stated that customer
retention is determined by the quality of the services provided. KBSP is currently facing
challenges with this because of the delays caused by the port congestion. Normally, the
main reasons for having the ships wait in the anchorage area for a long time is the slow
operation of the vessels that are already alongside, and the gate operations that cause
shifting of port handling equipment from the berth operations to support the gate’s
received and delivery operations (Albastaki, 2018). These equipment are mainly RTGs,
terminal trucks, reach stackers and heavy forklifts which are limited as mentioned earlier
in this research. Therefore, port congestion is a complex issue that poses a major challenge
to many ports globally even in the recognized terminal around the world.
It is important for governments and port operating companies to work hand in hand
in order to solve the port congestions issues. Particularly, the development of the logistics
and port sector is one of the main agenda items for Bahrain’s Government and it is
important to investigate the issue and recommend the best solutions to enhance the port
and maritime sector through providing world-class port services. Bahrain port authority is
currently making several initiatives and conducting projects to develop the maritime
industry and contribute to enhancing port performance and efficiency such as automation,
single window integration and dredging Bahrain approach channel and APMT’s
investments to accommodate larger vessels (MTT, 2016). Nevertheless, the port has a
limited number of port handling equipment according to figure 3 that illustrate the key
port information, as the terminal is equipped with four shore to ship cranes and 12 rubber-
tired gantry cranes, which are not sufficient, especially during peak operating times as the
port experiences an increase in throughput.
On one hand, port authorities’ role in regulating port operators is to ensure that the
port is always delivering best services to its clients and sufficiently market it. This is to

18
promote and attract the major shipping lines to utilize the facility and increase the
container volumes. However, the port needs to invest and provide adequate
infrastructure/superstructure and equip the port with a sufficient number of handling
equipment to cope up with the expected volumes. KBSP handled around half million
TEUs in 2015 and made a remarkable record which the KBSP never handled and even in
Bahrain’s maritime history (APMT, 2018). During the same year, KBSP’s management
reached an agreement with some of the shipping alliances to start calling KBSP using
some of their largest mother vessels that have a length over all of 350 meters (BNA, 2018).
This collaboration between the port authority and APMT resulted in a win-win situation
where the main three alliances such as 2M (MAERKS, MSC, HMM), the ocean alliance
(CMA-CGM, Cosco Group, OOCL, and Evergreen) and the alliance (Hapag Lloyd, NYK,
Yang Ming, MOL, K-Line) deployed their vessels to KBSP and included Bahrain in their
regular scheduled services to the region (MTT, 2016) making KBSP important hub in the
region for the alliances.
The KBSP is capable of handling small to medium size vessels (Almahmood, 2018).
Receiving larger vessels with greater container volumes may result in bottlenecks and
consequently port congestion. According to Moon (2018), high berth utilization means
high ships waiting time that can result in slow container handling and, therefore, port
congestion. In addition, it can be concluded from the literature that utilizing terminal
facilities and port handling equipment at high levels does not mean that it is the optimal
level of utilization. In other words, port operators should understand that 100% port
utilization does not indicate performance efficiency and effectiveness. On the contrary,
continuous high levels of utilization can lead to terminal congestion. Terminals and port
authorities should work closely to find the best fit for handling capacity and utilization
levels to manage the terminal operation. The optimal TEU capacity for a port with four
berth terminals and 4 STS cranes is 100K TEU per crane and the optimal berth utilization
level for a four berth terminal should not exceed 60% (Dragović, 2009).

19
From a vessel operator’s perspective, port congestion is described as the condition
where a vessel on arrival spends more time at anchorage waiting to be berthed. The
terminal operator would express congestion as the number of container/cargoes that are
coming to the port as being more than the empty available storage slots in the yard. In this
context, more ships will queue up in the vessel anchorage area waiting to get berthed at
the terminal. The waiting time is calculated using ship service time which is one way of
measuring the efficiency of the port (Onwumere, 2008). Based on classical transportation
magazines, logistics, freight, and multi-modal transportation, most claim that port
congestion is a common obstacle that may affect economic growth because it has negative
implications on economic resources, waste of time and space as well increased operating
costs and incurring costs to the community (Oyatoye, 2011).
Key performance indicators (KPIs) and Port performance indicators (PPIs) play
an essential role in helping to measure and analyze the performance of the port operations
in order to provide insight for the management to identify bottlenecks at the terminals.
Primarily, the port KPIs/PPIs analysis can be used to compare port performance with the
targeted levels and also monitor performance of the terminal in question. Furthermore,
KPIs/PPIs can be a useful tool to assist the port operator and port authority to take
decisions that help in controlling and mitigating any operational issues whilst assisting in
developing strategic plans that can improve port performance (UNCTAD, 2017). It can
be concluded, therefore, that ports play an essential role not only in economic
development of a country but also in sustaining businesses and the nation’s prosperity.
Thus, the sustainability of ports is an important pillar in industry’s growth. Port
performance should be considered by governments and port operators in order to achieve
an adequate level of port services to ensure that cargoes are handled without delays.
Entities within the port need to collaborate with the port authority and the port operating
company to achieve port performance excellence. This can be done by adhering to
industry best practices such as taking delivery of cargoes from the port as soon as the

20
cargoes are available for delivery. It is important to note that ports are not intended to store
cargo but only to facilitate the receipt and delivery.
Ports are a critical link in the supply chain, and smooth flow of cargoes is essential
and important for all players across the supply chain because of the economic interest and
necessity. Therefore, moving cargoes as per the 5R or 7R concept is an ultimate objective
for port stakeholders. Ports compete globally through provision of world-class services at
ports so as to attract and retain the shipping lines. Thus, there is a high interest for the
researchers to conduct this research because KBSP is the main gateway to the country and
the only port in Bahrain. The country imports most of its needs of goods through this port,
and it is necessary that the port services are delivered efficiently to ensure smooth flow of
goods and optimum inventories are realized in the local market.
There have been several complaints raised by port stakeholders regarding KBSP
congestion and delays in clearing cargoes. The research team was incentivized to carry
out the research due to the increasing global trend of port privatization and hope that the
research can assist not only KBSP but also serve as a base point for reference to other
ports who may or may not be privatized but are facing performance problems. In respect
to Bahrain maritime industry, no such research has been initiated; thus this paper seeks to
provide in depth knowledge in regard to the topical issue. The researchers are also
motivated to solve the congestion at KBSP which will benefit Bahrain and help the
country to achieve the optimal port performance levels. This is because there have been
several complaints raised by port stakeholders regarding KBSP congestion and delays in
clearing cargoes. Therefore, the researchers will use qualitative and quantitative analytical
tools in order to evaluate the performance level at KBSP and develop possible solutions
to mitigate the port congestion, which will be discussed further in the following chapters.

21
3. METHODOLOGY
3.1 Introduction
This chapter seeks to discuss the methodology, assist to formulate research designs
and explain the data collection methods and analytical tools used for this study. The
researchers have made a preliminary analysis through SWOT in the introduction part to
analyze the Bahrain maritime industry in order to understand the context within which
KBSP currently operates in. The main objective of this research is not just to describe the
state of the port under this study, but also include the process of exploring facts through
the data analysis in order to reach the best possible solution for the issue at hand. The
research uses a mix, which is a design that combines two methods, including quantitative
and qualitative approaches to obtain more comprehensive, valid, reliable and interpretive
results that can help in evaluating the KBSP performance, measuring the congestion levels
and suggesting ways of possible improvements. Table 2 provides an overview of the
methodology used by the researchers:
Table 2: Methodology Review.
Problem Approach Method
1- Evaluate KBSP container terminal
performance
Quantitative KPI Analysis
2- Investigate factors that contribute to
terminal congestion
Quantitative and
Qualitative
Regression analysis (E-views)
Questionnaires
3- Forecast future throughput Quantitative Regression analysis (E-views)
(Source: Author, 2018)
From the quantitative data perspective, the researchers have initiated the analysis process
for the KBSP primary statistical data by using three analytical tools:

22
a. Firstly, measuring the performance of the KBSP by using Key Performance
Indicator (KPI) instrument to give the current status of KBSP;
b. Secondly, carry out a regression analysis using E-views software to identify factors
(X1 to X10) that affect the KBSP container throughput (Y);
c. Thirdly, conducting a forecast using E-views software to predict future container
terminal throughput to support the researchers in providing appropriate
recommendations to be implemented by KBSP.
The quantitative data analysis was then followed by the collection of questionnaires
to further investigate the underlying issues facing the industry in order to support the
results of the analysis and relate it to the quantitative data analysis that was conducted in
the first stage. After conducting a series of quantitative analysis using the three analytical
instruments mentioned above and thereafter supported by the questionnaires and SWOT
analysis results, the researchers have reviewed and interpreted the the analysis and
proceeded with the evaluation of the KBSP performance, the conclusion of the case study
and finally developed the recommendations for possible ways to resolve the issue and
improve the current state of the port.
Problem?
KBSP Congestion
Qualitative Method
SWOT
Quantitative Method
1- KPI/PPI Calculations
2- Regression (E-views)
Analysis of KBSP current status
Quantitative Method
Forecast the future container throughput
(E-views)
Qualitative Method
Questionnaire
Disscussion Recommendations Conclusion
Figure 5: Research Design
(Source: Author, 2018)

23
3.2 Data Collection Method
Data collection is one of the most important stages in the research activities carried
out after developing the research design. At this point, KBSP’s primary statistical data
collection was carried out through obtaining port statistics from Bahrain port authority.
Surveys were also conducted using questionnaires for port stakeholders, which were
circulated after obtaining the necessary approvals from WMU and the port authority for
this study. The primary data was collected directly from the port operating company
APMT, the port authority and the port stakeholders, while secondary data was obtained
through literature and reports from academic resources and some interviews. This ensures
validity and accuracy of all the data collected.
3.3 Qualitative Methods
3.3.1 SWOT Analysis Approach
The SWOT analysis approach provides for a framework that would aid the
research team to identify and map out the industry within which KBSP operates in. The
analysis is, therefore, a useful tool to assist the researchers in analyzing the strengths,
weaknesses, opportunities of KBSP. SWOT analysis is geared towards aiding the research
team gain deep and accurate understanding of KBSP about its current circumstances,
which can be translated into strategies and solutions that are being faced or are likely to
be faced by the KBSP (USDA, 2008). Moreover, SWOT analysis is an approach used to
assess the feasibility of a business strategy, hence the potential threats and opportunities.
Basically this method uses internal information and information related to the external
environment of the company (Singh, 2010).
3.3.2 Questionnaires
The questionnaire is an instrument employed in indirect communication
techniques. The questionnaire as a data collection tool is a number of written questions,
which must be answered by the respondent. The results of the questionnaires will be

24
transformed into numbers, tables, statistical analysis and descriptions and conclusions of
the results of the study. In the mixed methodology the questionnaire is an important
element in the collection of research information. Research has proven that questionnaire
design can have an impact on the quality of the data used in a study.
The purpose of the questionnaire includes:
1. Gathering a great deal of information relevant to the needs of guidance and
information regarding the KBSP.
2. Obtaining data first hand ensuring the highest reliability and validity.
3. Using it to obtain data about the background issues that exist in the KBSP.
While on the other hand the key functions of the questionnaires include:
1. Gathering information as basic material in the framework of strategy preparation.
2. Guaranteeing the validity of information obtained by other methods.
3. Taking a sampling of the attitudes or opinions of respondents.
4. Using it as a tool for obtaining data that is in accordance with the research
objectives and elaboration of the hypothesis (Burns et al, 2000).
3.4 Quantitative Methods
3.4.1 Measuring the Port Key Performance Indicators (KPIs)
KPIs are measurable values that describe the performance level of the port by
measuring the time for a particular port activity carried out in the terminal (Moon, 2018).
The KPIs can be used in measuring the effectiveness and port performance efficiency that
can lead to improving service quality by minimizing port time and cargo handling time.
For example, the port authority has certain KPIs set for APMT in the concession
agreement which works as a base for the port operating company; and the authority
periodically compares it with the actual performance. In addition, KPI assessment is a
very important tool to evaluate port performance and also to provide ways for
improvements in terms of operational efficiency and productivity. Performance indicators

25
for measuring performance are generally determined based on the time-related KPIs,
tonnage or TEU handled, the number of vessel calls at the port and other port-related KPIs
(World Bank, 1993).
For this case study, the research was initiated with the time-related KPIs in order
to preliminary measure and evaluate the KBSP’s performance and also to support the
regression and forecast analysis generated from E-views. The preliminary analysis result
can help the researchers in developing ways for improvements that will be addressed
through recommendations at the end of this study. The important time-related KPIs that
were used for analyzing KBSP performance are as follows:
Table 3: KPIs Used for KBSP CT Analysis
(Source: Moon, 2018)

26
3.4.2 Regression Analysis to Forecast the Future Throughput
The annual container terminal throughput for KBSP is measured by the aggregated
number of container moves handled across the quayside and consist mainly of imports
Figure 6: Eviews Regression Flowchart
(Source: Author, 2018)

27
and exports. The terminal has of late become a transhipment hub to the upper northern
Gulf but handles very small volumes of transhipment containers due to various economic
reasons and value proposition (Almahmood, 2018).
● There is a continuous fluctuation on the monthly container throughput at KBSP
affected which is affected by the captive market’s demand and seasonality that
causes a commercial and economic impact (Almahmood, 2018).
● According to the statistical analysis of the KBSP annual TEU throughput; the
regression estimation can be developed as follow (Alhameedi, 2018):
TEU Throughput = ∑(𝑬𝒙𝒑𝒐𝒓𝒕) + ∑(𝑰𝒎𝒑𝒐𝒓𝒕) + ∑(𝑻𝒓𝒂𝒏𝒔𝒔𝒉𝒊𝒑𝒎𝒆𝒏𝒕)+ ∑(𝑹𝒆𝒔𝒕𝒐𝒘)
This research is focused on KBSP container terminal and particularly the berth throughput
performance evaluation as per the best industry practices to determine the optimal
performance level. Therefore, in the E-Views estimation model; the KBSP TEU
throughput is considered as the (Y) or the dependent variable while the (X) independent
variables are KBSP KPIs/PPIs (see table 5) and some economic indicators that may have
a correlation or impact (positively or negatively) on the KBSP throughput. The researchers
have considered for the regression analysis a 13 years’ time series data in a monthly
frequency that consist of 156 observations in E-views. The KBSP container terminal
annual throughput model can be estimated in the model as follows:
CT Throughput = α + β1 * Number of Vessels + β2 * Crane Productivity + Total
Transhipment + Berth Productivity +…. μ
The KBSP annual TEU throughput can be estimated mathematically in E-views as per
table 4 below:

28
Table 4: KBSP TEU throughput Estimation in E-Views.
(Source: Alhameedi et al, 2018)
Table 5: Independent Variables
(Source: Alhameedi et al, 2018 and MTT, 2018)

29
4. IN-DEPTH ANALYSIS OF KBSP
4.1 General Overview
4.1.1 Vessels Calling KBSP
The average length overall (ALOA) for vessels that can call KBSP has increased
from 227 meters in 2016 to 228 which is not a significant increase. As can be seen from
the figure 8 there was an 11% decrease in the number of container vessels calling the port
within the length of 300m 2017. In addition, the same number of vessels have called KBSP
container terminal that is greater than 300 m in length in the same year. On the other hand,
the average vessel gross tonnage is increasing. This is because the Ministry of
Transportation has successfully convinced the main Asian ocean alliances to include
KBSP in their services to Bahrain and replace their feeder vessels with fixed mother vessel
services to the port (Almahmood, 2018).
The main shipping lines that are deploying mother vessels to KBSP includes ocean
alliance (CMA CGM, Evergreen, OOCL and Cosco shipping) and other group liner
companies such as the alliance (K-Line, NYK, Yang Ming, Happag Lloyd, and MOL);
hence contributing to more tonnage to the services calling KBSP (MTT, 2016). The
AVGT in 2017 increased by a mere 2% from 37,580 GT in 2016 to 38,199 GT. Figure 7
groups the gross tonnage of the vessels that are calling KBSP and indicates an average
decrease in the number of vessels within the 300,001 gross tonnage and above when
compared with 2016.

30
4.1.2 Total Container Vessels Called KBSP 2016/2017
According to figure 9, the number of container vessels calling KBSP from 2013 to
2017 is constantly declining by an average of 12%. The decrease from 2013 to 2017 is
equivalent to 41%, which is almost half the number of vessels handled in 2013. The
decrease indicates that many shipping lines stopped or diverted their services to other
terminals in the region as there was no value proposition for calling KBSP (Almahmood,
2018). It is evident that the decrease of number of vessels calling the port is related to the
0 - 25002501 -4000
4001 -8000
8001 -12000
12001 -16000
16001 -20000
20001 -30000
30001 +
2016 0 0 25 0 6 61 40 179
2017 21 0 0 0 6 56 39 149
0 0
25
0 6
6140
179
210 0 0 6
5639
149
020406080
100120140160180200
NU
MB
ER O
F V
ESSE
LS
Vessel Breakdown by GT 2016/2017
Figure 7: KBSP Vessel by GT.
0 - 150 151 - 200 201 - 300 301 +
2016 25 102 159 25
2017 21 88 137 25
0
50
100
150
200
LOA
IN M
ETER
VESSEL BREAKDOWN BY LOA 2016/2017
Figure 8: KBSP Vessels by Length Overall.
(Source: MTT, 2018)
(Source: MTT, 2018)

31
fluctuation of service level at KBSP as reflected in the stakeholders’ complaints as well
as the questionnaires. Moreover, the TEU throughput is also trending with the decline of
the number of container vessels because of the constant decline by an average of 6%. The
decline from 2013 to 2017 is also 6% as a result of the decline of the number of container
vessels as discussed above (MTT, 2018).
2013 2014 2015 2016 2017
Total 461 421 352 311 270
0
100
200
300
400
500
KBSP Container Vessels From Year 2013 - 2017
Figure 9: KBSP CT Vessels
2013 2014 2015 2016 2017
Total TEU 429,843 432,941 424,602 379,817 402,625
350,000
360,000
370,000
380,000
390,000
400,000
410,000
420,000
430,000
440,000
KBSP TEU Throughput From Year 2013 - 2017
Figure 10: KBSP Throughput
(Source: MTT, 2018)
(Source: MTT, 2018)

32
4.1.3 Understanding the Characteristics of KBSP using SWOT Analysis
The researchers have developed preliminary research using the SWOT analysis
instrument that combines information from credible resources and interviews. The
purpose of the SWOT is to enable the researchers to understand Bahrain’s maritime
industry and the characteristics of the sector as holistically possessed by KBSP in order to
provide consideration and input for the next stage of the research. Here is the following
result of the analysis:
Port Facilities Infrastructures: KBSP, which was officially
inaugurated in 2009, stands firmly under the government of
Bahrain. KBSP has modern, and new port handling equipment
and port infrastructure was built in 2008. The port has all needed
auxiliary services to support operational activities including
customs clearance, marine control towers, passenger terminals,
administration buildings, container shipping stations and
medical care center (MTT, 2016).
Strategic Location: Another advantage that KBSP has in terms
of hinterland connectivity especially to Saudi Arabia as
strategically located at the center of the Gulf (MTT, 2018).
Draught: Since 2012, KBSP has carried out several dredging
projects in stages starting from 13 meters to 17 meters, and
pursued to a depth of 20 meters by 2019. This provides an
opportunity for ships of large size to be able to call KBSP in their
services to the region (MTT, 2018).
Single window project: As the best country in the Middle East
in terms of ICT development, the maritime sector together
with KBSP collaborates with the Bahrain’s e-government
directorate to integrate all government and non-government
entities in an electronic platform that will ease port
transactions between all port stakeholders. This project was
made to facilitate the flow of information and grant the
approval feature of the concerned authorities for security
clearance, export import declaration and cargo inspection.
Besides that, single window can also facilitate inter-port
transactions with service users through online self-service
features (ITU, 2017).
The trade agreement and commercial ties that have been built
by Bahrain government with major countries can be a great
opportunity for APMT to attract international shipping
companies to carry out their activities and tranship through
the KBSP (EDB, 2018).
Throughput growth: The vast growth of the economy as a
whole will lead to the opportunity for the container throughput
to increase in the future. As a result, shipping lines and port
stakeholders may divert their traffic to the other ports to avoid
delays.
KPI target: If the APMT is not able to reach the annual KPI
standard that has been set in the concession agreement, APMT
must pay a certain number of un-negotiable penalties paid to
the government (Almahmood, 2018).
Inadequate urban planning: the slow improvement of the
roadway access to KBSP may not compensate the heavy
traffic congestion around the port area and industrial zone.
This will also interrupt the flow of the national supply chain
(Almahmood, 2018).
Congestion: As the only commercial port in the country that
facilitates trade activities, KBSP become very important for the
maritime industry and therefore in high demand. The port has 4
STS cranes and 12 RTGs only to handle the country’s trade
activities. (Almahmood, 2018). KBSP may face difficulty in
handling incoming ships due to limited equipment.
Security procedures: the rise in the security level and customs
formalities that requires scanning of all containers delivered to
consignees contribute to the port congestion and delays (Sharif,
2018).
The congestion at King Fahad Causeway to Saudi Arabia is
making KBSP unsuitable for trade by shipping lines who want
to tranship their containers and cargo through KBSP (BCCI,
2015).
STRENGTH OPPORTUNITY
WEAKNESS THREATS
Table 6: Matrix of the SWOT Analysis Results

33
4.1.4 Stakeholders´ point of view
The research questionnaires that were distributed to the relevant stakeholders aim
to provide qualitative information that can support the quantitative data that has been
previously processed. In addition, the results of this questionnaire can provide an overview
of the actual state that exists in the industry from the perspective of various relevant
entities and port stakeholders. The correspondents are representatives of entities that
include 27,6% government officials, 48,3% shipping lines, and shipping agencies, 19%
freight forwarders, 8,6% ship chandlers, 5,2% trucking/haulage companies, 13,8%
customs clearing agents and 19% others. The following conclusions can be made from the
results of the questionnaire based on the answers obtained:
Table 7: Questionnaires Results overview
No. Questions % Answers Indication
1 Import Container Volume Per
Month
65.5% More than
50/month
Indicated that the KBSP port is
classified as a congested port because
it’s the only port in Bahrain that
handles the export and import.
2 In your opinion, how long it
takes to pick up a container
from KBSP?
43.1% 30 – 60
minutes
The industry standard for picking up or
dropping off a container is 20 minutes.
KBSP takes considerably longer to
deliver a container.
3 KBSP terminal charges are
reasonable versus the services
provided?
48.9% Fair The port charge is reasonably
compensating the service that has been
provided.
4 Do you feel that KBSP is E-
services compliant? If yes, do
the E-Systems meet your
expectations?
46.4% Yes This shows that KBSP is attempting to
develop their E-services in terms of
clients’ self-service. The industry is
satisfied with the service.
5 What causes excessive dwell
times in your opinion?
36.4% Customs
scanning
The possibility of the delays in the
scanning process carried out by the
customs. APMT may have no
influence on governmental operations.
6 What is the ship average
waiting time at the KBSP
during peak time?
42.1% 1-2 days This confirms that there is a delay in
vessel berthing which will affect
vessel operations.
7 What is the average dwell
times for containers and other
cargoes within KBSP?
25% 2 – 4 days For the relative size of the Bahrain
maritime industry, 2-4 days are quite
long and therefore, the dwell time is
expected to be lower at KBSP.

34
8 How often do you experience
congestion related to terminal
operations?
22.8% Seldom
(50% - 25 %
of the time)
This indicating that the port users
experiencing congestions and delays
at KBSP 25% - 50% of the time.
9 How often do you experience
congestion related to vessel
operations?
29,8% Seldom
(50% - 25 %
of the time)
This indicating that the port users
experiencing congestions and delays
at KBSP 25% - 50% of the time.
10 How often do you experience
congestion related to
appointment procedure?
25.5% Seldom
(50% - 25 %
of the time)
This indicates that the procedure of
appointment might not be efficient and
need improvement.
11 How often do you experience
congestion related to CT gate
operations?
25.5% Often (50% -
75 % of the
time)
This indicates that the port-users
experiencing congestion in the CT
gate operation 25%-50% of the time.
12 How often do you experience
congestion related to scanning
operations?
29.1% Seldom
(25% - 50 %
of the time)
This indicates that the port users
experience congestion in the scanning
process 25% - 50% of the time.
13 How often do you experience
congestion related to Customs
documentation procedure?
23.6% Seldom
(25% - 50 %
of the time)
This indicates that the port users
experiencing delays in the processing
of customs documentation 25%-50%
of the time.
14 How are port workers assigned
to a particular cargo/container
handling operation?
40.7% Per work
schedule
(E.g., shifts)
This indicates that KBSP applies the
division of working time within the
port’s worker to have create an
effective working environment.
15 Does the port have a terminal
operating system (TOS) that
incorporates container/cargo
location?
84.9% Yes This indicates that KBSP is equipped
with an adequate terminal operating
system that captures
cargoes/containers location.
16 KBSP delivers the containers
according to appointment/time
slot provided?
40% Often This indicates that KBSP often
adheres to the appointment schedule
given to the customer. On time
delivery should be always adhered to.
17 What causes excessive dwell
times in your opinion?
36.4% Custome
scanning
This indicates that other governmental
agencies contribute to the increase in
container dwell time hence port
congestion.
18 I can obtain container
appointment from KBSP
whenever needed at short
notice?
40.7% Maybe The port-users service indicated that
there is an uncertainty to retrieve the
cargoes within short notice.

35
No. Questions Rate Indication
19 Kindly rate the following E-
services (Appointment):
4 84.6% of the correspondents rated that the E-service
(appointment) at KBSP as quite satisfying.
20 Online payment: 4 38.8% of the correspondents show unsatisfaction.
However, 38.7% of them rated the E-service (online
payment) at KBSP as satisfactory.
21 Container/cargo Tracking 5 33.3% of the correspondents are rated unsatisfied.
However, 46.3% rated the E-service
(container/cargo track) at KBSP as satisfying.
22 Refund process 1 50.9% of the correspondents rated the E-service
regarding the refund at KBSP as not satisfying, this
indicates the possibility of poor performance in the
administrative processes carried out by APMT.
23 How congested is KBSP in your
opinion?
5 37.5% of the correspondents rated KBSP as
moderately congested. However, 33.9% assumed
that the KBSP is highly congested, this indicates that
some of the stakeholders are experiencing
congestion at KBSP.
24 How congested is the Container
terminal gate in your opinion?
4 44.6% of the correspondents rated the container
terminal as moderately congested. However, 33.9%
assumed that the KBSP is highly congested.
25 How do the clearance processes
and Customs procedures affect
the operation of KBSP?
4 35.2% of the correspondents stated that the customs
procedures affect KBSP operations. Moreover, 9.3%
assumed that the customs procedure is highly
affecting KBSP operations. This indicates that the
customs procedures do impact the container terminal
operations.
26 How customer friendly is KBSP? 4 35.7% of the correspondents were moderately
satisfied. However, 48.3% rated KBSP as user-
friendly (satisfactory).
27 In your opinion, how adequate
are KBSP facilities and port
handling equipment?
4 32.7% of the correspondents expressed satisfaction.
However, 34.6% rated KBSP as having adequate
facilities and equipment.
28 The speed of loading and
unloading operations of ships?
4 43.9% of the correspondents expressed somewhat
dissatisfaction, but 45.6% rated the speed of the
loading and unloading operation of ships as quite
reasonable.
29 The speed of receipt and delivery
operations of CT gate?
4 59.3% of the correspondents rated moderate.
However, 24.1% rated the speed of the receipt and
delivery operation of CT gate as fair.
30 Condition and availability of
container yard
4 41.1% of the correspondents rated average.
However, 39.3% rated the condition and availability
of the container yard as good while 9% said it is
excellent.

36
33. Accessibility from berth to
container yard/stacking area
5 40.7% of the correspondents rated the accessibility
from berth to container yard as good. Moreover,
11.1% rated excellent.
31 Warehouse capacity for
cargo/container storage
4 43.6% of the correspondents rated average.
However 30.9% rated the warehouse capacity as
very good, and 14.5% rated excellent.
32 How efficient is the
documentation process for the
pre-arrival of ships?
5 46.4% of the correspondents rated the
documentation process for pre-arrival of ships as
very good, and 7.1% rated it as excellent.
33 How efficient is the ship
clearance process for departing
ships?
5 44.6% of the correspondents rated the ship clearance
process for departing ships as very good, while
10.7% said it is excellent.
34 Port workers/officer response
toward customer's complaints
5 35.1% of the correspondents rated the port workers’
response towards customers’ complaints as very
good, and 10.5% rated excellent.
35 Overall Condition of the
berth/quayside
5 33.3% of the correspondents rated the overall
condition of the berth as very good, and 17.5% rated
excellent.
36 Availability of parking area for
vehicles at the port
5 33.3% of the correspondents rated the availability of
parking area for vehicles at the port as very good,
and 22.8% rated excellent.
37 Accessibility from gate the berth 35.7% of the correspondents rated the accessibility
from the gate to the berth as very good, and 22.8%
rated it as excellent.
4.2 Results and Finding from the Quantitative Methods
4.2.1 Performance of KBSP
After processing the primary data through the calculation of important indicators related
to assessing berth performance, the results in table 8 are obtained as follows:

37
Table 8: KBSP KPIs Years 2016 / 2017
(Source: Alhameedi et al, 2018 and MTT, 2018)
1) Average Time in Port (ATP)
ATP increased by twenty-one percent from 18.14 hrs in 2016 to 22.00 hrs in 2017. The
increase of the average port time is as a result of several reasons, and mainly the
operational reasons such as heat break given to port laborers due to high temperatures
during summer time, pilotage delays, occupied or unavailable berths, bad weather, vessel
delays at berth, shortage of pilots and pilotage equipment (Almahmood, 2018).
2) Average Ship Waiting Time (AWT)
AWT for arriving ships has dramatically increased by two hundred and seventy percent
from 01:54 (2016) to 05:07 (2017) hours per ship. This indicates that the four berths are
utilized whenever ships are arriving, which means that the container handling operations

38
are taking longer time as port time and average service time have also increased by 4 hours
and 5 hours respectively (Almahmood, 2018).
3) Average Gross Berthing Time (AGBT)
AGBT increased by twenty percent from 16:53 hrs (2016) to 20:15 hrs (2017) comparing
years. The increase of the average gross berthing time is caused by many reasons and
mainly cargo customs and security-related inspection procedures, handling delays and
port handling equipment breakdown (Almahmood, 2018).
4) Average Idle Time (AIT)
AIT has decreased by thirty-four percent from 3:26 hrs (2016) to 2:14 hrs (2017). The
decrease of the average idle time shows that the port operating company is taking into
consideration the required preparation before vessel arrivals to ensure that all port
resources such as equipment and laborers are ready to execute operations adequately and
ensure less idling times during loading/offloading operations and therefore less port stay
for ships (Almahmood, 2018).
5) Average Service Time (AST)
AST shows thirty-four percent increase from 13:26 hrs (2016) to 18:00 hrs (2017). The
average service time increase is justified by the increase of the container volumes brought
into the terminal by the new alliances after the successful negotiation with the major
alliances such as OOCL, COSCO and NYK (Almahmood, 2017).
6) Average Ship Maneuvering time (AMT)
AMT increased from 1:30 hrs (2016) to 1:40 hrs (2017). The large ocean alliances vessels
have an average length overall of 330 m, and the port pilots are more careful when
maneuvering these large ships as the port used to receive feeder ships which require less
time for maneuvering (Almahmood, 2018).

39
7) Average Ship Turnaround Time (ASTT)
ASTT increased by twenty-two percent from 18 hrs (2016) to 22 hrs (2017). The limited
number of gantry cranes and RTGs at KBSP and the increase in the volume and the vessel
size, tonnage and length caused the increase in the average ship turnaround time as larger
vessels require more time for handling at KBSP (Almahmood, 2018).
8) Berth Occupancy Rate (BOR)
BOR increased by three percent from 60 % (2016) to 63 % (2017). According to Dragović
(2009), the optimal berth occupancy rate for a four berth terminal should not exceed 60%.
It can be seen that the BOR is increasing above the optimal level due to the deployment
of large vessels by the alliances which directly affected the BOR ratio and subsequently
the ship waiting time (Moon, 2018).
9) Gross Crane Productivity (GCP moves / crane / gross)
GCP increased by seventeen percent from 16 (2016) to 19 (2017). The gross crane
productivity shows that APMT is focusing on container handling operations and ensuring
that crane operators are skilled in maintaining high productivity levels and mobilizing the
port handling equipment when deployed on container ships at KBSP (Almahmood, 2018).
10) Net Crane Productivity (NCP moves / crane / gross)
NCP increased by fifteen percent from 17 (2016) to 19 (2017). The increase of the other
related KPIs, such as quay productivity shows a correlation with the net crane productivity
through the increase occurred. The increase in the NCP is not significant and KBSP should
aim for higher productivity levels to meet shipping line expectations and reduce vessel
port time (Alhameedi et al, 2018).
11) Gross Berth Productivity (GBP move / hours)
GBP increased by two percent from 49 to 50 moves per hour. The gross berth productivity
is one of the key KPIs that shipping lines consider and APMT should maintain the

40
maximum possible levels of berth productivity to meet the port customers’ expectations
(Alhameedi, et al., 2018).
12) TEU Per Crane Hour (TPCH)
TPCH has slightly decreased by ten percent from 30 (2016) to 27 (2017) TEU per hour.
The decrease is as a result of the limited resources and equipment of the port, such as
gantry cranes that are crucial to achieve the highest productivity levels possible
(Almahmood, 2018).
13) TEU per Ship per Day (TPSPD)
TPSPD increased by twenty-three percent from 1208 (2016) to 1491 (2017). The KPI
shows a close correlation with the other KPIs such as quay productivity and gross berth
productivity which trend together and affect TPSPD positively (Alhameedi et al, 2018).
14) TEU per Ship per Berth Hour (BSO)
BSO increased by three percent from 72 TEU (2016) to 74 TEU (2017). The increase in
the berth productivity and crane productivity has positively reflected on the increase for
BSO as they are highly correlated. This is due to sufficient equipment utilization made by
the terminal operator and proper yard planning for every incoming ship that leads to
smooth loading and offloading operations (Almahmood, 2018).
15) TEU per Ship Working Hour (WSO)
TEU per ship working hours decreased by eight percent from 90 hrs (2016) to 83 hrs
(2017). The TEU per ship working hours is impacted by the labor regulation in Bahrain
that gives heat breaks during summer time from 12:00 to 16:00 where the vessel
operations are at stand still. The increase in vessel size also requires increased labor and
the other operational delays that impact productivity level (Almahmood, 2018).

41
16) AVG Productive Ratio (APR)
APR increased by eleven percent from 80% (2016) to 90% (2017), which is an indication
of the increase of the related KPIs such as crane productivity, berth productivity, TEU per
ship hours and berth occupancy ratio that negatively affected APR (Almahmood, 2018).
17) Labor Utilization Rate (LUR)
LUR increased by fourteen percent from 35% (2016) to 40 % (2017). The labor utilization
rate is affected by several factors and mainly the increase of the berth occupancy ratio due
to the increase in vessel size at the port due to scheduled and regular calls by the ocean
alliances vessels (Almahmood, 2018).
18) Crane Utilization Rate (CUR)
CUR increased by seventeen percent from 36% (2016) to 42% (2017). As BOR and LUR
increase, the crane utilization rate increases due to the close relation of these KPIs. This
is caused by the growth of vessels size and container traffic resulted by the ocean alliances
services to KBSP (Almahmood, 2018).
19) TEU per Ship per Port Hour (PSO)
PSO is showing an increase of three percent from 66 TEU (2016) to 68 TEU (2017). The
main increase of the PSO is mainly driven by the volume increase and the increasing size
of vessels caused by the ocean alliances calling KBSP (Almahmood, 2018).
20) Quay Productivity (QP)
QP increased by six percent from 214 (2016) to 228 (2017) moves. The quay productivity
should be increased to the maximum level and consider the optimal equipment utilization
ratio at 60% in order to efficiently handle vessels alongside (Dragović, 2009). The QP
KPI is one of the most important productivity measures that shipping lines is interested in
as it affects vessel port time, the more the QP the less is the port time (Moon, 2018).

42
4.2.2 The Future Delineation of KBSP
The main objective for using the regression analysis is to provide the researchers with an
indication of the forecast of KBSP future throughput. It can be concluded from the
analysis made in the E-views by looking at the independent variables (Xi) that have been
listed above in Table 5, along with the dependent variable (Y) that were selected for the
regression analysis, that the dependent variable, which is the annual KBSP throughput is
highly correlated and affected by the six main independent variables. These include berth
productivity, crane productivity, number of container vessels, gate turnaround time, total
export moves and total.
The six significant variables (X1-X6) basically have a relationship that is directly
proportional to the results shown (Alhameedi et al, 2018). The independent variable (X7)
is an error correction term made in E-views for (X1) after co-integration and then adding
the residual into the model. The relationship can be explained as follows:
Table 9: Significant Variables.
Source: Author, 2018.
From the above model, it can be concluded that the independent variables which
are (X1, X3, X4, X5, X6 and X7) have a high and positive correlation with the dependent

43
variable (Y). To illustrate, an increase occurred by one unit in the above mentioned
independent variables (X1, X3, X4, X5, X6 and X7) will also lead to an increase by one unit
in the dependent variable (Y). It can also be concluded that the independent variable (X2)
has a negative correlation with the dependent variable (Y), whereas one-unit decrease in
X2 will lead to one-unit decrease to Y because of the negative relationship. The final
equation can be express as:
Y = -0,49 + 0,16 * X1 – 0,22 * X2 + 0,29 * X3 + 0,14 * X4 + 0,35 * X5 + 0,02 * X6 + 0,23 * X7
The research team estimated the following formula and ran the regression analysis to
calculate the relation between the independent and dependent variable for the KBSP
annual TEU throughput as follows:
1) Berth Productivity (+ / positive relationship)
The increase in the number of containers will have an impact on the increase in gross berth
productivity, but if KBSP is unable to improve its operational performance, it will lead to
Figure 11: Regression KBSP Throughput Model and Equation
(Source: Alhameedi et al, 2018)

44
the delay and increase in vessel waiting time, port time and will ultimately lead to port
congestion (Alhameedi, et. al, 2018).
2) Crane Productivity (- / negative relationship)
There is a negative relationship between crane productivity and the KBSP TEU
throughput. This can be explained by the fact that the more the number of containers being
handled by cranes, the less the overall crane performance. The limited number of cranes
is not well-balanced vis-à-vis the number of containers handled at KBSP. This may cause
a negative impact on the crane's operating and technical condition. The deterioration in
crane condition will lead to lower performance and therefore lead to port congestion result
by crane breakdown or maintenance time (Alhameedi et al, 2018).
3) Number of Container Vessels (+ / positive relationship)
If the number of container vessels handled by KBSP increases, the container throughput
will also increase, a rising trend that occurred in 2016-2017 due to the entry of mother
vessels from the alliances, but will also have an impact on increasing berth occupancy
rate, ship waiting time and crane productivity which will also contribute to the congestion
issue (Alhameedi, et. al, 2018).
4) Gate Turnaround Time (+ / positive relationship)
The KBSP yard operation is highly connected to the berth operations as any congestion
that happens at the yard will lead to congestion at the berth as well. When vessel operations
reach their peak, and the four berths and the four gantry cranes are deployed into full use,
the truck turn-around time when picking up or dropping off a container will also increase
due to the fact that the concentration of the terminal operations is given to the vessel
operations where most of the RTGs are deployed for vessel loading and unloading
operations. Therfore, this leads to slow receipts/delivery of container (Almahmood, 2018).
KBSP should also pursue low truck turn-around time as the relation between the berth
productivity and the gate turn-around time is positive, which means the higher the number
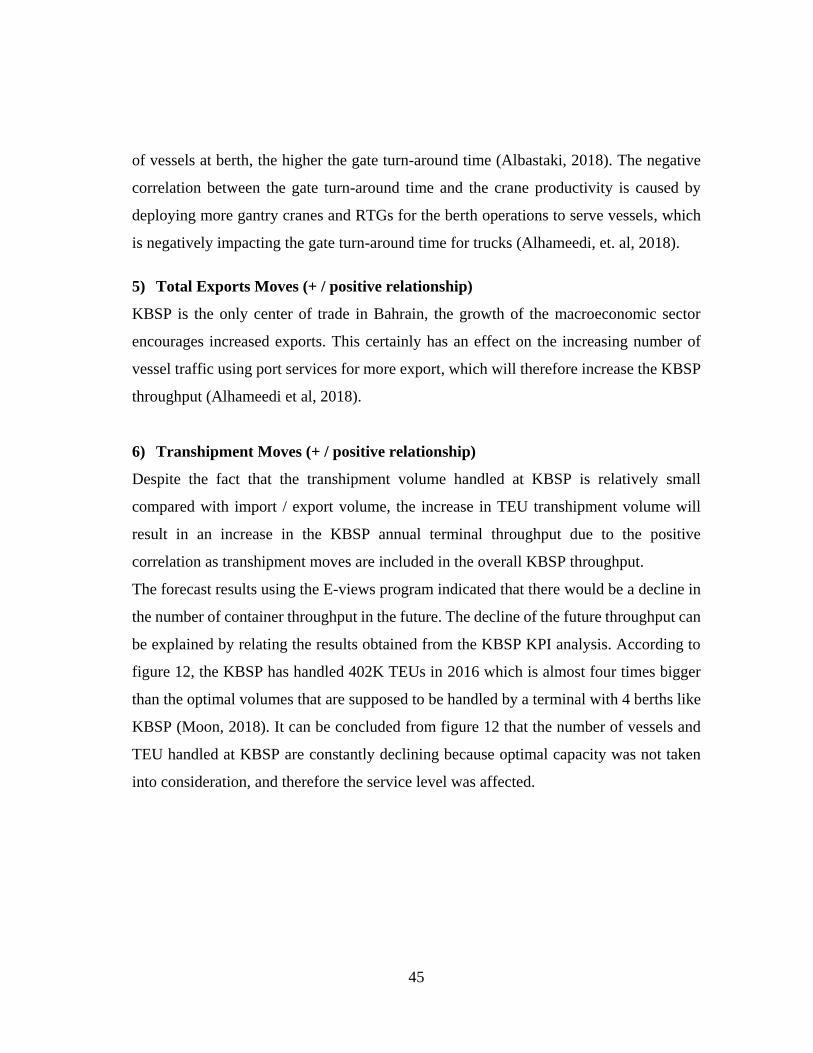
45
of vessels at berth, the higher the gate turn-around time (Albastaki, 2018). The negative
correlation between the gate turn-around time and the crane productivity is caused by
deploying more gantry cranes and RTGs for the berth operations to serve vessels, which
is negatively impacting the gate turn-around time for trucks (Alhameedi, et. al, 2018).
5) Total Exports Moves (+ / positive relationship)
KBSP is the only center of trade in Bahrain, the growth of the macroeconomic sector
encourages increased exports. This certainly has an effect on the increasing number of
vessel traffic using port services for more export, which will therefore increase the KBSP
throughput (Alhameedi et al, 2018).
6) Transhipment Moves (+ / positive relationship)
Despite the fact that the transhipment volume handled at KBSP is relatively small
compared with import / export volume, the increase in TEU transhipment volume will
result in an increase in the KBSP annual terminal throughput due to the positive
correlation as transhipment moves are included in the overall KBSP throughput.
The forecast results using the E-views program indicated that there would be a decline in
the number of container throughput in the future. The decline of the future throughput can
be explained by relating the results obtained from the KBSP KPI analysis. According to
figure 12, the KBSP has handled 402K TEUs in 2016 which is almost four times bigger
than the optimal volumes that are supposed to be handled by a terminal with 4 berths like
KBSP (Moon, 2018). It can be concluded from figure 12 that the number of vessels and
TEU handled at KBSP are constantly declining because optimal capacity was not taken
into consideration, and therefore the service level was affected.

46
4.3 Discussions: Ramification of the Port Performance
A port’s function has evolved from just being a gateway to playing a pivotal
economic role. It is crucial to the development of a country, and the hinterland it serves,
but the reverse is also true. The growth of the hinterland, and its import and export
activities play a crucial role in shaping up the port and its logistical infrastructure. A port’s
throughput, defined accurately, is the measure of both its productivity and performance.
It was, therefore, crucial to understanding the factors that influence the throughput and
performance of KBSP, which has the potential of becoming a transit/transhipment hub,
seeing it already serves as a connection to cargoes destined for Saudi Arabia, through the
King Fahad Causeway.
There are three main entry points into Bahrain, with the major one for goods being
KBSP. The other two are the airport, and King Fahd Causeway, which connects Bahrain
to the eastern part of Saudi Arabia. To improve on its efficiency and service delivery, the
government of Bahrain privatized the port, and KBSP is now under a concession, being
run by APM, which brings on board a wealth of knowledge and expertise. The changes in
Figure 12: E-views Forecast Comparison
(Source: Author, 2018)

47
port operation, organizational structure and to some extent infrastructure has indeed had
a positive impact on the efficiency of KBSP, but the industry, through the questionnaire
responses received, still believe that there is still much to be done so as to improve its
effectiveness.
Much focus by KBSP so far has been to service local trade, i.e., within Bahrain,
but with recent economic and regional developments, Bahrain has a long-term aim to be
a hub port that services the Upper Gulf region of the Middle East. This necessitates for
action to be taken from both sides, i.e. APMT, to improve efficiency and effectiveness of
the port, and the Government of Bahrain, in ensuring that indeed Bahrain puts measures
in place to stimulate import and export activities, and also facilitate cross-border trade,
which will see an increase in not only imports and exports, but also transit and
transhipment cargoes. Port performance will be crucial in attracting major shipping lines
to the port, bearing in mind the biggest competitors geographically are Jebel Ali Port in
the UAE and Salalah port in Oman, which have a major advantage due to their strategic
locations along major trade routes, giving them a preferred choice over KBSP; hence the
need for KBSP to improve on its service delivery.
The approach taken by the researchers is systematic, which is, to first use
quantitative analysis, to analyze the performance, so as to know what is currently
happening at KBSP. Next was to forecast the future throughput by E-views, which
indicate the expected throughput, and hence performance. The forecast is an important
indicator, which will help gauge the necessary actions to be taken by KBSP, as provided
for by the results of the forecast. The researchers also incorporated qualitative analysis by
using preliminary SWOT analysis and Questionnaires, so as to understand, first hand,
from the stakeholders, what problems and challenges they may be facing, first hand. This
instills a local perspective on the research, by taking into consideration the input provided
by the local industry.
The KPIs, APT and AGBT show an increase from 2016 to 2017. This indicates an
increase in the time that a vessel takes in the port, and also in the berth. This can logically

48
be explained by the increase in vessel sizes; thus it will need more time for loading and
offloading. This can be confirmed by data provided in figure 8, which indicates an increase
in the average vessel GRT from 37,580 in 2016 to 38,199 in 2017. Even though this is a
logical explanation operationally, KBSP needs to implement long-term measures to
reduce vessel turnaround time, to ensure competitiveness with other major container ports
and terminals, hence be able to attract bigger ships and enjoy economies of scale.
Operationally, KPIs indicate that KBSP is almost reaching its optimum, by observing its
BOR, which increased from 60% to 63% currently, against a suggested optimum
occupancy rate of 65% for a four berth terminal (Moon, 2018). Even though there is
improvement operationally, by looking at QP, GCP, NCP, and GBP, the improvement is
very minute, and all points to a stagnation in the increase in throughput by the port; hence
the port cannot be able to handle more, efficiently and effectively, until and unless more
resources are allocated, to facilitate more handling. The alarming KPIs that suggest that
KBSP needs to take immediate and swift action is the increase in AST and ASTT. Even
though there has been an increase in vessel sizes, which will, in turn, explain the increase
in ship service time and ship turnaround time, as explained above, the major worry is for
commercial and financial purposes on the part of liner companies, and other ship
operators, who want to minimize a vessels’ time in port, and keep port-related costs to a
minimum (Notteboom, 2006).
Major shipping lines will only deploy mother vessels to the ports that are well
equipped in terms of draught, length, handling equipment and labor. Hence, the need for
KBSP to plan strategically for the aforementioned factors if they are to retain the vessels
that are calling at their port and attract other bigger vessels and alliances to the port.
Moreover, figure 12 indicates that KBSP throughput is constantly decreasing from 2013
to 2017. The decrease from 429K in 2013 to 402K TEU in 2017 is equivalent to six percent
compared to 2013 with 2017 (MTT, 2018). The figures suggest that KBSP is losing
volumes and subsequently customers due to the low performance delivered. Besides,
inferring that it is way above its optimum handling capacity; thus there is need for

49
corrective action to be taken to avoid congestion of its capacity and exceeding optimum
utilization levels of its available resources. The current throughput indicates that the
current resources, such as yard space, handling equipment, and labor, are actually being
overused.
Even though the forecast by E-views suggest a reduction in throughput, as figure 12
shows, this may be provided for by the current conditions at the port, where operations
are exceeding optimum levels, and may thus lead to diseconomies of scale. On the
contrary, the trend shows a steady number over the last five years (see per figure 13)
through the simple forecast generated from the same annual data which provides for an
increase in throughput. In the upper confidence level, an increase of almost 90% is
forecasted by the 2022; hence the need for the port to plan accordingly for the expected
increase in volumes, which will affect the throughput of the port, and thereby the need to
increase its capacity. This move will not only help in preparing KBSP to handle more
cargo in the future but also address the bottlenecks in operations that are already being
manifested in its current scenario. The general outcry from the industry is that the port is
congested, and much needs to be done to address the situation, in terms of streamlining
processes and procedures, implementation of appropriate systems that would simplify
importation processes, and on time delivery of containers from the port.
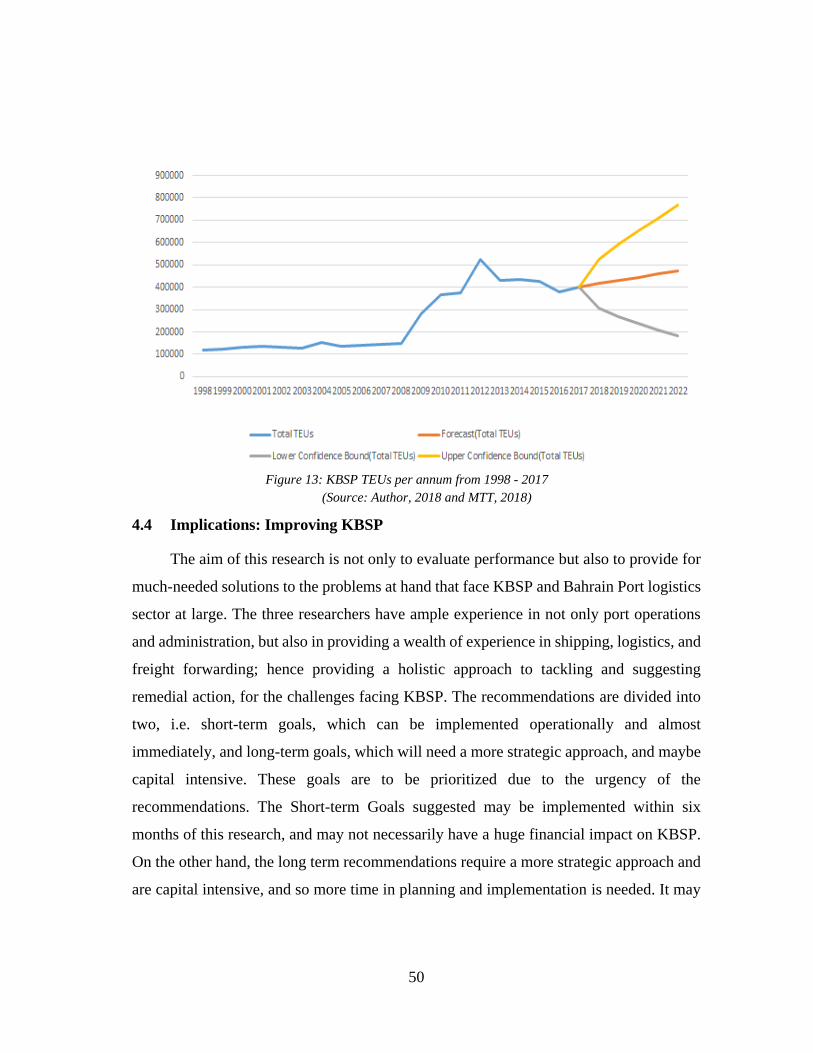
50
4.4 Implications: Improving KBSP
The aim of this research is not only to evaluate performance but also to provide for
much-needed solutions to the problems at hand that face KBSP and Bahrain Port logistics
sector at large. The three researchers have ample experience in not only port operations
and administration, but also in providing a wealth of experience in shipping, logistics, and
freight forwarding; hence providing a holistic approach to tackling and suggesting
remedial action, for the challenges facing KBSP. The recommendations are divided into
two, i.e. short-term goals, which can be implemented operationally and almost
immediately, and long-term goals, which will need a more strategic approach, and maybe
capital intensive. These goals are to be prioritized due to the urgency of the
recommendations. The Short-term Goals suggested may be implemented within six
months of this research, and may not necessarily have a huge financial impact on KBSP.
On the other hand, the long term recommendations require a more strategic approach and
are capital intensive, and so more time in planning and implementation is needed. It may
Figure 13: KBSP TEUs per annum from 1998 - 2017
(Source: Author, 2018 and MTT, 2018)
51
take 2 to 4 years, or more, since the inception to implementation or execution, and even
longer for completion of such projects.
1) Increase number of Handling Equipment
According to the feedback provided by the respondents, there is a shortage of yard
handling equipment at KBSP. Whatever equipment presently available is utilized for both
yard and gate operations, which is not sufficient during peak times, and results in
congestions and long queues. This leads to incurring of extra costs, delays and ultimately
unsatisfied customers, which is not good for business. Even though KBSP has adequate
yard capacity, it lacks port handling equipment. There are only four gantry cranes and 12
RTGs available to serve the port for incoming volumes that exceed 400k TEUs annually.
APMT should, therefore, consider investing in port handling equipment to keep a balance
between berth and yard operations and also meet the increasing demand of the captive
market (Almahmood, 2018).
KBSP can take advantage of APMT’s good networks and connections with providers of
handling equipment, such as reach stackers, front loaders, mobile cranes and other
necessary equipment, so as to acquire the machines. This could be by buying, or long-
term lease, whichever is more cost effective. Addition of such equipment will result in a
smooth cargo flow from vessel operations, yard operations, and gate operations; hence no
congestion. It is also important to make sure that availability of equipment alone would
not be sufficient, but to ensure that the equipment are maintained and serviced
appropriately, to minimize downtime, and maximize on the availability of the equipment.
This will most definitely improve the turnaround time of the vessels calling KBSP, and
also reduce the dwell time of the containers in the port, leading to improved capacity, and
ultimately increase throughput.
2) Increase number of Qualified Staff
The increase in the number of equipment would necessitate an increase in the personnel
handling the equipment. It is important that KBSP ensures they have adequate staff all

52
round; to oversee proper administration and operations. It is also important to ensure that
the staff are responsible and adequately trained to handle equipment; to ensure the
equipment are always in a good working condition; hence facilitating smooth operations.
It is also important for ports, KBSP included, to ensure such personnel are trained about
customer service, and that even though their work may have no direct contact with the
customers, it does actually play a significant role in ensuring customer satisfaction.
Further, staff need to understand the mission and vision of the organization, and buy into
its corporate goals. Skilled personnel will not only enhance service delivery but also
contribute to sustainable growth and development of the organization.
3) Enhance ICT
Even though Bahrain is ranked as the best country in the Middle East in terms of ICT
development (ITU, 2017), there is still a lot of room for improvement in the port ICT
infrastructure. Presently, there exists only EDI between the port and the shipping line
(Almahmood, 2018). No other platforms exist to improve the clearance process. Hence
most documentation is done manually, which is time-consuming and leads to delays in
the documentation, vessel and container handling and thus congestion. IMO, through its
FAL committee has recommended that for countries to facilitate maritime transport, they
need to use IT to improve its data exchange, and also suggested that provisions and
guidelines should be provided in implementing the single window system by 2019 (IMO,
1967). The single window system is a system that incorporates all stakeholders in the
documentation and clearance process, making it a fast, seamless and efficient process.
Even though APMT has recently introduced an online platform known as (LIFT), it
focuses primarily on basic functions such as invoicing and payments, appointments for
cargo delivery and tracking of cargo.
What KBSP needs is an ideal single window system which would not only
incorporate the port/terminal and the shipping lines but also other relevant stakeholders,
such as importers, exporters, customs authority, customs agents and OGAs.

53
Implementation of SWS would improve the clearance process that would otherwise take
a few days to complete, to only a few hours. Optimal use of IT would improve inward and
outward vessel clearance, and cargo clearance; hence less turnaround time for the vessel
and also reduced container dwell time. This will also address the issue of cargo
overstaying at the port, incurring huge storage costs by the traders, which are then passed
on to the consumers.
4) Expansion of the Container Terminal (KBSP Phase 2)
As shipping lines are cutting down on costs, they are utilizing bigger and bigger vessels
so as to reap the benefits realized by economies of scale. It is not an exception with the
scenario at KBSP. As discussed earlier, the average size of the vessels has increased, but
statistics show that the number of vessels is going down.
Figure 14 shows the number of container vessels annually calling at MSP/KBSP from
2005-2017. With the deployment of bigger ships, KBSP needs to undertake an expansion
project, to expand both the quay and yard, to allow the berth to accommodate bigger ships,
and also ensure that the yard has increased capacity to handle even more cargo. Bigger
vessels do not necessarily translate to increased annual throughput, but just that shipping
(Source: MTT, 2018) Figure 14: MSP/KBSP Number of Vessels 2005 - 2017.

54
lines are consolidating all containers destined for Bahrain, which would have taken
smaller but more feeder ships to deliver, are now delivered by fewer and bigger ships.
This has exerted more pressure on KBSP, which has to work longer on bigger ships, with
the same amount of limited resources; hence the increase in the time a ship stays at KBSP,
resulting in more vessels waiting for the limited berthing space. It will, therefore, be
prudent, for KBSP to undertake an expansion project, so that the port can evolve in tandem
with the global shipping trends, and capitalize on the opportunities that shipping lines
provide, ahead of other ports in the region. Being able to accommodate larger ships will
be a major factor in attracting major shipping lines to designate KBSP as their hub port;
thus giving KBSP a major boost in throughput.
5) Handling Equipment
KBSP needs to improve the status of its handling equipment to match the changes
happening in the shipping and ports industry. As mentioned earlier, shipping lines are
building bigger vessels, and KBSP has already started feeling the impact. Bigger vessels
have started calling KBSP, and for operational excellence, there is a need for the handling
equipment, especially gantry cranes, to be of proper standards, both in quality and size. A
close look at Hamburg Port, which is one of the leading hub ports in Europe, shows that
they only had 2 ultra-modern container gantry cranes at its terminal in Tollerort in 2016,
but due to more shipping companies ordering bigger container ships, Hamburg Port made
an additional order of 3 more such cranes which were delivered in 2017. As a result of
this investment, Hamburg port received five times more the number of 18000 TEUs
vessels in 2017, than it did in 2015 (Hafen, 2017). Even though this project is capital
intensive, it would certainly help to improve efficiency at KBSP. It will also market KBSP
as a leading port in the region, with the right equipment and superstructure that is capable
of servicing ships of all sizes.

55
6) Automation of KBSP
In a bid to improve efficiency, many terminal operators in the world are partially or fully
automating their terminals. Automation involves the use of technologically advanced
equipment, incorporated into the latest and integrated terminal loading and operating
systems, so as to improve efficiency, and in the long run, increase the terminal capacity.
KBSP should implement a complete automation of its container terminal, to keep up with
the increasing throughput (Liu, Jula & Ioannou, 2002). Automation is also introduced so
as to reduce human interface during operations, both at berth and yard, so as to minimize
human error, and therefore cutting down costs related to human labor, and the
inefficiencies that may be caused by the dependence on the human element

56
5. CONCLUSION
In a bid to increase efficiency and also achieve optimal use of available resources and
equipment, ports around the world are pushing for increased volumes and throughput.
With the current scenario where terminals are being ranked by majorly throughput, and
secondary, factors like liner connectivity index and port performance, port authorities are
keen to drive up throughput, and the approach used by most ports is to engage terminal
operators who are experienced in aspects of technical and commercial operations of ports.
Increase in port throughput, although beneficial commercially due to the realization of
economies of scale, actually needs proper planning, operationally, tactically and
strategically, to ensure that the port has measures in place to address the challenges that
may be realized due to increase in throughput. The scenario at hand, at KBSP, clearly
shows that there is indeed an increase in throughput, but this has actually led to exceeding
the KBSP optimal throughput capacity with the limited resources, and consequently led
to congestion at the port.
Even though ports are privatized to push for improved efficiency, proper targets and
limits need to be set, with relevant KPIs being monitored, to ensure that the port operates
within optimal and acceptable limits, thereby avoiding issues of congestions or over
utilization and exploitation of available resources, which will, in turn, lead to exerting of
pressure on the ports infrastructure and equipment, in the long run. It is also important for
KBSP to ensure that they stick to industry best practices in terms of operations, and setting
of its objectives and long-term goals and strategies of improving the port, to ensure that
they do not only adapt to the ever-changing trends of the maritime industry, but actually
surpass the minimum thresholds being set. Only then will KBSP be able to compete

57
regionally and put itself on the map in terms of being a leading container terminal
regionally and world-class port.
The major challenge in the development of the forecasting model developed by the
researchers was the lack of availability of data. Only port statistics are available; hence
the model is more focused on port performance. A wider scope of data needs to be
obtained and incorporated, to include more macroeconomic factors that could influence
port throughput, and hence have an impact on the research topic. Macroeconomic factors
are relatively hard to obtain, and with the same frequency as port data, which is collected
hourly, daily, weekly monthly, and annually; hence a large sample size. Therefore, all
other desired variables need to have a matching frequency to build an even more robust
and accurate model. A more robust model may achieve higher accuracy in terms of
forecast; hence it can be used to accurately forecast for longer periods ahead.
For the KPIs calculations, small idle times, like pilotage for berthing and unberthing
of vessels, other small breaks due to various circumstances, such as equipment change,
change in spreaders, calibrations and such, which may not seem long enough to be logged
in, but happen to a considerable extent, may go unaccounted and undocumented.
Therefore, they are not included in the data provided by KBSP for consideration. Such
omissions may seem inconsequential, but when aggregated, in the long run, may cause
bias, and create a variance from the actual scenario, however minimal it may be. There is
also limited information available, vessel wise, regarding the different KPIs that were
being researched on, per vessel or port call detailed time stamp information. Such data
may be obtained but would need interdepartmental collaboration and coordination, which
calls for extra cooperation between relevant authorities who obtain and record the data in
the desired frequency.
The lack of prior research into the specific port also proved a challenge. Even though
the topic of research is widely being looked into, the region has not attracted many
researchers thus far; hence the lack of availability of literature and research material. This
provided an opportunity for the research team to try and improve the literature available

58
on KBSP since it is a relatively new port. The port planning department should, therefore,
partner with the relevant internal and external departments and authorities, so as to ensure
relevant and significant data is recorded and obtained, which may in the be future used to
further this research.

59
REFERENCES
Albastaki, A. (2018). In Alhameedi M. (Ed.), KBSP service level
Alhameedi. (2018). Research proposal Unpublished manuscript. Retrieved
from https://academics.wmu.se/mod/turnitintooltwo/view.php?id=3969
Alhameedi, Deerod, Hadrian, Ncayo, Premathilaka. (2018). Mgm 101. Unpublished
manuscript. Retrieved from https://academics.wmu.se/course/view.php?id=337
Alhameedi, D., Milwano. (2018). Por102. Unpublished manuscript. Retrieved
from https://academics.wmu.se/course/view.php?id=341
Alhameedi, M. (2018). Research structure
Almahmood, B. (2017). In Alhameedi M. (Ed.), The assistant undersecretary for port
affairs - ministry of transportations and telecommunications of bahrain
Alsalem, E. (2017). In Alhameedi M. (Ed.), APM terminals bahrain commercial
manager
APMT. (2018a). Improving terminal productivity, costs and flexibility with a win-win
labor strategy. Retrieved from http://www.apmterminals.com/en/news/press-
releases/2017/news/improving-terminal-productivity-costs
APMT. (2018b). Statistics. Retrieved
from http://www.apmterminals.com/~/media/ContentEditors-
Uploads/Africa%20and%20Middle%20East/Bahrain/Information/Stats%202012/C
T%202012.ashx
APMT. (2018c). Terminal information. Retrieved
from http://www.apmterminals.com/~/media/ContentEditors-
Uploads/Africa%20and%20Middle%20East/Bahrain/About%20us/kbsp-port-
information.ashx
Baldauf, M. (2017). Lecture note by dr. baudalf [quantitative data analysis] 031017
URL. Unpublished manuscript. Retrieved
from https://drive.google.com/file/d/0B92KlnfYLuC-ZTlmWmhNTkhGRTA/view
BCCI. (2015). Al shemeri: Insufficient number of staff at khalifa bin salman port
restrains importers. Retrieved from https://www.bcci.bh/en/news-details/454
BNA. (2018, Feb 12,). plans to boost maritime transport sector
highlighted. Bahrain News Agency Retrieved
from http://bna.bh/portal/en/news/825419

60
Dragovi ć, B. (2009). A study of container terminal planning. (). S. Korea: Tongmyong
University, Dept. of Logistics Management , 535, Yongdang-dong, Nam-gu, Busan,
608-711, S. Korea. Retrieved
from http://www.mas.bg.ac.rs/_media/istrazivanje/fme/vol37/4/06_n-kpark.pdf
Dragović, B. (2009). A study of container terminal planning. © Faculty of Mechanical
Engineering, Belgrade. all Rights Reserved, 37(209), 205. Retrieved
from http://www.mas.bg.ac.rs/_media/istrazivanje/fme/vol37/4/06_n-kpark.pdf
EDB. (2018). Invest in bahrain | the economic development board. Retrieved
from http://bahrainedb.com/
Hafen. (2017). Port of hamburg. Retrieved from https://www.hafen-
hamburg.de/en/news/hhla-container-terminal-tollerort-new-mega-ship-gantry-
cranes-off-to-a-strong-start---35487
IMO. (1967). Convention on facilitation of international maritime traffic (FAL).
Retrieved
from http://www.imo.org/en/OurWork/Facilitation/ConventionsCodesGuidelines/Pa
ges/Default.aspx
ITU. (2017). ICT development index. Retrieved from http://www.itu.int/net4/ITU-
D/idi/2017/index.html
Kissling, C. (2007). Transport communications: Understanding global networks
enabling transport services. UK: Kogan.
Knemeyer, A. M. (2006). Logistics and supply chain management: Creating value-
adding networks. Transportation Journal, 45(1), 61.
legalaffairs. (2006). Royal decree number (76) for the year 2006 pertaining awarding the
exclusive rights to manage and operate mina salman port and management,
operating and development of khalifa bin salman port. Retrieved
from http://www.legalaffairs.gov.bh/Media/LegalPDF/L7606.pdf
Liu, C., Jula, H., & Ioannou, P. A. (2002). Design, simulation, and evaluation of
automated container terminals. IEEE Transactions on Intelligent Transportation
Systems, 3(1), 12-26.
LOH, H. S., & THAI, V. V. (2015). Cost consequences of a port-related supply chain
disruption. The Asian Journal of Shipping and Logistics, 31, 319-340.
doi:10.1016/j.ajsl.2015.09.001
Long, A. (2009). Port community systems. World Customs Journal, 3(1), 63-67.

61
Manuel, M. (2017). The nature of management URL. Unpublished manuscript.
Retrieved
from https://drive.google.com/file/d/0Bw9wZYh5AWkIMTVKZ191VDIyZWM/vi
ew
Moon, D. (2017). Planning of research. Malmo: WMU.
Moon, D. (2018a). Por101. Sweden:
Moon, D. (2018b). Port performance indicators (PPI) and analysis
- introduction -. Malmo: WMU.
MTT. (2016a). Khalifa bin salman port. Retrieved
from http://mtt.gov.bh/content/khalifa-bin-salman-port
MTT. (2016b). Khalifa bin salman port fact sheet Retrieved
from http://www.transportation.gov.bh/sites/default/files/content-
attachment/kbsp_fact_sheet.pdf
MTT. (2016c). Organisation chart. Retrieved
from http://www.caa.gov.bh/content/organisation-chart
MTT. (2016d). Ports and maritime projects. Retrieved
from http://www.caa.gov.bh/content/ports-and-maritime-projects
MTT. (2018). Ports and maritime. Retrieved from http://www.mtt.gov.bh/content/pma-
overview
Notteboom, T. E. (2006). The time factor in liner shipping services. Maritime
Economics & Logistics, 8(1), 19-39.
OBG. (2007, Nov 27,). Oxford business group launches the report: Emerging bahrain
2007. Middle East Company NewsRetrieved
from https://books.google.se/books?id=l5hhDiyVknkC&printsec=frontcover#v=one
page&q=mina%20salman&f=true
Obg. (2008). The report: Bahrain 2008. (). UK: Oxford Business Group. Retrieved
from https://books.google.se/books?id=HHmo2jjjb2AC&pg=PA118&lpg=PA118&
dq=the+government+of+bahrain+will+build+a+new+port&source=bl&ots=anNN-
v9HZH&sig=_13-
UXjjTsLT79X7_cvU38F27tk&hl=sv&sa=X#v=onepage&q=the%20government%2
0of%20bahrain%20will%20build%20a%20new%20port&f=false
Obg. (2018). Bahrain's transport sector expands on all fronts. Retrieved
from https://oxfordbusinessgroup.com/overview/bahrains-transport-sector-expands-
all-fronts

62
Obg, 2. (2018a). Port to port: Changing global trade patterns add importance to maritime
shipping. Retrieved from https://oxfordbusinessgroup.com/analysis/port-port-
changing-global-trade-patterns-add-importance-maritime-shipping
Obg, 2. (2018b). Port to port: Changing global trade patterns add importance to maritime
shipping. Retrieved from https://oxfordbusinessgroup.com/analysis/port-port-
changing-global-trade-patterns-add-importance-maritime-shipping
OEC. (2018). Bahrain. Retrieved from https://atlas.media.mit.edu/en/profile/country/bhr/
Sarwar, N. (2013). Time-related key performance indicators and port performance:
A review of theory and practice. Norway:
Sharif, M. (2018). In Alhameedi M. (Ed.), Senior operations manager APMT bahrain
Singh, N. (2009). Swot analysis – A useful tool for community vision. G.B. Pant
Institute of Himalayan Environment and Development Kosi – Katarmal, Almora
263 643 (Uttarakhand), 1(1), 16-17. Retrieved
from http://www.sciencepub.net/researcher/research0209/03_0682research0209_16
_18.pdf
Srdjevic, Z., Bajcetic, R., & Srdjevic, B. (2012). Identifying the criteria set for
multicriteria decision making based on SWOT/PESTLE analysis: A case study of
reconstructing a water intake structure. Water Resources Management, 26(12),
3379-3393. Retrieved from https://link.springer.com/article/10.1007/s11269-012-
0077-2
Tang, L. C., Lee, L. H., & Chew, E. P. (2011a). Advances in maritime logistics and
supply chain systems. Singapore: World Scientific. Retrieved
from https://login.proxy.wmu.se/login?url=http://search.ebscohost.com/login.aspx?
direct=true&AuthType=ip,uid&db=nlebk&AN=426415&site=eds-live&scope=site
Tang, L. C., Lee, L. H., & Chew, E. P. (2011b). Advances in maritime logistics and
supply chain systems. Singapore: World Scientific. Retrieved
from https://login.proxy.wmu.se/login?url=http://search.ebscohost.com/login.aspx?
direct=true&AuthType=ip,uid&db=nlebk&AN=426415&site=eds-live&scope=site
U.S. Department of State. (2013). 2013 investment climate statement - bahrain.
Retrieved from http://www.state.gov/e/eb/rls/othr/ics/2013/204598.htm
UNCTAD. (2018). United nations conference on trade and development. ().
Switzerland: UN. Retrieved
from http://unctad.org/en/pages/PublicationWebflyer.aspx?publicationid=1890
UNDATA. (2017). Bahrain. Retrieved
from file:///Users/mohammedalhameedi/Downloads/Bahrain2013.pdf

63
Wang, Z., Subramanian, N., Abdulrahman, M. D., Cui, H., Wu, L., & Liu, C.
(2017). Port sustainable services innovation: Ningbo port users’ expectation.
China: Science Direct. doi://doi.org/10.1016/j.spc.2016.08.002
World Bank. (1993). TRANSPORTATION, WATER AND URBAN DEVELOPMENT
DEPARTMENT
THE WORLD BANK (). Washington: World Bank. Retrieved
from http://documents.worldbank.org/curated/en/303501468337289364/pdf/816090
BRI0Infr00Box379840B00PUBLIC0.pdf

64
APPENDICES

65
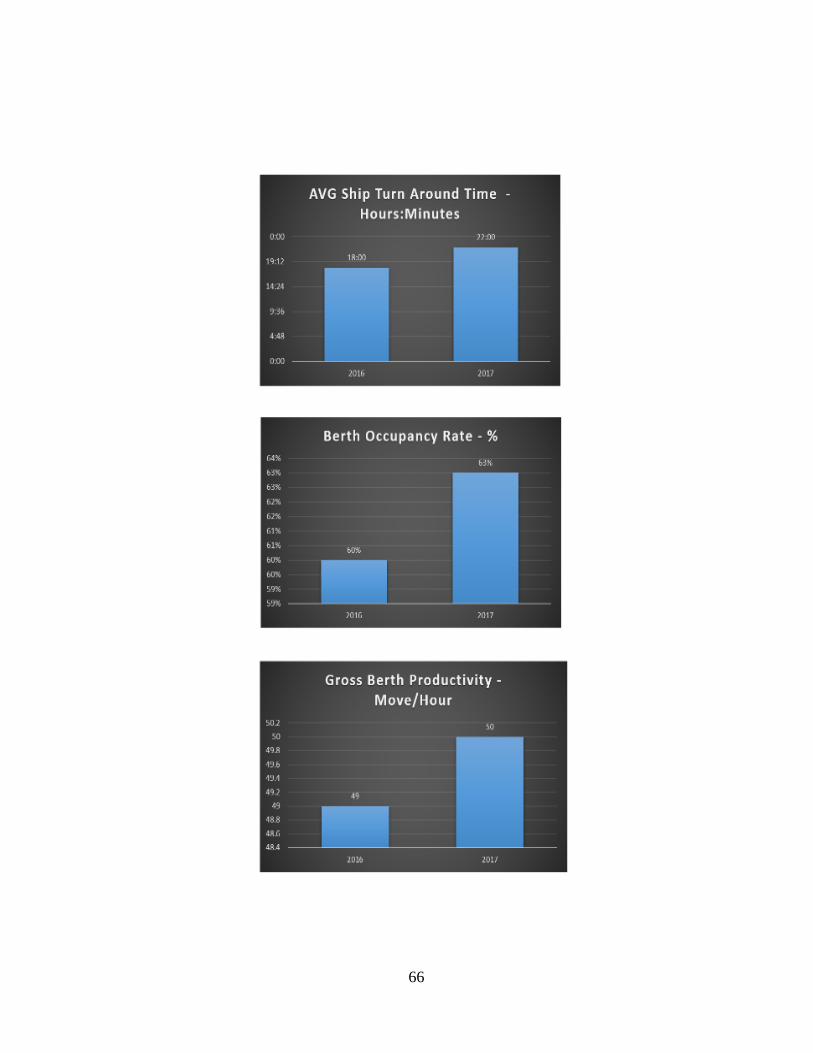
66

67

68

69

70