Embed Size (px)
Citation preview
Fact-based study on the container barge supply chain in the Port of Rotterdam
6 March 2018

EY-Parthenon | Page 2
CONFIDENTIAL
EY-Parthenon | Page 0
EY-Parthenon B.V. ‘De Nieuwe Boompjes’Rederijstraat 53011 XR Rotterdam The Netherlands
Tel: +31 10 217 5555parthenon.ey.com
EY-Parthenon B.V. is established in Rotterdam and registered with the Chamber of Commerce Rotterdam 58273867. Our services are subject to general terms and conditions, which contain a limitation of liability clause.
Any person intending to read this report should first read this letter
Reliance Restricted 6 March 2018
Mr. M. van Doorn
Havenbedrijf Rotterdam N.V.
Postbus 6622
3002 AP
Rotterdam
Dear Sirs, Madams,
Container congestion in the Port of Rotterdam
In accordance with your instructions, we have performed the work set out in our
Engagement Agreement dated 10 November 2017 between Havenbedrijf
Roterdam N.V. and Parthenon-EY B.V. rebranded to EY-Parthenon B.V. on 1
January 2018 (the “Engagement Agreement”) in connection with the proposed
services to perform a research on the container barge supply chain.
Purpose of our report and restrictions on its use
This report was prepared on the specific instructions of the directors of
Havenbedrijf Rotterdam N.V. solely for the purpose as described in the
Engagement Agreement and the supporting presentation dated 25 October
2017 and should not be used or relied upon for any other purpose.
This report and its contents may not be quoted, referred to or shown to any
other parties except as provided in the Engagement Agreement.
We accept no responsibility or liability to any person other than to Havenbedrijf
Rotterdam N.V., or to such party covered by a reliance letter which we have
mutually signed, and accordingly if such other persons choose to rely upon any
of the contents of this report they do so at their own risk.
Nature and scope of the services
The nature and scope of the services, including the basis and limitations, are
detailed in the Engagement Agreement. Moreover, not all data requested was or
has been made available.
Whilst each part of our report addresses different aspects of the work we have
agreed to perform, the entire report should be read for a full understanding of
our findings and advice.
Our work commenced on 2 November 2018 and was completed on 1 February
2018. Therefore, our Report does not take account of events or circumstances
arising after 1 February 2018 and we have no responsibility to update the report
for such events or circumstances.
Yours faithfully,
EY-Parthenon B.V.
Bram Kuijpers
Partner
EY-Parthenon | Page 3
CONFIDENTIAL
Background
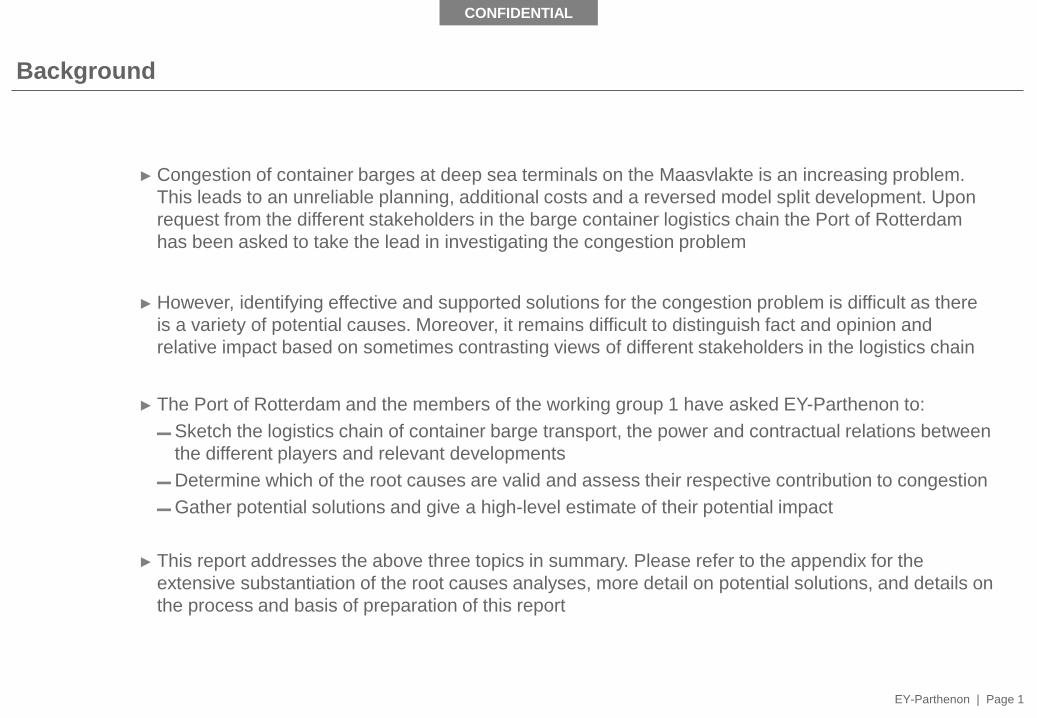
► Congestion of container barges at deep sea terminals on the Maasvlakte is an increasing problem.
This leads to an unreliable planning, additional costs and a reversed model split development. Upon
request from the different stakeholders in the barge container logistics chain the Port of Rotterdam
has been asked to take the lead in investigating the congestion problem
► However, identifying effective and supported solutions for the congestion problem is difficult as there
is a variety of potential causes. Moreover, it remains difficult to distinguish fact and opinion and
relative impact based on sometimes contrasting views of different stakeholders in the logistics chain
► The Port of Rotterdam and the members of the working group 1 have asked EY-Parthenon to:
▬ Sketch the logistics chain of container barge transport, the power and contractual relations between
the different players and relevant developments
▬ Determine which of the root causes are valid and assess their respective contribution to congestion
▬ Gather potential solutions and give a high-level estimate of their potential impact
► This report addresses the above three topics in summary. Please refer to the appendix for the
extensive substantiation of the root causes analyses, more detail on potential solutions, and details on
the process and basis of preparation of this report
EY-Parthenon | Page 1
EY-Parthenon | Page 4
CONFIDENTIAL
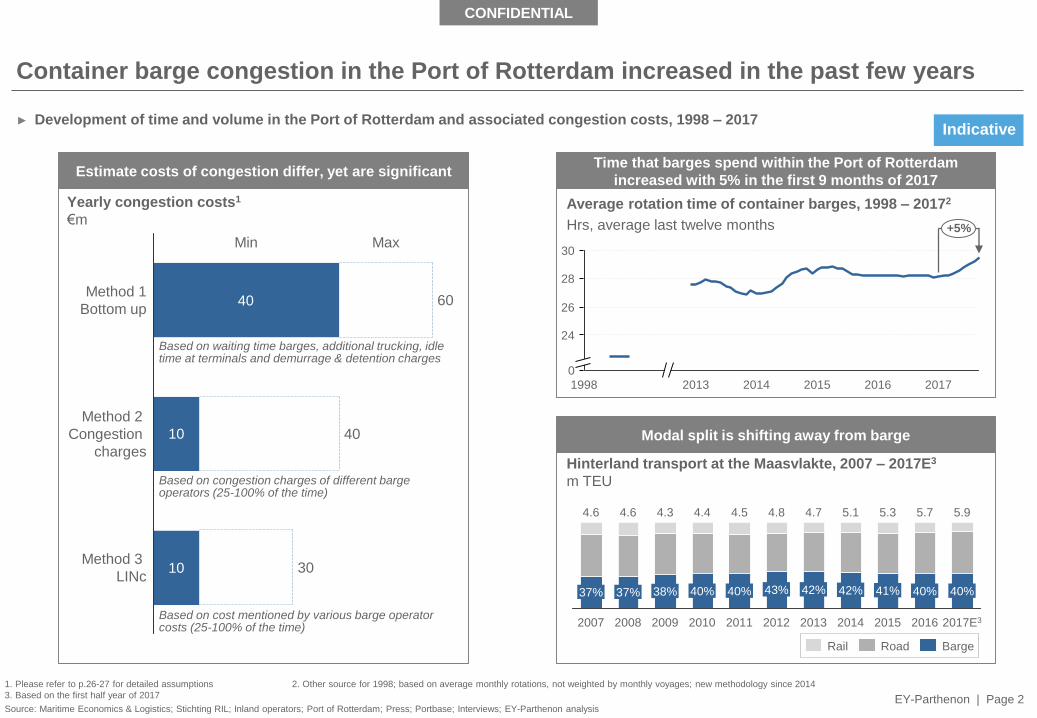
Time that barges spend within the Port of Rotterdam
increased with 5% in the first 9 months of 2017
Container barge congestion in the Port of Rotterdam increased in the past few years
30
28
26
24
0
+5%
201720162015201420131998
Estimate costs of congestion differ, yet are significant
Modal split is shifting away from barge
Average rotation time of container barges, 1998 – 20172
Hrs, average last twelve months
2011
4.5
40%
2010
38%
2008
4.6
37%
2007
4.6
37%
2017E3
5.9
40%
2016
5.7
43%
2015
5.34.7
42%
2012
4.8
41%
2014
5.1
42%
2013
4.4
40%
2009
4.3
40%
BargeRoadRail
Hinterland transport at the Maasvlakte, 2007 – 2017E3
m TEU
Yearly congestion costs1
€m
1. Please refer to p.26-27 for detailed assumptions 2. Other source for 1998; based on average monthly rotations, not weighted by monthly voyages; new methodology since 2014
3. Based on the first half year of 2017
Source: Maritime Economics & Logistics; Stichting RIL; Inland operators; Port of Rotterdam; Press; Portbase; Interviews; EY-Parthenon analysis
► Development of time and volume in the Port of Rotterdam and associated congestion costs, 1998 – 2017
40
10
10
Min Max
Method 3
LINc30
60
Method 2
Congestion
charges
40
Method 1
Bottom up
Indicative
Based on waiting time barges, additional trucking, idle time at terminals and demurrage & detention charges
Based on congestion charges of different barge operators (25-100% of the time)
Based on cost mentioned by various barge operator costs (25-100% of the time)
EY-Parthenon | Page 2
EY-Parthenon | Page 5
CONFIDENTIAL
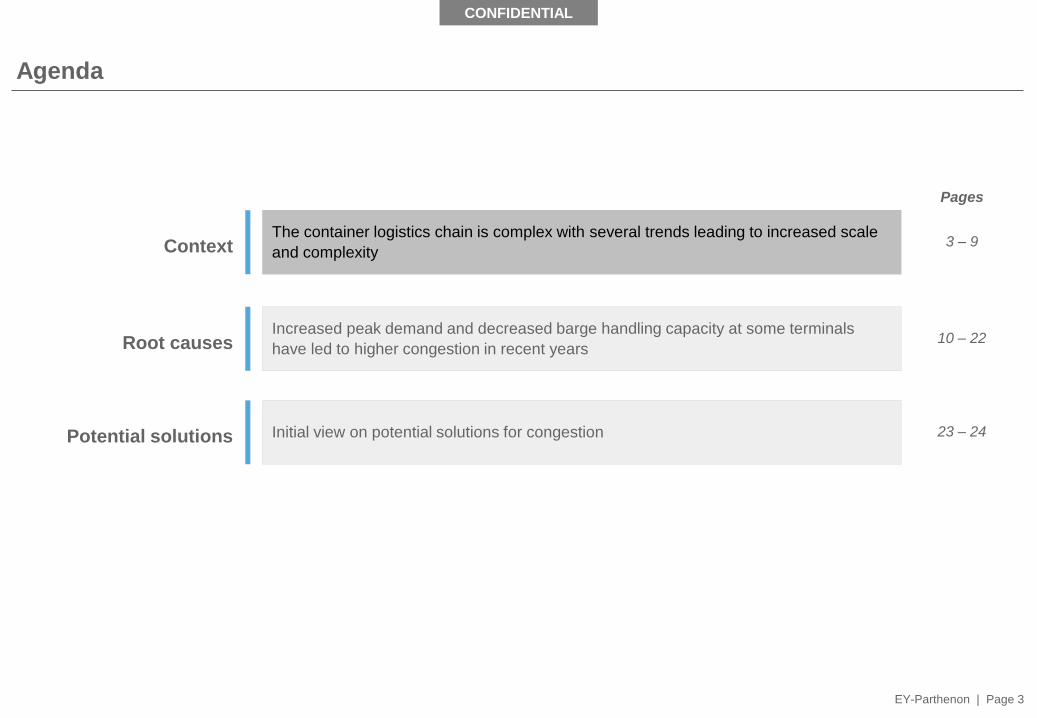
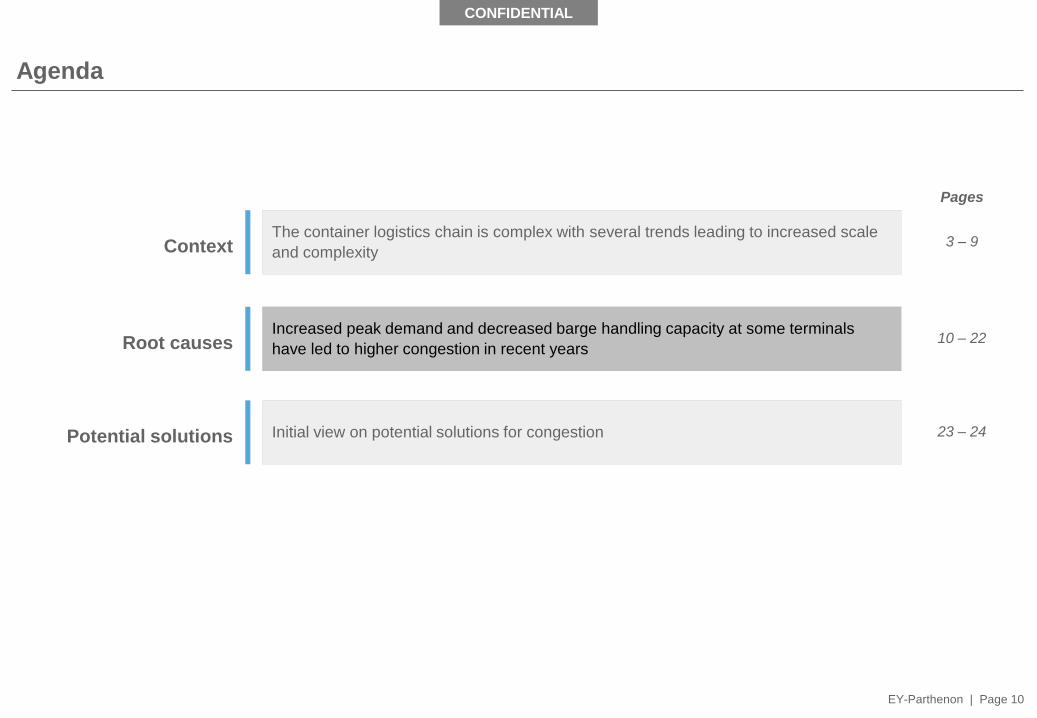
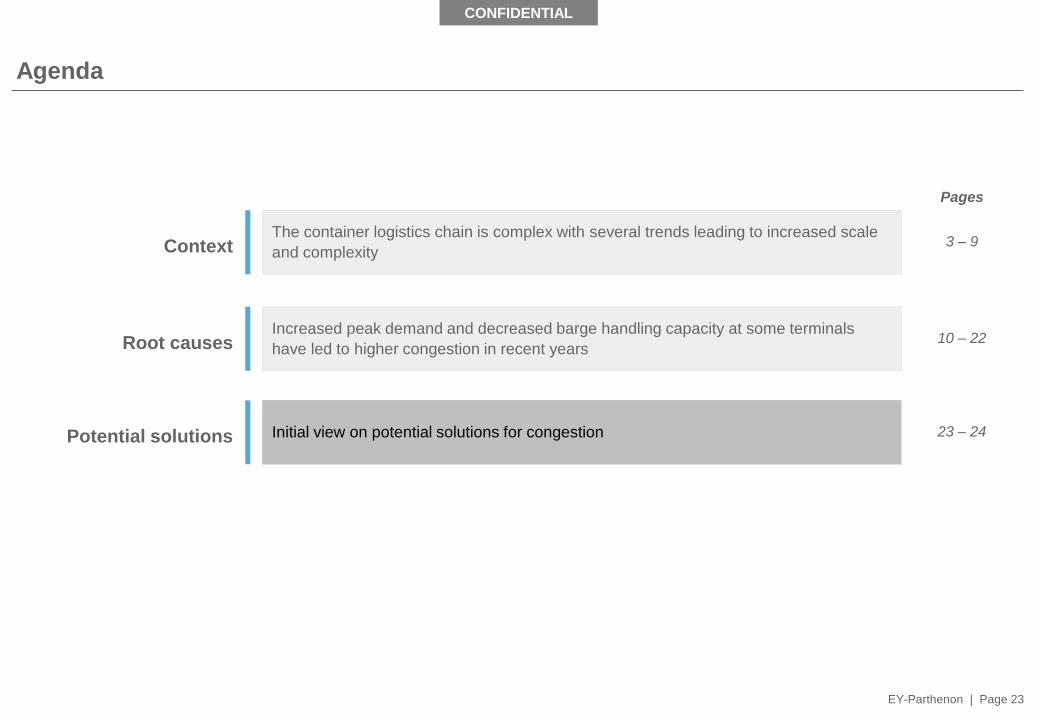
Agenda
The container logistics chain is complex with several trends leading to increased scale
and complexity
Increased peak demand and decreased barge handling capacity at some terminals
have led to higher congestion in recent years
Initial view on potential solutions for congestion
Context
Potential solutions
Root causes
Pages
3 – 9
10 – 22
23 – 24
EY-Parthenon | Page 3
EY-Parthenon | Page 6
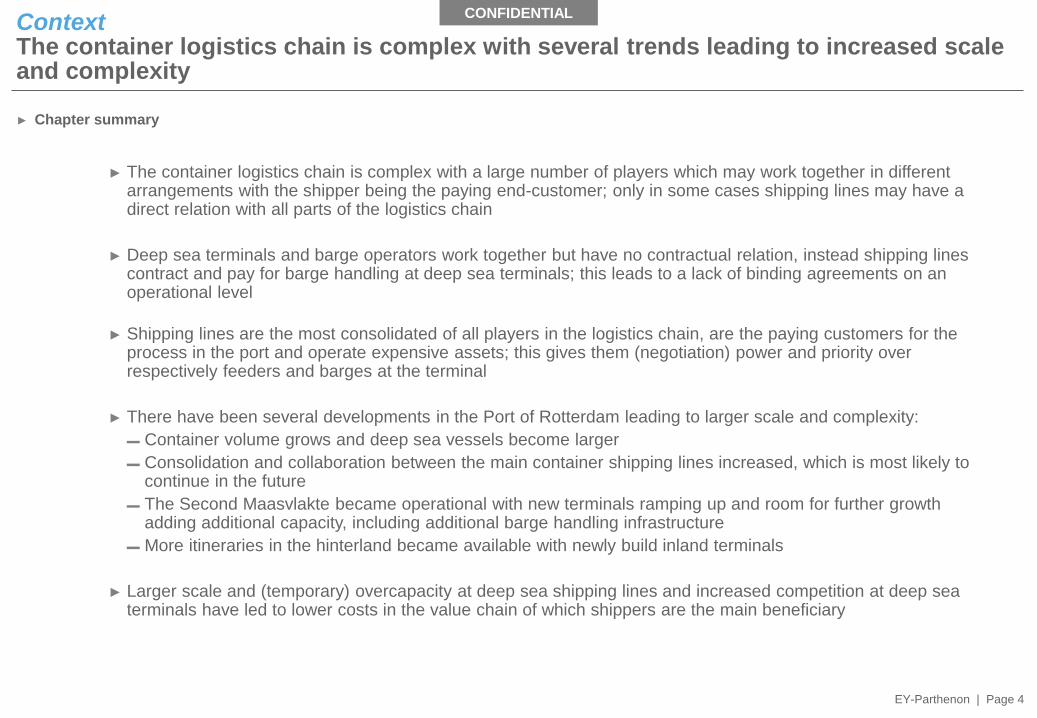
CONFIDENTIALContextThe container logistics chain is complex with several trends leading to increased scale and complexity
► The container logistics chain is complex with a large number of players which may work together in different arrangements with the shipper being the paying end-customer; only in some cases shipping lines may have a direct relation with all parts of the logistics chain
► Deep sea terminals and barge operators work together but have no contractual relation, instead shipping lines contract and pay for barge handling at deep sea terminals; this leads to a lack of binding agreements on an operational level
► Shipping lines are the most consolidated of all players in the logistics chain, are the paying customers for the process in the port and operate expensive assets; this gives them (negotiation) power and priority over respectively feeders and barges at the terminal
► There have been several developments in the Port of Rotterdam leading to larger scale and complexity:
▬ Container volume grows and deep sea vessels become larger
▬ Consolidation and collaboration between the main container shipping lines increased, which is most likely to continue in the future
▬ The Second Maasvlakte became operational with new terminals ramping up and room for further growth adding additional capacity, including additional barge handling infrastructure
▬ More itineraries in the hinterland became available with newly build inland terminals
► Larger scale and (temporary) overcapacity at deep sea shipping lines and increased competition at deep sea terminals have led to lower costs in the value chain of which shippers are the main beneficiary
► Chapter summary
EY-Parthenon | Page 4
EY-Parthenon | Page 7
CONFIDENTIAL
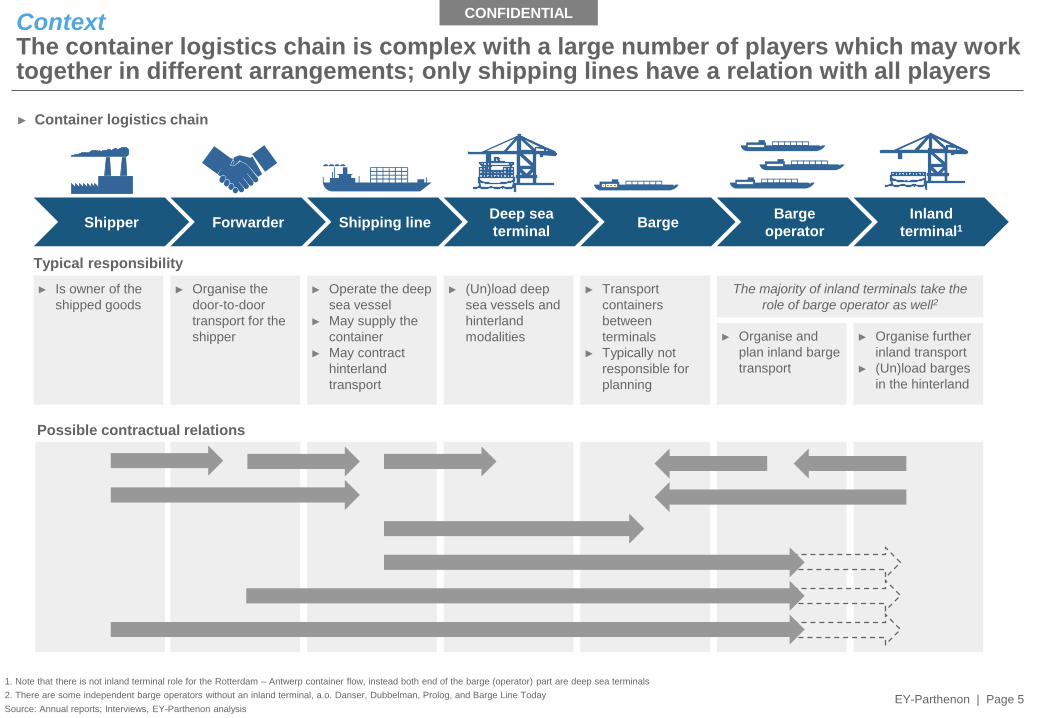
► Operate the deep
sea vessel
► May supply the
container
► May contract
hinterland
transport
► (Un)load deep
sea vessels and
hinterland
modalities
► Transport
containers
between
terminals
► Typically not
responsible for
planning
► Organise and
plan inland barge
transport
► Is owner of the
shipped goods
► Organise the
door-to-door
transport for the
shipper
ContextThe container logistics chain is complex with a large number of players which may work together in different arrangements; only shipping lines have a relation with all players
► Container logistics chain
Typical responsibility
Possible contractual relations
► Organise further
inland transport
► (Un)load barges
in the hinterland
The majority of inland terminals take the
role of barge operator as well2
Shipper Shipping lineDeep sea
terminalForwarder Barge
Inland
terminal1Barge
operator
1. Note that there is not inland terminal role for the Rotterdam – Antwerp container flow, instead both end of the barge (operator) part are deep sea terminals
2. There are some independent barge operators without an inland terminal, a.o. Danser, Dubbelman, Prolog, and Barge Line Today
Source: Annual reports; Interviews, EY-Parthenon analysisEY-Parthenon | Page 5

EY-Parthenon | Page 8
CONFIDENTIALContext Some players - such as deep sea terminals and barge operators - work together but have no contractual relation; this makes it more difficult to work together smoothly
Shipper Forwarder Shipping lineDeep sea
terminal
Inland terminal /
Barge operator
Physical
(Containers)
Contractualrelations
simplified
► Logistics chain (simplified) – physical and contractual
Source: Interviews; EY-Parthenon analysis
Conceptual
Implications of absence of a contractual
relation:
► Payment of the handling comes through the
shipping line whose vessels often share capacity
with barges; even shippers that contract
hinterland transport do not have a direct relation
with deep sea terminals
► Lack of (service level) agreements leave the
possibility at both sides to cancel or reschedule
last minute without any financial consequences
EY-Parthenon | Page 6
EY-Parthenon | Page 9
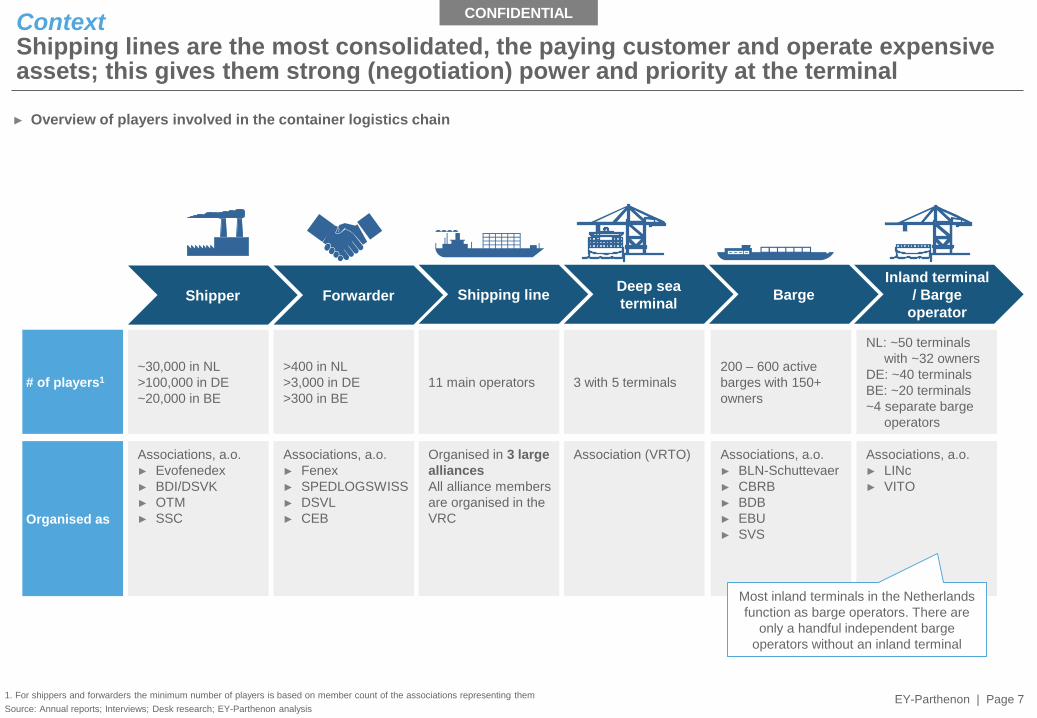
CONFIDENTIALContextShipping lines are the most consolidated, the paying customer and operate expensive assets; this gives them strong (negotiation) power and priority at the terminal
Shipper Shipping lineDeep sea
terminalBarge
Inland terminal
/ Barge
operatorForwarder
► Overview of players involved in the container logistics chain
1. For shippers and forwarders the minimum number of players is based on member count of the associations representing them
Source: Annual reports; Interviews; Desk research; EY-Parthenon analysis
# of players1 11 main operators 3 with 5 terminals
200 – 600 active
barges with 150+
owners
NL: ~50 terminals
with ~32 owners
DE: ~40 terminals
BE: ~20 terminals
~4 separate barge
operators
Organised as
Associations, a.o.
► Evofenedex
► BDI/DSVK
► OTM
► SSC
Associations, a.o.
► Fenex
► SPEDLOGSWISS
► DSVL
► CEB
Organised in 3 large
alliances
All alliance members
are organised in the
VRC
Associations, a.o.
► BLN-Schuttevaer
► CBRB
► BDB
► EBU
► SVS
Associations, a.o.
► LINc
► VITO
~30,000 in NL
>100,000 in DE
~20,000 in BE
>400 in NL
>3,000 in DE
>300 in BE
Association (VRTO)
Most inland terminals in the Netherlands
function as barge operators. There are
only a handful independent barge
operators without an inland terminal
EY-Parthenon | Page 7

EY-Parthenon | Page 10
CONFIDENTIAL
Container volume grows, transported by more and larger
deep sea vessels
Maasvlakte 2 is operational with new terminals ramping
up and room for further growthMore hinterland itineraries are available
Consolidation / collaboration of container shipping lines
increases, this is likely to continue in the future
► New collaborations formed in
April 2017 resulting in three
alliances
► 3 Alliances combined have
~75% market shares
► In 2015 the number of
operational deep sea terminals
increased from three to five
► Further growth is possible,
APMT2, RWG and Euromax
could all be further expanded
Context There have been several trends in Port of Rotterdam leading to larger scale and complexity
1. Ultra Large Container Vessels
Source: Port of Rotterdam; Inlandlinks; Press; EY-Parthenon analysis
► Examples of changes in the Port of Rotterdam Not exhaustive
► Estimated ULCV1 counts of the 3 alliances, 2017 –
2020
► # of vessels
4845434140
373532
2012 201320112010 2014 2015 2016 2017
► Inland terminals in the Netherlands, 2010 – 2017
► # inland terminals
6894 107
125
2017 2019 20202018
“Further consolidation seem
imminent, most likely resulting in the
survival of five or six top carriers”
– CEO Møller Mærsk
EY-Parthenon | Page 8
EY-Parthenon | Page 11
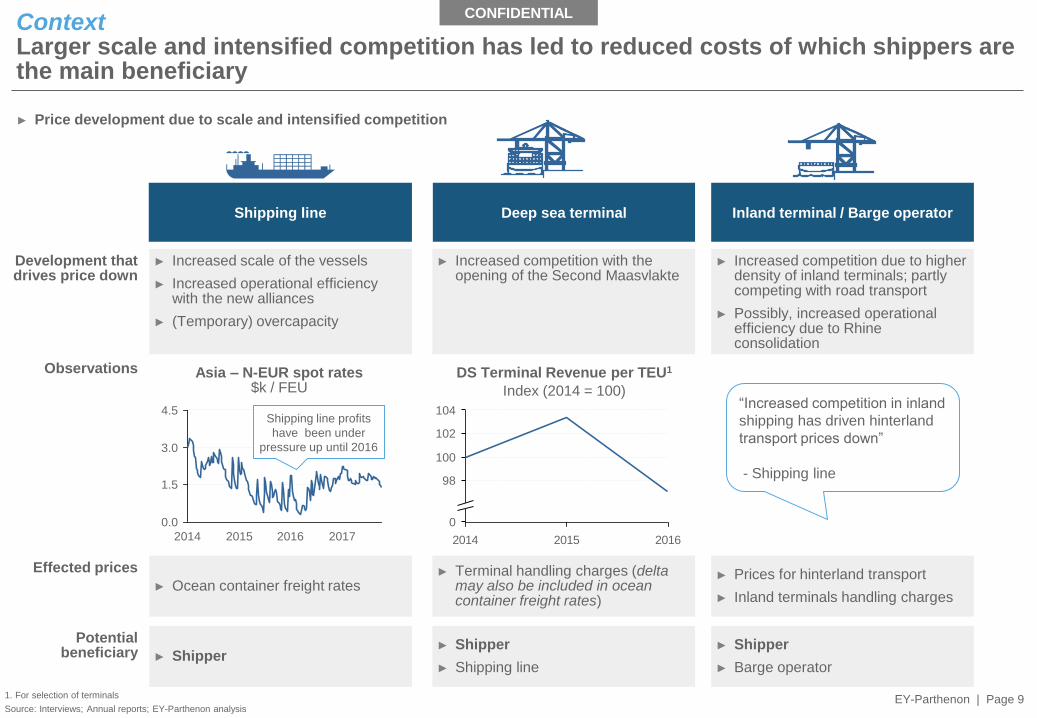
CONFIDENTIALContext Larger scale and intensified competition has led to reduced costs of which shippers are the main beneficiary
Shipping line Deep sea terminal Inland terminal / Barge operator
► Increased competition with the opening of the Second Maasvlakte
► Increased scale of the vessels
► Increased operational efficiency with the new alliances
► (Temporary) overcapacity
Development that drives price down
► Terminal handling charges (delta may also be included in ocean container freight rates)
► Ocean container freight rates
Effected prices
► Increased competition due to higher density of inland terminals; partly competing with road transport
► Possibly, increased operational efficiency due to Rhine consolidation
► Prices for hinterland transport
► Inland terminals handling charges
► Shipper
► Shipping line► Shipper
Potentialbeneficiary
► Shipper
► Barge operator
► Price development due to scale and intensified competition
1. For selection of terminals
Source: Interviews; Annual reports; EY-Parthenon analysis
2014 2015 2016
0
104
102
100
98
“Increased competition in inland
shipping has driven hinterland
transport prices down”
- Shipping line
DS Terminal Revenue per TEU1
Index (2014 = 100)
4.5
1.5
3.0
0.0
2017201620152014
Asia – N-EUR spot rates$k / FEU
Shipping line profits
have been under
pressure up until 2016
Observations
EY-Parthenon | Page 9
EY-Parthenon | Page 12
CONFIDENTIAL
Agenda
EY-Parthenon | Page 10
The container logistics chain is complex with several trends leading to increased scale
and complexity
Increased peak demand and decreased barge handling capacity at some terminals
have led to higher congestion in recent years
Initial view on potential solutions for congestion
Context
Potential solutions
Root causes
Pages
3 – 9
10 – 22
23 – 24
EY-Parthenon | Page 13
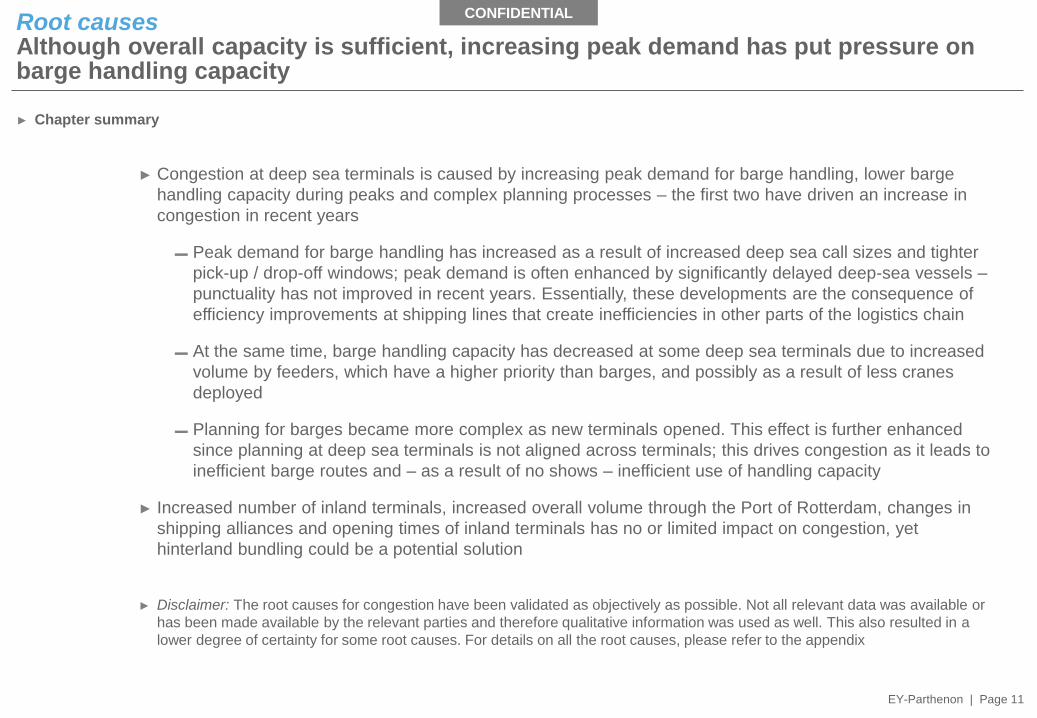
CONFIDENTIALRoot causesAlthough overall capacity is sufficient, increasing peak demand has put pressure on barge handling capacity
► Congestion at deep sea terminals is caused by increasing peak demand for barge handling, lower barge
handling capacity during peaks and complex planning processes – the first two have driven an increase in
congestion in recent years
▬ Peak demand for barge handling has increased as a result of increased deep sea call sizes and tighter
pick-up / drop-off windows; peak demand is often enhanced by significantly delayed deep-sea vessels –
punctuality has not improved in recent years. Essentially, these developments are the consequence of
efficiency improvements at shipping lines that create inefficiencies in other parts of the logistics chain
▬ At the same time, barge handling capacity has decreased at some deep sea terminals due to increased
volume by feeders, which have a higher priority than barges, and possibly as a result of less cranes
deployed
▬ Planning for barges became more complex as new terminals opened. This effect is further enhanced
since planning at deep sea terminals is not aligned across terminals; this drives congestion as it leads to
inefficient barge routes and – as a result of no shows – inefficient use of handling capacity
► Increased number of inland terminals, increased overall volume through the Port of Rotterdam, changes in
shipping alliances and opening times of inland terminals has no or limited impact on congestion, yet
hinterland bundling could be a potential solution
► Disclaimer: The root causes for congestion have been validated as objectively as possible. Not all relevant data was available or
has been made available by the relevant parties and therefore qualitative information was used as well. This also resulted in a
lower degree of certainty for some root causes. For details on all the root causes, please refer to the appendix
► Chapter summary
EY-Parthenon | Page 11
EY-Parthenon | Page 14
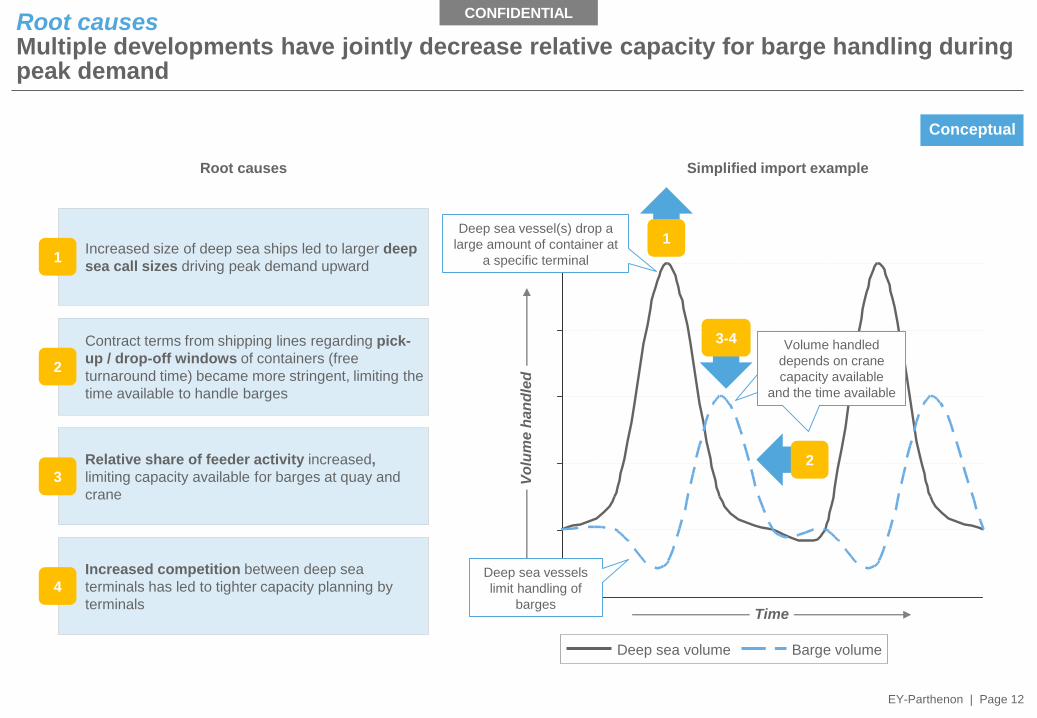
CONFIDENTIALRoot causesMultiple developments have jointly decrease relative capacity for barge handling during peak demand
Deep sea volume Barge volume
Conceptual
Increased size of deep sea ships led to larger deep
sea call sizes driving peak demand upward
Contract terms from shipping lines regarding pick-
up / drop-off windows of containers (free
turnaround time) became more stringent, limiting the
time available to handle barges
Relative share of feeder activity increased,
limiting capacity available for barges at quay and
crane
Increased competition between deep sea
terminals has led to tighter capacity planning by
terminals
3-4
23
2
1
4
1
Simplified import example
Deep sea vessel(s) drop a
large amount of container at
a specific terminal
Vo
lum
e h
an
dle
d
Time
Deep sea vessels
limit handling of
barges
Volume handled
depends on crane
capacity available
and the time available
Volume handled
depends on crane
capacity available
and the time available
Root causes
EY-Parthenon | Page 12
EY-Parthenon | Page 15
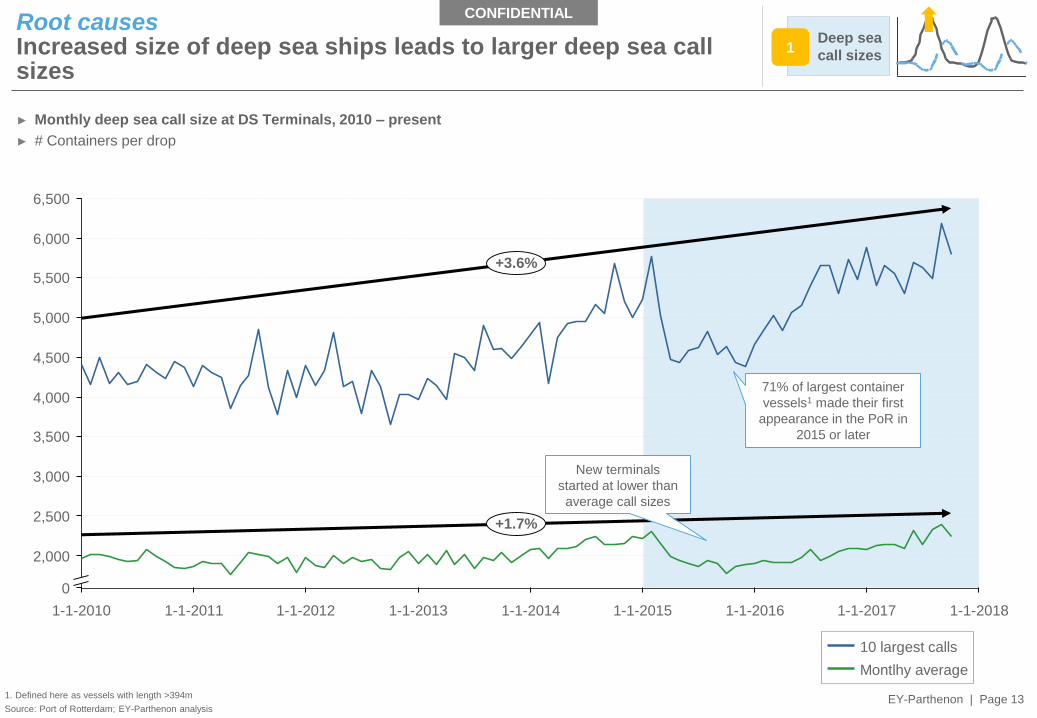
CONFIDENTIALRoot causesIncreased size of deep sea ships leads to larger deep sea call sizes
6,500
6,000
5,500
5,000
4,000
3,500
3,000
2,500
2,000
0
1-1-20181-1-20171-1-20141-1-2012 1-1-2015
4,500
1-1-2011 1-1-20161-1-20131-1-2010
+3.6%
+1.7%
1. Defined here as vessels with length >394m
Source: Port of Rotterdam; EY-Parthenon analysis
► Monthly deep sea call size at DS Terminals, 2010 – present
► # Containers per drop
71% of largest container
vessels1 made their first
appearance in the PoR in
2015 or later
Deep sea
call sizes1
New terminals
started at lower than
average call sizes
Montlhy average
10 largest calls
EY-Parthenon | Page 13

EY-Parthenon | Page 16
CONFIDENTIALRoot causesPeak demand is often enhanced by significantly delayed deep-sea vessels – punctuality has not improved in recent years
0%
20%
40%
60%
80%
100%
201720162015201420132012
Asia – North Europe schedule reliability
%
Average delay for late vessel arrivals
days
0
1
2
3
4
5
6
2015201420132012 20172016
► Asia – North Europe trade developments, 2012 – April 2017
Source: SeaIntel; EY-Parthenon analysis
Indicative
Asia - Rotterdam
Asia - North Europe
Deep sea
call sizes1
EY-Parthenon | Page 14

EY-Parthenon | Page 17
CONFIDENTIALRoot causesMultiple days are needed to move away the barge volumes after an import peak, sometimes longer than demurrage windows
3.3
4.4
3.7
2.8
2.9
Liner A
5 days
Hapag Lloyd
4 days
Maersk
3 days
Terminal E
Terminal D
Terminal C
Terminal B
Terminal A
► Barge handling time needed to handle average of 10 largest deep sea drops1 per terminal
► Days
1. Defined by departure day in port
Source: Interviews; Port of Rotterdam; Company websites (Maersk / Hapag Lloyd); EY-Parthenon analysis
Model calculation
Input for model calculation
Figure shows how many days it would take to manoeuver away the average of the 10 largest deep sea drops per terminal, based on:
► Realised modal split per terminal (1st half 2017)
► Average number of barges present per terminal (2017YTD)
► 2017 Realized moves per hour per terminal (1st half 2017) including mooring time
► 50/50 ratio loading and unloading
► 15% idle time per terminal to reflect amongst others no shows, planning inefficiencies and crane personnel breaks
► Excludes limitations due to barge operating schedules or other terminal visits
Pick-up
/drop-off
windows2
EY-Parthenon | Page 15
EY-Parthenon | Page 18
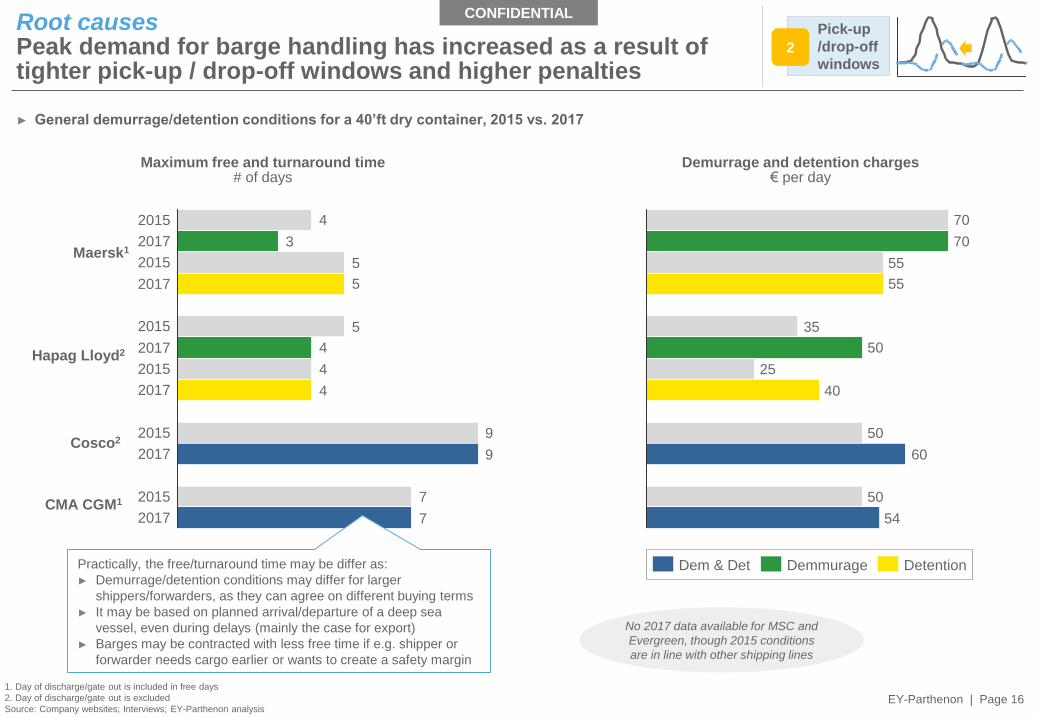
CONFIDENTIALRoot causes Peak demand for barge handling has increased as a result of tighter pick-up / drop-off windows and higher penalties
1. Day of discharge/gate out is included in free days
2. Day of discharge/gate out is excluded
Source: Company websites; Interviews; EY-Parthenon analysis
7
7
9
9
4
4
4
5
5
5
3
4
2017
2015
2017
2015
2015
2017
2017
2015
2017
2017
2015
2015
Maersk1
Hapag Lloyd2
CMA CGM1
Cosco2
► General demurrage/detention conditions for a 40’ft dry container, 2015 vs. 2017
54
50
60
50
40
25
50
35
55
55
70
70
DemmurageDem & Det Detention
Maximum free and turnaround time# of days
Demurrage and detention charges€ per day
Pick-up
/drop-off
windows2
No 2017 data available for MSC and
Evergreen, though 2015 conditions
are in line with other shipping lines
Practically, the free/turnaround time may be differ as:
► Demurrage/detention conditions may differ for larger
shippers/forwarders, as they can agree on different buying terms
► It may be based on planned arrival/departure of a deep sea
vessel, even during delays (mainly the case for export)
► Barges may be contracted with less free time if e.g. shipper or
forwarder needs cargo earlier or wants to create a safety margin
EY-Parthenon | Page 16

EY-Parthenon | Page 19
CONFIDENTIALRoot causes Growing relative share of feeder activity, decreasing the quay and crane capacity available for barges
2012
1.8
(21%)
6.7
(79%)
8.5
2017
11.0
2.6
(24%)
8.3
(76%)
2016
9.5
2.0
(21%)
7.5
(79%)
2015
9.0
1.9
(21%)
7.1
(79%)
2014
9.1
1.9
(20%)
7.2
(80%)
2013
8.8
1.9
(21%)
6.9
(79%)
2011
8.6
1.9
(22%)
6.7
(78%)
2010
7.8
1.5
(20%)
6.2
(80%)
Volume handled at Maasvlakte, 2010 – 2017
m TEU
1. 90% of total capacity based on number of dedicated feeder/barge cranes, an average moving speed of 20 containers/hour, 24h a day, 364 days a year. Assumed to be a theoretical maximum
2.H1 LTM = last twelve months; second half 2016 and first half 2017
Source: Port of Rotterdam; EY-Parthenon analysis
Deep seaFeeder
c.45%
c.55%
Barge and feeder throughput handled by
dedicated cranes1, 2017H1 LTM2
% of TEU
Read example: Around
55% of the barge
volume needs to be
handled at the same
quay as deep sea
vessels and feeders
Dedicated cranesOther cranes
► Barge handling capacity metrics
Feeder
activity3
Feeder volumes have grown in both absolute and relative
terms
More than 55% of the barge / feeder volumes handled at
deep sea terminals competes with deep sea volume
Part of the dedicated cranes
can handle both feeder and
barges, increasing the impact
of feeder volume growth
5.6 5.9 5.5 5.3 5.7 5.7 6.4 7.5
# Calls (‘000)
1.9 2.1 2.2 2.1 2.1 2.2 2.3 2.3 DS
Feeder
EY-Parthenon | Page 17
EY-Parthenon | Page 20
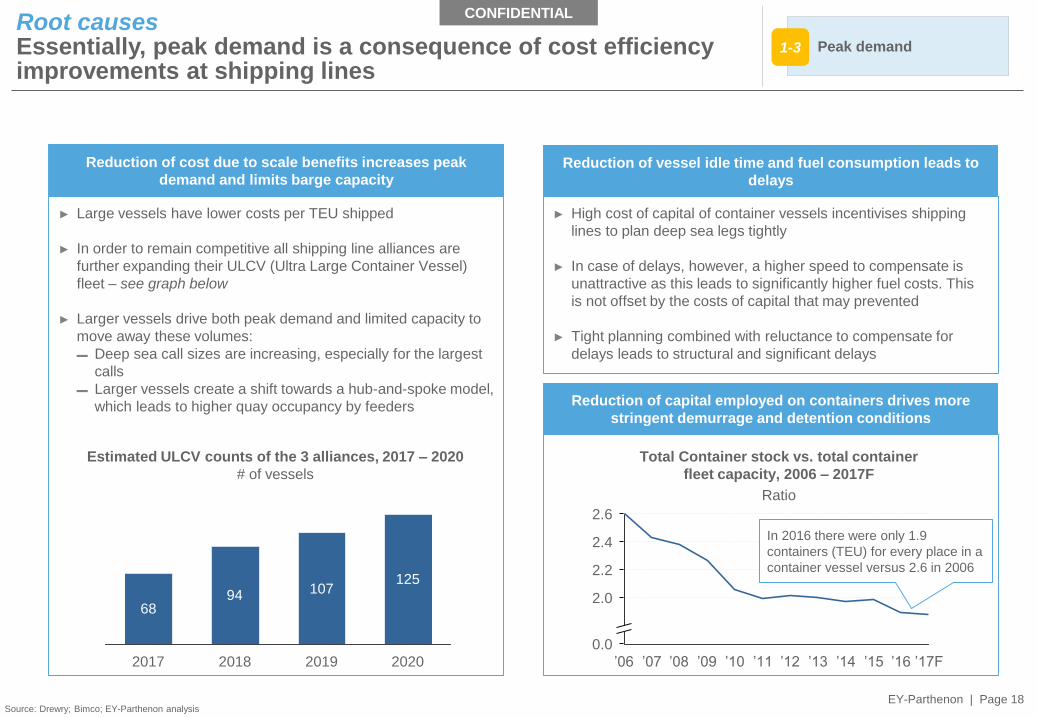
CONFIDENTIALRoot causesEssentially, peak demand is a consequence of cost efficiency improvements at shipping lines
2.6
2.4
2.2
2.0
0.0
’17F’16’15’14’13’12’11’10’09’08’07’06
Source: Drewry; Bimco; EY-Parthenon analysis
In 2016 there were only 1.9
containers (TEU) for every place in a
container vessel versus 2.6 in 2006
Total Container stock vs. total container
fleet capacity, 2006 – 2017F
Ratio
Peak demand1-3
► Large vessels have lower costs per TEU shipped
► In order to remain competitive all shipping line alliances are
further expanding their ULCV (Ultra Large Container Vessel)
fleet – see graph below
► Larger vessels drive both peak demand and limited capacity to
move away these volumes:
▬ Deep sea call sizes are increasing, especially for the largest
calls
▬ Larger vessels create a shift towards a hub-and-spoke model,
which leads to higher quay occupancy by feeders
► High cost of capital of container vessels incentivises shipping
lines to plan deep sea legs tightly
► In case of delays, however, a higher speed to compensate is
unattractive as this leads to significantly higher fuel costs. This
is not offset by the costs of capital that may prevented
► Tight planning combined with reluctance to compensate for
delays leads to structural and significant delays
Reduction of cost due to scale benefits increases peak
demand and limits barge capacityReduction of vessel idle time and fuel consumption leads to
delays
Reduction of capital employed on containers drives more
stringent demurrage and detention conditions
Estimated ULCV counts of the 3 alliances, 2017 – 2020
# of vessels
6894 107
125
2020201920182017
EY-Parthenon | Page 18
EY-Parthenon | Page 21
CONFIDENTIAL
-10%
-2%
5%
9%
Terminal D
Terminal C
Terminal B
Terminal A
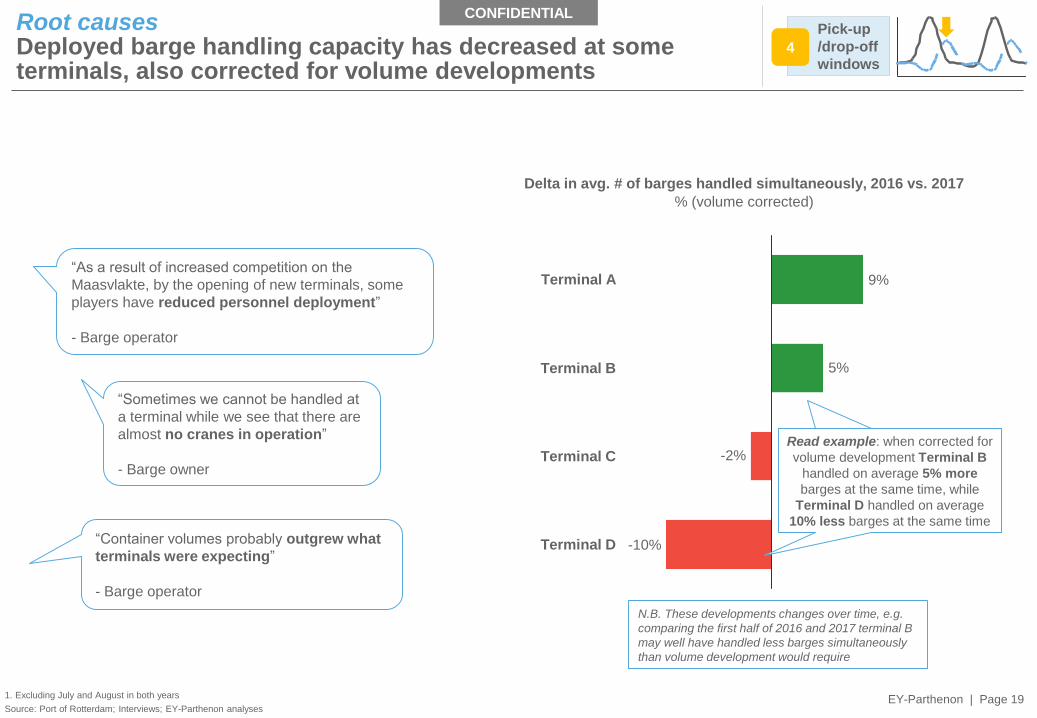
Root causesDeployed barge handling capacity has decreased at some terminals, also corrected for volume developments
“As a result of increased competition on the
Maasvlakte, by the opening of new terminals, some
players have reduced personnel deployment”
- Barge operator
“Sometimes we cannot be handled at
a terminal while we see that there are
almost no cranes in operation”
- Barge owner
1. Excluding July and August in both years
Source: Port of Rotterdam; Interviews; EY-Parthenon analyses
“Container volumes probably outgrew what
terminals were expecting”
- Barge operator
Delta in avg. # of barges handled simultaneously, 2016 vs. 2017
% (volume corrected)
Pick-up
/drop-off
windows4
Read example: when corrected for
volume development Terminal C
handled on average 9% more
barges at the same time, while
Terminal D handled on average
10% less barges at the same time
Read example: when corrected for
volume development Terminal B
handled on average 5% more
barges at the same time, while
Terminal D handled on average
10% less barges at the same time
EY-Parthenon | Page 19
N.B. These developments changes over time, e.g.
comparing the first half of 2016 and 2017 terminal B
may well have handled less barges simultaneously
than volume development would require
EY-Parthenon | Page 22
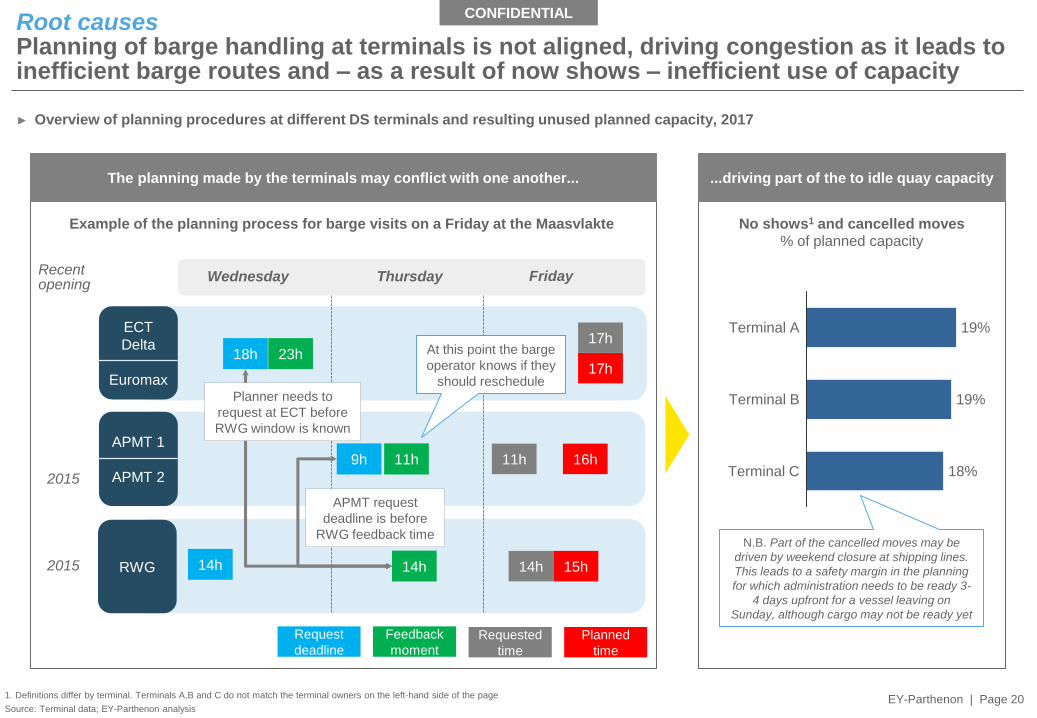
CONFIDENTIALRoot causes Planning of barge handling at terminals is not aligned, driving congestion as it leads to inefficient barge routes and – as a result of now shows – inefficient use of capacity
Terminal C 18%
Terminal B 19%
Terminal A 19%
1. Definitions differ by terminal. Terminals A,B and C do not match the terminal owners on the left-hand side of the page
Source: Terminal data; EY-Parthenon analysis
No shows1 and cancelled moves
% of planned capacity
► Overview of planning procedures at different DS terminals and resulting unused planned capacity, 2017
ECT
Delta
Euromax
18h17h
17h23h
Wednesday Thursday Friday
RWG 14h 15h14h 14h
Example of the planning process for barge visits on a Friday at the Maasvlakte
N.B. Part of the cancelled moves may be
driven by weekend closure at shipping lines.
This leads to a safety margin in the planning
for which administration needs to be ready 3-
4 days upfront for a vessel leaving on
Sunday, although cargo may not be ready yet
At this point the barge
operator knows if they
should reschedule
The planning made by the terminals may conflict with one another... ...driving part of the to idle quay capacity
11h
APMT 1
APMT 2
9h 11h 16h
APMT request
deadline is before
RWG feedback time
Planner needs to
request at ECT before
RWG window is known
Requested
time
Planned
time
Request
deadline
Feedback
moment
Recentopening
2015
2015
EY-Parthenon | Page 20
EY-Parthenon | Page 23
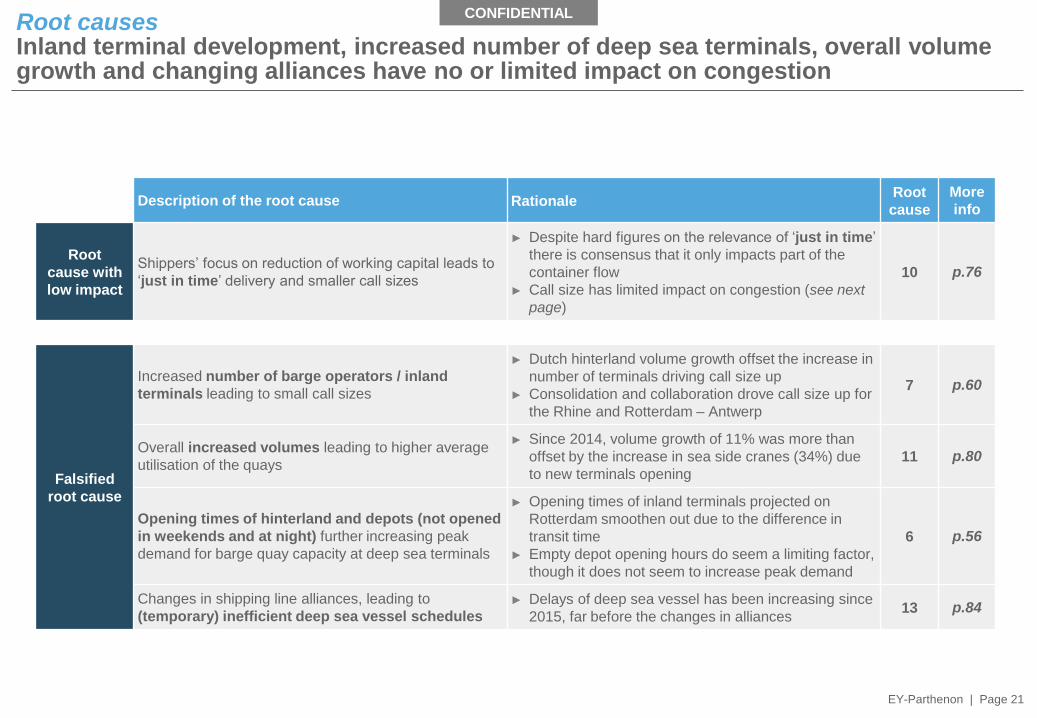
CONFIDENTIALRoot causesInland terminal development, increased number of deep sea terminals, overall volume growth and changing alliances have no or limited impact on congestion
Description of the root cause RationaleRoot
cause
More
info
Root
cause with
low impact
Shippers’ focus on reduction of working capital leads to
‘just in time’ delivery and smaller call sizes
► Despite hard figures on the relevance of ‘just in time’
there is consensus that it only impacts part of the
container flow
► Call size has limited impact on congestion (see next
page)
10 p.76
Falsified
root cause
Increased number of barge operators / inland
terminals leading to small call sizes
► Dutch hinterland volume growth offset the increase in
number of terminals driving call size up
► Consolidation and collaboration drove call size up for
the Rhine and Rotterdam – Antwerp
7 p.60
Overall increased volumes leading to higher average
utilisation of the quays
► Since 2014, volume growth of 11% was more than
offset by the increase in sea side cranes (34%) due
to new terminals opening
11 p.80
Opening times of hinterland and depots (not opened
in weekends and at night) further increasing peak
demand for barge quay capacity at deep sea terminals
► Opening times of inland terminals projected on
Rotterdam smoothen out due to the difference in
transit time
► Empty depot opening hours do seem a limiting factor,
though it does not seem to increase peak demand
6 p.56
Changes in shipping line alliances, leading to
(temporary) inefficient deep sea vessel schedules
► Delays of deep sea vessel has been increasing since
2015, far before the changes in alliances13 p.84
EY-Parthenon | Page 21
EY-Parthenon | Page 24
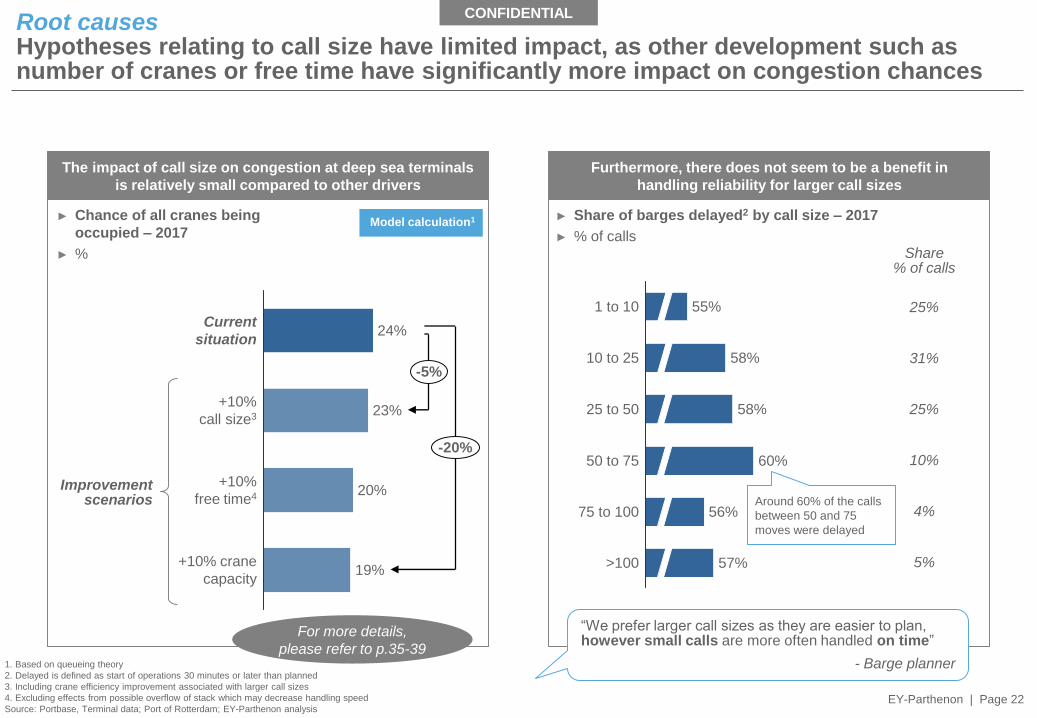
CONFIDENTIALRoot causesHypotheses relating to call size have limited impact, as other development such as number of cranes or free time have significantly more impact on congestion chances
1. Based on queueing theory
2. Delayed is defined as start of operations 30 minutes or later than planned
3. Including crane efficiency improvement associated with larger call sizes
4. Excluding effects from possible overflow of stack which may decrease handling speed
Source: Portbase, Terminal data; Port of Rotterdam; EY-Parthenon analysis
Model calculation1
The impact of call size on congestion at deep sea terminals
is relatively small compared to other drivers
Furthermore, there does not seem to be a benefit in
handling reliability for larger call sizes
-5%
-20%
+10% crane
capacity19%
+10%
free time4 20%
+10%
call size3 23%
Current
situation24%
► Chance of all cranes being
occupied – 2017
► %
>100 57%
75 to 100 56%
50 to 75 60%
25 to 50 58%
10 to 25 58%
1 to 10 55%
31%
25%
10%
4%
5%
25%
Share% of calls
“We prefer larger call sizes as they are easier to plan, however small calls are more often handled on time”
- Barge planner
► Share of barges delayed2 by call size – 2017
► % of calls
Improvementscenarios
For more details,
please refer to p.35-39
Around 60% of the calls
between 50 and 75
moves were delayed
EY-Parthenon | Page 22
EY-Parthenon | Page 25
CONFIDENTIAL
Agenda
EY-Parthenon | Page 23
The container logistics chain is complex with several trends leading to increased scale
and complexity
Increased peak demand and decreased barge handling capacity at some terminals
have led to higher congestion in recent years
Initial view on potential solutions for congestion
Context
Potential solutions
Root causes
Pages
3 – 9
10 – 22
23 – 24
EY-Parthenon | Page 26
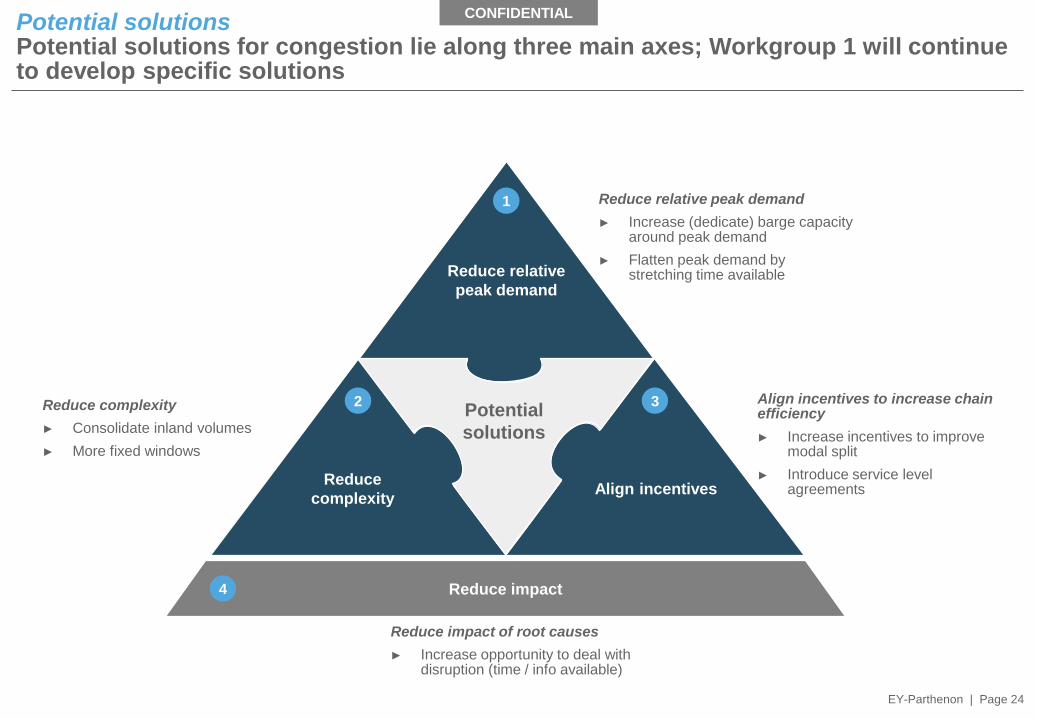
CONFIDENTIALPotential solutionsPotential solutions for congestion lie along three main axes; Workgroup 1 will continue to develop specific solutions
EY-Parthenon | Page 24
?
Reduce impact
Reduce
complexity
Reduce relative
peak demand
?
Align incentives
Potential
solutions
Reduce relative peak demand
► Increase (dedicate) barge capacity around peak demand
► Flatten peak demand by stretching time available
Reduce complexity
► Consolidate inland volumes
► More fixed windows
Align incentives to increase chainefficiency
► Increase incentives to improve modal split
► Introduce service level agreements
Reduce impact of root causes
► Increase opportunity to deal with disruption (time / info available)
1
2 3
4
EY | Assurance | Tax | Transactions | Advisory
About EY
EY is a global leader in assurance, tax, transaction and advisory services. The insights and quality
services we deliver help build trust and confidence in the capital markets and in economies the world
over. We develop outstanding leaders who team to deliver on our promises to all of our stakeholders.
In so doing, we play a critical role in building a better working world for our people, for our clients and
for our communities.
EY refers to the global organization, and may refer to one or more, of the member firms of
Ernst & Young Global Limited, each of which is a separate legal entity. Ernst & Young Global Limited,
a UK company limited by guarantee, does not provide services to clients. For more information about
our organization, please visit ey.com.
About EY-Parthenon
EY-Parthenon B.V. is a member firm of Ernst & Young Global Limited and part of EY Transaction
Advisory Services.
About EY Transaction Advisory Services.
How you manage your Capital Agenda today will define your competitive position tomorrow. We work
with clients to create social and economic value by helping them make better, more informed
decisions about strategically managing capital and transactions in fast-changing markets. Whether
you’re preserving, optimizing, raising or investing capital, EY’s Transaction Advisory Services
combine a unique set of skills, insight and experience to deliver focused advice. We help you drive
competitive advantage and increased returns through improved decisions across all aspects of your
Capital Agenda.
© 2018 EYGM Limited.
All Rights Reserved.