Embed Size (px)
Citation preview

Page 1/20
Velocity vector imaging echocardiography and N-terminal pro- brain natriuretic peptide study ofpeople with preclinical hypertrophiccardiomyopathyLi Yu ( [email protected] )
Second Xiangya Hospital of Central South University https://orcid.org/0000-0001-5903-211XQichang Zhou
Second Xiangya HospitalXiangdang Long
Hunan Provincial People's HospitalQinghai Peng
Second Xiangya HospitalZurong Yang
Second Xiangya Hospital
Research
Keywords: NT-proBNP, preclinical hypertrophic cardiomyopathy, rotation, strain, velocity vector imaging
Posted Date: April 20th, 2021
DOI: https://doi.org/10.21203/rs.3.rs-429819/v1
License: This work is licensed under a Creative Commons Attribution 4.0 International License. Read Full License

Page 2/20
AbstractBackground: To investigate whether familial hypertrophic cardiomyopathy (HCM) gene mutation carrierswithout overt left ventricular hypertrophy have subclinical changes in left ventricular function.
Methods: We studied Eighteen HCM families with pathogenic mutations, 45 patients with overt HCM(gene positive/phenotype positive (G+/P+)), 40 patients without myocardial hypertrophy (genepositive/phenotype negative G+/P-)), and 48 genotype-negative related healthy controls. Conventionalechocardiography and velocity vector imaging (VVI) were
performed, and blood levels of N- terminal pro- brain natriuretic peptide (NT- pro- BNP) were analyzed.
Results: Although the global longitudinal, circumferential and radial strain was similar between the G+/P-group and the control group, the longitudinal strain of basal inferoseptum and basal anteroseptum waslower in G+/P- patients than in controls, while the basal and middle inferolateral longitudinal strains weresigni�cantly higher. Compared with the controls, G+/P+ patients had signi�cantly lower global andsegmental longitudinal and radial strains. There were no signi�cant differences between the normalcontrol and G+/P+ groups for global and segmental circumferential strains. The middle of the leftventricle (LV) was clockwise in G+/P+ patients (opposite to normal).The rotation angle of the mid LVrotation in the G+/P+ group were signi�cantly higher than those in the G+/P- subjects and controls. TheNT-proBNP levels were higher in G+/P+ patients than in G+/P- people and controls.
Conclusions: Sarcomere gene mutation carriers without overt left ventricular hypertrophy have subclinicalsegmental systolic dysfunction. Velocity vector imaging is feasible for differentiating HCM, G+/P-patients from controls.
BackgroundHypertrophic cardiomyopathy (HCM) is one of the most common autosomal dominant cardiovasculardiseases, and it is the primary cause of sudden death in young people and athletes. In most patients,gene mutation is the primary cause of HCM. Most mutations are sarcomere protein gene mutationsencoding myocardium that exhibit autosomal dominant inheritance[1]. HCM demonstrates obviousfamily clustering, and the genetic probability is 50%. According to statistics, the proportion of patientswith familial HCM who eventually develop HCM is 40%-100%. Early recognition of and intervention forcardiac function changes are particularly important.
Familial HCM gene mutation carriers without overt left ventricular hypertrophy (gene positive/phenotypenegative G+/P-) may experience syncope and have other clinical symptoms, including abnormalelectrocardiogram (ECG) repolarization, and they may develop subclinical changes in cardiac functionbefore developing myocardial hypertrophy. Therefore, it is urgent to identify these patients via imagingmethods.

Page 3/20
Velocity vector imaging (VVI) is based on two-dimensional grayscale images that track the spatial motionof cardiovascular tissue to show echo spots. The tracking of multiple regional myocardial segments isperformed simultaneously. The velocity and displacement of the regional myocardium are displayedquantitatively as a curve. VVI can be used to analyze the movement and deformation of the myocardium,and it is possible to detect �ne space and time distinctions in cardiac deformation in different myocardialsegments during systole and diastole[1–5]. Therefore, VVI is valuable for evaluating regional and globalcardiac function.
Many studies have shown that VVI is potentially viable for assessing myocardial function[6]. N-terminalpro-brain natriuretic peptide (NT-proBNP) level may be related to cardiovascular damage, re�ectingventricular function[7]. However, there are no VVI parameters for the left ventricle (LV), globally orsegmentally, in preclinical HCM. We aimed to evaluate changes in the long and short-axis function of theLV using VVI combined with NT-pro-BNP levels.
MethodsStudy Population
A total of 96 unrelated HCM patients who were diagnosed in our hospital from March 2016 to April 2019were selected for gene detection, and 45 HCM patients who were carrying sarcomere gene mutationswere selected as the gene positive/phenotype positive (G+/P+) group. Gene detection and conventionalechocardiography were performed on the �rst-degree relatives of 45 unrelated patients (i.e., parents,children, siblings of the same parent). According to the examination results, 40 patients with HCMsarcomere mutation genes but no ventricular wall hypertrophy were selected as the gene positivephenotype negative (G+/P-) group. At the same time, 48 healthy volunteers without gene mutations wereselected as normal controls.
The diagnostic criterion of HCM is that the thickness of the left ventricular wall in one or more myocardialsegments is greater than or equal to 15 mm. It was necessary to exclude myocardial hypertrophy due toathletics, metabolic diseases, congenital heart diseases and other systemic diseases. In patients with aclear family history, an unexplained left ventricular wall thickness of one or more myocardial segments ≥13 mm was observed[1].
All G+/P+ individuals had interventricular septum thickening, with or without other left ventricular wallthickening. Before examination, β-blockers, calcium antagonists and angiotensin-converting enzymeinhibitors were stopped for at least 24 hours. The exclusion criteria were as follows: 1) patients withventricular wall hypertrophy caused by hypertension, coronary heart disease, diabetes mellitus, valvulardisease, congenital heart disease, pulmonary heart disease, metabolic disease or other factors, as well asathletes with cardiac hypertrophy, were excluded after obtaining a medical history and performing aphysical examination, ECG and echocardiography; 2) patients with HCM whose left ventricular ejectionfraction was less than 50%; 3) accepted patients with HCM who underwent percutaneous septal

Page 4/20
myocardial ablation, surgical septal myomectomy or permanent pacemaker implantation or experiencedatrial �brillation.
The inclusion criteria for the G+/P- group were as follows: 1) carrier of a sarcomere mutation geneveri�ed by gene generation; 2) maximum left ventricular wall thickness (LVMWT) less than 13 mmdetected by echocardiography. The exclusion criteria were as follows: 1) diabetes mellitus andhypertension; 2) cardiac muscle noncompaction and amyloidosis; 3) metabolic diseases and othersystemic diseases; 4) signi�cant pulmonary lesions; 5) treadmill test, coronary angiography or coronaryartery computed tomography (CT) results indicating coronary heart disease, which was de�nitivelydiagnosed by imaging; 6) congenital heart disease; 7) moderate and severe valve stenosis andregurgitation detected by echocardiography.
Thirty �rst-degree relatives (parents, children, siblings of the same parent) of 45 unrelated patients wereexamined by gene testing and routine echocardiography. According to the results of the examination, 40patients with HCM sarcomere mutation genes but no ventricular wall hypertrophy were selected as thepositive gene group, and 48 healthy volunteers without gene mutations were selected as the normalcontrol (G-/P-) group.
This cross-sectional study was conducted with the permission of the Institutional Ethics Committe. Allsubjects provided written informed consent.
Conventional echocardiography
For the ECG recordings, all subjects laid on their left side. Three short-axis views (mitral valve level,papillary muscle level and apical level) and three long-axis views (apical three-chamber view, apical two-chamber view and apical four-chamber view) of the LV were obtained on a Siemens S2000 ultrasoundsystem (Axius, Siemens Medical Solutions, Malvern, PA, USA) with a 4Px probe (2.75–4.25 MHz). Allimages and clips were stored on the echocardiographic machine for analysis.
The interventricular septal thickness in diastole (IVSD) and left atrial diameter (LAD) were detected in theparasternal long-axis view. The LVMWT was measured in diastole in the basal, mid and apical short-axisviews and in the apical long-axis view.
The left atrial volume (LAV), left ventricular end-diastolic volume (LVEDV) and left ventricular end-systolicvolume (LVESV) were measured by the Simpson biplane method in the apical two-chamber and four-chamber views. The left atrial volume index (LAVI) was calculated as LAVI = LAV/body surface area(BSA).
The left ventricular out�ow tract pressure gradient (LVOT-PG) was measured by continuous-wave Doppler(CW), and the sampling line was placed at the stenosis of the left ventricular out�ow tract. In the apicalfour-chamber view, E/A was measured by pulsed-wave Doppler (PW). The ejection fraction (EF) wasestimated using the Simpson biplane method.

Page 5/20
All recordings were performed by professional sonographers. All conventional echocardiographyparameters were read o�ine.
Velocity vector imaging echocardiography
Movie clips were recorded in 3 cardiac cycles and stored, and three apical views of the LV were analyzedo�ine using VVI software (Axius, Siemens Medical Solutions). A line was �tted along the internal surfaceof the LV endocardium at end-diastole. We used a frame-by-frame image tracking mode to estimate themovement of the myocardium. The acoustic marker of the myocardium was accurately identi�ed andautomatically tracked during several consecutive frames.
The longitudinal strain, circumferential strain, and radial strain curves were measured for each LVsegment using long-axis and short-axis views according to the 16-segment model of the AmericanSociety of Echocardiography [8,9]. In this model, we placed a sampling point on each segment to recordthe strain experienced during 3 cardiac cycles. The mean value of each measurement was calculated forfurther analysis.
The global longitudinal strain (GLS), circumferential strain (GCS),and radial strain (GRS) were obtainedby averaging all the segment strain values.
The displacement angle of the left ventricle was de�ned as the left ventricular rotation, with the clockwisedirection rotation being positive and the counterclockwise direction rotation being negative. The Peakbasilar rotation angle (PBr), the Peak mid rotation angle (PMr) and the peak apex rotation angle(PAr) weremeasured.The peak left ventricular twist (Ptw) angle was the pure difference in left ventricular rotationangle between the apex and the base, Ptw = PBr-PAr.
NT-pro-BNP Test
Fasting blood samples were collected from each patient within 24 hours after enrollment. Blood samplingwas standardized without tourniquet and immediately centrifuged twice. NT-pro-BNP was analyzed on aModular E 170 (Roche Diagnostics, Mannheim, Germany).
Interobserver and Intraobserver Variability
To assess the interobserver variability, which was expressed as the coe�cient of variation (CV), 2independent investigators who were blinded to each other’s results analyzed 30 randomly selected VVImovie clips. For intraobserver variability, 30 VVI movie clips were analyzed 3 times within an interval of 2weeks by one investigator who was blinded to the previous results.
Data and Statistical analysis
All measurement data are expressed as the mean ± standard deviation (SD) and were analyzed using theSPSS 17.0 statistical software package (IBM Corp., Chicago, IL, USA). Signi�cant differences between thetwo groups were analyzed by one-way ANOVA, and comparisons between the two groups were conducted

Page 6/20
using independent sample t tests. Pearson’s correlation analysis was used if the independent variablesand dependent variables were normally distributed. The plasma concentration of NT- pro- BNP waslogarithmically converted to log NT- pro- BNP, and the normal distribution was analyzed by analysis ofvariance. P < 0.05 and P < 0.01 indicated signi�cant differences. Correlations between VVI parametersand NT- pro- BNP levels were analyzed by linear regression.
ResultsClinical characteristics
There were no signi�cant differences in age, sex, BSA, heart rate, or blood pressure among the 3 groups(Table 1).
Conventional echo parameters
The IVSD, LVMWT, LAD, LAVI, and LVOT-PG of the HCM patients were signi�cantly higher than those ofthe patients in the G+/P- group and the control subjects. Meanwhile, G+/P+ patients had a signi�cantlylower E/A. However, none of the conventional echo parameters were signi�cantly different between theG+/P- group and the control group. In addition, there were no signi�cant differences in LVEDV, LVESV orEF among the three groups (Table 1).
Regional longitudinal peak systolic strain
The longitudinal peak systolic strain of the basal inferoseptum and basal anteroseptum in the G+/P-group was signi�cantly lower than that in the control group (P < 0.05). The longitudinal peak systolicstrain of the basal and middle segments of the inferolateral in the G+/P- group was signi�cantly higherthan that in the control group (P < 0.05). The peak longitudinal strain of each segment in the G+/P+ groupwas signi�cantly lower than that in the control group, especially in the basal and middle segments of theinferoseptum, anterior wall and anteroseptum (P < 0.01). The longitudinal peak systolic strain of each leftventricular wall segment in the G+/P+ group was signi�cantly lower than that in the G+/P- group (P <0.01)
In the G+/P- group, the longitudinal peak systolic strain of the basal inferoseptum and basalanteroseptum was signi�cantly lower than that of other ventricular wall segments (P < 0.05). In theG+/P+ group, the longitudinal peak systolic strain of the basal and middle segments of the inferoseptum,anterior wall and anteroseptum was signi�cantly lower than that of the corresponding segments of theleft ventricular wall (P < 0.05) (Table 2) ( Figure 1) ( Figure 2).
Regional circumferential peak systolic strain
There were no signi�cant differences among the normal control, G+/P- and G+/P+ groups for GCS valuesat all levels. The circumferential systolic strain increased from base to apex in the three groups (P < 0.01)(Table 3) ( Figure 1) ( Figure 2).

Page 7/20
Regional radial peak systolic strain
In the G+/P- group, the peak radial strain at all levels no signi�cant differences compared with the controlgroup (P < 0.05). The peak radial strain of each segment in the G+/P+ group was signi�cantly lower thanthose in the control and G+/P- groups (P < 0.05).
In the normal control group, G+/P- group and G+/P+ group, there were signi�cant differences in peaksystolic strain among different segments of the same ventricular wall; the strain was greater in thepapillary muscle level than in the apical and mitral valve level (P < 0.05). In the G+/P+ group, the peakradial strain of the anteroseptum, anterior wall and Inferoseptum was signi�cantly lower than that of theother ventricular wall segments (P < 0.05) (Table 4) ( Figure 1) ( Figure 2).
Global longitudinal, circumferential and radial strain
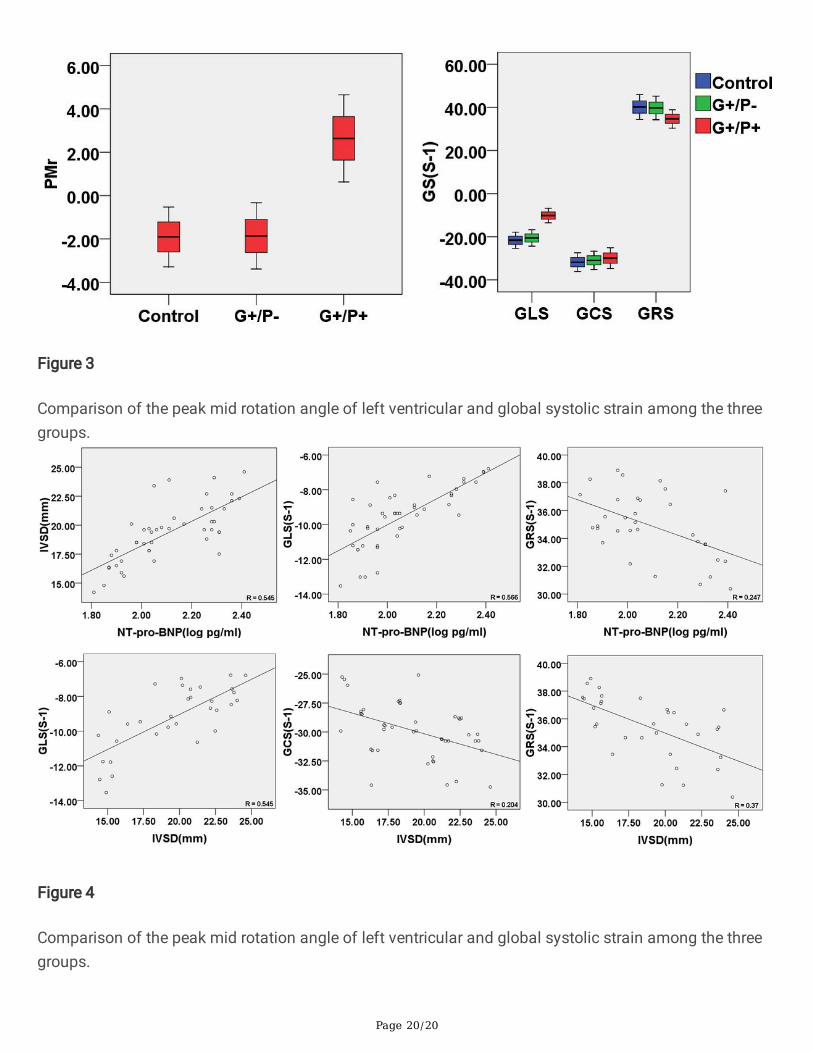
There was no signi�cant difference in systolic longitudinal, circumferential, or radial strain between theG+/P- group and the control group (P > 0.05). The systolic GLS of the G+/P+ group was lower than that ofthe control group and the G+/P- group, and the difference was very signi�cant (P < 0.01). The systolicGRS of the G+/P+ group was lower than that of the control group and the G+/P- group, and the differencewas signi�cant (P < 0.05). The systolic GCS of the G+/P+ group was not signi�cantly different from thatof the control group or the G+/P- group (P > 0.05) (Table 5) (Figure 3).
Left ventricular rotation parameters andNT-pro-BNP level
In the control, G+/P- and G+/P+ groups, the pattern of cardiac rotation and torsion was the same: theapical part rotated counterclockwise, and the basal part rotated clockwise. However, the rotation of themidventricle was clockwise in G+/P+ group which was different from the control and G+/P- group. In thecontrol and G+/P- groups, the rotation of the midventricle followed the apex. whereas, in G+/P+ groups,the midventricle rotated in the same direction as the base.
The rotation angle of the middle of the LV of the G+/P+ group was signi�cantly higher than those of thenormal group and the G+/P- group (P < 0.05). However, there were no signi�cant differences in therotation angle of the base, middle or apex of the LV and the global torsion angle of the LV between theG+/P- group and the control group (P > 0.05) (Figure 3).
NT-pro-BNP levels were signi�cantly higher in HCM patients compared with the control group and G+/P-group. There no detectable differences in G+/P− individuals compared with healthy controls (Table 5).
Correlation analysis results
In the HCM patients, GLS and GRS were signi�cantly correlated with IVSD (r=0.545,P= 0.003;r= 0.37,P=0.031; respectively). There was no signi�cant correlation between GCS and IVSD. NT-proBNP wassigni�cantly correlated with GLS and IVSD(r=0.566,P=0.003;r= 0.545,P= 0.004; respectively), but nosigni�cant associations with GRS (Figure 4).
Page 8/20
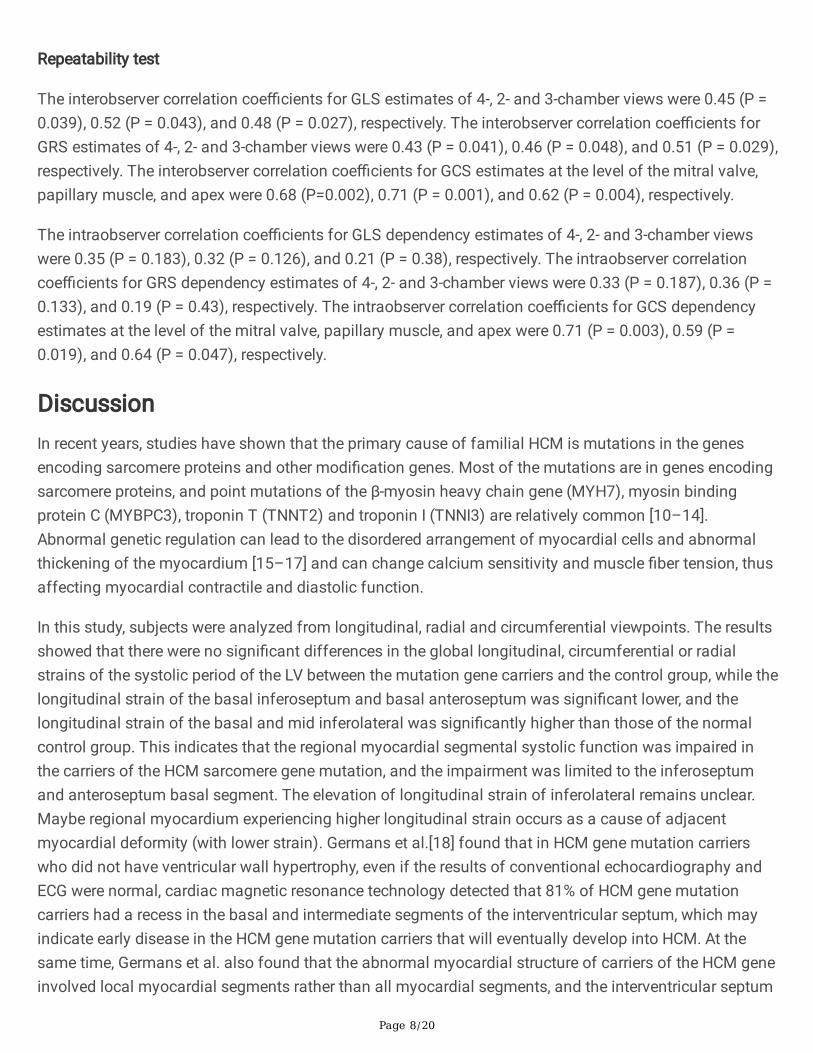
Repeatability test
The interobserver correlation coe�cients for GLS estimates of 4-, 2- and 3-chamber views were 0.45 (P =0.039), 0.52 (P = 0.043), and 0.48 (P = 0.027), respectively. The interobserver correlation coe�cients forGRS estimates of 4-, 2- and 3-chamber views were 0.43 (P = 0.041), 0.46 (P = 0.048), and 0.51 (P = 0.029),respectively. The interobserver correlation coe�cients for GCS estimates at the level of the mitral valve,papillary muscle, and apex were 0.68 (P=0.002), 0.71 (P = 0.001), and 0.62 (P = 0.004), respectively.
The intraobserver correlation coe�cients for GLS dependency estimates of 4-, 2- and 3-chamber viewswere 0.35 (P = 0.183), 0.32 (P = 0.126), and 0.21 (P = 0.38), respectively. The intraobserver correlationcoe�cients for GRS dependency estimates of 4-, 2- and 3-chamber views were 0.33 (P = 0.187), 0.36 (P =0.133), and 0.19 (P = 0.43), respectively. The intraobserver correlation coe�cients for GCS dependencyestimates at the level of the mitral valve, papillary muscle, and apex were 0.71 (P = 0.003), 0.59 (P =0.019), and 0.64 (P = 0.047), respectively.
DiscussionIn recent years, studies have shown that the primary cause of familial HCM is mutations in the genesencoding sarcomere proteins and other modi�cation genes. Most of the mutations are in genes encodingsarcomere proteins, and point mutations of the β-myosin heavy chain gene (MYH7), myosin bindingprotein C (MYBPC3), troponin T (TNNT2) and troponin I (TNNI3) are relatively common [10–14].Abnormal genetic regulation can lead to the disordered arrangement of myocardial cells and abnormalthickening of the myocardium [15–17] and can change calcium sensitivity and muscle �ber tension, thusaffecting myocardial contractile and diastolic function.
In this study, subjects were analyzed from longitudinal, radial and circumferential viewpoints. The resultsshowed that there were no signi�cant differences in the global longitudinal, circumferential or radialstrains of the systolic period of the LV between the mutation gene carriers and the control group, while thelongitudinal strain of the basal inferoseptum and basal anteroseptum was signi�cant lower, and thelongitudinal strain of the basal and mid inferolateral was signi�cantly higher than those of the normalcontrol group. This indicates that the regional myocardial segmental systolic function was impaired inthe carriers of the HCM sarcomere gene mutation, and the impairment was limited to the inferoseptumand anteroseptum basal segment. The elevation of longitudinal strain of inferolateral remains unclear.Maybe regional myocardium experiencing higher longitudinal strain occurs as a cause of adjacentmyocardial deformity (with lower strain). Germans et al.[18] found that in HCM gene mutation carrierswho did not have ventricular wall hypertrophy, even if the results of conventional echocardiography andECG were normal, cardiac magnetic resonance technology detected that 81% of HCM gene mutationcarriers had a recess in the basal and intermediate segments of the interventricular septum, which mayindicate early disease in the HCM gene mutation carriers that will eventually develop into HCM. At thesame time, Germans et al. also found that the abnormal myocardial structure of carriers of the HCM geneinvolved local myocardial segments rather than all myocardial segments, and the interventricular septum

Page 9/20
were the most obviously involved. HCM gene mutation carriers exhibit disordered arrangement anddegeneration of cardiac myocytes, mild �brosis in the intercellular matrix and increased myocardialstiffness, and the longitudinal myocardial �bers under the endocardium of these patients are more proneto interstitial �brosis [19]. The regional radial systolic strain (the basal inferoseptum and basalanteroseptum) of the G+/P- group remained similar to that of the control group. The may be becausechanges in LV radial systolic function occur later than do changes in longitudinal systolic function.
Our study showned that NT-proBNP levers in HCM patients were signi�cant higher and correlated withmyocardial deformation and interventricular septal thickness. Among genotype-negative individuals, wealso found that there were no difference in NT-proBNP concentrations compared with control relatives,but their local segmental deformation parameters were different, which was different from the DoroteiaSilva et al[20] who identify mutation carriers of hypertrophic cardiomyopathy by tissue Doppler imaging.
ConclusionsIn conclusion, the GLS and GRS were diminished in HCM subjects, whereas a compensatory mechanismexisted that tended to maintain the GCS. Although the GLS, GRS and GCS of HCM gene mutation carrierswere still within the normal range, the longitudinal strain of local myocardial segments was diminished.
VVI can provide quantitative information for the early diagnosis of HCM sarcomere gene mutationcarriers without myocardial hypertrophy to improve early diagnosis and identi�cation.
AbbreviationsHCM, Hypertrophic cardiomyopathy; G+/P+, gene positive/phenotype positive; G+/P-, genepositive/phenotype negative; LAD, left atrialanteroposterior diameter; LAVI, left atrial volume index ;LVEDV, left ventricular end-diastolic volume; LVESV, left ventricular end-systolic volume; LVOT-PG, leftventricular out�ow tract pressure gradient; EF, ejection fraction; E/A, mitral early diastolic �lling ratio;IVSD, interventricular septum thickness in diastolic; LVMWT, left ventricular wall maximum thickness;BSA, body surface area; DBP, diastolic blood pressure; SBP,systolic blood pressure; GLS, globallongitudinal strain; GCS, global circumferential strain; GRS, global radial strain; PBr, Peak basilar rotationangle; PMr, Peak mid rotation angle; PAr, peak apex rotation angle; Ptw, peak left ventricular twist; NT-pro-BNP, N-terminal pro-brain natriuretic peptide; VVI, velocity vector imaging.
DeclarationsEthics approval and consent to participate
All protocols pertaining to human subjects were �rst approved by the Institutional Ethics Committee ofSecond Xiangya Hospital of Central South University. Informed consent was obtained from all of thepatients.
Page 10/20
Consent for publication
Not applicable
Availability of data and materials
The datasets used and/or analysed during the current study are available from the corresponding authoron reasonable request.
Competing interests
All authors declares that there no con�icts of interest.
Funding
Not applicable.
Authors' contributions
ZR,Y and QH,P analyzed and explained the patient data. QC,Z and XD,L collected the blood samples ofthe patients and consulted the relevant literature. Ultrasound examnation were performed by LY, LY wasthe main contributor to the manuscripts. All authors have read and approved the �nal manuscript.
Acknowledgements
We thank all the patients and control subjects for their participation in this study.
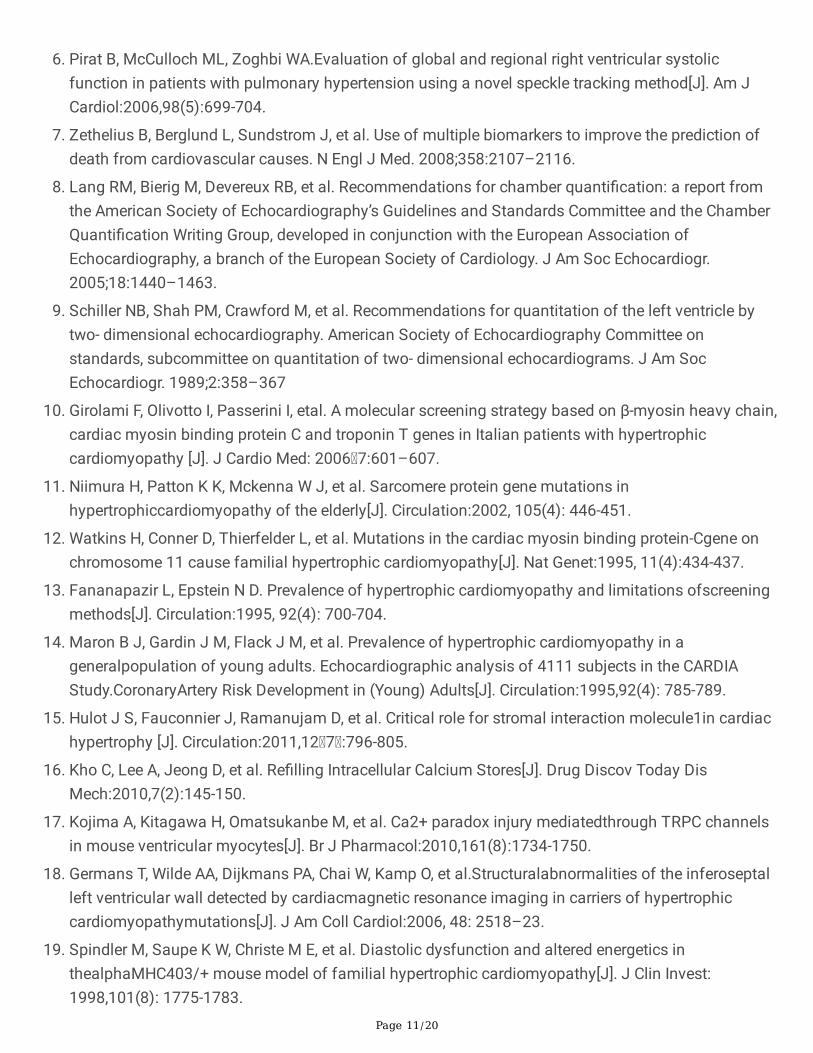
References1. Elliott PM, Anastasakis A, Borger MA, et al. 2014 ESCGuidelines on diagnosis and management of
hypertrophiccardiomyopathy: the Task Force for the Diagnosis andManagement of HypertrophicCardiomyopathy of the EuropeanSociety of Cardiology (ESC) [J]. Eur Heart J: 2014,35(39):2733-2779.
2. Bansal M, Cho GY, Chan J, et al. Feasibility and accuracy of different techniques of two-dimensionalspeckle based strain and validation with harmonic phase magnetic resonance imaging[J].2008,21(12):1318-1325.
3. Wei Z, Su H, Zhang H, et al.Assessment of left ventricular wall motion in diabetic rats using velocityvector imaging combined with stress echocardiography[J]. Echocardiography:2008,25(6):609-616.
4. Bohs LN, Geiman BJ, AndersonME, et al. Speckle tracking for multi-dimensional �ow estimation[J].Ultrasonics:2000,38 (14):369-375.
5. Langeland S, Dhooge J, Wouters PF, et al. Experimental validation of a new ultrasound method forthe simultaneous assessment of radial and longitudinal myocardial deformation independent ofinsonation angle[J]. Circulation:2005,112(14):2157-2162.
Page 11/20
�. Pirat B, McCulloch ML, Zoghbi WA.Evaluation of global and regional right ventricular systolicfunction in patients with pulmonary hypertension using a novel speckle tracking method[J]. Am JCardiol:2006,98(5):699-704.
7. Zethelius B, Berglund L, Sundstrom J, et al. Use of multiple biomarkers to improve the prediction ofdeath from cardiovascular causes. N Engl J Med. 2008;358:2107–2116.
�. Lang RM, Bierig M, Devereux RB, et al. Recommendations for chamber quanti�cation: a report fromthe American Society of Echocardiography’s Guidelines and Standards Committee and the ChamberQuanti�cation Writing Group, developed in conjunction with the European Association ofEchocardiography, a branch of the European Society of Cardiology. J Am Soc Echocardiogr.2005;18:1440–1463.
9. Schiller NB, Shah PM, Crawford M, et al. Recommendations for quantitation of the left ventricle bytwo- dimensional echocardiography. American Society of Echocardiography Committee onstandards, subcommittee on quantitation of two- dimensional echocardiograms. J Am SocEchocardiogr. 1989;2:358–367
10. Girolami F, Olivotto I, Passerini I, etal. A molecular screening strategy based on β-myosin heavy chain,cardiac myosin binding protein C and troponin T genes in Italian patients with hypertrophiccardiomyopathy [J]. J Cardio Med: 2006 7:601–607.
11. Niimura H, Patton K K, Mckenna W J, et al. Sarcomere protein gene mutations inhypertrophiccardiomyopathy of the elderly[J]. Circulation:2002, 105(4): 446-451.
12. Watkins H, Conner D, Thierfelder L, et al. Mutations in the cardiac myosin binding protein-Cgene onchromosome 11 cause familial hypertrophic cardiomyopathy[J]. Nat Genet:1995, 11(4):434-437.
13. Fananapazir L, Epstein N D. Prevalence of hypertrophic cardiomyopathy and limitations ofscreeningmethods[J]. Circulation:1995, 92(4): 700-704.
14. Maron B J, Gardin J M, Flack J M, et al. Prevalence of hypertrophic cardiomyopathy in ageneralpopulation of young adults. Echocardiographic analysis of 4111 subjects in the CARDIAStudy.CoronaryArtery Risk Development in (Young) Adults[J]. Circulation:1995,92(4): 785-789.
15. Hulot J S, Fauconnier J, Ramanujam D, et al. Critical role for stromal interaction molecule1in cardiachypertrophy [J]. Circulation:2011,12 7 :796-805.
1�. Kho C, Lee A, Jeong D, et al. Re�lling Intracellular Calcium Stores[J]. Drug Discov Today DisMech:2010,7(2):145-150.
17. Kojima A, Kitagawa H, Omatsukanbe M, et al. Ca2+ paradox injury mediatedthrough TRPC channelsin mouse ventricular myocytes[J]. Br J Pharmacol:2010,161(8):1734-1750.
1�. Germans T, Wilde AA, Dijkmans PA, Chai W, Kamp O, et al.Structuralabnormalities of the inferoseptalleft ventricular wall detected by cardiacmagnetic resonance imaging in carriers of hypertrophiccardiomyopathymutations[J]. J Am Coll Cardiol:2006, 48: 2518–23.
19. Spindler M, Saupe K W, Christe M E, et al. Diastolic dysfunction and altered energetics inthealphaMHC403/+ mouse model of familial hypertrophic cardiomyopathy[J]. J Clin Invest:1998,101(8): 1775-1783.

Page 12/20
20. Silva D, Madeira H, Almeida A, et al. Tissue Doppler imaging and plasma N-terminal probrainnatriuretic peptide for the identi�cation of hypertrophic cardiomyopathy mutation carriers. Am JCardiol 2013;112:996–1004.
TablesTable 1 Clinical characteristics and conventional echocardiographic ultrasound parameters for all groups
Control G+/P- G+/P+
Number of cases 48 40 45
Age, y 39±17 42±16 48±15
Sex (male/female) 21/17 16/14 20/15
BSA, M2 1.7±0.2 1.6±0.2 1.7±0.2
Heart rate, bpm 71±18 73±14 72±16
SBP, mmHg 107±13 109±11 108±12
DBP, mmHg 74±10 73±11 75±9
Mutant gene, %
MYH7 0 13(44%) 9(26%)
MYBPC3 0 15(50%) 22(63%)
TNNT2 0 1(3%) 3(9%)
TNNI3 0 1(3%) 1(2%)
IVSD (mm) 9.0±0.9 8.8±1.0 19.4±5.2#△
LVMWT (mm) 8.9±1.0 9.2±1.4 17.6±6.8#△
LAD (mm) 33±4 34±3 41±5#△
LAVI (ml/m2) 21±5 22±4 31±6#△
LVEDV (ml) 72±15 73±16 75±17
LVESV (ml) 28±6 29±8 31±7
LVOT-PG (mmHg) 2.2±0.9 2.5±0.7 22±30.5#△
EF (%) 63±4 63±5 64±6
E/A 1.4±0.6 1.4±0.5 1.0±0.5*&

Page 13/20
BSA, body surface area; DBP, diastolic blood pressure; SBP, systolic blood pressure; IVSD, interventricularseptum thickness in diastolic; LVMWT, left ventricular wall maximum thickness; LAD, leftatrialanteroposterior diameter; LAVI, left atrial volume index; LVEDV, left ventricular end-diastolic volume;LVESV, left ventricular end-systolic volume; LVOT-PG, left ventricular out�ow tract pressure gradient; EF,ejection fraction; E/A, mitral early diastolic �lling ratio.
* P < 0.05, compared with the control group.
# P < 0.01, compared with the control group.
& P < 0.05, compared with the G+/P- group.
△P < 0.01, compared with the G+/P- group.
Table 2 Comparison of left ventricular longitudinal peak systolic strain among all groups

Page 14/20
Left ventricular wall segmentation Control G+/P- G+/P+
Apical 4-chamber
Basal anterolateral 20.31±7.15 -20.41±5.61 -13.74±2.82#△
Mid anterolateral 20.23±6.74 -20.55±6.13 -12.06±2.94#△
Apical lateral 19.35±6.94 -19.87±5.35 -11.84±2.60#△
Basal inferoseptum 21.37±7.55 -15.48±3.04* -8.12±1.34#△
Mid inferoseptum 19.86±7.32 -18.65±2.72 -8.64±1.55#△
Apical septum 20.14±6.76 -20.88±3.60 -11.86±1.24#△
Apical 2-chamber
Basal anterior 23.35±7.77 -22.57±5.64 -10.54±2.07#△
Mid anterior 20.26±5.52 -19.96±5.35 -9.22±1.85#△
Apical anterior 20.74±6.75 -19.87±4.91 -11.80±2.46#△
Basal inferior 20.27±6.65 -20.12±5.34 -13.84±3.17#△
Mid inferior 19.38±6.83 -18.68±6.15 -12.96±2.95#△
Apical inferior 20.15±7.31 -19.73±5.80 -12.15±3.34#△
Apical 3-chamber
Basal anteroseptum 21.23±7.82 -15.94±5.54* -9.54±2.04#△
Mid anteroseptum 20.62±5.70 -20.65±4.12 -8.95±1.86#△
Basal inferolateral 19.25±7.85 -22.74±6.82* -13.61±2.74#△
Mid inferolateral 18.24±6.40 -21.12±5.94* -12.42±1.62#△
* P < 0.05, compared with the control group.
# P < 0.01, compared with the control group.
& P < 0.05, compared with the G+/P- group.
△P < 0.01, compared with the G+/P- group.
⊙P < 0.05; the same segment in the same group compared with other ventricular walls.
Table 3 Comparison of left ventricular circumferential peak systolic strain among all groups

Page 15/20
Left ventricular wall segmentation Control G+/P- G+/P+
Mitral valve level
Anteroseptum 27.81±6.65● 27.74±6.25● 26.77±7.13●
Anterior wall 31.4±8.62● 29.34±7.63● 29.82±8.74●
Anterolateral wall 31.61±5.87● 30.97±7.86● 32.15±8.33●
Inferolateral wall 27.91±7.46 26.72±9.41 27.33±4.17
Inferior wall 25.23±5.17● 26.23±6.41● 27.41±5.80●
Inferoseptum
Papillary muscle level
28.32±8.77 26.73±9.74 26.83±11.26
Anteroseptum 26.52±5.23● 27.41±5.74● 26.12±5.13●
Anterior wall 32.65±6.58● 31.52±6.51● 30.89±8.63●
Anterolateral wall 32.43±6.76● 32.73±7.65● 33.36±6.84●
Inferolateral wall 29.30±9.14 28.24±8.25 29.72±5.97
Inferior wall 26.75±5.95● 25.76±5.86● 27.36±5.35●
Inferoseptum
Apical level
29.13±7.63 30.86±6.36 29.62±6.50
Anteroseptum 40.74±5.97 40.33±5.52 38.23±9.41
Anterior wall 41.85±7.94 40.64±6.84 39.12±10.24
Anterolateral wall 42.65±7.24 41.40±6.94 40.80±7.74
Inferior wall 41.87±6.25 40.29±6.04 39.82±8.51
P < 0.01, compared with apical level.
Table 4 Comparison of left ventricular radial peak systolic strain among all groups

Page 16/20
Left ventricular wall segmentation Control G+/P- G+/P+
Mitral valve level
Anteroseptum 37.91±4.72 36.76±4.76 26.86±7.93*& ⊕
Anterior wall 38.55±5.43 37.45±5.37 25.44±10.45*& ⊕
Anterolateral wall 37.95±7.14 37.19±7.42 32.72±7.67*&
Inferolateral wall 36.96±6.52 36.34±6.04 30.76±7.15*&
Inferior wall 37.93±9.31 37.67±9.16 31.74±10.04*&
Inferoseptum
Papillary muscle level
36.46±8.17 35.37±8.27 25.22±11.42*& ⊕
Anteroseptum 43.64±8.15 41.49±8.49 33.17±10.45*&⊕
Anterior wall 43.33±7.33 42.97±5.37 33.46±9.93*&⊕
Anterolateral wall 43.77±7.32 43.24±7.34 37.27±7.15*&
Inferolateral wall 41.24±8.20 41.45±8.37 36.12±8.52*&
Inferior wall 43.11±8.42 42.14±8.37 37.53±7.31*&
Inferoseptum
Apical level
42.42±8.52 42.79±8.46 31.16±8.23*&⊕
Anteroseptum 36.56±4.89 37.26±8.37 26.12±11.26*&
Anterior wall 35.41±5.32 36.43±7.43 26.62±10.23*&
Anterolateral wall 34.40±7.67 35.45±7.04 28.23±8.26*&
Inferior wall 35.40±8.42 36.16±8.45 27.72±11.01*&
* P < 0.05, compared with the control group.
& P < 0.05, compared with the G+/P- group.
P < 0.05, compared with central section.
⊕P<0.05, compared with other ventricular walls in the same level of the same group.
table 5 Comparison of left ventricular global systolic strain, rotation, torsion and NT- pro-BNP level amongall groups
Page 17/20
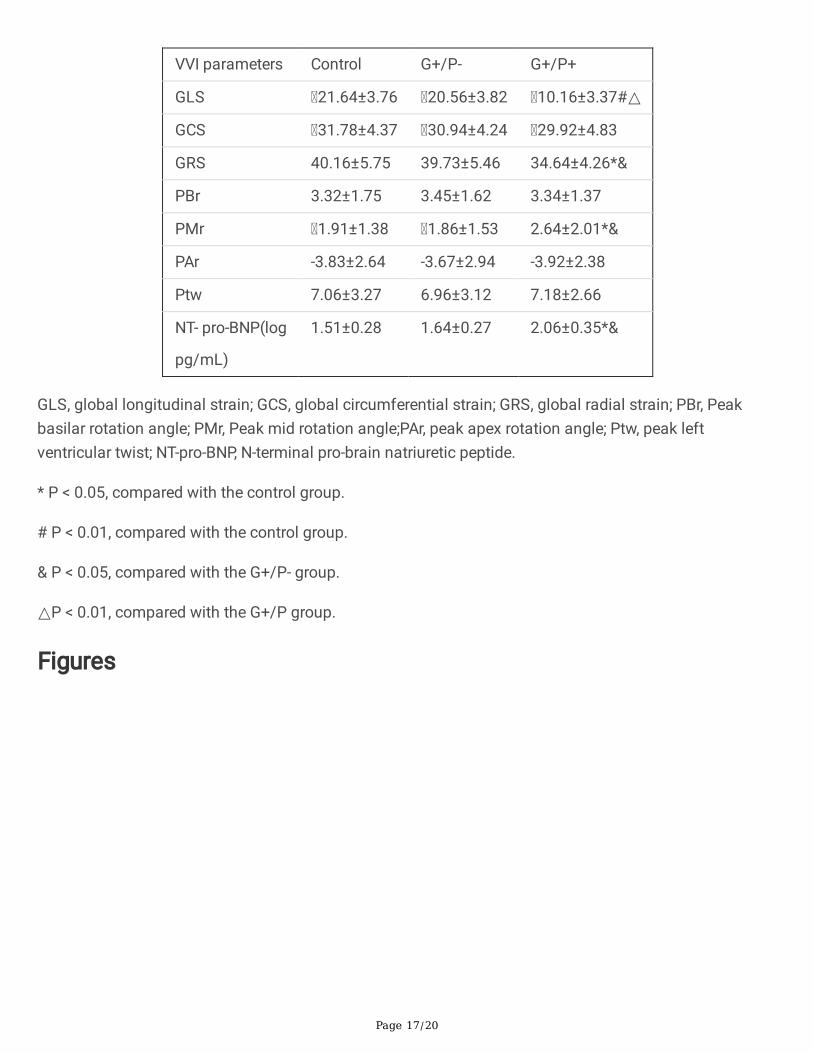
VVI parameters Control G+/P- G+/P+
GLS 21.64±3.76 20.56±3.82 10.16±3.37#△
GCS 31.78±4.37 30.94±4.24 29.92±4.83
GRS 40.16±5.75 39.73±5.46 34.64±4.26*&
PBr 3.32±1.75 3.45±1.62 3.34±1.37
PMr 1.91±1.38 1.86±1.53 2.64±2.01*&
PAr -3.83±2.64 -3.67±2.94 -3.92±2.38
Ptw 7.06±3.27 6.96±3.12 7.18±2.66
NT- pro-BNP(log
pg/mL)
1.51±0.28 1.64±0.27 2.06±0.35*&
GLS, global longitudinal strain; GCS, global circumferential strain; GRS, global radial strain; PBr, Peakbasilar rotation angle; PMr, Peak mid rotation angle;PAr, peak apex rotation angle; Ptw, peak leftventricular twist; NT-pro-BNP, N-terminal pro-brain natriuretic peptide.
* P < 0.05, compared with the control group.
# P < 0.01, compared with the control group.
& P < 0.05, compared with the G+/P- group.
△P < 0.01, compared with the G+/P group.
Figures

Page 18/20
Figure 1
Longitudinal, circumferential and radial strain curve for the left ventricle in the three groups. a. radialstrain curve; b. Longitudinal strain curve; c. circumferential strain curve. A. Normal control; B. G+/P-; C.G+/P+.

Page 19/20
Figure 2
Longitudinal, circumferential and radial strain of 16 segments in the three groups. a. Longitudinal strain;b. circumferential strain; c. radial strain.
Page 20/20
Figure 3
Comparison of the peak mid rotation angle of left ventricular and global systolic strain among the threegroups.
Figure 4
Comparison of the peak mid rotation angle of left ventricular and global systolic strain among the threegroups.