Embed Size (px)
Citation preview
Pennsylvania
2015-16 Deer Harvest Estimates
2
Deer and Elk Section, Bureau of Wildlife life Management March 9, 2016
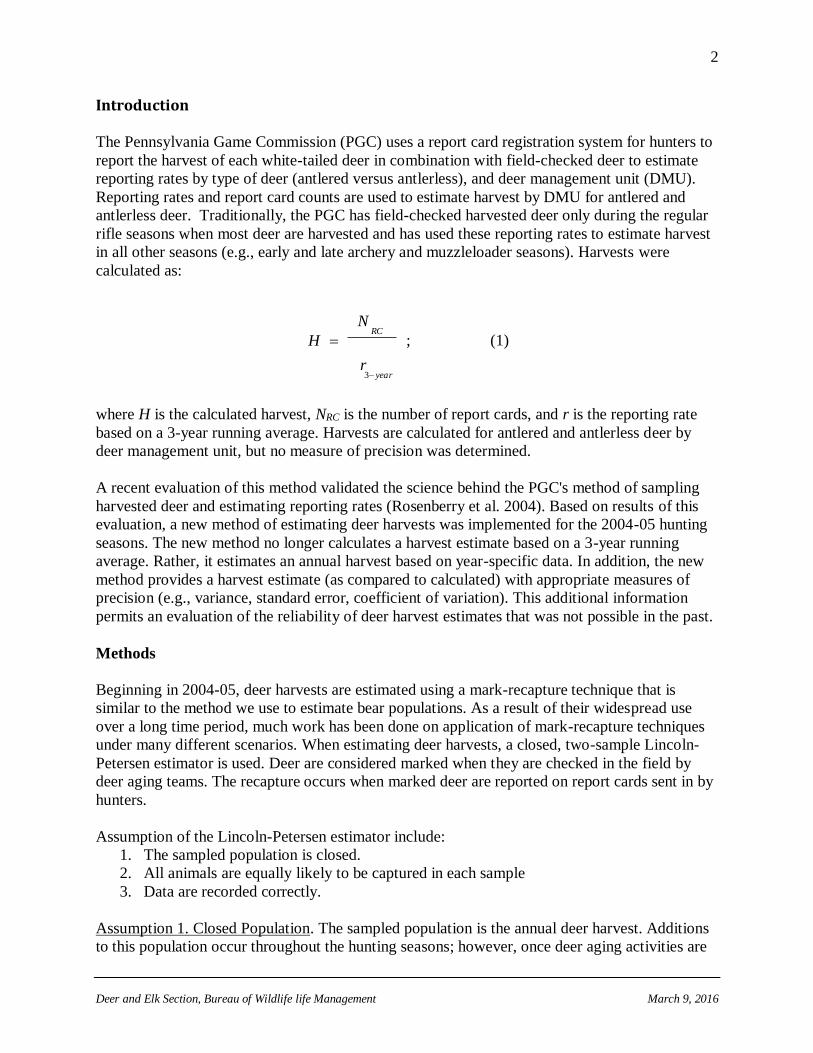
Introduction
The Pennsylvania Game Commission (PGC) uses a report card registration system for hunters to
report the harvest of each white-tailed deer in combination with field-checked deer to estimate
reporting rates by type of deer (antlered versus antlerless), and deer management unit (DMU).
Reporting rates and report card counts are used to estimate harvest by DMU for antlered and
antlerless deer. Traditionally, the PGC has field-checked harvested deer only during the regular
rifle seasons when most deer are harvested and has used these reporting rates to estimate harvest
in all other seasons (e.g., early and late archery and muzzleloader seasons). Harvests were
calculated as:
year
RC
r
N
H
3
; (1)
where H is the calculated harvest, NRC is the number of report cards, and r is the reporting rate
based on a 3-year running average. Harvests are calculated for antlered and antlerless deer by
deer management unit, but no measure of precision was determined.
A recent evaluation of this method validated the science behind the PGC's method of sampling
harvested deer and estimating reporting rates (Rosenberry et al. 2004). Based on results of this
evaluation, a new method of estimating deer harvests was implemented for the 2004-05 hunting
seasons. The new method no longer calculates a harvest estimate based on a 3-year running
average. Rather, it estimates an annual harvest based on year-specific data. In addition, the new
method provides a harvest estimate (as compared to calculated) with appropriate measures of
precision (e.g., variance, standard error, coefficient of variation). This additional information
permits an evaluation of the reliability of deer harvest estimates that was not possible in the past.
Methods
Beginning in 2004-05, deer harvests are estimated using a mark-recapture technique that is
similar to the method we use to estimate bear populations. As a result of their widespread use
over a long time period, much work has been done on application of mark-recapture techniques
under many different scenarios. When estimating deer harvests, a closed, two-sample Lincoln-
Petersen estimator is used. Deer are considered marked when they are checked in the field by
deer aging teams. The recapture occurs when marked deer are reported on report cards sent in by
hunters.
Assumption of the Lincoln-Petersen estimator include:
1. The sampled population is closed.
2. All animals are equally likely to be captured in each sample
3. Data are recorded correctly.
Assumption 1. Closed Population. The sampled population is the annual deer harvest. Additions
to this population occur throughout the hunting seasons; however, once deer aging activities are
3
Deer and Elk Section, Bureau of Wildlife life Management March 9, 2016
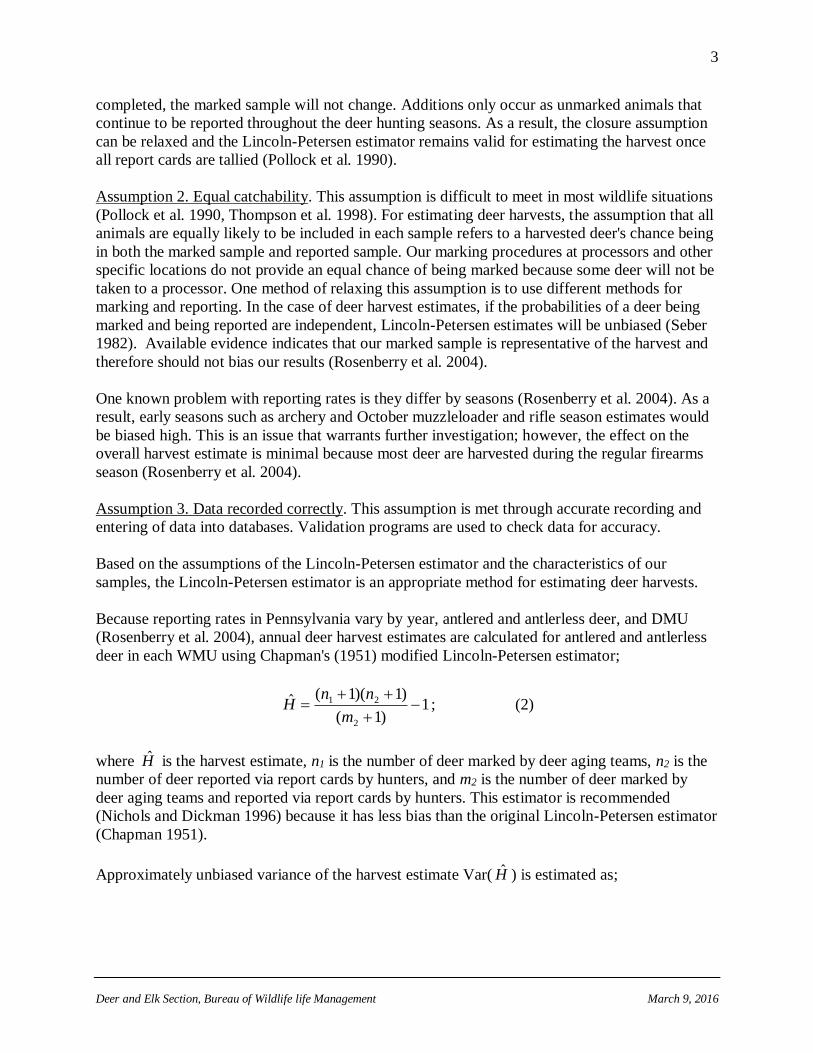
completed, the marked sample will not change. Additions only occur as unmarked animals that
continue to be reported throughout the deer hunting seasons. As a result, the closure assumption
can be relaxed and the Lincoln-Petersen estimator remains valid for estimating the harvest once
all report cards are tallied (Pollock et al. 1990).
Assumption 2. Equal catchability. This assumption is difficult to meet in most wildlife situations
(Pollock et al. 1990, Thompson et al. 1998). For estimating deer harvests, the assumption that all
animals are equally likely to be included in each sample refers to a harvested deer's chance being
in both the marked sample and reported sample. Our marking procedures at processors and other
specific locations do not provide an equal chance of being marked because some deer will not be
taken to a processor. One method of relaxing this assumption is to use different methods for
marking and reporting. In the case of deer harvest estimates, if the probabilities of a deer being
marked and being reported are independent, Lincoln-Petersen estimates will be unbiased (Seber
1982). Available evidence indicates that our marked sample is representative of the harvest and
therefore should not bias our results (Rosenberry et al. 2004).
One known problem with reporting rates is they differ by seasons (Rosenberry et al. 2004). As a
result, early seasons such as archery and October muzzleloader and rifle season estimates would
be biased high. This is an issue that warrants further investigation; however, the effect on the
overall harvest estimate is minimal because most deer are harvested during the regular firearms
season (Rosenberry et al. 2004).
Assumption 3. Data recorded correctly. This assumption is met through accurate recording and
entering of data into databases. Validation programs are used to check data for accuracy.
Based on the assumptions of the Lincoln-Petersen estimator and the characteristics of our
samples, the Lincoln-Petersen estimator is an appropriate method for estimating deer harvests.
Because reporting rates in Pennsylvania vary by year, antlered and antlerless deer, and DMU
(Rosenberry et al. 2004), annual deer harvest estimates are calculated for antlered and antlerless
deer in each WMU using Chapman's (1951) modified Lincoln-Petersen estimator;
1)1(
)1)(1(ˆ
2
21
m
nnH ; (2)
where H is the harvest estimate, n1 is the number of deer marked by deer aging teams, n2 is the
number of deer reported via report cards by hunters, and m2 is the number of deer marked by
deer aging teams and reported via report cards by hunters. This estimator is recommended
(Nichols and Dickman 1996) because it has less bias than the original Lincoln-Petersen estimator
(Chapman 1951).
Approximately unbiased variance of the harvest estimate Var( H ) is estimated as;
4
Deer and Elk Section, Bureau of Wildlife life Management March 9, 2016
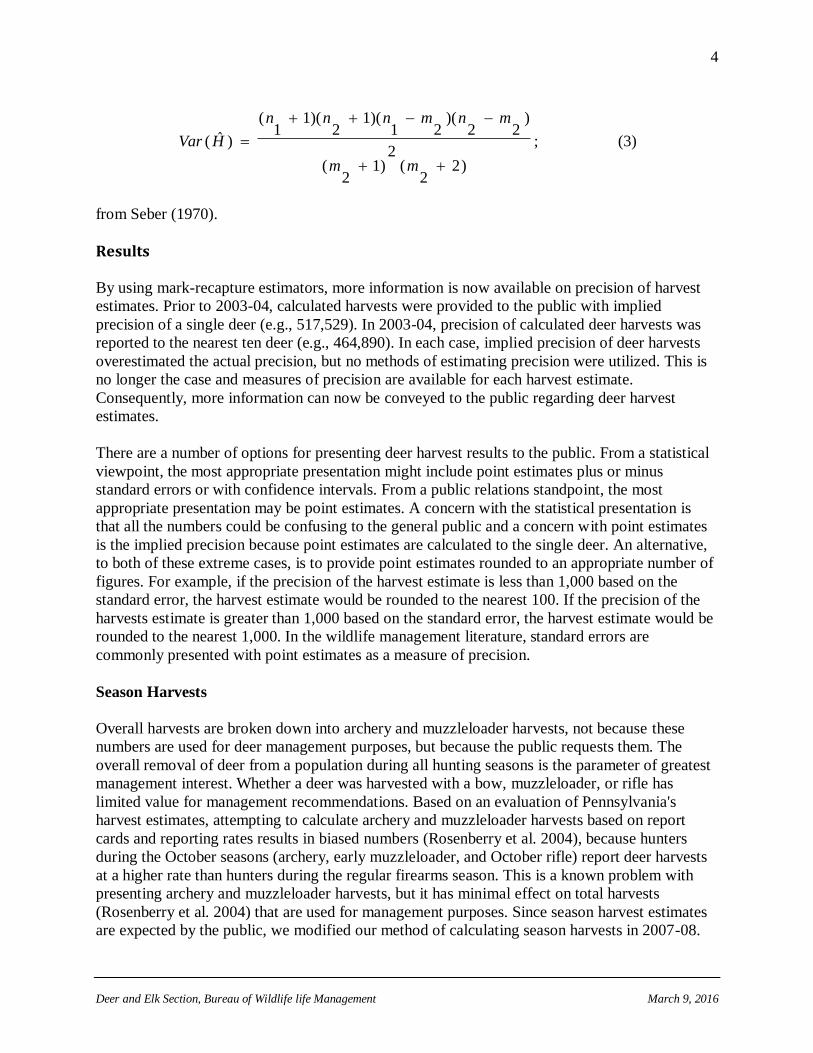
)22
(2
)12
(
)22
)(21
)(12
)(11
(
)ˆ(
mm
mnmnnn
HVar ; (3)
from Seber (1970).
Results
By using mark-recapture estimators, more information is now available on precision of harvest
estimates. Prior to 2003-04, calculated harvests were provided to the public with implied
precision of a single deer (e.g., 517,529). In 2003-04, precision of calculated deer harvests was
reported to the nearest ten deer (e.g., 464,890). In each case, implied precision of deer harvests
overestimated the actual precision, but no methods of estimating precision were utilized. This is
no longer the case and measures of precision are available for each harvest estimate.
Consequently, more information can now be conveyed to the public regarding deer harvest
estimates.
There are a number of options for presenting deer harvest results to the public. From a statistical
viewpoint, the most appropriate presentation might include point estimates plus or minus
standard errors or with confidence intervals. From a public relations standpoint, the most
appropriate presentation may be point estimates. A concern with the statistical presentation is
that all the numbers could be confusing to the general public and a concern with point estimates
is the implied precision because point estimates are calculated to the single deer. An alternative,
to both of these extreme cases, is to provide point estimates rounded to an appropriate number of
figures. For example, if the precision of the harvest estimate is less than 1,000 based on the
standard error, the harvest estimate would be rounded to the nearest 100. If the precision of the
harvests estimate is greater than 1,000 based on the standard error, the harvest estimate would be
rounded to the nearest 1,000. In the wildlife management literature, standard errors are
commonly presented with point estimates as a measure of precision.
Season Harvests
Overall harvests are broken down into archery and muzzleloader harvests, not because these
numbers are used for deer management purposes, but because the public requests them. The
overall removal of deer from a population during all hunting seasons is the parameter of greatest
management interest. Whether a deer was harvested with a bow, muzzleloader, or rifle has
limited value for management recommendations. Based on an evaluation of Pennsylvania's
harvest estimates, attempting to calculate archery and muzzleloader harvests based on report
cards and reporting rates results in biased numbers (Rosenberry et al. 2004), because hunters
during the October seasons (archery, early muzzleloader, and October rifle) report deer harvests
at a higher rate than hunters during the regular firearms season. This is a known problem with
presenting archery and muzzleloader harvests, but it has minimal effect on total harvests
(Rosenberry et al. 2004) that are used for management purposes. Since season harvest estimates
are expected by the public, we modified our method of calculating season harvests in 2007-08.
5
Deer and Elk Section, Bureau of Wildlife life Management March 9, 2016
Prior to 2007-08, we simply divided the overall harvest into season harvests using the proportion
of report cards received during each type of season. For example, if 20% of the report cards were
from archery season, then 20% of the harvest was identified as archery harvest. In 2007-08, we
modified this slightly. First, we estimated the total deer harvests for all seasons. Second, we
estimated the firearms season harvest using the animals we checked in the field, the number of
those animals reported by hunters, and the number of report cards from the firearms season. We
then subtracted the firearms season harvest from the overall harvest leaving only those deer
killed during the archery and muzzleloader seasons. These remaining deer were divided into
archery and muzzleloader harvests using the proportion of report cards similar to previous years.
The primary difference between the current method and the previous method is that it should
reduce bias in archery and muzzleloader harvests because the firearms harvest is estimated based
on field data and not proportion of report cards.
Disease Management Area 2 Antlerless Permit (DMA2 permit)
In 2014-15, a permit was developed to increase antlerless deer harvests within disease
management areas where Chronic Wasting Disease (CWD) has been detected in free ranging
deer. Use of this permit was limited to DMA2. Because of the large area of this DMA, antlerless
harvests reported on DMA2 permits are included in overall harvest estimates.
Literature Cited
Chao, A. 1989. Estimating population size for sparse data in capture-recapture experiments. Biometrics 45:427-438.
Chapman, D. G.. 1951. Some properties of the hypergeometric distribution with applications to zoological censuses.
University of California Publications on Statistics 1:131-160.
Nichols, J. D. and C. R. Dickman. 1996. Capture-recapture methods in Measuring and monitoring biological
diversity: standard methods for mammals. D. E. Wilson, F. R. Cole, J. D. Nichols, R. Rudran, and M. S.
Foster editors. Smithsonian Institute Press, Washington D.C.
Pollock, K. H., J. D. Nichols, C. Brownie, and J. E. Hines. 1990. Statistical inference for capture-recapture
experiments. Wildlife Monographs 107.
Rexstad, E. A. and K. P. Burnham. 1992. User's guide for interactive Program CAPTURE. Colorado Cooperative
Fish and Wildlife Research Unit, Colorado State University, Fort Collins, Colorado.
Rosenberry, C. S., D. R. Diefenbach, and B. D. Wallingford. 2004. Reporting rate variability and precision of white-
tailed deer harvest estimates in Pennsylvania. Journal of Wildlife Management 68:860-869.
Seber, G. A. F. 1982. The estimation of animal abundance and related parameters, Second edition. Charles Griffin and Company LTD. London.
Thompson, W. L., G. C. White, and C. Gowan. 1998. Monitoring vertebrate populations. Academic Press, New
York, New York.
Williams, B. K., J. D. Nichols, and M. J. Conroy. 2002. Analysis and management of animal populations. Academic
Press, New York, New York.
6
Deer and Elk Section, Bureau of Wildlife life Management March 9, 2016
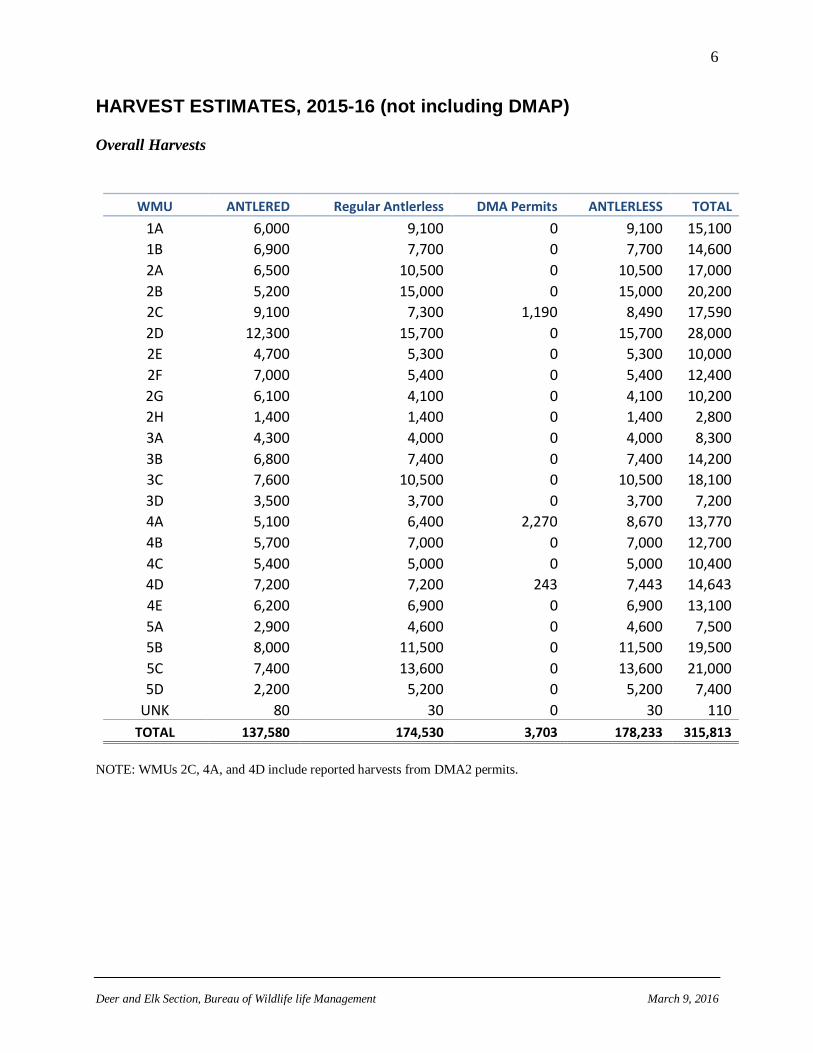
HARVEST ESTIMATES, 2015-16 (not including DMAP)
Overall Harvests
WMU ANTLERED Regular Antlerless DMA Permits ANTLERLESS TOTAL
1A 6,000 9,100 0 9,100 15,100
1B 6,900 7,700 0 7,700 14,600
2A 6,500 10,500 0 10,500 17,000
2B 5,200 15,000 0 15,000 20,200
2C 9,100 7,300 1,190 8,490 17,590
2D 12,300 15,700 0 15,700 28,000
2E 4,700 5,300 0 5,300 10,000
2F 7,000 5,400 0 5,400 12,400
2G 6,100 4,100 0 4,100 10,200
2H 1,400 1,400 0 1,400 2,800
3A 4,300 4,000 0 4,000 8,300
3B 6,800 7,400 0 7,400 14,200
3C 7,600 10,500 0 10,500 18,100
3D 3,500 3,700 0 3,700 7,200
4A 5,100 6,400 2,270 8,670 13,770
4B 5,700 7,000 0 7,000 12,700
4C 5,400 5,000 0 5,000 10,400
4D 7,200 7,200 243 7,443 14,643
4E 6,200 6,900 0 6,900 13,100
5A 2,900 4,600 0 4,600 7,500
5B 8,000 11,500 0 11,500 19,500
5C 7,400 13,600 0 13,600 21,000
5D 2,200 5,200 0 5,200 7,400
UNK 80 30 0 30 110
TOTAL 137,580 174,530 3,703 178,233 315,813
NOTE: WMUs 2C, 4A, and 4D include reported harvests from DMA2 permits.
7
Deer and Elk Section, Bureau of Wildlife life Management March 9, 2016
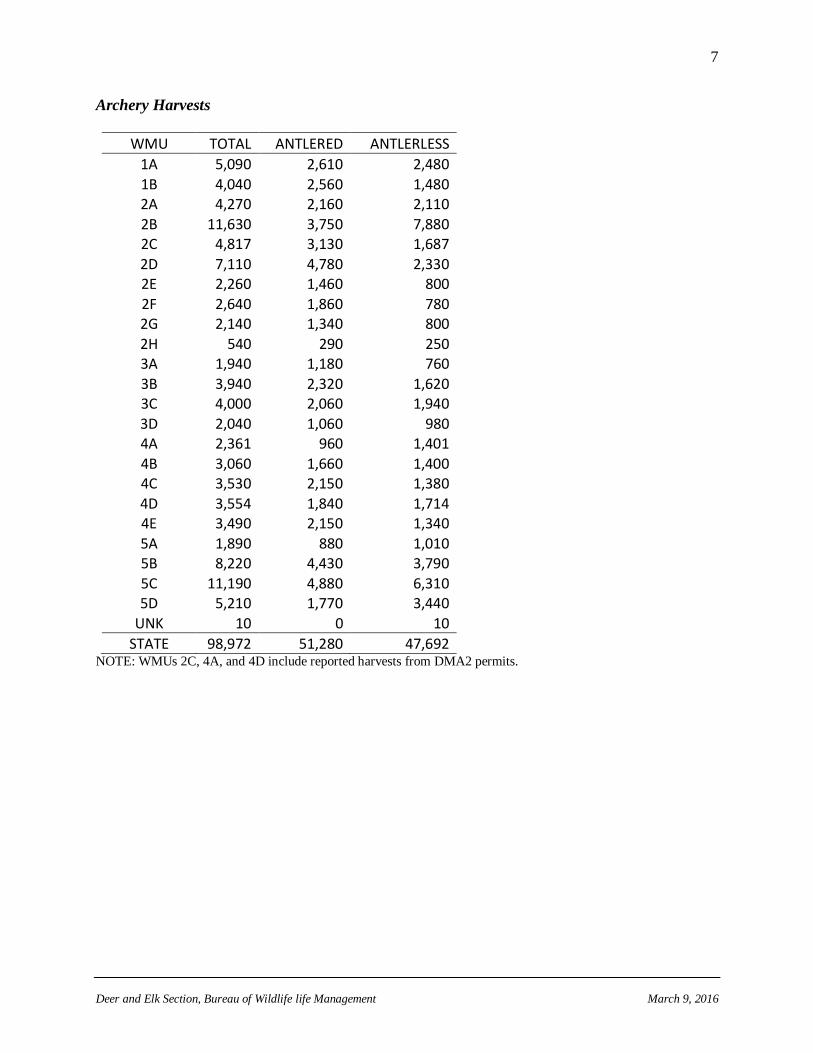
Archery Harvests
WMU TOTAL ANTLERED ANTLERLESS
1A 5,090 2,610 2,480
1B 4,040 2,560 1,480 2A 4,270 2,160 2,110
2B 11,630 3,750 7,880 2C 4,817 3,130 1,687
2D 7,110 4,780 2,330 2E 2,260 1,460 800
2F 2,640 1,860 780 2G 2,140 1,340 800
2H 540 290 250 3A 1,940 1,180 760
3B 3,940 2,320 1,620 3C 4,000 2,060 1,940
3D 2,040 1,060 980 4A 2,361 960 1,401
4B 3,060 1,660 1,400 4C 3,530 2,150 1,380
4D 3,554 1,840 1,714 4E 3,490 2,150 1,340
5A 1,890 880 1,010 5B 8,220 4,430 3,790
5C 11,190 4,880 6,310 5D 5,210 1,770 3,440
UNK 10 0 10
STATE 98,972 51,280 47,692 NOTE: WMUs 2C, 4A, and 4D include reported harvests from DMA2 permits.
8
Deer and Elk Section, Bureau of Wildlife life Management March 9, 2016
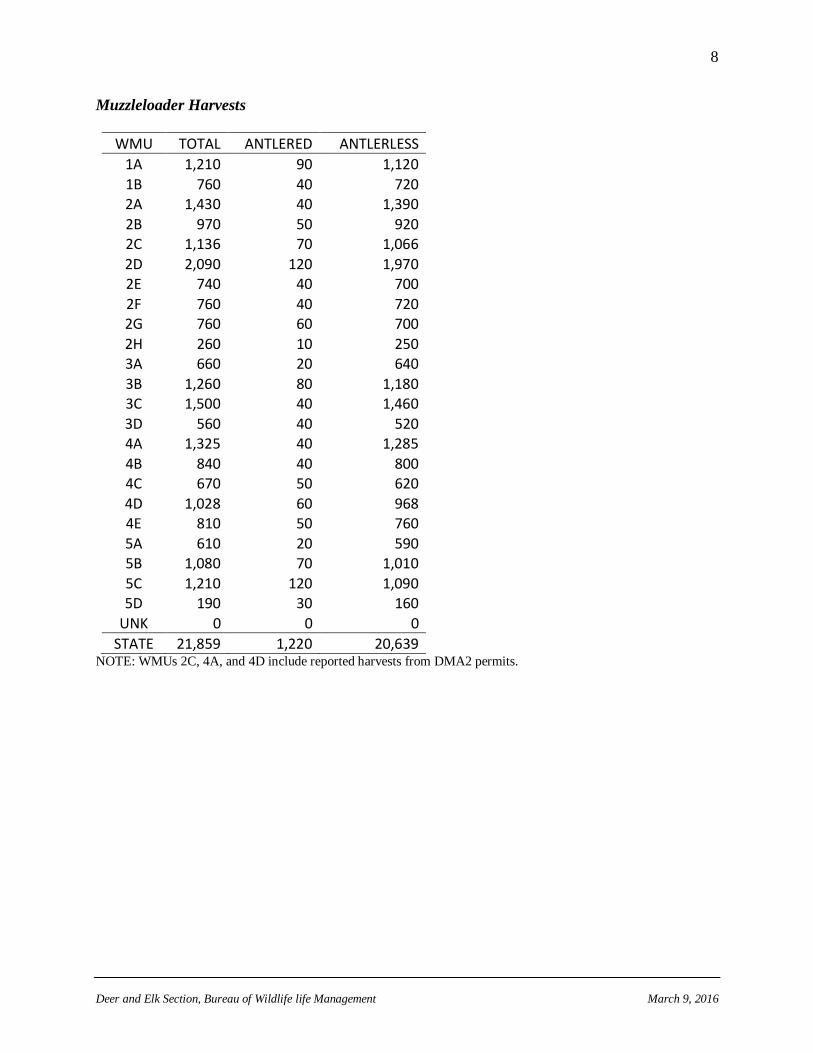
Muzzleloader Harvests
WMU TOTAL ANTLERED ANTLERLESS
1A 1,210 90 1,120
1B 760 40 720 2A 1,430 40 1,390
2B 970 50 920 2C 1,136 70 1,066
2D 2,090 120 1,970 2E 740 40 700
2F 760 40 720 2G 760 60 700
2H 260 10 250 3A 660 20 640
3B 1,260 80 1,180 3C 1,500 40 1,460
3D 560 40 520 4A 1,325 40 1,285
4B 840 40 800 4C 670 50 620
4D 1,028 60 968 4E 810 50 760
5A 610 20 590 5B 1,080 70 1,010
5C 1,210 120 1,090 5D 190 30 160
UNK 0 0 0
STATE 21,859 1,220 20,639 NOTE: WMUs 2C, 4A, and 4D include reported harvests from DMA2 permits.
9
Deer and Elk Section, Bureau of Wildlife life Management March 9, 2016
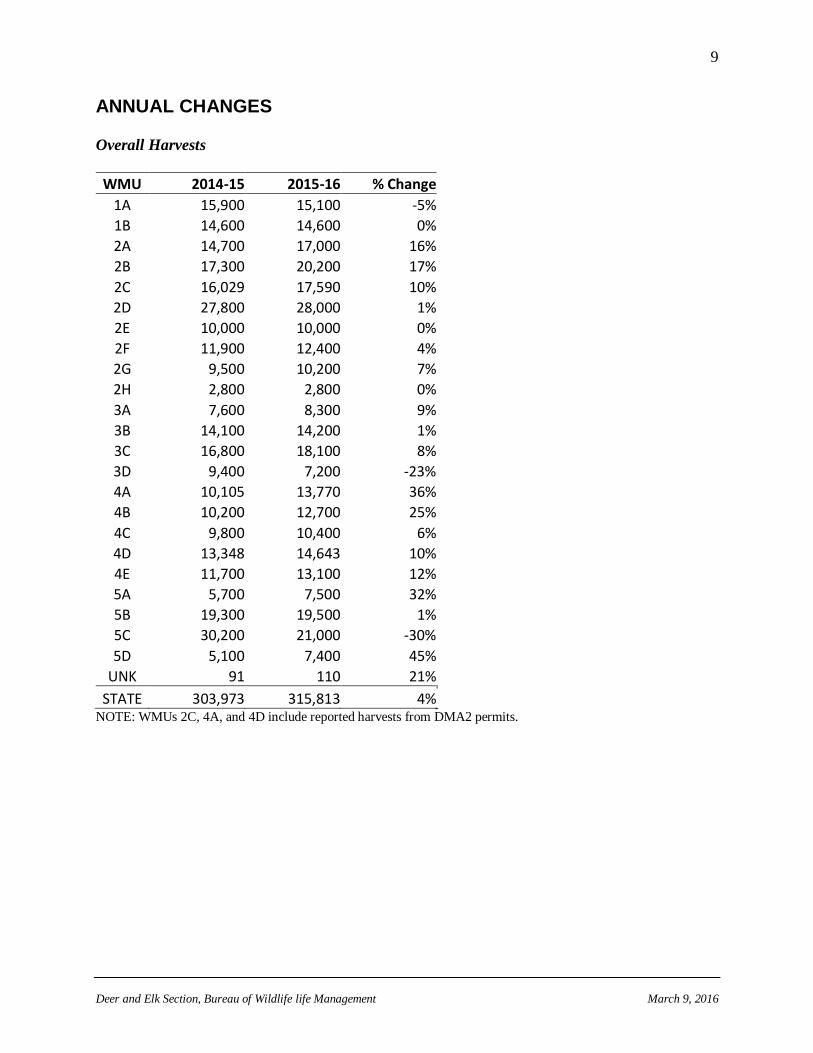
ANNUAL CHANGES
Overall Harvests
WMU 2014-15 2015-16 % Change
1A 15,900 15,100 -5%
1B 14,600 14,600 0%
2A 14,700 17,000 16%
2B 17,300 20,200 17%
2C 16,029 17,590 10%
2D 27,800 28,000 1%
2E 10,000 10,000 0%
2F 11,900 12,400 4%
2G 9,500 10,200 7%
2H 2,800 2,800 0%
3A 7,600 8,300 9%
3B 14,100 14,200 1%
3C 16,800 18,100 8%
3D 9,400 7,200 -23%
4A 10,105 13,770 36%
4B 10,200 12,700 25%
4C 9,800 10,400 6%
4D 13,348 14,643 10%
4E 11,700 13,100 12%
5A 5,700 7,500 32%
5B 19,300 19,500 1%
5C 30,200 21,000 -30%
5D 5,100 7,400 45%
UNK 91 110 21%
STATE 303,973 315,813 4%
NOTE: WMUs 2C, 4A, and 4D include reported harvests from DMA2 permits.
10
Deer and Elk Section, Bureau of Wildlife life Management March 9, 2016
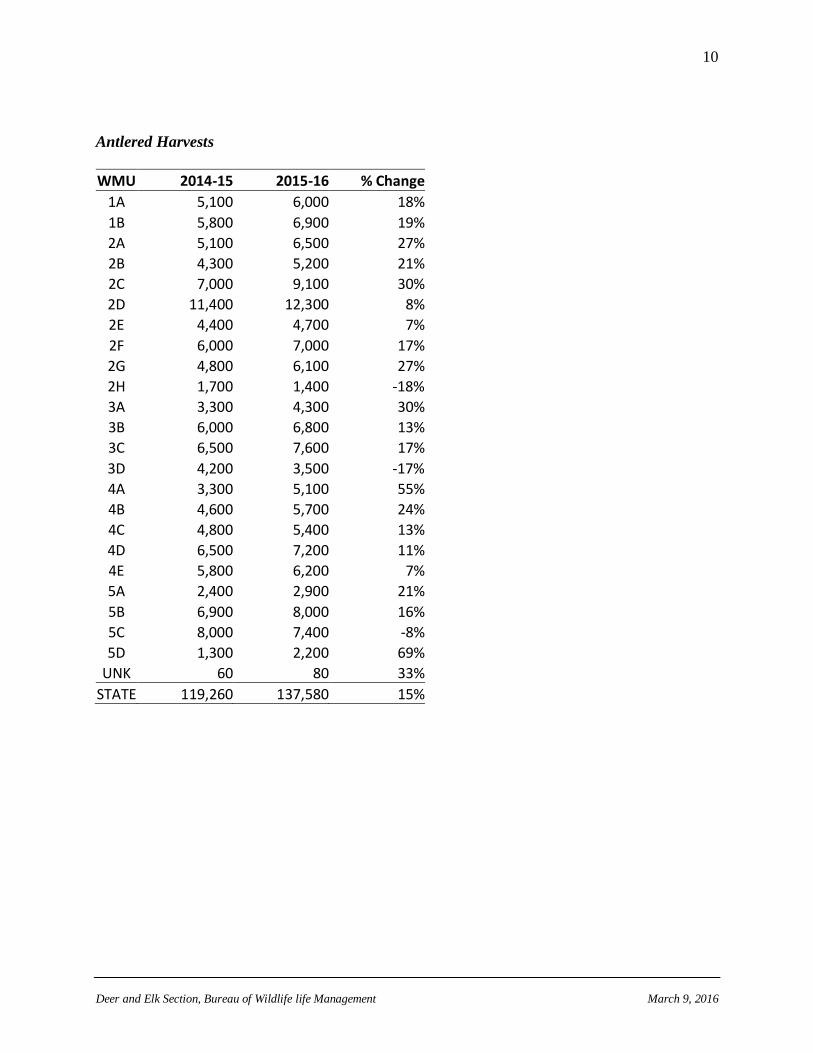
Antlered Harvests
WMU 2014-15 2015-16 % Change
1A 5,100 6,000 18%
1B 5,800 6,900 19%
2A 5,100 6,500 27%
2B 4,300 5,200 21%
2C 7,000 9,100 30%
2D 11,400 12,300 8%
2E 4,400 4,700 7%
2F 6,000 7,000 17%
2G 4,800 6,100 27%
2H 1,700 1,400 -18%
3A 3,300 4,300 30%
3B 6,000 6,800 13%
3C 6,500 7,600 17%
3D 4,200 3,500 -17%
4A 3,300 5,100 55%
4B 4,600 5,700 24%
4C 4,800 5,400 13%
4D 6,500 7,200 11%
4E 5,800 6,200 7%
5A 2,400 2,900 21%
5B 6,900 8,000 16%
5C 8,000 7,400 -8%
5D 1,300 2,200 69%
UNK 60 80 33%
STATE 119,260 137,580 15%
11
Deer and Elk Section, Bureau of Wildlife life Management March 9, 2016
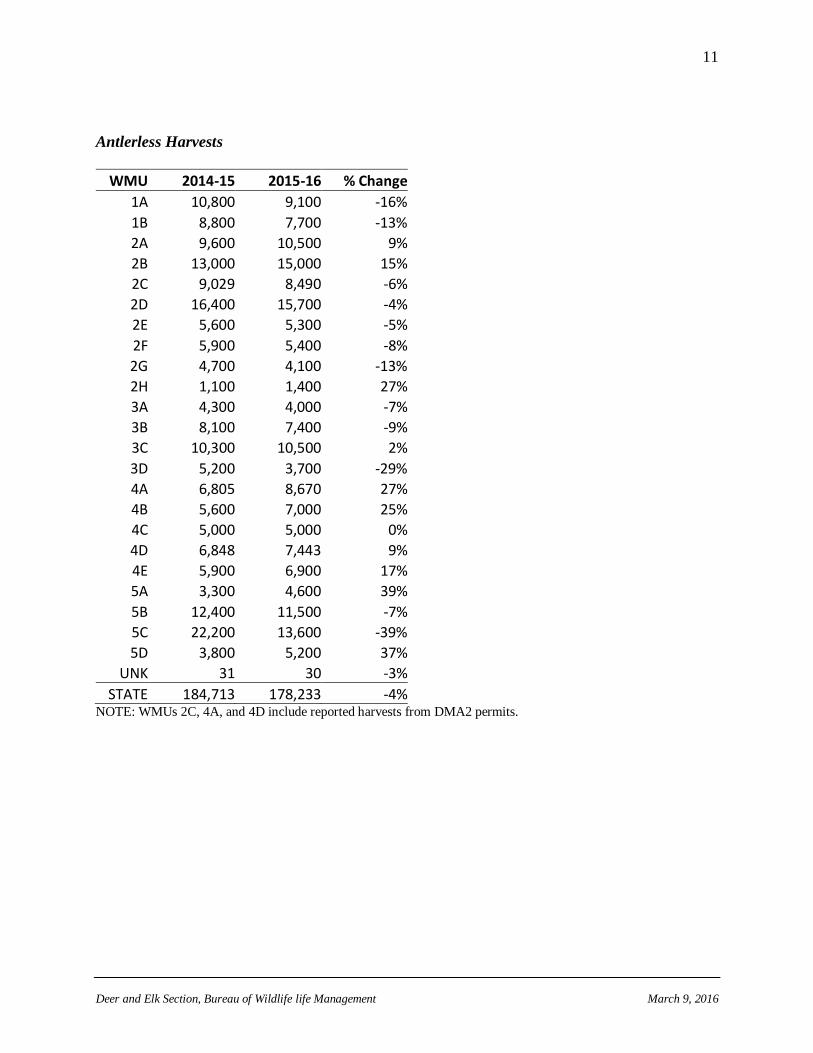
Antlerless Harvests
WMU 2014-15 2015-16 % Change
1A 10,800 9,100 -16%
1B 8,800 7,700 -13%
2A 9,600 10,500 9%
2B 13,000 15,000 15%
2C 9,029 8,490 -6%
2D 16,400 15,700 -4%
2E 5,600 5,300 -5%
2F 5,900 5,400 -8%
2G 4,700 4,100 -13%
2H 1,100 1,400 27%
3A 4,300 4,000 -7%
3B 8,100 7,400 -9%
3C 10,300 10,500 2%
3D 5,200 3,700 -29%
4A 6,805 8,670 27%
4B 5,600 7,000 25%
4C 5,000 5,000 0%
4D 6,848 7,443 9%
4E 5,900 6,900 17%
5A 3,300 4,600 39%
5B 12,400 11,500 -7%
5C 22,200 13,600 -39%
5D 3,800 5,200 37%
UNK 31 30 -3%
STATE 184,713 178,233 -4% NOTE: WMUs 2C, 4A, and 4D include reported harvests from DMA2 permits.
12
Deer and Elk Section, Bureau of Wildlife life Management March 9, 2016
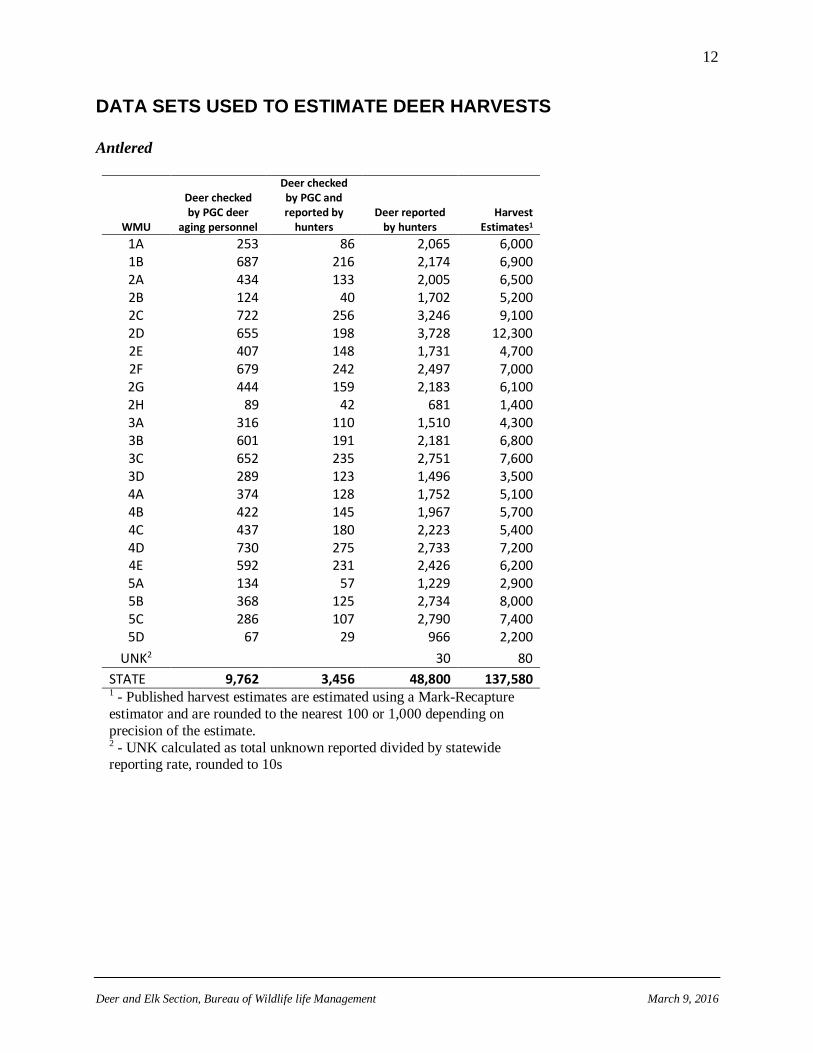
DATA SETS USED TO ESTIMATE DEER HARVESTS Antlered
Deer checked by PGC deer
aging personnel
Deer checked by PGC and reported by
hunters Deer reported
by hunters Harvest
Estimates1 WMU
1A 253 86 2,065 6,000 1B 687 216 2,174 6,900 2A 434 133 2,005 6,500 2B 124 40 1,702 5,200 2C 722 256 3,246 9,100 2D 655 198 3,728 12,300 2E 407 148 1,731 4,700 2F 679 242 2,497 7,000 2G 444 159 2,183 6,100 2H 89 42 681 1,400 3A 316 110 1,510 4,300 3B 601 191 2,181 6,800 3C 652 235 2,751 7,600 3D 289 123 1,496 3,500 4A 374 128 1,752 5,100 4B 422 145 1,967 5,700 4C 437 180 2,223 5,400 4D 730 275 2,733 7,200 4E 592 231 2,426 6,200 5A 134 57 1,229 2,900 5B 368 125 2,734 8,000 5C 286 107 2,790 7,400 5D 67 29 966 2,200
UNK2 30 80
STATE 9,762 3,456 48,800 137,580 1 - Published harvest estimates are estimated using a Mark-Recapture
estimator and are rounded to the nearest 100 or 1,000 depending on
precision of the estimate. 2 - UNK calculated as total unknown reported divided by statewide reporting rate, rounded to 10s
13
Deer and Elk Section, Bureau of Wildlife life Management March 9, 2016
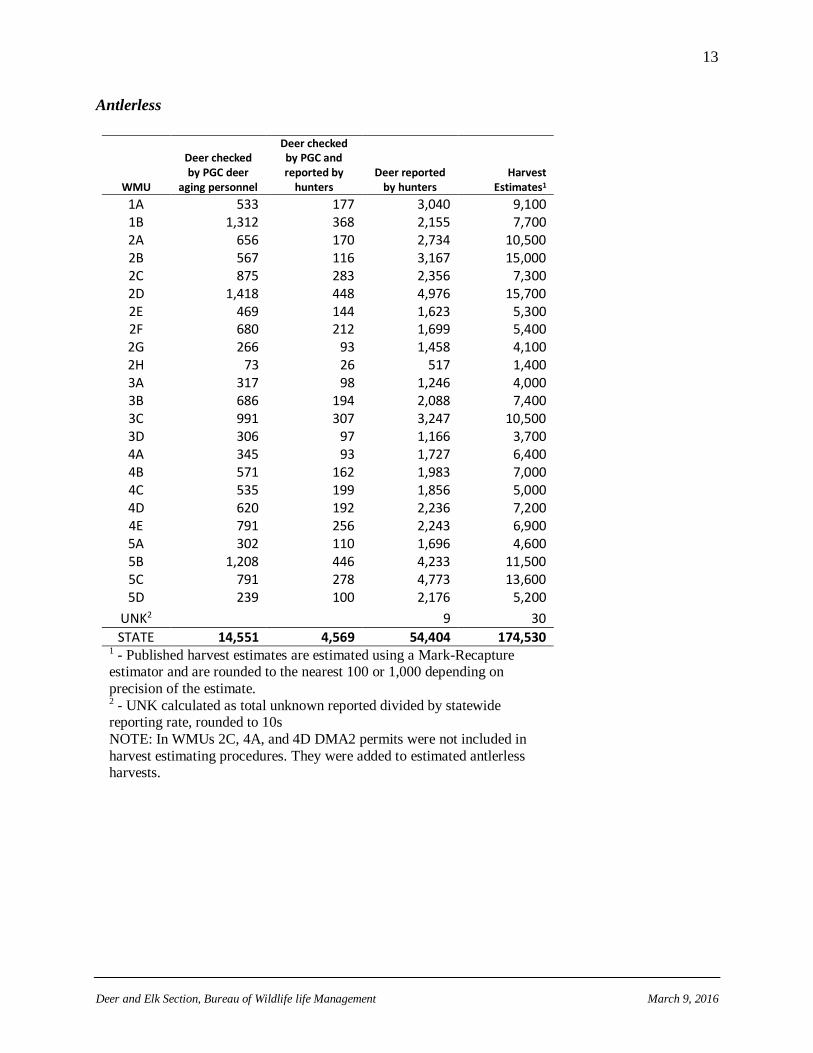
Antlerless
WMU
Deer checked by PGC deer
aging personnel
Deer checked by PGC and reported by
hunters Deer reported
by hunters Harvest
Estimates1
1A 533 177 3,040 9,100 1B 1,312 368 2,155 7,700 2A 656 170 2,734 10,500 2B 567 116 3,167 15,000 2C 875 283 2,356 7,300 2D 1,418 448 4,976 15,700 2E 469 144 1,623 5,300 2F 680 212 1,699 5,400 2G 266 93 1,458 4,100 2H 73 26 517 1,400 3A 317 98 1,246 4,000 3B 686 194 2,088 7,400 3C 991 307 3,247 10,500 3D 306 97 1,166 3,700 4A 345 93 1,727 6,400 4B 571 162 1,983 7,000 4C 535 199 1,856 5,000 4D 620 192 2,236 7,200 4E 791 256 2,243 6,900 5A 302 110 1,696 4,600 5B 1,208 446 4,233 11,500 5C 791 278 4,773 13,600 5D 239 100 2,176 5,200
UNK2 9 30
STATE 14,551 4,569 54,404 174,530 1 - Published harvest estimates are estimated using a Mark-Recapture estimator and are rounded to the nearest 100 or 1,000 depending on
precision of the estimate. 2 - UNK calculated as total unknown reported divided by statewide reporting rate, rounded to 10s
NOTE: In WMUs 2C, 4A, and 4D DMA2 permits were not included in
harvest estimating procedures. They were added to estimated antlerless harvests.
14
Deer and Elk Section, Bureau of Wildlife life Management March 9, 2016
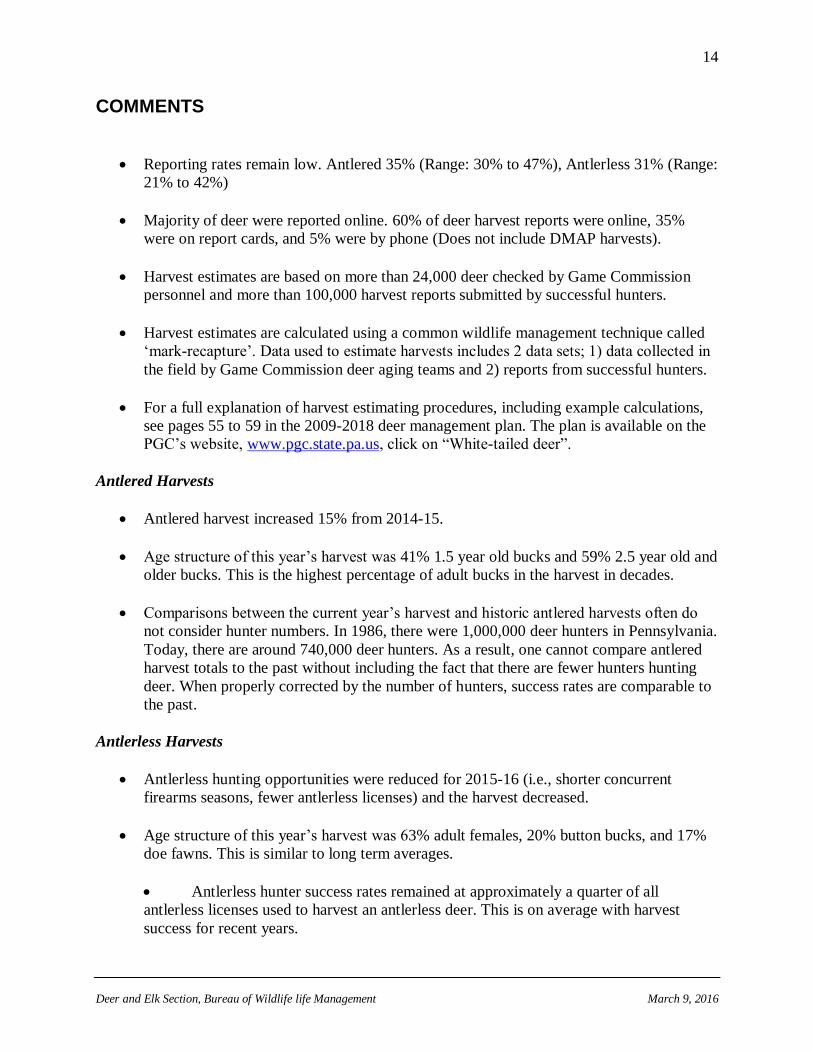
COMMENTS
Reporting rates remain low. Antlered 35% (Range: 30% to 47%), Antlerless 31% (Range:
21% to 42%)
Majority of deer were reported online. 60% of deer harvest reports were online, 35%
were on report cards, and 5% were by phone (Does not include DMAP harvests).
Harvest estimates are based on more than 24,000 deer checked by Game Commission
personnel and more than 100,000 harvest reports submitted by successful hunters.
Harvest estimates are calculated using a common wildlife management technique called
‘mark-recapture’. Data used to estimate harvests includes 2 data sets; 1) data collected in
the field by Game Commission deer aging teams and 2) reports from successful hunters.
For a full explanation of harvest estimating procedures, including example calculations,
see pages 55 to 59 in the 2009-2018 deer management plan. The plan is available on the
PGC’s website, www.pgc.state.pa.us, click on “White-tailed deer”.
Antlered Harvests
Antlered harvest increased 15% from 2014-15.
Age structure of this year’s harvest was 41% 1.5 year old bucks and 59% 2.5 year old and
older bucks. This is the highest percentage of adult bucks in the harvest in decades.
Comparisons between the current year’s harvest and historic antlered harvests often do
not consider hunter numbers. In 1986, there were 1,000,000 deer hunters in Pennsylvania.
Today, there are around 740,000 deer hunters. As a result, one cannot compare antlered
harvest totals to the past without including the fact that there are fewer hunters hunting
deer. When properly corrected by the number of hunters, success rates are comparable to
the past.
Antlerless Harvests
Antlerless hunting opportunities were reduced for 2015-16 (i.e., shorter concurrent
firearms seasons, fewer antlerless licenses) and the harvest decreased.
Age structure of this year’s harvest was 63% adult females, 20% button bucks, and 17%
doe fawns. This is similar to long term averages.
Antlerless hunter success rates remained at approximately a quarter of all
antlerless licenses used to harvest an antlerless deer. This is on average with harvest
success for recent years.