Embed Size (px)
Citation preview

www.dec.ny.gov
WHITE-TAILED DEER HARVEST SUMMARY
2015
Results reported in this document were funded by the Federal Aid in Wildlife Restoration Act. Grant WE-173-G
Jennifer Kurilovitch, Wyoming County, 2015 Early Bow Season

Change 5‐year Average
(2014 to 2015) (2010 to 2014)
Total Take 202,973 238,672 ‐15.0% 236,731
Adult Buck Take (≥ 1.5 years old) 99,572 108,604 ‐8.3% 111,855
Adult Female Take (≥ 1.5 years old) 75,157 90,321 ‐16.8% 86,499
Antlerless Take (fawns and adult does) 103,401 130,068 ‐20.5% 124,876
% Buck Fawns in Antlerless Take 14.9% 16.0% 16.7%
% Buck Take ≥ 2.5 Years Old 52.8% 51.8% 46.9%
Antlerless to Adult Buck Harvest Ratio 1.04 : 1 1.2 : 1 1.1 : 1
Deer Management Permits (DMPs) Issued 626,389 671,782 ‐6.8% 591,972
DMP Take 76,928 100,381 ‐23.4% 94,197
DMP Success Rate 12.3% 14.9% 16.0%
DMAP Take 10,847 12,627 ‐14.1% 11,712
Muzzleloader Season Take 11,570 15,071 ‐23.2% 16,197
% Antlerless of Muzzleloader Take 60.5% 60.1% 62.2%
Bow Season Take 37,697 35,388 6.5% 35,825
% Antlerless of Bow Take 31.0% 31.0% 31.8%
Crossbow Take 7,469 5,535 34.9%
Youth Deer Hunt 1,222 1,182 3.4% 1,289
Hunter Reporting Rate (statewide, all tags) 44.0% 42.6% 44.4%
Deer Check (% of harvest checked by DEC) * 6.9% 6.4% 6.5%
Statewide Harvest Estimate Precision (95% CI) ±1.95% ±1.96% ±1.94%
NEW YORK STATE
DEPARTMENT OF ENVIRONMENTAL CONSERVATION
2015 Deer Harvest ‐ Recent Trend Comparison
Note: DEC checks hunter‐killed deer each year to determine age and sex breakdown of the harvest and to determine reporting rate by zone and tag type (DMP, Regular Season tags, ect.). In 2015, DEC checked 13,936 deer throughout New York.
2015 2014
Page 2

Reg Big
Game Bow DMP Muzldr DMAP
Male
Adult
Male
Fawn
Female
Adult
Female
Fawn
Total
Deer
Northern Zone Totals 11,374 1,660 3,117 5,835 1,603 14,850 1,102 6,786 851 23,589Bowhunting 767 114 692 87 1,660Deer Management Permit 162 368 2,300 287 3,117Muzzleloader 2,557 370 2,583 325 5,835DMAP 19 246 1,190 148 1,603
Southern Zone Totals 54,302 34,927 71,942 5,735 9,081 83,517 13,926 66,970 11,574 175,987Bowhunting 24,318 1,452 8,118 1,039 34,927Deer Management Permit 2,967 10,631 49,022 9,322 71,942Muzzleloader 2,018 411 2,949 357 5,735DMAP 103 1,402 6,747 829 9,081
Long Island Totals 255 1,110 1,869 0 163 1,205 361 1,401 430 3,397Bowhunting 930 26 135 19 1,110Deer Management Permit 61 289 1,123 396 1,869DMAP 2 25 121 15 163
Statewide Totals 65,931 37,697 76,928 11,570 10,847 99,572 15,389 75,157 12,855 202,973Bowhunting 26,015 1,592 8,945 1,145 37,697Deer Management Permit 3,190 11,288 52,445 10,005 76,928Muzzleloader 4,575 781 5,532 682 11,570DMAP 124 1,673 8,058 992 10,847
Note: Deer Management Permits (DMPs) and Deer Management Assistance Program (DMAP) permits are for antlerless deer. Bucks with antlers less than 3 inches long are not considered legally antlered deer and may be taken using a DMP or DMAP permit.
NEW YORK STATE
DEPARTMENT OF ENVIRONMENTAL CONSERVATION
2015 Calculated Deer Harvest by Zone
Page 3

2015 New York State Deer Take by Wildlife Management UnitThe values presented here are calculated estimates. The precision of the statewide take estimate is within 1-2 percent.
Take estimates become less precise as the size of the area considered is reduced.
New York State Department of Environmental Conservation
WMU BUCKS/SQ MI
BUCKS TOTAL DEER
TOTAL DEER/SQ
WMU BUCKS/SQ MI
BUCKS TOTAL DEER
TOTAL DEER/SQ
1C 1,205 1.3 3,397 3.83A 625 0.9 777 1.13C 547 1.7 883 2.83F 556 1.7 1,239 3.73G 596 1.3 1,217 2.73H 1,210 2.2 2,109 3.83J 734 2.1 1,514 4.33K 543 1.4 691 1.83M 2,162 2.9 6,024 8.03N 400 1.8 775 3.53P 147 1.2 231 1.83R 208 1.0 433 2.13S 376 0.9 1,093 2.54A 967 2.2 1,553 3.64B 278 1.7 606 3.84C 582 3.5 1,183 7.24F 3,869 3.3 7,113 6.14G 726 2.0 1,247 3.44H 801 2.8 1,242 4.34J 151 1.0 434 2.94K 694 2.7 1,131 4.44L 429 1.9 555 2.54O 1,588 2.1 2,545 3.34P 707 2.0 1,142 3.24R 476 1.6 783 2.74S 414 1.9 655 3.04T 327 2.5 884 6.74U 338 2.7 431 3.44W 759 1.7 1,205 2.74Y 452 2.6 972 5.54Z 481 1.9 805 3.25A 455 0.7 681 1.15C 488 0.4 682 0.65F 548 0.4 816 0.65G 983 0.9 1,463 1.35H 1,823 0.6 2,487 0.85J 923 1.4 1,280 1.95R 719 1.9 1,631 4.45S 1,199 2.8 2,381 5.65T 396 1.8 527 2.46A 1,699 1.2 2,193 1.56C 1,431 1.5 2,412 2.56F 577 0.5 808 0.76G 2,390 2.6 5,168 5.56H 137 0.8 239 1.46J 727 0.5 1,030 0.76K 2,169 1.9 3,622 3.16N 500 1.0 708 1.46P 381 1.9 800 3.96R 1,026 1.9 1,919 3.56S 1,554 2.6 2,819 4.87A 1,344 2.5 2,513 4.6
7F 1,419 2.1 3,628 5.37H 874 2.4 2,189 6.17J 2,556 3.0 6,537 7.87M 3,787 3.0 7,440 6.07P 1,206 2.5 1,929 4.07R 1,916 2.6 4,163 5.67S 1,756 2.6 3,289 5.08A 1,094 2.6 2,971 7.18C 101 0.7 296 2.18F 2,301 3.1 6,033 8.28G 2,682 3.9 7,005 10.28H 2,562 4.5 7,209 12.68J 2,188 3.1 5,044 7.18M 1,323 4.3 3,189 10.48N 1,855 5.9 4,994 15.98P 1,089 3.1 1,872 5.38R 1,500 5.6 4,186 15.58S 675 2.6 1,461 5.78T 1,385 3.6 2,548 6.68W 1,204 2.7 2,010 4.68X 1,685 4.2 3,933 9.88Y 1,319 3.7 2,397 6.89A 865 1.9 2,130 4.69F 764 2.8 1,891 6.89G 593 2.6 1,533 6.79H 4,261 4.4 9,682 9.99J 2,377 3.4 5,311 7.79K 1,556 3.5 3,063 6.99M 1,432 4.3 2,909 8.89N 732 3.5 1,561 7.59P 2,486 4.3 4,151 7.19R 491 2.3 770 3.59S 133 1.5 197 2.29T 554 2.2 813 3.39W 779 3.1 1,464 5.99X 770 3.5 1,226 5.69Y 485 3.9 901 7.2
Antlered Bucks
Total Deer
Antlerless
99,572
202,973
103,401
Page 4

9S
9T
9X
9N
8J
8Y
6N
6H
6A
3K
4A
3C
5C
3G
9A
9R
8G
7R
6G
9K9M
8X
8C
8R
7H
7F
4P
6F
2A
4Z
1A
9A
9W
9Y
7J
7P
6S
4F
3A
4R
2A2A
3P
5F
4Y
5T
9H
8P
8T
8S
6P6R
6J
3H
4G 4H
4S
3N
4J
5G
4L
5S
7S
6C
2A
4B
3S
4T
4K
5A
9G
8M
8H
8W
7M
4O
4W
5H
3J
3R
5J
5R
1C
9J
9C
9F
8A
9P
8N
8F
7A 6K
3M
3F
4U
4C
Adult BuckTake Density
2015 Bucks Takenper Square Mile
< 1.0
1.1 - 2.0
2.1 - 3.0
3.1 - 4.0
4.1 - 5.0
5.1 - 6.0
No Deer Hunting
WMU
9S
9T
9X
9N
8J
8Y
6N
6H
6A
3K
4A
3C
5C
3G
9A
9R
8G
7R
6G
9K9M
8X
8C
8R
7H
7F
4P
6F
2A
4Z
1A
9A
9W
9Y
7J
7P
6S
4F
3A
4R
2A2A
3P
5F
4Y
5T
9H
8P
8T
8S
6P6R
6J
3H
4G 4H
4S
3N
4J
5G
4L
5S
7S
6C
2A
4B
3S
4T
4K
5A
9G
8M
8H
8W
7M
4O
4W
5H
3J
3R
5J
5R
1C
9J
9C
9F
8A
9P
8N
8F
7A 6K
3M
3F
4U
4C
2014
9S
9T
9X
9N
8J
8Y
6N
6H
6A
3K
4A
3C
5C
3G
9A
9R
8G
7R
6G
9K9M
8X
8C
8R
7H
7F
4P
6F
2A
4Z
1A
9A
9W
9Y
7J
7P
6S
4F
3A
4R
2A2A
3P
5F
4Y
5T
9H
8P
8T
8S
6P6R
6J
3H
4G 4H
4S
3N
4J
5G
4L
5S
7S
6C
2A
4B
3S
4T
4K
5A
9G
8M
8H
8W
7M
4O
4W
5H
3J
3R
5J
5R
1C
9J
9C
9F
8A
9P
8N
8F
7A 6K
3M
3F
4U
4C
9S
9T
9X
9N
8J
8Y
6N
6H
6A
3K
4A
3C
5C
3G
9A
9R
8G
7R
6G
9K9M
8X
8C
8R
7H
7F
4P
6F
2A
4Z
1A
9A
9W
9Y
7J
7P
6S
4F
3A
4R
2A2A
3P
5F
4Y
5T
9H
8P
8T
8S
6P6R
6J
3H
4G 4H
4S
3N
4J
5G
4L
5S
7S
6C
2A
4B
3S
4T
4K
5A
9G
8M
8H
8W
7M
4O
4W
5H
3J
3R
5J
5R
1C
9J
9C
9F
8A
9P
8N
8F
7A 6K
3M
3F
4U
4C
2014
Antlerless DeerTake Density
2015Deer Takenper Square Mile
< 1.0
1.1 - 2.0
2.1 - 4.0
4.1 - 6.0
6.1 - 8.0
8.1 - 13.0
No Deer Hunting
WMU
Page 5

9S
9T
9X
9N
8J
8Y
6N
6H
6A
3K
4A
3C
5C
3G
9A
9R
8G
7R
6G
9K9M
8X
8C
8R
7H
7F
4P
6F
2A
4Z
1A
9A
9W
9Y
7J
7P
6S
4F
3A
4R
2A2A
3P
5F
4Y
5T
9H
8P
8T
8S
6P6R
6J
3H
4G 4H
4S
3N
4J
5G
4L
5S
7S
6C
2A
4B
3S
4T
4K
5A
9G
8M
8H
8W
7M
4O
4W
5H
3J
3R
5J
5R
1C
9J
9C
9F
8A
9P
8N
8F
7A 6K
3M
3F
4U
4C
Change inAdult Buck Take
2015 vs. 2014Difference>15% Increase
5-15% Increase
Stable (± 5%)
5-15% Decrease
> 15% Decrease
No Deer Hunting
WMU
9S
9T
9X
9N
8J
8Y
6N
6H
6A
3K
4A
3C
5C
3G
9A
9R
8G
7R
6G
9K9M
8X
8C
8R
7H
7F
4P
6F
2A
4Z
1A
9A
9W
9Y
7J
7P
6S
4F
3A
4R
2A2A
3P
5F
4Y
5T
9H
8P
8T
8S
6P6R
6J
3H
4G 4H
4S
3N
4J
5G
4L
5S
7S
6C
2A
4B
3S
4T
4K
5A
9G
8M
8H
8W
7M
4O
4W
5H
3J
3R
5J
5R
1C
9J
9C
9F
8A
9P
8N
8F
7A 6K
3M
3F
4U
4C
Change inAntlerless Deer Take
2015 vs. 2014Difference
> 15% Increase
5-15% Increase
Stable (± 5%)
5-15% Decrease
> 15% Decrease
No Deer Hunting
WMU
Page 6

9S
9T
9X
9N
8J
8Y
6N
6H
6A
3K
4A
3C
5C
3G
9A
9R
8G
7R
6G
9K9M
8X
8C
8R
7H
7F
4P
6F
2A
4Z
1A
9A
9W
9Y
7J
7P
6S
4F
3A
4R
2A2A
3P
5F
4Y
5T
9H
8P
8T
8S
6P6R
6J
3H
4G 4H
4S
3N
4J
5G
4L
5S
7S
6C
2A
4B
3S
4T
4K
5A
9G
8M
8H
8W
7M
4O
4W
5H
3J
3R
5J
5R
1C
9J
9C
9F
8A
9P
8N
8F
7A 6K
3M
3F
4U
4C
Antlerless to AntleredDeer Harvest Ratio
2015 # Antlerless per Antlered Deer Taken
0.2 - 0.5
0.5 - 0.75
0.75 - 1.0
1.0 - 1.25
1.25 - 1.5
1.5 - 2.1
No Deer Hunting
WMU
9S
9T
9X
9N
8J
8Y
6N
6H
6A
3K
4A
3C
5C
3G
9A
9R
8G
7R
6G
9K9M
8X
8C
8R
7H
7F
4P
6F
2A
4Z
1A
9A
9W
9Y
7J
7P
6S
4F
3A
4R
2A2A
3P
5F
4Y
5T
9H
8P
8T
8S
6P6R
6J
3H
4G 4H
4S
3N
4J
5G
4L
5S
7S
6C
2A
4B
3S
4T
4K
5A
9G
8M
8H
8W
7M
4O
4W
5H
3J
3R
5J
5R
1C
9J
9C
9F
8A
9P
8N
8F
7A 6K
3M
3F
4U
4C
2014
9S
9T
9X
9N
8J
8Y
6N
6H
6A
3K
4A
3C
5C
3G
9A
9R
8G
7R
6G
9K9M
8X
8C
8R
7H
7F
4P
6F
2A
4Z
1A
9A
9W
9Y
7J
7P
6S
4F
3A
4R
2A2A
3P
5F
4Y
5T
9H
8P
8T
8S
6P6R
6J
3H
4G 4H
4S
3N
4J
5G
4L
5S
7S
6C
2A
4B
3S
4T
4K
5A
9G
8M
8H
8W
7M
4O
4W
5H
3J
3R
5J
5R
1C
9J
9C
9F
8A
9P
8N
8F
7A 6K
3M
3F
4U
4C
9S
9T
9X
9N
8J
8Y
6N
6H
6A
3K
4A
3C
5C
3G
9A
9R
8G
7R
6G
9K9M
8X
8C
8R
7H
7F
4P
6F
2A
4Z
1A
9A
9W
9Y
7J
7P
6S
4F
3A
4R
2A2A
3P
5F
4Y
5T
9H
8P
8T
8S
6P6R
6J
3H
4G 4H
4S
3N
4J
5G
4L
5S
7S
6C
2A
4B
3S
4T
4K
5A
9G
8M
8H
8W
7M
4O
4W
5H
3J
3R
5J
5R
1C
9J
9C
9F
8A
9P
8N
8F
7A 6K
3M
3F
4U
4C
2014
Buck Fawnsin Antlerless Harvest
2015Percent (%)
10.0 - 13.0
13.1 - 15.0
15.1 - 17.0
17.1 - 20.0
No Deer Hunting
WMU
Page 7

9S
9T
9X
9N
8J
8Y
6N
6H
6A
3K
4A
3C
5C
3G
9A
9R
8G
7R
6G
9K9M
8X
8C
8R
7H
7F
4P
6F
2A
4Z
1A
9A
9W
9Y
7J
7P
6S
4F
3A
4R
2A2A
3P
5F
4Y
5T
9H
8P
8T
8S
6P6R
6J
3H
4G 4H
4S
3N
4J
5G
4L
5S
7S
6C
2A
4B
3S
4T
4K
5A
9G
8M
8H
8W
7M
4O
4W
5H
3J
3R
5J
5R
1C
9J
9C
9F
8A
9P
8N
8F
7A 6K
3M
3F
4U
4C
2015 Buck Takevs
Objectives
> 10% Below Objective
Within + or - 10% of Objective
> 10% Above Objective
No Deer Hunting
No Objective
Antler Restriction Units
9S
9T
9X
9N
8J
8Y
6N
6H
6A
3K
4A
3C
5C
3G
9A
9R
8G
7R
6G
9K9M
8X
8C
8R
7H
7F
4P
6F
2A
4Z
1A
9A
9W
9Y
7J
7P
6S
4F
3A
4R
2A2A
3P
5F
4Y
5T
9H
8P
8T
8S
6P6R
6J
3H
4G 4H
4S
3N
4J
5G
4L
5S
7S
6C
2A
4B
3S
4T
4K
5A
9G
8M
8H
8W
7M
4O
4W
5H
3J
3R
5J
5R
1C
9J
9C
9F
8A
9P
8N
8F
7A 6K
3M
3F
4U
4C
Bucks / Square Mile< 1.0
1.1 - 2.0
2.1 - 3.0
3.1 - 4.0
4.1 - 5.0
5.1 - 6.0
Buck Take Objectives
Notes: The Buck Take Objective (BTO) for a WMU represents the numberof antlered bucks expected to be harvested per square mile when the deer population is at the desired level. BTOs are based upon recommendations of local stakeholders in each WMU. BTOs are not the estimated take for a particular hunting season but rather help guide the direction of population management efforts in an area. In many Adirondack and highly suburbanunits, deer populations are strongly influenced by factors other than hunting (winter mortality, deer vehicle collisions, lack of hunter access), and no BTOhas been established for these units. In WMUs with mandatory antler restrictions, buck takes are no longer a valid index of relative deer populations.
Page 8

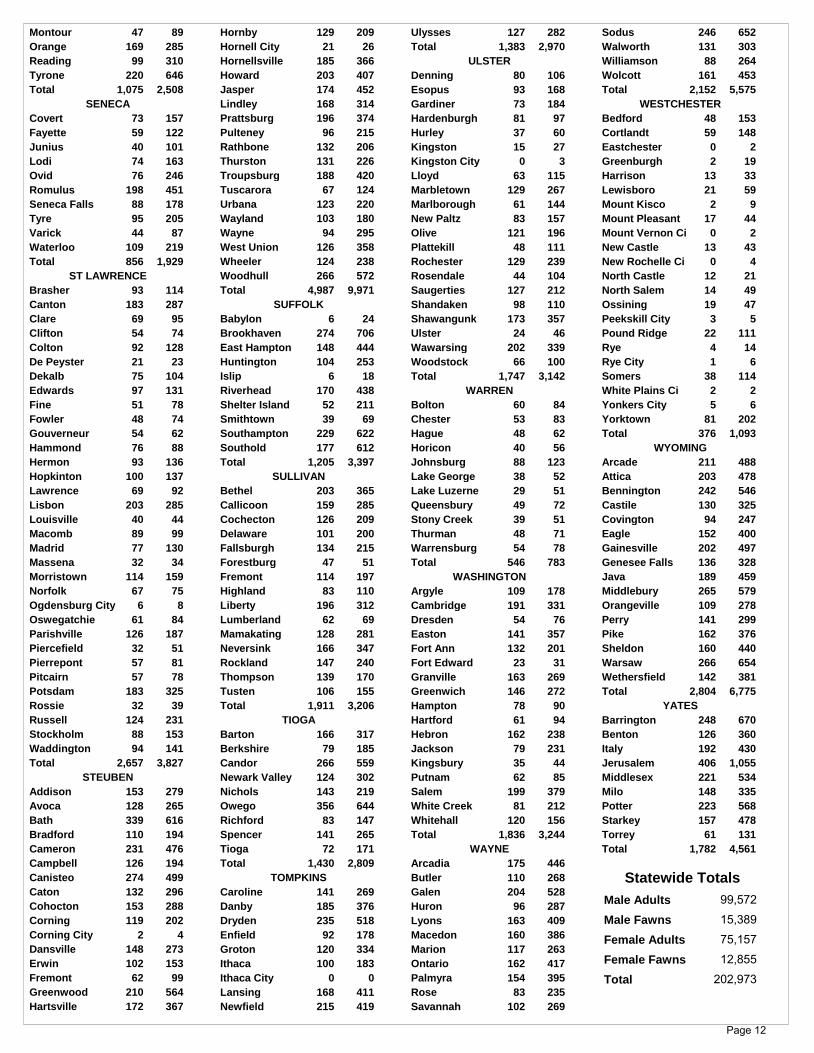
2015 NEW YORK STATE DEER TAKE BY TOWN AND COUNTYListed below are counties, towns and cities from which deer harvests were reported.
First column of figures represents ADULT BUCK TAKE(1 1/2+ Yrs Old). Second column of figures represents TOTAL TAKE.
New York State Department of Environmental Conservation
ALBANY
Albany City 13 30
Berne 174 287
Bethlehem 107 272
Coeymans 94 232
Cohoes City 3 5
Colonie 55 138
Guilderland 88 204
Knox 111 147
New Scotland 117 231
Rensselaerville 170 275
Watervliet City 5 8
Westerlo 146 234
1,083 2,063Total
ALLEGANY
Alfred 142 279
Allen 184 301
Alma 154 249
Almond 208 310
Amity 155 241
Andover 162 400
Angelica 170 275
Belfast 145 263
Birdsall 145 236
Bolivar 152 257
Burns 141 201
Caneadea 151 280
Centerville 135 279
Clarksville 122 178
Cuba 104 202
Friendship 228 363
Genesee 115 161
Granger 166 279
Grove 163 273
Hume 172 348
Independence 133 302
New Hudson 66 115
Rushford 132 262
Scio 104 153
Ward 74 128
Wellsville 178 327
West Almond 110 243
Willing 141 255
Wirt 107 194
4,159 7,354Total
BROOME
Barker 68 112
Binghamton 100 219
Chenango 48 69
Colesville 137 242
Conklin 69 156
Dickinson 2 2
Fenton 46 92
Kirkwood 96 169
Lisle 86 235
Maine 116 255
Nanticoke 58 92
Sanford 162 248
Triangle 92 160
Union 63 130
Vestal 176 392
Windsor 246 394
1,565 2,967Total
CATTARAUGUS
Allegany 138 227
Ashford 148 288
Carrollton 54 92
Cold Spring 55 101
Conewango 104 216
Dayton 121 295
East Otto 182 425
Ellicottville 297 475
Farmersville 137 306
Franklinville 221 400
Freedom 121 258
Great Valley 90 143
Hinsdale 111 155
Humphrey 97 148
Ischua 81 120
Leon 166 325
Little Valley 98 193
Lyndon 106 192
Machias 131 251
Mansfield 173 331
Napoli 101 184
New Albion 175 370
Olean 74 105
Otto 155 376
Perrysburg 86 244
Persia 60 153
Portville 111 175
Randolph 168 267
Red House 85 110
Salamanca 40 52
South Valley 67 99
Yorkshire 124 253
3,877 7,329Total
CAYUGA
Auburn City 15 52
Aurelius 100 222
Brutus 73 179
Cato 101 297
Conquest 90 274
Fleming 33 96
Genoa 94 201
Ira 96 173
Ledyard 142 380
Locke 75 208
Mentz 72 174
Montezuma 37 88
Moravia 133 358
Niles 148 367
Owasco 68 185
Scipio 82 190
Sempronius 116 279
Sennett 77 243
Springport 37 100
Sterling 144 407
Summerhill 55 159
Throop 73 173
Venice 38 114
Victory 72 194
1,971 5,113Total
CHAUTAUQUA
Arkwright 156 306
Busti 156 372
Carroll 106 210
Charlotte 138 244
Chautauqua 249 510
Cherry Creek 165 313
Clymer 147 372
Dunkirk 42 75
Ellery 167 330
Ellicott 85 169
Ellington 93 180
French Creek 88 223
Gerry 123 273
Hanover 176 455
Harmony 147 377
Jamestown City 16 28
Kiantone 60 120
Mina 97 288
North Harmony 139 288
Poland 115 205
Pomfret 125 290
Portland 83 223
Ripley 169 354
Sheridan 95 232
Sherman 135 291
Stockton 189 403
Villenova 114 200
Westfield 199 374
3,574 7,705Total
CHEMUNG
Ashland 120 189
Baldwin 87 140
Big Flats 101 186
Catlin 80 114
Chemung 186 340
Elmira 109 241
Elmira City 5 6
Erin 152 264
Horseheads 113 211
Southport 222 364
Van Etten 66 147
Veteran 98 147
1,339 2,349Total
CHENANGO
Afton 142 223
Bainbridge 132 195
Columbus 116 202
Coventry 137 216
German 72 144
Greene 208 359
Guilford 176 285
Lincklaen 45 110
Mcdonough 139 270
New Berlin 148 216
North Norwich 58 95
Norwich 163 268
Norwich City 0 2
Otselic 92 175
Oxford 236 440
Pharsalia 69 155
Pitcher 57 115
Plymouth 123 232
Preston 136 227
Sherburne 188 346
Smithville 136 289
Smyrna 129 341
2,702 4,905Total
CLINTON
Altona 50 74
Ausable 35 54
Beekmantown 28 36
Black Brook 59 94
Champlain 59 73
Chazy 23 46
Clinton 61 89
Dannemora 12 15
Ellenburg 73 102
Mooers 56 105
Peru 42 49
Plattsburgh 22 25
Saranac 65 88
Schuyler Falls 23 34
608 884Total
COLUMBIA
Ancram 108 190
Austerlitz 84 112
Canaan 110 128
Chatham 150 266
Claverack 115 260
Clermont 33 107
Copake 62 139
Gallatin 79 135
Germantown 61 115
Ghent 131 267
Greenport 34 84
Hillsdale 148 192
Hudson City 6 17
Kinderhook 90 240
Livingston 66 156
New Lebanon 69 80
Stockport 43 101
Stuyvesant 68 168
Taghkanic 94 194
1,551 2,951Total
CORTLAND
Cincinnatus 101 145
Cortland City 8 11
Cortlandville 95 238
Cuyler 119 247
Freetown 58 120
Harford 27 66
Homer 117 278
Lapeer 47 105
Marathon 68 145
Preble 73 114
Scott 61 228
Solon 64 131
Taylor 64 127
Truxton 140 245
Virgil 125 267
Willet 82 149
1,249 2,616Total
DELAWARE
Andes 209 343
Bovina 71 128
Colchester 209 311
Davenport 139 245
Delhi 166 250
Deposit 88 145
Franklin 191 384
Hamden 114 197
Page 9

Hancock 351 566
Harpersfield 111 200
Kortright 113 171
Masonville 133 219
Meredith 163 212
Middletown 154 247
Roxbury 153 199
Sidney 128 179
Stamford 97 150
Tompkins 108 171
Walton 172 307
2,870 4,624Total
DUTCHESS
Amenia 62 123
Beacon City 4 7
Beekman 42 81
Clinton 75 173
Dover 49 119
East Fishkill 55 132
Fishkill 56 121
Hyde Park 57 100
La Grange 54 121
Milan 38 86
Northeast 32 72
Pawling 49 126
Pine Plains 33 68
Pleasant Valley 68 137
Poughkeepsie 66 114
Red Hook 58 128
Rhinebeck 86 232
Stanford 81 151
Union Vale 53 101
Wappinger 42 87
Washington 82 172
1,142 2,451Total
ERIE
Alden 153 332
Aurora 173 405
Boston 100 197
Brant 64 164
Clarence 94 200
Colden 121 218
Collins 191 459
Concord 255 513
Eden 131 281
Elma 128 351
Evans 150 332
Grand Island 71 122
Hamburg 73 133
Holland 157 295
Lancaster 91 189
Marilla 115 256
Newstead 120 285
North Collins 96 237
Orchard Park 95 268
Sardinia 117 279
Wales 156 325
West Seneca 0 4
2,651 5,845Total
ESSEX
Chesterfield 94 139
Crown Point 101 156
Elizabethtown 52 72
Essex 40 62
Jay 48 89
Keene 92 131
Lewis 51 83
Minerva 61 71
Moriah 73 101
Newcomb 52 65
North Elba 32 54
North Hudson 36 41
Schroon 66 89
St Armand 13 21
Ticonderoga 56 84
Westport 79 136
Willsboro 40 68
Wilmington 58 85
1,044 1,547Total
FRANKLIN
Bangor 56 94
Bellmont 51 77
Bombay 34 41
Brandon 21 39
Brighton 25 34
Burke 50 75
Chateaugay 40 69
Constable 32 53
Dickinson 39 64
Duane 6 8
Fort Covington 45 66
Franklin 69 83
Harrietstown 58 90
Malone 86 126
Moira 77 114
Santa Clara 40 58
Tupper Lake 78 102
Waverly 47 61
Westville 38 50
892 1,304Total
FULTON
Bleecker 57 73
Broadalbin 61 108
Caroga 38 53
Ephratah 71 111
Gloversville Ci 7 10
Johnstown 137 221
Mayfield 107 141
Northampton 13 28
Oppenheim 130 226
Perth 39 70
Stratford 62 85
722 1,126Total
GENESEE
Alabama 190 500
Alexander 217 514
Batavia 195 425
Batavia City 2 2
Bergen 97 291
Bethany 179 537
Byron 111 315
Darien 233 545
Elba 173 506
Le Roy 144 417
Oakfield 110 315
Pavilion 149 364
Pembroke 165 440
Stafford 165 305
2,130 5,476Total
GREENE
Ashland 39 63
Athens 99 149
Cairo 113 177
Catskill 132 216
Coxsackie 88 129
Durham 99 188
Greenville 103 184
Halcott 30 48
Hunter 50 60
Jewett 72 122
Lexington 77 93
New Baltimore 49 77
Prattsville 45 80
Windham 69 90
1,065 1,676Total
HAMILTON
Arietta 88 107
Benson 31 34
Hope 44 63
Indian Lake 148 176
Inlet 23 24
Lake Pleasant 70 82
Long Lake 108 138
Morehouse 34 49
Wells 119 146
665 819Total
HERKIMER
Columbia 103 201
Danube 74 113
Fairfield 119 173
Frankfort 110 199
German Flatts 126 244
Herkimer 94 172
Litchfield 59 101
Little Falls 107 184
Manheim 54 94
Newport 72 137
Norway 94 195
Ohio 129 160
Russia 96 131
Salisbury 94 127
Schuyler 55 107
Stark 107 192
Warren 100 179
Webb 112 136
Winfield 78 136
1,783 2,981Total
JEFFERSON
Adams 242 482
Alexandria 71 107
Antwerp 89 109
Brownville 194 416
Cape Vincent 58 123
Champion 176 322
Clayton 112 272
Ellisburg 318 695
Henderson 277 537
Hounsfield 110 261
Le Ray 77 182
Lorraine 99 172
Lyme 93 224
Orleans 82 155
Pamelia 30 64
Philadelphia 35 52
Rodman 186 322
Rutland 146 344
Theresa 94 154
Watertown 184 344
Watertown City 3 5
Wilna 106 155
Worth 66 70
2,848 5,567Total
LEWIS
Croghan 191 287
Denmark 232 435
Diana 78 107
Greig 101 156
Harrisburg 98 171
Lewis 39 52
Leyden 83 137
Lowville 77 215
Lyonsdale 71 92
Martinsburg 134 255
Montague 55 55
New Bremen 108 165
Osceola 64 98
Pinckney 87 129
Turin 69 147
Watson 110 161
West Turin 78 143
1,675 2,805Total
LIVINGSTON
Avon 156 421
Caledonia 201 581
Conesus 222 552
Geneseo 184 442
Groveland 143 388
Leicester 133 403
Lima 165 429
Livonia 214 622
Mount Morris 156 411
North Dansville 60 126
Nunda 212 508
Ossian 199 393
Portage 114 266
Sparta 125 259
Springwater 278 772
West Sparta 146 379
York 214 481
2,922 7,433Total
MADISON
Brookfield 251 576
Cazenovia 157 325
De Ruyter 46 96
Eaton 198 408
Fenner 99 244
Georgetown 100 182
Hamilton 190 431
Lebanon 131 250
Lenox 71 174
Lincoln 69 122
Madison 155 413
Nelson 122 303
Oneida City 42 126
Smithfield 75 222
Stockbridge 91 253
Sullivan 146 273
1,943 4,398Total
MONROE
Brighton 19 47
Chili 59 154
Clarkson 87 221
Gates 0 5
Greece 45 90
Hamlin 84 177
Henrietta 64 158
Irondequoit 27 110
Mendon 247 748
Ogden 114 246
Parma 97 207
Penfield 79 154
Perinton 43 118
Pittsford 42 138
Riga 110 276
Rochester City 2 8
Rush 190 513
Page 10

Sweden 143 397
Webster 74 172
Wheatland 134 428
1,660 4,367Total
MONTGOMERY
Amsterdam 56 122
Amsterdam City 2 2
Canajoharie 98 176
Charleston 127 217
Florida 69 118
Glen 89 147
Minden 93 175
Mohawk 31 49
Palatine 47 107
Root 154 211
St Johnsville 35 69
801 1,393Total
NIAGARA
Cambria 52 130
Hartland 117 359
Lewiston 47 94
Lockport 121 278
Lockport City 4 4
Newfane 128 349
Niagara 14 48
Pendleton 46 84
Porter 63 103
Royalton 201 502
Somerset 119 361
Wheatfield 19 58
Wilson 58 131
989 2,501Total
ONEIDA
Annsville 76 133
Augusta 88 221
Ava 55 78
Boonville 87 146
Bridgewater 60 86
Camden 110 164
Deerfield 73 132
Florence 60 88
Floyd 71 143
Forestport 64 88
Kirkland 113 221
Lee 63 95
Marcy 75 134
Marshall 115 218
New Hartford 37 70
Paris 108 180
Remsen 75 110
Rome City 79 139
Sangerfield 115 212
Steuben 77 116
Trenton 119 207
Utica City 4 6
Vernon 83 197
Verona 143 292
Vienna 75 154
Western 77 129
Westmoreland 102 205
Whitestown 47 106
2,251 4,070Total
ONONDAGA
Camillus 133 285
Cicero 61 181
Clay 41 119
Dewitt 59 132
Elbridge 100 289
Fabius 125 255
Geddes 0 2
Lafayette 164 329
Lysander 156 364
Manlius 134 267
Marcellus 137 334
Onondaga 151 388
Otisco 101 229
Pompey 148 335
Skaneateles 114 248
Spafford 114 325
Syracuse City 12 22
Tully 111 266
Van Buren 39 87
1,900 4,457Total
ONTARIO
Bristol 288 815
Canadice 183 476
Canandaigua 282 757
Canandaigua Cit 0 0
East Bloomfield 120 388
Farmington 170 352
Geneva 88 197
Gorham 150 314
Hopewell 85 177
Manchester 172 366
Naples 238 689
Phelps 217 469
Richmond 328 753
Seneca 71 147
South Bristol 123 319
Victor 210 531
West Bloomfield 97 296
2,822 7,046Total
ORANGE
Blooming Grove 148 379
Chester 106 247
Cornwall 42 107
Crawford 144 378
Deerpark 100 151
Goshen 130 453
Greenville 107 262
Hamptonburgh 88 319
Highlands 32 46
Middletown City 20 75
Minisink 102 299
Monroe 72 198
Montgomery 127 394
Mount Hope 62 137
New Windsor 88 221
Newburgh 78 214
Port Jervis Cit 7 12
Tuxedo 36 49
Wallkill 196 513
Warwick 314 906
Wawayanda 105 258
Woodbury 33 67
2,137 5,685Total
ORLEANS
Albion 97 296
Barre 203 496
Carlton 129 339
Clarendon 143 432
Gaines 57 164
Kendall 87 199
Murray 83 220
Ridgeway 177 508
Shelby 207 541
Yates 109 367
1,292 3,562Total
OSWEGO
Albion 84 165
Amboy 73 106
Boylston 55 85
Constantia 140 231
Fulton City 4 10
Granby 117 234
Hannibal 175 336
Hastings 83 139
Mexico 114 213
Minetto 20 38
New Haven 25 40
Orwell 72 145
Oswego 110 195
Oswego City 2 4
Palermo 72 112
Parish 100 180
Redfield 74 103
Richland 206 402
Sandy Creek 141 315
Schroeppel 75 119
Scriba 85 169
Volney 81 150
West Monroe 66 162
Williamstown 73 127
2,047 3,780Total
OTSEGO
Burlington 197 410
Butternuts 147 255
Cherry Valley 131 216
Decatur 47 91
Edmeston 179 398
Exeter 176 320
Hartwick 184 338
Laurens 173 274
Maryland 141 277
Middlefield 141 275
Milford 182 320
Morris 161 329
New Lisbon 119 210
Oneonta 142 246
Otego 128 260
Otsego 150 281
Pittsfield 105 173
Plainfield 82 186
Richfield 119 225
Roseboom 91 149
Springfield 164 305
Unadilla 130 208
Westford 116 204
Worcester 150 235
3,355 6,185Total
PUTNAM
Carmel 92 182
Kent 59 126
Patterson 58 84
Philipstown 54 111
Putnam Valley 79 145
Southeast 69 138
411 786Total
RENSSELAER
Berlin 113 139
Brunswick 145 246
East Greenbush 96 148
Grafton 71 82
Hoosick 256 525
Nassau 184 282
North Greenbush 47 73
Petersburg 94 135
Pittstown 194 455
Poestenkill 79 125
Rensselaer City 14 19
Sand Lake 105 149
Schaghticoke 125 205
Schodack 154 320
Stephentown 83 129
Troy City 13 16
1,773 3,048Total
ROCKLAND
Clarkstown 60 124
Haverstraw 12 33
Orangetown 27 63
Ramapo 65 124
Stony Point 39 87
203 431Total
SARATOGA
Ballston 55 114
Charlton 54 95
Clifton Park 63 126
Corinth 77 131
Day 95 132
Edinburg 98 162
Galway 92 163
Greenfield 117 160
Hadley 53 68
Halfmoon 51 130
Malta 57 116
Mechanicville C 2 17
Milton 62 121
Moreau 23 31
Northumberland 38 46
Providence 42 64
Saratoga 101 255
Saratoga City 1 17
Stillwater 125 295
Waterford 14 23
Wilton 79 101
1,299 2,367Total
SCHENECTADY
Duanesburg 145 248
Glenville 115 267
Niskayuna 0 2
Princetown 47 59
Rotterdam 61 79
368 655Total
SCHOHARIE
Blenheim 56 91
Broome 114 155
Carlisle 58 103
Cobleskill 61 128
Conesville 68 102
Esperance 65 102
Fulton 72 145
Gilboa 114 178
Jefferson 144 272
Middleburg 154 250
Richmondville 103 184
Schoharie 96 174
Seward 125 228
Sharon 116 199
Summit 90 165
Wright 51 86
1,487 2,562Total
SCHUYLER
Catharine 115 269
Cayuta 48 91
Dix 109 195
Hector 268 623
Page 11
Montour 47 89
Orange 169 285
Reading 99 310
Tyrone 220 646
1,075 2,508Total
SENECA
Covert 73 157
Fayette 59 122
Junius 40 101
Lodi 74 163
Ovid 76 246
Romulus 198 451
Seneca Falls 88 178
Tyre 95 205
Varick 44 87
Waterloo 109 219
856 1,929Total
ST LAWRENCE
Brasher 93 114
Canton 183 287
Clare 69 95
Clifton 54 74
Colton 92 128
De Peyster 21 23
Dekalb 75 104
Edwards 97 131
Fine 51 78
Fowler 48 74
Gouverneur 54 62
Hammond 76 88
Hermon 93 136
Hopkinton 100 137
Lawrence 69 92
Lisbon 203 285
Louisville 40 44
Macomb 89 99
Madrid 77 130
Massena 32 34
Morristown 114 159
Norfolk 67 75
Ogdensburg City 6 8
Oswegatchie 61 84
Parishville 126 187
Piercefield 32 51
Pierrepont 57 81
Pitcairn 57 78
Potsdam 183 325
Rossie 32 39
Russell 124 231
Stockholm 88 153
Waddington 94 141
2,657 3,827Total
STEUBEN
Addison 153 279
Avoca 128 265
Bath 339 616
Bradford 110 194
Cameron 231 476
Campbell 126 194
Canisteo 274 499
Caton 132 296
Cohocton 153 288
Corning 119 202
Corning City 2 4
Dansville 148 273
Erwin 102 153
Fremont 62 99
Greenwood 210 564
Hartsville 172 367
Hornby 129 209
Hornell City 21 26
Hornellsville 185 366
Howard 203 407
Jasper 174 452
Lindley 168 314
Prattsburg 196 374
Pulteney 96 215
Rathbone 132 206
Thurston 131 226
Troupsburg 188 420
Tuscarora 67 124
Urbana 123 220
Wayland 103 180
Wayne 94 295
West Union 126 358
Wheeler 124 238
Woodhull 266 572
4,987 9,971Total
SUFFOLK
Babylon 6 24
Brookhaven 274 706
East Hampton 148 444
Huntington 104 253
Islip 6 18
Riverhead 170 438
Shelter Island 52 211
Smithtown 39 69
Southampton 229 622
Southold 177 612
1,205 3,397Total
SULLIVAN
Bethel 203 365
Callicoon 159 285
Cochecton 126 209
Delaware 101 200
Fallsburgh 134 215
Forestburg 47 51
Fremont 114 197
Highland 83 110
Liberty 196 312
Lumberland 62 69
Mamakating 128 281
Neversink 166 347
Rockland 147 240
Thompson 139 170
Tusten 106 155
1,911 3,206Total
TIOGA
Barton 166 317
Berkshire 79 185
Candor 266 559
Newark Valley 124 302
Nichols 143 219
Owego 356 644
Richford 83 147
Spencer 141 265
Tioga 72 171
1,430 2,809Total
TOMPKINS
Caroline 141 269
Danby 185 376
Dryden 235 518
Enfield 92 178
Groton 120 334
Ithaca 100 183
Ithaca City 0 0
Lansing 168 411
Newfield 215 419
Ulysses 127 282
1,383 2,970Total
ULSTER
Denning 80 106
Esopus 93 168
Gardiner 73 184
Hardenburgh 81 97
Hurley 37 60
Kingston 15 27
Kingston City 0 3
Lloyd 63 115
Marbletown 129 267
Marlborough 61 144
New Paltz 83 157
Olive 121 196
Plattekill 48 111
Rochester 129 239
Rosendale 44 104
Saugerties 127 212
Shandaken 98 110
Shawangunk 173 357
Ulster 24 46
Wawarsing 202 339
Woodstock 66 100
1,747 3,142Total
WARREN
Bolton 60 84
Chester 53 83
Hague 48 62
Horicon 40 56
Johnsburg 88 123
Lake George 38 52
Lake Luzerne 29 51
Queensbury 49 72
Stony Creek 39 51
Thurman 48 71
Warrensburg 54 78
546 783Total
WASHINGTON
Argyle 109 178
Cambridge 191 331
Dresden 54 76
Easton 141 357
Fort Ann 132 201
Fort Edward 23 31
Granville 163 269
Greenwich 146 272
Hampton 78 90
Hartford 61 94
Hebron 162 238
Jackson 79 231
Kingsbury 35 44
Putnam 62 85
Salem 199 379
White Creek 81 212
Whitehall 120 156
1,836 3,244Total
WAYNE
Arcadia 175 446
Butler 110 268
Galen 204 528
Huron 96 287
Lyons 163 409
Macedon 160 386
Marion 117 263
Ontario 162 417
Palmyra 154 395
Rose 83 235
Savannah 102 269
Sodus 246 652
Walworth 131 303
Williamson 88 264
Wolcott 161 453
2,152 5,575Total
WESTCHESTER
Bedford 48 153
Cortlandt 59 148
Eastchester 0 2
Greenburgh 2 19
Harrison 13 33
Lewisboro 21 59
Mount Kisco 2 9
Mount Pleasant 17 44
Mount Vernon Ci 0 2
New Castle 13 43
New Rochelle Ci 0 4
North Castle 12 21
North Salem 14 49
Ossining 19 47
Peekskill City 3 5
Pound Ridge 22 111
Rye 4 14
Rye City 1 6
Somers 38 114
White Plains Ci 2 2
Yonkers City 5 6
Yorktown 81 202
376 1,093Total
WYOMING
Arcade 211 488
Attica 203 478
Bennington 242 546
Castile 130 325
Covington 94 247
Eagle 152 400
Gainesville 202 497
Genesee Falls 136 328
Java 189 459
Middlebury 265 579
Orangeville 109 278
Perry 141 299
Pike 162 376
Sheldon 160 440
Warsaw 266 654
Wethersfield 142 381
2,804 6,775Total
YATES
Barrington 248 670
Benton 126 360
Italy 192 430
Jerusalem 406 1,055
Middlesex 221 534
Milo 148 335
Potter 223 568
Starkey 157 478
Torrey 61 131
1,782 4,561Total
Statewide Totals
Male Adults 99,572
Male Fawns 15,389
Female Adults 75,157
Female Fawns 12,855
Total 202,973
Page 12

Adult BuckTake Density
2015 Bucks Takenper Square Mile
0 - 1.0
1.1 - 2.0
2.1 - 3.0
3.1 - 4.0
4.0 - 6.0
> 6.1
No Deer Hunting
County2014
2014
Antlerless DeerTake Density
2015Deer Takenper Square Mile
0.1 - 1.0
1.1 - 2.0
2.1 - 4.0
4.1 - 6.0
6.1 - 8.0
> 8.1
No Deer Hunting
County
Page 13

NEW YORK STATE DEPARTEMENT OF ENVIRONMENTAL CONSERVATION
2015 Youth Deer Hunt New York’s third Youth Deer Hunt was held over Columbus Day weekend, October 11‐13, 2014. During the youth deer hunt, 14‐15 year old junior hunters could take 1 deer, antlered or antlerless, with a firearm when properly accompanied by a licensed and experienced adult mentor. See the Youth Deer Hunt Photo Gallery for pictures of successful junior hunters.
Key Results:
1,222 deer taken (51% antlered and 49% antlerless deer) 7,931 junior hunters participated, approximately 67% of
eligible junior hunters Average harvest density was 2.7 deer per 100 square miles
Estimated deer harvest during the 2015 Youth Deer Hunt in New York.
Zone and Tag Type Adult Male
Fawn Male
Adult Female
Fawn Female
Total
Northern Zone
Regular Big Game 79 2 24 1 106 Deer Management Permit 1 2 25 2 30
Northern Total 80 4 49 3 136 Southern Zone
Regular Big Game 519 14 167 13 713 Deer Management Permit 18 25 307 23 373
Southern Total 537 39 474 36 1,086 Statewide
Regular Big Game 598 16 191 14 819 Deer Management Permit 19 27 332 25 403
New York State Total 617 43 523 39 1,222
Jacob Unser, Columbia County, 2015 Youth Deer Hunt.
Page 14

NEW YORK STATE
DEPARTMENT OF ENVIRONMENTAL CONSERVATION
Deer Harvest by Age
Note: samples from Long Island are included in the state totals only. DEC determines deer age by examining tooth wear and replacement patterns of hunter‐killed deer in each WMU. In 2015, DEC checked 13,936 deer throughout New York.
45%50%55%60%65%70%75%
Yearling portion of NYS Buck Take
0%
25%
50%
75%Adult Buck Take by Age
1.5 2.5 ≥ 3.5
0%
25%
50%
75%Adult Doe Take by Age
1.5 2.5 ≥ 3.5
0%
10%
20%
30%
40%
50%
60%
1.5 2.5 3.5 ≥4.5 1.5 2.5 3.5 ≥4.5 1.5 2.5 3.5 ≥4.5 1.5 2.5 3.5 ≥4.5
Northern Southeastern Central‐Western State Total
2015 Deer Take
Bucks Does
0.0
0.5
1.0
1.5
2.0
≥ 2.5 Year Old Bucks Taken / Mi2
Northern Southeastern Central‐Western
0.0
1.0
2.0
3.0
1.5 Year Old Bucks Taken / Mi2
Northern Southeastern Central‐Western
Page 15

NEW YORK STATE
DEPARTMENT OF ENVIRONMENTAL CONSERVATION
Antler Point Distribution by Buck Age Class ‐ 2015
Indices of Relative Deer Herd Condition and Habitat Quality
Note: samples from Long Island are included in the state total only. Antler point and age data are generated through examination of hunter‐killed deer in each WMU by DEC staff. In 2015, DEC checked 13,936 deer throughout New York.
16
17
18
19
20
21Yearling Antler Beam Diameter (mm)
Northern Southeastern Central‐Western
0%
10%
20%
30%
40%
50%
% Yearling Bucks with Legal Spike Antlers (≥ 3 inches long)
Northern Southeastern Central‐Western
0%10%20%30%40%50%60%
2 3 4 5 6 7 8 9 10 11 ≥12
Antler Points
New York State1.52.5≥ 3.5
n = 4,978
0%10%20%30%40%50%60%
2 3 4 5 6 7 8 9 10 11 ≥12
Antler Points
Southeastern NY1.52.5≥ 3.5
n = 1,665
0%10%20%30%40%50%60%
2 3 4 5 6 7 8 9 10 11 ≥12
Antler Points
Northern NY1.52.5≥ 3.5
n = 621
0%10%20%30%40%50%60%
2 3 4 5 6 7 8 9 10 11 ≥12
Antler Points
Central‐Western NY1.52.5≥ 3.5
n = 2,663
Page 16

Note: Southern Zone includes Westchester County, where bowhunting season ended 12/31/15.
NEW YORK STATE
DEPARTMENT OF ENVIRONMENTAL CONSERVATION
Reported Deer Take by Day ‐ 2015
0%
5%
10%
15%
20%
25%
10/1 10/8 10/15 10/22 10/29 11/5 11/12 11/19 11/26 12/3 12/10 12/17 12/24 12/31
% of Rep
orted
Total (all season
s)
Southern Zone
< 0.1%
0%
1%
2%
3%
4%
5%
6%
7%
8%
9/27 10/4 10/11 10/18 10/25 11/1 11/8 11/15 11/22 11/29 12/6 12/13
% of Rep
orted
Total (all season
s)
Northern Zone
0%
2%
4%
6%
10/1 10/8 10/15 10/22 10/29 11/5 11/12 11/19
% of Bow Take
Southern Zone Early Bow Season
Page 17

NZ SE CW SE CW
46.6 46.0 45.7 39.1 43.3 44.0
45.4 43.4 46.1 42.1 42.0 44.4
Note: NYS laws and regulations require all successful deer hunters to report their harvest within 7 days.
Bow
48,207
23.8%
21.2%
Deer Take by Implement
2015
Average
(2010 ‐ 2014)
Deer
Management
Assistance
Program
84.0
83.8
Bow &
Muzzleloader
46.4
46.0
NEW YORK STATE
DEPARTMENT OF ENVIRONMENTAL CONSERVATION
Deer Hunter Reporting Rates
Regular Big Game DMP Total
MuzzleloaderRifle & Shotgun
Estimated Take 128,300 18,044
2015
7,469
3.7%
0.7%
CrossbowHandgun
954
Note: Estimated take is a rough approximation obtained by multiplying the proportion of reported take (for each implement type) by the total calculated harvest. Bows and muzzleloaders were legal implements during the Regular Firearms season and the bowhunting and muzzleloader seasons.
% of Reported Take
5‐year Average %
(2010 ‐ 2014)
63.2%
66.0%
8.9%
11.6%
0.5%
0.7%
± 0.0 %
± 0.5 %
± 1.0 %
± 1.5 %
± 2.0 %
± 2.5 %
± 3.0 %
0%
20%
40%
60%
80%
100%
Reporting Rate & Precision of Harvest Estimate
ReportingRate
95% Confidence Interval
Page 18

1st 2nd Bonus Total
1C 903.3 Maximize 4,450 8,625 973 14,048 15.6 1,869 2.1 13.3%3A 694.3 0 0 0 0 0.0 0 0.0 NA3C 316.1 2,000 2,000 0 2,000 6.3 256 0.8 12.8%3F 331.7 5,600 2,555 3,180 5,735 17.3 545 1.6 9.5%3G 457.1 3,100 3,094 0 3,094 6.8 359 0.8 11.6%3H 554.1 1,600 1,599 0 1,599 2.9 335 0.6 21.0%3J 355.6 5,500 3,776 1,819 5,595 15.7 650 1.8 11.6%3K 381.0 150 151 0 151 0.4 16 0.0 10.6%3M 749.2 42,900 17,442 25,428 42,870 57.2 3,699 4.9 8.6%3N 222.8 3,100 2,176 1,024 3,200 14.4 306 1.4 9.6%3P 125.1 700 693 0 693 5.5 36 0.3 5.2%3R 206.1 2,500 613 1,145 1,758 8.5 187 0.9 10.6%3S 430.8 Maximize 1,792 3,409 104 5,305 12.3 569 1.3 10.7%4A 430.1 1,800 1,800 0 1,800 4.2 423 1.0 23.5%4B 161.5 2,500 1,739 981 2,720 16.8 296 1.8 10.9%4C 164.8 1,000 988 0 988 6.0 221 1.3 22.4%4F 1,161.0 13,500 13,979 0 13,979 12.0 2,682 2.3 19.2%4G 370.5 2,000 1,968 0 1,968 5.3 378 1.0 19.2%4H 289.8 1,300 1,300 0 1,300 4.5 268 0.9 20.6%4J 148.9 Maximize 468 1,994 58 2,520 16.9 254 1.7 10.1%4K 255.9 1,000 1,000 0 1,000 3.9 198 0.8 19.8%4L 220.8 0 0 0 0 0.0 0 0.0 NA4O 760.5 1,900 1,898 0 1,898 2.5 537 0.7 28.3%4P 361.4 1,850 1,937 0 1,937 5.4 353 1.0 18.2%4R 290.2 1,300 1,280 0 1,280 4.4 247 0.9 19.3%4S 220.0 300 294 0 294 1.3 72 0.3 24.5%4T 131.8 4,100 1,963 2,389 4,352 33.0 491 3.7 11.3%4U 127.0 100 94 0 94 0.0 21 0.2 22.3%4W 443.2 1,700 1,674 0 1,674 3.8 330 0.7 19.7%4Y 176.5 2,900 2,815 84 2,899 16.4 404 2.3 13.9%4Z 250.7 400 396 0 396 0 67 0.3 16.9%5A 609.8 NA NA NA NA NA NA NA NA5C 1,125.7 NA NA NA NA NA NA NA NA5F 1,328.3 NA NA NA NA NA NA NA NA5G 1,112.6 NA NA NA NA NA NA NA NA5H 3,046.5 NA NA NA NA NA NA NA NA5J 674.3 NA NA NA NA NA NA NA NA5R 373.0 7,500 4,888 3,434 8,322 22.3 838 2.2 10.1%5S 421.9 1,200 1,331 0 1,331 3.2 281 0.7 21.1%5T 223.4 0 0 0 0 0 0 0.0 NA6A 1,471.7 0 0 0 0 0.0 0 0.0 NA6C 976.7 1,600 1,573 0 1,573 1.6 270 0.3 17.2%6F 1,213.0 NA NA NA NA NA NA NA NA6G 933.2 14,000 8,938 5,045 13,983 15.0 2,035 2.2 14.6%6H 172.6 700 691 0 691 4.0 48 0.3 6.9%6J 1,576.3 NA NA NA NA NA NA NA NA6K 1,161.2 4,800 4,800 0 4,800 4.1 764 0.7 15.9%6N 491.4 NA NA NA NA NA NA NA NA6P 203.0 4,500 1,710 2,780 4,490 22.1 359 1.8 8.0%6R 541.8 5,800 5,725 412 6,137 11.3 768 1.4 12.5%6S 589.1 5,500 5,077 766 5,843 9.9 1,029 1.7 17.6%
WMU
DEPARTMENT OF ENVIRONMENTAL CONSERVATION
NEW YORK STATE
Deer Management Permit Summary ‐ 2015
Area (mi2)
DMPs
Issued per
mi2
DMP Take
per mi2DMP Take
Total DMPs IssuedDMP Target
DMP
Success
Page 19

1st 2nd Bonus TotalWMU Area (mi
2)
DMPs
Issued per
mi2
DMP Take
per mi2DMP Take
Total DMPs IssuedDMP Target
DMP
Success
7A 544.9 6,300 6,274 159 6,433 11.8 856 1.6 13.3%7F 687.2 29,000 11,566 17,629 29,195 42.5 2,002 2.9 6.9%7H 357.2 14,700 6,717 8,027 14,744 41.3 1,215 3.4 8.2%7J 838.9 37,400 13,397 24,243 37,640 44.9 3,518 4.2 9.3%7M 1,242.3 19,300 18,039 2,711 20,750 16.7 2,816 2.3 13.6%7P 484.8 3,000 2,972 0 2,972 6.1 451 0.9 15.2%7R 739.3 21,900 6,918 15,147 22,065 29.8 1,964 2.7 8.9%7S 662.7 8,700 8,992 0 8,992 13.6 1,076 1.6 12.0%8A 419.0 14,400 7,489 6,934 14,423 34.4 1,668 4.0 11.6%8C 138.1 Maximize 267 402 88 757 5.5 170 1.2 22.5%8F 733.0 39,100 12,187 15,964 28,151 38.4 3,316 4.5 11.8%8G 686.2 44,900 13,412 18,468 31,880 46.5 3,868 5.6 12.1%8H 574.0 27,200 10,578 13,188 23,766 41.4 3,976 6.9 16.7%8J 711.9 25,100 9,041 11,798 20,839 29.3 2,480 3.5 11.9%8M 307.4 6,900 5,141 2,531 7,672 25.0 1,319 4.3 17.2%8N 314.3 28,500 11,627 16,421 28,048 89.2 2,898 9.2 10.3%8P 356.2 3,000 2,969 0 2,969 8.3 390 1.1 13.1%8R 270.0 17,500 6,206 11,377 17,583 65.1 2,454 9.1 14.0%8S 256.2 3,300 3,058 473 3,531 13.8 559 2.2 15.8%8T 385.2 1,500 1,477 0 1,477 3.8 380 1.0 25.7%8W 439.5 3,300 3,278 0 3,278 7.5 504 1.1 15.4%8X 400.5 8,100 6,837 1,746 8,583 21.4 1,438 3.6 16.8%8Y 354.2 4,500 4,797 0 4,797 13.5 754 2.1 15.7%9A 461.6 19,600 6,679 10,646 17,325 37.5 1,158 2.5 6.7%9F 277.0 14,000 5,622 8,416 14,038 50.7 1,007 3.6 7.2%9G 229.9 7,300 1,893 5,176 7,069 30.7 749 3.3 10.6%9H 973.1 30,700 13,891 18,371 32,262 33.2 4,413 4.5 13.7%9J 693.6 13,300 10,050 3,990 14,040 20.2 2,254 3.2 16.1%9K 446.4 4,400 4,363 0 4,363 9.8 1,007 2.3 23.1%9M 329.7 6,600 6,897 0 6,897 20.9 1,112 3.4 16.1%9N 207.1 4,000 3,986 0 3,986 19.2 631 3.0 15.8%9P 581.5 3,100 3,100 0 3,100 5.3 741 1.3 23.9%9R 217.6 700 686 0 686 3.2 134 0.6 19.5%9S 91.5 500 493 0 493 5.4 49 0.5 9.9%9T 248.4 700 700 0 700 2.8 118 0.5 16.9%9W 250.1 3,100 3,100 0 3,100 12.4 503 2.0 16.2%9X 219.1 600 600 0 600 2.7 162 0.7 27.0%9Y 124.8 2,800 2,868 0 2,868 23.0 357 2.9 12.4%
Total (units with a target) 629,400 341,857 261,902 603,759 19.0 74,066 2.3 12.3%
Total (all units) 348,834 276,332 1,223 626,389 18.2 76,928 2.2 12.3%
Note: DMP targets are not established for Long Island (WMU 1C), bowhunting‐only units (WMUs 3S, 4J, 8C), or in Adirondack units where DMPs cannot be offered ( WMUs 5A, 5C, 5F, 5G, 5H, 5J, 6F, 6J, and 6N).
0%
5%
10%
15%
20%
25%
0100200300400500600700800
2002 2003 2004 2005 2006 2007 2008 2009 2010 2011 2012 2013 2014 2015
Success
# DMPs
Thou
sand
s
NYS Deer Management Permits
DMPs Issued DMP Success
Page 20

Statewide Summary 2007‐2015
Year
2007 4.12008 4.02009 3.72010 5.22011 4.72012 4.72013 5.22014 5.82015 4.9
2015 DMAP Summary by DEC Region
1 3 4 5 6 7 8 9 Total
Applications
Approved2 145 148 190 207 175 912 441 2,220
Deer Take 163 846 1040 959 1,334 988 3,467 2050 10,847
Average Deer Take
per Permit1 81.5 5.8 7.0 5.0 6.4 5.6 3.8 4.6 4.9
2015 DMAP Summary by DEC Region and Type of Complaint
1 3 4 5 6 7 8 9 Total
Agriculture 0 93 113 142 220 150 844 342 1,904
Municipal 1 2 2 0 2 0 3 2 12
Significant Natural
Community0 4 1 1 1 3 0 2 12
Forest Regeneration 1 40 26 41 27 17 58 92 302
Custom Deer Mgmt 0 6 6 6 11 5 7 3 44
DEC Region
Category2DEC Region
1 The number of carcass tags with each DMAP permit varies by need and property size. Individual hunters may generally only use 2 DMAP tags per permit unless specified on the permit.2 Permits may be issued for more than one category of complaint, so the sum of categories may not equal total applications approved in each region.
2,345 22,661 12,2852,190 21,222 12,627
2,312 21,720 10,7672,231 20,927 10,497
10,0102,616 26,275 9,7892,364 21,957 12,384
2,220 22,353 10,847
NEW YORK STATE
DEPARTMENT OF ENVIRONMENTAL CONSERVATION
Deer Management Assistance Program (DMAP)
The Deer Management Assistance Program enables DEC to help landowners and resource managers implement site specific deer management on their lands. DMAP permits are valid for use only during the open deer hunting seasons and can only be used by licensed hunters. More information about DMAP can be found at www.dec.ny.gov/animals/33973.html.
Permits Tags Issued Deer Harvested
Average # Deer Taken
per Permit
2,449 25,048 10,1362,490 25,215
Page 21

Statewide Summary 2007‐2015
2015 Deer Damage Summary by DEC Region
1 3 4 5 6 7 8 9 Total124 166 75 47 50 137 772 237 1,6081285 651 247 39 125 626 1,891 724 5,58810.4 3.9 3.3 0.8 2.5 4.6 2.4 3.1 3.5
2015 Deer Damage Summary by DEC Region and Type of Complaint
1 3 4 5 6 7 8 9 Total*3 8 2 0 6 1 7 6 33
147 124 82 40 41 154 1207 192 1,98758 76 25 24 8 52 216 45 50490 40 6 5 0 28 41 27 23720 1 0 0 0 3 0 0 240 5 0 4 1 0 0 0 10
* Permits may be issued for more than one category of damage, so the sum of permit categories may not equal the total.
Average Take per
PermitReported TakePermits IssuedYear
2007 1,143 3,708 3.2
AirportAgricultureTree Farm
Community / ResidentialEcological
Other
DEC Region
Permits IssuedReported Deer Take
Average Take per Permit
CategoryDEC Region
2014 1,684 6,076 3.62015 1,608 5,588 3.5
2012 1,544 5,046 3.32013 1,640 5,104 3.1
2010 1,337 4,445 3.32011 1,481 5,007 3.4
4,070 3.32009 1,358 4,468 3.32008 1,239
NEW YORK STATE
Deer Damage Permit Summary
Deer Damage Permits (DDPs) are issued by DEC to reduce deer‐related damage on individual properties while damage is occurring, generally outside of hunting seasons. DDPs typically authorize removal of antlerless deer only, though take of antlered deer is authorized for some permits. DDPs authorize deer culling, not deer hunting. The reported take on DDPs is not included in annual deer harvest totals. More information can be found at http://www.dec.ny.gov/animals/104956.html.
DEPARTMENT OF ENVIRONMENTAL CONSERVATION
0255075
100125150175
# Antlerless Deer Thou
sand
s
Antlerless Deer Take by Permit Type
DDP*
DMAP Hunting
Other Hunting(DMPs, Bow,Muzzleloader)
* DDP take may include asmall fraction of antlered deer
Page 22

DEPARTMENT OF ENVIRONMENTAL CONSERVATION
Statewide TotalCALCULATED LEGAL DEER TAKE IN NEW YORK STATE
NEW YORK STATE
YEAR ADULTS FAWNS ADULTS FAWNS TOTAL
..............MALES............ ...........FEMALES.........
2015 99,572 15,389 75,157 12,855 202,973
2014 108,604 20,848 90,321 18,899 238,672
2013 114,716 22,395 88,634 17,822 243,567
2012 118,993 20,263 86,644 17,057 242,957
2011 110,002 19,793 82,090 16,474 228,359
2010 106,960 21,131 84,806 17,203 230,100
2009 102,057 19,710 84,330 16,701 222,798
2008 105,747 20,000 79,953 17,279 222,979
2007 104,451 21,096 76,367 17,227 219,141
2006 96,569 18,336 60,102 14,101 189,108
2005 89,015 16,373 61,179 13,647 180,214
2004 88,733 21,022 80,196 18,455 208,406
2003 107,533 26,883 94,376 24,296 253,088
2002 128,292 36,958 113,317 29,649 308,216
2001 127,084 31,414 100,800 22,572 281,870
2000 140,857 31,317 98,265 25,420 295,859
1999 125,392 26,305 84,432 19,830 255,959
1998 121,911 23,652 67,672 17,523 230,758
1997 119,090 21,811 58,772 17,163 216,836
1996 104,689 22,781 59,161 16,134 202,765
1995 113,566 16,670 45,648 12,400 188,284
1994 89,328 18,460 45,106 12,789 165,683
1993 102,431 26,408 71,340 20,109 220,288
1992 117,984 28,257 64,385 22,518 233,144
1991 110,701 24,326 58,765 18,841 212,633
1990 103,258 20,314 51,757 15,481 190,810
1989 99,589 20,600 45,623 16,067 181,879
1988 92,987 23,804 58,464 18,209 193,464
1987 97,595 25,883 59,577 21,660 204,715
1986 90,719 21,622 48,665 17,707 178,713
1985 80,732 17,167 36,972 14,212 149,083
1984 77,596 21,676 53,174 17,864 170,310
1983 79,746 20,082 51,111 16,510 167,449
1982 78,460 24,436 62,338 20,221 185,455
1981 83,669 19,558 46,962 16,133 166,322
1980 75,441 14,177 35,100 11,537 136,255
Page 23

YEAR ADULTS FAWNS ADULTS FAWNS TOTAL
..............MALES............ ...........FEMALES.........
1979 59,086 7,855 20,685 6,433 94,059
1978 51,872 7,549 19,921 6,217 85,559
1977 55,880 6,407 15,631 5,286 83,204
1976 54,879 7,808 21,140 6,388 90,215
1975 59,055 9,496 26,937 7,737 103,225
1974 63,266 8,944 23,786 7,307 103,303
1973 49,979 5,849 14,776 4,775 75,379
1972 41,071 3,571 8,130 2,866 55,638
1971 35,821 3,109 6,852 2,508 48,290
1970 36,538 6,450 16,648 5,377 65,013
1969 48,064 8,668 24,061 7,336 88,129
1968 54,010 8,063 23,219 6,873 92,165
1967 51,291 5,684 16,790 4,890 78,655
1966 43,936 6,550 18,121 5,550 74,157
1965 43,846 5,379 13,670 4,525 67,420
1964 35,814 5,444 14,958 4,540 60,756
1963 37,195 6,071 15,496 5,105 63,867
1962 38,782 4,718 15,246 4,035 62,781
1961 36,905 4,490 13,201 3,858 58,454
1960 34,065 1,924 8,079 1,687 45,755
1959 29,606 2,817 7,368 2,515 42,306
1958 35,684 6,815 18,168 5,802 66,469
1957 41,367 7,668 17,214 6,428 72,677
1956 35,592 9,157 19,993 7,573 72,315
1955 40,082 5,250 9,999 4,201 59,532
New York State Deer Harvest
0
50,000
100,000
150,000
200,000
250,000
300,000
350,000
1955
1957
1959
1961
1963
1965
1967
1969
1971
1973
1975
1977
1979
1981
1983
1985
1987
1989
1991
1993
1995
1997
1999
2001
2003
2005
2007
2009
2011
2013
2015
Adult Male
Adult Female
Total
Page 24

NEW YORK STATE DEPARTMENT OF ENVIRONMENTAL CONSERVATION
2015 Deer Hunting Season Maps
Page 25

NEW YORK STATE DEPARTMENT OF ENVIRONMENTAL CONSERVATION
2015 Deer Hunting Season Maps
Page 26