Embed Size (px)
Citation preview

PENDERGAST ELEMENTARY SCHOOL DISTRICT NO. 92
Comprehensive Annual Financial Report
for the Fiscal Year Ended June 30, 2010
3802 North 91st Avenue • Phoenix, Arizona 85037
PENDERGAST ELEMENTARY SCHOOL DISTRICT NO. 92
PHOENIX, ARIZONA
COMPREHENSIVE ANNUAL FINANCIAL REPORT FOR THE FISCAL YEAR ENDED JUNE 30, 2010
Issued by: Business and Finance Department
PENDERGAST ELEMENTARY SCHOOL DISTRICT NO. 92
TABLE OF CONTENTS
INTRODUCTORY SECTION Page Letter of Transmittal i ASBO Certificate of Excellence vi GFOA Certificate of Achievement vii Organizational Chart viii List of Principal Officials ix FINANCIAL SECTION INDEPENDENT AUDITORS' REPORT 1 MANAGEMENT’S DISCUSSION AND ANALYSIS (MD&A) (Required Supplementary Information) 5 BASIC FINANCIAL STATEMENTS
Government-Wide Financial Statements:
Statement of Net Assets 18 Statement of Activities 19
Fund Financial Statements: Balance Sheet - Governmental Funds 22 Reconciliation of the Balance Sheet - Governmental Funds to the Statement of Net Assets 25 Statement of Revenues, Expenditures and Changes in Fund Balances - Governmental Funds 26 Reconciliation of the Statement of Revenues, Expenditures and Changes in Fund Balances - Governmental Funds to the Statement of Activities 28

PENDERGAST ELEMENTARY SCHOOL DISTRICT NO. 92
TABLE OF CONTENTS (Cont’d)
FINANCIAL SECTION (Cont’d) Page BASIC FINANCIAL STATEMENTS (Concl’d)
Statement of Fiduciary Assets and Liabilities 29
Notes to Financial Statements 30
SCHEDULE OF REVENUES, EXPENDITURES AND CHANGES IN FUND BALANCES-BUDGET AND ACTUAL (Required Supplementary Information)
General Fund 48 Note to Required Supplementary Information 49
COMBINING AND INDIVIDUAL FUND FINANCIAL STATEMENTS AND SCHEDULES
Other Major Governmental Funds Schedule of Revenues, Expenditures and
Changes in Fund Balances - Budget and Actual: Debt Service Fund 54 Bond Building Fund 55
Non-Major Governmental Funds: Combining Balance Sheet - All Non-Major Governmental Funds - By Fund Type 58 Combining Statement of Revenues, Expenditures and Changes in Fund Balances - All Non-Major Governmental Funds - By Fund Type 59
Non-Major Special Revenue Funds: Combining Balance Sheet 62 Combining Statement of Revenues, Expenditures and Changes in Fund Balances 70 Combining Schedule of Revenues, Expenditures and Changes in Fund Balances - Budget and Actual 78
PENDERGAST ELEMENTARY SCHOOL DISTRICT NO. 92
TABLE OF CONTENTS (Cont’d)
FINANCIAL SECTION (Concl’d) Page COMBINING AND INDIVIDUAL FUND FINANCIAL STATEMENTS AND SCHEDULES (Concl’d)
Non-Major Capital Projects Funds:
Combining Balance Sheet 102 Combining Statement of Revenues, Expenditures and Changes in Fund Balances 104 Combining Schedule of Revenues, Expenditures and Changes in Fund Balances - Budget and Actual 106
Agency Funds: Combining Statement of Fiduciary Assets and Liabilities 112 Combining Statement of Changes in Fiduciary Assets and Liabilities 113
STATISTICAL SECTION Financial Trends:
Net Assets by Component 117 Expenses, Program Revenues, and Net (Expense)/Revenue 118 General Revenues and Total Changes in Net Assets 120 Fund Balances – Governmental Funds 122 Governmental Funds Revenues 123 Governmental Funds Expenditures and Debt Service Ratio 124 Other Financing Sources and Uses and Net Changes in Fund Balances – Governmental Funds 126
PENDERGAST ELEMENTARY SCHOOL DISTRICT NO. 92
TABLE OF CONTENTS (Concl’d)
STATISTICAL SECTION (Concl’d) Page Revenue Capacity:
Assessed Value and Estimated Actual Value of Taxable Property 127 Direct and Overlapping Property Tax Rates 128 Principal Property Taxpayers 129 Property Tax Levies and Collections 130
Debt Capacity:
Outstanding Debt by Type 131 Direct and Overlapping Governmental Activities Debt 132 Legal Debt Margin Information 133
Demographic and Economic Information:
County-Wide Demographic and Economic Statistics 134 Principal Employers 135
Operating Information: Full-Time Equivalent District Employees by Type 136 Operating Statistics 138 Capital Assets Information 139

(This page intentionally left blank)

INTRODUCTORY SECTION

(This page intentionally left blank)
i
December 3, 2010 Citizens and Governing Board Pendergast Elementary School District 3802 North 91st Avenue Phoenix, Arizona 85037 State law mandates that school districts required to undergo an annual single audit publish a complete set of financial statements presented in conformity with accounting principles generally accepted in the United States of America and audited in accordance with auditing standards generally accepted in the United States of America by a certified public accounting firm licensed in the State of Arizona. Pursuant to that requirement, we hereby issue the Comprehensive Annual Financial Report of the Pendergast Elementary School District for the fiscal year ended June 30, 2010.
This report consists of management’s representations concerning the finances of the District. Consequently, management assumes full responsibility for the completeness and reliability of all of the information presented in this report. To provide a reasonable basis for making these representations, management of the District has established a comprehensive internal control framework that is designed both to protect the District’s assets from loss, theft, or misuse and to compile sufficient reliable information for the preparation of the District’s financial statements in conformity with accounting principles generally accepted in the United States of America. Because the cost of internal controls should not outweigh their benefits, the District’s comprehensive framework of internal controls has been designed to provide reasonable rather than absolute assurance that the financial statements will be free of material misstatement. As management, we assert that, to the best of our knowledge and belief, this financial report is complete and reliable in all material respects.
The District’s financial statements have been audited by Heinfeld, Meech & Co., P.C., a certified public accounting firm. The goal of the independent audit was to provide reasonable assurance that the financial statements of the District for the fiscal year ended June 30, 2010, are free of material misstatement. The independent audit involved examining, on a test basis, evidence supporting the amounts and disclosures in the financial statements; assessing the accounting principles used and significant estimates made by management; and evaluating the overall financial statement presentation. The independent auditors concluded, based upon the audit, that there was a reasonable basis for rendering an unqualified opinion that the District’s financial statements for the fiscal year ended June 30, 2010, are fairly presented in conformity with accounting principles generally accepted in the United States of America. The independent auditors’ report is presented as the first component of the financial section of this report.
ii
The independent audit of the financial statements of the District was part of a broader, federally mandated Single Audit as required by the provisions of the Single Audit Act Amendments of 1996 and U.S. Office of Management and Budget Circular A-133, Audits of States, Local Governments and Non-Profit Organizations designed to meet the special needs of federal grantor agencies. The standards governing Single Audit engagements require the independent auditor to report not only on the fair presentation of the financial statements, but also on the District’s internal controls and compliance with legal requirements, with special emphasis on internal controls and legal requirements involving the administration of federal awards. These reports are available in a separately issued Single Audit Reporting Package. Accounting principles generally accepted in the United States of America require that management provide a narrative introduction, overview, and analysis to accompany the basic financial statements in the form of Management’s Discussion and Analysis (MD&A). This letter of transmittal is designed to complement the MD&A and should be read in conjunction with it. The District’s MD&A can be found immediately following the report of the independent auditors. PROFILE OF THE DISTRICT The District is one of 58 public school districts located in Maricopa County, Arizona. It provides a program of public education from pre-kindergarten through grade eight, with an estimated current enrollment of 9,961 students. The District’s Governing Board is organized under Section 15-321 of the Arizona Revised Statutes (A.R.S.). Management of the District is independent of other state or local governments. The County Treasurer collects taxes for the District but exercises no control over its expenditures/ expenses. The membership of the Governing Board consists of five members elected by the public. Under existing statutes, the Governing Board’s duties and powers include, but are not limited to, the acquisition, maintenance and disposition of school property; the development and adoption of a school program; and the establishment, organization and operation of schools. The Board also has broad financial responsibilities, including the approval of the annual budget, and the establishment of a system of accounting and budgetary controls. The financial reporting entity consists of a primary government and its component units. A component unit is a legally separate entity that must be included in the reporting entity in conformity with generally accepted accounting principles. The District is a primary government because it is a special-purpose government that has a separately elected governing body, is legally separate, and is fiscally independent of other state or local governments. Furthermore, there are no component units combined with the District for financial statement presentation purposes, and the District is not included in any other governmental reporting entity. Consequently, the District’s financial statements include only the funds of those organizational entities for which its elected governing board is financially accountable. The District’s major operations include education, student transportation, construction and maintenance of District facilities, and food services. The District, established in 1888, is located in Maricopa County, Arizona (the County) and encompasses an area of approximately 19.75 square miles in the Phoenix metropolitan area. Portions of the Cities of Phoenix, Glendale and Avondale overlap the District’s boundaries. The District primarily consists of residential areas for people working in the surrounding Cities of Phoenix,
iii
Glendale, Avondale, Goodyear, Tolleson and Litchfield Park. Prior to the residential development of the area, agriculture was the major contributor to the economy of the District. Interstate 10, located directly south of the District, is the main route to the City of Los Angeles, California from Phoenix and provides for easy access to the District. Within a few miles of the boundaries of the District are corporate divisions of AT&T Technology, Lockheed-Martin, Revlon and Coca-Cola Bottling Company. The District is included in the area served by the Tolleson Union High School District No. 214. The population of the District is estimated at 83,000. The District currently has 670 full-time and part-time certified employees, and 580 full-time and part-time classified employees. The annual expenditure budget serves as the foundation for the District’s financial planning and control. The objective of these budgetary controls is to ensure compliance with legal provisions embodied in the annual expenditure budget approved by the District’s Governing Board. The expenditure budget is prepared by fund for all Governmental Funds, and includes function and object code detail for the General Fund, and some Special Revenue and Capital Projects Funds. The legal level of budgetary control (the level at which expenditures cannot exceed the appropriated amount) is established at the individual fund level for all funds. Funds that are not required to legally adopt a budget may have overexpenditures of budgeted funds. The budget for these funds is simply an estimate and does not prevent the District from exceeding the budget as long as the necessary revenue is earned. The District is not required to prepare an annual budget of revenue, therefore a deficit budgeted fund balance may be presented. However, this does not affect the District’s ability to expend monies. FACTORS AFFECTING FINANCIAL CONDITION The information presented in the financial statements is perhaps best understood when it is considered from the broader perspective of the specific environment within which the District operates. Local Economy. The Phoenix metropolitan area and the rest of Maricopa County have become one of the fastest growing regional markets in the United States. The number of manufacturing and wholesale businesses located in the metropolitan area is approximating 3,000. This growth has been stimulated by a combination of warm climate, a substantial well educated labor pool, a wide range of support industries, and a governmental climate that is supportive of economic growth and investment. A few of the major firms represented in the Phoenix metropolitan area include Honeywell International, Inc., Banner Health Systems, Wal-Mart Stores, Inc., Wells Fargo Company and Bashas’. In addition, the metropolitan area provides excellent educational and training opportunities through seven community colleges, four private colleges and graduate schools, and one state university.
iv
Maricopa County is located in the south-central portion of Arizona and encompasses an area of approximately 9,226 square miles. Its boundaries encompass the cities of Phoenix, Scottsdale, Mesa, Avondale, Tolleson and Goodyear, and such towns as Gilbert, Paradise Valley and Fountain Hills. Maricopa County is currently the nation’s fourth largest county in terms of population size and the 14th in land area. The County’s 2009 population was estimated at 4,023,331 and is expected to reach 6 million by 2030. Maricopa County has a very wide range of economic sectors supporting its substantial growth. Maricopa County has, for some time, enjoyed an unemployment rate that was somewhat lower than the national average.
Service is the largest employment sector in the County, partly fueled by the $2+ billion per year tourist industry. The County has excellent accommodations, diverse cultural and recreational activities, and a favorable climate attracting millions to the area annually. Wholesale and retail trade is the second largest employment category, employing over a quarter million people.
Manufacturing consisting primarily of high technology companies is the third largest employer. Other factors aiding economic growth include major expansions of the international airport serving the area, a favorable business climate and the presence of a well developed and expanding transportation infrastructure.
Long-term Financial Planning. After seven years of growth averaging five percent, the District enrollment has started to decline, so the need for sound financial strategies is imperative.
The District has taken a very conservative approach to budgeting. The concept is to continually budget less than anticipated revenue to allow for positive financial gain. This gain can then be used to fund the increases and sustain adequate operational funding levels. As the enrollment percentages continue to decrease, the District will adjust the budget projections down to keep the strategy intact.
The District voters approved a $50.0 million bond issue in November 2006. Since its approval, the District has completed a number of projects. It has completed the addition of two 10 classroom buildings at Rio Vista and Canyon Breeze Elementary schools. These additions not only help relieve crowding in these schools, they were the first 21st century classrooms designed with the latest in classroom instructional technology and equipment. The District has also replaced and reopened its oldest school, Pendergast Elementary, in August of 2009. The school opened as the District’s first LEED certified school. It also is the first school to be built with a community gymnasium. The District will also be replacing its next oldest school by January 2012. Other plans for the bond proceeds are to renovate other schools in need, construct multi-purpose gymnasiums for all schools, and build a new District office facility. The average age of the school buildings is 19 years. AWARDS AND ACKNOWLEDGMENTS Awards. The Association of School Business Officials (ASBO) awarded a Certificate of Excellence in Financial Reporting to the District for its Comprehensive Annual Financial Report for the fiscal year ended June 30, 2009. This was the 18th consecutive year that the District has received this prestigious award. In addition, the Government Finance Officers Association (GFOA) awarded a Certificate of Achievement for Excellence in Financial Reporting to the District for its Comprehensive Annual Financial Report for the fiscal year ended June 30, 2009. In order to be awarded these certificates, the District published an easily readable and efficiently organized Comprehensive Annual Financial Report. This report satisfied both accounting principles generally accepted in the United States of America and applicable legal requirements.
v
These certificates are valid for a period of one year only. We believe that our current Comprehensive Annual Financial Report continues to meet the programs' requirements and we are submitting it to ASBO and GFOA to determine its eligibility for the fiscal year 2009-10 certificates. ASBO also awarded a Meritorious Budget Award to the District for its Adopted Expenditure Budget for the fiscal year ended June 30, 2010. In order to be recognized with this award, the District published an easily readable and efficiently organized annual budget. This was the fifth consecutive year that the District has received this prestigious award. The District has submitted for the Meritorious Budget Award for its Adopted Expenditure Budget for the year ended June 30, 2011 as well. Acknowledgments. The preparation of the Comprehensive Annual Financial Report on a timely basis was made possible by the dedicated service of the entire staff of the Business and Finance Department. Each member of the department has our sincere appreciation for the contributions made in the preparation of this report. In closing, without the leadership and support of the Governing Board of the District, preparation of this report would not have been possible. Respectfully submitted, Ronald Richards, Ed.D. Brian Mee Superintendent Assistant Superintendent for Business Services
vi
vii
viii
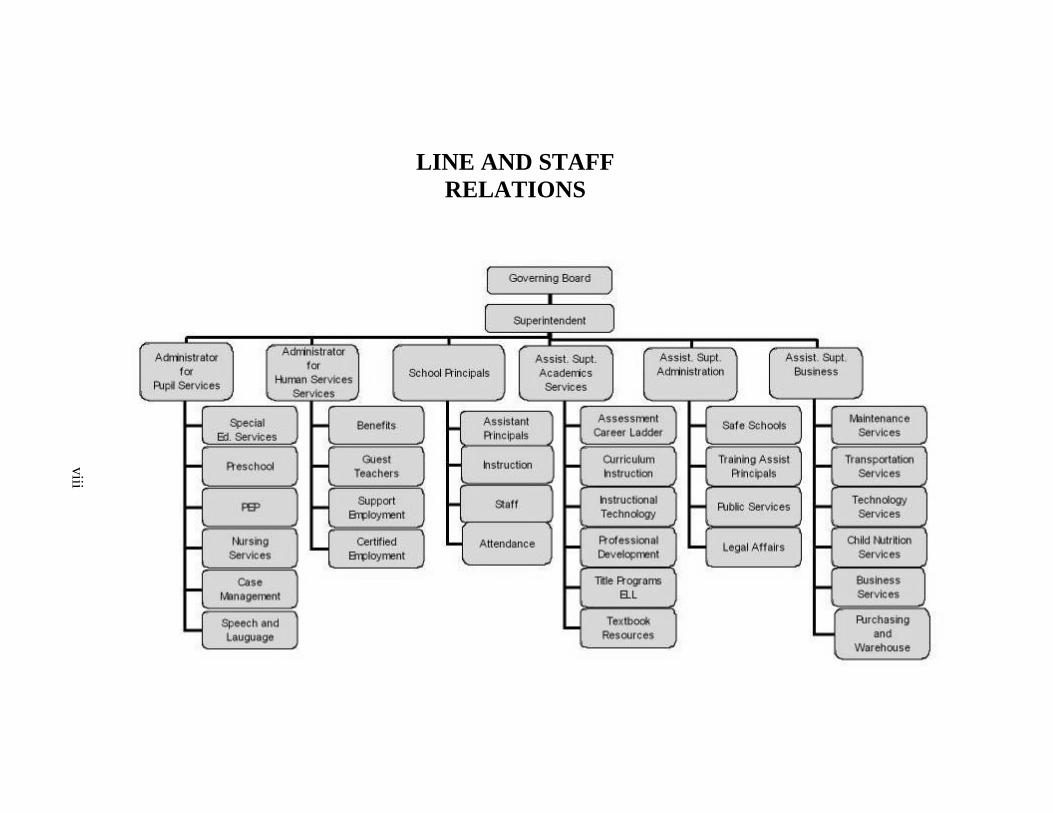
LINE AND STAFF RELATIONS
ix
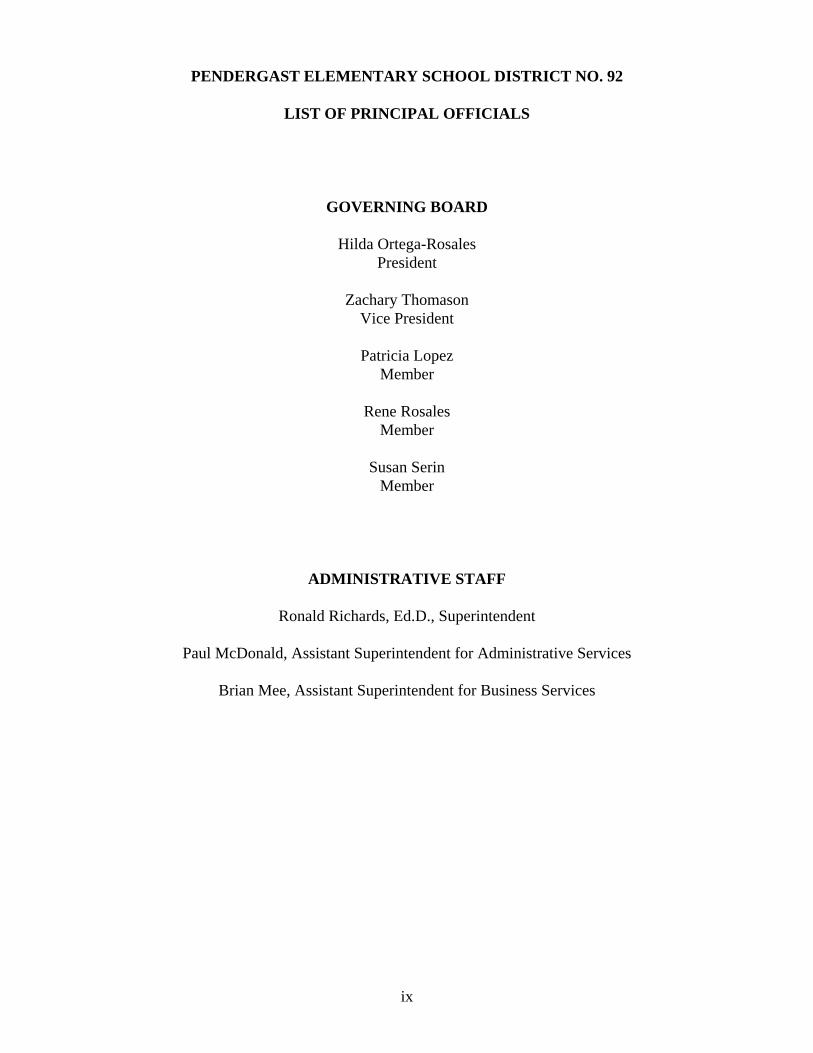
PENDERGAST ELEMENTARY SCHOOL DISTRICT NO. 92
LIST OF PRINCIPAL OFFICIALS
GOVERNING BOARD
Hilda Ortega-Rosales President
Zachary Thomason
Vice President
Patricia Lopez Member
Rene Rosales
Member
Susan Serin Member
ADMINISTRATIVE STAFF
Ronald Richards, Ed.D., Superintendent
Paul McDonald, Assistant Superintendent for Administrative Services
Brian Mee, Assistant Superintendent for Business Services

(This page intentionally left blank)
FINANCIAL SECTION

(This page intentionally left blank)
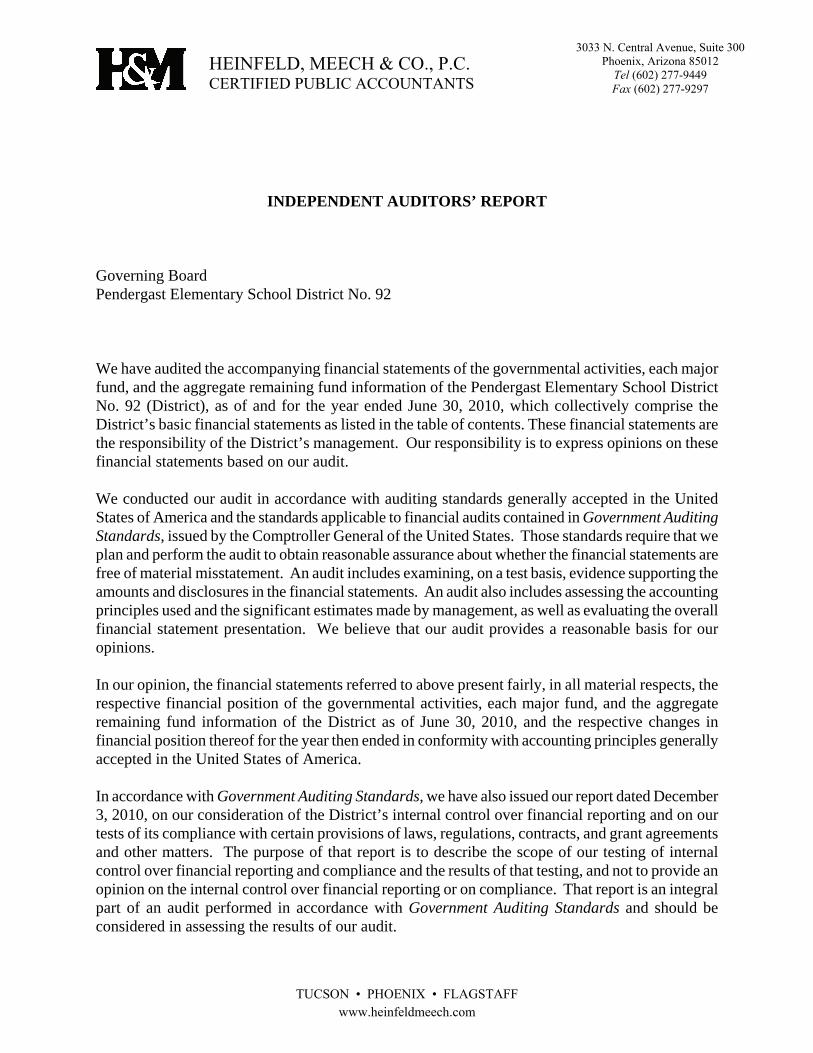
INDEPENDENT AUDITORS’ REPORT Governing Board Pendergast Elementary School District No. 92 We have audited the accompanying financial statements of the governmental activities, each major fund, and the aggregate remaining fund information of the Pendergast Elementary School District No. 92 (District), as of and for the year ended June 30, 2010, which collectively comprise the District’s basic financial statements as listed in the table of contents. These financial statements are the responsibility of the District’s management. Our responsibility is to express opinions on these financial statements based on our audit. We conducted our audit in accordance with auditing standards generally accepted in the United States of America and the standards applicable to financial audits contained in Government Auditing Standards, issued by the Comptroller General of the United States. Those standards require that we plan and perform the audit to obtain reasonable assurance about whether the financial statements are free of material misstatement. An audit includes examining, on a test basis, evidence supporting the amounts and disclosures in the financial statements. An audit also includes assessing the accounting principles used and the significant estimates made by management, as well as evaluating the overall financial statement presentation. We believe that our audit provides a reasonable basis for our opinions. In our opinion, the financial statements referred to above present fairly, in all material respects, the respective financial position of the governmental activities, each major fund, and the aggregate remaining fund information of the District as of June 30, 2010, and the respective changes in financial position thereof for the year then ended in conformity with accounting principles generally accepted in the United States of America. In accordance with Government Auditing Standards, we have also issued our report dated December 3, 2010, on our consideration of the District’s internal control over financial reporting and on our tests of its compliance with certain provisions of laws, regulations, contracts, and grant agreements and other matters. The purpose of that report is to describe the scope of our testing of internal control over financial reporting and compliance and the results of that testing, and not to provide an opinion on the internal control over financial reporting or on compliance. That report is an integral part of an audit performed in accordance with Government Auditing Standards and should be considered in assessing the results of our audit.
HEINFELD, MEECH & CO., P.C. 3033 N. Central Avenue, Suite 300
Phoenix, Arizona 85012 Tel (602) 277-9449
TUCSON • PHOENIX • FLAGSTAFF www.heinfeldmeech.com
CERTIFIED PUBLIC ACCOUNTANTS Fax (602) 277-9297
Page 2
Accounting principles generally accepted in the United States of America require that the management’s discussion and analysis on pages 5 through 13 and budgetary comparison information on pages 48 and 49 be presented to supplement the basic financial statements. Such information, although not a part of the basic financial statements, is required by Governmental Accounting Standards Board, who considers it to be an essential part of financial reporting for placing the basic financial statements in an appropriate operational, economic, or historical context. We have applied certain limited procedures to the required supplementary information in accordance with auditing standards generally accepted in the United States of America, which consisted of inquiries of management about the methods of preparing the information and comparing the information for consistency with management’s responses to our inquiries, the basic financial statements, and other knowledge we obtained during our audit of the basic financial statements. We do not express an opinion or provide any assurance on the information because the limited procedures do not provide us with sufficient evidence to express an opinion or provide any assurance. Our audit was conducted for the purpose of forming opinions on the financial statements that collectively comprise the District’s financial statements as a whole. The accompanying supplementary information such as the introductory section, combining and individual fund financial statements and schedules and statistical section, are presented for purposes of additional analysis and are not a required part of the financial statements. The combining and individual fund financial statements and schedules are the responsibility of management and were derived from and relate directly to the underlying accounting and other records used to prepare the financial statements. The information has been subjected to the auditing procedures applied in the audit of the financial statements and certain additional procedures, including comparing and reconciling such information directly to the underlying accounting and other records used to prepare the financial statements or to the financial statements themselves, and other additional procedures in accordance with auditing standards generally accepted in the United States of America. In our opinion, the information is fairly stated in all material respects in relation to the financial statements as a whole. The introductory and statistical sections have not been subjected to the auditing procedures applied in the audit of the basic financial statements and, accordingly, we do not express an opinion or provide any assurance on them. HEINFELD, MEECH & CO., P.C. Certified Public Accountants December 3, 2010

Page 3
MANAGEMENT’S DISCUSSION AND ANALYSIS (MD&A) (Required Supplementary Information)

Page 4
(This page intentionally left blank)
PENDERGAST ELEMENTARY SCHOOL DISTRICT NO. 92 MANAGEMENT’S DISCUSSION AND ANALYSIS (MD&A)
YEAR ENDED JUNE 30, 2010
Page 5
As management of the Pendergast Elementary School District No. 92 (District), we offer readers of the District’s financial statements this narrative overview and analysis of the financial activities of the District for the fiscal year ended June 30, 2010. We encourage readers to consider the information presented here in conjunction with additional information that we have furnished in our letter of transmittal, which can be found in the introductory section of this report. FINANCIAL HIGHLIGHTS
The District’s total net assets of governmental activities increased $9.4 million which
represents a 10 percent increase from the prior fiscal year as a result of an increase in property tax revenue and unrestricted County aid.
General revenues accounted for $74.7 million in revenue, or 85 percent of all current fiscal
year revenues. Program specific revenue in the form of charges for services and grants and contributions accounted for $13.4 million or 15 percent of total current fiscal year revenues.
The District had approximately $78.7 million in expenses related to governmental activities,
a decrease of 3 percent from the prior fiscal year.
Among major funds, the General Fund had $60.3 million in current fiscal year revenues, which primarily consisted of state aid and property taxes, and $56.0 million in expenditures. The General Fund’s fund balance increase from $183,723 at the prior fiscal year end to $4.4 million at the end of the current fiscal year was primarily due to an increase in property tax revenues and County aid.
OVERVIEW OF FINANCIAL STATEMENTS This discussion and analysis are intended to serve as an introduction to the District’s basic financial statements. The District’s basic financial statements comprise three components: 1) government-wide financial statements, 2) fund financial statements, and 3) notes to the financial statements. This report also contains other supplementary information in addition to the basic financial statements themselves. Government-wide financial statements. The government-wide financial statements are designed to provide readers with a broad overview of the District’s finances, in a manner similar to a private-sector business. The accrual basis of accounting is used for the government-wide financial statements.
PENDERGAST ELEMENTARY SCHOOL DISTRICT NO. 92 MANAGEMENT’S DISCUSSION AND ANALYSIS (MD&A)
YEAR ENDED JUNE 30, 2010
Page 6
OVERVIEW OF FINANCIAL STATEMENTS (Cont’d) The statement of net assets presents information on all of the District’s assets and liabilities, with the difference between the two reported as net assets. Over time, increases or decreases in net assets may serve as a useful indicator of whether the financial position of the District is improving or deteriorating. The statement of activities presents information showing how the District’s net assets changed during the most recent fiscal year. All changes in net assets are reported as soon as the underlying event giving rise to the change occurs, regardless of the timing of related cash flows. Thus, revenues and expenses are reported in this statement for some items that will only result in cash flows in future fiscal periods (e.g., uncollected taxes and earned but unused compensated absences). The government-wide financial statements outline functions of the District that are principally supported by property taxes and intergovernmental revenues. The governmental activities of the District include instruction, support services, operation and maintenance of plant services, student transportation services, operation of non-instructional services, and interest on long-term debt. Fund financial statements. A fund is a grouping of related accounts that is used to maintain control over resources that have been segregated for specific activities or objectives. The District uses fund accounting to ensure and demonstrate compliance with finance-related legal requirements. All of the funds of the District can be divided into two categories: governmental funds and fiduciary funds.
Governmental funds. Governmental funds are used to account for essentially the same functions reported as governmental activities in the government-wide financial statements. However, unlike the government-wide financial statements, governmental fund financial statements use the modified accrual basis of accounting and focus on near-term inflows of spendable resources, as well as on balances of spendable resources available at the end of the fiscal year. Such information may be useful in evaluating the District’s near-term financing requirements.
Because the focus of governmental funds is narrower than that of the government-wide financial statements, it is useful to compare the information presented for governmental funds with similar information presented for governmental activities in the government-wide financial statements. By doing so, readers may better understand the long-term impact of the District’s near-term financing decision. Both the governmental fund balance sheet and the governmental fund statement of revenues, expenditures and changes in fund balances provide a reconciliation to facilitate this comparison between governmental funds and governmental activities.
PENDERGAST ELEMENTARY SCHOOL DISTRICT NO. 92 MANAGEMENT’S DISCUSSION AND ANALYSIS (MD&A)
YEAR ENDED JUNE 30, 2010
Page 7
OVERVIEW OF FINANCIAL STATEMENTS (Concl’d) Information is presented separately in the governmental fund balance sheet and in the governmental fund statement of revenues, expenditures and changes in fund balances for the General Fund, the Debt Service Fund, and the Bond Building Fund, all of which are considered to be major funds. Data from the other governmental funds are combined into a single, aggregated presentation. Individual fund data for each of these non-major governmental funds is provided in the form of combining statements and schedules. Fiduciary funds. Fiduciary funds are used to account for resources held for the benefit of parties outside the District. Fiduciary funds are not reflected in the government-wide financial statements because the resources of those funds are not available to support the District’s own programs. Due to their custodial nature, fiduciary funds do not have a measurement focus.
Notes to the financial statements. The notes provide additional information that is essential to a full understanding of the data provided in the government-wide and fund financial statements. The notes to the financial statements can be found immediately following the basic financial statements. Other information. In addition to the basic financial statements and accompanying notes, this report also presents certain required supplementary information concerning the District’s budget process. The District adopts an annual expenditure budget for all governmental funds. A schedule of revenues, expenditures and changes in fund balances - budget and actual has been provided for the General Fund as required supplementary information. GOVERNMENT-WIDE FINANCIAL ANALYSIS Net assets may serve over time as a useful indicator of a government’s financial position. In the case of the District, assets exceeded liabilities by $104.0 million at the current fiscal year end. By far the largest portion of the District’s net assets (80 percent) reflects its investment in capital assets (e.g., land and improvements, buildings and improvements, vehicles, furniture and equipment and construction in progress), less any related debt used to acquire those assets that is still outstanding. The District uses these capital assets to provide services to its students; consequently, these assets are not available for future spending. Although the District’s investment in its capital assets is reported net of related debt, it should be noted that the resources needed to repay this debt must be provided from other sources, since the capital assets themselves cannot be used to liquidate these liabilities. In addition, a portion of the District’s net assets (4 percent) are restricted by statute for the specified purposes of debt service repayment and capital outlay investment.
PENDERGAST ELEMENTARY SCHOOL DISTRICT NO. 92 MANAGEMENT’S DISCUSSION AND ANALYSIS (MD&A)
YEAR ENDED JUNE 30, 2010
Page 8
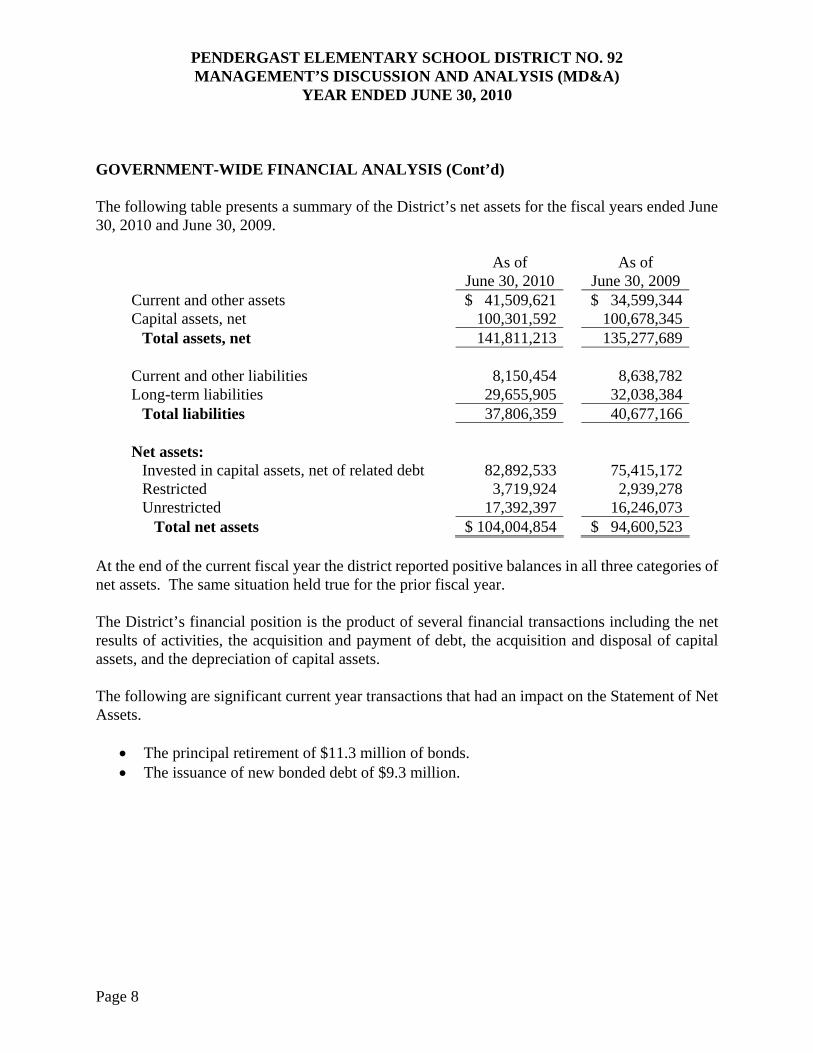
GOVERNMENT-WIDE FINANCIAL ANALYSIS (Cont’d) The following table presents a summary of the District’s net assets for the fiscal years ended June 30, 2010 and June 30, 2009.
As of June 30, 2010
As of June 30, 2009
Current and other assets $ 41,509,621 $ 34,599,344 Capital assets, net 100,301,592 100,678,345
Total assets, net 141,811,213 135,277,689 Current and other liabilities 8,150,454 8,638,782 Long-term liabilities 29,655,905 32,038,384
Total liabilities 37,806,359 40,677,166 Net assets:
Invested in capital assets, net of related debt 82,892,533 75,415,172 Restricted 3,719,924 2,939,278 Unrestricted 17,392,397 16,246,073
Total net assets $ 104,004,854 $ 94,600,523 At the end of the current fiscal year the district reported positive balances in all three categories of net assets. The same situation held true for the prior fiscal year. The District’s financial position is the product of several financial transactions including the net results of activities, the acquisition and payment of debt, the acquisition and disposal of capital assets, and the depreciation of capital assets. The following are significant current year transactions that had an impact on the Statement of Net Assets.
The principal retirement of $11.3 million of bonds. The issuance of new bonded debt of $9.3 million.
PENDERGAST ELEMENTARY SCHOOL DISTRICT NO. 92 MANAGEMENT’S DISCUSSION AND ANALYSIS (MD&A)
YEAR ENDED JUNE 30, 2010
Page 9
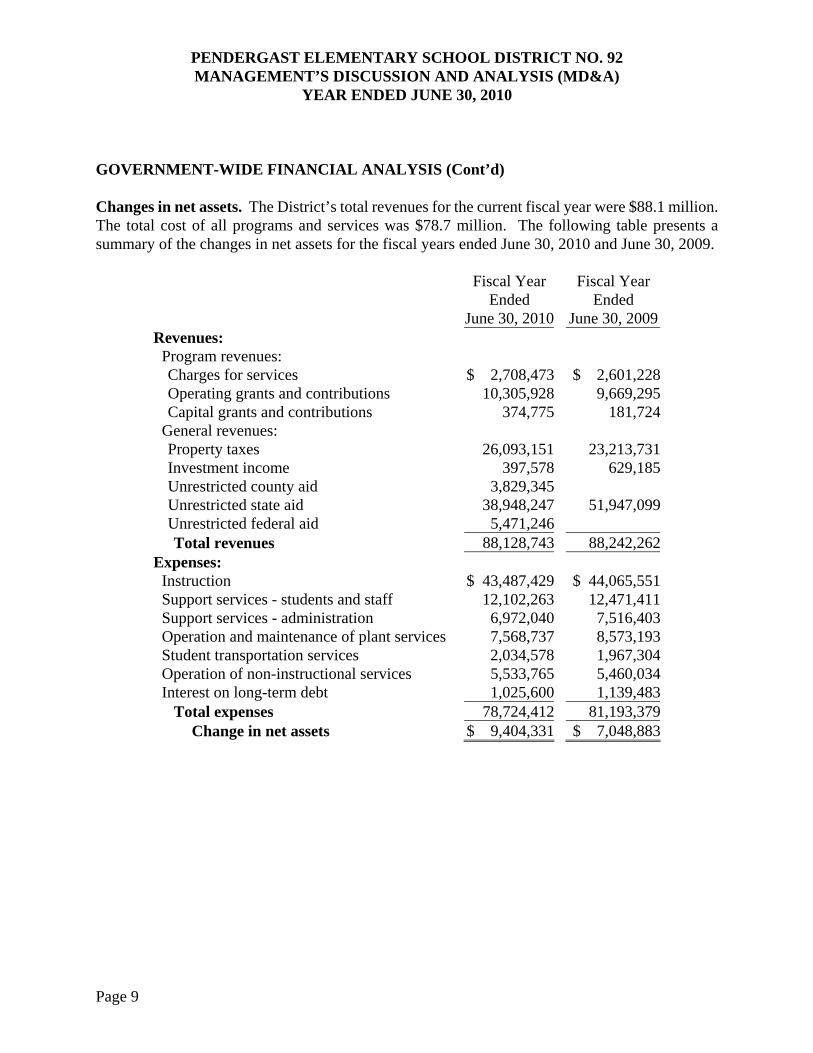
GOVERNMENT-WIDE FINANCIAL ANALYSIS (Cont’d) Changes in net assets. The District’s total revenues for the current fiscal year were $88.1 million. The total cost of all programs and services was $78.7 million. The following table presents a summary of the changes in net assets for the fiscal years ended June 30, 2010 and June 30, 2009.
Fiscal Year Ended
June 30, 2010
Fiscal Year Ended
June 30, 2009Revenues:
Program revenues: Charges for services $ 2,708,473 $ 2,601,228 Operating grants and contributions 10,305,928 9,669,295 Capital grants and contributions 374,775 181,724
General revenues: Property taxes 26,093,151 23,213,731 Investment income 397,578 629,185 Unrestricted county aid 3,829,345 Unrestricted state aid 38,948,247 51,947,099Unrestricted federal aid 5,471,246 Total revenues 88,128,743 88,242,262
Expenses: Instruction $ 43,487,429 $ 44,065,551Support services - students and staff 12,102,263 12,471,411 Support services - administration 6,972,040 7,516,403 Operation and maintenance of plant services 7,568,737 8,573,193 Student transportation services 2,034,578 1,967,304 Operation of non-instructional services 5,533,765 5,460,034 Interest on long-term debt 1,025,600 1,139,483
Total expenses 78,724,412 81,193,379Change in net assets $ 9,404,331 $ 7,048,883
PENDERGAST ELEMENTARY SCHOOL DISTRICT NO. 92 MANAGEMENT’S DISCUSSION AND ANALYSIS (MD&A)
YEAR ENDED JUNE 30, 2010
Page 10
GOVERNMENT-WIDE FINANCIAL ANALYSIS (Cont’d)
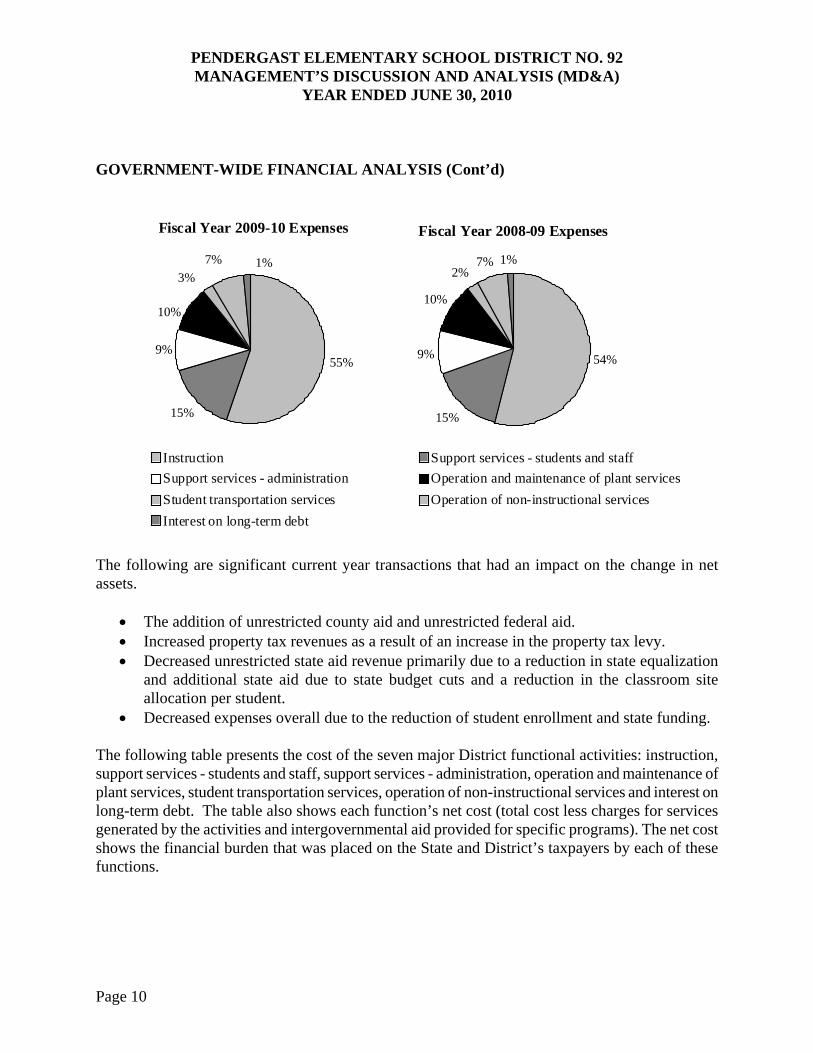
The following are significant current year transactions that had an impact on the change in net assets.
The addition of unrestricted county aid and unrestricted federal aid. Increased property tax revenues as a result of an increase in the property tax levy. Decreased unrestricted state aid revenue primarily due to a reduction in state equalization
and additional state aid due to state budget cuts and a reduction in the classroom site allocation per student.
Decreased expenses overall due to the reduction of student enrollment and state funding. The following table presents the cost of the seven major District functional activities: instruction, support services - students and staff, support services - administration, operation and maintenance of plant services, student transportation services, operation of non-instructional services and interest on long-term debt. The table also shows each function’s net cost (total cost less charges for services generated by the activities and intergovernmental aid provided for specific programs). The net cost shows the financial burden that was placed on the State and District’s taxpayers by each of these functions.
Fiscal Year 2009-10 Expenses
55%
15%
9%
10%
3%1%7%
Instruction Support services - students and staff
Support services - administration Operation and maintenance of plant services
Student transportation services Operation of non-instructional services
Interest on long-term debt
Fiscal Year 2008-09 Expenses
54%
15%
9%
10%
2%1%7%
PENDERGAST ELEMENTARY SCHOOL DISTRICT NO. 92 MANAGEMENT’S DISCUSSION AND ANALYSIS (MD&A)
YEAR ENDED JUNE 30, 2010
Page 11
GOVERNMENT-WIDE FINANCIAL ANALYSIS (Concl’d)
Year Ended June 30, 2010 Year Ended June 30, 2009 Total
Expenses Net (Expense)/
Revenue Total
Expenses Net (Expense)/
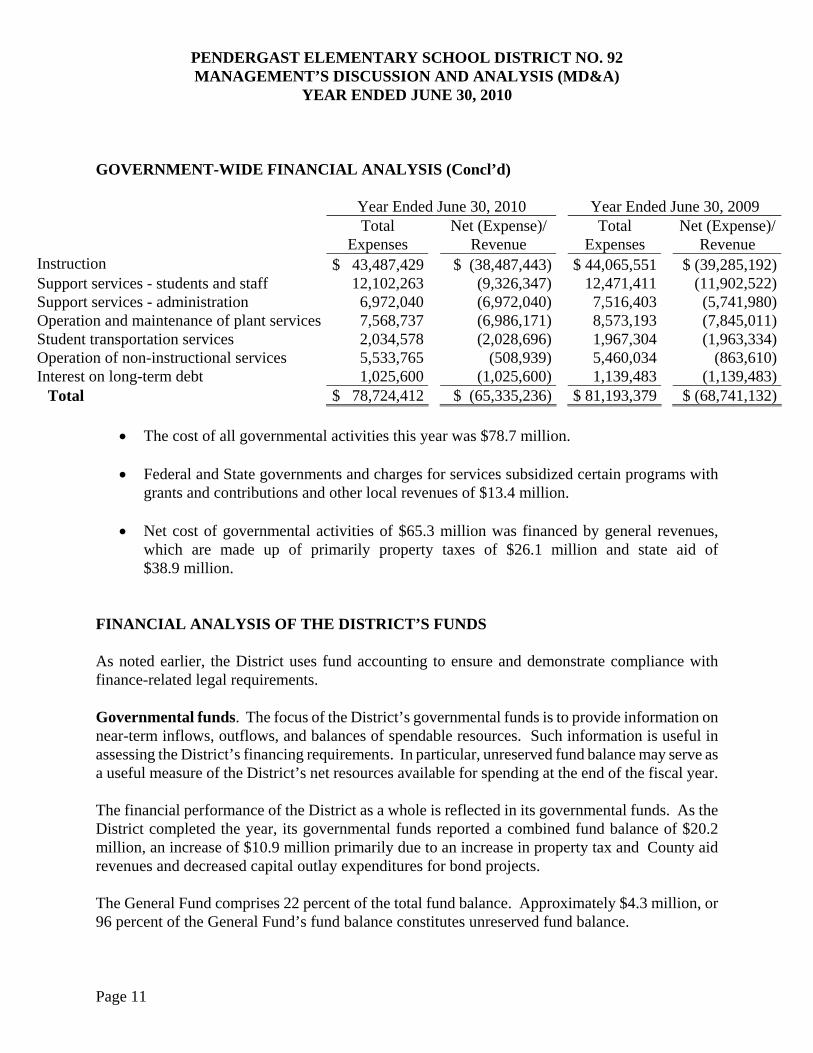
Revenue Instruction $ 43,487,429 $ (38,487,443) $ 44,065,551 $ (39,285,192)Support services - students and staff 12,102,263 (9,326,347) 12,471,411 (11,902,522)Support services - administration 6,972,040 (6,972,040) 7,516,403 (5,741,980)Operation and maintenance of plant services 7,568,737 (6,986,171) 8,573,193 (7,845,011)Student transportation services 2,034,578 (2,028,696) 1,967,304 (1,963,334)Operation of non-instructional services 5,533,765 (508,939) 5,460,034 (863,610)Interest on long-term debt 1,025,600 (1,025,600) 1,139,483 (1,139,483)
Total $ 78,724,412 $ (65,335,236) $ 81,193,379 $ (68,741,132)
The cost of all governmental activities this year was $78.7 million. Federal and State governments and charges for services subsidized certain programs with
grants and contributions and other local revenues of $13.4 million.
Net cost of governmental activities of $65.3 million was financed by general revenues, which are made up of primarily property taxes of $26.1 million and state aid of $38.9 million.
FINANCIAL ANALYSIS OF THE DISTRICT’S FUNDS As noted earlier, the District uses fund accounting to ensure and demonstrate compliance with finance-related legal requirements. Governmental funds. The focus of the District’s governmental funds is to provide information on near-term inflows, outflows, and balances of spendable resources. Such information is useful in assessing the District’s financing requirements. In particular, unreserved fund balance may serve as a useful measure of the District’s net resources available for spending at the end of the fiscal year. The financial performance of the District as a whole is reflected in its governmental funds. As the District completed the year, its governmental funds reported a combined fund balance of $20.2 million, an increase of $10.9 million primarily due to an increase in property tax and County aid revenues and decreased capital outlay expenditures for bond projects. The General Fund comprises 22 percent of the total fund balance. Approximately $4.3 million, or 96 percent of the General Fund’s fund balance constitutes unreserved fund balance.
PENDERGAST ELEMENTARY SCHOOL DISTRICT NO. 92 MANAGEMENT’S DISCUSSION AND ANALYSIS (MD&A)
YEAR ENDED JUNE 30, 2010
Page 12
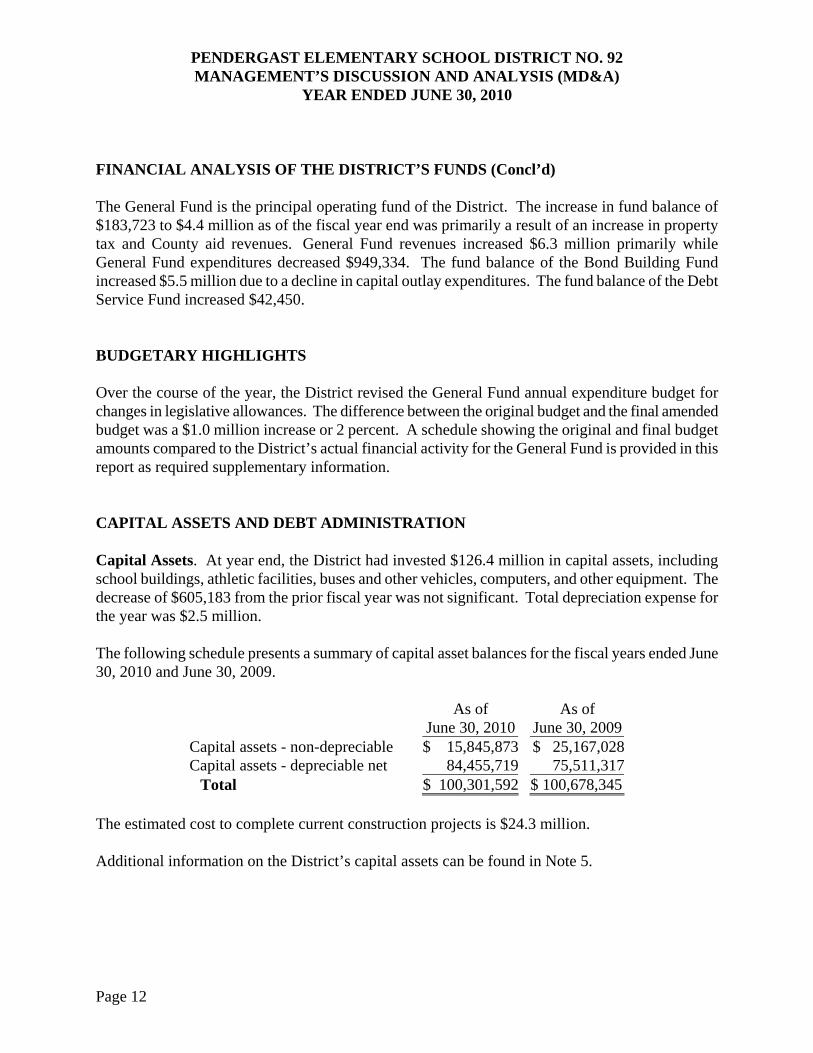
FINANCIAL ANALYSIS OF THE DISTRICT’S FUNDS (Concl’d) The General Fund is the principal operating fund of the District. The increase in fund balance of $183,723 to $4.4 million as of the fiscal year end was primarily a result of an increase in property tax and County aid revenues. General Fund revenues increased $6.3 million primarily while General Fund expenditures decreased $949,334. The fund balance of the Bond Building Fund increased $5.5 million due to a decline in capital outlay expenditures. The fund balance of the Debt Service Fund increased $42,450. BUDGETARY HIGHLIGHTS Over the course of the year, the District revised the General Fund annual expenditure budget for changes in legislative allowances. The difference between the original budget and the final amended budget was a $1.0 million increase or 2 percent. A schedule showing the original and final budget amounts compared to the District’s actual financial activity for the General Fund is provided in this report as required supplementary information. CAPITAL ASSETS AND DEBT ADMINISTRATION Capital Assets. At year end, the District had invested $126.4 million in capital assets, including school buildings, athletic facilities, buses and other vehicles, computers, and other equipment. The decrease of $605,183 from the prior fiscal year was not significant. Total depreciation expense for the year was $2.5 million. The following schedule presents a summary of capital asset balances for the fiscal years ended June 30, 2010 and June 30, 2009.
As of
June 30, 2010 As of
June 30, 2009 Capital assets - non-depreciable $ 15,845,873 $ 25,167,028Capital assets - depreciable net 84,455,719 75,511,317
Total $ 100,301,592 $ 100,678,345 The estimated cost to complete current construction projects is $24.3 million. Additional information on the District’s capital assets can be found in Note 5.
PENDERGAST ELEMENTARY SCHOOL DISTRICT NO. 92 MANAGEMENT’S DISCUSSION AND ANALYSIS (MD&A)
YEAR ENDED JUNE 30, 2010
Page 13
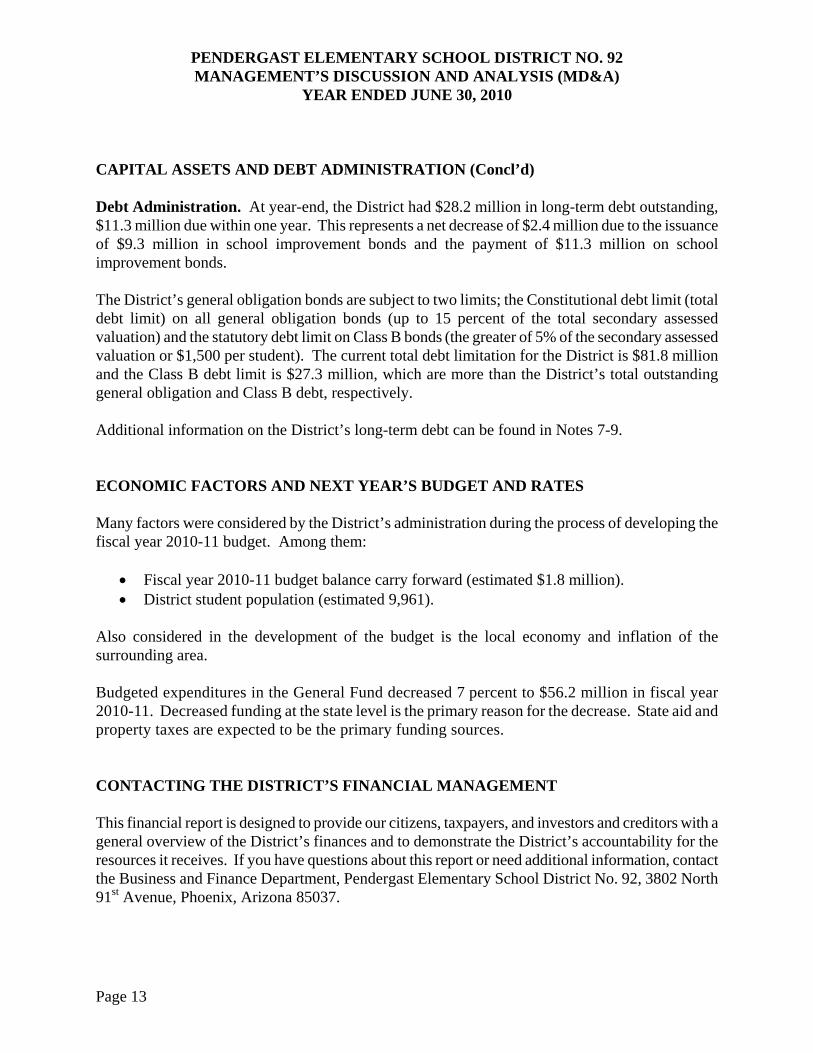
CAPITAL ASSETS AND DEBT ADMINISTRATION (Concl’d) Debt Administration. At year-end, the District had $28.2 million in long-term debt outstanding, $11.3 million due within one year. This represents a net decrease of $2.4 million due to the issuance of $9.3 million in school improvement bonds and the payment of $11.3 million on school improvement bonds. The District’s general obligation bonds are subject to two limits; the Constitutional debt limit (total debt limit) on all general obligation bonds (up to 15 percent of the total secondary assessed valuation) and the statutory debt limit on Class B bonds (the greater of 5% of the secondary assessed valuation or $1,500 per student). The current total debt limitation for the District is $81.8 million and the Class B debt limit is $27.3 million, which are more than the District’s total outstanding general obligation and Class B debt, respectively. Additional information on the District’s long-term debt can be found in Notes 7-9. ECONOMIC FACTORS AND NEXT YEAR’S BUDGET AND RATES Many factors were considered by the District’s administration during the process of developing the fiscal year 2010-11 budget. Among them:
Fiscal year 2010-11 budget balance carry forward (estimated $1.8 million). District student population (estimated 9,961).
Also considered in the development of the budget is the local economy and inflation of the surrounding area. Budgeted expenditures in the General Fund decreased 7 percent to $56.2 million in fiscal year 2010-11. Decreased funding at the state level is the primary reason for the decrease. State aid and property taxes are expected to be the primary funding sources. CONTACTING THE DISTRICT’S FINANCIAL MANAGEMENT This financial report is designed to provide our citizens, taxpayers, and investors and creditors with a general overview of the District’s finances and to demonstrate the District’s accountability for the resources it receives. If you have questions about this report or need additional information, contact the Business and Finance Department, Pendergast Elementary School District No. 92, 3802 North 91st Avenue, Phoenix, Arizona 85037.

Page 14
(This page intentionally left blank)

Page 15
BASIC FINANCIAL STATEMENTS

Page 16
(This page intentionally left blank)

Page 17
GOVERNMENT-WIDE FINANCIAL STATEMENTS
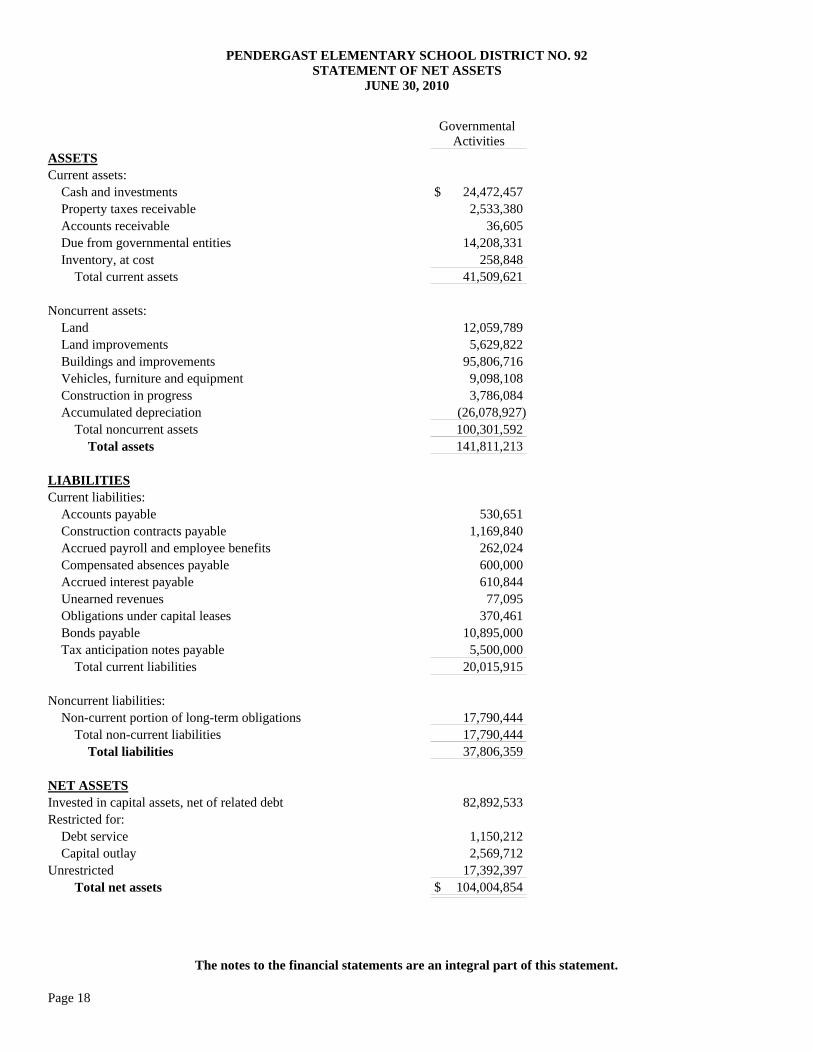
PENDERGAST ELEMENTARY SCHOOL DISTRICT NO. 92STATEMENT OF NET ASSETS
JUNE 30, 2010
Governmental Activities
ASSETSCurrent assets: Cash and investments Property taxes receivable Accounts receivable Due from governmental entities Inventory, at cost Total current assets
Noncurrent assets: Land Land improvements Buildings and improvements Vehicles, furniture and equipment Construction in progress Accumulated depreciation Total noncurrent assets Total assets
LIABILITIESCurrent liabilities: Accounts payable Construction contracts payable Accrued payroll and employee benefits Compensated absences payable Accrued interest payable Unearned revenues Obligations under capital leases Bonds payable Tax anticipation notes payable Total current liabilities
Noncurrent liabilities: Non-current portion of long-term obligations Total non-current liabilities Total liabilities
NET ASSETSInvested in capital assets, net of related debtRestricted for: Debt service Capital outlayUnrestricted Total net assets
$ 24,472,457 2,533,380
36,605 14,208,331
258,848 41,509,621
12,059,789 5,629,822
95,806,716 9,098,108 3,786,084
(26,078,927)100,301,592 141,811,213
530,651 1,169,840
262,024 600,000 610,844
77,095 370,461
10,895,000 5,500,000
20,015,915
17,790,444 17,790,444 37,806,359
82,892,533
1,150,212 2,569,712
17,392,397 $ 104,004,854
The notes to the financial statements are an integral part of this statement.
Page 18
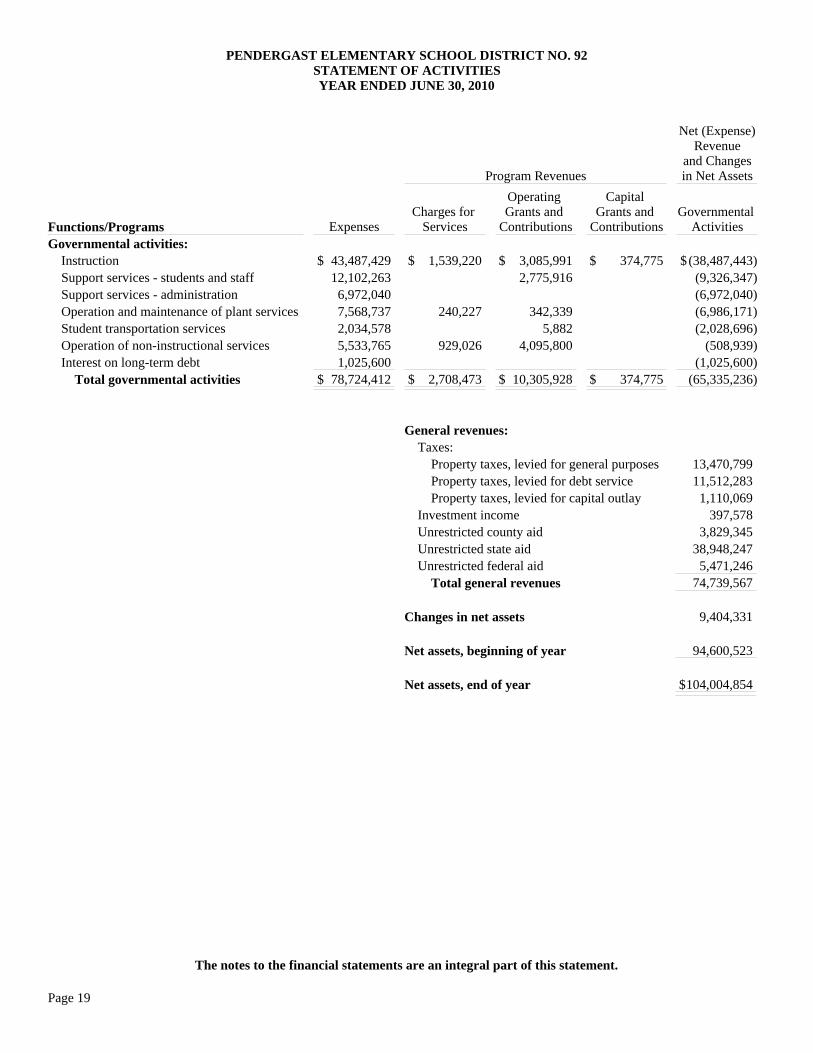
PENDERGAST ELEMENTARY SCHOOL DISTRICT NO. 92STATEMENT OF ACTIVITIESYEAR ENDED JUNE 30, 2010
Program Revenues
Net (Expense)Revenue
and Changesin Net Assets
Functions/Programs ExpensesCharges for
Services
Operating Grants and
Contributions
Capital Grants and
ContributionsGovernmental
ActivitiesGovernmental activities: Instruction Support services - students and staff Support services - administration Operation and maintenance of plant services Student transportation services Operation of non-instructional services Interest on long-term debt Total governmental activities
$ 43,487,429 $ 1,539,220 $ 3,085,991 $ 374,775 $ (38,487,443)12,102,263 2,775,916 (9,326,347)
6,972,040 (6,972,040)7,568,737 240,227 342,339 (6,986,171)2,034,578 5,882 (2,028,696)5,533,765 929,026 4,095,800 (508,939)1,025,600 (1,025,600)
$ 78,724,412 $ 2,708,473 $ 10,305,928 $ 374,775 (65,335,236)
General revenues: Taxes: Property taxes, levied for general purposes Property taxes, levied for debt service Property taxes, levied for capital outlay Investment income Unrestricted county aid Unrestricted state aid Unrestricted federal aid Total general revenues
Changes in net assets
Net assets, beginning of year
Net assets, end of year
13,470,799 11,512,283
1,110,069 397,578
3,829,345 38,948,247
5,471,246 74,739,567
9,404,331
94,600,523
$104,004,854
The notes to the financial statements are an integral part of this statement.
Page 19

Page 20
(This page intentionally left blank)

Page 21
FUND FINANCIAL STATEMENTS
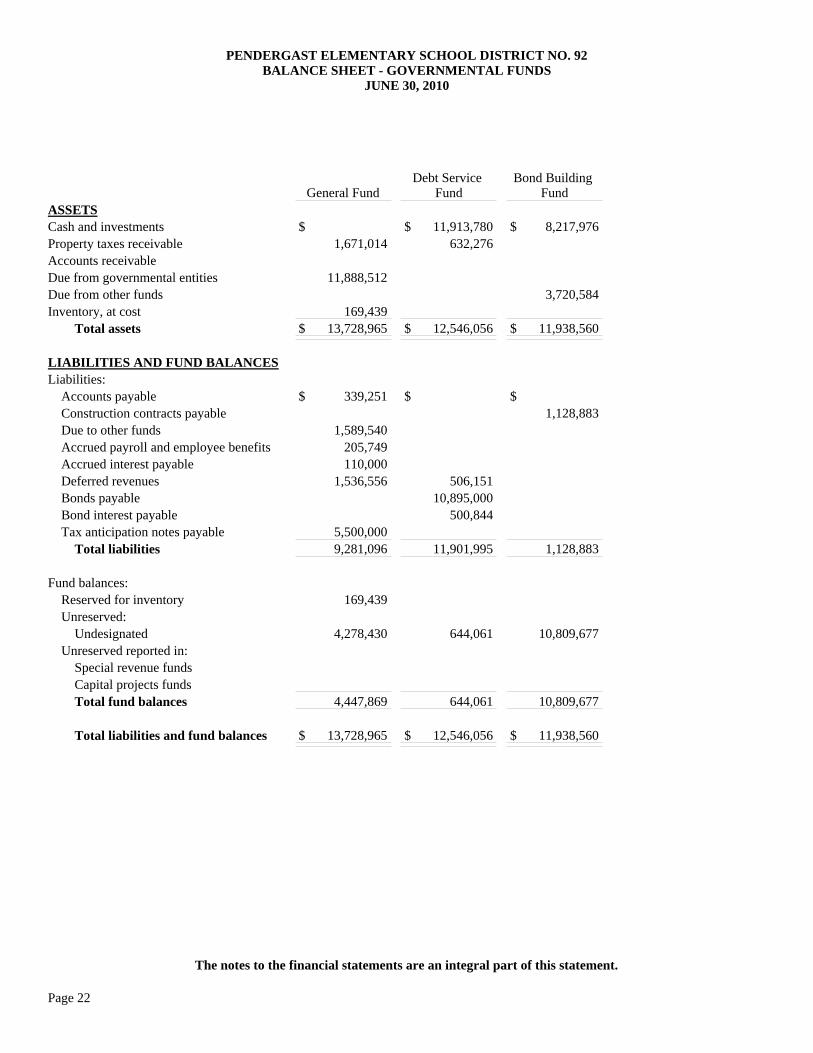
PENDERGAST ELEMENTARY SCHOOL DISTRICT NO. 92BALANCE SHEET - GOVERNMENTAL FUNDS
JUNE 30, 2010
General FundDebt Service
FundBond Building
FundASSETSCash and investmentsProperty taxes receivableAccounts receivableDue from governmental entitiesDue from other fundsInventory, at cost Total assets
LIABILITIES AND FUND BALANCESLiabilities: Accounts payable Construction contracts payable Due to other funds Accrued payroll and employee benefits Accrued interest payable Deferred revenues Bonds payable Bond interest payable Tax anticipation notes payable Total liabilities
Fund balances: Reserved for inventory Unreserved: Undesignated Unreserved reported in: Special revenue funds Capital projects funds Total fund balances
Total liabilities and fund balances
$ $ 11,913,780 $ 8,217,976 1,671,014 632,276
11,888,512
3,720,584 169,439
$ 13,728,965 $ 12,546,056 $ 11,938,560
$ 339,251 $ $ 1,128,883
1,589,540 205,749 110,000
1,536,556 506,151 10,895,000 500,844
5,500,000 9,281,096 11,901,995 1,128,883
169,439
4,278,430 644,061 10,809,677
4,447,869 644,061 10,809,677
$ 13,728,965 $ 12,546,056 $ 11,938,560
The notes to the financial statements are an integral part of this statement.
Page 22
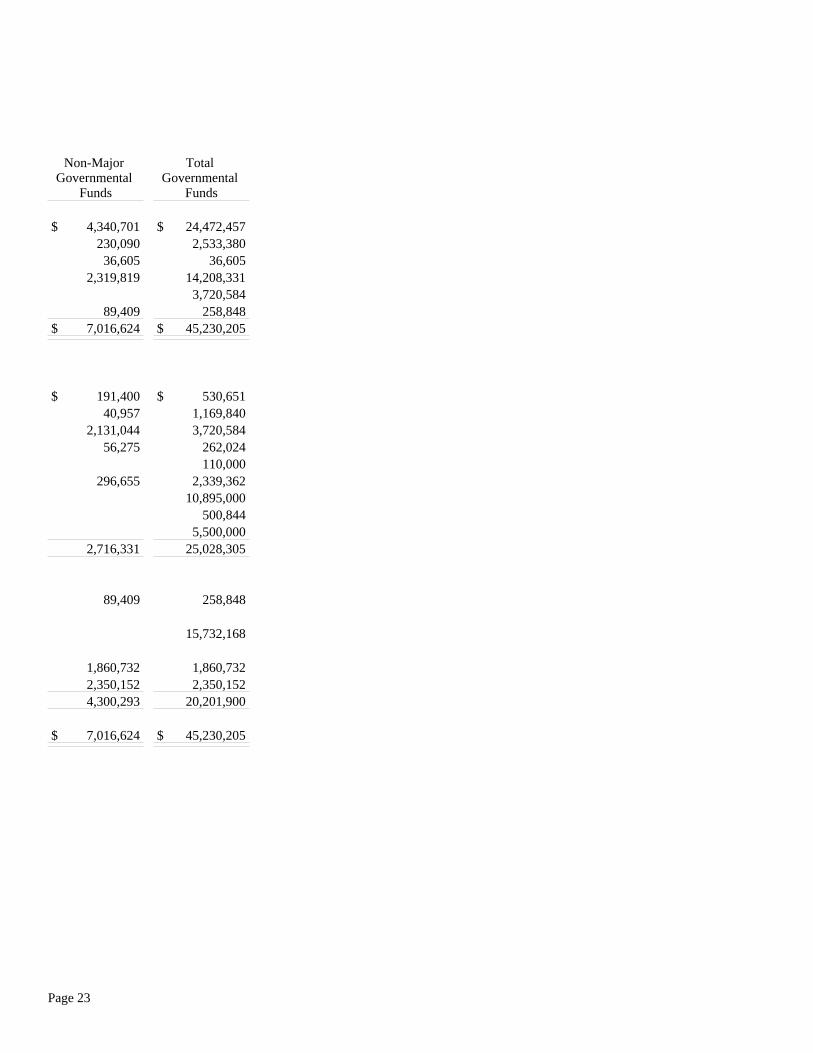
Non-Major Governmental
Funds
Total Governmental
Funds
$ 4,340,701 $ 24,472,457 230,090 2,533,380
36,605 36,605 2,319,819 14,208,331
3,720,584 89,409 258,848
$ 7,016,624 $ 45,230,205
$ 191,400 $ 530,651 40,957 1,169,840
2,131,044 3,720,584 56,275 262,024
110,000 296,655 2,339,362
10,895,000 500,844 5,500,000
2,716,331 25,028,305
89,409 258,848
15,732,168
1,860,732 1,860,732 2,350,152 2,350,152 4,300,293 20,201,900
$ 7,016,624 $ 45,230,205
Page 23

Page 24
(This page intentionally left blank)
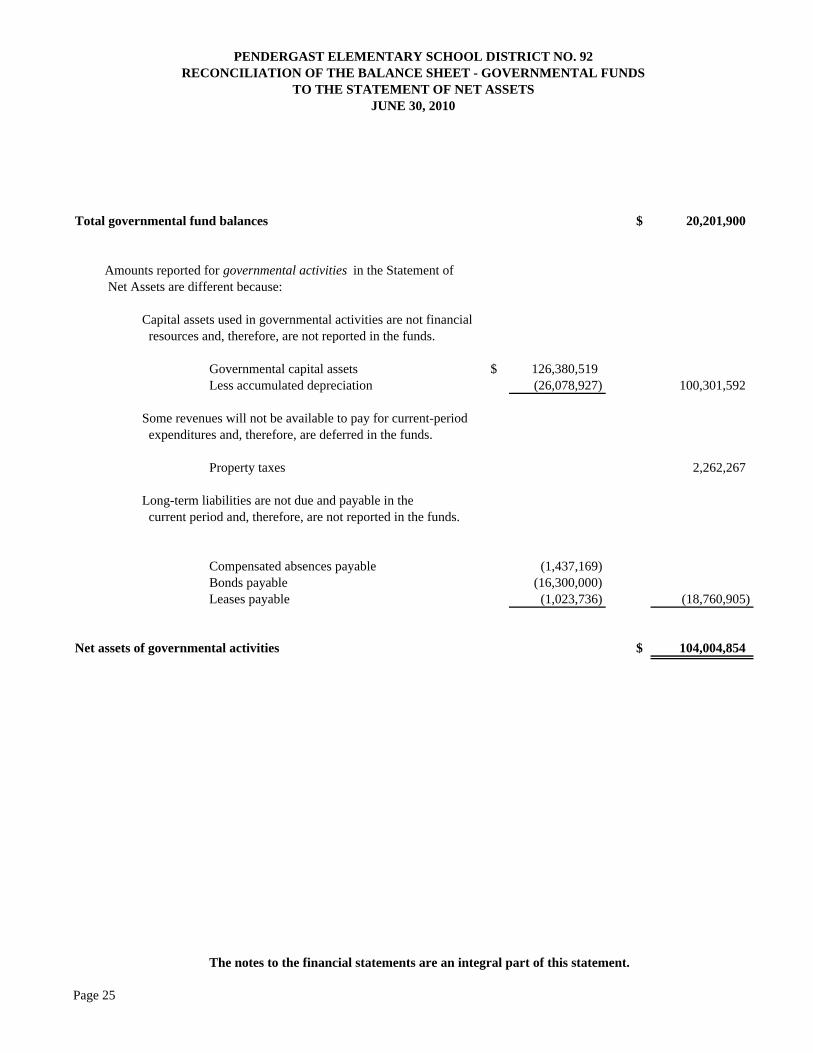
Total governmental fund balances $ 20,201,900
Amounts reported for governmental activities in the Statement of Net Assets are different because:
Capital assets used in governmental activities are not financial resources and, therefore, are not reported in the funds.
Governmental capital assets $ 126,380,519Less accumulated depreciation (26,078,927) 100,301,592
Some revenues will not be available to pay for current-period expenditures and, therefore, are deferred in the funds.
Property taxes 2,262,267
Long-term liabilities are not due and payable in the current period and, therefore, are not reported in the funds.
Compensated absences payable (1,437,169)Bonds payable (16,300,000)Leases payable (1,023,736) (18,760,905)
Net assets of governmental activities $ 104,004,854
The notes to the financial statements are an integral part of this statement.
PENDERGAST ELEMENTARY SCHOOL DISTRICT NO. 92RECONCILIATION OF THE BALANCE SHEET - GOVERNMENTAL FUNDS
TO THE STATEMENT OF NET ASSETSJUNE 30, 2010
Page 25
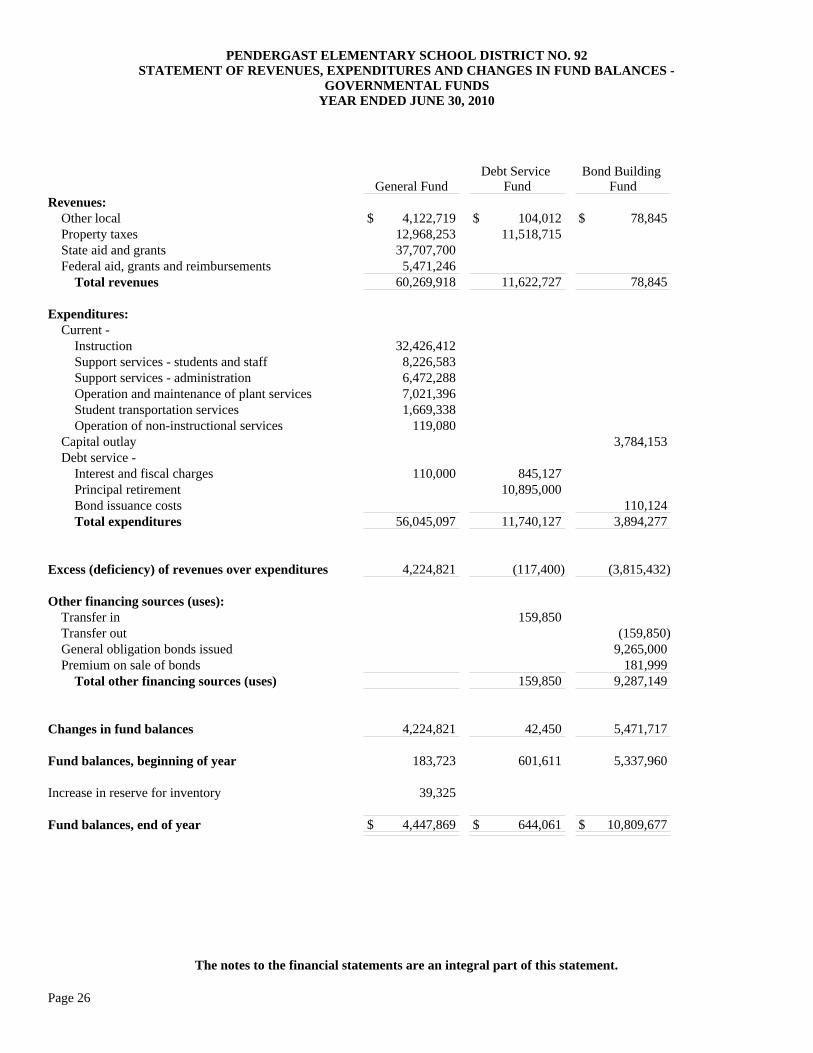
PENDERGAST ELEMENTARY SCHOOL DISTRICT NO. 92STATEMENT OF REVENUES, EXPENDITURES AND CHANGES IN FUND BALANCES -
GOVERNMENTAL FUNDSYEAR ENDED JUNE 30, 2010
General FundDebt Service
FundBond Building
FundRevenues: Other local Property taxes State aid and grants Federal aid, grants and reimbursements Total revenues
Expenditures: Current - Instruction Support services - students and staff Support services - administration Operation and maintenance of plant services Student transportation services Operation of non-instructional services Capital outlay Debt service - Interest and fiscal charges Principal retirement Bond issuance costs Total expenditures
Excess (deficiency) of revenues over expenditures
Other financing sources (uses): Transfer in Transfer out General obligation bonds issued Premium on sale of bonds Total other financing sources (uses)
Changes in fund balances
Fund balances, beginning of year
Increase in reserve for inventory
Fund balances, end of year
$ 4,122,719 $ 104,012 $ 78,845 12,968,253 11,518,715 37,707,700
5,471,246 60,269,918 11,622,727 78,845
32,426,412 8,226,583 6,472,288 7,021,396 1,669,338
119,080 3,784,153
110,000 845,127 10,895,000 110,124
56,045,097 11,740,127 3,894,277
4,224,821 (117,400) (3,815,432)
159,850 (159,850) 9,265,000 181,999 159,850 9,287,149
4,224,821 42,450 5,471,717
183,723 601,611 5,337,960
39,325
$ 4,447,869 $ 644,061 $ 10,809,677
The notes to the financial statements are an integral part of this statement.
Page 26
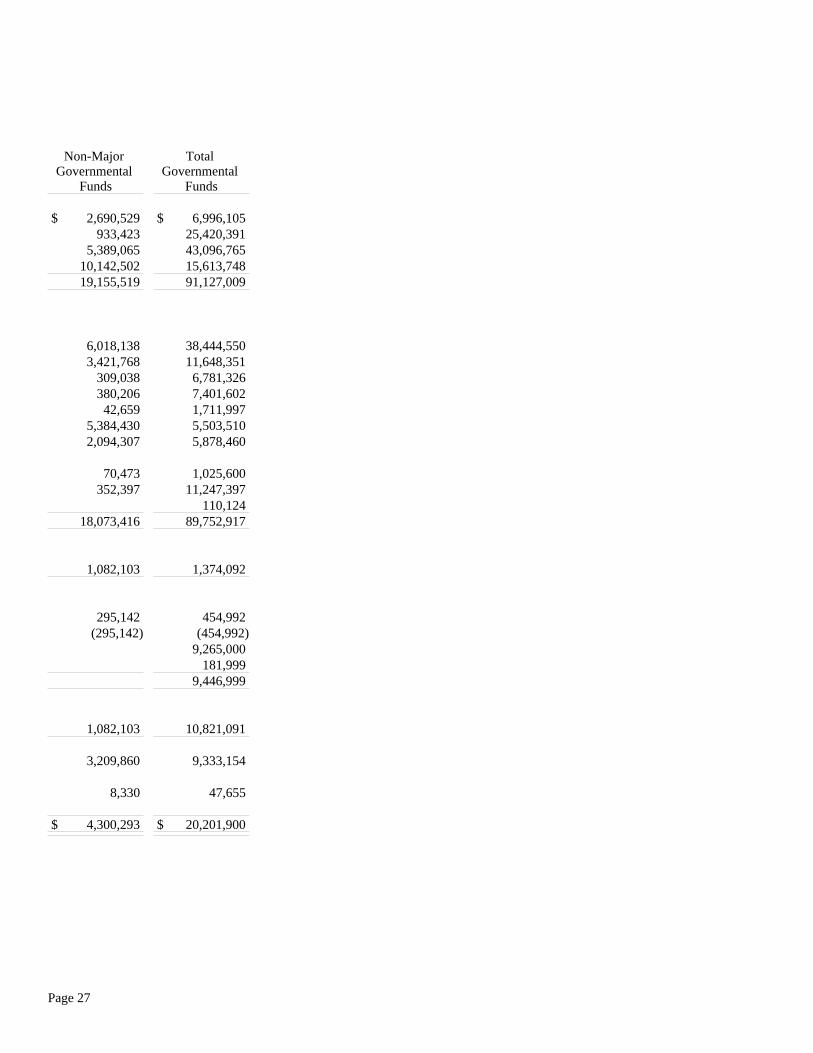
Non-Major Governmental
Funds
Total Governmental
Funds
$ 2,690,529 $ 6,996,105 933,423 25,420,391
5,389,065 43,096,765 10,142,502 15,613,748 19,155,519 91,127,009
6,018,138 38,444,550 3,421,768 11,648,351
309,038 6,781,326 380,206 7,401,602
42,659 1,711,997 5,384,430 5,503,510 2,094,307 5,878,460
70,473 1,025,600 352,397 11,247,397
110,124 18,073,416 89,752,917
1,082,103 1,374,092
295,142 454,992 (295,142) (454,992)
9,265,000 181,999 9,446,999
1,082,103 10,821,091
3,209,860 9,333,154
8,330 47,655
$ 4,300,293 $ 20,201,900
Page 27
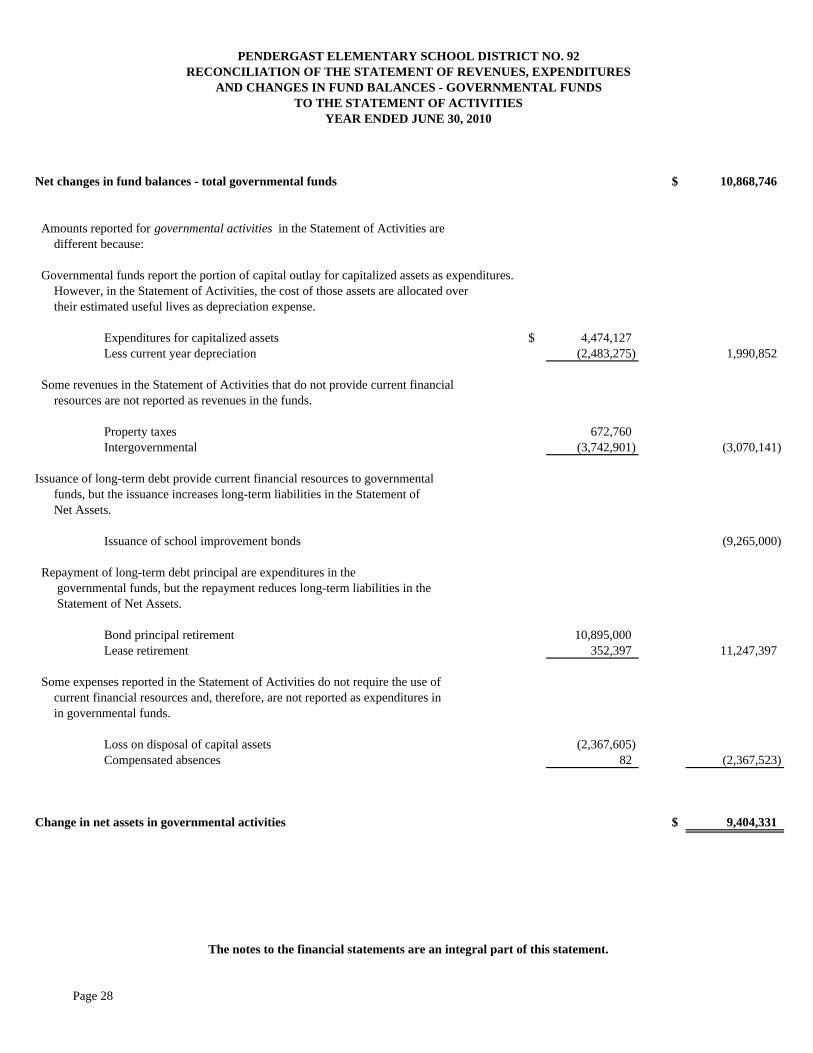
Net changes in fund balances - total governmental funds $ 10,868,746
Amounts reported for governmental activities in the Statement of Activities aredifferent because:
Governmental funds report the portion of capital outlay for capitalized assets as expenditures. However, in the Statement of Activities, the cost of those assets are allocated over their estimated useful lives as depreciation expense.
Expenditures for capitalized assets $ 4,474,127Less current year depreciation (2,483,275) 1,990,852
Some revenues in the Statement of Activities that do not provide current financialresources are not reported as revenues in the funds.
Property taxes 672,760 Intergovernmental (3,742,901) (3,070,141)
Issuance of long-term debt provide current financial resources to governmentalfunds, but the issuance increases long-term liabilities in the Statement ofNet Assets.
Issuance of school improvement bonds (9,265,000)
Repayment of long-term debt principal are expenditures in the governmental funds, but the repayment reduces long-term liabilities in the Statement of Net Assets.
Bond principal retirement 10,895,000Lease retirement 352,397 11,247,397
Some expenses reported in the Statement of Activities do not require the use ofcurrent financial resources and, therefore, are not reported as expenditures in in governmental funds.
Loss on disposal of capital assets (2,367,605)Compensated absences 82 (2,367,523)
Change in net assets in governmental activities $ 9,404,331
The notes to the financial statements are an integral part of this statement.
PENDERGAST ELEMENTARY SCHOOL DISTRICT NO. 92RECONCILIATION OF THE STATEMENT OF REVENUES, EXPENDITURES
AND CHANGES IN FUND BALANCES - GOVERNMENTAL FUNDS
YEAR ENDED JUNE 30, 2010TO THE STATEMENT OF ACTIVITIES
Page 28
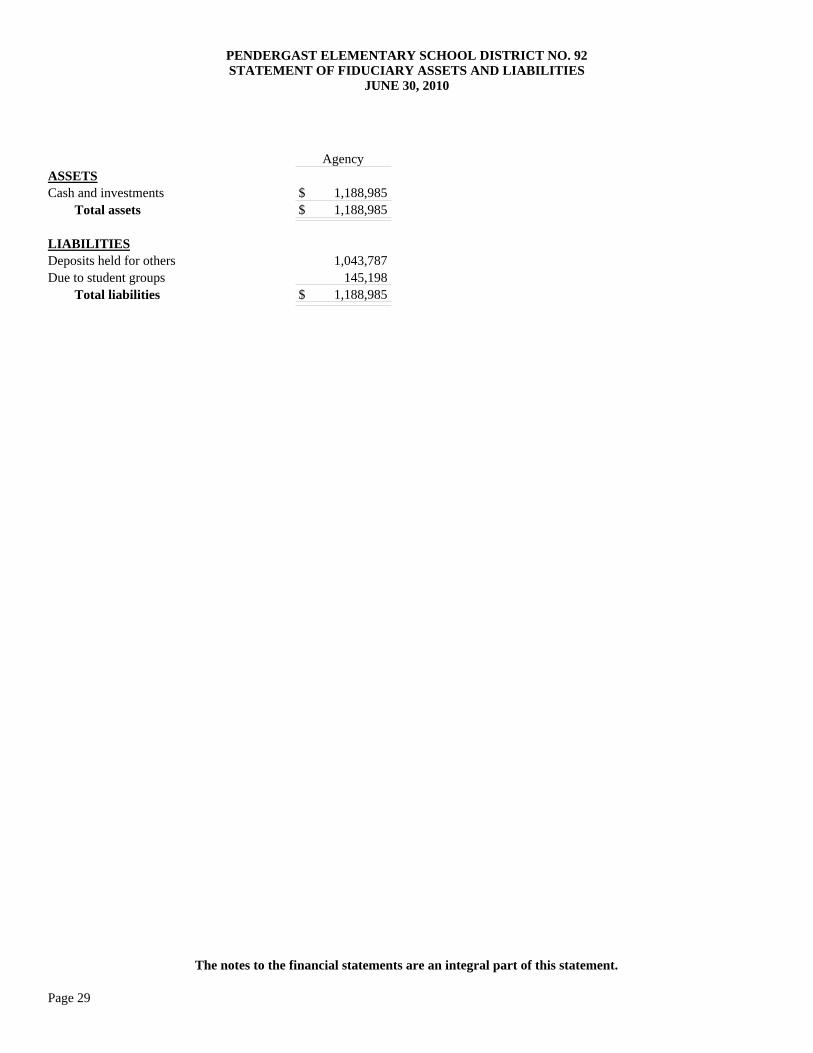
PENDERGAST ELEMENTARY SCHOOL DISTRICT NO. 92STATEMENT OF FIDUCIARY ASSETS AND LIABILITIES
JUNE 30, 2010
AgencyASSETSCash and investments Total assets
LIABILITIESDeposits held for othersDue to student groups Total liabilities
$ 1,188,985 $ 1,188,985
1,043,787 145,198
$ 1,188,985
The notes to the financial statements are an integral part of this statement.
Page 29
PENDERGAST ELEMENTARY SCHOOL DISTRICT NO. 92 NOTES TO FINANCIAL STATEMENTS
JUNE 30, 2010
Page 30
NOTE 1 - SUMMARY OF SIGNIFICANT ACCOUNTING POLICIES The financial statements of the Pendergast Elementary School District No. 92 (District) have been prepared in conformity with accounting principles generally accepted in the United States of America as applied to government units. The Governmental Accounting Standards Board (GASB) is the accepted standard-setting body for establishing governmental accounting and financial reporting principles. The more significant of the District’s accounting policies are described below. A. Reporting Entity The Governing Board is organized under Section 15-321 of the Arizona Revised Statutes (A.R.S.). Management of the District is independent of other state or local governments. The County Treasurer collects taxes for the District, but exercises no control over its expenditures/expenses. The membership of the Governing Board consists of five members elected by the public. Under existing statutes, the Governing Board’s duties and powers include, but are not limited to, the acquisition, maintenance and disposition of school property; the development and adoption of a school program; and the establishment, organization and operation of schools. The Board also has broad financial responsibilities, including the approval of the annual budget, and the establishment of a system of accounting and budgetary controls. The financial reporting entity consists of a primary government and its component units. A component unit is a legally separate entity that must be included in the reporting entity in conformity with generally accepted accounting principles. The District is a primary government because it is a special-purpose government that has a separately elected governing body, is legally separate, and is fiscally independent of other state or local governments. Furthermore, there are no component units combined with the District for financial statement presentation purposes, and the District is not included in any other governmental reporting entity. Consequently, the District’s financial statements include only the funds of those organizational entities for which its elected governing board is financially accountable. The District’s major operations include education, student transportation, construction and maintenance of District facilities, and food services.
PENDERGAST ELEMENTARY SCHOOL DISTRICT NO. 92 NOTES TO FINANCIAL STATEMENTS
JUNE 30, 2010
Page 31
NOTE 1 - SUMMARY OF SIGNIFICANT ACCOUNTING POLICIES (Cont’d) B. Government-Wide and Fund Financial Statements The government-wide financial statements (i.e., the statement of net assets and the statement of activities) present financial information about the District as a whole. The reported information includes all of the nonfiduciary activities of the District. For the most part, the effect of internal activity has been removed from these statements. These statements are to distinguish between the governmental and business-type activities of the District. Governmental activities normally are supported by taxes and intergovernmental revenues, and are reported separately from business-type activities, which rely to a significant extent on fees and charges for support. The District does not have any business-type activities. The statement of activities demonstrates the degree to which the direct expenses of a given function or segment are offset by program revenues. Direct expenses are those that are clearly identifiable with a specific function or segment. Program revenues include 1) charges to customers or applicants who purchase, use, or directly benefit from goods, services, or privileges provided by a given function or segment and 2) grants and contributions that are restricted to meeting the operational or capital requirements of a particular function or segment. Taxes, unrestricted County, State and Federal aid, and other items not included among program revenues are reported instead as general revenues. Separate financial statements are provided for governmental funds and fiduciary funds, even though the latter are excluded from the government-wide financial statements. Major individual governmental funds are reported as separate columns in the fund financial statements. C. Measurement Focus, Basis of Accounting, and Financial Statement Presentation Government-Wide Financial Statements - The government-wide financial statements are reported using the economic resources measurement focus and the accrual basis of accounting. Revenues are recorded when earned and expenses are recorded when a liability is incurred, regardless of the timing of related cash flows. Property taxes are recognized as revenues in the year for which they are levied. Grants and similar items are recognized as revenue as soon as all eligibility requirements imposed by the grantor or provider have been met. As a general rule, the effect of internal activity has been eliminated from the government-wide financial statements; however, the effects of interfund services provided and used between functions are reported as expenses and program revenues at amounts approximating their external exchange value.
PENDERGAST ELEMENTARY SCHOOL DISTRICT NO. 92 NOTES TO FINANCIAL STATEMENTS
JUNE 30, 2010
Page 32
NOTE 1 - SUMMARY OF SIGNIFICANT ACCOUNTING POLICIES (Cont’d) Fund Financial Statements - Governmental fund financial statements are reported using the current financial resources measurement focus and the modified accrual basis of accounting. Revenues are recognized as soon as they are both measurable and available. Revenues are considered to be available when they are collectible within the current period or soon enough thereafter to pay liabilities of the current period. For this purpose, the District considers revenues to be available if they are collected within 60 days of the end of the current fiscal period. Expenditures generally are recorded when a liability is incurred, as under accrual accounting. However, debt service resources are provided during the current year for payment of long-term debt principal and interest due early in the following year (not to exceed one month) and, therefore, the expenditures and related liabilities have been recognized. Compensated absences are recorded only when payment is due. Property taxes, State and County aid, tuition and investment income associated with the current fiscal period are all considered to be susceptible to accrual and have been recognized as revenues of the current fiscal period. Food services and miscellaneous revenues are not susceptible to accrual because generally they are not measurable until received in cash. Grants and similar awards are recognized as revenue as soon as all eligibility requirements imposed by the grantor or provider have been met. Deferred revenues arise when resources are received by the District before it has legal claim to them, as when grant monies are received prior to meeting all eligibility requirements imposed by the provider. Delinquent property taxes and other receivables that will not be collected within the available period have been reported as deferred revenue on the governmental fund financial statements. When both restricted and unrestricted resources are available for use, it is the District’s policy to use restricted resources first, then unrestricted resources as they are needed. The focus of governmental fund financial statements is on major funds rather than reporting funds by type. Each major fund is presented in a separate column. Non-major funds are aggregated and presented in a single column. Fiduciary funds are reported by fund type. The District reports the following major governmental funds:
General Fund - The General Fund is the District’s primary operating fund. It accounts for all resources used to finance District maintenance and operation except those required to be accounted for in other funds. It is described as the Maintenance and Operation Fund by A.R.S. Debt Service Fund - The Debt Service Fund accounts for the accumulation of resources for, and the payment of, long-term debt principal, interest and related costs.
PENDERGAST ELEMENTARY SCHOOL DISTRICT NO. 92 NOTES TO FINANCIAL STATEMENTS
JUNE 30, 2010
Page 33
NOTE 1 - SUMMARY OF SIGNIFICANT ACCOUNTING POLICIES (Cont’d) Bond Building Fund - The Bond Building Fund accounts for proceeds from District bond issues that are expended on the acquisition or lease of sites, construction or renovation of school buildings, improving school grounds, or purchasing pupil transportation vehicles.
Additionally, the District reports the following fund type: Fiduciary Funds – The Fiduciary Funds are Agency Funds which account for resources held by the District on behalf of others. This fund type includes the Student Activities Fund which accounts for monies raised by students to finance student clubs and organizations held by the District as an agent. In addition, funds that account for employee withholdings before the monies are remitted to the appropriate entities are included in the Agency Funds.
The Agency Funds are custodial in nature and do not have a measurement focus and are reported using the accrual basis of accounting. The Agency Funds are reported by type.
D. Cash and Investments A.R.S. require the District to deposit certain cash with the County Treasurer. That cash is pooled for investment purposes, except for cash of the Debt Service and Bond Building Funds that may be invested separately. Interest earned from investments purchased with pooled monies is allocated to each of the District’s funds based on their average balances. As required by statute, interest earnings of the Bond Building Fund are recorded initially in that fund, but then transferred to the Debt Service Fund. All investments are stated at fair value. E. Investment Income Investment income is composed of interest, dividends and net changes in the fair value of applicable investments. Investment income is included in other local revenue in the governmental fund financial statements. F. Receivables and Payables Activity between funds that is representative of lending/borrowing arrangements outstanding at the end of the fiscal year is referred to as either “due to/from other funds” (i.e., the current portion of interfund loans) or “advances to/from other funds” (i.e., the non-current portion of interfund loans). All other outstanding balances between funds are reported as “due to/from other funds.”
PENDERGAST ELEMENTARY SCHOOL DISTRICT NO. 92 NOTES TO FINANCIAL STATEMENTS
JUNE 30, 2010
Page 34
NOTE 1 - SUMMARY OF SIGNIFICANT ACCOUNTING POLICIES (Cont’d) All receivables, including property taxes receivable, are shown net of an allowance for uncollectibles. Property tax levies are obtained by applying tax rates against either the primary assessed valuation or the secondary assessed valuation. Primary and secondary valuation categories are composed of the exact same properties. However, the primary category limits the increase in property values to 10% from the previous year, while there is no limit to the increase in property values for secondary valuation. Override and debt service tax rates are applied to the secondary assessed valuation and all other tax rates are applied to the primary assessed valuation. The County levies real property taxes on or before the third Monday in August, which become due and payable in two equal installments. The first installment is due on the first day of October and becomes delinquent after the first business day of November. The second installment is due on the first day of March of the next year and becomes delinquent after the first business day of May. The billings are considered past due after these dates, at which time the applicable property is subject to penalties and interest. The County also levies various personal property taxes during the year, which are due the second Monday of the month following receipt of the tax notice, and become delinquent 30 days thereafter. Pursuant to A.R.S., a lien against assessed real and personal property attaches on the first day of January preceding assessment and levy; however according to case law, an enforceable legal claim to the asset does not arise. G. Inventory All inventories are valued at cost using the average cost method. Inventories consist of expendable supplies held for consumption. Inventories are recorded as expenses when consumed on the government-wide financial statements and as expenditures when purchased on the fund financial statements. The United States Department of Agriculture (USDA) commodity portion of the food services inventory consists of food donated by the USDA. It is valued at estimated market prices paid by the USDA.
PENDERGAST ELEMENTARY SCHOOL DISTRICT NO. 92 NOTES TO FINANCIAL STATEMENTS
JUNE 30, 2010
Page 35
NOTE 1 - SUMMARY OF SIGNIFICANT ACCOUNTING POLICIES (Cont’d) H. Prepaid Items Certain payments to vendors reflect costs applicable to future accounting periods and are recorded as prepaid items in both the government-wide and fund financial statements. Prepaid items are recorded as expenses when consumed in the government-wide financial statements. Prepaid items are recorded as expenditures when purchased in the fund financial statements and are offset by a reserve of fund balance.
Prepaid items at year end were immaterial and therefore not included on the fund or government-wide financial statements. I. Capital Assets Capital assets, which include land and improvements, buildings and improvements, vehicles, furniture and equipment and construction in progress, are reported in the government-wide financial statements.
Capital assets are defined by the District as assets with an initial, individual cost in excess of $5,000 and an estimated useful life of more than one year. Such assets are recorded at historical cost, or estimated historical cost if actual historical cost is not available. Donated capital assets are recorded at the estimated fair market value at the date of donation.
The costs of normal maintenance and repairs that do not add to the value of the asset or materially extend the life of the asset are not capitalized.
Capital assets are depreciated using the straight-line method over the following estimated useful lives:
Land improvements 5 - 20 years Buildings and improvements 20 - 50 years Vehicles, furniture and equipment 3 - 15 years
J. Compensated Absences The District’s employee vacation and sick leave policies generally provide for granting vacation and sick leave with pay. Accrued sick leave is earned by all employees at the rate of one day per month. Employees can accumulate sick leave without limit but it does not vest. All full-time twelve-month classified employees earn vacation at a rate of 10 to 20 days a year, depending on length of service. Vacation time earned in any school year must be used by June 30 of the following school year or it shall be forfeited. The current and long-term liabilities, including related benefits, for accumulated vacation and sick leave are reported on the government-wide financial statements. A liability for these amounts is reported in governmental funds only if they have matured, for example, as a result of employee leave, resignations and retirements. Generally, resources from the General Fund are used to pay for compensated absences.
PENDERGAST ELEMENTARY SCHOOL DISTRICT NO. 92 NOTES TO FINANCIAL STATEMENTS
JUNE 30, 2010
Page 36
NOTE 1 - SUMMARY OF SIGNIFICANT ACCOUNTING POLICIES (Concl’d) K. Long-term Obligations In the government-wide financial statements, long-term debt and other long-term obligations are reported as liabilities on the statement of net assets. Bond premiums and discounts, as well as issuance costs and the difference between the reacquisition price and the net carrying amount of the old debt, are deferred and amortized over the life of the bonds using the straight-line method over the term of the related debt. In the fund financial statements, governmental fund types recognize bond premiums and discounts, as well as bond issuance costs, during the current period. The face amount of debt issued is reported as other financing sources. Premiums received on debt issuances are reported as other financing sources while discounts on debt issuances are reported as other financing uses. Issuance costs, whether or not withheld from the actual debt proceeds received, are reported as debt service expenditures. L. Fund Equity In the fund financial statements, governmental funds report reservations of fund balance for amounts that are not available for expenditures or are legally restricted by outside parties for use for a specific purpose. M. Interfund Activity Flows of cash from one fund to another without a requirement for repayment are reported as interfund transfers. Interfund transfers between governmental funds are eliminated in the Statement of Activities. Interfund transfers in the fund financial statements are reported as other financing sources/uses in governmental funds. N. Estimates The preparation of the financial statements in conformity with accounting principles generally accepted in the United States of America requires management to make estimates and assumptions that affect the amounts reported in the financial statements and accompanying notes. Actual results may differ from those estimates.
PENDERGAST ELEMENTARY SCHOOL DISTRICT NO. 92 NOTES TO FINANCIAL STATEMENTS
JUNE 30, 2010
Page 37
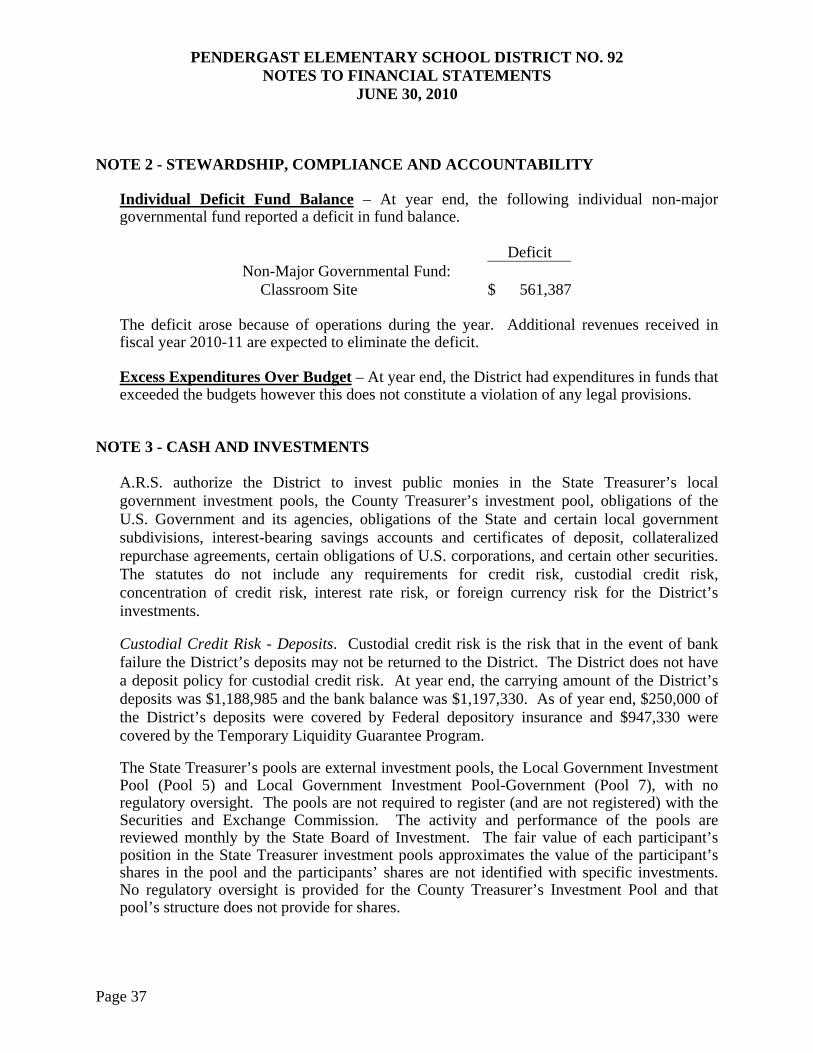
NOTE 2 - STEWARDSHIP, COMPLIANCE AND ACCOUNTABILITY Individual Deficit Fund Balance – At year end, the following individual non-major governmental fund reported a deficit in fund balance.
Deficit Non-Major Governmental Fund:
Classroom Site $ 561,387 The deficit arose because of operations during the year. Additional revenues received in fiscal year 2010-11 are expected to eliminate the deficit. Excess Expenditures Over Budget – At year end, the District had expenditures in funds that exceeded the budgets however this does not constitute a violation of any legal provisions.
NOTE 3 - CASH AND INVESTMENTS A.R.S. authorize the District to invest public monies in the State Treasurer’s local government investment pools, the County Treasurer’s investment pool, obligations of the U.S. Government and its agencies, obligations of the State and certain local government subdivisions, interest-bearing savings accounts and certificates of deposit, collateralized repurchase agreements, certain obligations of U.S. corporations, and certain other securities. The statutes do not include any requirements for credit risk, custodial credit risk, concentration of credit risk, interest rate risk, or foreign currency risk for the District’s investments. Custodial Credit Risk - Deposits. Custodial credit risk is the risk that in the event of bank failure the District’s deposits may not be returned to the District. The District does not have a deposit policy for custodial credit risk. At year end, the carrying amount of the District’s deposits was $1,188,985 and the bank balance was $1,197,330. As of year end, $250,000 of the District’s deposits were covered by Federal depository insurance and $947,330 were covered by the Temporary Liquidity Guarantee Program. The State Treasurer’s pools are external investment pools, the Local Government Investment Pool (Pool 5) and Local Government Investment Pool-Government (Pool 7), with no regulatory oversight. The pools are not required to register (and are not registered) with the Securities and Exchange Commission. The activity and performance of the pools are reviewed monthly by the State Board of Investment. The fair value of each participant’s position in the State Treasurer investment pools approximates the value of the participant’s shares in the pool and the participants’ shares are not identified with specific investments. No regulatory oversight is provided for the County Treasurer’s Investment Pool and that pool’s structure does not provide for shares.
PENDERGAST ELEMENTARY SCHOOL DISTRICT NO. 92 NOTES TO FINANCIAL STATEMENTS
JUNE 30, 2010
Page 38
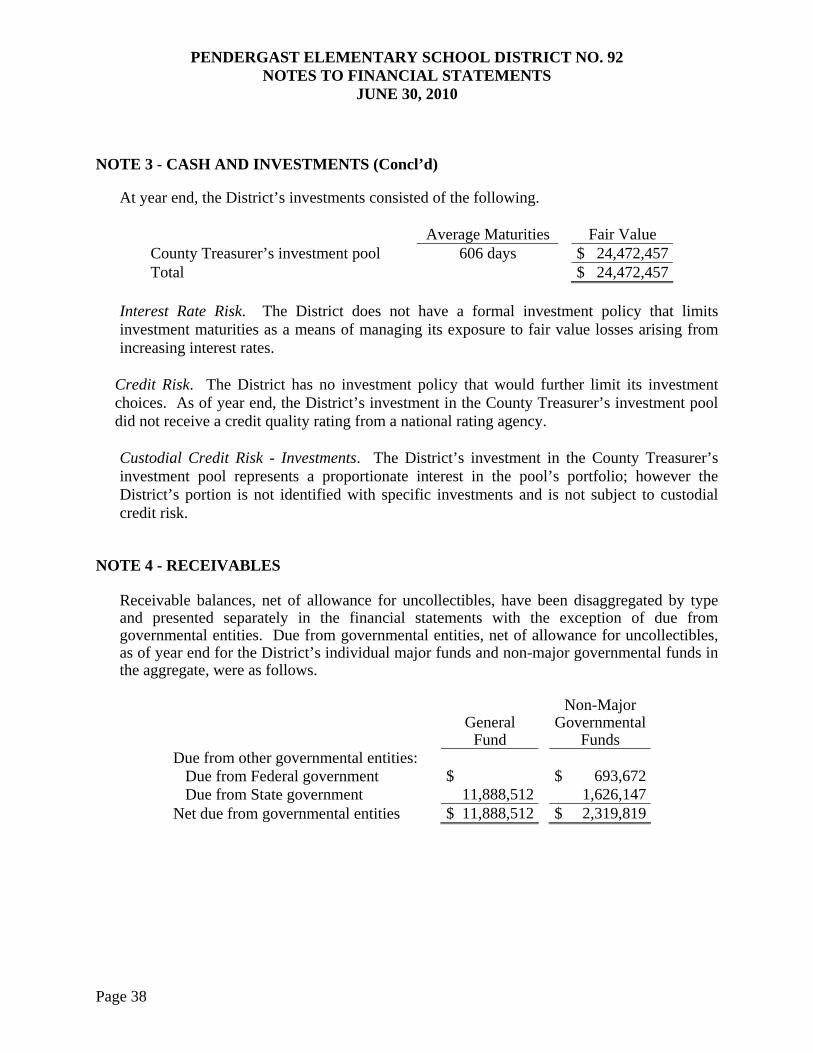
NOTE 3 - CASH AND INVESTMENTS (Concl’d) At year end, the District’s investments consisted of the following.
Average Maturities Fair Value County Treasurer’s investment pool 606 days $ 24,472,457Total $ 24,472,457
Interest Rate Risk. The District does not have a formal investment policy that limits investment maturities as a means of managing its exposure to fair value losses arising from increasing interest rates.
Credit Risk. The District has no investment policy that would further limit its investment choices. As of year end, the District’s investment in the County Treasurer’s investment pool did not receive a credit quality rating from a national rating agency. Custodial Credit Risk - Investments. The District’s investment in the County Treasurer’s investment pool represents a proportionate interest in the pool’s portfolio; however the District’s portion is not identified with specific investments and is not subject to custodial credit risk.
NOTE 4 - RECEIVABLES
Receivable balances, net of allowance for uncollectibles, have been disaggregated by type and presented separately in the financial statements with the exception of due from governmental entities. Due from governmental entities, net of allowance for uncollectibles, as of year end for the District’s individual major funds and non-major governmental funds in the aggregate, were as follows.
General
Fund
Non-Major Governmental
Funds Due from other governmental entities:
Due from Federal government $ $ 693,672 Due from State government 11,888,512 1,626,147
Net due from governmental entities $ 11,888,512 $ 2,319,819
PENDERGAST ELEMENTARY SCHOOL DISTRICT NO. 92 NOTES TO FINANCIAL STATEMENTS
JUNE 30, 2010
Page 39
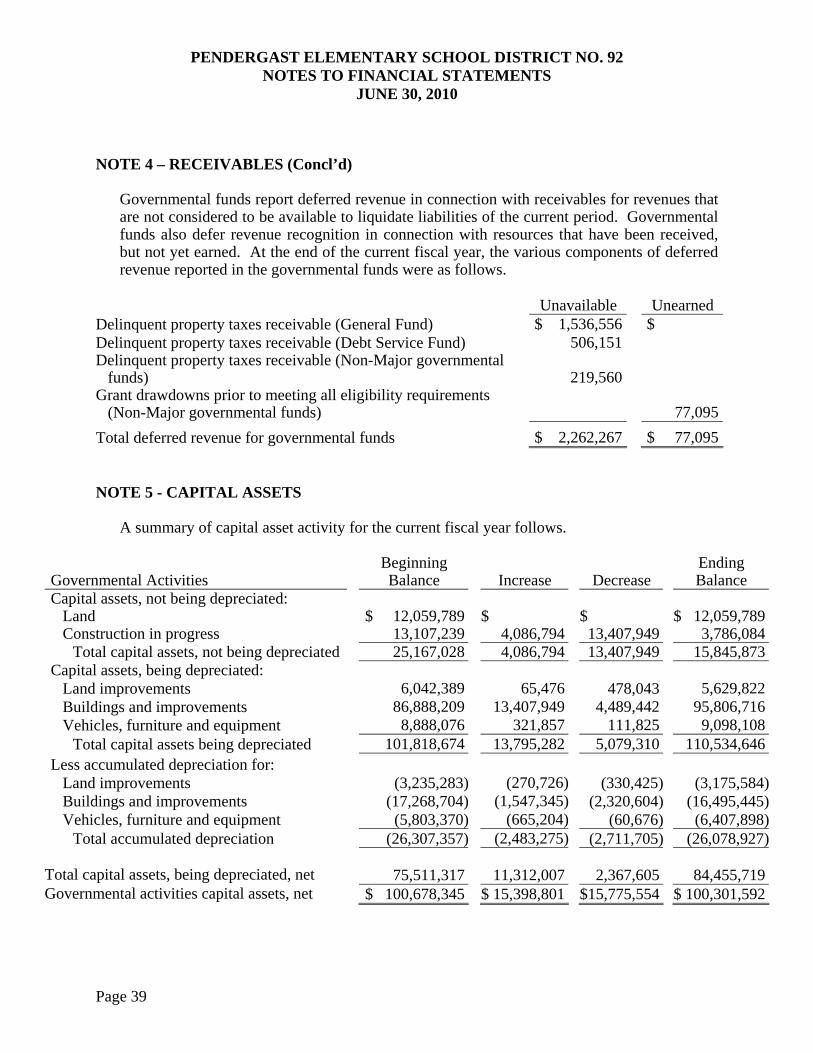
NOTE 4 – RECEIVABLES (Concl’d) Governmental funds report deferred revenue in connection with receivables for revenues that are not considered to be available to liquidate liabilities of the current period. Governmental funds also defer revenue recognition in connection with resources that have been received, but not yet earned. At the end of the current fiscal year, the various components of deferred revenue reported in the governmental funds were as follows.
Unavailable Unearned
Delinquent property taxes receivable (General Fund) $ 1,536,556 $ Delinquent property taxes receivable (Debt Service Fund) 506,151 Delinquent property taxes receivable (Non-Major governmental
funds) 219,560 Grant drawdowns prior to meeting all eligibility requirements
(Non-Major governmental funds) 77,095
Total deferred revenue for governmental funds $ 2,262,267 $ 77,095 NOTE 5 - CAPITAL ASSETS
A summary of capital asset activity for the current fiscal year follows.
Governmental Activities
Beginning Balance Increase Decrease
Ending Balance
Capital assets, not being depreciated:
Land
$ 12,059,789 $ $ $ 12,059,789
Construction in progress
13,107,239 4,086,794 13,407,949 3,786,084 Total capital assets, not being depreciated
25,167,028 4,086,794 13,407,949 15,845,873
Capital assets, being depreciated:
Land improvements
6,042,389 65,476 478,043 5,629,822
Buildings and improvements
86,888,209 13,407,949 4,489,442 95,806,716 Vehicles, furniture and equipment
8,888,076 321,857 111,825 9,098,108
Total capital assets being depreciated
101,818,674 13,795,282 5,079,310 110,534,646 Less accumulated depreciation for:
Land improvements
(3,235,283) (270,726) (330,425) (3,175,584)Buildings and improvements
(17,268,704) (1,547,345) (2,320,604) (16,495,445)
Vehicles, furniture and equipment
(5,803,370) (665,204) (60,676) (6,407,898)Total accumulated depreciation
(26,307,357) (2,483,275) (2,711,705) (26,078,927)
Total capital assets, being depreciated, net
75,511,317 11,312,007 2,367,605 84,455,719
Governmental activities capital assets, net
$ 100,678,345 $ 15,398,801 $15,775,554 $ 100,301,592
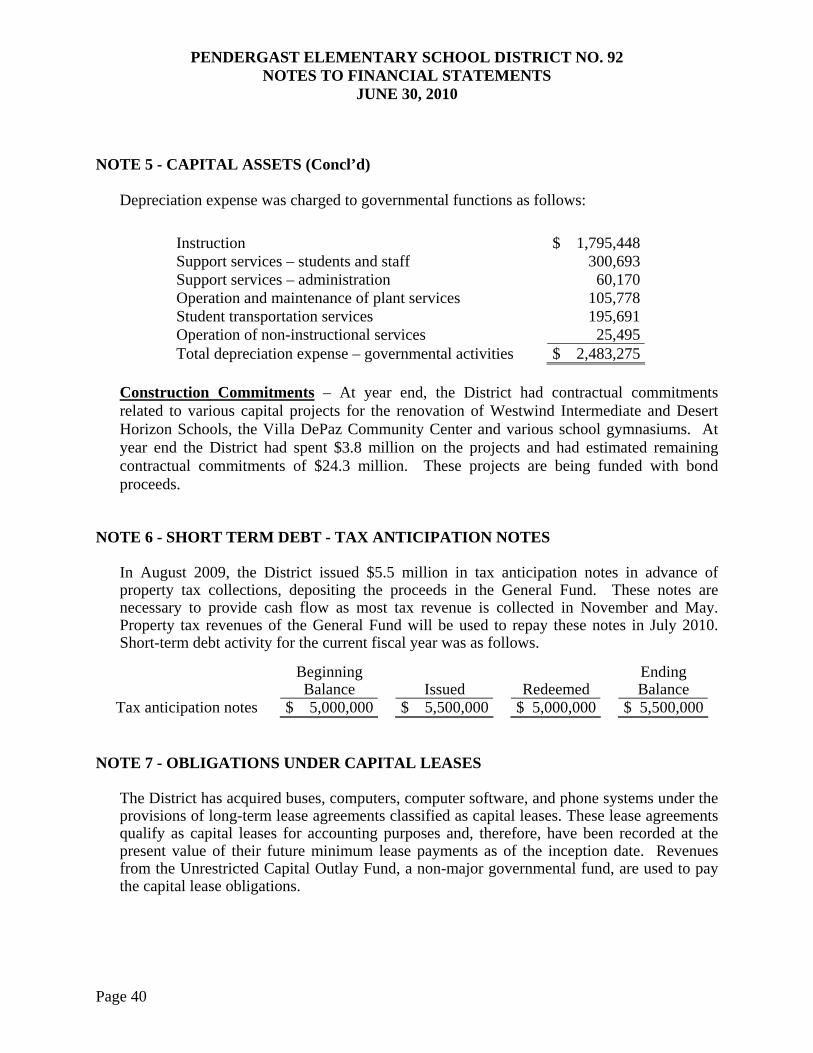
PENDERGAST ELEMENTARY SCHOOL DISTRICT NO. 92 NOTES TO FINANCIAL STATEMENTS
JUNE 30, 2010
Page 40
NOTE 5 - CAPITAL ASSETS (Concl’d) Depreciation expense was charged to governmental functions as follows:
Instruction $ 1,795,448 Support services – students and staff 300,693 Support services – administration 60,170 Operation and maintenance of plant services 105,778 Student transportation services 195,691 Operation of non-instructional services 25,495 Total depreciation expense – governmental activities $ 2,483,275
Construction Commitments – At year end, the District had contractual commitments related to various capital projects for the renovation of Westwind Intermediate and Desert Horizon Schools, the Villa DePaz Community Center and various school gymnasiums. At year end the District had spent $3.8 million on the projects and had estimated remaining contractual commitments of $24.3 million. These projects are being funded with bond proceeds.
NOTE 6 - SHORT TERM DEBT - TAX ANTICIPATION NOTES
In August 2009, the District issued $5.5 million in tax anticipation notes in advance of property tax collections, depositing the proceeds in the General Fund. These notes are necessary to provide cash flow as most tax revenue is collected in November and May. Property tax revenues of the General Fund will be used to repay these notes in July 2010. Short-term debt activity for the current fiscal year was as follows.
Beginning Balance Issued Redeemed
Ending Balance
Tax anticipation notes $ 5,000,000 $ 5,500,000 $ 5,000,000 $ 5,500,000 NOTE 7 - OBLIGATIONS UNDER CAPITAL LEASES
The District has acquired buses, computers, computer software, and phone systems under the provisions of long-term lease agreements classified as capital leases. These lease agreements qualify as capital leases for accounting purposes and, therefore, have been recorded at the present value of their future minimum lease payments as of the inception date. Revenues from the Unrestricted Capital Outlay Fund, a non-major governmental fund, are used to pay the capital lease obligations.

PENDERGAST ELEMENTARY SCHOOL DISTRICT NO. 92 NOTES TO FINANCIAL STATEMENTS
JUNE 30, 2010
Page 41
NOTE 7 - OBLIGATIONS UNDER CAPITAL LEASES (Concl’d) The assets acquired through capital leases that meet the District’s capitalization threshold are as follows.
Governmental
Activities Asset:
Vehicles, furniture and equipment $ 627,630 Less: Accumulated depreciation 387,038
Total $ 240,592
The future minimum lease obligations and the net present value of these minimum lease payments as of year end were as follows.
Year Ending June 30: Governmental
Activities
2011 $ 422,870 2012 422,870 2013 277,283
Total minimum lease payments 1,123,023Less: amount representing interest 99,287Present value of minimum lease payments $ 1,023,736Due within one year $ 370,461
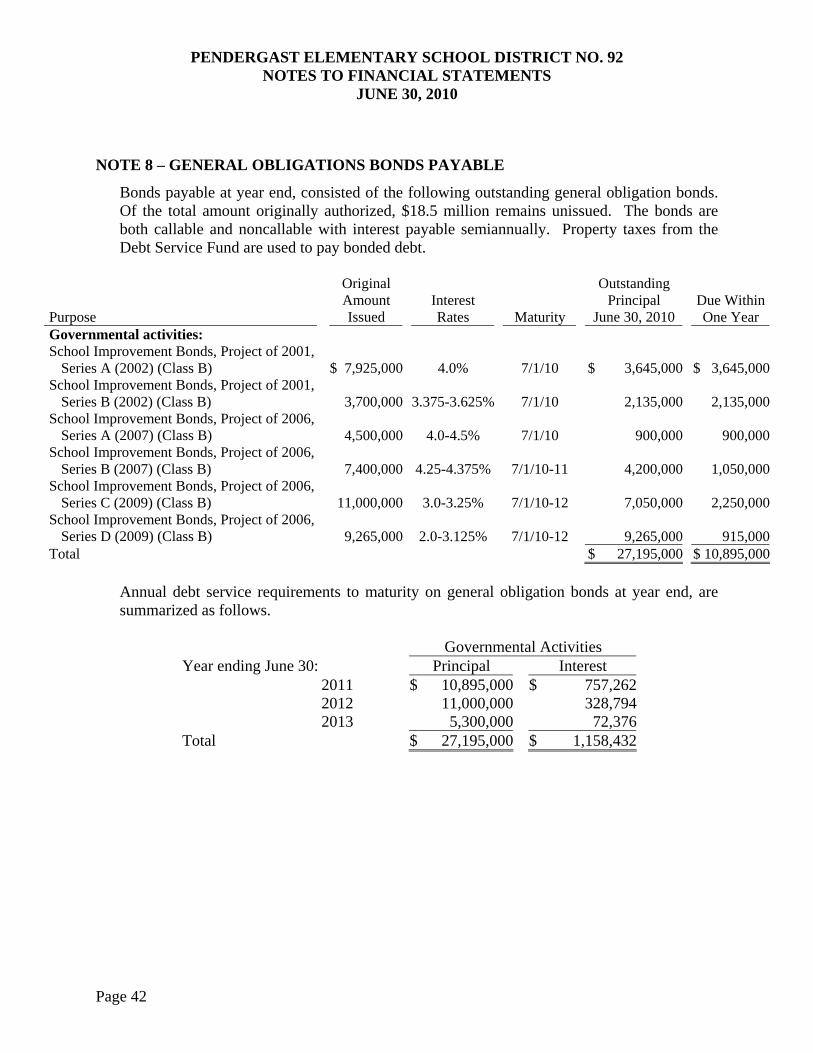
PENDERGAST ELEMENTARY SCHOOL DISTRICT NO. 92 NOTES TO FINANCIAL STATEMENTS
JUNE 30, 2010
Page 42
NOTE 8 – GENERAL OBLIGATIONS BONDS PAYABLE
Bonds payable at year end, consisted of the following outstanding general obligation bonds. Of the total amount originally authorized, $18.5 million remains unissued. The bonds are both callable and noncallable with interest payable semiannually. Property taxes from the Debt Service Fund are used to pay bonded debt.
Purpose
Original Amount Issued
Interest Rates Maturity
Outstanding Principal
June 30, 2010 Due WithinOne Year
Governmental activities: School Improvement Bonds, Project of 2001,
Series A (2002) (Class B) $ 7,925,000
4.0% 7/1/10 $ 3,645,000 $ 3,645,000School Improvement Bonds, Project of 2001,
Series B (2002) (Class B) 3,700,000
3.375-3.625% 7/1/10 2,135,000 2,135,000School Improvement Bonds, Project of 2006,
Series A (2007) (Class B) 4,500,000
4.0-4.5% 7/1/10 900,000 900,000School Improvement Bonds, Project of 2006,
Series B (2007) (Class B) 7,400,000
4.25-4.375% 7/1/10-11 4,200,000 1,050,000School Improvement Bonds, Project of 2006,
Series C (2009) (Class B) 11,000,000
3.0-3.25% 7/1/10-12 7,050,000 2,250,000School Improvement Bonds, Project of 2006,
Series D (2009) (Class B) 9,265,000
2.0-3.125% 7/1/10-12 9,265,000 915,000Total $ 27,195,000 $ 10,895,000
Annual debt service requirements to maturity on general obligation bonds at year end, are summarized as follows.
Governmental Activities Year ending June 30: Principal Interest
2011 $ 10,895,000 $ 757,2622012 11,000,000 328,7942013 5,300,000 72,376
Total $ 27,195,000 $ 1,158,432
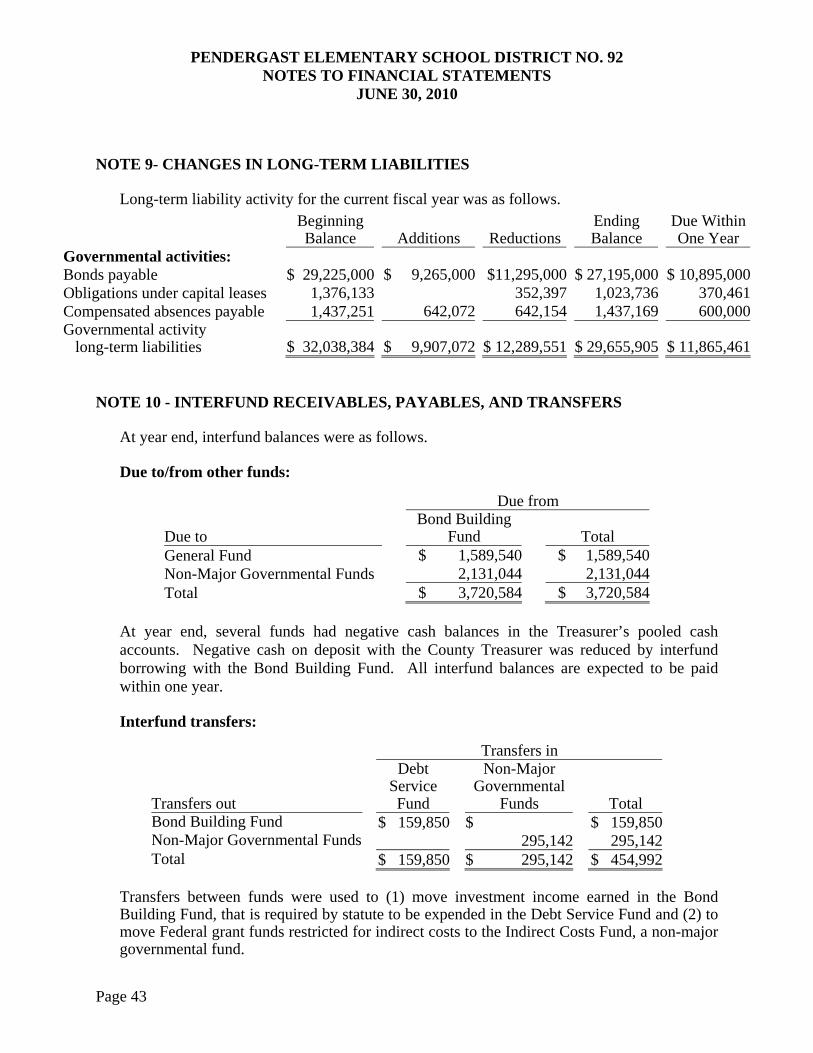
PENDERGAST ELEMENTARY SCHOOL DISTRICT NO. 92 NOTES TO FINANCIAL STATEMENTS
JUNE 30, 2010
Page 43
NOTE 9- CHANGES IN LONG-TERM LIABILITIES Long-term liability activity for the current fiscal year was as follows.
Beginning Balance Additions Reductions
Ending Balance
Due WithinOne Year
Governmental activities: Bonds payable $ 29,225,000 $ 9,265,000 $11,295,000 $ 27,195,000 $ 10,895,000 Obligations under capital leases 1,376,133 352,397 1,023,736 370,461 Compensated absences payable 1,437,251 642,072 642,154 1,437,169 600,000 Governmental activity long-term liabilities
$ 32,038,384 $ 9,907,072 $ 12,289,551 $ 29,655,905 $ 11,865,461
NOTE 10 - INTERFUND RECEIVABLES, PAYABLES, AND TRANSFERS
At year end, interfund balances were as follows. Due to/from other funds:
Due from
Due to Bond Building
Fund Total General Fund $ 1,589,540 $ 1,589,540 Non-Major Governmental Funds 2,131,044 2,131,044Total $ 3,720,584 $ 3,720,584
At year end, several funds had negative cash balances in the Treasurer’s pooled cash accounts. Negative cash on deposit with the County Treasurer was reduced by interfund borrowing with the Bond Building Fund. All interfund balances are expected to be paid within one year. Interfund transfers:
Transfers in
Transfers out
Debt Service Fund
Non-Major Governmental
Funds Total Bond Building Fund $ 159,850 $ $ 159,850 Non-Major Governmental Funds 295,142 295,142 Total $ 159,850 $ 295,142 $ 454,992
Transfers between funds were used to (1) move investment income earned in the Bond Building Fund, that is required by statute to be expended in the Debt Service Fund and (2) to move Federal grant funds restricted for indirect costs to the Indirect Costs Fund, a non-major governmental fund.
PENDERGAST ELEMENTARY SCHOOL DISTRICT NO. 92 NOTES TO FINANCIAL STATEMENTS
JUNE 30, 2010
Page 44
NOTE 11 - CONTINGENT LIABILITIES Compliance – Amounts received or receivable from grantor agencies are subject to audit and adjustment by grantor agencies, principally the federal government. Any disallowed claims, including amounts already collected, may constitute a liability of the applicable funds. The amount, if any, of expenditures/expenses that may be disallowed by the grantor cannot be determined at this time, although the District expects such amounts, if any, to be immaterial. Lease-To-Own Agreement - The Arizona Schools Facilities Board (SFB) entered into a lease in January 2003 to finance costs of the District’s new school facilities pursuant to A.R.S. 15-2004, 15-2005 and 15-2006. The SFB is required to make all lease payments, however if the SFB does not make the lease payments, the District has the option to make the payments on behalf of the SFB to ensure the facilities do not revert back to the lessor.
NOTE 12 - RISK MANAGEMENT The District is exposed to various risks of loss related to torts; theft of, damage to, and destruction of assets; errors and omissions; injuries to employees; and natural disasters. The District was unable to obtain general property and liability insurance at a cost it considered to be economically justifiable. Therefore, the District joined the Arizona School Risk Retention Trust, Inc. (ASRRT). ASRRT is a public entity risk pool currently operating as a common risk management and insurance program for school districts and community colleges in the State. The District pays an annual premium to ASRRT for its general insurance coverage. The agreement provides that ASRRT will be self-sustaining through member premiums and will reinsure through commercial companies for claims in excess of specified amounts. The District’s employees have health and accident insurance coverage with the Arizona School Board Association Insurance Trust (ASBAIT). ASBAIT is a public entity risk pool currently operating as a common risk management and insurance program for school districts in the State. The District pays a monthly premium to ASBAIT for employees’ health and accident insurance coverage. The agreement provides that ASBAIT will be self-sustaining through member premiums and will reinsure through commercial companies for claims in excess of specified amounts. The District joined the Arizona School Alliance for Workers’ Compensation, Inc. (Alliance) together with other school districts in the state for risks of loss related to workers’ compensation claims. The Alliance is a public entity risk pool currently operating as a common risk management and insurance program for school districts in the State. The District pays quarterly premiums to the Alliance for its employee workers’ compensation coverage. The agreement provides that the Alliance will be self-sustaining through members’ premiums and will reinsure through commercial companies for claims in excess of specified amounts for each insured event.
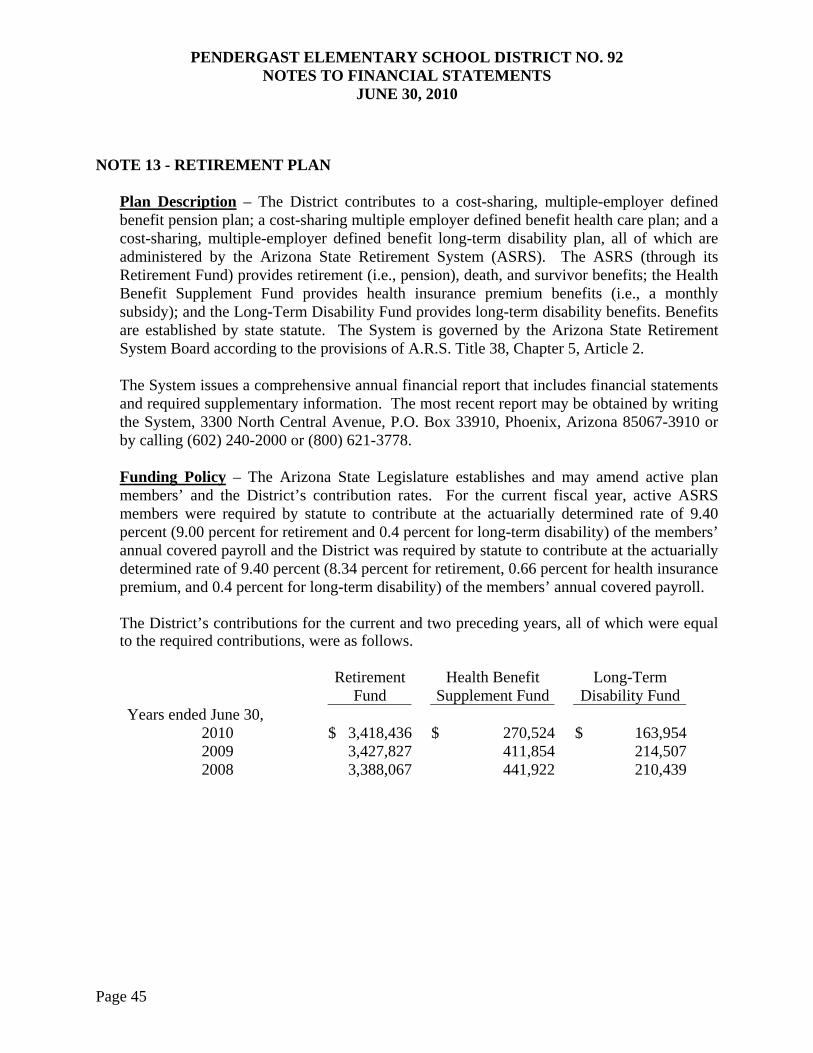
PENDERGAST ELEMENTARY SCHOOL DISTRICT NO. 92 NOTES TO FINANCIAL STATEMENTS
JUNE 30, 2010
Page 45
NOTE 13 - RETIREMENT PLAN Plan Description – The District contributes to a cost-sharing, multiple-employer defined benefit pension plan; a cost-sharing multiple employer defined benefit health care plan; and a cost-sharing, multiple-employer defined benefit long-term disability plan, all of which are administered by the Arizona State Retirement System (ASRS). The ASRS (through its Retirement Fund) provides retirement (i.e., pension), death, and survivor benefits; the Health Benefit Supplement Fund provides health insurance premium benefits (i.e., a monthly subsidy); and the Long-Term Disability Fund provides long-term disability benefits. Benefits are established by state statute. The System is governed by the Arizona State Retirement System Board according to the provisions of A.R.S. Title 38, Chapter 5, Article 2.
The System issues a comprehensive annual financial report that includes financial statements and required supplementary information. The most recent report may be obtained by writing the System, 3300 North Central Avenue, P.O. Box 33910, Phoenix, Arizona 85067-3910 or by calling (602) 240-2000 or (800) 621-3778.
Funding Policy – The Arizona State Legislature establishes and may amend active plan members’ and the District’s contribution rates. For the current fiscal year, active ASRS members were required by statute to contribute at the actuarially determined rate of 9.40 percent (9.00 percent for retirement and 0.4 percent for long-term disability) of the members’ annual covered payroll and the District was required by statute to contribute at the actuarially determined rate of 9.40 percent (8.34 percent for retirement, 0.66 percent for health insurance premium, and 0.4 percent for long-term disability) of the members’ annual covered payroll.
The District’s contributions for the current and two preceding years, all of which were equal to the required contributions, were as follows.
Retirement
Fund Health Benefit
Supplement Fund Long-Term
Disability FundYears ended June 30,
2010 $ 3,418,436 $ 270,524 $ 163,954 2009 3,427,827 411,854 214,5072008 3,388,067 441,922 210,439

PENDERGAST ELEMENTARY SCHOOL DISTRICT NO. 92 NOTES TO FINANCIAL STATEMENTS
JUNE 30, 2010
Page 46
NOTE 14 - SUBSEQUENT EVENTS
Tax Anticipation Notes - In August 2010, the District issued $4.0 million of tax anticipation notes in advance of property tax collections, depositing the proceeds in its General Fund. General Obligation Bond Issuance - In August 2010, the District issued School Improvement Bonds, Series D in the amount of $9.3 million, maturing on July 1, 2012, with an average interest rate of 3 percent. The purpose of the bonds is school improvement projects. Budget Override – On November 2, 2010, District voters approved a 15 percent Maintenance and Operation budget override to replace the current overrides. The budget override will be used to fund music, art and physical education programs, maintain teacher-pupil ratio levels and provide counseling and learning interventions.
Page 47
SCHEDULE OF REVENUES, EXPENDITURES AND CHANGES IN FUND BALANCES - BUDGET AND ACTUAL
(Required Supplementary Information)
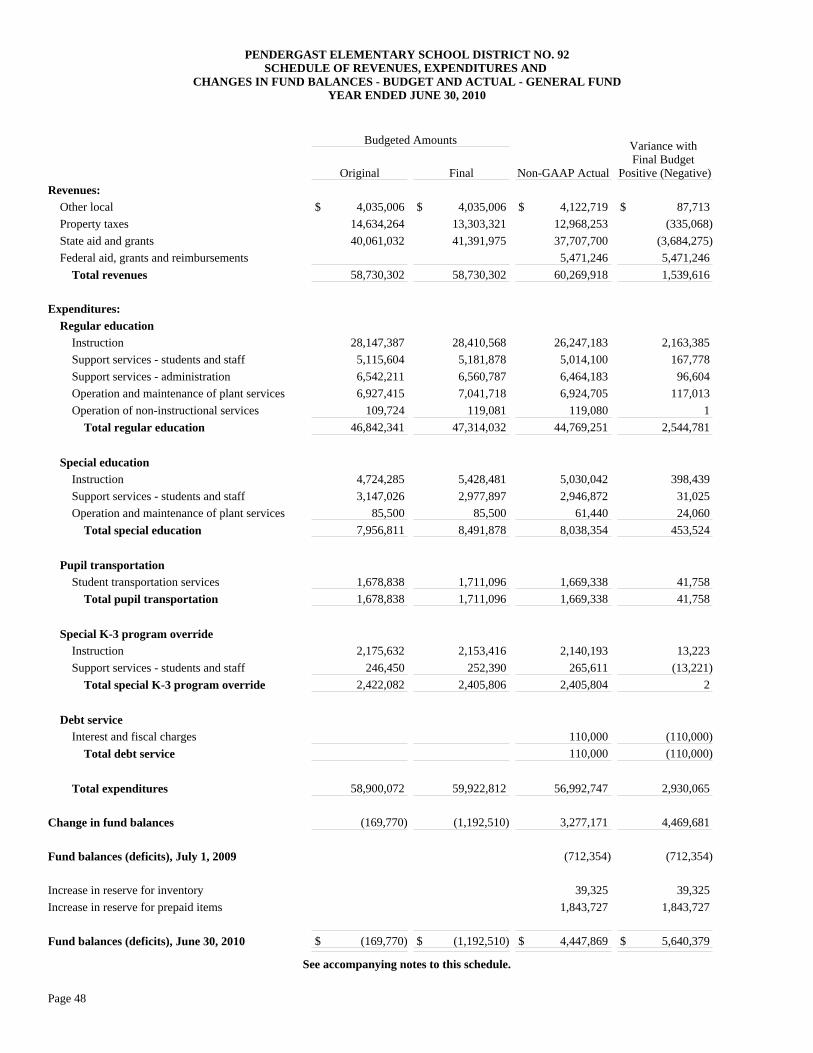
PENDERGAST ELEMENTARY SCHOOL DISTRICT NO. 92SCHEDULE OF REVENUES, EXPENDITURES AND
CHANGES IN FUND BALANCES - BUDGET AND ACTUAL - GENERAL FUNDYEAR ENDED JUNE 30, 2010
Budgeted Amounts
Original Final Non-GAAP Actual
Variance with Final Budget
Positive (Negative)
Revenues:
Other local
Property taxes
State aid and grants
Federal aid, grants and reimbursements
Total revenues
Expenditures:
Regular education
Instruction
Support services - students and staff
Support services - administration
Operation and maintenance of plant services
Operation of non-instructional services
Total regular education
Special education
Instruction
Support services - students and staff
Operation and maintenance of plant services
Total special education
Pupil transportation
Student transportation services
Total pupil transportation
Special K-3 program override
Instruction
Support services - students and staff
Total special K-3 program override
Debt service
Interest and fiscal charges
Total debt service
Total expenditures
Change in fund balances
Fund balances (deficits), July 1, 2009
Increase in reserve for inventory
Increase in reserve for prepaid items
Fund balances (deficits), June 30, 2010
$ 4,035,006 $ 4,035,006 $ 4,122,719 $ 87,713
14,634,264 13,303,321 12,968,253 (335,068)
40,061,032 41,391,975 37,707,700 (3,684,275)
5,471,246 5,471,246
58,730,302 58,730,302 60,269,918 1,539,616
28,147,387 28,410,568 26,247,183 2,163,385
5,115,604 5,181,878 5,014,100 167,778
6,542,211 6,560,787 6,464,183 96,604
6,927,415 7,041,718 6,924,705 117,013
109,724 119,081 119,080 1
46,842,341 47,314,032 44,769,251 2,544,781
4,724,285 5,428,481 5,030,042 398,439
3,147,026 2,977,897 2,946,872 31,025
85,500 85,500 61,440 24,060
7,956,811 8,491,878 8,038,354 453,524
1,678,838 1,711,096 1,669,338 41,758
1,678,838 1,711,096 1,669,338 41,758
2,175,632 2,153,416 2,140,193 13,223
246,450 252,390 265,611 (13,221)
2,422,082 2,405,806 2,405,804 2
110,000 (110,000)
110,000 (110,000)
58,900,072 59,922,812 56,992,747 2,930,065
(169,770) (1,192,510) 3,277,171 4,469,681
(712,354) (712,354)
39,325 39,325
1,843,727 1,843,727
$ (169,770) $ (1,192,510) $ 4,447,869 $ 5,640,379
See accompanying notes to this schedule.
Page 48
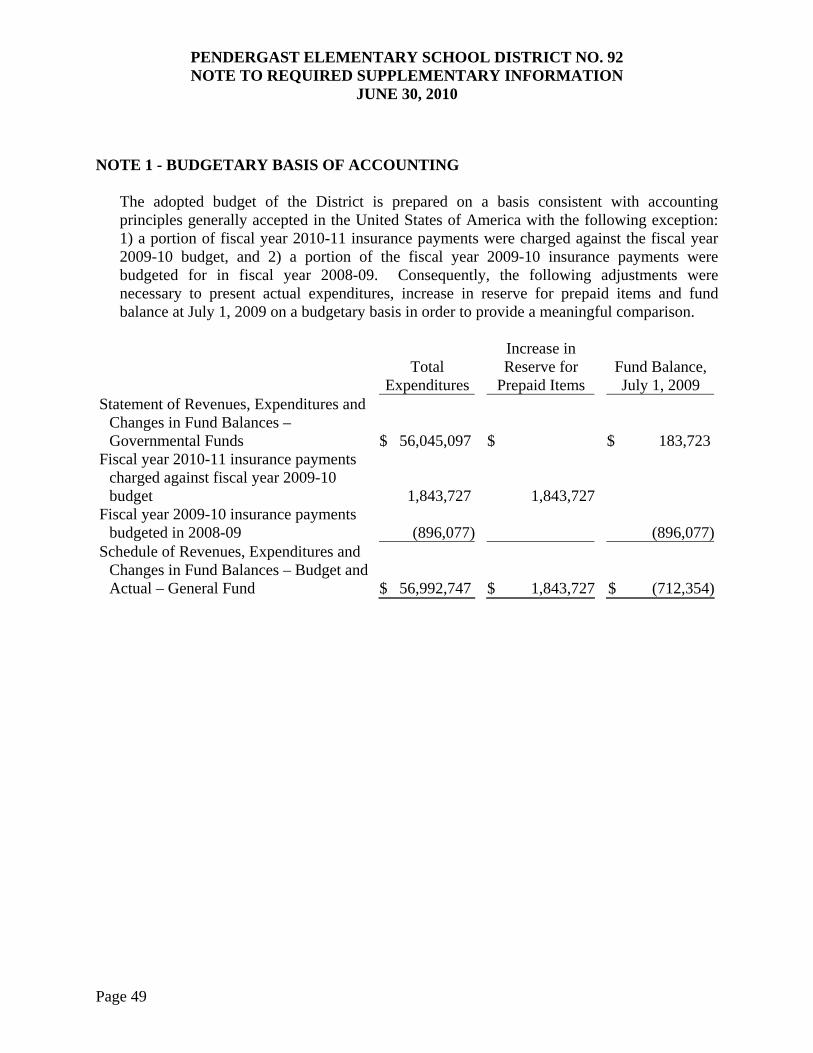
PENDERGAST ELEMENTARY SCHOOL DISTRICT NO. 92 NOTE TO REQUIRED SUPPLEMENTARY INFORMATION
JUNE 30, 2010
Page 49
NOTE 1 - BUDGETARY BASIS OF ACCOUNTING The adopted budget of the District is prepared on a basis consistent with accounting principles generally accepted in the United States of America with the following exception: 1) a portion of fiscal year 2010-11 insurance payments were charged against the fiscal year 2009-10 budget, and 2) a portion of the fiscal year 2009-10 insurance payments were budgeted for in fiscal year 2008-09. Consequently, the following adjustments were necessary to present actual expenditures, increase in reserve for prepaid items and fund balance at July 1, 2009 on a budgetary basis in order to provide a meaningful comparison.
Total
Expenditures
Increase in Reserve for
Prepaid Items Fund Balance, July 1, 2009
Statement of Revenues, Expenditures and Changes in Fund Balances – Governmental Funds $ 56,045,097 $ $ 183,723
Fiscal year 2010-11 insurance payments charged against fiscal year 2009-10 budget 1,843,727 1,843,727
Fiscal year 2009-10 insurance payments budgeted in 2008-09 (896,077) (896,077)
Schedule of Revenues, Expenditures and Changes in Fund Balances – Budget and Actual – General Fund $ 56,992,747 $ 1,843,727
$ (712,354)

Page 50
(This page intentionally left blank)
Page 51
COMBINING AND INDIVIDUAL FUND FINANCIAL STATEMENTS
AND SCHEDULES

Page 52
(This page intentionally left blank)
Page 53
OTHER MAJOR GOVERNMENTAL FUNDS SCHEDULE OF REVENUES, EXPENDITURES AND
CHANGES IN FUND BALANCES – BUDGET AND ACTUAL
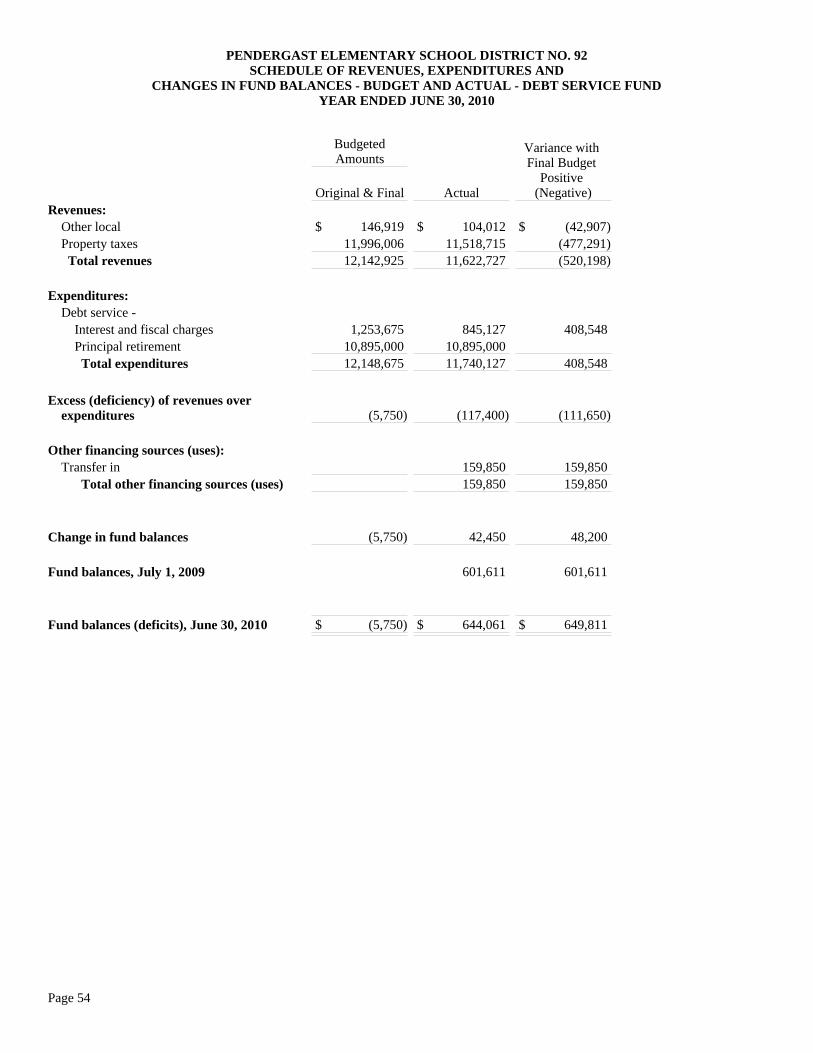
PENDERGAST ELEMENTARY SCHOOL DISTRICT NO. 92SCHEDULE OF REVENUES, EXPENDITURES AND
CHANGES IN FUND BALANCES - BUDGET AND ACTUAL - DEBT SERVICE FUNDYEAR ENDED JUNE 30, 2010
BudgetedAmounts
Original & Final Actual
Variance with Final Budget
Positive (Negative)
Revenues: Other local Property taxes Total revenues
Expenditures: Debt service - Interest and fiscal charges Principal retirement Total expenditures
Excess (deficiency) of revenues over expenditures
Other financing sources (uses): Transfer in Total other financing sources (uses)
Change in fund balances
Fund balances, July 1, 2009
Fund balances (deficits), June 30, 2010
$ 146,919 $ 104,012 $ (42,907)11,996,006 11,518,715 (477,291)12,142,925 11,622,727 (520,198)
1,253,675 845,127 408,548 10,895,000 10,895,000 12,148,675 11,740,127 408,548
(5,750) (117,400) (111,650)
159,850 159,850 159,850 159,850
(5,750) 42,450 48,200
601,611 601,611
$ (5,750) $ 644,061 $ 649,811
Page 54
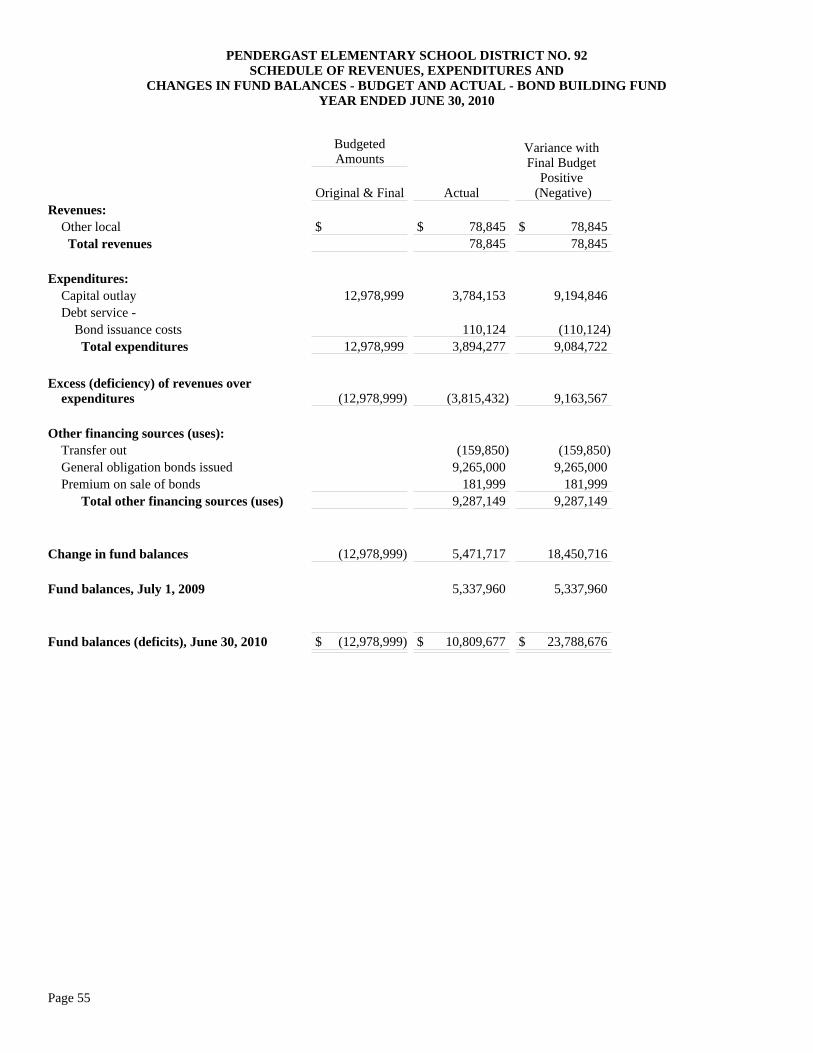
PENDERGAST ELEMENTARY SCHOOL DISTRICT NO. 92SCHEDULE OF REVENUES, EXPENDITURES AND
CHANGES IN FUND BALANCES - BUDGET AND ACTUAL - BOND BUILDING FUNDYEAR ENDED JUNE 30, 2010
BudgetedAmounts
Original & Final Actual
Variance with Final Budget
Positive (Negative)
Revenues: Other local Total revenues
Expenditures: Capital outlay Debt service - Bond issuance costs Total expenditures
Excess (deficiency) of revenues over expenditures
Other financing sources (uses): Transfer out General obligation bonds issued Premium on sale of bonds Total other financing sources (uses)
Change in fund balances
Fund balances, July 1, 2009
Fund balances (deficits), June 30, 2010
$ $ 78,845 $ 78,845 78,845 78,845
12,978,999 3,784,153 9,194,846
110,124 (110,124)12,978,999 3,894,277 9,084,722
(12,978,999) (3,815,432) 9,163,567
(159,850) (159,850) 9,265,000 9,265,000 181,999 181,999 9,287,149 9,287,149
(12,978,999) 5,471,717 18,450,716
5,337,960 5,337,960
$ (12,978,999) $ 10,809,677 $ 23,788,676
Page 55

Page 56
(This page intentionally left blank)
Page 57
NON-MAJOR GOVERNMENTAL FUNDS
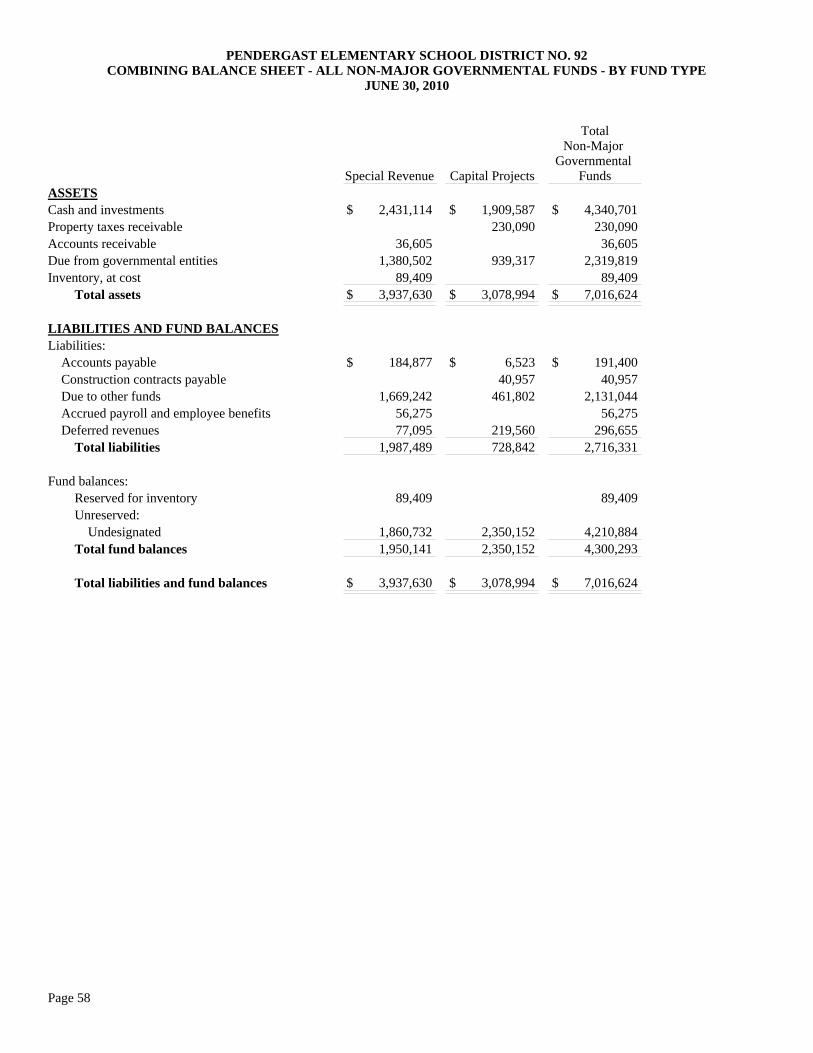
PENDERGAST ELEMENTARY SCHOOL DISTRICT NO. 92COMBINING BALANCE SHEET - ALL NON-MAJOR GOVERNMENTAL FUNDS - BY FUND TYPE
JUNE 30, 2010
Special Revenue Capital Projects
TotalNon-Major
Governmental Funds
ASSETSCash and investmentsProperty taxes receivableAccounts receivableDue from governmental entitiesInventory, at cost Total assets
LIABILITIES AND FUND BALANCESLiabilities: Accounts payable Construction contracts payable Due to other funds Accrued payroll and employee benefits Deferred revenues Total liabilities
Fund balances: Reserved for inventory Unreserved: Undesignated Total fund balances
Total liabilities and fund balances
$ 2,431,114 $ 1,909,587 $ 4,340,701 230,090 230,090
36,605 36,605 1,380,502 939,317 2,319,819
89,409 89,409 $ 3,937,630 $ 3,078,994 $ 7,016,624
$ 184,877 $ 6,523 $ 191,400 40,957 40,957
1,669,242 461,802 2,131,044 56,275 56,275 77,095 219,560 296,655
1,987,489 728,842 2,716,331
89,409 89,409
1,860,732 2,350,152 4,210,884 1,950,141 2,350,152 4,300,293
$ 3,937,630 $ 3,078,994 $ 7,016,624
Page 58
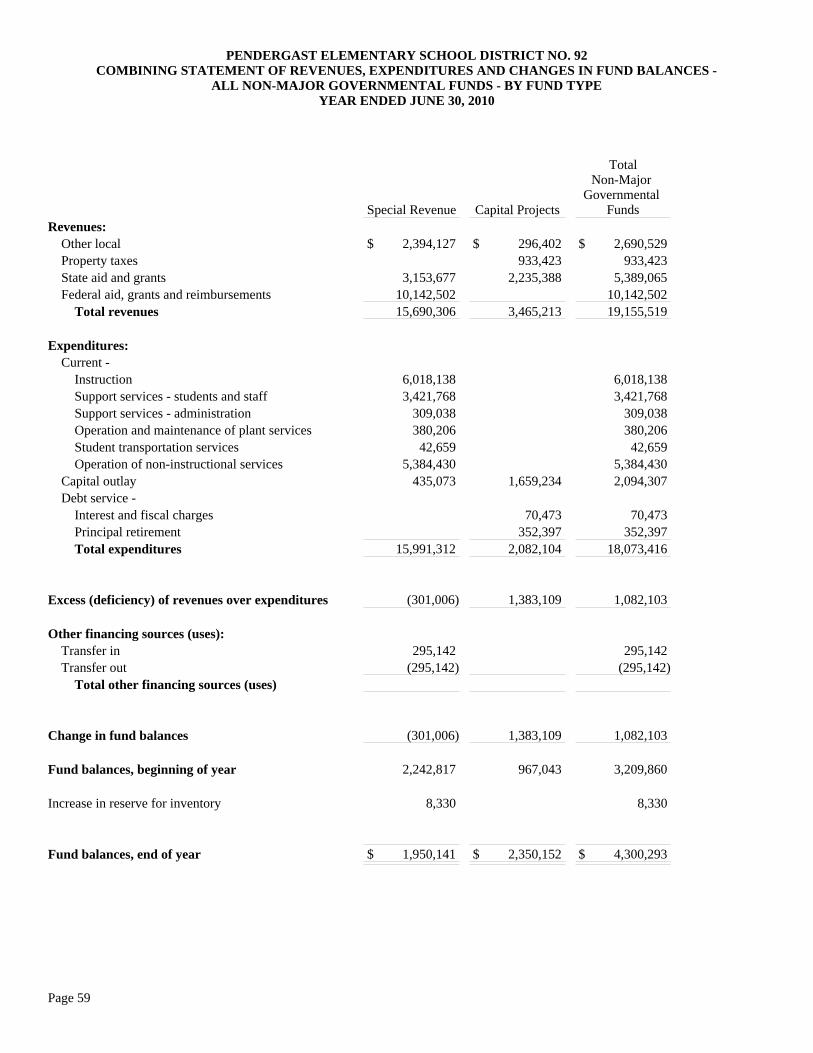
PENDERGAST ELEMENTARY SCHOOL DISTRICT NO. 92COMBINING STATEMENT OF REVENUES, EXPENDITURES AND CHANGES IN FUND BALANCES -
ALL NON-MAJOR GOVERNMENTAL FUNDS - BY FUND TYPEYEAR ENDED JUNE 30, 2010
Special Revenue Capital Projects
TotalNon-Major
Governmental Funds
Revenues: Other local Property taxes State aid and grants Federal aid, grants and reimbursements Total revenues
Expenditures: Current - Instruction Support services - students and staff Support services - administration Operation and maintenance of plant services Student transportation services Operation of non-instructional services Capital outlay Debt service - Interest and fiscal charges Principal retirement Total expenditures
Excess (deficiency) of revenues over expenditures
Other financing sources (uses): Transfer in Transfer out Total other financing sources (uses)
Change in fund balances
Fund balances, beginning of year
Increase in reserve for inventory
Fund balances, end of year
$ 2,394,127 $ 296,402 $ 2,690,529 933,423 933,423
3,153,677 2,235,388 5,389,065 10,142,502 10,142,502 15,690,306 3,465,213 19,155,519
6,018,138 6,018,138 3,421,768 3,421,768
309,038 309,038 380,206 380,206
42,659 42,659 5,384,430 5,384,430
435,073 1,659,234 2,094,307
70,473 70,473 352,397 352,397
15,991,312 2,082,104 18,073,416
(301,006) 1,383,109 1,082,103
295,142 295,142 (295,142) (295,142)
(301,006) 1,383,109 1,082,103
2,242,817 967,043 3,209,860
8,330 8,330
$ 1,950,141 $ 2,350,152 $ 4,300,293
Page 59

Page 60
NON-MAJOR SPECIAL REVENUE FUNDS The following non-major Special Revenue Funds are maintained by the District. Arizona Revised Statutes (A.R.S.) and the Uniform System of Financial Records (USFR) require the establishment of these funds for the specified financial activities. Classroom Site - to account for the financial activity for the portion of state sales tax collections and permanent state school fund earnings as approved by the voters in 2000. Instructional Improvement - to account for the activity of monies received from gaming revenue. County, City and Town Grants - to account for monies received from county, city and town grants. Full-Day Kindergarten - to account for monies received for full-day kindergarten, including capital and interest earned. Compensatory Instruction - to account for monies received for programs in addition to normal classroom instruction to improve the English proficiency of current English language learners. Title I Grants - to account for financial assistance received for the purpose of improving the teaching and learning of children failing, or most at-risk of failing, to meet challenging State academic standards. Professional Development and Technology Grants - to account for financial assistance received to increase student academic achievement through improving teacher quality. Title IV Grants - to account for financial assistance received for chemical abuse awareness programs and expanding projects that benefit educational and health needs of the communities. Limited English and Immigrant Students - to account for financial assistance received for educational services and costs for limited English and immigrant children. Special Education Grants - to account for supplemental financial assistance received to provide a free, appropriate public education to disabled children. Medicaid Reimbursement - to account for reimbursements related to specific health services provided to eligible students. Other Federal Projects - to account for financial assistance received for other supplemental federal projects. Early Childhood Block Grant - to account for financial assistance received for preschool education. Gifted - to account for financial assistance received for programs for gifted students.
Page 61
Other State Projects - to account for financial assistance received for other State projects. School Plant - to account for proceeds from the sale or lease of school property. Food Service - to account for the financial activity of school activities that have as their purpose the preparation and serving of regular and incidental meals and snacks in connection with school functions. Civic Center - to account for monies received from the rental of school facilities for civic activities. Community School - to account for activity related to academic and skill development for all citizens. Auxiliary Operations - to account for activity arising from bookstore, athletic and miscellaneous District related operations. Extracurricular Activities Fees Tax Credit - to account for activity related to monies collected in support of extracurricular activities to be taken as a tax credit by the tax payer in accordance with A.R.S. §43-1089.01. Gifts and Donations - to account for activity related to gifts, donations, bequests and private grants made to the District. Fingerprint - to account for activity of fingerprinting employees as mandated by the State. Insurance Proceeds - to account for the monies received from insurance claims. Textbooks - to account for monies received from students to replace or repair lost or damaged textbooks. Litigation Recovery - to account for monies received for and derived from litigation. Indirect Costs - to account for monies transferred from Federal projects for administrative costs. Unemployment Insurance - to account for unemployment insurance contributions using the reimbursement method of accounting to the Department of Economic Security. Insurance Refund - to account for insurance premium payments that are refunded to the District. Grants and Gifts to Teachers - to account for grants and gifts under $1,500 received from private sources that are designated for use by a teacher for instructional purposes. Joint Technological Education - to account for monies received from Joint Technological Education Districts for vocational education programs. Intergovernmental Agreements - to account for the financial activities relating to agreements with other governments not required to be accounted for elsewhere.
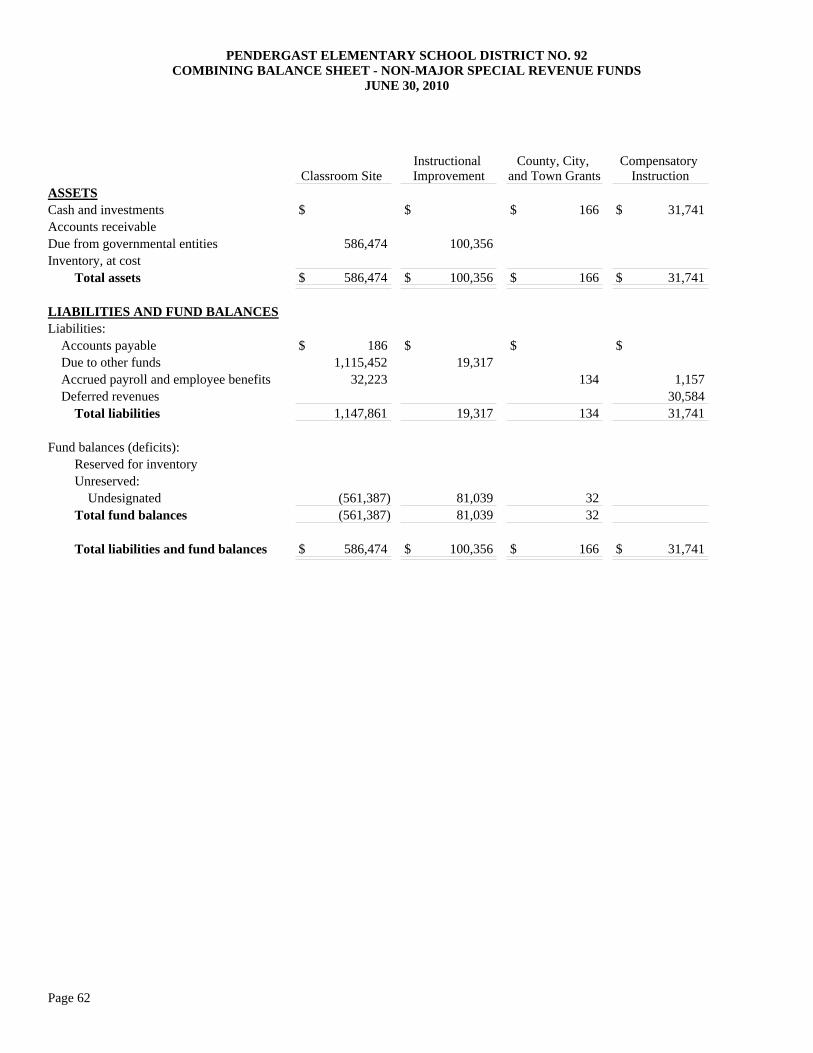
PENDERGAST ELEMENTARY SCHOOL DISTRICT NO. 92COMBINING BALANCE SHEET - NON-MAJOR SPECIAL REVENUE FUNDS
JUNE 30, 2010
Classroom Site Instructional Improvement
County, City, and Town Grants
Compensatory Instruction
ASSETSCash and investmentsAccounts receivableDue from governmental entitiesInventory, at cost Total assets
LIABILITIES AND FUND BALANCESLiabilities: Accounts payable Due to other funds Accrued payroll and employee benefits Deferred revenues Total liabilities
Fund balances (deficits): Reserved for inventory Unreserved: Undesignated Total fund balances
Total liabilities and fund balances
$ $ $ 166 $ 31,741
586,474 100,356
$ 586,474 $ 100,356 $ 166 $ 31,741
$ 186 $ $ $ 1,115,452 19,317
32,223 134 1,157 30,584
1,147,861 19,317 134 31,741
(561,387) 81,039 32 (561,387) 81,039 32
$ 586,474 $ 100,356 $ 166 $ 31,741
Page 62
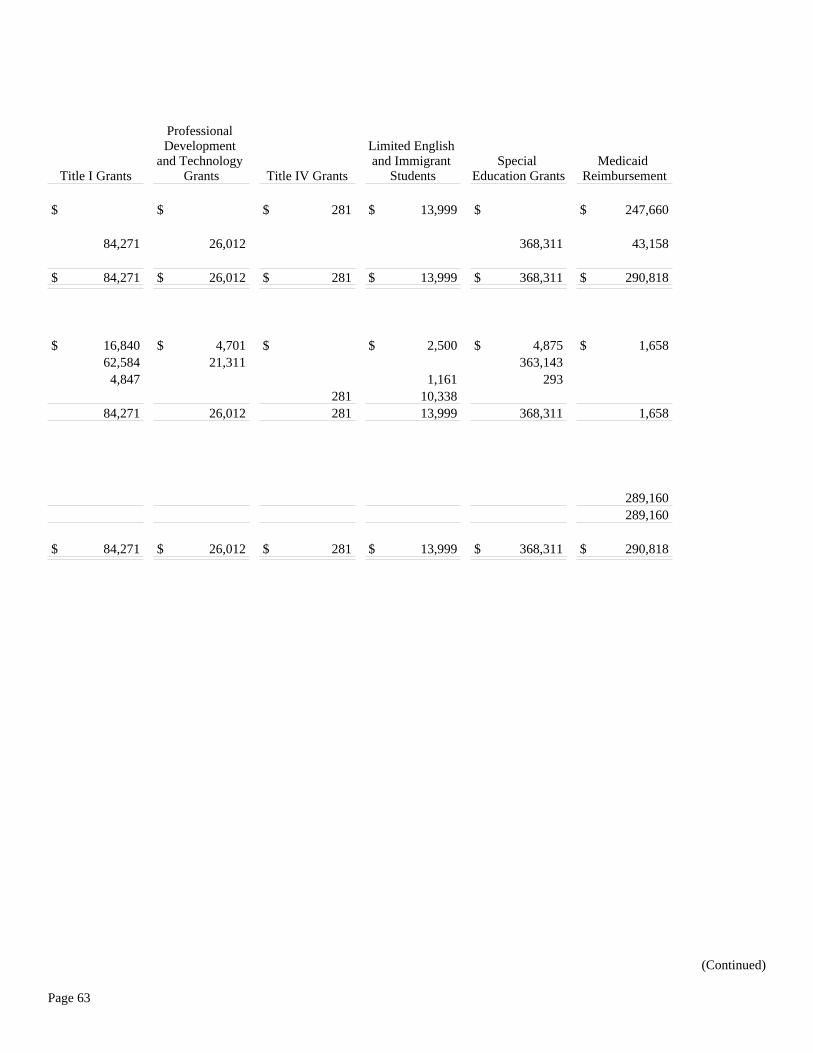
Title I Grants
Professional Development
and Technology Grants Title IV Grants
Limited English and Immigrant
StudentsSpecial
Education GrantsMedicaid
Reimbursement
$ $ $ 281 $ 13,999 $ $ 247,660
84,271 26,012 368,311 43,158
$ 84,271 $ 26,012 $ 281 $ 13,999 $ 368,311 $ 290,818
$ 16,840 $ 4,701 $ $ 2,500 $ 4,875 $ 1,658 62,584 21,311 363,143
4,847 1,161 293 281 10,338
84,271 26,012 281 13,999 368,311 1,658
289,160 289,160
$ 84,271 $ 26,012 $ 281 $ 13,999 $ 368,311 $ 290,818
(Continued)
Page 63
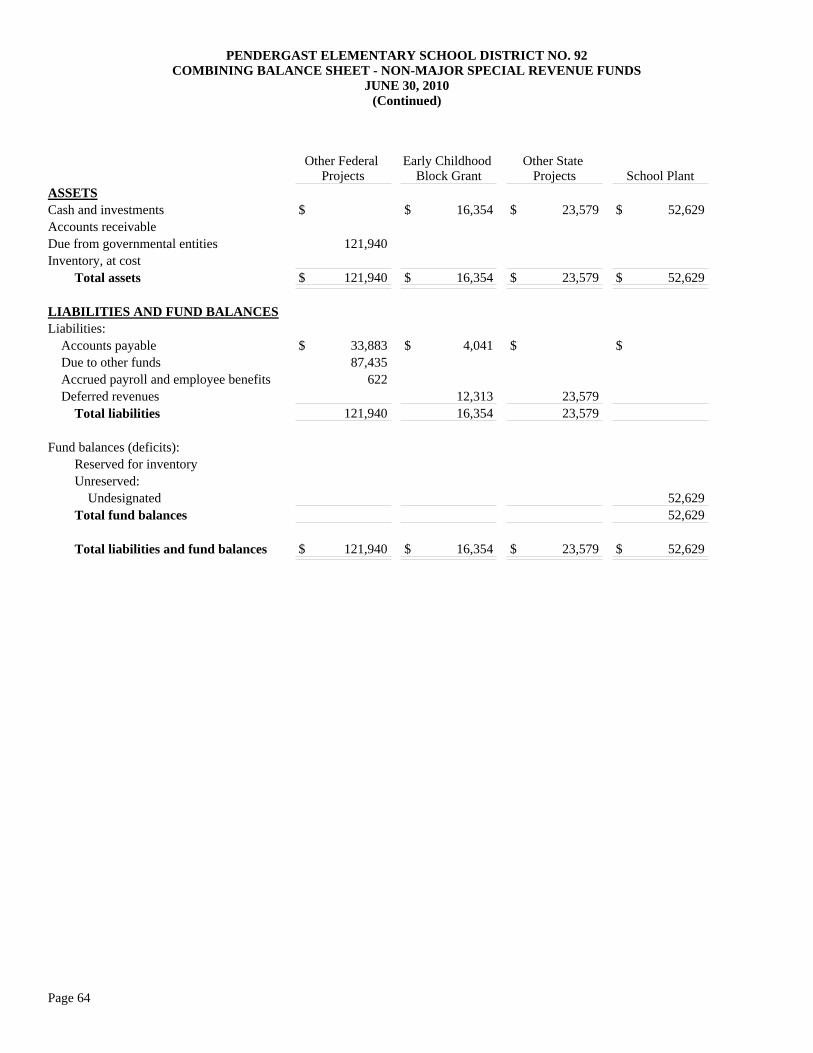
PENDERGAST ELEMENTARY SCHOOL DISTRICT NO. 92COMBINING BALANCE SHEET - NON-MAJOR SPECIAL REVENUE FUNDS
JUNE 30, 2010(Continued)
Other Federal Projects
Early Childhood Block Grant
Other State Projects School Plant
ASSETSCash and investmentsAccounts receivableDue from governmental entitiesInventory, at cost Total assets
LIABILITIES AND FUND BALANCESLiabilities: Accounts payable Due to other funds Accrued payroll and employee benefits Deferred revenues Total liabilities
Fund balances (deficits): Reserved for inventory Unreserved: Undesignated Total fund balances
Total liabilities and fund balances
$ $ 16,354 $ 23,579 $ 52,629
121,940
$ 121,940 $ 16,354 $ 23,579 $ 52,629
$ 33,883 $ 4,041 $ $ 87,435
622 12,313 23,579
121,940 16,354 23,579
52,629 52,629
$ 121,940 $ 16,354 $ 23,579 $ 52,629
Page 64
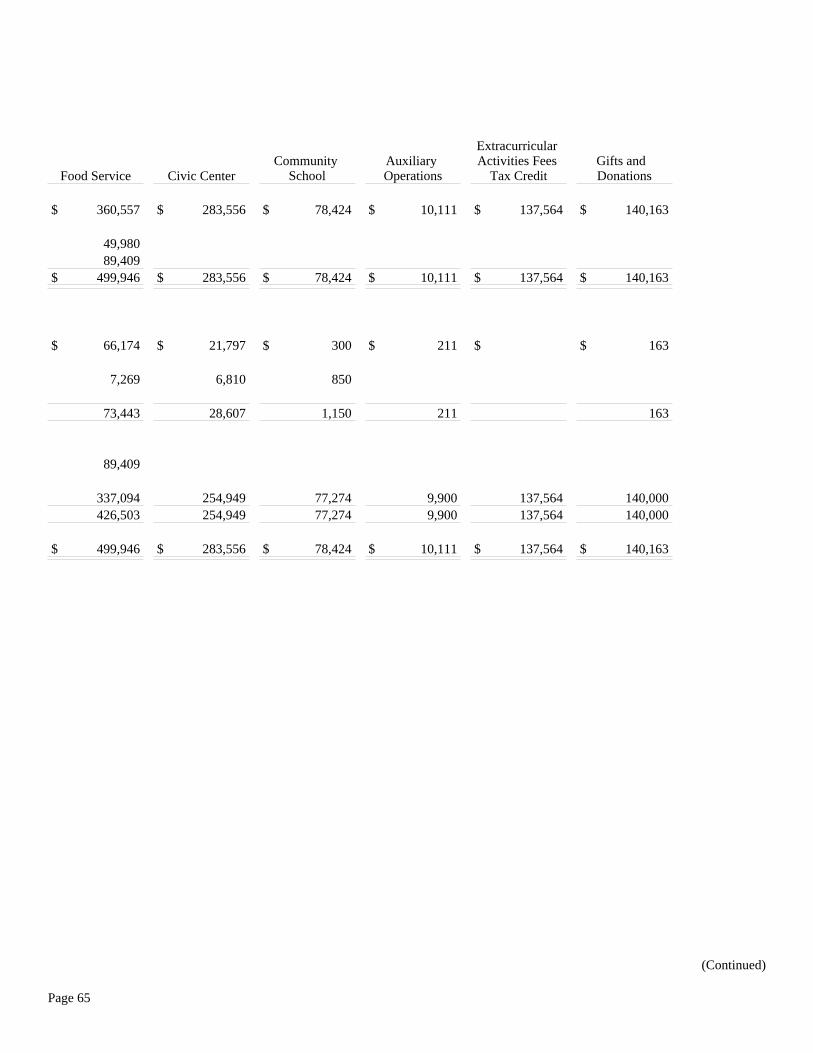
Food Service Civic CenterCommunity
SchoolAuxiliary Operations
Extracurricular Activities Fees
Tax CreditGifts and Donations
$ 360,557 $ 283,556 $ 78,424 $ 10,111 $ 137,564 $ 140,163
49,980 89,409
$ 499,946 $ 283,556 $ 78,424 $ 10,111 $ 137,564 $ 140,163
$ 66,174 $ 21,797 $ 300 $ 211 $ $ 163
7,269 6,810 850
73,443 28,607 1,150 211 163
89,409
337,094 254,949 77,274 9,900 137,564 140,000 426,503 254,949 77,274 9,900 137,564 140,000
$ 499,946 $ 283,556 $ 78,424 $ 10,111 $ 137,564 $ 140,163
(Continued)
Page 65
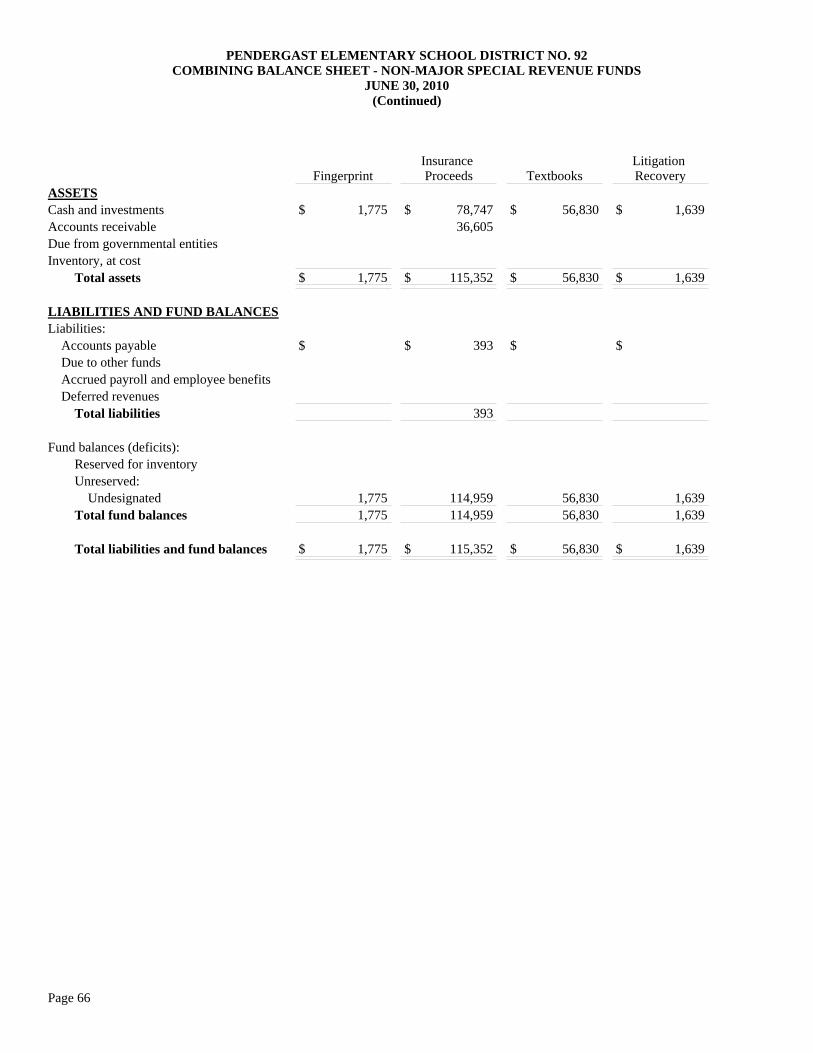
PENDERGAST ELEMENTARY SCHOOL DISTRICT NO. 92COMBINING BALANCE SHEET - NON-MAJOR SPECIAL REVENUE FUNDS
JUNE 30, 2010(Continued)
FingerprintInsurance Proceeds Textbooks
Litigation Recovery
ASSETSCash and investmentsAccounts receivableDue from governmental entitiesInventory, at cost Total assets
LIABILITIES AND FUND BALANCESLiabilities: Accounts payable Due to other funds Accrued payroll and employee benefits Deferred revenues Total liabilities
Fund balances (deficits): Reserved for inventory Unreserved: Undesignated Total fund balances
Total liabilities and fund balances
$ 1,775 $ 78,747 $ 56,830 $ 1,639 36,605
$ 1,775 $ 115,352 $ 56,830 $ 1,639
$ $ 393 $ $ 393
1,775 114,959 56,830 1,639 1,775 114,959 56,830 1,639
$ 1,775 $ 115,352 $ 56,830 $ 1,639
Page 66
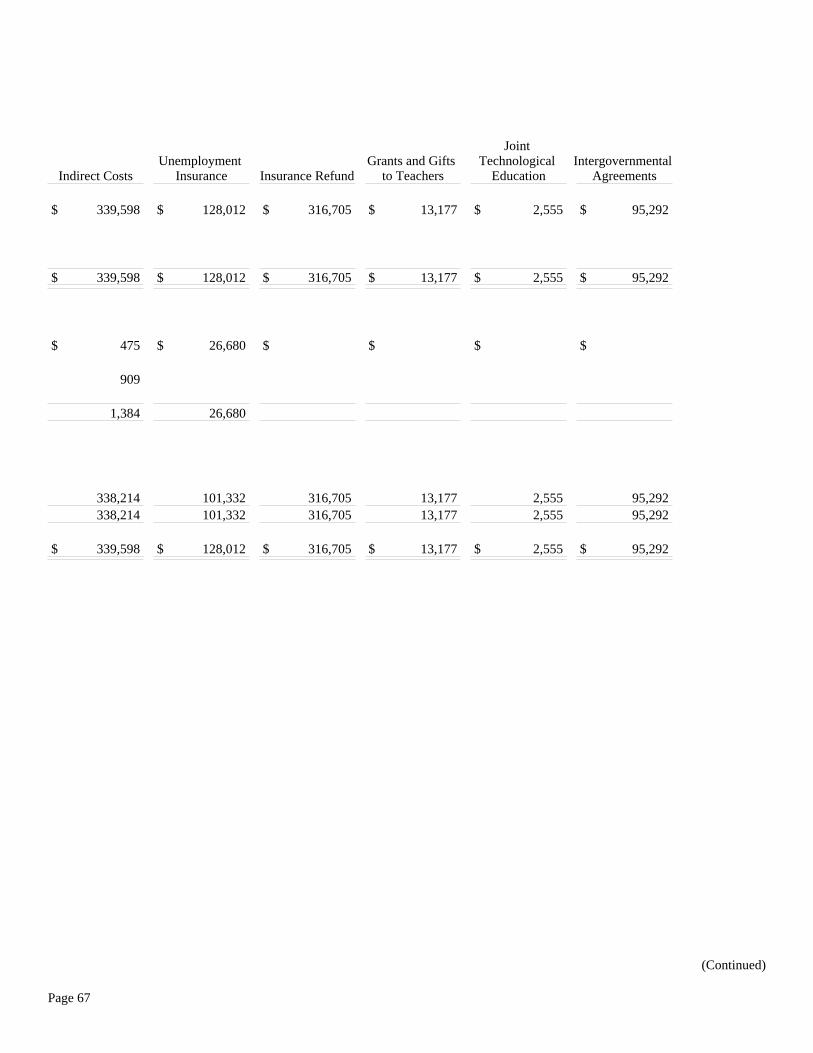
Indirect CostsUnemployment
Insurance Insurance RefundGrants and Gifts
to Teachers
Joint Technological
EducationIntergovernmental
Agreements
$ 339,598 $ 128,012 $ 316,705 $ 13,177 $ 2,555 $ 95,292
$ 339,598 $ 128,012 $ 316,705 $ 13,177 $ 2,555 $ 95,292
$ 475 $ 26,680 $ $ $ $
909
1,384 26,680
338,214 101,332 316,705 13,177 2,555 95,292 338,214 101,332 316,705 13,177 2,555 95,292
$ 339,598 $ 128,012 $ 316,705 $ 13,177 $ 2,555 $ 95,292
(Continued)
Page 67
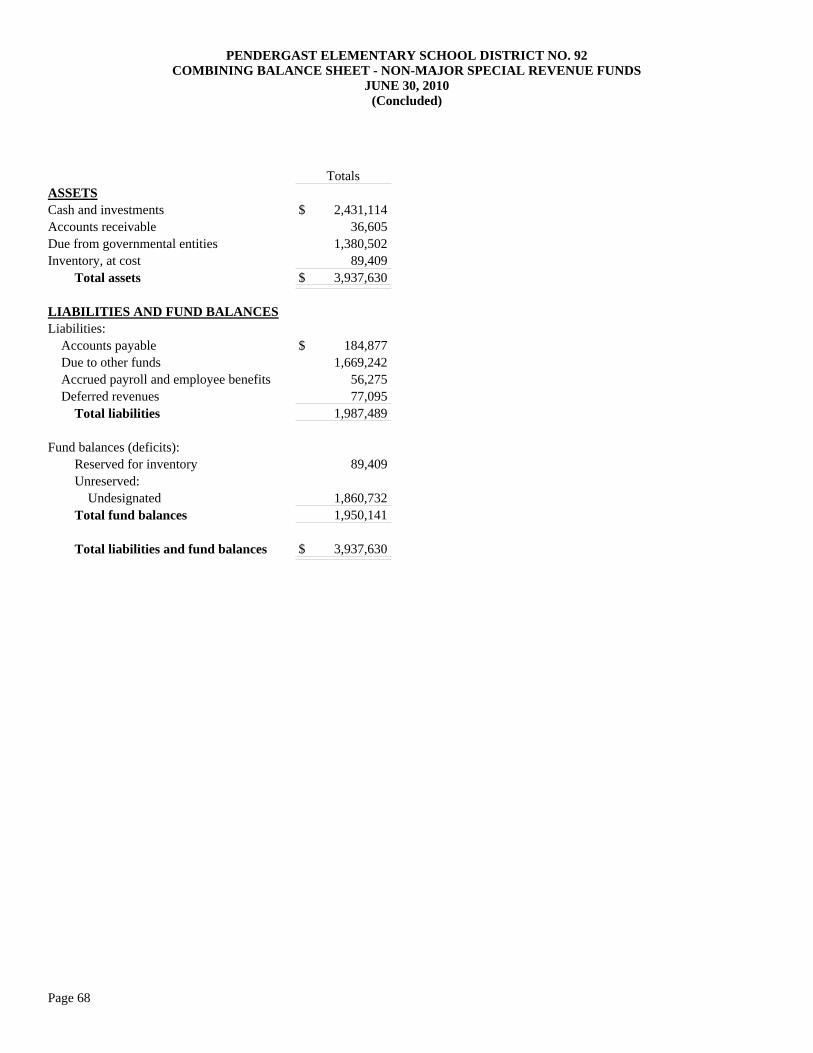
PENDERGAST ELEMENTARY SCHOOL DISTRICT NO. 92COMBINING BALANCE SHEET - NON-MAJOR SPECIAL REVENUE FUNDS
JUNE 30, 2010(Concluded)
TotalsASSETSCash and investmentsAccounts receivableDue from governmental entitiesInventory, at cost Total assets
LIABILITIES AND FUND BALANCESLiabilities: Accounts payable Due to other funds Accrued payroll and employee benefits Deferred revenues Total liabilities
Fund balances (deficits): Reserved for inventory Unreserved: Undesignated Total fund balances
Total liabilities and fund balances
$ 2,431,114 36,605
1,380,502 89,409
$ 3,937,630
$ 184,877 1,669,242
56,275 77,095
1,987,489
89,409
1,860,732 1,950,141
$ 3,937,630
Page 68

Page 69
(This page intentionally left blank)
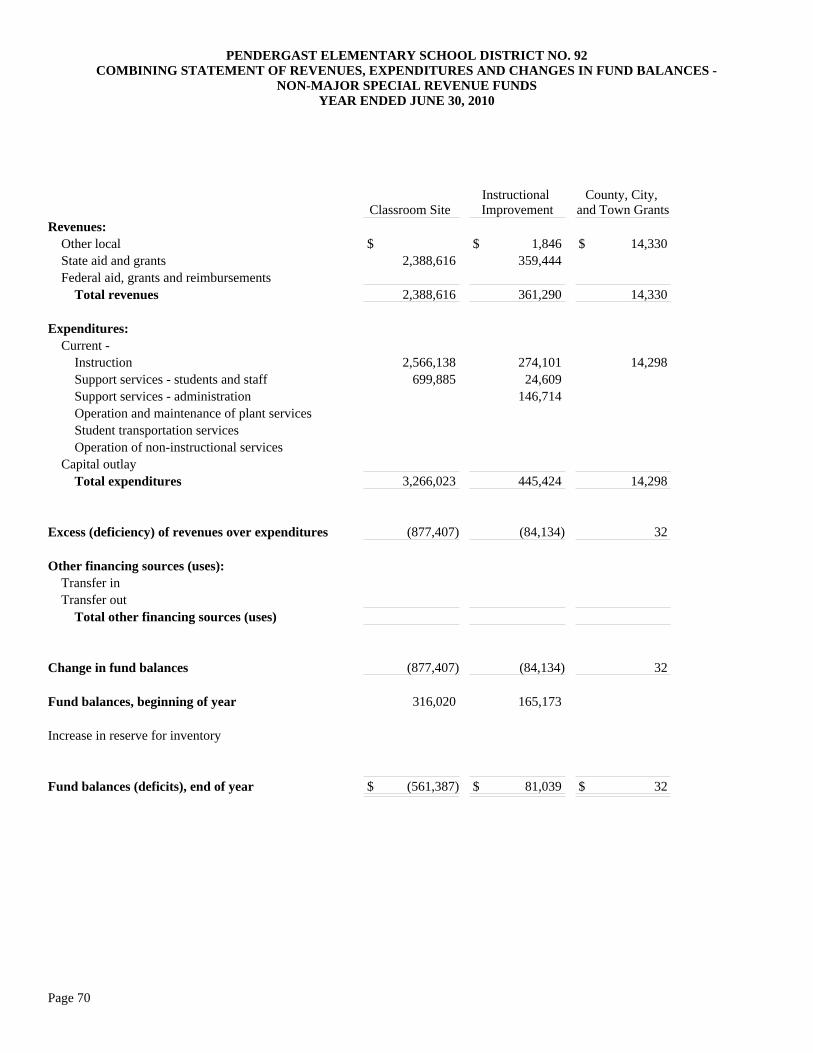
PENDERGAST ELEMENTARY SCHOOL DISTRICT NO. 92COMBINING STATEMENT OF REVENUES, EXPENDITURES AND CHANGES IN FUND BALANCES -
NON-MAJOR SPECIAL REVENUE FUNDSYEAR ENDED JUNE 30, 2010
Classroom Site Instructional Improvement
County, City, and Town Grants
Revenues: Other local State aid and grants Federal aid, grants and reimbursements Total revenues
Expenditures: Current - Instruction Support services - students and staff Support services - administration Operation and maintenance of plant services Student transportation services Operation of non-instructional services Capital outlay Total expenditures
Excess (deficiency) of revenues over expenditures
Other financing sources (uses): Transfer in Transfer out Total other financing sources (uses)
Change in fund balances
Fund balances, beginning of year
Increase in reserve for inventory
Fund balances (deficits), end of year
$ $ 1,846 $ 14,330 2,388,616 359,444
2,388,616 361,290 14,330
2,566,138 274,101 14,298 699,885 24,609
146,714
3,266,023 445,424 14,298
(877,407) (84,134) 32
(877,407) (84,134) 32
316,020 165,173
$ (561,387) $ 81,039 $ 32
Page 70
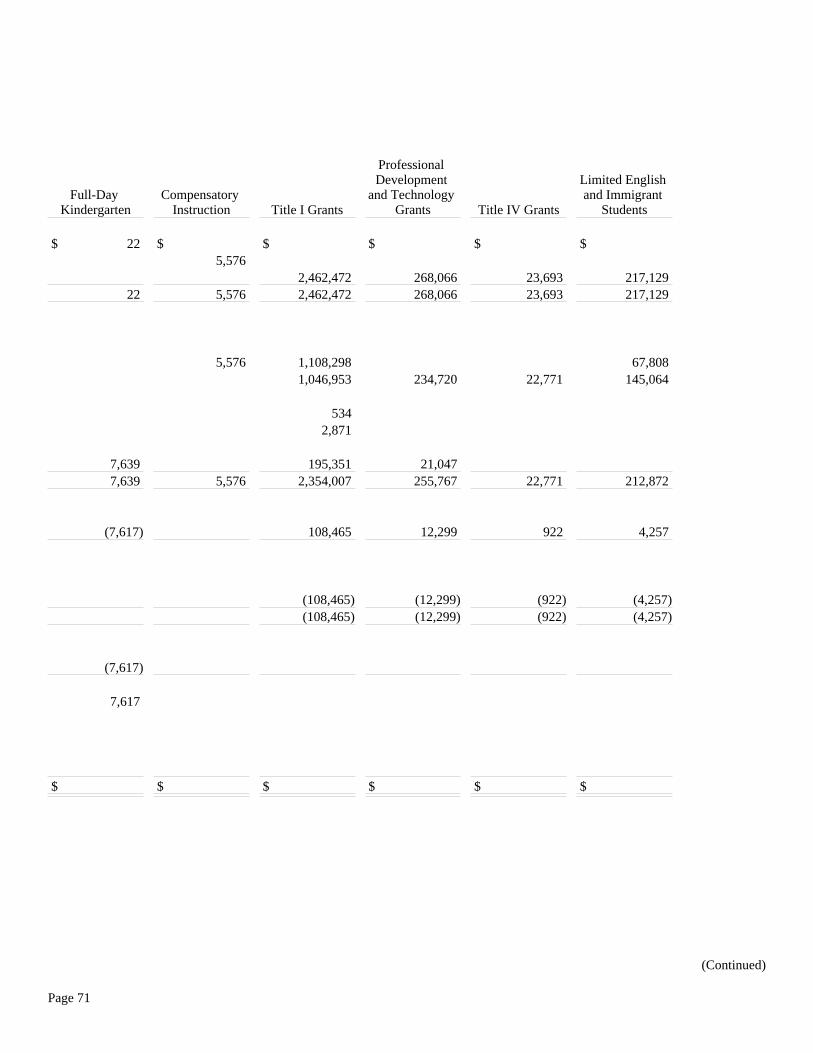
Full-Day Kindergarten
Compensatory Instruction Title I Grants
Professional Development
and Technology Grants Title IV Grants
Limited English and Immigrant
Students
$ 22 $ $ $ $ $ 5,576 2,462,472 268,066 23,693 217,129
22 5,576 2,462,472 268,066 23,693 217,129
5,576 1,108,298 67,808 1,046,953 234,720 22,771 145,064 534 2,871
7,639 195,351 21,047 7,639 5,576 2,354,007 255,767 22,771 212,872
(7,617) 108,465 12,299 922 4,257
(108,465) (12,299) (922) (4,257) (108,465) (12,299) (922) (4,257)
(7,617)
7,617
$ $ $ $ $ $
(Continued)
Page 71
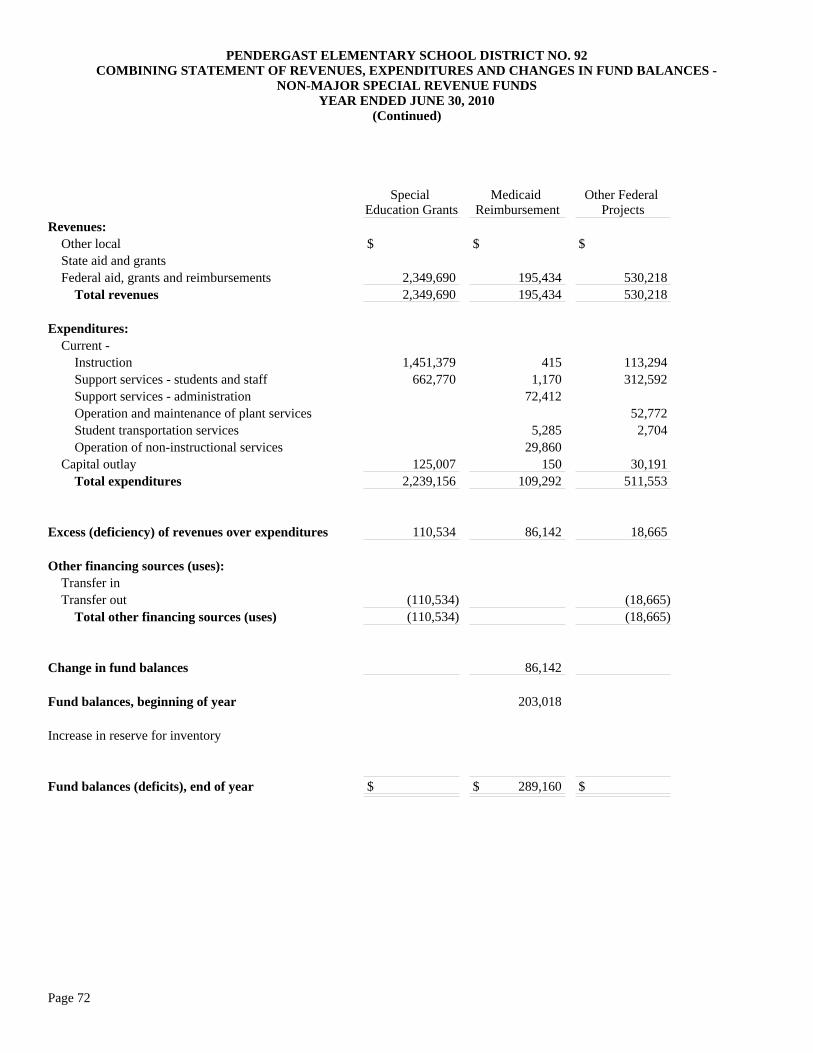
PENDERGAST ELEMENTARY SCHOOL DISTRICT NO. 92COMBINING STATEMENT OF REVENUES, EXPENDITURES AND CHANGES IN FUND BALANCES -
NON-MAJOR SPECIAL REVENUE FUNDSYEAR ENDED JUNE 30, 2010
(Continued)
Special Education Grants
Medicaid Reimbursement
Other Federal Projects
Revenues: Other local State aid and grants Federal aid, grants and reimbursements Total revenues
Expenditures: Current - Instruction Support services - students and staff Support services - administration Operation and maintenance of plant services Student transportation services Operation of non-instructional services Capital outlay Total expenditures
Excess (deficiency) of revenues over expenditures
Other financing sources (uses): Transfer in Transfer out Total other financing sources (uses)
Change in fund balances
Fund balances, beginning of year
Increase in reserve for inventory
Fund balances (deficits), end of year
$ $ $
2,349,690 195,434 530,218 2,349,690 195,434 530,218
1,451,379 415 113,294 662,770 1,170 312,592
72,412 52,772 5,285 2,704 29,860
125,007 150 30,191 2,239,156 109,292 511,553
110,534 86,142 18,665
(110,534) (18,665)(110,534) (18,665)
86,142
203,018
$ $ 289,160 $
Page 72
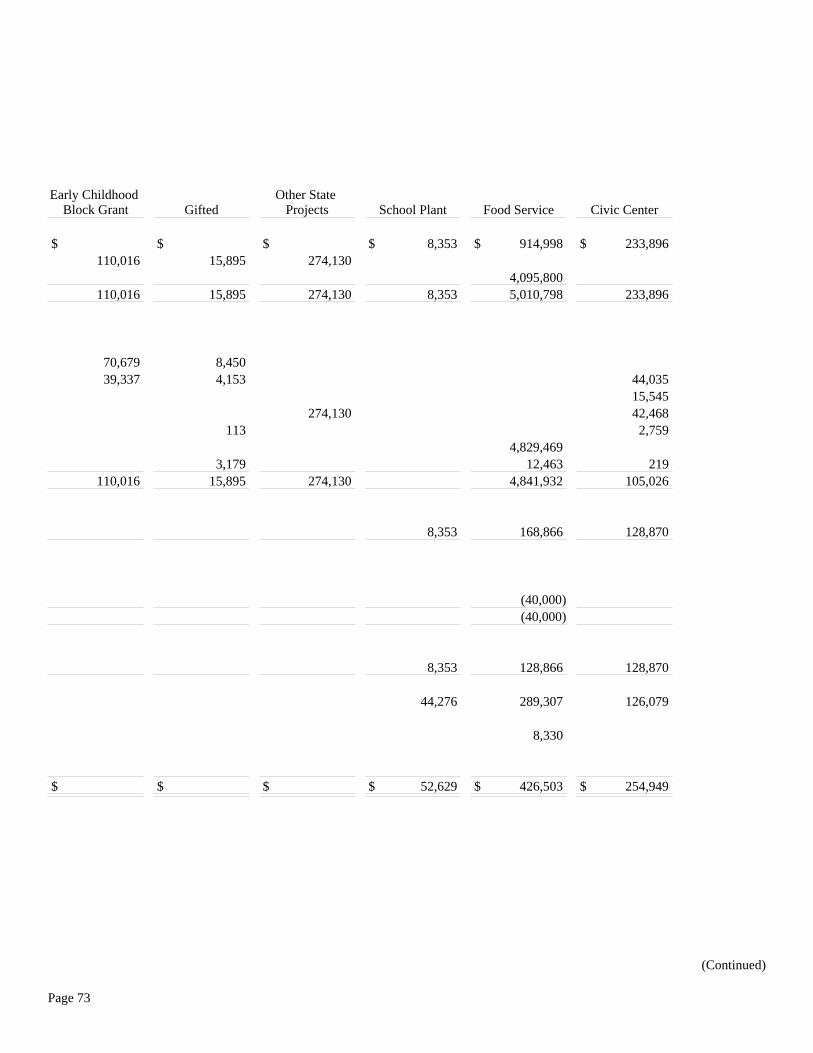
Early Childhood Block Grant Gifted
Other State Projects School Plant Food Service Civic Center
$ $ $ $ 8,353 $ 914,998 $ 233,896 110,016 15,895 274,130
4,095,800 110,016 15,895 274,130 8,353 5,010,798 233,896
70,679 8,450 39,337 4,153 44,035
15,545 274,130 42,468 113 2,759 4,829,469 3,179 12,463 219
110,016 15,895 274,130 4,841,932 105,026
8,353 168,866 128,870
(40,000) (40,000)
8,353 128,866 128,870
44,276 289,307 126,079
8,330
$ $ $ $ 52,629 $ 426,503 $ 254,949
(Continued)
Page 73
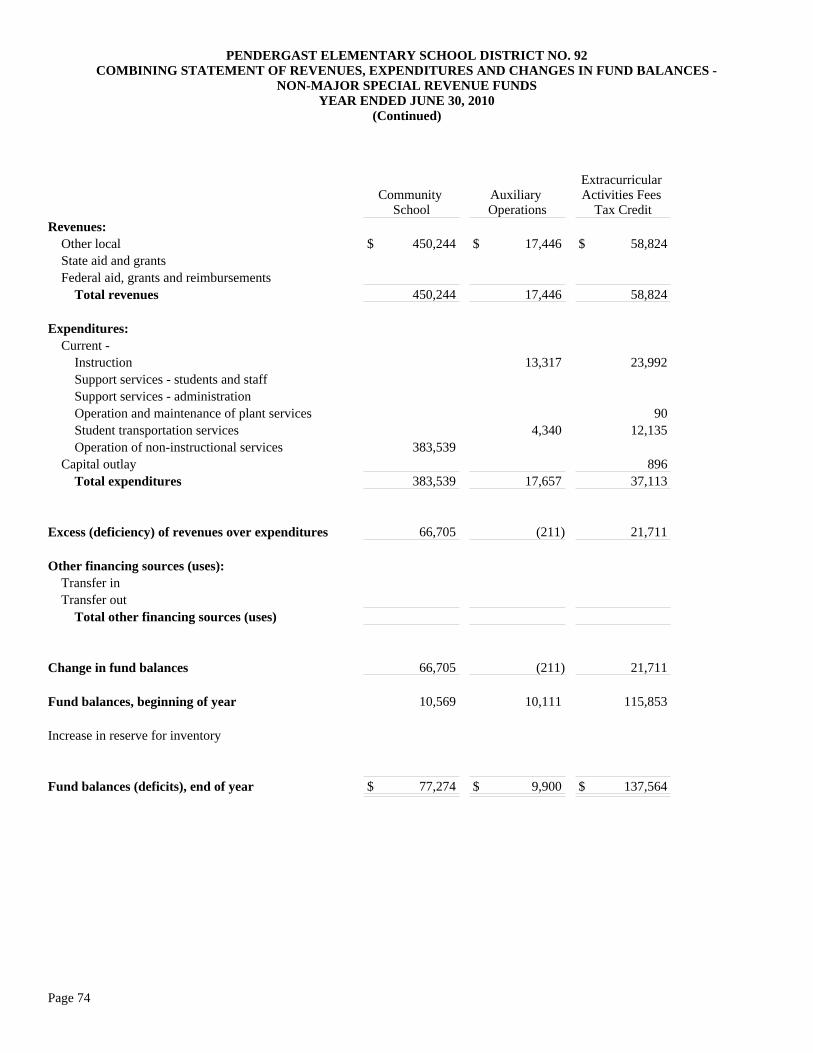
PENDERGAST ELEMENTARY SCHOOL DISTRICT NO. 92COMBINING STATEMENT OF REVENUES, EXPENDITURES AND CHANGES IN FUND BALANCES -
NON-MAJOR SPECIAL REVENUE FUNDSYEAR ENDED JUNE 30, 2010
(Continued)
Community School
Auxiliary Operations
Extracurricular Activities Fees
Tax CreditRevenues: Other local State aid and grants Federal aid, grants and reimbursements Total revenues
Expenditures: Current - Instruction Support services - students and staff Support services - administration Operation and maintenance of plant services Student transportation services Operation of non-instructional services Capital outlay Total expenditures
Excess (deficiency) of revenues over expenditures
Other financing sources (uses): Transfer in Transfer out Total other financing sources (uses)
Change in fund balances
Fund balances, beginning of year
Increase in reserve for inventory
Fund balances (deficits), end of year
$ 450,244 $ 17,446 $ 58,824
450,244 17,446 58,824
13,317 23,992 90 4,340 12,135
383,539 896
383,539 17,657 37,113
66,705 (211) 21,711
66,705 (211) 21,711
10,569 10,111 115,853
$ 77,274 $ 9,900 $ 137,564
Page 74
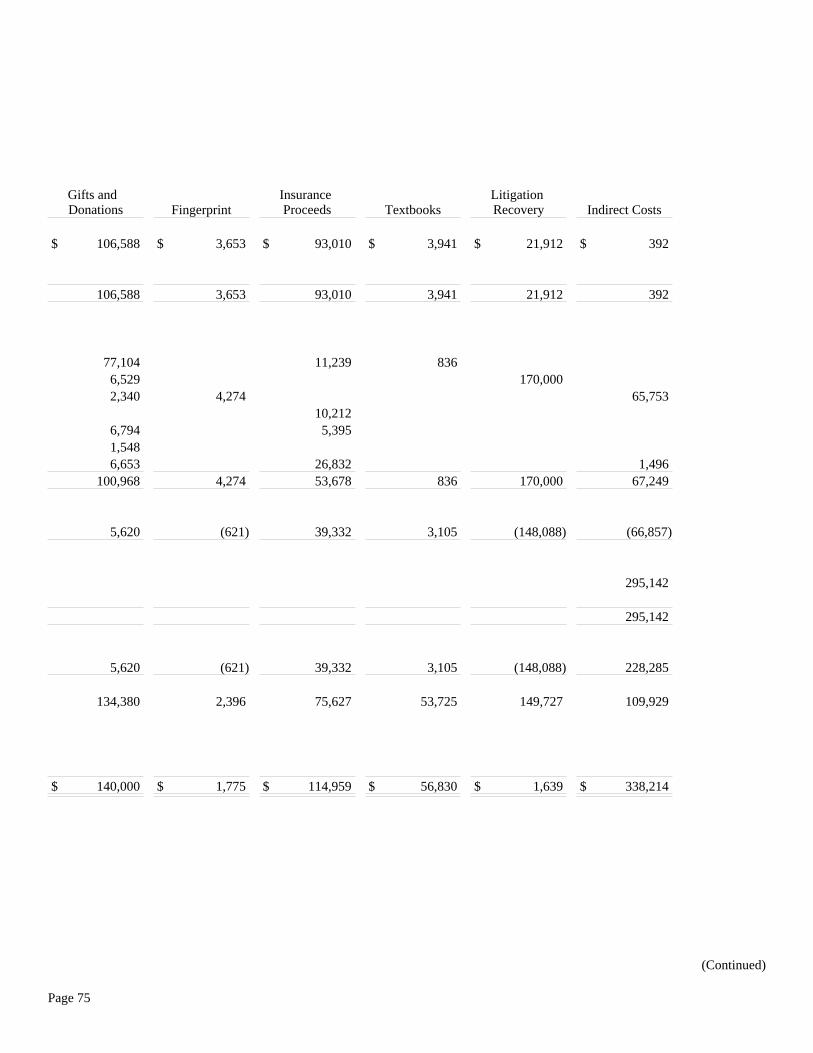
Gifts and Donations Fingerprint
Insurance Proceeds Textbooks
Litigation Recovery Indirect Costs
$ 106,588 $ 3,653 $ 93,010 $ 3,941 $ 21,912 $ 392
106,588 3,653 93,010 3,941 21,912 392
77,104 11,239 836 6,529 170,000 2,340 4,274 65,753
10,212 6,794 5,395 1,548 6,653 26,832 1,496
100,968 4,274 53,678 836 170,000 67,249
5,620 (621) 39,332 3,105 (148,088) (66,857)
295,142 295,142
5,620 (621) 39,332 3,105 (148,088) 228,285
134,380 2,396 75,627 53,725 149,727 109,929
$ 140,000 $ 1,775 $ 114,959 $ 56,830 $ 1,639 $ 338,214
(Continued)
Page 75
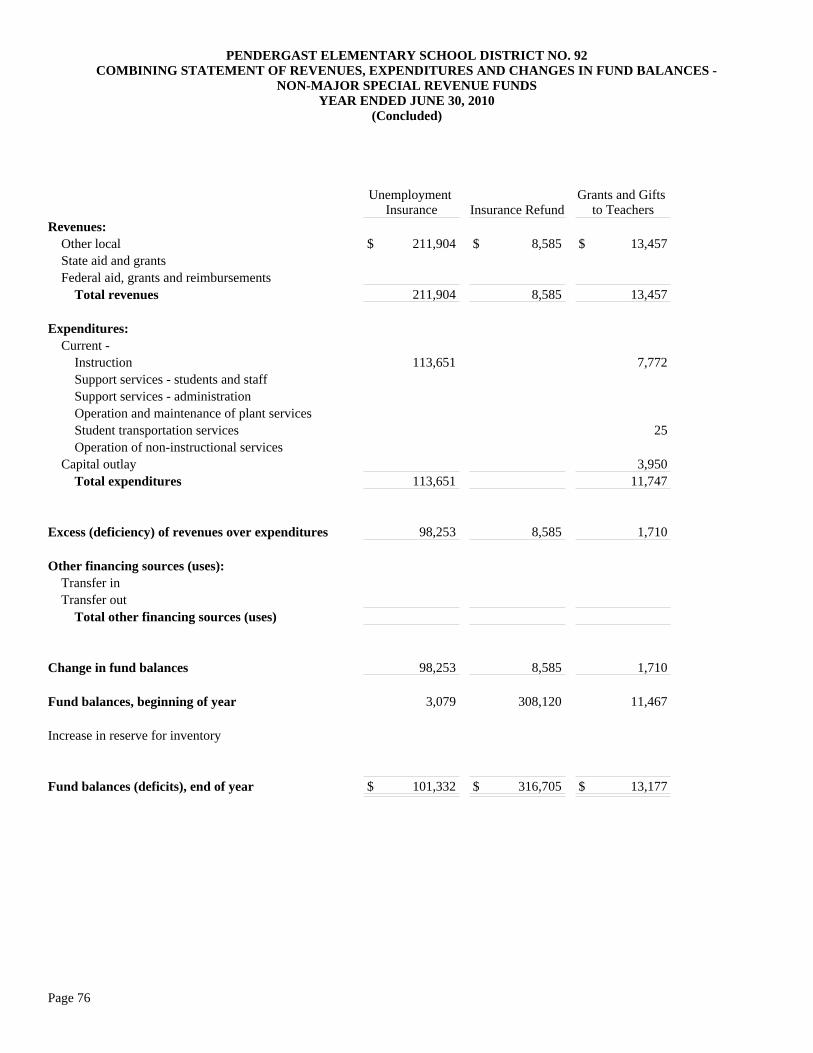
PENDERGAST ELEMENTARY SCHOOL DISTRICT NO. 92COMBINING STATEMENT OF REVENUES, EXPENDITURES AND CHANGES IN FUND BALANCES -
NON-MAJOR SPECIAL REVENUE FUNDSYEAR ENDED JUNE 30, 2010
(Concluded)
Unemployment Insurance Insurance Refund
Grants and Gifts to Teachers
Revenues: Other local State aid and grants Federal aid, grants and reimbursements Total revenues
Expenditures: Current - Instruction Support services - students and staff Support services - administration Operation and maintenance of plant services Student transportation services Operation of non-instructional services Capital outlay Total expenditures
Excess (deficiency) of revenues over expenditures
Other financing sources (uses): Transfer in Transfer out Total other financing sources (uses)
Change in fund balances
Fund balances, beginning of year
Increase in reserve for inventory
Fund balances (deficits), end of year
$ 211,904 $ 8,585 $ 13,457
211,904 8,585 13,457
113,651 7,772 25 3,950
113,651 11,747
98,253 8,585 1,710
98,253 8,585 1,710
3,079 308,120 11,467
$ 101,332 $ 316,705 $ 13,177
Page 76
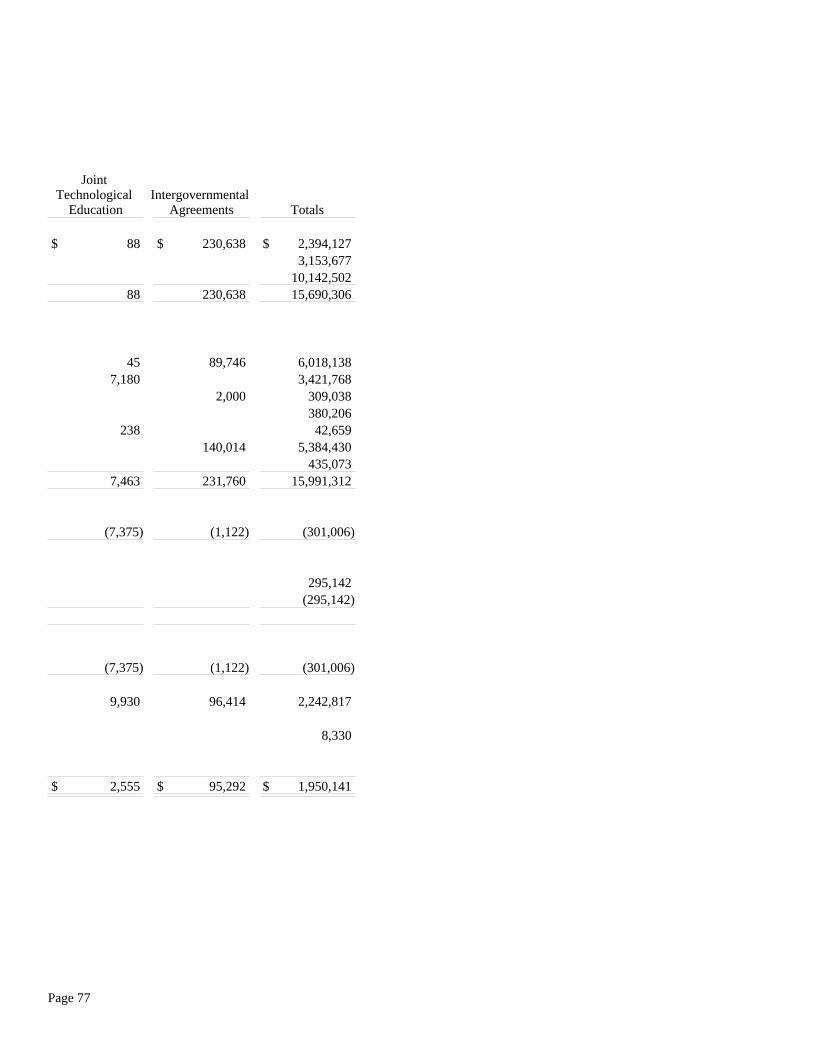
Joint Technological
EducationIntergovernmental
Agreements Totals
$ 88 $ 230,638 $ 2,394,127 3,153,677 10,142,502
88 230,638 15,690,306
45 89,746 6,018,138 7,180 3,421,768
2,000 309,038 380,206
238 42,659 140,014 5,384,430 435,073
7,463 231,760 15,991,312
(7,375) (1,122) (301,006)
295,142 (295,142)
(7,375) (1,122) (301,006)
9,930 96,414 2,242,817
8,330
$ 2,555 $ 95,292 $ 1,950,141
Page 77
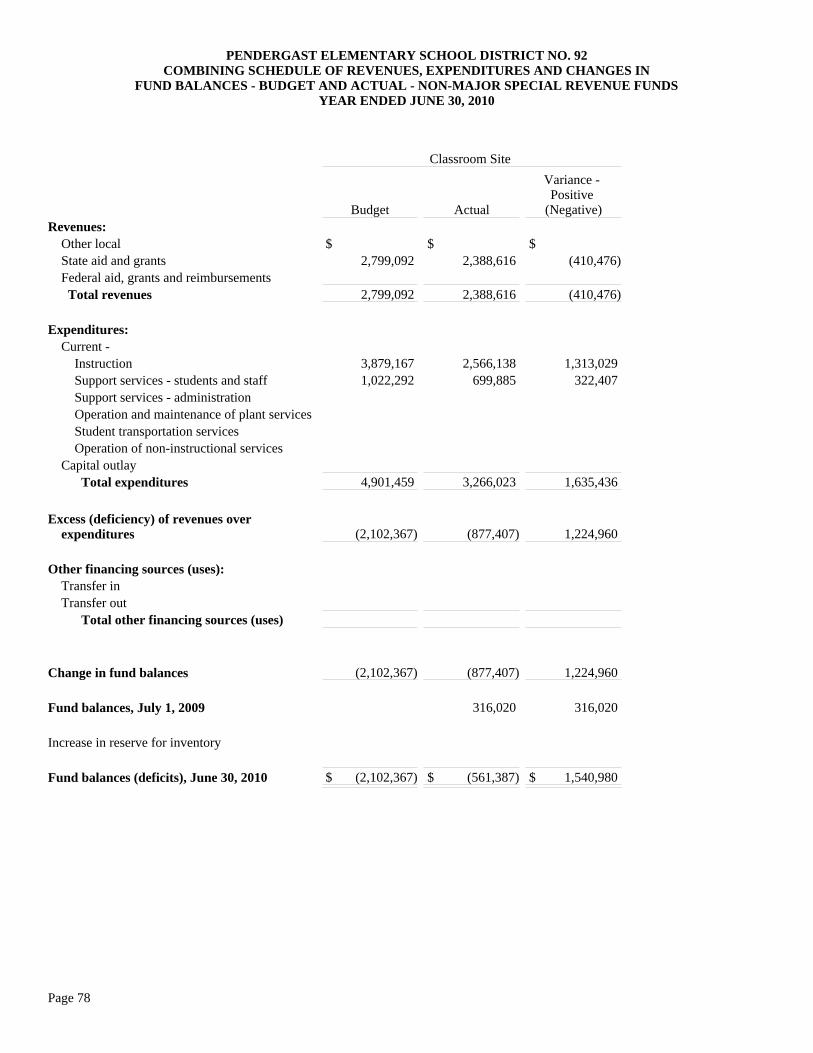
PENDERGAST ELEMENTARY SCHOOL DISTRICT NO. 92COMBINING SCHEDULE OF REVENUES, EXPENDITURES AND CHANGES IN
FUND BALANCES - BUDGET AND ACTUAL - NON-MAJOR SPECIAL REVENUE FUNDSYEAR ENDED JUNE 30, 2010
Classroom Site
Budget Actual
Variance - Positive
(Negative)Revenues: Other local State aid and grants Federal aid, grants and reimbursements Total revenues
Expenditures: Current - Instruction Support services - students and staff Support services - administration Operation and maintenance of plant services Student transportation services Operation of non-instructional services Capital outlay Total expenditures
Excess (deficiency) of revenues over expenditures
Other financing sources (uses): Transfer in Transfer out Total other financing sources (uses)
Change in fund balances
Fund balances, July 1, 2009
Increase in reserve for inventory
Fund balances (deficits), June 30, 2010
$ $ $ 2,799,092 2,388,616 (410,476)
2,799,092 2,388,616 (410,476)
3,879,167 2,566,138 1,313,029 1,022,292 699,885 322,407
4,901,459 3,266,023 1,635,436
(2,102,367) (877,407) 1,224,960
(2,102,367) (877,407) 1,224,960
316,020 316,020
$ (2,102,367) $ (561,387) $ 1,540,980
Page 78
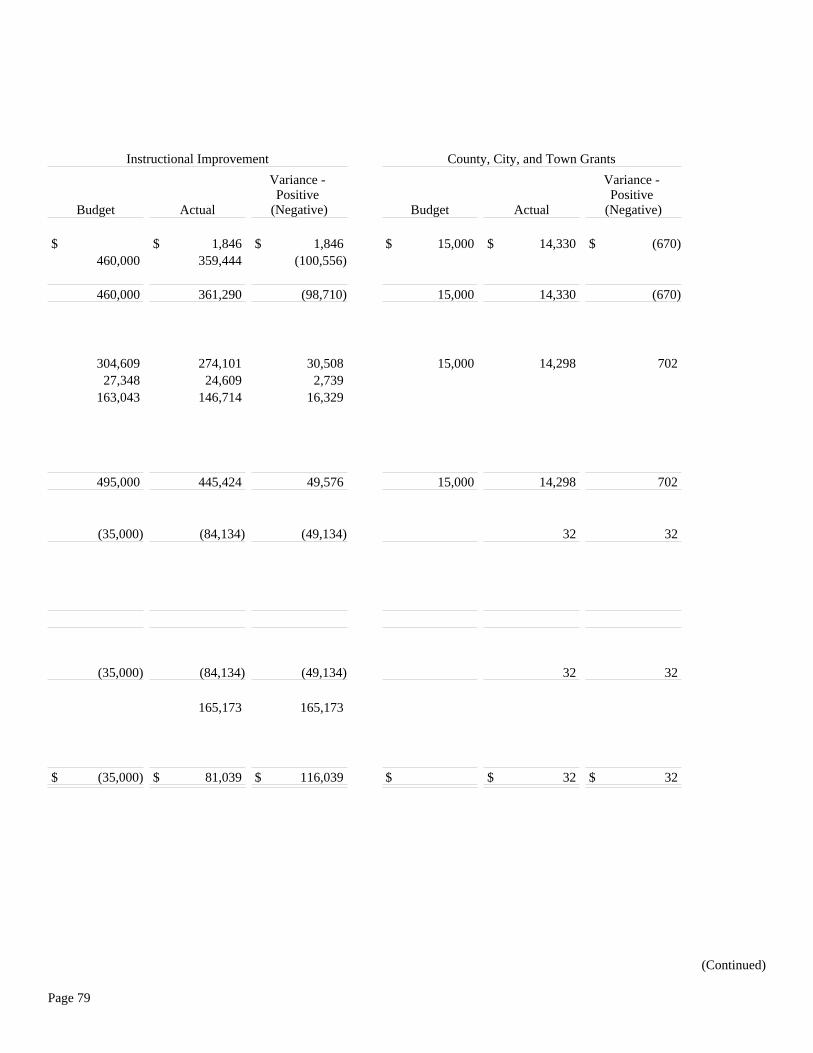
Instructional Improvement County, City, and Town Grants
Budget Actual
Variance - Positive
(Negative) Budget Actual
Variance - Positive
(Negative)
$ $ 1,846 $ 1,846 $ 15,000 $ 14,330 $ (670)460,000 359,444 (100,556)
460,000 361,290 (98,710) 15,000 14,330 (670)
304,609 274,101 30,508 15,000 14,298 702 27,348 24,609 2,739
163,043 146,714 16,329
495,000 445,424 49,576 15,000 14,298 702
(35,000) (84,134) (49,134) 32 32
(35,000) (84,134) (49,134) 32 32
165,173 165,173
$ (35,000) $ 81,039 $ 116,039 $ $ 32 $ 32
(Continued)
Page 79

PENDERGAST ELEMENTARY SCHOOL DISTRICT NO. 92COMBINING SCHEDULE OF REVENUES, EXPENDITURES AND CHANGES IN
FUND BALANCES - BUDGET AND ACTUAL - NON-MAJOR SPECIAL REVENUE FUNDSYEAR ENDED JUNE 30, 2010
(Continued)
Full-Day Kindergarten
Budget Actual
Variance - Positive
(Negative)Revenues: Other local State aid and grants Federal aid, grants and reimbursements Total revenues
Expenditures: Current - Instruction Support services - students and staff Support services - administration Operation and maintenance of plant services Student transportation services Operation of non-instructional services Capital outlay Total expenditures
Excess (deficiency) of revenues over expenditures
Other financing sources (uses): Transfer in Transfer out Total other financing sources (uses)
Change in fund balances
Fund balances, July 1, 2009
Increase in reserve for inventory
Fund balances (deficits), June 30, 2010
$ $ 22 $ 22
22 22
7,700 7,639 61 7,700 7,639 61
(7,700) (7,617) 83
(7,700) (7,617) 83
7,617 7,617
$ (7,700) $ $ 7,700
Page 80
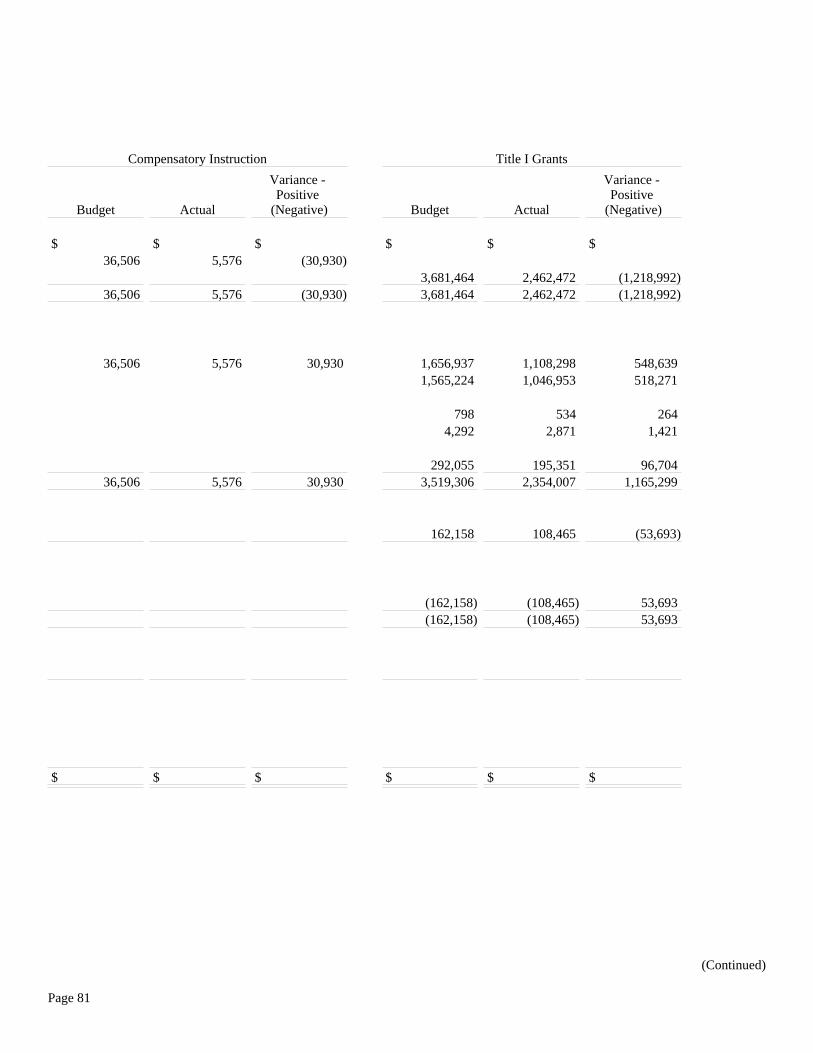
Compensatory Instruction Title I Grants
Budget Actual
Variance - Positive
(Negative) Budget Actual
Variance - Positive
(Negative)
$ $ $ $ $ $ 36,506 5,576 (30,930)
3,681,464 2,462,472 (1,218,992)36,506 5,576 (30,930) 3,681,464 2,462,472 (1,218,992)
36,506 5,576 30,930 1,656,937 1,108,298 548,639 1,565,224 1,046,953 518,271
798 534 264 4,292 2,871 1,421
292,055 195,351 96,704 36,506 5,576 30,930 3,519,306 2,354,007 1,165,299
162,158 108,465 (53,693)
(162,158) (108,465) 53,693 (162,158) (108,465) 53,693
$ $ $ $ $ $
(Continued)
Page 81

PENDERGAST ELEMENTARY SCHOOL DISTRICT NO. 92COMBINING SCHEDULE OF REVENUES, EXPENDITURES AND CHANGES IN
FUND BALANCES - BUDGET AND ACTUAL - NON-MAJOR SPECIAL REVENUE FUNDSYEAR ENDED JUNE 30, 2010
(Continued)
Professional Development and Technology Grants
Budget Actual
Variance - Positive
(Negative)Revenues: Other local State aid and grants Federal aid, grants and reimbursements Total revenues
Expenditures: Current - Instruction Support services - students and staff Support services - administration Operation and maintenance of plant services Student transportation services Operation of non-instructional services Capital outlay Total expenditures
Excess (deficiency) of revenues over expenditures
Other financing sources (uses): Transfer in Transfer out Total other financing sources (uses)
Change in fund balances
Fund balances, July 1, 2009
Increase in reserve for inventory
Fund balances (deficits), June 30, 2010
$ $ $
492,926 268,066 (224,860)492,926 268,066 (224,860)
431,608 234,720 196,888
38,702 21,047 17,655 470,310 255,767 214,543
22,616 12,299 (10,317)
(22,616) (12,299) 10,317 (22,616) (12,299) 10,317
$ $ $
Page 82
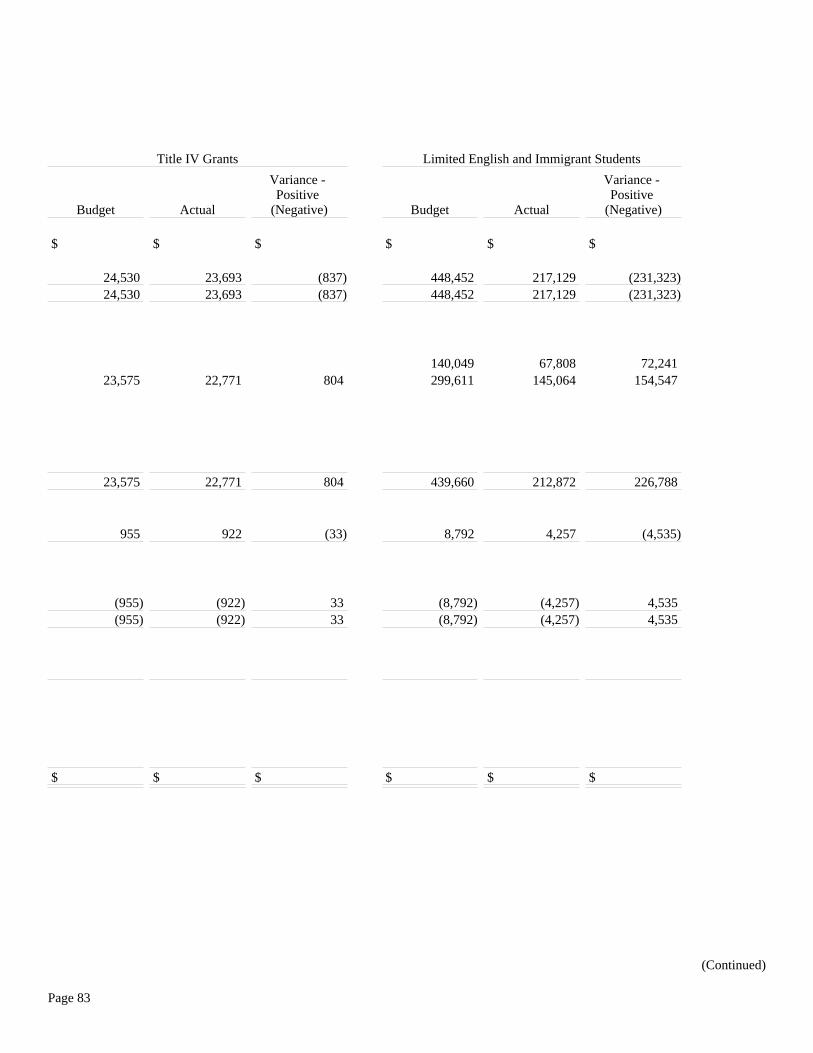
Title IV Grants Limited English and Immigrant Students
Budget Actual
Variance - Positive
(Negative) Budget Actual
Variance - Positive
(Negative)
$ $ $ $ $ $
24,530 23,693 (837) 448,452 217,129 (231,323)24,530 23,693 (837) 448,452 217,129 (231,323)
140,049 67,808 72,241 23,575 22,771 804 299,611 145,064 154,547
23,575 22,771 804 439,660 212,872 226,788
955 922 (33) 8,792 4,257 (4,535)
(955) (922) 33 (8,792) (4,257) 4,535 (955) (922) 33 (8,792) (4,257) 4,535
$ $ $ $ $ $
(Continued)
Page 83
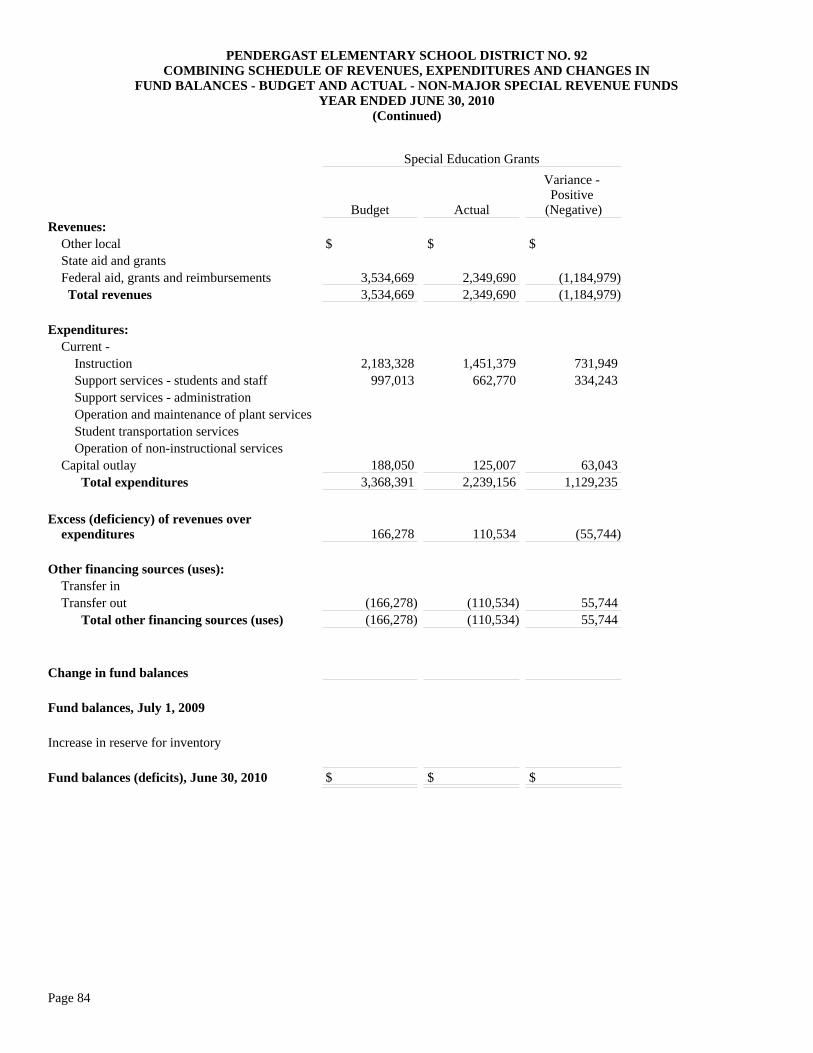
PENDERGAST ELEMENTARY SCHOOL DISTRICT NO. 92COMBINING SCHEDULE OF REVENUES, EXPENDITURES AND CHANGES IN
FUND BALANCES - BUDGET AND ACTUAL - NON-MAJOR SPECIAL REVENUE FUNDSYEAR ENDED JUNE 30, 2010
(Continued)
Special Education Grants
Budget Actual
Variance - Positive
(Negative)Revenues: Other local State aid and grants Federal aid, grants and reimbursements Total revenues
Expenditures: Current - Instruction Support services - students and staff Support services - administration Operation and maintenance of plant services Student transportation services Operation of non-instructional services Capital outlay Total expenditures
Excess (deficiency) of revenues over expenditures
Other financing sources (uses): Transfer in Transfer out Total other financing sources (uses)
Change in fund balances
Fund balances, July 1, 2009
Increase in reserve for inventory
Fund balances (deficits), June 30, 2010
$ $ $
3,534,669 2,349,690 (1,184,979)3,534,669 2,349,690 (1,184,979)
2,183,328 1,451,379 731,949 997,013 662,770 334,243
188,050 125,007 63,043 3,368,391 2,239,156 1,129,235
166,278 110,534 (55,744)
(166,278) (110,534) 55,744 (166,278) (110,534) 55,744
$ $ $
Page 84
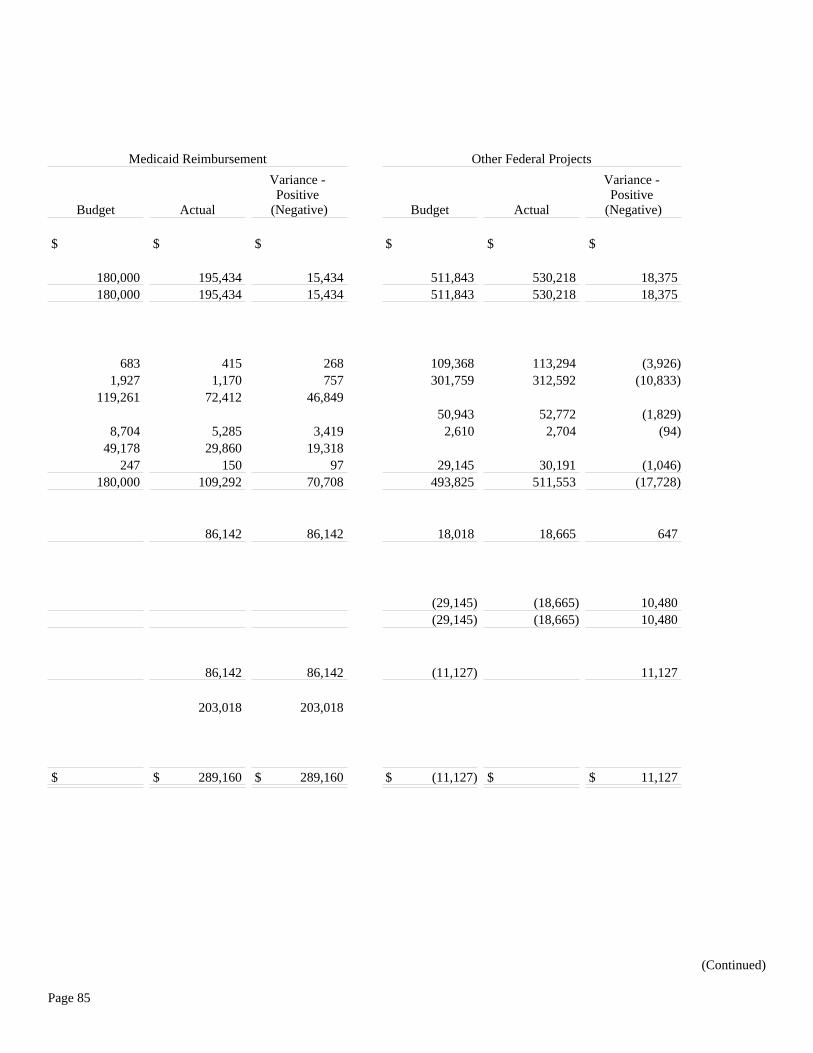
Medicaid Reimbursement Other Federal Projects
Budget Actual
Variance - Positive
(Negative) Budget Actual
Variance - Positive
(Negative)
$ $ $ $ $ $
180,000 195,434 15,434 511,843 530,218 18,375 180,000 195,434 15,434 511,843 530,218 18,375
683 415 268 109,368 113,294 (3,926)1,927 1,170 757 301,759 312,592 (10,833)
119,261 72,412 46,849 50,943 52,772 (1,829)
8,704 5,285 3,419 2,610 2,704 (94)49,178 29,860 19,318
247 150 97 29,145 30,191 (1,046)180,000 109,292 70,708 493,825 511,553 (17,728)
86,142 86,142 18,018 18,665 647
(29,145) (18,665) 10,480 (29,145) (18,665) 10,480
86,142 86,142 (11,127) 11,127
203,018 203,018
$ $ 289,160 $ 289,160 $ (11,127) $ $ 11,127
(Continued)
Page 85
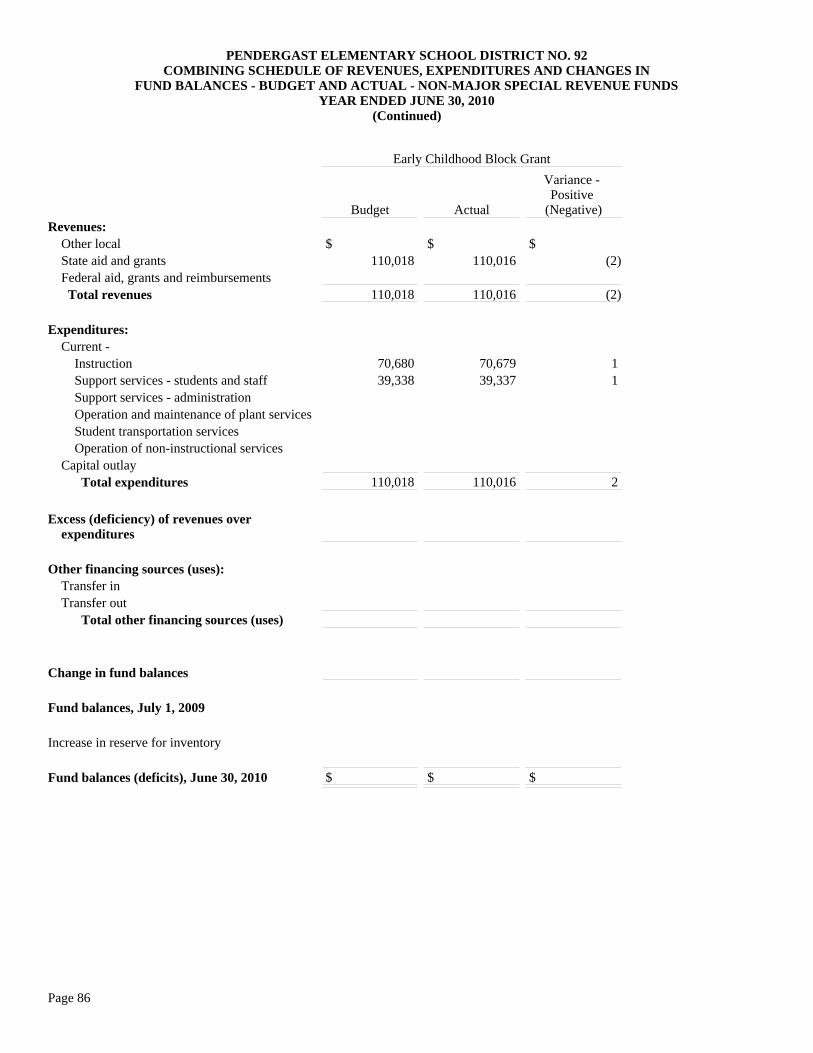
PENDERGAST ELEMENTARY SCHOOL DISTRICT NO. 92COMBINING SCHEDULE OF REVENUES, EXPENDITURES AND CHANGES IN
FUND BALANCES - BUDGET AND ACTUAL - NON-MAJOR SPECIAL REVENUE FUNDSYEAR ENDED JUNE 30, 2010
(Continued)
Early Childhood Block Grant
Budget Actual
Variance - Positive
(Negative)Revenues: Other local State aid and grants Federal aid, grants and reimbursements Total revenues
Expenditures: Current - Instruction Support services - students and staff Support services - administration Operation and maintenance of plant services Student transportation services Operation of non-instructional services Capital outlay Total expenditures
Excess (deficiency) of revenues over expenditures
Other financing sources (uses): Transfer in Transfer out Total other financing sources (uses)
Change in fund balances
Fund balances, July 1, 2009
Increase in reserve for inventory
Fund balances (deficits), June 30, 2010
$ $ $ 110,018 110,016 (2)
110,018 110,016 (2)
70,680 70,679 1 39,338 39,337 1
110,018 110,016 2
$ $ $
Page 86
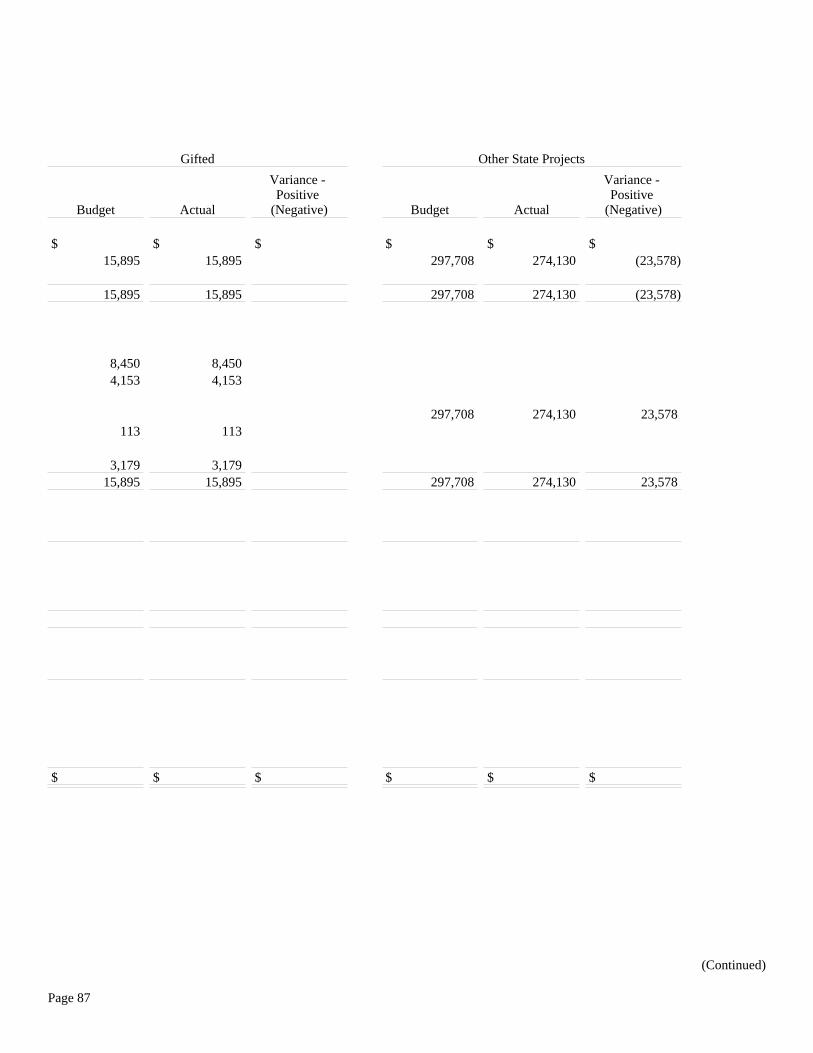
Gifted Other State Projects
Budget Actual
Variance - Positive
(Negative) Budget Actual
Variance - Positive
(Negative)
$ $ $ $ $ $ 15,895 15,895 297,708 274,130 (23,578)
15,895 15,895 297,708 274,130 (23,578)
8,450 8,450 4,153 4,153
297,708 274,130 23,578 113 113
3,179 3,179 15,895 15,895 297,708 274,130 23,578
$ $ $ $ $ $
(Continued)
Page 87
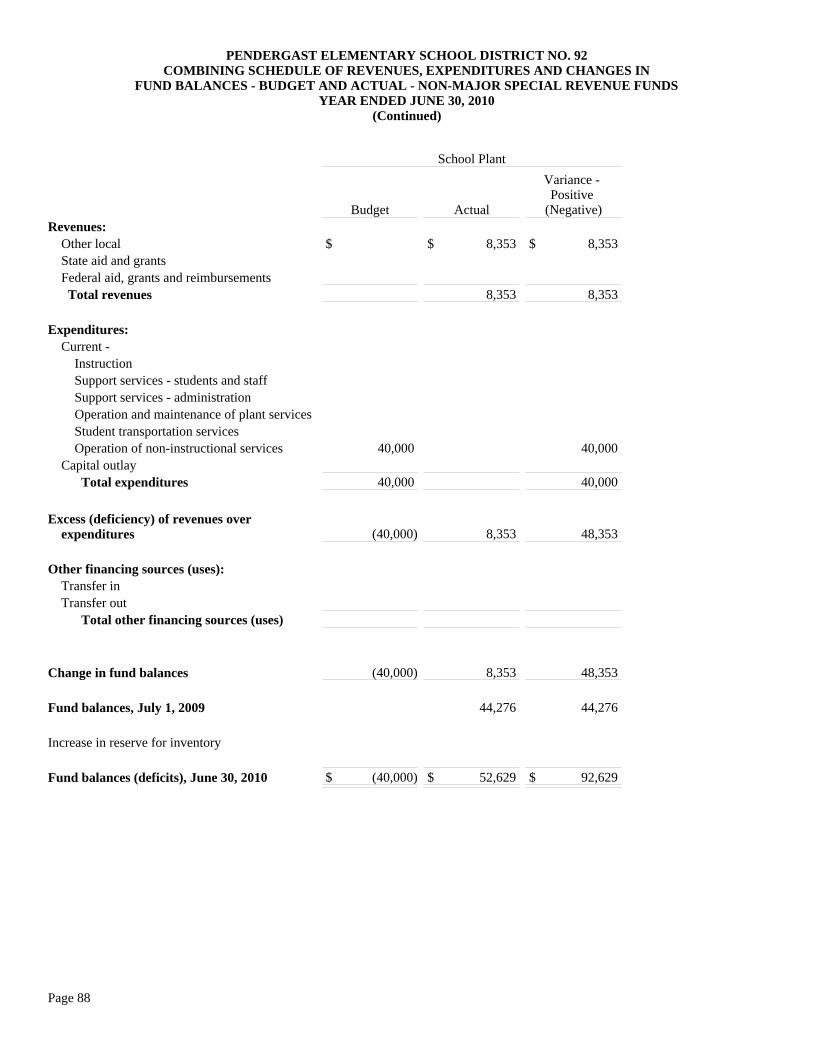
PENDERGAST ELEMENTARY SCHOOL DISTRICT NO. 92COMBINING SCHEDULE OF REVENUES, EXPENDITURES AND CHANGES IN
FUND BALANCES - BUDGET AND ACTUAL - NON-MAJOR SPECIAL REVENUE FUNDSYEAR ENDED JUNE 30, 2010
(Continued)
School Plant
Budget Actual
Variance - Positive
(Negative)Revenues: Other local State aid and grants Federal aid, grants and reimbursements Total revenues
Expenditures: Current - Instruction Support services - students and staff Support services - administration Operation and maintenance of plant services Student transportation services Operation of non-instructional services Capital outlay Total expenditures
Excess (deficiency) of revenues over expenditures
Other financing sources (uses): Transfer in Transfer out Total other financing sources (uses)
Change in fund balances
Fund balances, July 1, 2009
Increase in reserve for inventory
Fund balances (deficits), June 30, 2010
$ $ 8,353 $ 8,353
8,353 8,353
40,000 40,000
40,000 40,000
(40,000) 8,353 48,353
(40,000) 8,353 48,353
44,276 44,276
$ (40,000) $ 52,629 $ 92,629
Page 88
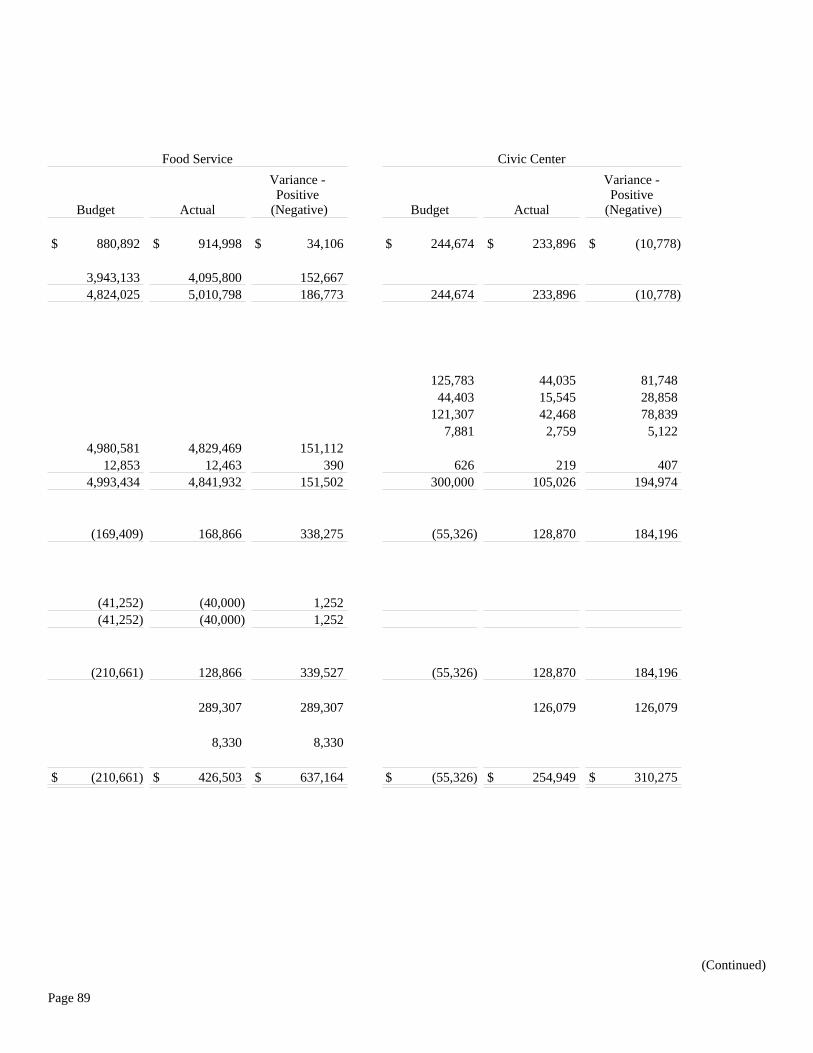
Food Service Civic Center
Budget Actual
Variance - Positive
(Negative) Budget Actual
Variance - Positive
(Negative)
$ 880,892 $ 914,998 $ 34,106 $ 244,674 $ 233,896 $ (10,778)
3,943,133 4,095,800 152,667 4,824,025 5,010,798 186,773 244,674 233,896 (10,778)
125,783 44,035 81,748 44,403 15,545 28,858
121,307 42,468 78,839 7,881 2,759 5,122
4,980,581 4,829,469 151,112 12,853 12,463 390 626 219 407
4,993,434 4,841,932 151,502 300,000 105,026 194,974
(169,409) 168,866 338,275 (55,326) 128,870 184,196
(41,252) (40,000) 1,252 (41,252) (40,000) 1,252
(210,661) 128,866 339,527 (55,326) 128,870 184,196
289,307 289,307 126,079 126,079
8,330 8,330
$ (210,661) $ 426,503 $ 637,164 $ (55,326) $ 254,949 $ 310,275
(Continued)
Page 89
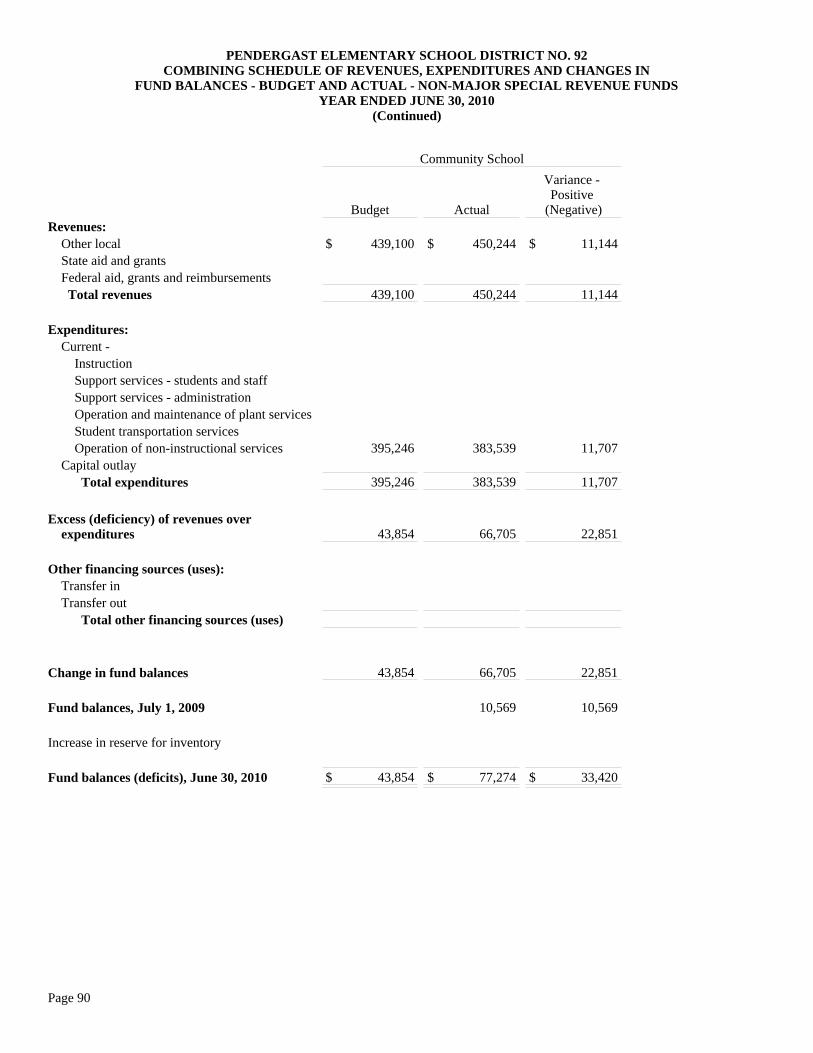
PENDERGAST ELEMENTARY SCHOOL DISTRICT NO. 92COMBINING SCHEDULE OF REVENUES, EXPENDITURES AND CHANGES IN
FUND BALANCES - BUDGET AND ACTUAL - NON-MAJOR SPECIAL REVENUE FUNDSYEAR ENDED JUNE 30, 2010
(Continued)
Community School
Budget Actual
Variance - Positive
(Negative)Revenues: Other local State aid and grants Federal aid, grants and reimbursements Total revenues
Expenditures: Current - Instruction Support services - students and staff Support services - administration Operation and maintenance of plant services Student transportation services Operation of non-instructional services Capital outlay Total expenditures
Excess (deficiency) of revenues over expenditures
Other financing sources (uses): Transfer in Transfer out Total other financing sources (uses)
Change in fund balances
Fund balances, July 1, 2009
Increase in reserve for inventory
Fund balances (deficits), June 30, 2010
$ 439,100 $ 450,244 $ 11,144
439,100 450,244 11,144
395,246 383,539 11,707
395,246 383,539 11,707
43,854 66,705 22,851
43,854 66,705 22,851
10,569 10,569
$ 43,854 $ 77,274 $ 33,420
Page 90
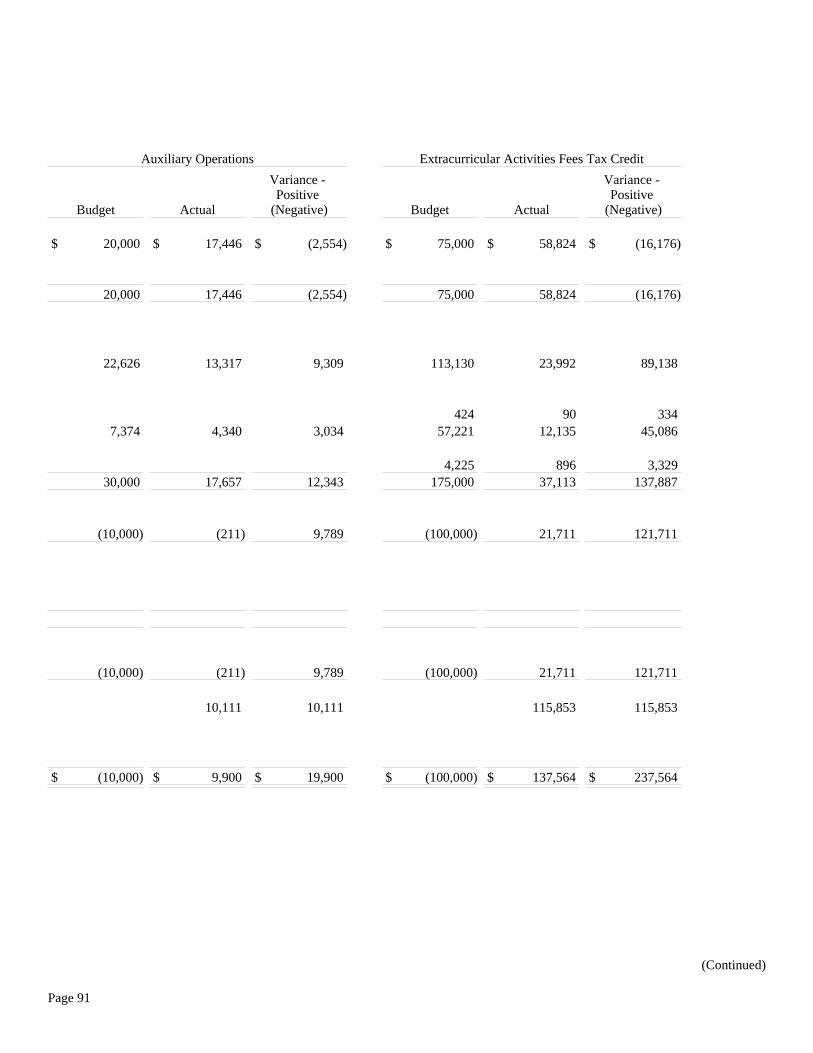
Auxiliary Operations Extracurricular Activities Fees Tax Credit
Budget Actual
Variance - Positive
(Negative) Budget Actual
Variance - Positive
(Negative)
$ 20,000 $ 17,446 $ (2,554) $ 75,000 $ 58,824 $ (16,176)
20,000 17,446 (2,554) 75,000 58,824 (16,176)
22,626 13,317 9,309 113,130 23,992 89,138
424 90 334 7,374 4,340 3,034 57,221 12,135 45,086
4,225 896 3,329 30,000 17,657 12,343 175,000 37,113 137,887
(10,000) (211) 9,789 (100,000) 21,711 121,711
(10,000) (211) 9,789 (100,000) 21,711 121,711
10,111 10,111 115,853 115,853
$ (10,000) $ 9,900 $ 19,900 $ (100,000) $ 137,564 $ 237,564
(Continued)
Page 91
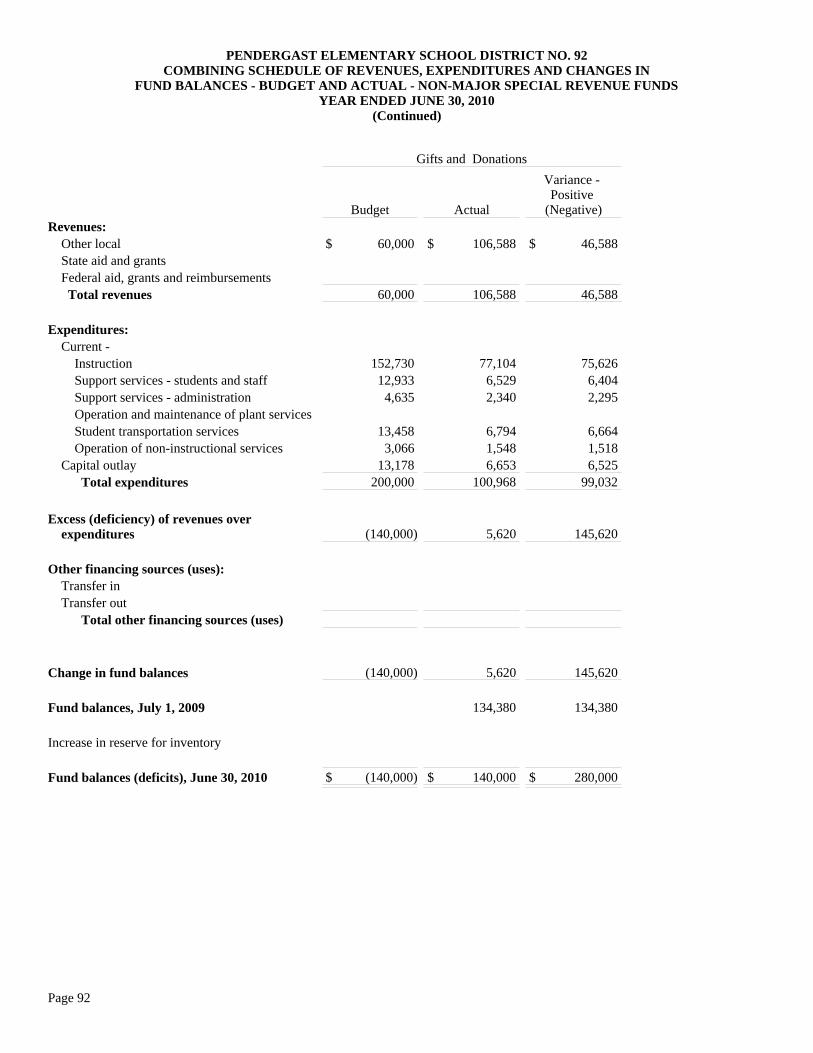
PENDERGAST ELEMENTARY SCHOOL DISTRICT NO. 92COMBINING SCHEDULE OF REVENUES, EXPENDITURES AND CHANGES IN
FUND BALANCES - BUDGET AND ACTUAL - NON-MAJOR SPECIAL REVENUE FUNDSYEAR ENDED JUNE 30, 2010
(Continued)
Gifts and Donations
Budget Actual
Variance - Positive
(Negative)Revenues: Other local State aid and grants Federal aid, grants and reimbursements Total revenues
Expenditures: Current - Instruction Support services - students and staff Support services - administration Operation and maintenance of plant services Student transportation services Operation of non-instructional services Capital outlay Total expenditures
Excess (deficiency) of revenues over expenditures
Other financing sources (uses): Transfer in Transfer out Total other financing sources (uses)
Change in fund balances
Fund balances, July 1, 2009
Increase in reserve for inventory
Fund balances (deficits), June 30, 2010
$ 60,000 $ 106,588 $ 46,588
60,000 106,588 46,588
152,730 77,104 75,626 12,933 6,529 6,404
4,635 2,340 2,295
13,458 6,794 6,664 3,066 1,548 1,518
13,178 6,653 6,525 200,000 100,968 99,032
(140,000) 5,620 145,620
(140,000) 5,620 145,620
134,380 134,380
$ (140,000) $ 140,000 $ 280,000
Page 92

Fingerprint Insurance Proceeds
Budget Actual
Variance - Positive
(Negative) Budget Actual
Variance - Positive
(Negative)
$ 3,000 $ 3,653 $ 653 $ 125,000 $ 93,010 $ (31,990)
3,000 3,653 653 125,000 93,010 (31,990)
41,876 11,239 30,637
5,500 4,274 1,226 38,049 10,212 27,837 20,101 5,395 14,706
99,974 26,832 73,142 5,500 4,274 1,226 200,000 53,678 146,322
(2,500) (621) 1,879 (75,000) 39,332 114,332
(2,500) (621) 1,879 (75,000) 39,332 114,332
2,396 2,396 75,627 75,627
$ (2,500) $ 1,775 $ 4,275 $ (75,000) $ 114,959 $ 189,959
(Continued)
Page 93
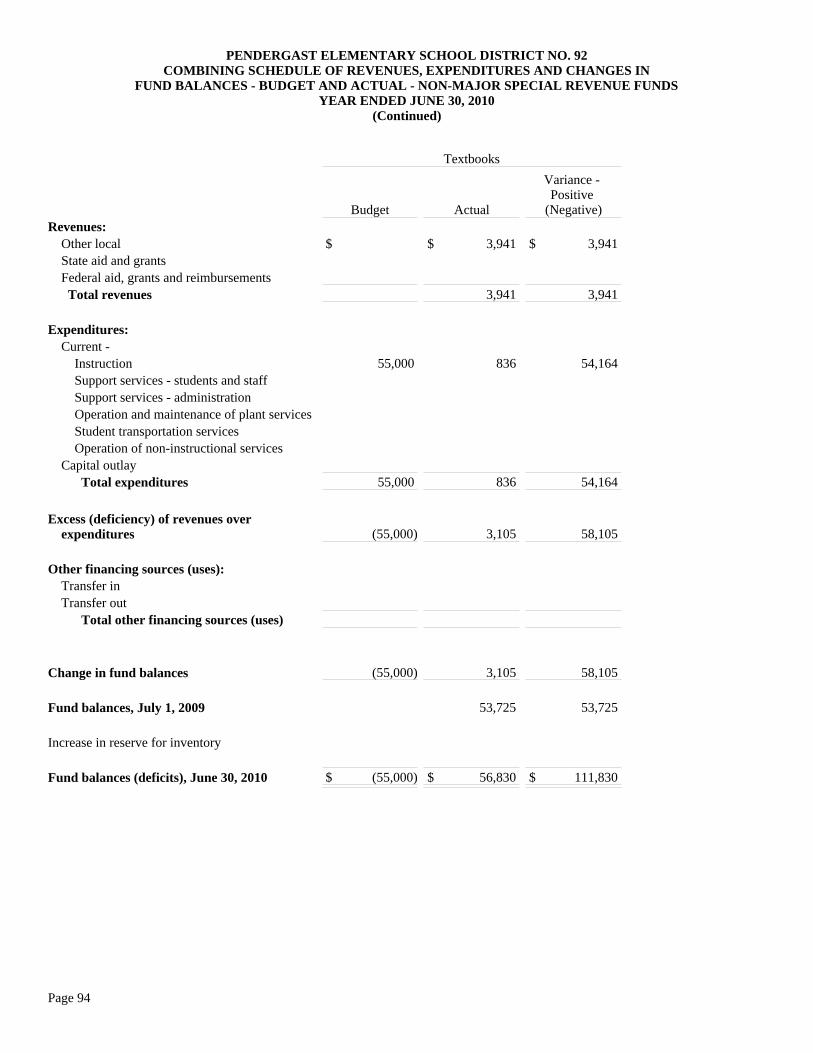
PENDERGAST ELEMENTARY SCHOOL DISTRICT NO. 92COMBINING SCHEDULE OF REVENUES, EXPENDITURES AND CHANGES IN
FUND BALANCES - BUDGET AND ACTUAL - NON-MAJOR SPECIAL REVENUE FUNDSYEAR ENDED JUNE 30, 2010
(Continued)
Textbooks
Budget Actual
Variance - Positive
(Negative)Revenues: Other local State aid and grants Federal aid, grants and reimbursements Total revenues
Expenditures: Current - Instruction Support services - students and staff Support services - administration Operation and maintenance of plant services Student transportation services Operation of non-instructional services Capital outlay Total expenditures
Excess (deficiency) of revenues over expenditures
Other financing sources (uses): Transfer in Transfer out Total other financing sources (uses)
Change in fund balances
Fund balances, July 1, 2009
Increase in reserve for inventory
Fund balances (deficits), June 30, 2010
$ $ 3,941 $ 3,941
3,941 3,941
55,000 836 54,164
55,000 836 54,164
(55,000) 3,105 58,105
(55,000) 3,105 58,105
53,725 53,725
$ (55,000) $ 56,830 $ 111,830
Page 94
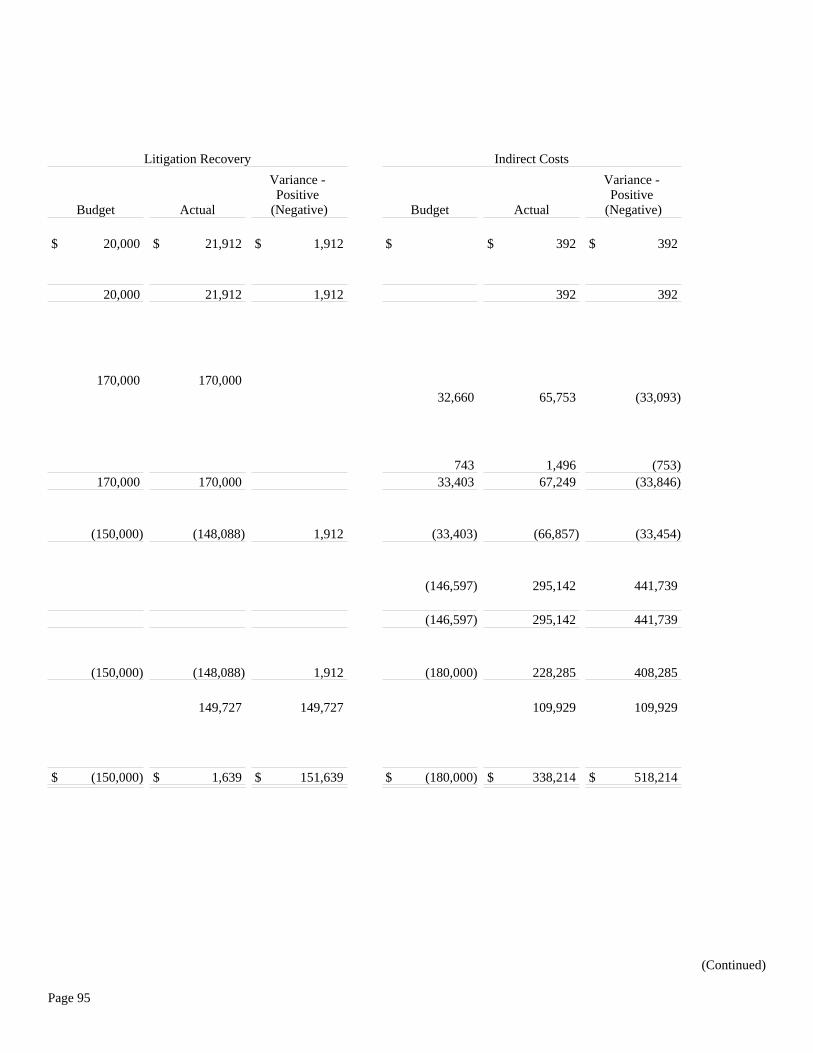
Litigation Recovery Indirect Costs
Budget Actual
Variance - Positive
(Negative) Budget Actual
Variance - Positive
(Negative)
$ 20,000 $ 21,912 $ 1,912 $ $ 392 $ 392
20,000 21,912 1,912 392 392
170,000 170,000 32,660 65,753 (33,093)
743 1,496 (753)170,000 170,000 33,403 67,249 (33,846)
(150,000) (148,088) 1,912 (33,403) (66,857) (33,454)
(146,597) 295,142 441,739
(146,597) 295,142 441,739
(150,000) (148,088) 1,912 (180,000) 228,285 408,285
149,727 149,727 109,929 109,929
$ (150,000) $ 1,639 $ 151,639 $ (180,000) $ 338,214 $ 518,214
(Continued)
Page 95
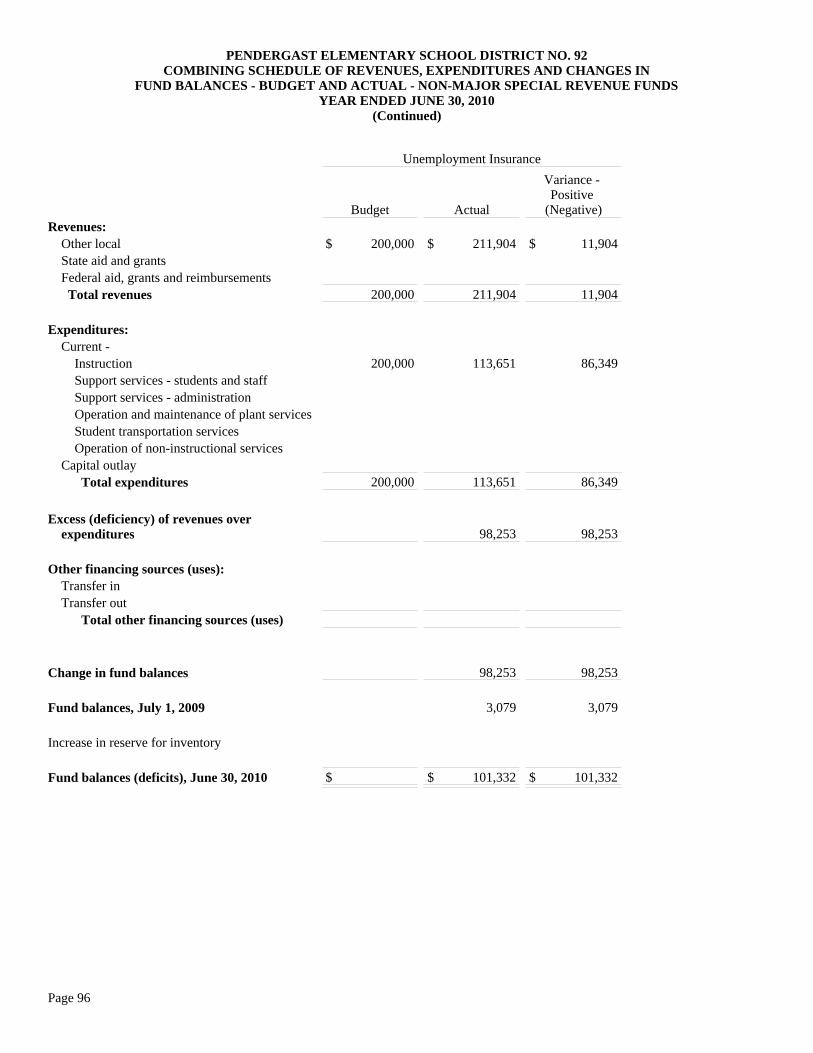
PENDERGAST ELEMENTARY SCHOOL DISTRICT NO. 92COMBINING SCHEDULE OF REVENUES, EXPENDITURES AND CHANGES IN
FUND BALANCES - BUDGET AND ACTUAL - NON-MAJOR SPECIAL REVENUE FUNDSYEAR ENDED JUNE 30, 2010
(Continued)
Unemployment Insurance
Budget Actual
Variance - Positive
(Negative)Revenues: Other local State aid and grants Federal aid, grants and reimbursements Total revenues
Expenditures: Current - Instruction Support services - students and staff Support services - administration Operation and maintenance of plant services Student transportation services Operation of non-instructional services Capital outlay Total expenditures
Excess (deficiency) of revenues over expenditures
Other financing sources (uses): Transfer in Transfer out Total other financing sources (uses)
Change in fund balances
Fund balances, July 1, 2009
Increase in reserve for inventory
Fund balances (deficits), June 30, 2010
$ 200,000 $ 211,904 $ 11,904
200,000 211,904 11,904
200,000 113,651 86,349
200,000 113,651 86,349
98,253 98,253
98,253 98,253
3,079 3,079
$ $ 101,332 $ 101,332
Page 96
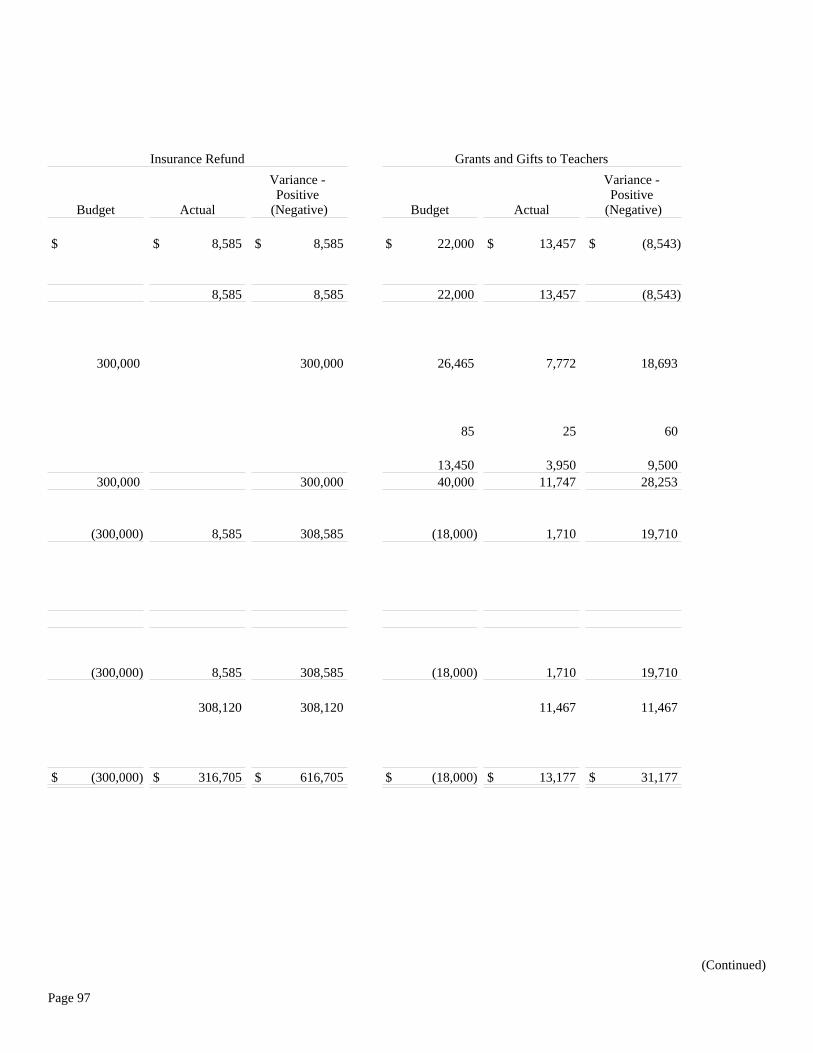
Insurance Refund Grants and Gifts to Teachers
Budget Actual
Variance - Positive
(Negative) Budget Actual
Variance - Positive
(Negative)
$ $ 8,585 $ 8,585 $ 22,000 $ 13,457 $ (8,543)
8,585 8,585 22,000 13,457 (8,543)
300,000 300,000 26,465 7,772 18,693
85 25 60
13,450 3,950 9,500 300,000 300,000 40,000 11,747 28,253
(300,000) 8,585 308,585 (18,000) 1,710 19,710
(300,000) 8,585 308,585 (18,000) 1,710 19,710
308,120 308,120 11,467 11,467
$ (300,000) $ 316,705 $ 616,705 $ (18,000) $ 13,177 $ 31,177
(Continued)
Page 97
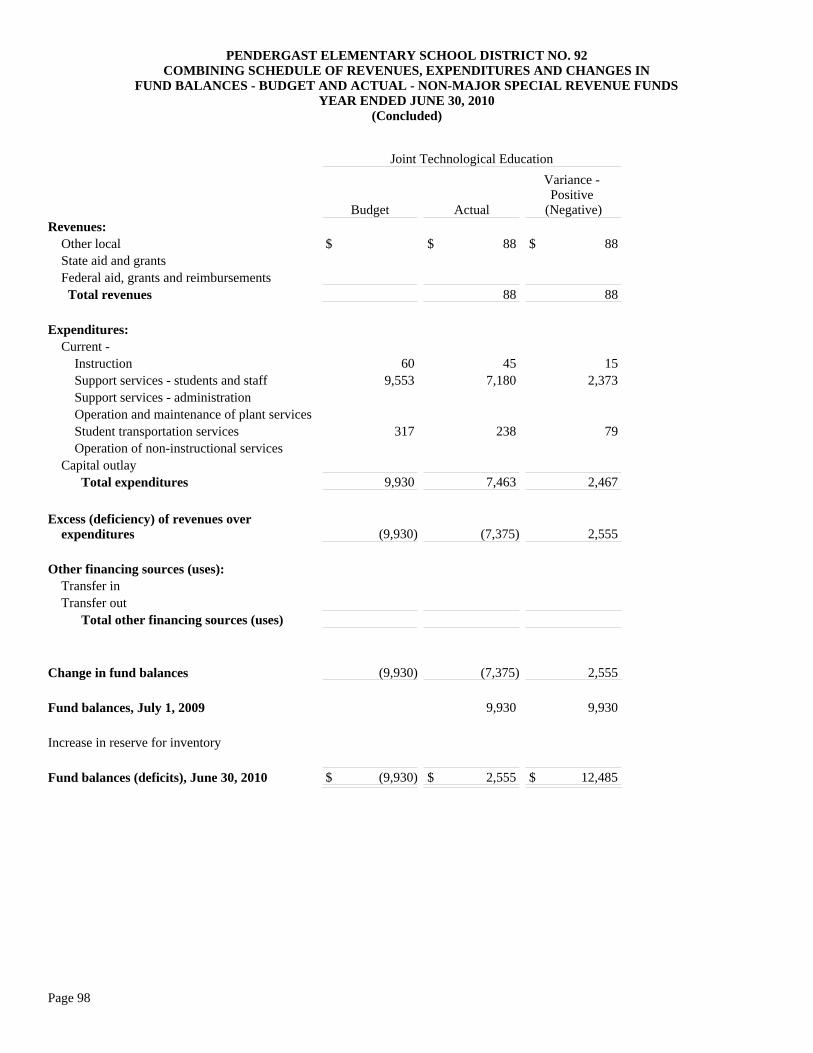
PENDERGAST ELEMENTARY SCHOOL DISTRICT NO. 92COMBINING SCHEDULE OF REVENUES, EXPENDITURES AND CHANGES IN
FUND BALANCES - BUDGET AND ACTUAL - NON-MAJOR SPECIAL REVENUE FUNDSYEAR ENDED JUNE 30, 2010
(Concluded)
Joint Technological Education
Budget Actual
Variance - Positive
(Negative)Revenues: Other local State aid and grants Federal aid, grants and reimbursements Total revenues
Expenditures: Current - Instruction Support services - students and staff Support services - administration Operation and maintenance of plant services Student transportation services Operation of non-instructional services Capital outlay Total expenditures
Excess (deficiency) of revenues over expenditures
Other financing sources (uses): Transfer in Transfer out Total other financing sources (uses)
Change in fund balances
Fund balances, July 1, 2009
Increase in reserve for inventory
Fund balances (deficits), June 30, 2010
$ $ 88 $ 88
88 88
60 45 15 9,553 7,180 2,373
317 238 79
9,930 7,463 2,467
(9,930) (7,375) 2,555
(9,930) (7,375) 2,555
9,930 9,930
$ (9,930) $ 2,555 $ 12,485
Page 98
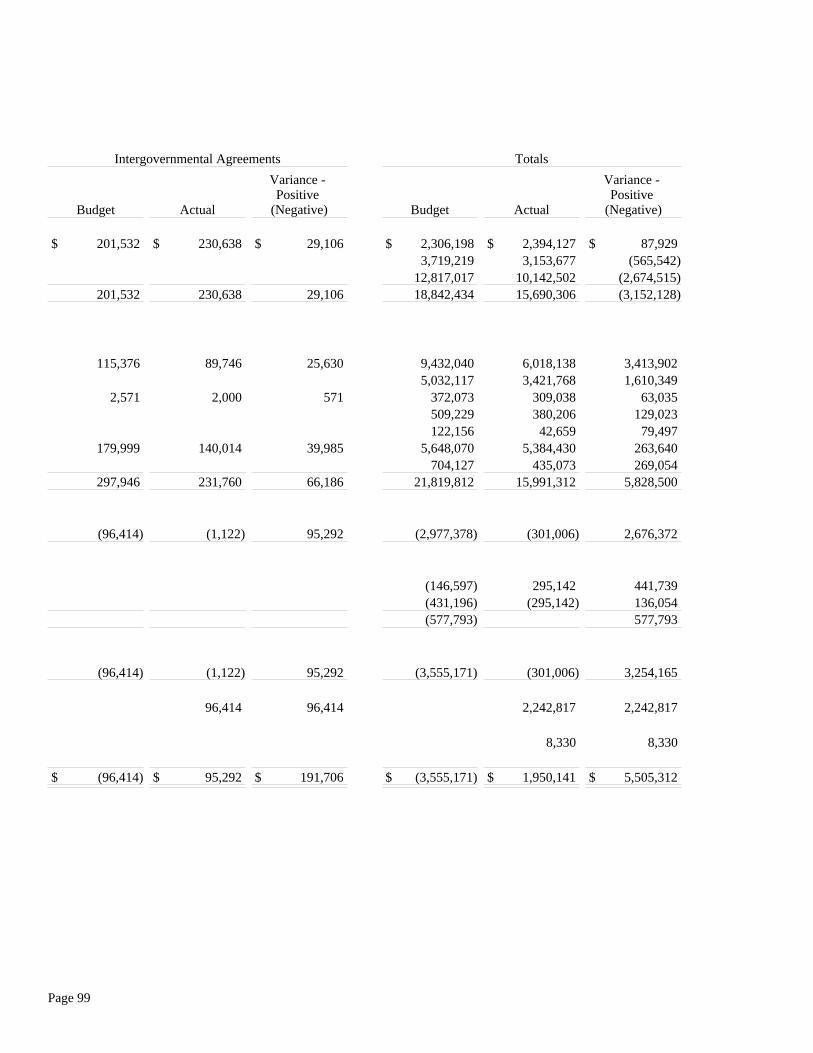
Intergovernmental Agreements Totals
Budget Actual
Variance - Positive
(Negative) Budget Actual
Variance - Positive
(Negative)
$ 201,532 $ 230,638 $ 29,106 $ 2,306,198 $ 2,394,127 $ 87,929 3,719,219 3,153,677 (565,542)
12,817,017 10,142,502 (2,674,515)201,532 230,638 29,106 18,842,434 15,690,306 (3,152,128)
115,376 89,746 25,630 9,432,040 6,018,138 3,413,902 5,032,117 3,421,768 1,610,349
2,571 2,000 571 372,073 309,038 63,035 509,229 380,206 129,023 122,156 42,659 79,497
179,999 140,014 39,985 5,648,070 5,384,430 263,640 704,127 435,073 269,054
297,946 231,760 66,186 21,819,812 15,991,312 5,828,500
(96,414) (1,122) 95,292 (2,977,378) (301,006) 2,676,372
(146,597) 295,142 441,739 (431,196) (295,142) 136,054
(577,793) 577,793
(96,414) (1,122) 95,292 (3,555,171) (301,006) 3,254,165
96,414 96,414 2,242,817 2,242,817
8,330 8,330
$ (96,414) $ 95,292 $ 191,706 $ (3,555,171) $ 1,950,141 $ 5,505,312
Page 99

Page 100
(This page intentionally left blank)
Page 101
NON-MAJOR CAPITAL PROJECTS FUNDS The following non-major Capital Projects Funds are maintained by the District. Arizona Revised Statutes (A.R.S.) and the Uniform System of Financial Records (USFR) require the establishment of these funds for the specified financial activities. Unrestricted Capital Outlay- to account for transactions relating to the acquisition of capital items. Adjacent Ways - to account for monies received to finance improvements of public ways adjacent to school property. Soft Capital Allocation - to account for transactions relating to the acquisition of short-term capital items required to meet academic adequacy standards. Gifts and Donations - to account for gifts and donations to be expended for capital acquisitions. Building Renewal - to account for monies received from the School Facilities Board that are used for infrastructure or for major upgrades, repairs, or renovations to areas, systems or buildings that will maintain or extend their useful life. New School Facilities - to account for monies received from the School Facilities Board to be used for constructing new school facilities and purchasing land for new school sites.
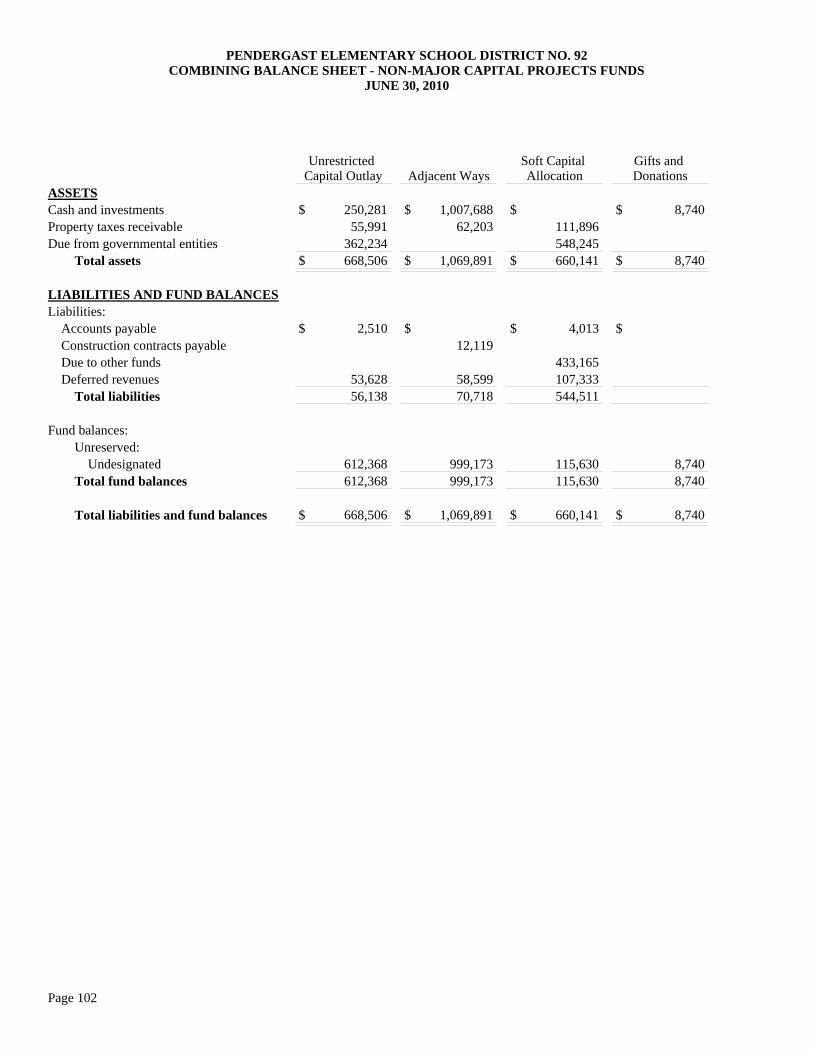
PENDERGAST ELEMENTARY SCHOOL DISTRICT NO. 92COMBINING BALANCE SHEET - NON-MAJOR CAPITAL PROJECTS FUNDS
JUNE 30, 2010
Unrestricted Capital Outlay Adjacent Ways
Soft Capital Allocation
Gifts and Donations
ASSETSCash and investmentsProperty taxes receivableDue from governmental entities Total assets
LIABILITIES AND FUND BALANCESLiabilities: Accounts payable Construction contracts payable Due to other funds Deferred revenues Total liabilities
Fund balances: Unreserved: Undesignated Total fund balances
Total liabilities and fund balances
$ 250,281 $ 1,007,688 $ $ 8,740 55,991 62,203 111,896
362,234 548,245 $ 668,506 $ 1,069,891 $ 660,141 $ 8,740
$ 2,510 $ $ 4,013 $ 12,119 433,165
53,628 58,599 107,333 56,138 70,718 544,511
612,368 999,173 115,630 8,740 612,368 999,173 115,630 8,740
$ 668,506 $ 1,069,891 $ 660,141 $ 8,740
Page 102
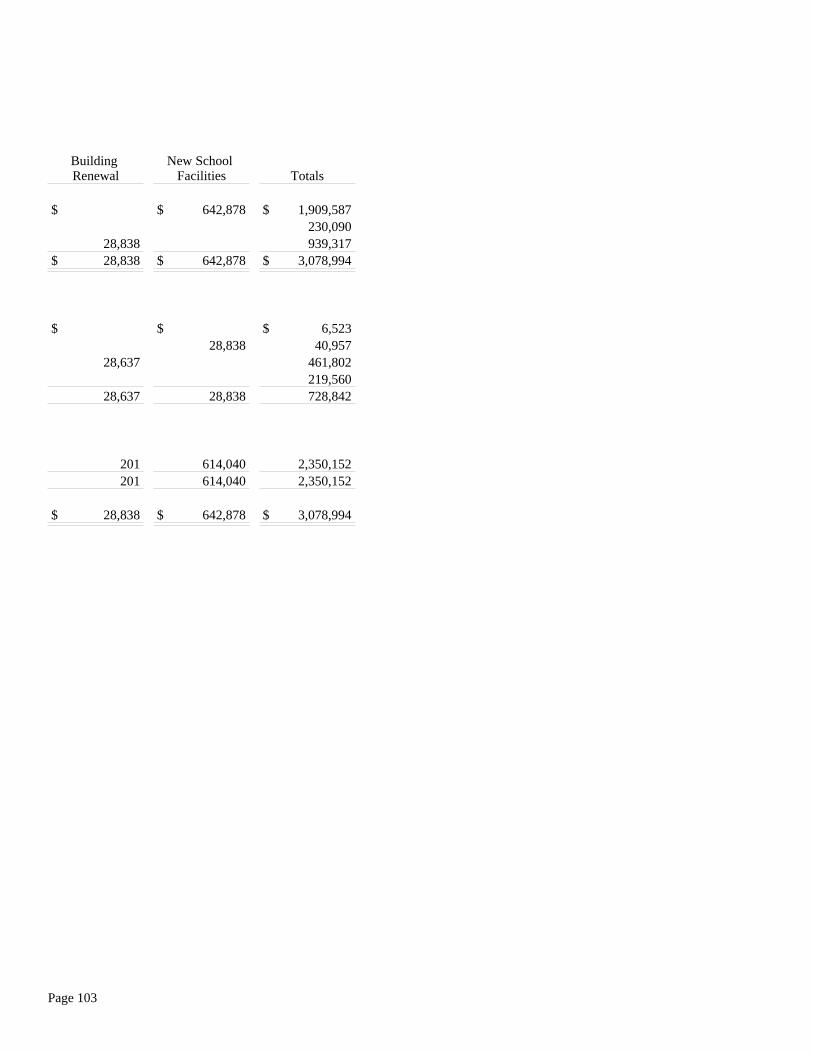
Building Renewal
New School Facilities Totals
$ $ 642,878 $ 1,909,587 230,090
28,838 939,317 $ 28,838 $ 642,878 $ 3,078,994
$ $ $ 6,523 28,838 40,957
28,637 461,802 219,560
28,637 28,838 728,842
201 614,040 2,350,152 201 614,040 2,350,152
$ 28,838 $ 642,878 $ 3,078,994
Page 103
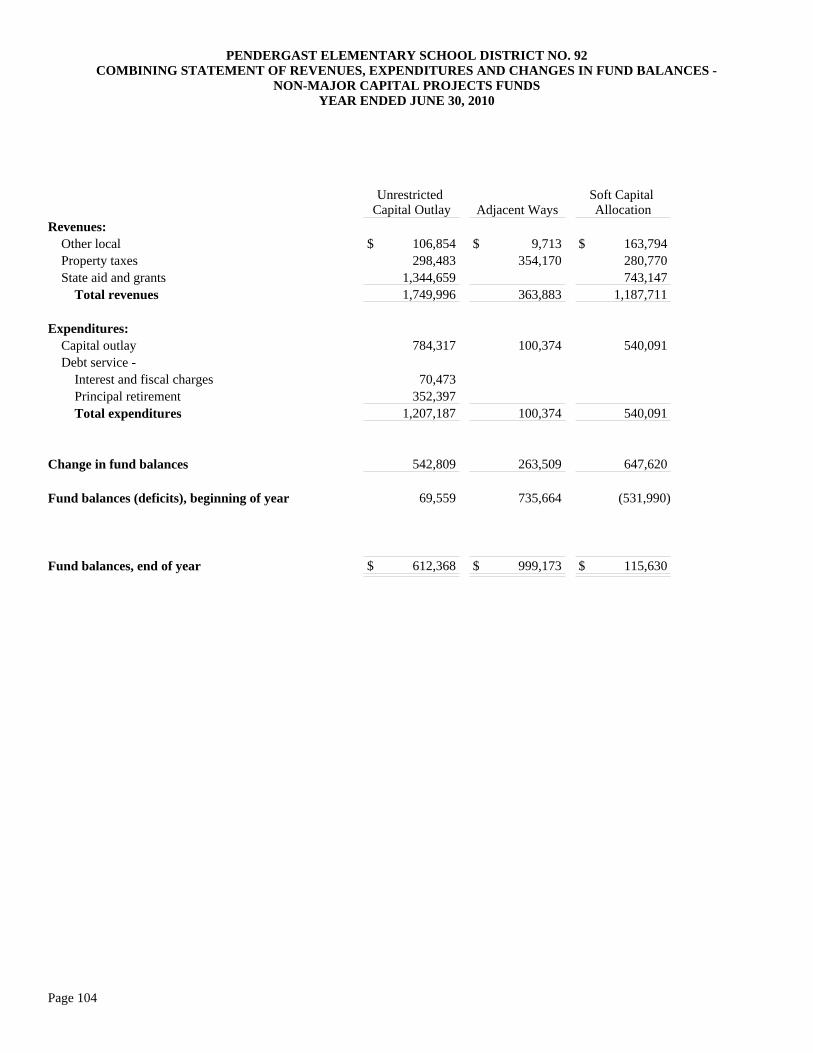
PENDERGAST ELEMENTARY SCHOOL DISTRICT NO. 92COMBINING STATEMENT OF REVENUES, EXPENDITURES AND CHANGES IN FUND BALANCES -
NON-MAJOR CAPITAL PROJECTS FUNDSYEAR ENDED JUNE 30, 2010
Unrestricted Capital Outlay Adjacent Ways
Soft Capital Allocation
Revenues: Other local Property taxes State aid and grants Total revenues
Expenditures: Capital outlay Debt service - Interest and fiscal charges Principal retirement Total expenditures
Change in fund balances
Fund balances (deficits), beginning of year
Fund balances, end of year
$ 106,854 $ 9,713 $ 163,794 298,483 354,170 280,770
1,344,659 743,147 1,749,996 363,883 1,187,711
784,317 100,374 540,091
70,473 352,397
1,207,187 100,374 540,091
542,809 263,509 647,620
69,559 735,664 (531,990)
$ 612,368 $ 999,173 $ 115,630
Page 104
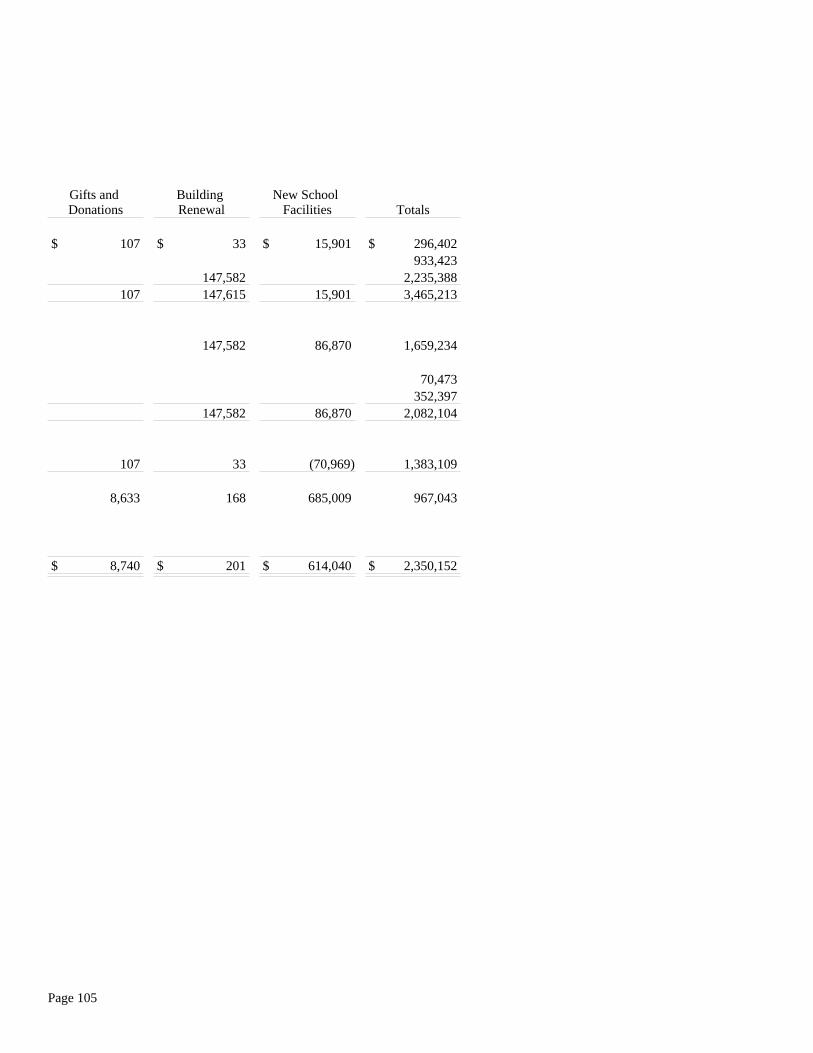
Gifts and Donations
Building Renewal
New School Facilities Totals
$ 107 $ 33 $ 15,901 $ 296,402 933,423 147,582 2,235,388
107 147,615 15,901 3,465,213
147,582 86,870 1,659,234
70,473 352,397 147,582 86,870 2,082,104
107 33 (70,969) 1,383,109
8,633 168 685,009 967,043
$ 8,740 $ 201 $ 614,040 $ 2,350,152
Page 105
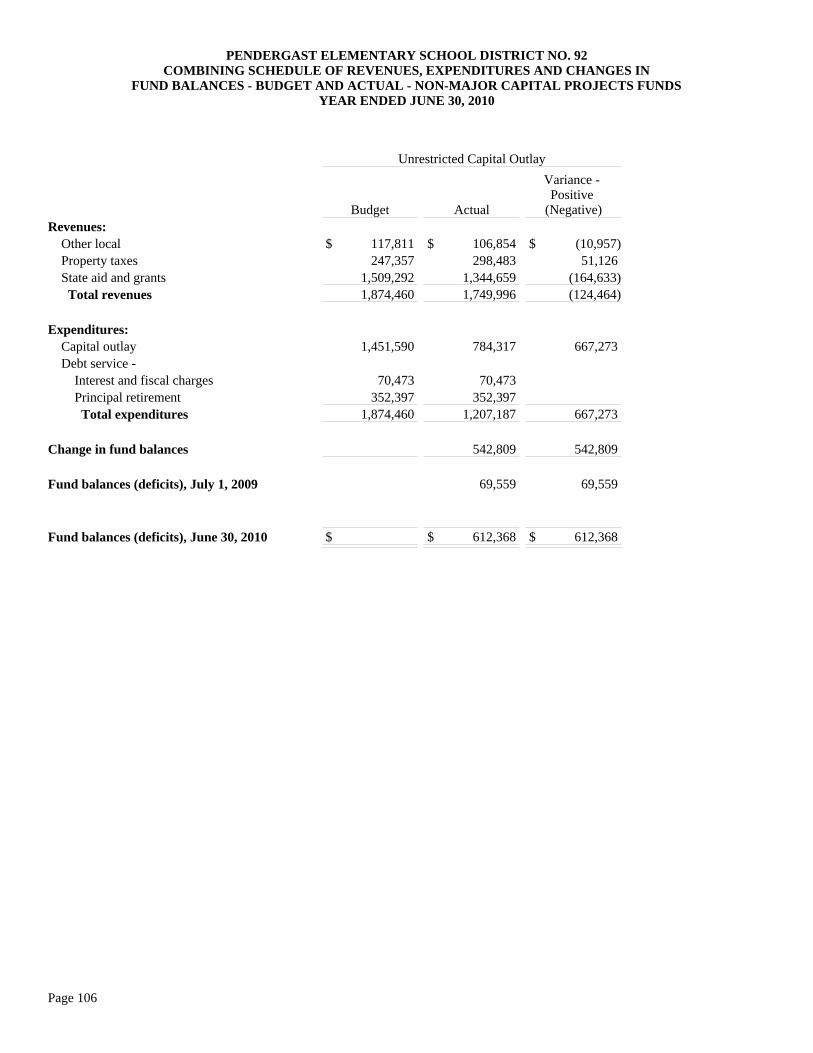
PENDERGAST ELEMENTARY SCHOOL DISTRICT NO. 92COMBINING SCHEDULE OF REVENUES, EXPENDITURES AND CHANGES IN
FUND BALANCES - BUDGET AND ACTUAL - NON-MAJOR CAPITAL PROJECTS FUNDSYEAR ENDED JUNE 30, 2010
Unrestricted Capital Outlay
Budget Actual
Variance - Positive
(Negative)Revenues: Other local Property taxes State aid and grants Total revenues
Expenditures: Capital outlay Debt service - Interest and fiscal charges Principal retirement Total expenditures
Change in fund balances
Fund balances (deficits), July 1, 2009
Fund balances (deficits), June 30, 2010
$ 117,811 $ 106,854 $ (10,957)247,357 298,483 51,126
1,509,292 1,344,659 (164,633)1,874,460 1,749,996 (124,464)
1,451,590 784,317 667,273
70,473 70,473 352,397 352,397
1,874,460 1,207,187 667,273
542,809 542,809
69,559 69,559
$ $ 612,368 $ 612,368
Page 106
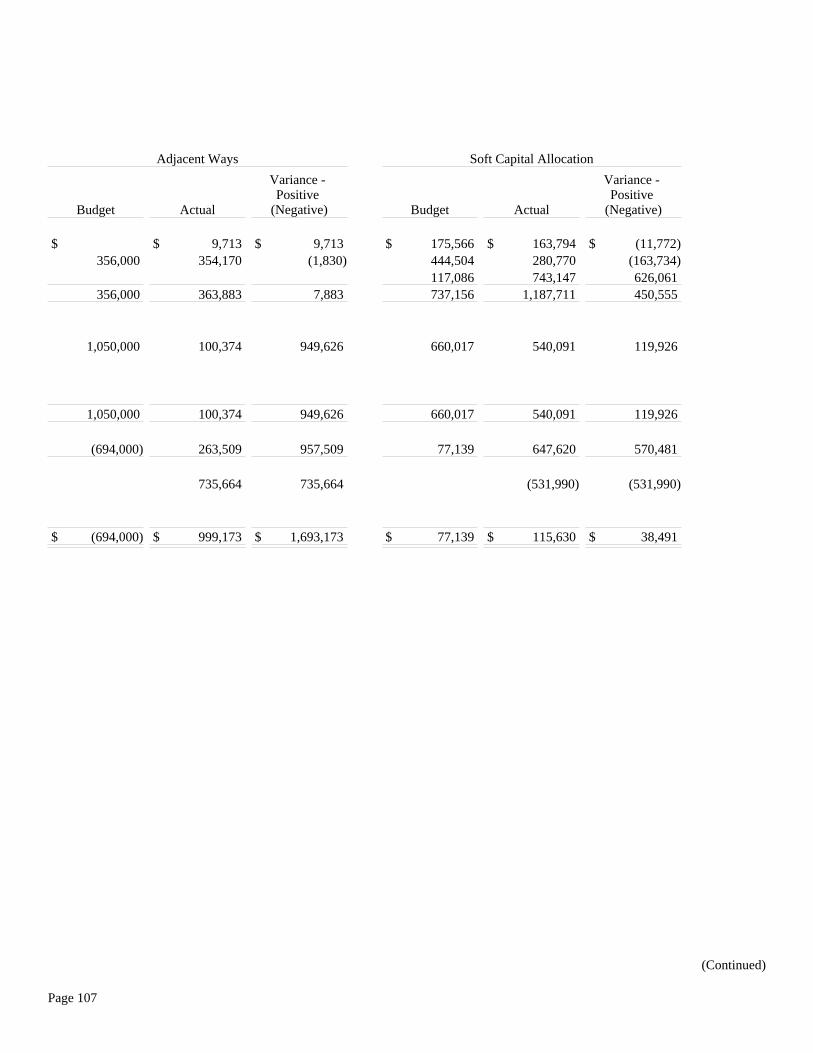
Adjacent Ways Soft Capital Allocation
Budget Actual
Variance - Positive
(Negative) Budget Actual
Variance - Positive
(Negative)
$ $ 9,713 $ 9,713 $ 175,566 $ 163,794 $ (11,772)356,000 354,170 (1,830) 444,504 280,770 (163,734)
117,086 743,147 626,061 356,000 363,883 7,883 737,156 1,187,711 450,555
1,050,000 100,374 949,626 660,017 540,091 119,926
1,050,000 100,374 949,626 660,017 540,091 119,926
(694,000) 263,509 957,509 77,139 647,620 570,481
735,664 735,664 (531,990) (531,990)
$ (694,000) $ 999,173 $ 1,693,173 $ 77,139 $ 115,630 $ 38,491
(Continued)
Page 107
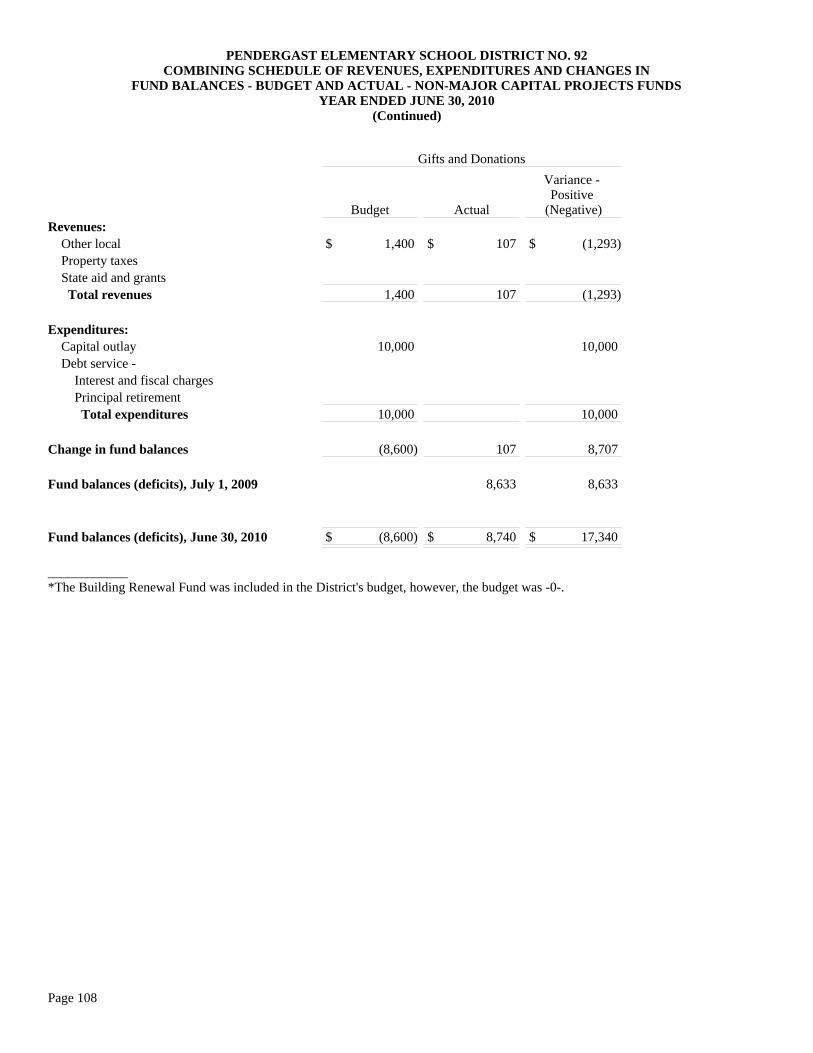
PENDERGAST ELEMENTARY SCHOOL DISTRICT NO. 92COMBINING SCHEDULE OF REVENUES, EXPENDITURES AND CHANGES IN
FUND BALANCES - BUDGET AND ACTUAL - NON-MAJOR CAPITAL PROJECTS FUNDSYEAR ENDED JUNE 30, 2010
(Continued)
Gifts and Donations
Budget Actual
Variance - Positive
(Negative)Revenues: Other local Property taxes State aid and grants Total revenues
Expenditures: Capital outlay Debt service - Interest and fiscal charges Principal retirement Total expenditures
Change in fund balances
Fund balances (deficits), July 1, 2009
Fund balances (deficits), June 30, 2010
$ 1,400 $ 107 $ (1,293)
1,400 107 (1,293)
10,000 10,000
10,000 10,000
(8,600) 107 8,707
8,633 8,633
$ (8,600) $ 8,740 $ 17,340
____________*The Building Renewal Fund was included in the District's budget, however, the budget was -0-.
Page 108
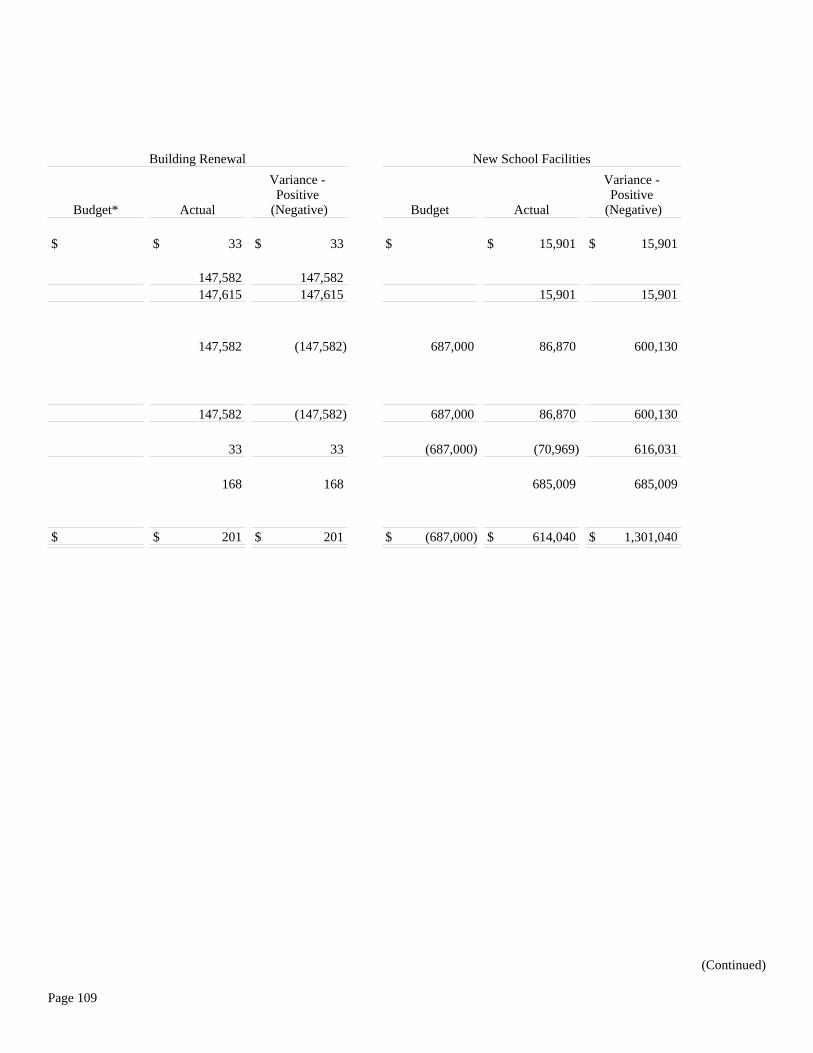
Building Renewal New School Facilities
Budget* Actual
Variance - Positive
(Negative) Budget Actual
Variance - Positive
(Negative)
$ $ 33 $ 33 $ $ 15,901 $ 15,901
147,582 147,582 147,615 147,615 15,901 15,901
147,582 (147,582) 687,000 86,870 600,130
147,582 (147,582) 687,000 86,870 600,130
33 33 (687,000) (70,969) 616,031
168 168 685,009 685,009
$ $ 201 $ 201 $ (687,000) $ 614,040 $ 1,301,040
(Continued)
Page 109
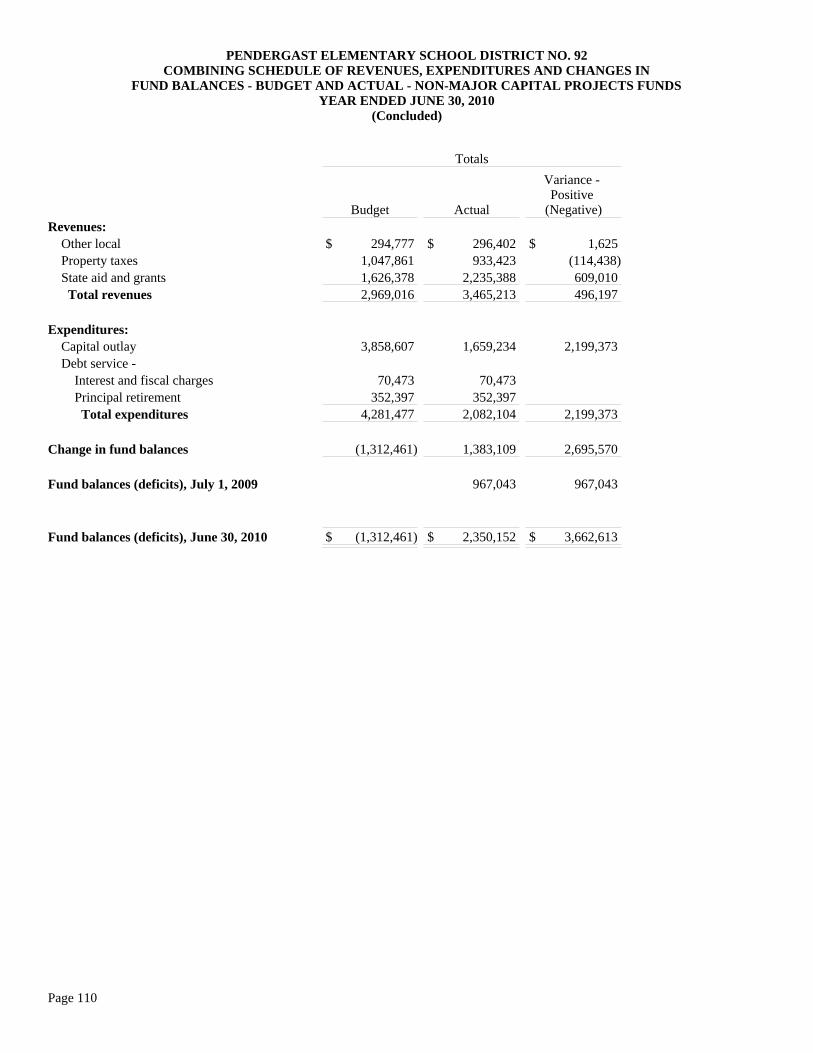
PENDERGAST ELEMENTARY SCHOOL DISTRICT NO. 92COMBINING SCHEDULE OF REVENUES, EXPENDITURES AND CHANGES IN
FUND BALANCES - BUDGET AND ACTUAL - NON-MAJOR CAPITAL PROJECTS FUNDSYEAR ENDED JUNE 30, 2010
(Concluded)
Totals
Budget Actual
Variance - Positive
(Negative)Revenues: Other local Property taxes State aid and grants Total revenues
Expenditures: Capital outlay Debt service - Interest and fiscal charges Principal retirement Total expenditures
Change in fund balances
Fund balances (deficits), July 1, 2009
Fund balances (deficits), June 30, 2010
$ 294,777 $ 296,402 $ 1,625 1,047,861 933,423 (114,438)1,626,378 2,235,388 609,010 2,969,016 3,465,213 496,197
3,858,607 1,659,234 2,199,373
70,473 70,473 352,397 352,397
4,281,477 2,082,104 2,199,373
(1,312,461) 1,383,109 2,695,570
967,043 967,043
$ (1,312,461) $ 2,350,152 $ 3,662,613
Page 110
Page 111
AGENCY FUNDS Student Activities - to account for monies raised by students to finance student clubs and organizations but held by the District as an agent. Employee Withholding - to account for voluntary deductions and employee payroll checks temporarily held by the District as an agent.
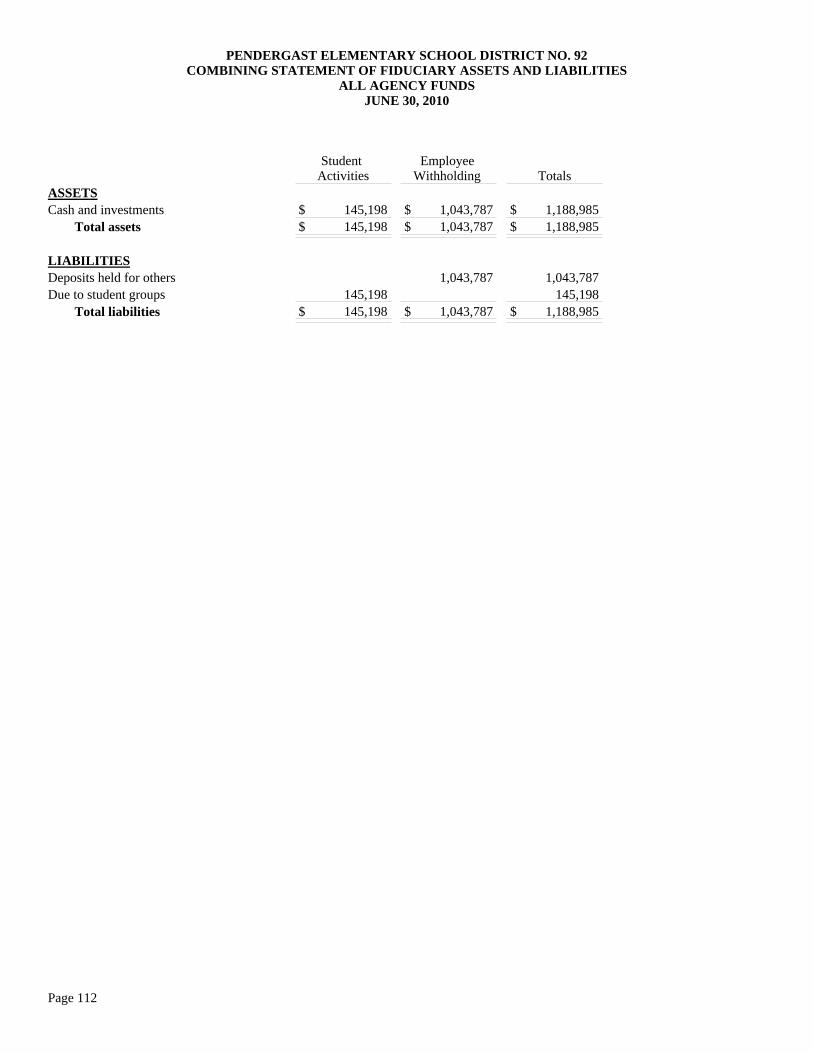
PENDERGAST ELEMENTARY SCHOOL DISTRICT NO. 92COMBINING STATEMENT OF FIDUCIARY ASSETS AND LIABILITIES
ALL AGENCY FUNDSJUNE 30, 2010
Student Activities
Employee Withholding Totals
ASSETSCash and investments Total assets
LIABILITIESDeposits held for othersDue to student groups Total liabilities
$ 145,198 $ 1,043,787 $ 1,188,985 $ 145,198 $ 1,043,787 $ 1,188,985
1,043,787 1,043,787 145,198 145,198
$ 145,198 $ 1,043,787 $ 1,188,985
Page 112
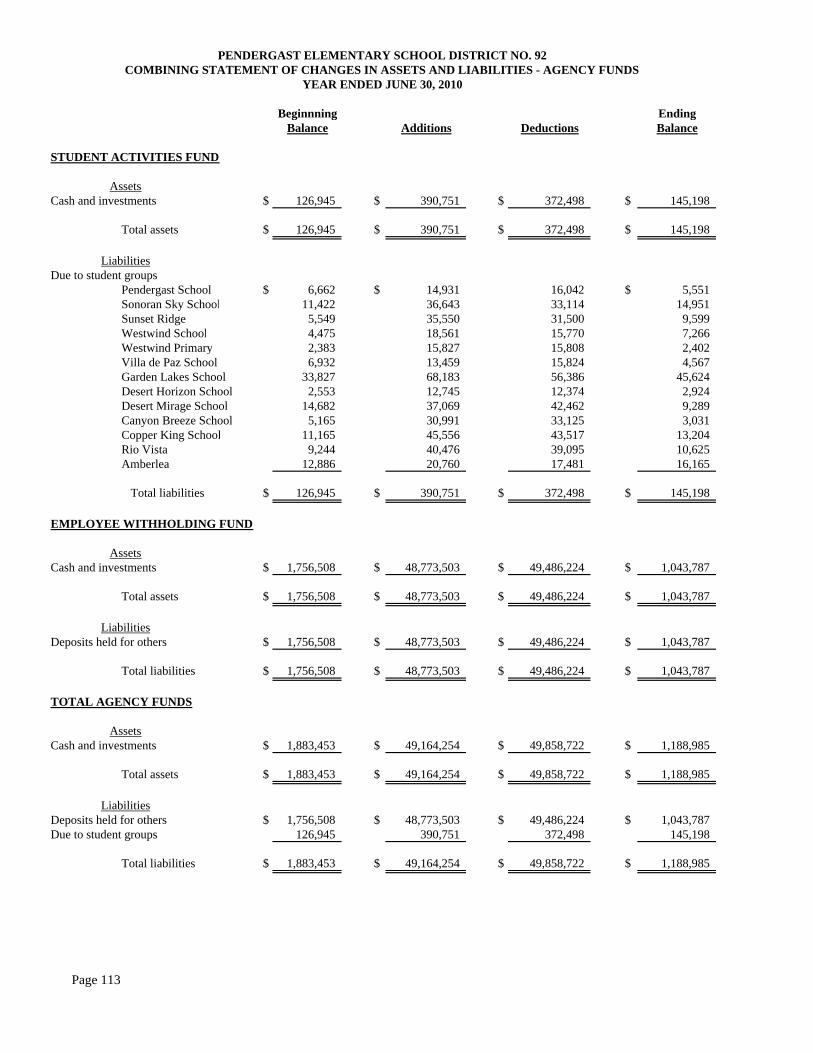
Beginnning EndingBalance Additions Deductions Balance
STUDENT ACTIVITIES FUND
AssetsCash and investments $ 126,945 $ 390,751 $ 372,498 $ 145,198
Total assets $ 126,945 $ 390,751 $ 372,498 $ 145,198
LiabilitiesDue to student groups
Pendergast School $ 6,662 $ 14,931 16,042 $ 5,551 Sonoran Sky School 11,422 36,643 33,114 14,951 Sunset Ridge 5,549 35,550 31,500 9,599 Westwind School 4,475 18,561 15,770 7,266 Westwind Primary 2,383 15,827 15,808 2,402 Villa de Paz School 6,932 13,459 15,824 4,567 Garden Lakes School 33,827 68,183 56,386 45,624 Desert Horizon School 2,553 12,745 12,374 2,924 Desert Mirage School 14,682 37,069 42,462 9,289 Canyon Breeze School 5,165 30,991 33,125 3,031 Copper King School 11,165 45,556 43,517 13,204 Rio Vista 9,244 40,476 39,095 10,625 Amberlea 12,886 20,760 17,481 16,165
Total liabilities $ 126,945 $ 390,751 $ 372,498 $ 145,198
EMPLOYEE WITHHOLDING FUND
AssetsCash and investments $ 1,756,508 $ 48,773,503 $ 49,486,224 $ 1,043,787
Total assets $ 1,756,508 $ 48,773,503 $ 49,486,224 $ 1,043,787
LiabilitiesDeposits held for others $ 1,756,508 $ 48,773,503 $ 49,486,224 $ 1,043,787
Total liabilities $ 1,756,508 $ 48,773,503 $ 49,486,224 $ 1,043,787
TOTAL AGENCY FUNDS
AssetsCash and investments $ 1,883,453 $ 49,164,254 $ 49,858,722 $ 1,188,985
Total assets $ 1,883,453 $ 49,164,254 $ 49,858,722 $ 1,188,985
LiabilitiesDeposits held for others $ 1,756,508 $ 48,773,503 $ 49,486,224 $ 1,043,787Due to student groups 126,945 390,751 372,498 145,198
Total liabilities $ 1,883,453 $ 49,164,254 $ 49,858,722 $ 1,188,985
PENDERGAST ELEMENTARY SCHOOL DISTRICT NO. 92COMBINING STATEMENT OF CHANGES IN ASSETS AND LIABILITIES - AGENCY FUNDS
YEAR ENDED JUNE 30, 2010
Page 113

Page 114
(This page intentionally left blank)
Page 115
STATISTICAL SECTION
The statistical section presents financial statement trends as well as detailed financial and operational information not available elsewhere in the report. The statistical section is intended to enhance the reader’s understanding of the information presented in the financial statements, notes to the financial statements, and other supplementary information presented in this report. The statistical section is comprised of the five categories of statistical information presented below.
Financial Trends
These schedules contain information on financial trends to help the reader understand how the District’s financial position and financial activities have changed over time.
Revenue Capacity
These schedules contain information to help the reader assess the factors affecting the District’s ability to generate revenue.
Debt Capacity
These schedules present information to help the reader evaluate the District’s current levels of outstanding debt as well as assess the District’s ability to make debt payments and/or issue additional debt in the future.
Demographic and Economic Information These schedules present various demographic and economic indicators to help the reader understand the environment in which the District’s financial activities take place and to help make comparisons with other school districts.
Operating Information
These schedules contain information about the District’s operations and various resources to help the reader draw conclusions as to how the District’s financial information relates to the services provided by the District.
Due to cost considerations for the accumulation of data, the District has elected to present less than ten years of data, or data from less than nine years prior, for certain statistical schedules. This information will be accumulated and reported each year until the complete ten years of data is presented.

Page 116
(This page intentionally left blank)
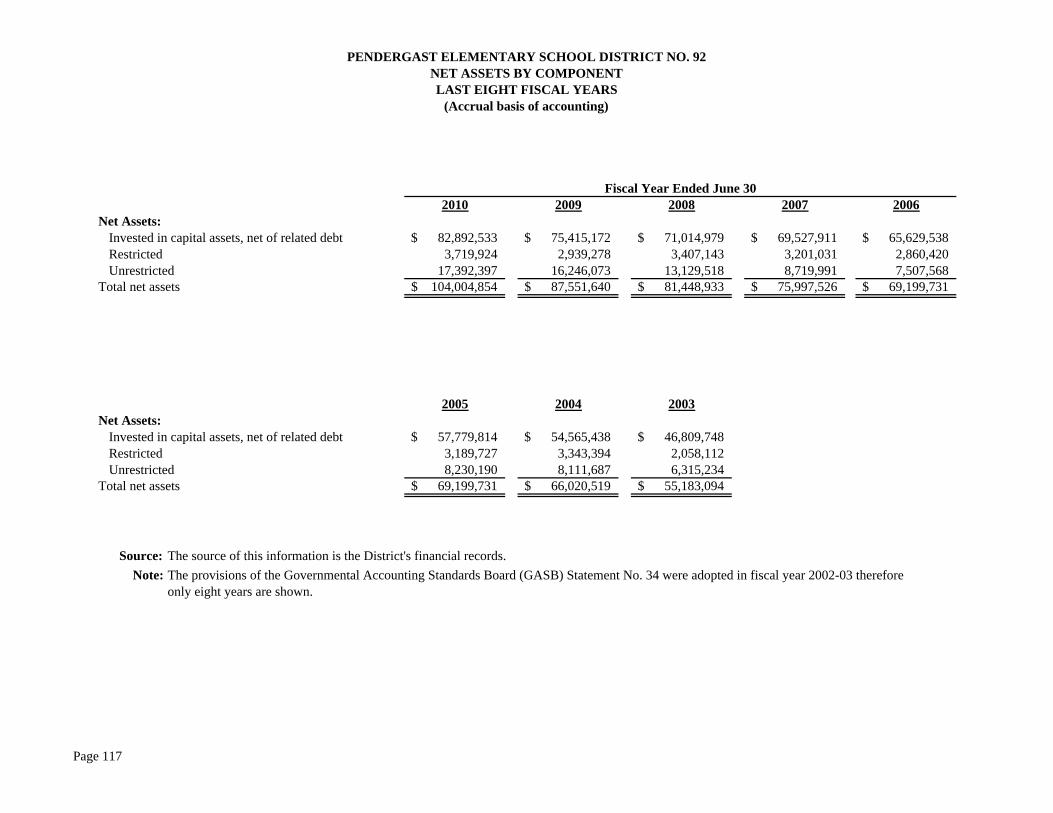
2010 2009 2008 2007 2006Net Assets:
Invested in capital assets, net of related debt 82,892,533$ 75,415,172$ 71,014,979$ 69,527,911$ 65,629,538$ Restricted 3,719,924 2,939,278 3,407,143 3,201,031 2,860,420 Unrestricted 17,392,397 16,246,073 13,129,518 8,719,991 7,507,568
Total net assets 104,004,854$ 87,551,640$ 81,448,933$ 75,997,526$ 69,199,731$
2005 2004 2003Net Assets:
Invested in capital assets, net of related debt 57,779,814$ 54,565,438$ 46,809,748$ Restricted 3,189,727 3,343,394 2,058,112 Unrestricted 8,230,190 8,111,687 6,315,234
Total net assets 69,199,731$ 66,020,519$ 55,183,094$
Source: The source of this information is the District's financial records.
The provisions of the Governmental Accounting Standards Board (GASB) Statement No. 34 were adopted in fiscal year 2002-03 therefore only eight years are shown.
Note:
PENDERGAST ELEMENTARY SCHOOL DISTRICT NO. 92NET ASSETS BY COMPONENTLAST EIGHT FISCAL YEARS
Fiscal Year Ended June 30
(Accrual basis of accounting)
Page 117
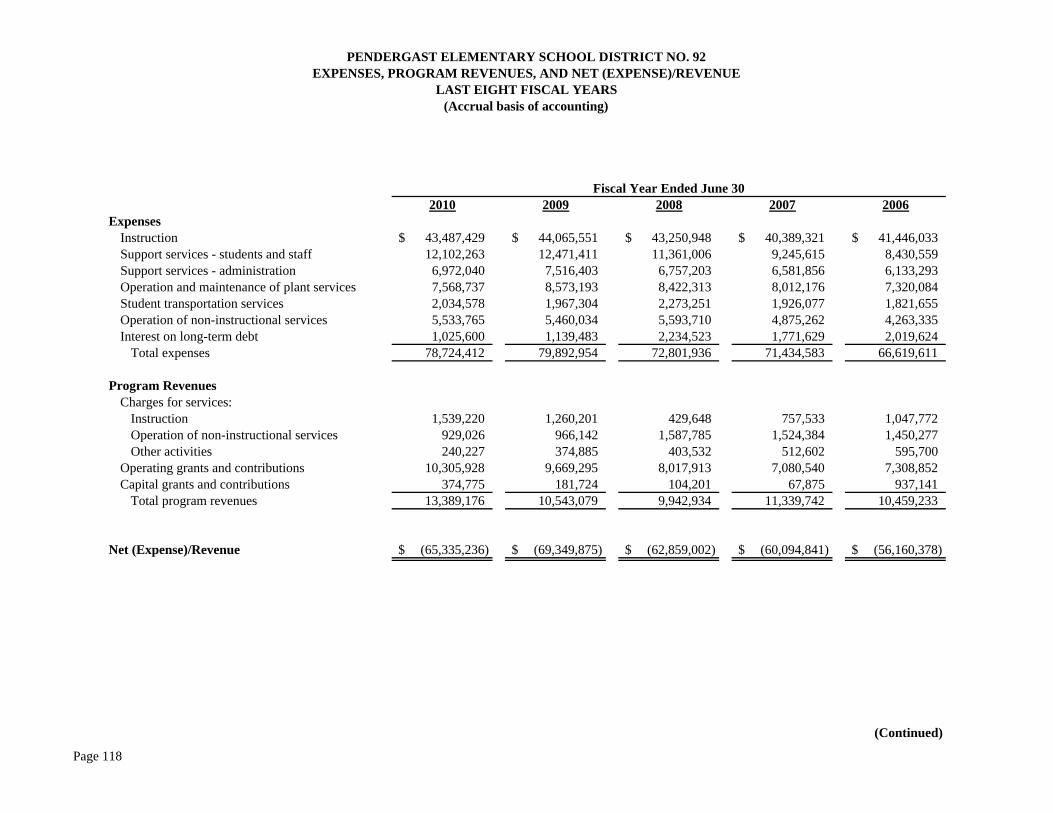
2010 2009 2008 2007 2006
Instruction 43,487,429$ 44,065,551$ 43,250,948$ 40,389,321$ 41,446,033$ Support services - students and staff 12,102,263 12,471,411 11,361,006 9,245,615 8,430,559 Support services - administration 6,972,040 7,516,403 6,757,203 6,581,856 6,133,293 Operation and maintenance of plant services 7,568,737 8,573,193 8,422,313 8,012,176 7,320,084 Student transportation services 2,034,578 1,967,304 2,273,251 1,926,077 1,821,655 Operation of non-instructional services 5,533,765 5,460,034 5,593,710 4,875,262 4,263,335 Interest on long-term debt 1,025,600 1,139,483 2,234,523 1,771,629 2,019,624
Total expenses 78,724,412 79,892,954 72,801,936 71,434,583 66,619,611
Program RevenuesCharges for services:
Instruction 1,539,220 1,260,201 429,648 757,533 1,047,772Operation of non-instructional services 929,026 966,142 1,587,785 1,524,384 1,450,277Other activities 240,227 374,885 403,532 512,602 595,700
Operating grants and contributions 10,305,928 9,669,295 8,017,913 7,080,540 7,308,852 Capital grants and contributions 374,775 181,724 104,201 67,875 937,141
Total program revenues 13,389,176 10,543,079 9,942,934 11,339,742 10,459,233
Net (Expense)/Revenue (65,335,236)$ (69,349,875)$ (62,859,002)$ (60,094,841)$ (56,160,378)$
(Continued)
PENDERGAST ELEMENTARY SCHOOL DISTRICT NO. 92EXPENSES, PROGRAM REVENUES, AND NET (EXPENSE)/REVENUE
LAST EIGHT FISCAL YEARS(Accrual basis of accounting)
Fiscal Year Ended June 30
Expenses
Page 118
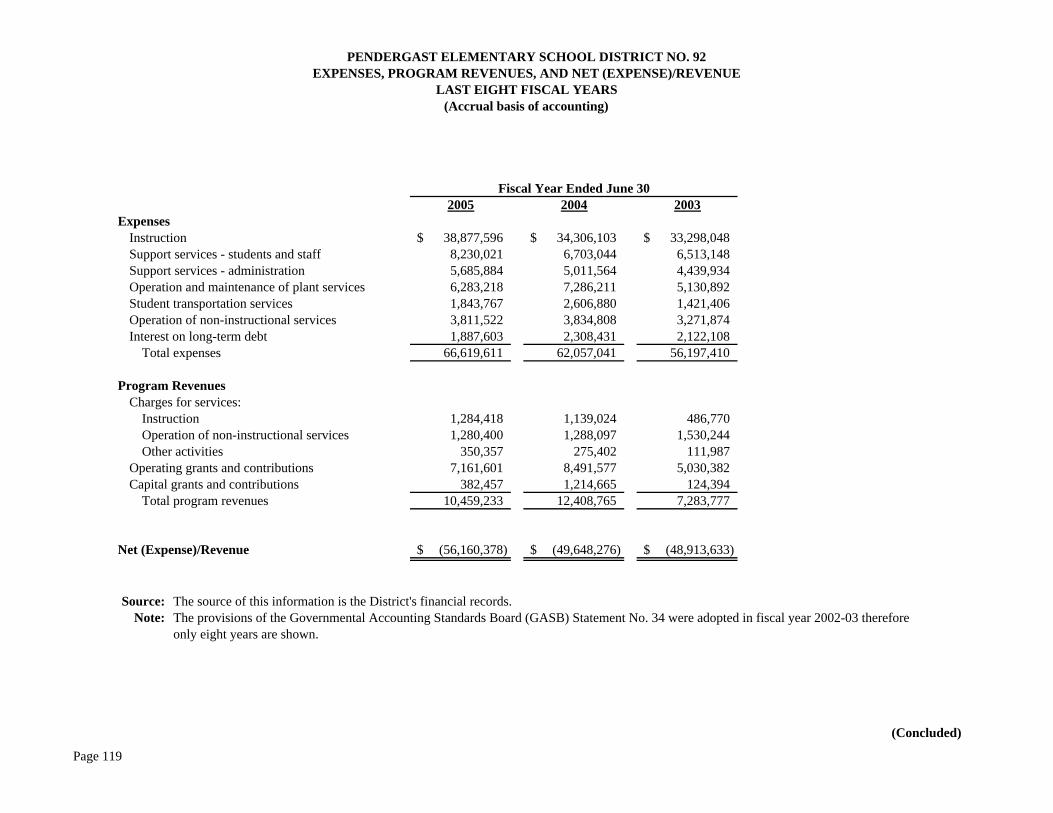
2005 2004 2003 1998 1997Expenses
Instruction 38,877,596$ 34,306,103$ 33,298,048$ Support services - students and staff 8,230,021 6,703,044 6,513,148 Support services - administration 5,685,884 5,011,564 4,439,934 Operation and maintenance of plant services 6,283,218 7,286,211 5,130,892 Student transportation services 1,843,767 2,606,880 1,421,406 Operation of non-instructional services 3,811,522 3,834,808 3,271,874 Interest on long-term debt 1,887,603 2,308,431 2,122,108
Total expenses 66,619,611 62,057,041 56,197,410 - -
Program RevenuesCharges for services:
Instruction 1,284,418 1,139,024 486,770Operation of non-instructional services 1,280,400 1,288,097 1,530,244Other activities 350,357 275,402 111,987
Operating grants and contributions 7,161,601 8,491,577 5,030,382 Capital grants and contributions 382,457 1,214,665 124,394
Total program revenues 10,459,233 12,408,765 7,283,777 - -
Net (Expense)/Revenue (56,160,378)$ (49,648,276)$ (48,913,633)$ -$ -$
Source: The source of this information is the District's financial records.Note: The provisions of the Governmental Accounting Standards Board (GASB) Statement No. 34 were adopted in fiscal year 2002-03 therefore
only eight years are shown.
(Concluded)
Fiscal Year Ended June 30
LAST EIGHT FISCAL YEARS(Accrual basis of accounting)
PENDERGAST ELEMENTARY SCHOOL DISTRICT NO. 92EXPENSES, PROGRAM REVENUES, AND NET (EXPENSE)/REVENUE
Page 119
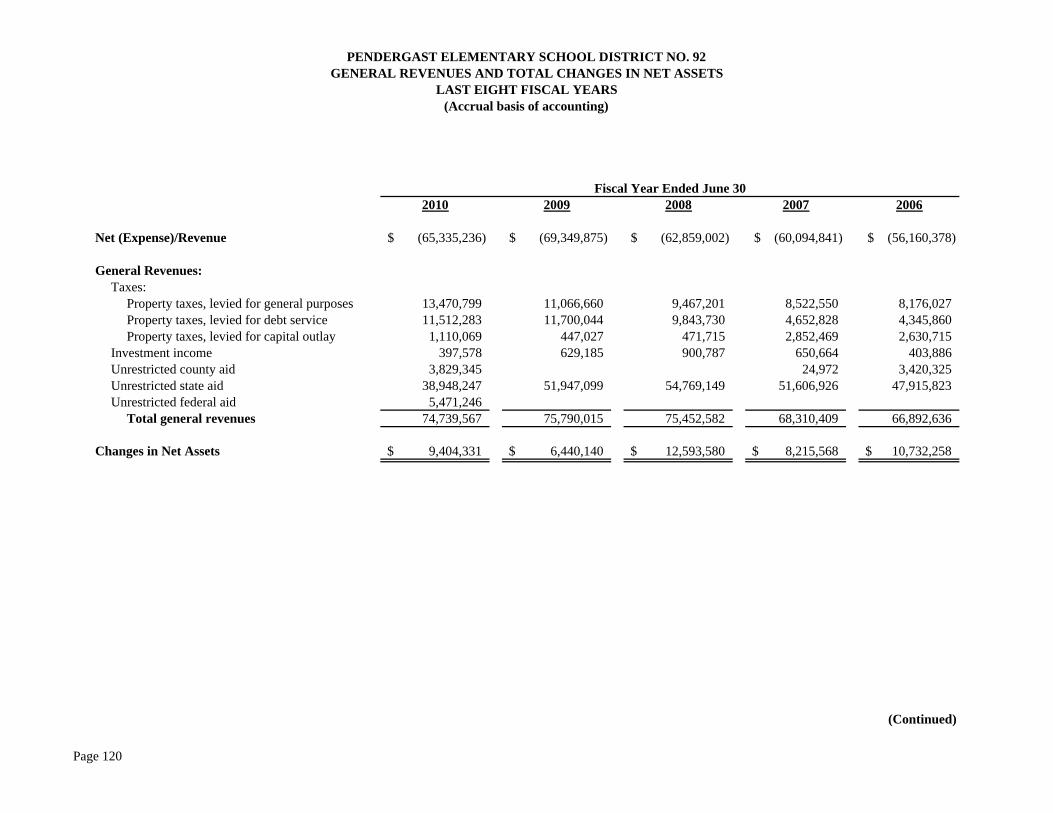
2010 2009 2008 2007 2006
Net (Expense)/Revenue (65,335,236)$ (69,349,875)$ (62,859,002)$ (60,094,841)$ (56,160,378)$
General Revenues: Taxes:
Property taxes, levied for general purposes 13,470,799 11,066,660 9,467,201 8,522,550 8,176,027 Property taxes, levied for debt service 11,512,283 11,700,044 9,843,730 4,652,828 4,345,860Property taxes, levied for capital outlay 1,110,069 447,027 471,715 2,852,469 2,630,715
Investment income 397,578 629,185 900,787 650,664 403,886Unrestricted county aid 3,829,345 24,972 3,420,325Unrestricted state aid 38,948,247 51,947,099 54,769,149 51,606,926 47,915,823Unrestricted federal aid 5,471,246
Total general revenues 74,739,567 75,790,015 75,452,582 68,310,409 66,892,636
Changes in Net Assets 9,404,331$ 6,440,140$ 12,593,580$ 8,215,568$ 10,732,258$
(Continued)
PENDERGAST ELEMENTARY SCHOOL DISTRICT NO. 92GENERAL REVENUES AND TOTAL CHANGES IN NET ASSETS
LAST EIGHT FISCAL YEARS(Accrual basis of accounting)
Fiscal Year Ended June 30
Page 120
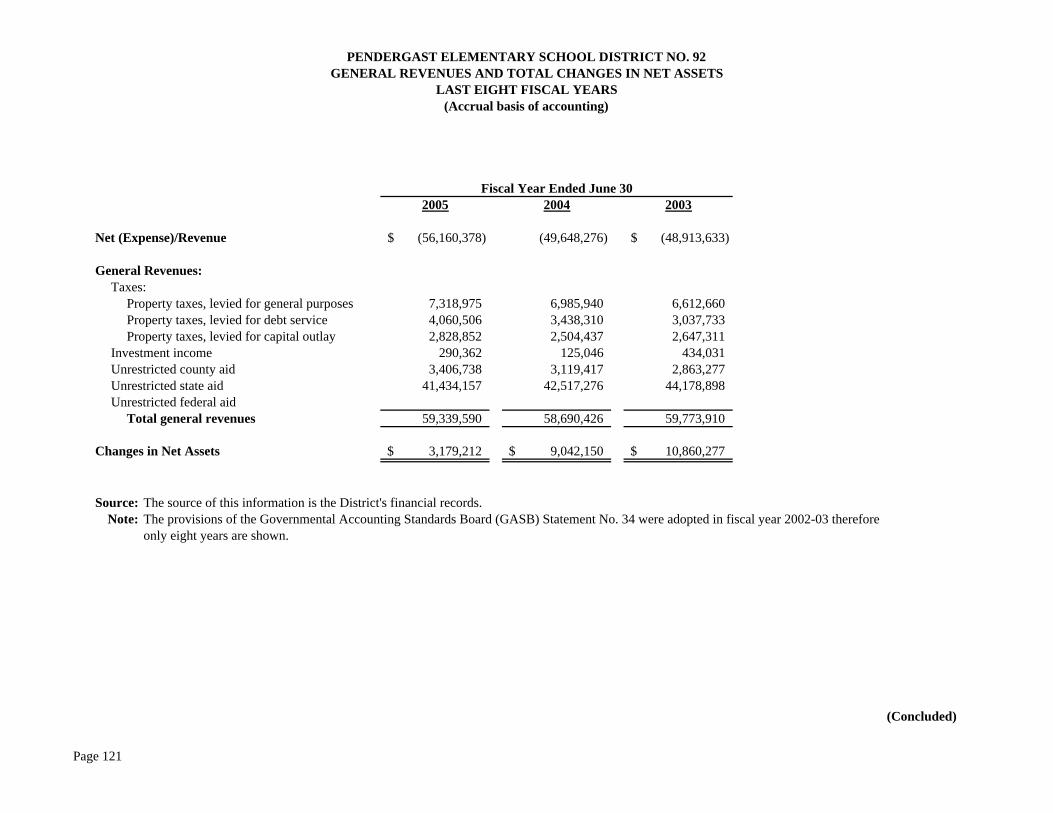
2005 2004 2003
Net (Expense)/Revenue (56,160,378)$ (49,648,276) (48,913,633)$
General Revenues: Taxes:
Property taxes, levied for general purposes 7,318,975 6,985,940 6,612,660 Property taxes, levied for debt service 4,060,506 3,438,310 3,037,733Property taxes, levied for capital outlay 2,828,852 2,504,437 2,647,311
Investment income 290,362 125,046 434,031Unrestricted county aid 3,406,738 3,119,417 2,863,277Unrestricted state aid 41,434,157 42,517,276 44,178,898Unrestricted federal aid
Total general revenues 59,339,590 58,690,426 59,773,910
Changes in Net Assets 3,179,212$ 9,042,150$ 10,860,277$
Source: The source of this information is the District's financial records.Note: The provisions of the Governmental Accounting Standards Board (GASB) Statement No. 34 were adopted in fiscal year 2002-03 therefore
only eight years are shown.
(Concluded)
Fiscal Year Ended June 30
PENDERGAST ELEMENTARY SCHOOL DISTRICT NO. 92GENERAL REVENUES AND TOTAL CHANGES IN NET ASSETS
LAST EIGHT FISCAL YEARS(Accrual basis of accounting)
Page 121
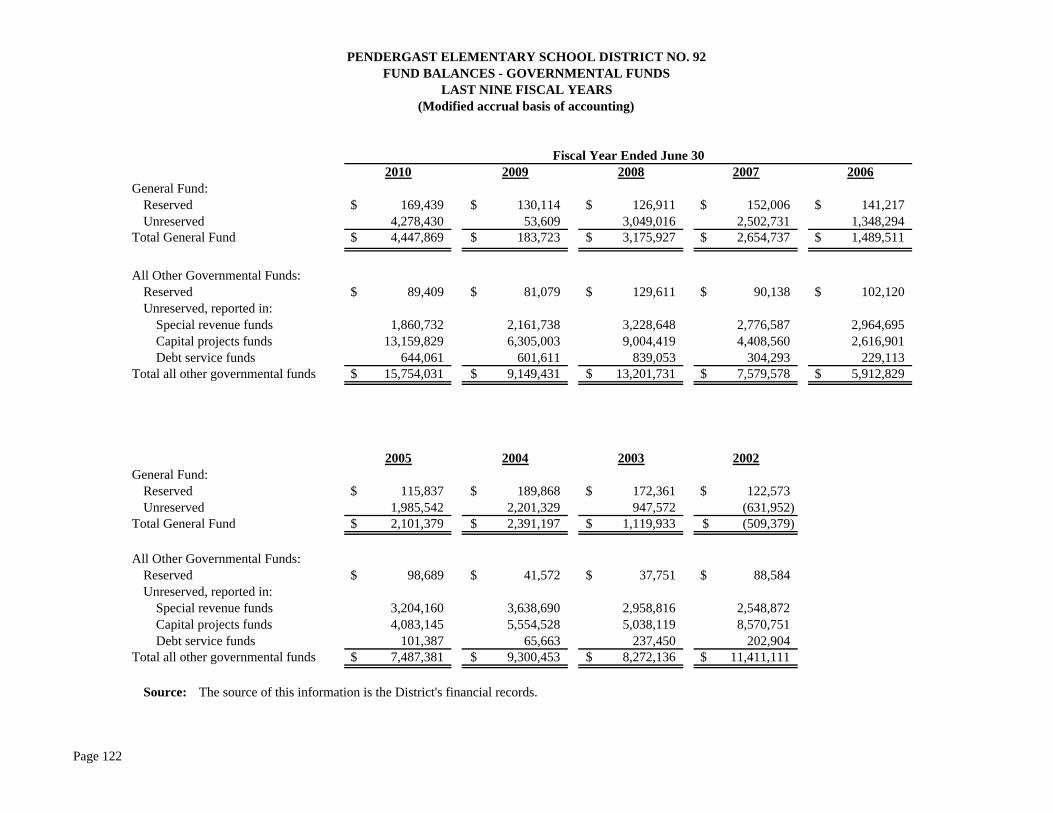
2010 2009 2008 2007 2006General Fund:
Reserved 169,439$ 130,114$ 126,911$ 152,006$ 141,217$ Unreserved 4,278,430 53,609 3,049,016 2,502,731 1,348,294
Total General Fund 4,447,869$ 183,723$ 3,175,927$ 2,654,737$ 1,489,511$
All Other Governmental Funds:Reserved 89,409$ 81,079$ 129,611$ 90,138$ 102,120$ Unreserved, reported in:
Special revenue funds 1,860,732 2,161,738 3,228,648 2,776,587 2,964,695 Capital projects funds 13,159,829 6,305,003 9,004,419 4,408,560 2,616,901 Debt service funds 644,061 601,611 839,053 304,293 229,113
Total all other governmental funds 15,754,031$ 9,149,431$ 13,201,731$ 7,579,578$ 5,912,829$
2005 2004 2003 2002 1997General Fund:
Reserved 115,837$ 189,868$ 172,361$ 122,573$ Unreserved 1,985,542 2,201,329 947,572 (631,952)
Total General Fund 2,101,379$ 2,391,197$ 1,119,933$ (509,379)$ -$
All Other Governmental Funds:Reserved 98,689$ 41,572$ 37,751$ 88,584$ Unreserved, reported in:
Special revenue funds 3,204,160 3,638,690 2,958,816 2,548,872 Capital projects funds 4,083,145 5,554,528 5,038,119 8,570,751 Debt service funds 101,387 65,663 237,450 202,904
Total all other governmental funds 7,487,381$ 9,300,453$ 8,272,136$ 11,411,111$ -$
Source: The source of this information is the District's financial records.
PENDERGAST ELEMENTARY SCHOOL DISTRICT NO. 92FUND BALANCES - GOVERNMENTAL FUNDS
Fiscal Year Ended June 30
LAST NINE FISCAL YEARS(Modified accrual basis of accounting)
Page 122
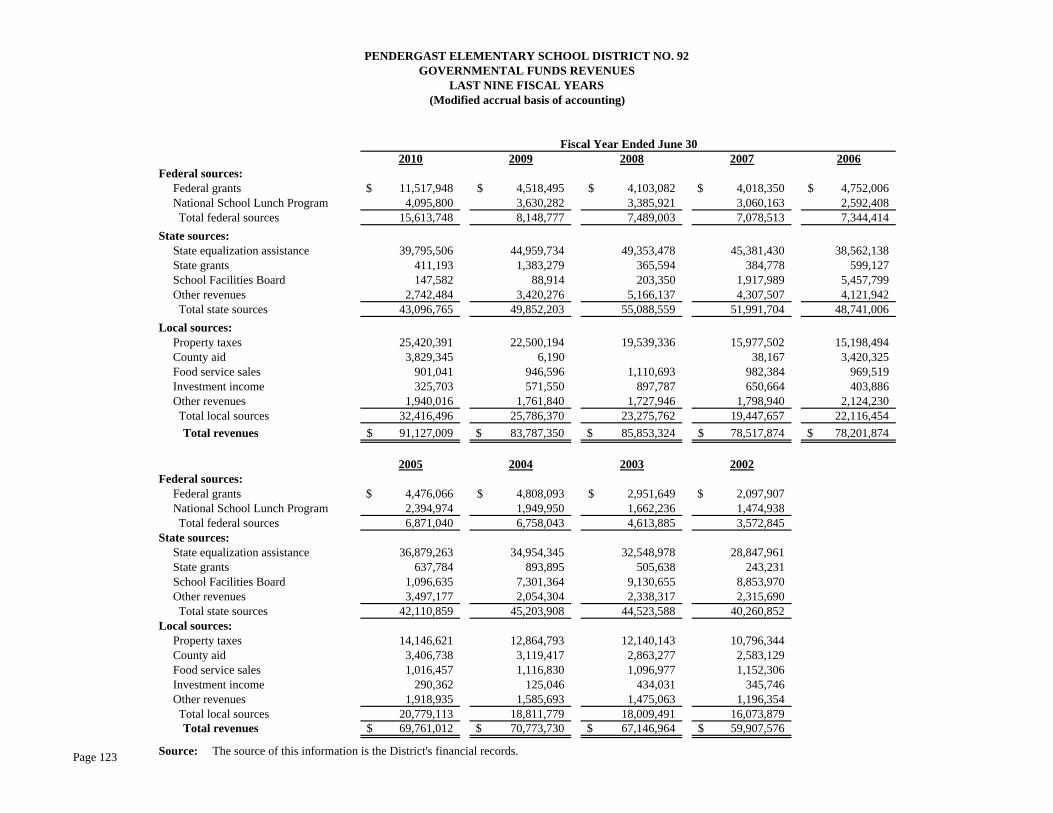
2010 2009 2008 2007 2006Federal sources:
Federal grants 11,517,948$ 4,518,495$ 4,103,082$ 4,018,350$ 4,752,006$ National School Lunch Program 4,095,800 3,630,282 3,385,921 3,060,163 2,592,408Total federal sources 15,613,748 8,148,777 7,489,003 7,078,513 7,344,414
State sources:State equalization assistance 39,795,506 44,959,734 49,353,478 45,381,430 38,562,138State grants 411,193 1,383,279 365,594 384,778 599,127School Facilities Board 147,582 88,914 203,350 1,917,989 5,457,799Other revenues 2,742,484 3,420,276 5,166,137 4,307,507 4,121,942Total state sources 43,096,765 49,852,203 55,088,559 51,991,704 48,741,006
Local sources:Property taxes 25,420,391 22,500,194 19,539,336 15,977,502 15,198,494County aid 3,829,345 6,190 38,167 3,420,325Food service sales 901,041 946,596 1,110,693 982,384 969,519Investment income 325,703 571,550 897,787 650,664 403,886Other revenues 1,940,016 1,761,840 1,727,946 1,798,940 2,124,230Total local sources 32,416,496 25,786,370 23,275,762 19,447,657 22,116,454
Total revenues 91,127,009$ 83,787,350$ 85,853,324$ 78,517,874$ 78,201,874$
2005 2004 2003 2002 1997Federal sources:
Federal grants 4,476,066$ 4,808,093$ 2,951,649$ 2,097,907$ National School Lunch Program 2,394,974 1,949,950 1,662,236 1,474,938 Total federal sources 6,871,040 6,758,043 4,613,885 3,572,845 -
State sources:State equalization assistance 36,879,263 34,954,345 32,548,978 28,847,961 State grants 637,784 893,895 505,638 243,231 School Facilities Board 1,096,635 7,301,364 9,130,655 8,853,970 Other revenues 3,497,177 2,054,304 2,338,317 2,315,690 Total state sources 42,110,859 45,203,908 44,523,588 40,260,852 -
Local sources:Property taxes 14,146,621 12,864,793 12,140,143 10,796,344 County aid 3,406,738 3,119,417 2,863,277 2,583,129 Food service sales 1,016,457 1,116,830 1,096,977 1,152,306 Investment income 290,362 125,046 434,031 345,746 Other revenues 1,918,935 1,585,693 1,475,063 1,196,354 Total local sources 20,779,113 18,811,779 18,009,491 16,073,879 - Total revenues 69,761,012$ 70,773,730$ 67,146,964$ 59,907,576$ -$
Source: The source of this information is the District's financial records.
Fiscal Year Ended June 30
PENDERGAST ELEMENTARY SCHOOL DISTRICT NO. 92GOVERNMENTAL FUNDS REVENUES
LAST NINE FISCAL YEARS(Modified accrual basis of accounting)
Page 123
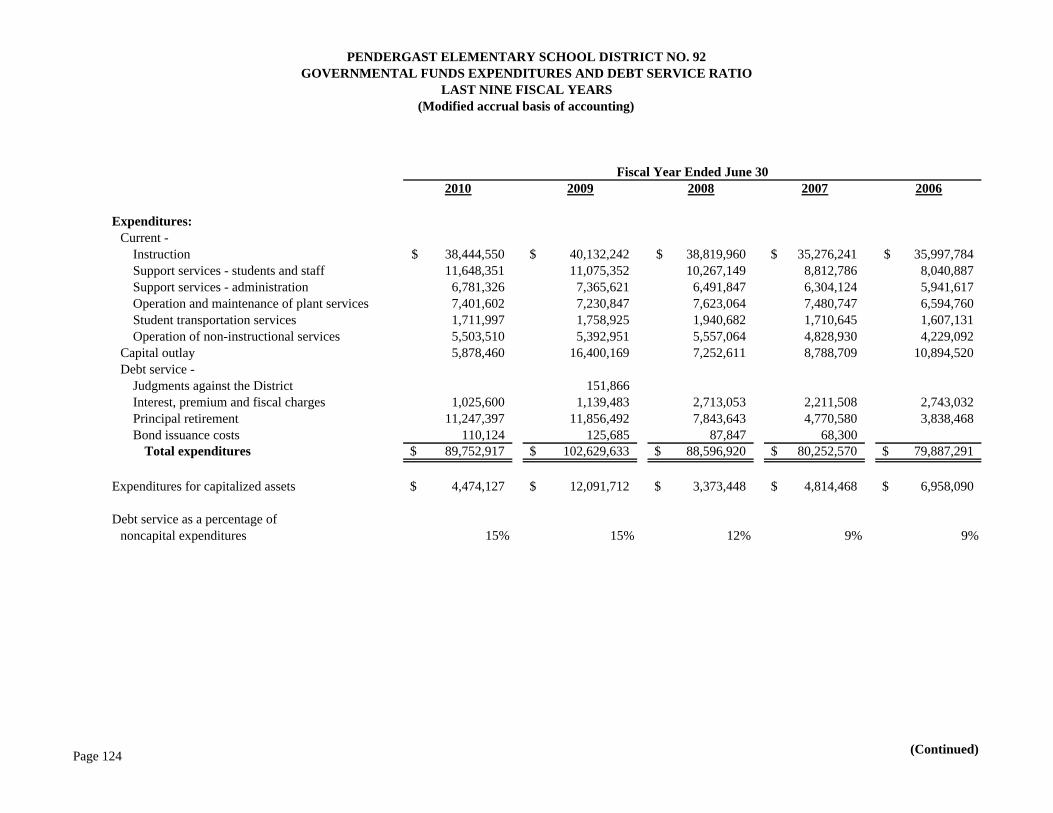
2010 2009 2008 2007 2006
Expenditures:Current -
Instruction 38,444,550$ 40,132,242$ 38,819,960$ 35,276,241$ 35,997,784$ Support services - students and staff 11,648,351 11,075,352 10,267,149 8,812,786 8,040,887 Support services - administration 6,781,326 7,365,621 6,491,847 6,304,124 5,941,617 Operation and maintenance of plant services 7,401,602 7,230,847 7,623,064 7,480,747 6,594,760 Student transportation services 1,711,997 1,758,925 1,940,682 1,710,645 1,607,131 Operation of non-instructional services 5,503,510 5,392,951 5,557,064 4,828,930 4,229,092
Capital outlay 5,878,460 16,400,169 7,252,611 8,788,709 10,894,520 Debt service -
Judgments against the District 151,866 Interest, premium and fiscal charges 1,025,600 1,139,483 2,713,053 2,211,508 2,743,032 Principal retirement 11,247,397 11,856,492 7,843,643 4,770,580 3,838,468 Bond issuance costs 110,124 125,685 87,847 68,300
Total expenditures 89,752,917$ 102,629,633$ 88,596,920$ 80,252,570$ 79,887,291$
Expenditures for capitalized assets 4,474,127$ 12,091,712$ 3,373,448$ 4,814,468$ 6,958,090$
Debt service as a percentage ofnoncapital expenditures 15% 15% 12% 9% 9%
(Continued)
Fiscal Year Ended June 30
LAST NINE FISCAL YEARS(Modified accrual basis of accounting)
PENDERGAST ELEMENTARY SCHOOL DISTRICT NO. 92GOVERNMENTAL FUNDS EXPENDITURES AND DEBT SERVICE RATIO
Page 124
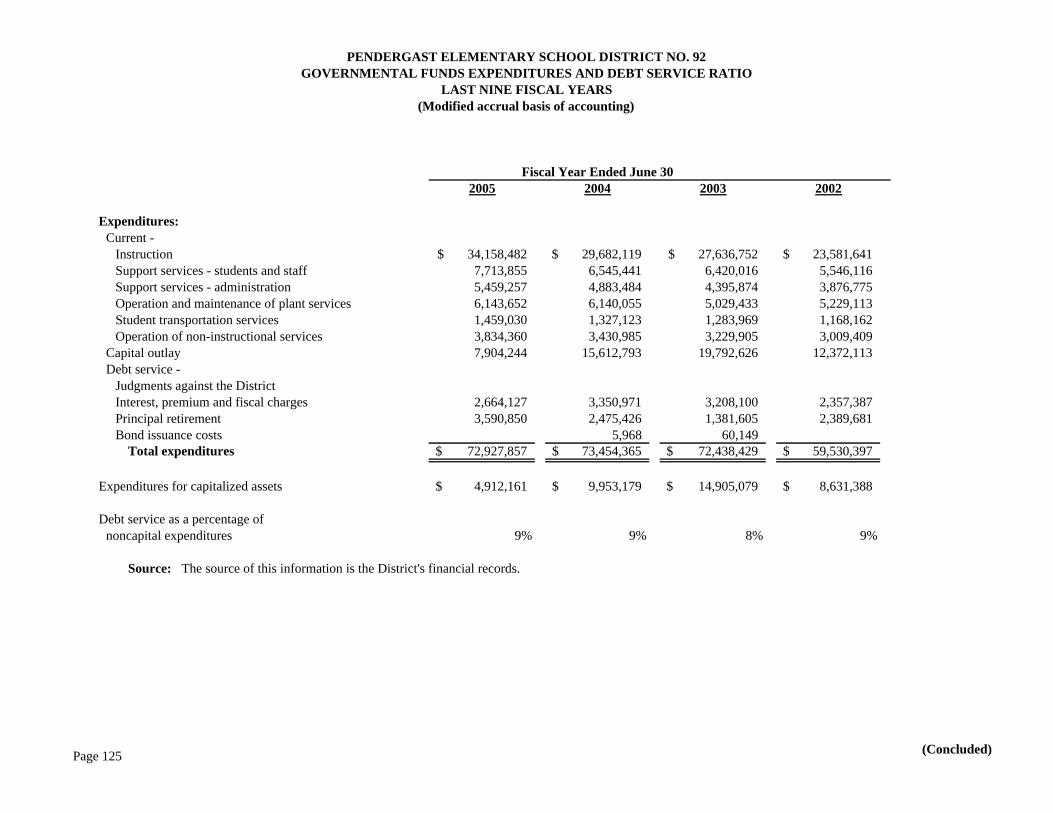
2005 2004 2003 2002 1997
Expenditures:Current -
Instruction 34,158,482$ 29,682,119$ 27,636,752$ 23,581,641$ Support services - students and staff 7,713,855 6,545,441 6,420,016 5,546,116 Support services - administration 5,459,257 4,883,484 4,395,874 3,876,775 Operation and maintenance of plant services 6,143,652 6,140,055 5,029,433 5,229,113 Student transportation services 1,459,030 1,327,123 1,283,969 1,168,162 Operation of non-instructional services 3,834,360 3,430,985 3,229,905 3,009,409
Capital outlay 7,904,244 15,612,793 19,792,626 12,372,113 Debt service -
Judgments against the DistrictInterest, premium and fiscal charges 2,664,127 3,350,971 3,208,100 2,357,387 Principal retirement 3,590,850 2,475,426 1,381,605 2,389,681 Bond issuance costs 5,968 60,149
Total expenditures 72,927,857$ 73,454,365$ 72,438,429$ 59,530,397$ -$
Expenditures for capitalized assets 4,912,161$ 9,953,179$ 14,905,079$ 8,631,388$
Debt service as a percentage ofnoncapital expenditures 9% 9% 8% 9% #DIV/0!
Source: The source of this information is the District's financial records.
(Concluded)
PENDERGAST ELEMENTARY SCHOOL DISTRICT NO. 92GOVERNMENTAL FUNDS EXPENDITURES AND DEBT SERVICE RATIO
(Modified accrual basis of accounting)LAST NINE FISCAL YEARS
Fiscal Year Ended June 30
Page 125
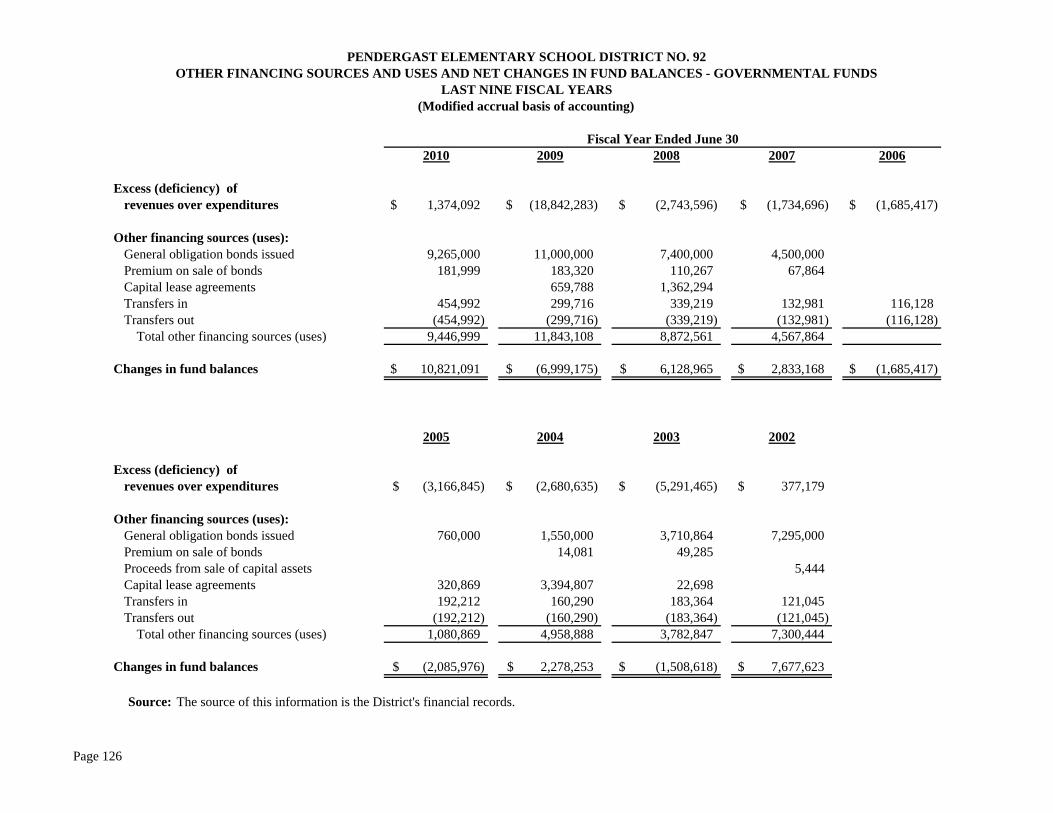
2010 2009 2008 2007 2006
Excess (deficiency) of revenues over expenditures 1,374,092$ (18,842,283)$ (2,743,596)$ (1,734,696)$ (1,685,417)$
Other financing sources (uses):General obligation bonds issued 9,265,000 11,000,000 7,400,000 4,500,000 Premium on sale of bonds 181,999 183,320 110,267 67,864 Capital lease agreements 659,788 1,362,294 Transfers in 454,992 299,716 339,219 132,981 116,128 Transfers out (454,992) (299,716) (339,219) (132,981) (116,128)
Total other financing sources (uses) 9,446,999 11,843,108 8,872,561 4,567,864 -
Changes in fund balances 10,821,091$ (6,999,175)$ 6,128,965$ 2,833,168$ (1,685,417)$
2005 2004 2003 2002 1997
Excess (deficiency) of revenues over expenditures (3,166,845)$ (2,680,635)$ (5,291,465)$ 377,179$ -$
Other financing sources (uses):General obligation bonds issued 760,000 1,550,000 3,710,864 7,295,000 Premium on sale of bonds 14,081 49,285 Proceeds from sale of capital assets 5,444 Capital lease agreements 320,869 3,394,807 22,698 Transfers in 192,212 160,290 183,364 121,045 Transfers out (192,212) (160,290) (183,364) (121,045)
Total other financing sources (uses) 1,080,869 4,958,888 3,782,847 7,300,444 -
Changes in fund balances (2,085,976)$ 2,278,253$ (1,508,618)$ 7,677,623$ -$
Source: The source of this information is the District's financial records.
PENDERGAST ELEMENTARY SCHOOL DISTRICT NO. 92OTHER FINANCING SOURCES AND USES AND NET CHANGES IN FUND BALANCES - GOVERNMENTAL FUNDS
LAST NINE FISCAL YEARS
Fiscal Year Ended June 30
(Modified accrual basis of accounting)
Page 126
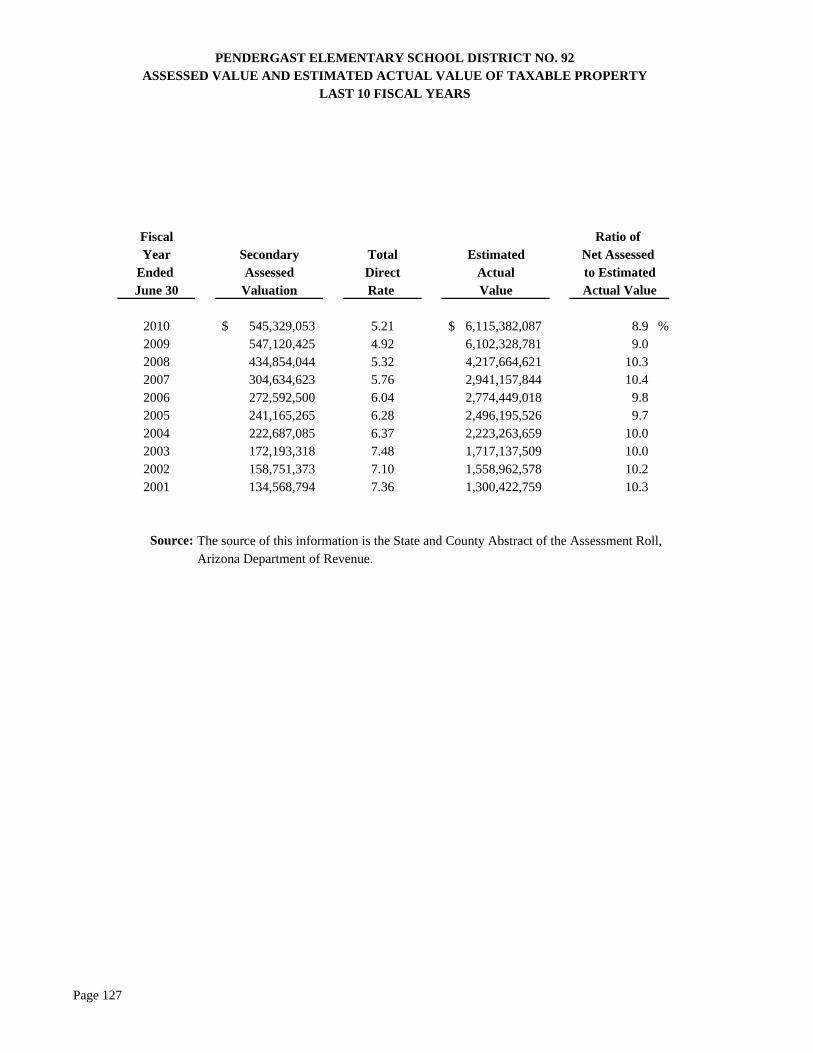
FiscalYear Secondary Total Estimated
Ended Assessed Direct ActualJune 30 Valuation Rate Value
2010 545,329,053$ 5.21 6,115,382,087$ 8.9 %2009 547,120,425 4.92 6,102,328,781 9.0 2008 434,854,044 5.32 4,217,664,621 10.3 2007 304,634,623 5.76 2,941,157,844 10.4 2006 272,592,500 6.04 2,774,449,018 9.8 2005 241,165,265 6.28 2,496,195,526 9.7 2004 222,687,085 6.37 2,223,263,659 10.0 2003 172,193,318 7.48 1,717,137,509 10.0 2002 158,751,373 7.10 1,558,962,578 10.2 2001 134,568,794 7.36 1,300,422,759 10.3
Source: The source of this information is the State and County Abstract of the Assessment Roll, Arizona Department of Revenue.
Net Assessed to EstimatedActual Value
PENDERGAST ELEMENTARY SCHOOL DISTRICT NO. 92ASSESSED VALUE AND ESTIMATED ACTUAL VALUE OF TAXABLE PROPERTY
LAST 10 FISCAL YEARS
Ratio of
Page 127
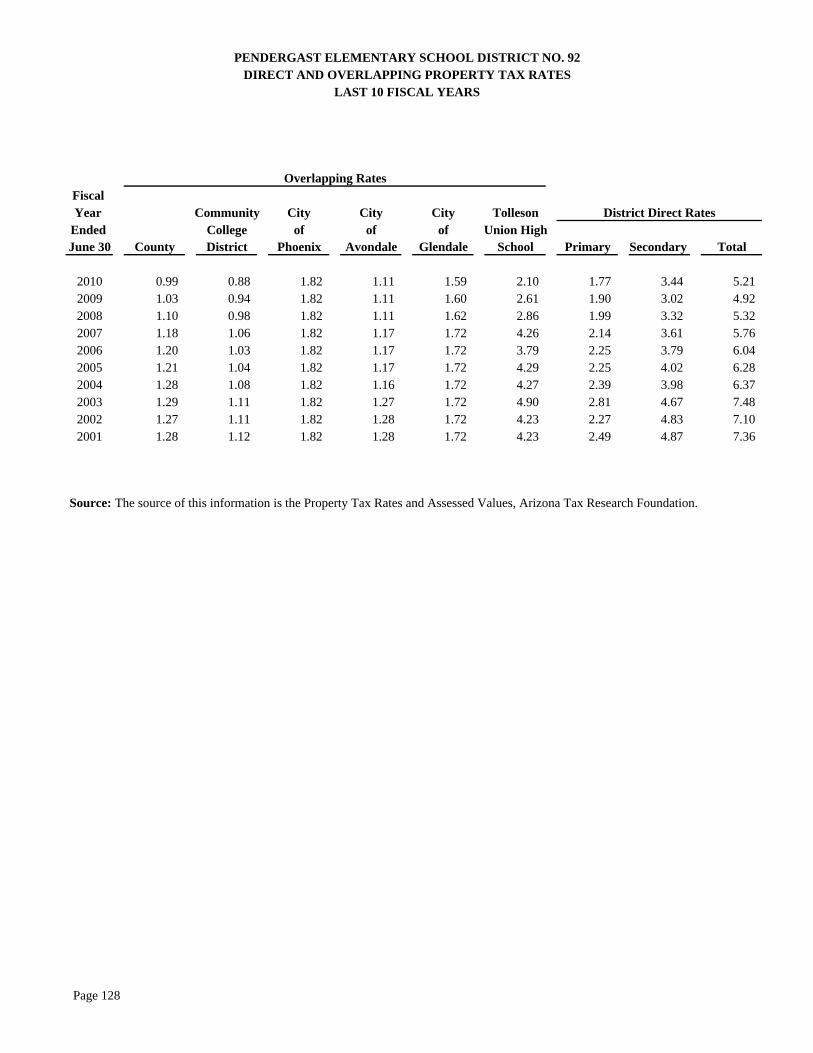
Fiscal Year Community City City City Tolleson
Ended College of of of Union HighJune 30 County District Phoenix Avondale Glendale School Primary Secondary Total
2010 0.99 0.88 1.82 1.11 1.59 2.10 1.77 3.44 5.21 2009 1.03 0.94 1.82 1.11 1.60 2.61 1.90 3.02 4.92 2008 1.10 0.98 1.82 1.11 1.62 2.86 1.99 3.32 5.32 2007 1.18 1.06 1.82 1.17 1.72 4.26 2.14 3.61 5.76 2006 1.20 1.03 1.82 1.17 1.72 3.79 2.25 3.79 6.04 2005 1.21 1.04 1.82 1.17 1.72 4.29 2.25 4.02 6.28 2004 1.28 1.08 1.82 1.16 1.72 4.27 2.39 3.98 6.37 2003 1.29 1.11 1.82 1.27 1.72 4.90 2.81 4.67 7.48 2002 1.27 1.11 1.82 1.28 1.72 4.23 2.27 4.83 7.10 2001 1.28 1.12 1.82 1.28 1.72 4.23 2.49 4.87 7.36
PENDERGAST ELEMENTARY SCHOOL DISTRICT NO. 92DIRECT AND OVERLAPPING PROPERTY TAX RATES
LAST 10 FISCAL YEARS
Source:
Overlapping Rates
District Direct Rates
The source of this information is the Property Tax Rates and Assessed Values, Arizona Tax Research Foundation.
Page 128
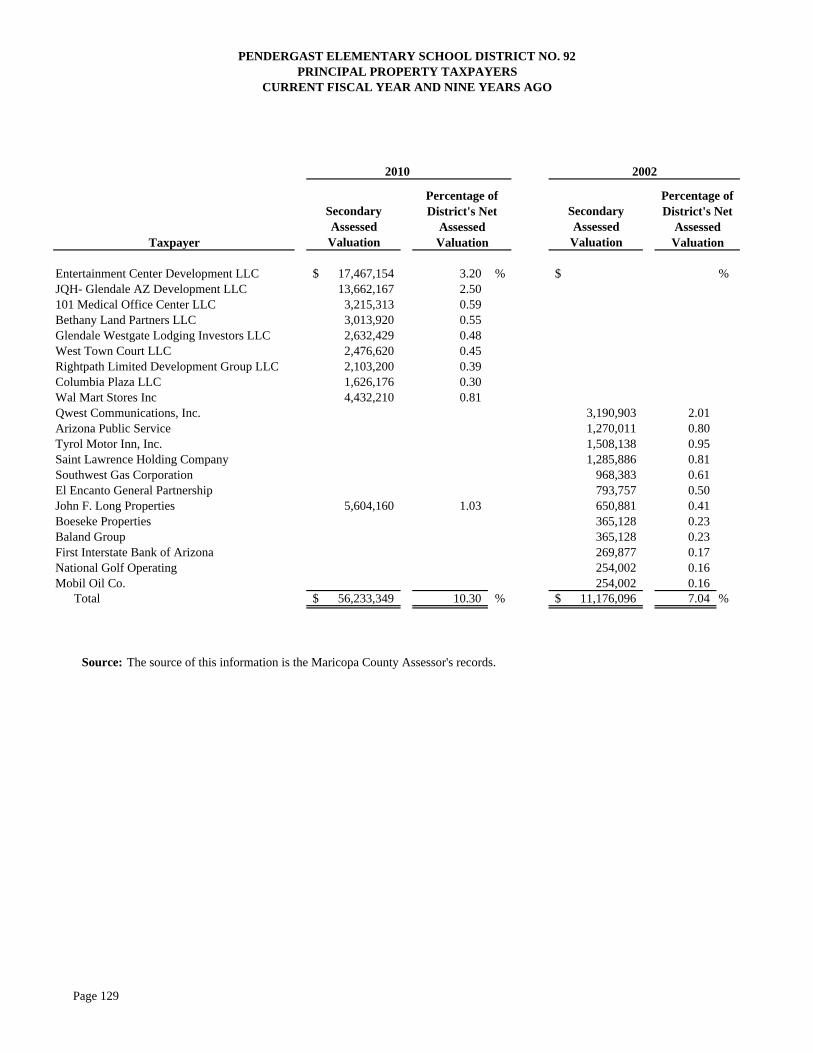
Secondary Assessed
Valuation
Secondary Assessed
Valuation
Entertainment Center Development LLC 17,467,154$ 3.20 % $ %JQH- Glendale AZ Development LLC 13,662,167 2.50 101 Medical Office Center LLC 3,215,313 0.59 Bethany Land Partners LLC 3,013,920 0.55 Glendale Westgate Lodging Investors LLC 2,632,429 0.48 West Town Court LLC 2,476,620 0.45 Rightpath Limited Development Group LLC 2,103,200 0.39 Columbia Plaza LLC 1,626,176 0.30 Wal Mart Stores Inc 4,432,210 0.81 Qwest Communications, Inc. 3,190,903 2.01 Arizona Public Service 1,270,011 0.80 Tyrol Motor Inn, Inc. 1,508,138 0.95 Saint Lawrence Holding Company 1,285,886 0.81 Southwest Gas Corporation 968,383 0.61 El Encanto General Partnership 793,757 0.50 John F. Long Properties 5,604,160 1.03 650,881 0.41 Boeseke Properties 365,128 0.23 Baland Group 365,128 0.23 First Interstate Bank of Arizona 269,877 0.17 National Golf Operating 254,002 0.16 Mobil Oil Co. 254,002 0.16
Total 56,233,349$ 10.30 % 11,176,096$ 7.04 %
Source: The source of this information is the Maricopa County Assessor's records.
PENDERGAST ELEMENTARY SCHOOL DISTRICT NO. 92PRINCIPAL PROPERTY TAXPAYERS
CURRENT FISCAL YEAR AND NINE YEARS AGO
Percentage of District's Net
Assessed Valuation
Percentage of District's Net
Assessed Valuation
2010 2002
Taxpayer
Page 129
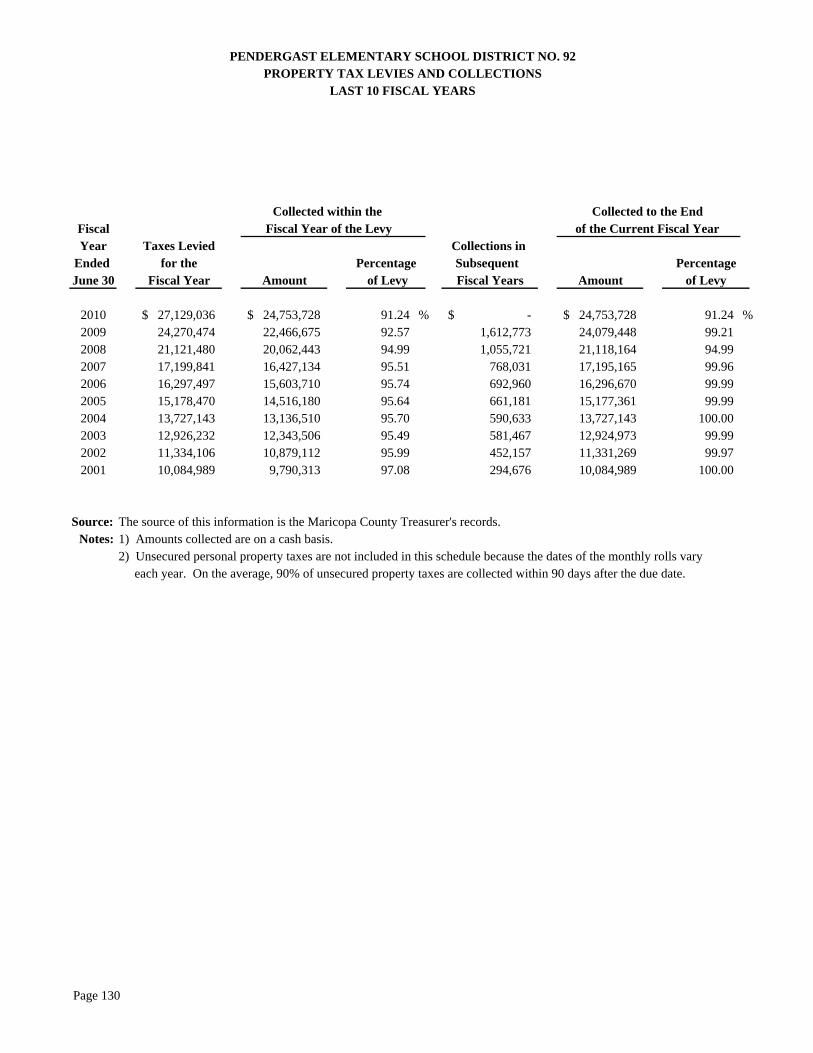
FiscalYear Taxes Levied Collections in
Ended for the Subsequent June 30 Fiscal Year Amount Fiscal Years Amount
2010 27,129,036$ 24,753,728$ 91.24 % -$ 24,753,728$ 91.24 %2009 24,270,474 22,466,675 92.57 1,612,773 24,079,448 99.212008 21,121,480 20,062,443 94.99 1,055,721 21,118,164 94.992007 17,199,841 16,427,134 95.51 768,031 17,195,165 99.962006 16,297,497 15,603,710 95.74 692,960 16,296,670 99.992005 15,178,470 14,516,180 95.64 661,181 15,177,361 99.992004 13,727,143 13,136,510 95.70 590,633 13,727,143 100.002003 12,926,232 12,343,506 95.49 581,467 12,924,973 99.992002 11,334,106 10,879,112 95.99 452,157 11,331,269 99.972001 10,084,989 9,790,313 97.08 294,676 10,084,989 100.00
Source: The source of this information is the Maricopa County Treasurer's records.Notes: 1) Amounts collected are on a cash basis.
2) Unsecured personal property taxes are not included in this schedule because the dates of the monthly rolls vary each year. On the average, 90% of unsecured property taxes are collected within 90 days after the due date.
Fiscal Year of the LevyCollected within the
of the Current Fiscal Year
PENDERGAST ELEMENTARY SCHOOL DISTRICT NO. 92PROPERTY TAX LEVIES AND COLLECTIONS
LAST 10 FISCAL YEARS
Collected to the End
of LevyPercentage
of LevyPercentage
Page 130
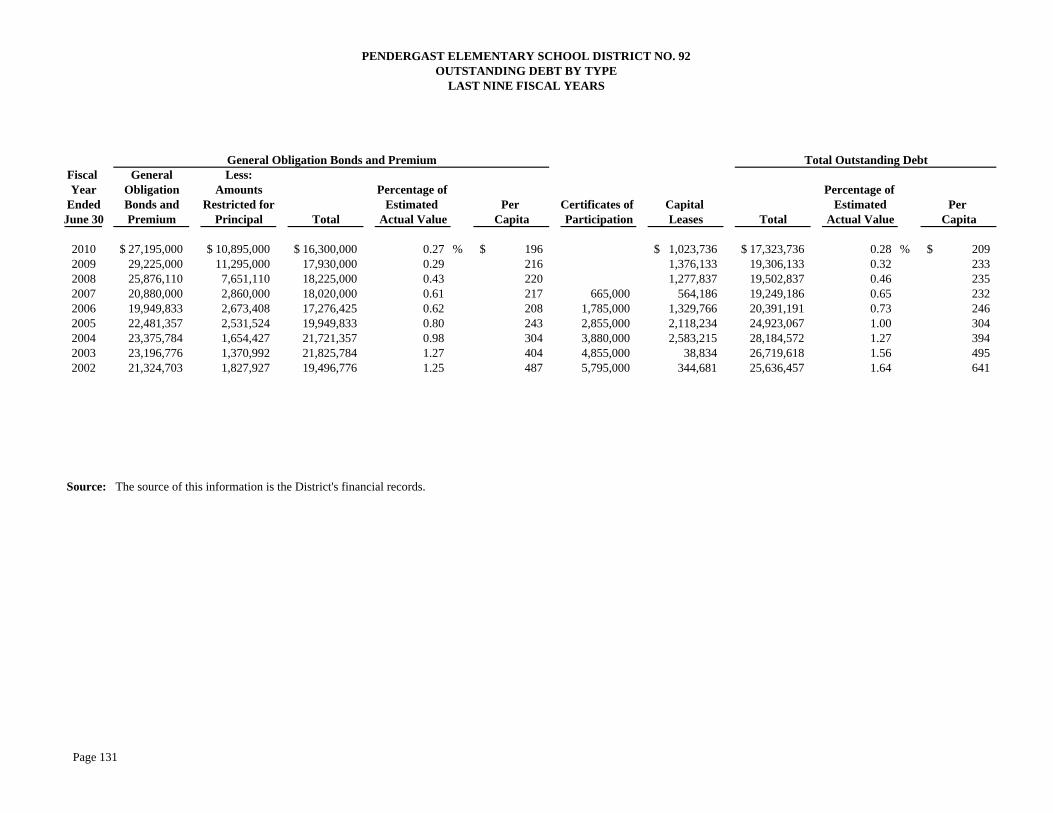
Fiscal General Less:Year Obligation Amounts Percentage of Percentage of
Ended Bonds and Restricted for Estimated Per Certificates of Capital Estimated Per June 30 Premium Principal Total Actual Value Capita Participation Leases Total Actual Value Capita
2010 27,195,000$ 10,895,000$ 16,300,000$ 0.27 % 196$ 1,023,736$ 17,323,736$ 0.28 % 209$ 2009 29,225,000 11,295,000 17,930,000 0.29 216 1,376,133 19,306,133 0.32 233 2008 25,876,110 7,651,110 18,225,000 0.43 220 1,277,837 19,502,837 0.46 235 2007 20,880,000 2,860,000 18,020,000 0.61 217 665,000 564,186 19,249,186 0.65 232 2006 19,949,833 2,673,408 17,276,425 0.62 208 1,785,000 1,329,766 20,391,191 0.73 246 2005 22,481,357 2,531,524 19,949,833 0.80 243 2,855,000 2,118,234 24,923,067 1.00 304 2004 23,375,784 1,654,427 21,721,357 0.98 304 3,880,000 2,583,215 28,184,572 1.27 394 2003 23,196,776 1,370,992 21,825,784 1.27 404 4,855,000 38,834 26,719,618 1.56 495 2002 21,324,703 1,827,927 19,496,776 1.25 487 5,795,000 344,681 25,636,457 1.64 641
Source: The source of this information is the District's financial records.
General Obligation Bonds and Premium
PENDERGAST ELEMENTARY SCHOOL DISTRICT NO. 92OUTSTANDING DEBT BY TYPE
LAST NINE FISCAL YEARS
Total Outstanding Debt
Page 131
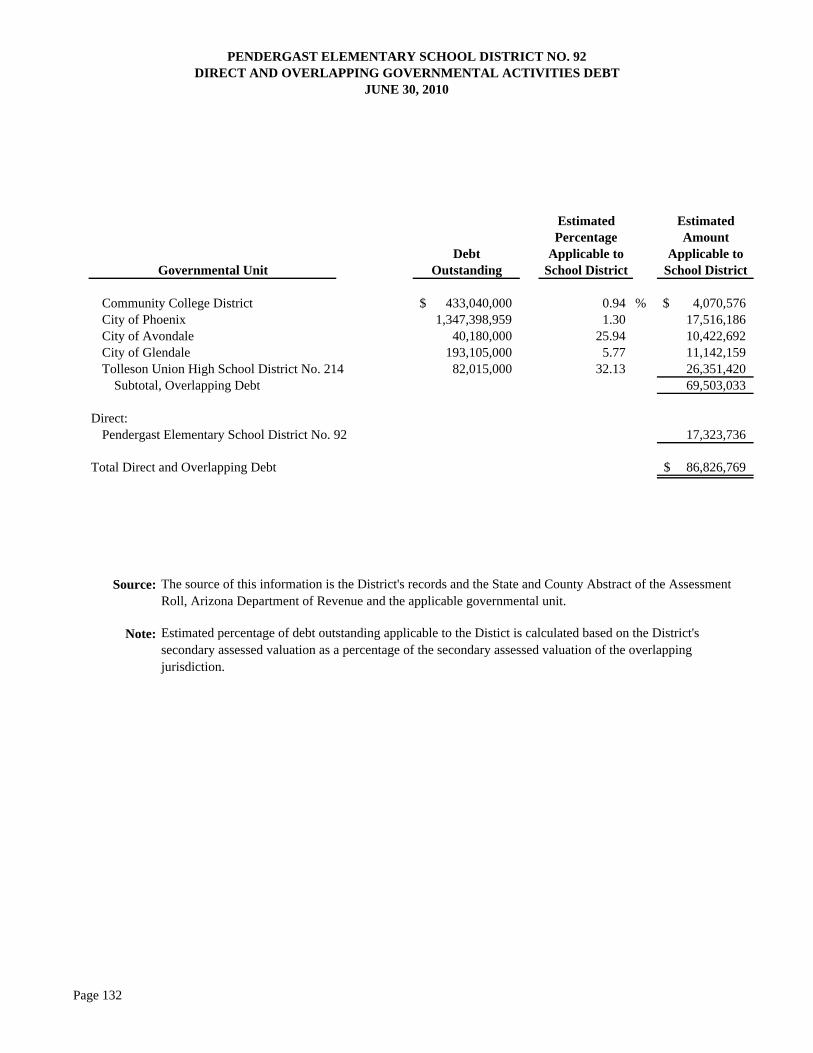
Estimated EstimatedPercentage Amount
Debt Applicable to Applicable toOutstanding School District School District
Community College District 433,040,000$ 0.94 % 4,070,576$ City of Phoenix 1,347,398,959 1.30 17,516,186 City of Avondale 40,180,000 25.94 10,422,692 City of Glendale 193,105,000 5.77 11,142,159 Tolleson Union High School District No. 214 82,015,000 32.13 26,351,420
Subtotal, Overlapping Debt 69,503,033
Direct:Pendergast Elementary School District No. 92 17,323,736
Total Direct and Overlapping Debt 86,826,769$
Source:
Note:
PENDERGAST ELEMENTARY SCHOOL DISTRICT NO. 92DIRECT AND OVERLAPPING GOVERNMENTAL ACTIVITIES DEBT
JUNE 30, 2010
Governmental Unit
The source of this information is the District's records and the State and County Abstract of the Assessment Roll, Arizona Department of Revenue and the applicable governmental unit.
Estimated percentage of debt outstanding applicable to the Distict is calculated based on the District's secondary assessed valuation as a percentage of the secondary assessed valuation of the overlapping jurisdiction.
Page 132
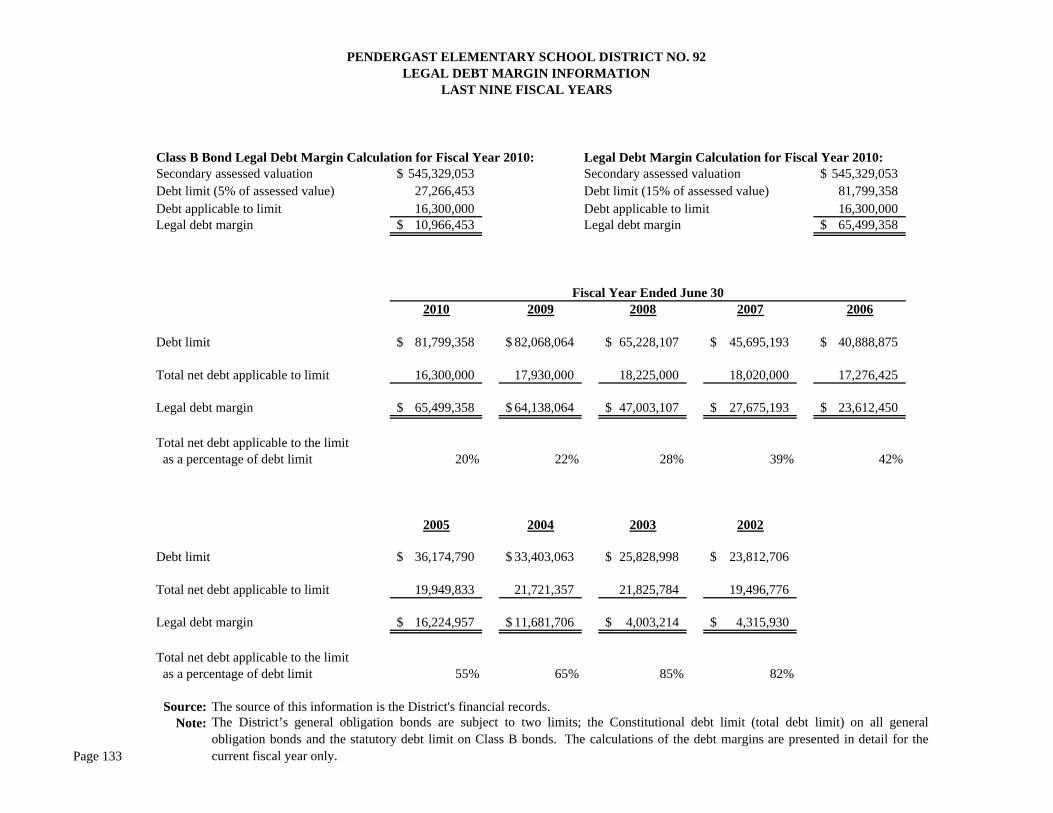
Class B Bond Legal Debt Margin Calculation for Fiscal Year 2010: Legal Debt Margin Calculation for Fiscal Year 2010:Secondary assessed valuation 545,329,053$ Secondary assessed valuation 545,329,053$ Debt limit (5% of assessed value) 27,266,453 Debt limit (15% of assessed value) 81,799,358 Debt applicable to limit 16,300,000 Debt applicable to limit 16,300,000 Legal debt margin 10,966,453$ Legal debt margin 65,499,358$
2010 2009 2008 2007 2006
Debt limit 81,799,358$ 82,068,064$ 65,228,107$ 45,695,193$ 40,888,875$
Total net debt applicable to limit 16,300,000 17,930,000 18,225,000 18,020,000 17,276,425
Legal debt margin 65,499,358$ 64,138,064$ 47,003,107$ 27,675,193$ 23,612,450$
Total net debt applicable to the limit as a percentage of debt limit 20% 22% 28% 39% 42%
2005 2004 2003 2002 1997
Debt limit 36,174,790$ 33,403,063$ 25,828,998$ 23,812,706$
Total net debt applicable to limit 19,949,833 21,721,357 21,825,784 19,496,776
Legal debt margin 16,224,957$ 11,681,706$ 4,003,214$ 4,315,930$ -$
Total net debt applicable to the limit as a percentage of debt limit 55% 65% 85% 82% #DIV/0!
The source of this information is the District's financial records.The District’s general obligation bonds are subject to two limits; the Constitutional debt limit (total debt limit) on all generalobligation bonds and the statutory debt limit on Class B bonds. The calculations of the debt margins are presented in detail for thecurrent fiscal year only.
Source:Note:
PENDERGAST ELEMENTARY SCHOOL DISTRICT NO. 92LEGAL DEBT MARGIN INFORMATION
LAST NINE FISCAL YEARS
Fiscal Year Ended June 30
Page 133
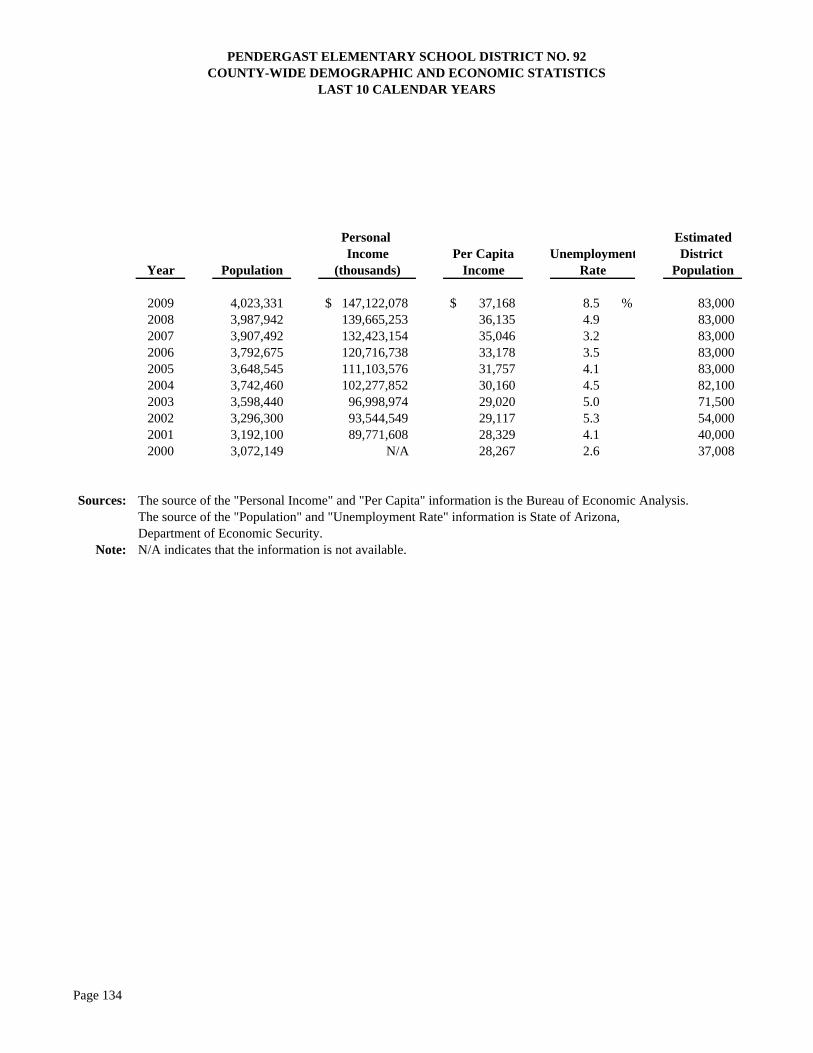
Personal EstimatedIncome Per Capita District
Year Population (thousands) Income Population
2009 4,023,331 147,122,078$ 37,168$ % 83,000 2008 3,987,942 139,665,253 36,135 83,000 2007 3,907,492 132,423,154 35,046 3.2 83,000 2006 3,792,675 120,716,738 33,178 3.5 83,000 2005 3,648,545 111,103,576 31,757 4.1 83,000 2004 3,742,460 102,277,852 30,160 4.5 82,100 2003 3,598,440 96,998,974 29,020 5.0 71,500 2002 3,296,300 93,544,549 29,117 5.3 54,000 2001 3,192,100 89,771,608 28,329 4.1 40,000 2000 3,072,149 N/A 28,267 2.6 37,008
Sources: The source of the "Personal Income" and "Per Capita" information is the Bureau of Economic Analysis.The source of the "Population" and "Unemployment Rate" information is State of Arizona,Department of Economic Security.
Note: N/A indicates that the information is not available.
8.5 4.9
UnemploymentRate
PENDERGAST ELEMENTARY SCHOOL DISTRICT NO. 92COUNTY-WIDE DEMOGRAPHIC AND ECONOMIC STATISTICS
LAST 10 CALENDAR YEARS
Page 134
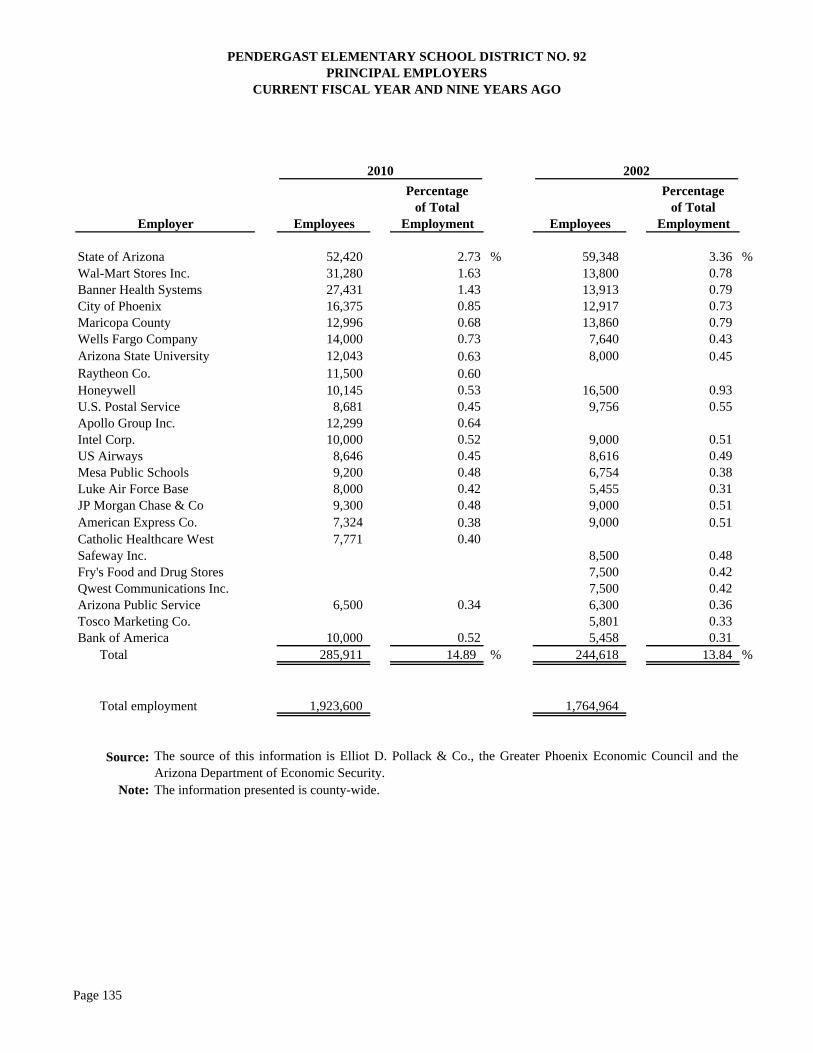
Percentage Percentageof Total of Total
Employees Employment Employees Employment
State of Arizona 52,420 2.73 % 59,348 3.36 %Wal-Mart Stores Inc. 31,280 1.63 13,800 0.78 Banner Health Systems 27,431 1.43 13,913 0.79 City of Phoenix 16,375 0.85 12,917 0.73 Maricopa County 12,996 0.68 13,860 0.79 Wells Fargo Company 14,000 0.73 7,640 0.43 Arizona State University 12,043 0.63 8,000 0.45 Raytheon Co. 11,500 0.60Honeywell 10,145 0.53 16,500 0.93 U.S. Postal Service 8,681 0.45 9,756 0.55 Apollo Group Inc. 12,299 0.64Intel Corp. 10,000 0.52 9,000 0.51 US Airways 8,646 0.45 8,616 0.49 Mesa Public Schools 9,200 0.48 6,754 0.38 Luke Air Force Base 8,000 0.42 5,455 0.31 JP Morgan Chase & Co 9,300 0.48 9,000 0.51 American Express Co. 7,324 0.38 9,000 0.51 Catholic Healthcare West 7,771 0.40Safeway Inc. 8,500 0.48 Fry's Food and Drug Stores 7,500 0.42 Qwest Communications Inc. 7,500 0.42 Arizona Public Service 6,500 0.34 6,300 0.36 Tosco Marketing Co. 5,801 0.33 Bank of America 10,000 0.52 5,458 0.31
Total 285,911 14.89 % 244,618 13.84 %
Total employment 1,923,600 1,764,964
Source:
Note: The information presented is county-wide.
PENDERGAST ELEMENTARY SCHOOL DISTRICT NO. 92PRINCIPAL EMPLOYERS
CURRENT FISCAL YEAR AND NINE YEARS AGO
Employer
2010 2002
The source of this information is Elliot D. Pollack & Co., the Greater Phoenix Economic Council and theArizona Department of Economic Security.
Page 135
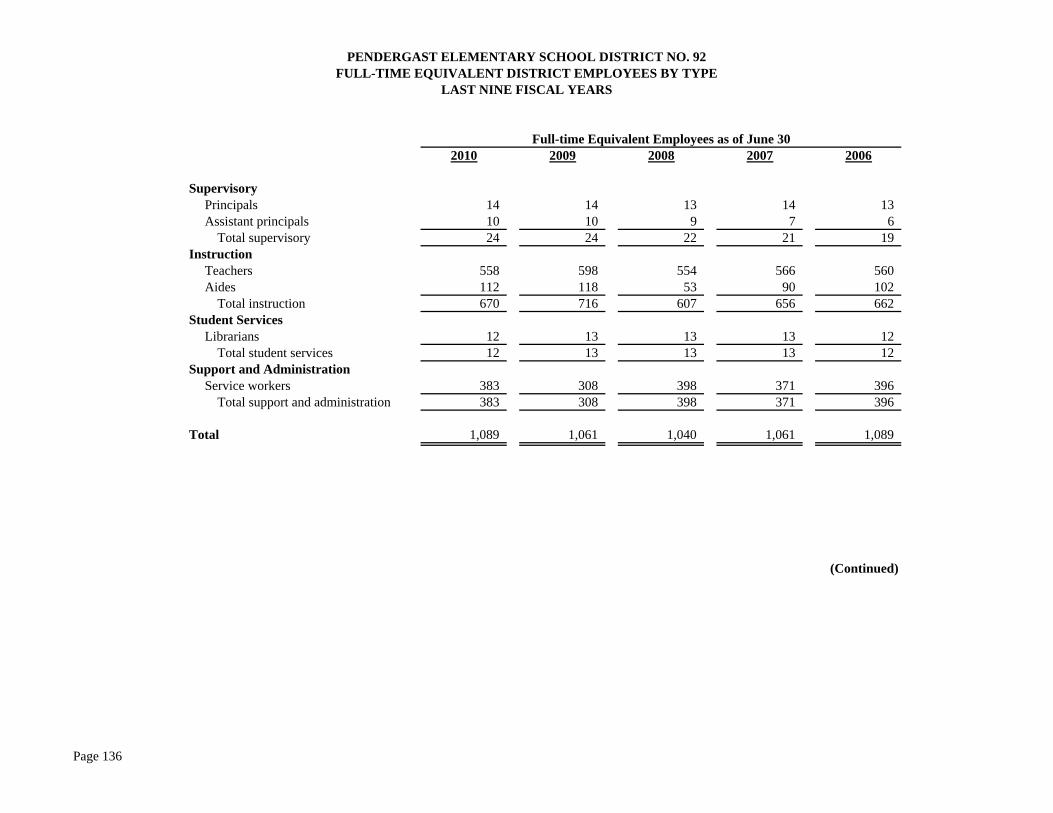
2010 2009 2008 2007 2006
SupervisoryPrincipals 14 14 13 14 13 Assistant principals 10 10 9 7 6
Total supervisory 24 24 22 21 19 Instruction
Teachers 558 598 554 566 560 Aides 112 118 53 90 102
Total instruction 670 716 607 656 662 Student Services
Librarians 12 13 13 13 12 Total student services 12 13 13 13 12
Support and AdministrationService workers 383 308 398 371 396
Total support and administration 383 308 398 371 396
Total 1,089 1,061 1,040 1,061 1,089
(Continued)
PENDERGAST ELEMENTARY SCHOOL DISTRICT NO. 92FULL-TIME EQUIVALENT DISTRICT EMPLOYEES BY TYPE
Full-time Equivalent Employees as of June 30
LAST NINE FISCAL YEARS
Page 136
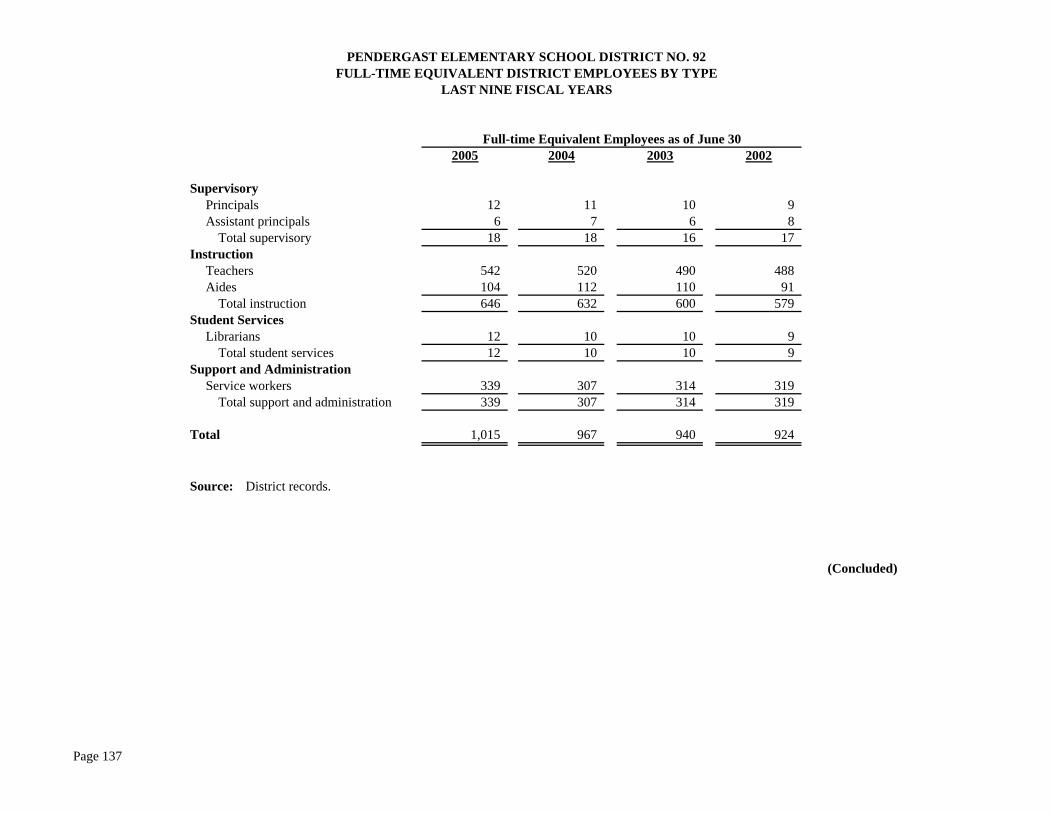
2005 2004 2003 2002 1997
SupervisoryPrincipals 12 11 10 9 Assistant principals 6 7 6 8
Total supervisory 18 18 16 17 - Instruction
Teachers 542 520 490 488 Aides 104 112 110 91
Total instruction 646 632 600 579 - Student Services
Librarians 12 10 10 9 Total student services 12 10 10 9 -
Support and AdministrationService workers 339 307 314 319
Total support and administration 339 307 314 319 -
Total 1,015 967 940 924 -
Source: District records.
(Concluded)
PENDERGAST ELEMENTARY SCHOOL DISTRICT NO. 92FULL-TIME EQUIVALENT DISTRICT EMPLOYEES BY TYPE
LAST NINE FISCAL YEARS
Full-time Equivalent Employees as of June 30
Page 137
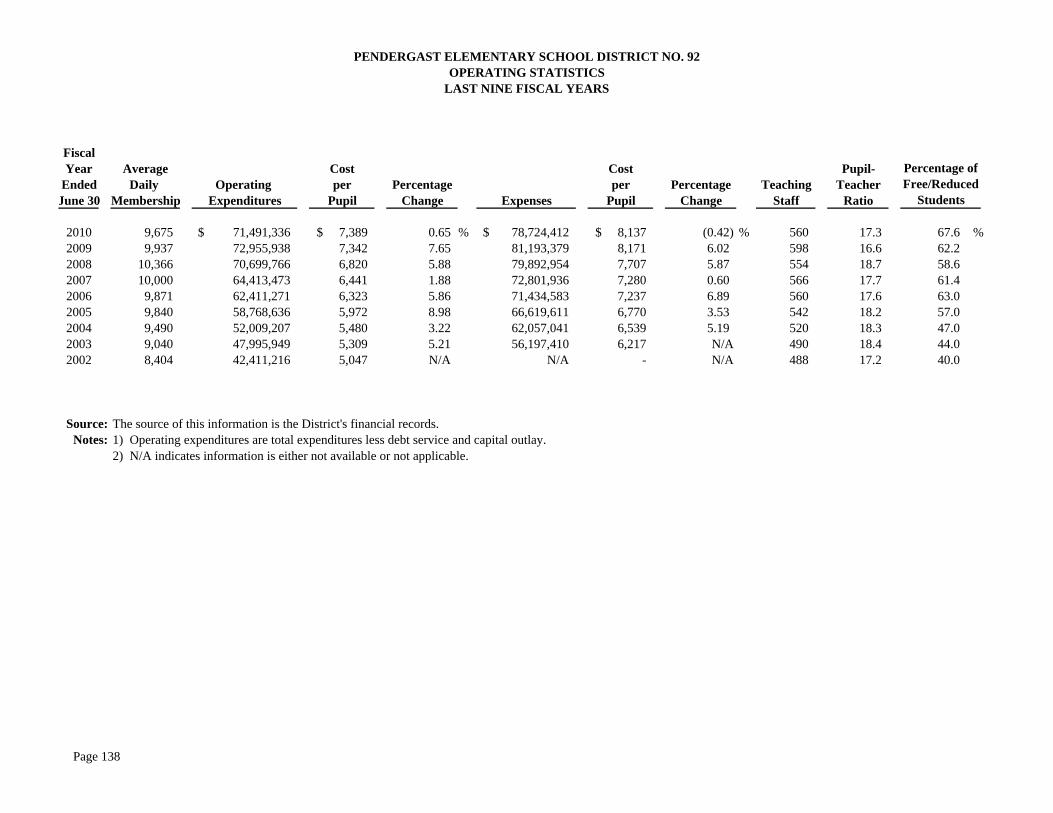
FiscalYear Average Cost Cost Pupil-
Ended Daily Operating per Percentage per Percentage Teaching TeacherJune 30 Membership Expenditures Pupil Change Expenses Pupil Change Staff Ratio
2010 9,675 71,491,336$ 7,389$ 0.65 % 78,724,412$ 8,137$ (0.42) % 560 17.3 67.6 %2009 9,937 72,955,938 7,342 7.65 81,193,379 8,171 6.02 598 16.6 62.2 2008 10,366 70,699,766 6,820 5.88 79,892,954 7,707 5.87 554 18.7 58.6 2007 10,000 64,413,473 6,441 1.88 72,801,936 7,280 0.60 566 17.7 61.4 2006 9,871 62,411,271 6,323 5.86 71,434,583 7,237 6.89 560 17.6 63.0 2005 9,840 58,768,636 5,972 8.98 66,619,611 6,770 3.53 542 18.2 57.0 2004 9,490 52,009,207 5,480 3.22 62,057,041 6,539 5.19 520 18.3 47.0 2003 9,040 47,995,949 5,309 5.21 56,197,410 6,217 N/A 490 18.4 44.0 2002 8,404 42,411,216 5,047 N/A N/A - N/A 488 17.2 40.0
Source: The source of this information is the District's financial records.Notes: 1) Operating expenditures are total expenditures less debt service and capital outlay.
2) N/A indicates information is either not available or not applicable.
Free/ReducedStudents
PENDERGAST ELEMENTARY SCHOOL DISTRICT NO. 92OPERATING STATISTICS
LAST NINE FISCAL YEARS
Percentage of
Page 138
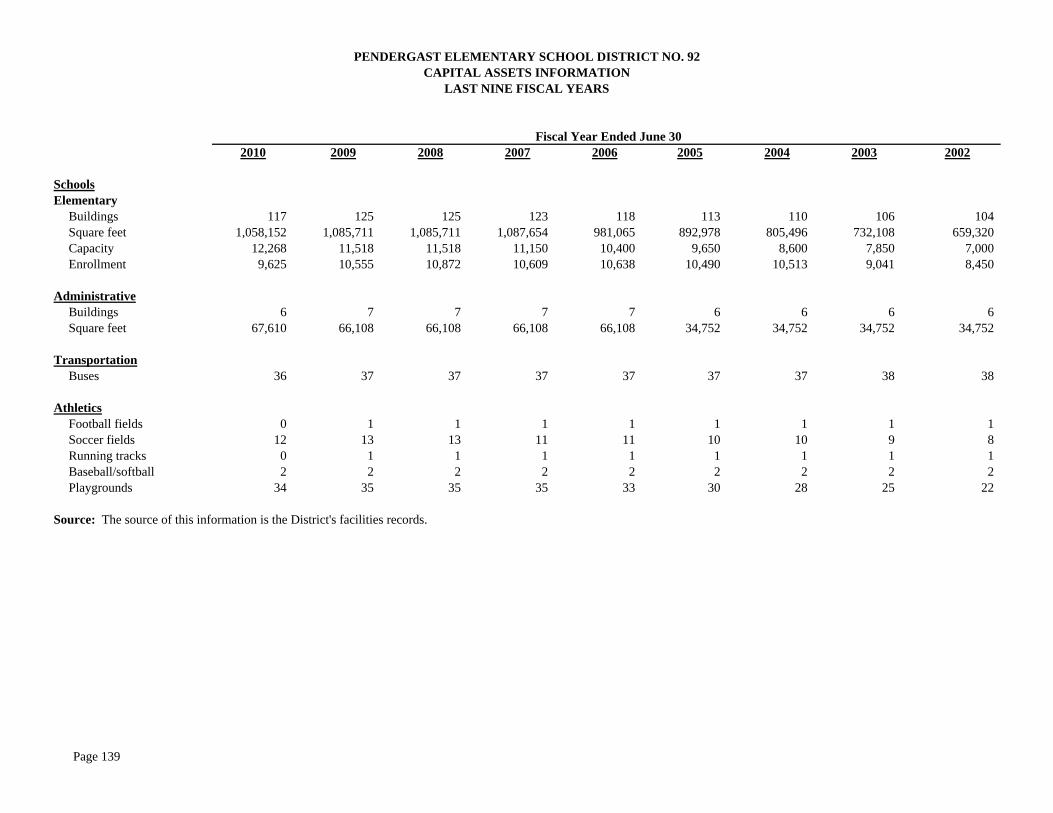
2010 2009 2008 2007 2006 2005 2004 2003 2002
SchoolsElementary
Buildings 117 125 125 123 118 113 110 106 104Square feet 1,058,152 1,085,711 1,085,711 1,087,654 981,065 892,978 805,496 732,108 659,320Capacity 12,268 11,518 11,518 11,150 10,400 9,650 8,600 7,850 7,000Enrollment 9,625 10,555 10,872 10,609 10,638 10,490 10,513 9,041 8,450
AdministrativeBuildings 6 7 7 7 7 6 6 6 6Square feet 67,610 66,108 66,108 66,108 66,108 34,752 34,752 34,752 34,752
TransportationBuses 36 37 37 37 37 37 37 38 38
AthleticsFootball fields 0 1 1 1 1 1 1 1 1Soccer fields 12 13 13 11 11 10 10 9 8Running tracks 0 1 1 1 1 1 1 1 1Baseball/softball 2 2 2 2 2 2 2 2 2Playgrounds 34 35 35 35 33 30 28 25 22
Source: The source of this information is the District's facilities records.
PENDERGAST ELEMENTARY SCHOOL DISTRICT NO. 92CAPITAL ASSETS INFORMATION
LAST NINE FISCAL YEARS
Fiscal Year Ended June 30
Page 139
Page 140
(This page intentionally left blank)


![Relic [Pendergast 01] - Preston.pdf](https://img.pdfslide.us/doc/110x75/577cd69e1a28ab9e789ccc6d/relic-pendergast-01-prestonpdf.jpg)