Embed Size (px)
Citation preview

A STUDY OF THE CONSTRUCT VALIDITY OF THE BEHAVIORAL ASSESSMENT
SYSTEM FOR CHILDREN, SECOND EDITION (BASC-2)
WITHIN THE JUVENILE OFFENDER POPULATION.
by
JON PEIPER
(Under the Direction of Georgia B. Calhoun)
ABSTRACT
The current study sought to evaluate the construct validity of the Behavior Assessment System
for Children, Second Edition (BASC-2) Self-Report of Personality-Adolescent (SRP-A) as a
broad screening measure for use within the juvenile offender population. The BASC-2 SRP-A is
recommended for this purpose but has not been validated for use within this population. Results
from Confirmatory Factor Analysis (n=205) provided evidence of adequate fit of the five-factor
higher-order model (Reynolds & Kamphaus, 2004) with the data from the current study. The
individual scales of the instrument demonstrated good to excellent internal consistency except
for two scales; Sensation Seeking and Self-Reliance. Inter-scale correlations of SRP-A scales
were in expected directions, while specific correlations with MMPI-A scales provided strong
support for convergent validity. Based on these results, the BASC-2 SRP-A is supported for use
within the juvenile offender population as a broad screening instrument.
INDEX WORDS: Juvenile Offenders, Behavioral assessment System for Children, Second
Edition (BASC-2), Factor Analysis, Validity, Reliability

A STUDY OF THE CONSTRUCT VALIDITY OF THE BEHAVIORAL ASSESSMENT
SYSTEM FOR CHILDREN, SECOND EDITION (BASC-2)
WITHIN THE JUVENILE OFFENDER POPULATION.
by
JON PEIPER
B.S., The University of Georgia, 2002
M.Ed., The University of Georgia, 2005
A Dissertation Submitted to the Graduate Faculty of The University of Georgia in Partial
Fulfillment of the Requirements for the Degree
DOCTOR OF PHILOSOPHY
ATHENS, GEORGIA
2009

© 2009
Jon Peiper
All Rights Reserved

A STUDY OF THE CONSTRUCT VALIDITY OF THE BEHAVIORAL ASSESSMENT
SYSTEM FOR CHILDREN, SECOND EDITION (BASC-2)
WITHIN THE JUVENILE OFFENDER POPULATION.
by
JON PEIPER
Major Professor: Georgia B. Calhoun
Committee: Edward Delgado-Romero Brian A. Glaser Pamela O. Paisley
Electronic Version Approved: Maureen Grasso Dean of the Graduate School The University of Georgia August 2009

iv
DEDICATION
I would like to dedicate this paper to my wife, Katherine. She has been with me through
the thickest and most challenging parts of this journey. She has been supportive, encouraging,
and also willing to kick me in the pants when needed. She has also provided a balance to my life
that would not exist without her.
My family has also been a strong foundation of support. Their belief in me has been
motivating. I would to like thank my mother for teaching me compassion and my father for
teaching me dedication. Together, they have made it possible for me to be the professional I am
today. My siblings have all been individual inspirations to me and their support has been
invaluable.
Specifically, I would like to thank the staff, faculty, and students of the Counseling
Psychology program and in the Department of Counseling and Human Development Services.
My fellow students and cohort members have taught me about the true value of seeking and
offering help. The faculty inspired me and became models of what being a psychologist means. I
would like to thank Heather Dukes Murray for being a strong leader for JCAP and for all she did
to help me complete this dissertation. Finally, I would like to specifically thank Dr.s Georgia
Calhoun and Brian Glaser. They have nurtured me in my professional development since I began
as a masters student in the Juvenile Counseling and Assessment Program. You are both models
of who and how I want to be.
v
ACKNOWLEDGEMENTS
I would like to acknowledge Georgia Calhoun and Brian Glaser. They have personally
and professionally influenced who I am and this dissertation could not have been completed
without them. Throughout my years of work with JCAP, I always felt supported and encouraged.
As a doctoral assistant with the program, I developed professional confidence in myself because
they believed in me and respected my input. I learned and grew as a psychologist during JCAP.
Thank you.
vi
TABLE OF CONTENTS
Page
ACKNOWLEDGEMENTS .............................................................................................................v
LIST OF TABLES ....................................................................................................................... viii
LIST OF FIGURES ....................................................................................................................... ix
CHAPTER
1 Introduction ....................................................................................................................1
The Juvenile Offender ...............................................................................................2
Justification and Significance ....................................................................................5
Statement of Problem ................................................................................................7
General Hypotheses ...................................................................................................7
Definitions and Operational Terms ...........................................................................8
2 Review of Related Research ..........................................................................................9
Evidence-Based Assessment (EBA) .........................................................................9
Research and Theory ...............................................................................................10
Reliability and Validity ...........................................................................................11
The Assessment Process ..........................................................................................15
EBA for Specific Purposes with Children and Adolescents ...................................16
Behavioral Assessment System for Children, Second Edition (BASC-2) ..............23
3 Method .........................................................................................................................28
Description of Sample .............................................................................................28
Statistical Analysis ..................................................................................................28
Instruments ..............................................................................................................31

vii
Data Collection ........................................................................................................34
Limitations ...............................................................................................................37
Assumptions ............................................................................................................37
Hypotheses ..............................................................................................................38
4 Results ..........................................................................................................................39
Reliability ................................................................................................................39
Validity ....................................................................................................................45
5 Discussion and Summary .............................................................................................58
Summary .................................................................................................................58
Discussion of Findings ............................................................................................60
Reliability ................................................................................................................60
Validity ....................................................................................................................61
Limits to Internal Validity .......................................................................................64
Limits to External Validity ......................................................................................65
Implications for Future Research ............................................................................65
Implications for Practice .........................................................................................66
Conclusions .............................................................................................................67
REFERENCES ..............................................................................................................................69
APPENDICES ...............................................................................................................................74
A Stem and Leaf Plots for BASC-2 Scales......................................................................74
B BASC-2 Scale Cronbach Alphas and Item-Total Correlations ....................................84
C Results from Confirmatory Factor Analysis ................................................................94
D Results from Exploratory Factor Analysis ...................................................................98

viii
LIST OF TABLES
Page
Table 1: Matrix for Evaluating Internal Consistency Alphas. .......................................................13
Table 2: BASC-2 and MMPI-A Scale Statistics for Sample. ........................................................36
Table 3: Coefficient Alpha Classifications. ...................................................................................40
Table 4: Cronbach Alpha’s for Current Study and for Normative Sample. ..................................41
Table 5: Interscale Correlations within BASC-2 SRP-A. ..............................................................46
Table 6: BASC-2 SRP-A Correlations with MMPI-A. ................................................................48
Table 7: Fit Indices for Confirmatory Factor Analyses. ................................................................50
Table 8: Standardized Parameter Estimates for Five-factor Model. ..............................................53
Table 9: Parallel Analysis Results. ................................................................................................55
Table 10: Loadings from 4-factor Solution. ..................................................................................57

ix
LIST OF FIGURES
Page
Figure 1: Composite to Scale Relationships on BASC-2 SRP-A ..................................................30
Figure 2: EFA 4-factor Structure ...................................................................................................56

1
CHAPTER 1
INTRODUCTION
The age cohort comprising childhood and adolescence has been of interest to
psychologists since psychology’s introduction to the United States (Benjamin 2007). G. Stanley
Hall, ostensibly the founder of American psychology, has been credited with initiating the child
guidance movement. His efforts in founding journals, writing books, organizing associations,
and advocating for children have had a lasting influence on psychology and arguably this country
as well (Benjamin 2007).
One noteworthy continuation of Hall’s efforts can be found in the work of Lightner
Witmer (Benjamin 2007). By specifying the need for a psychology for application in clinics, he
opened the way for the development of school psychology, clinical psychology, and counseling
psychology; the applied psychologies. The application of psychology received initial skepticism
and was tagged with the same negative valence associated with phrenology and other
“applications” of psychology of that day. The early American versions of “therapy” were
negatively seen by many as a mystic type of healing (Benjamin 2007). Many a nose was turned
up at the application of psychology, but it has slowly become the face and hands of psychology.
A central function within the application of psychology is assessment. Watkin’s (1992)
discussion of the historical influences on assessment practices of counseling psychologists noted
that regardless of work setting, assessment occupied a significant part of a counseling
psychologist’s practice. Groth-Marnat (2003) stated that “assessment is crucial to the definition,
training, and practice of professional psychology” (p.5). He continued by citing that 91% of
psychologists in practice engage in assessment. Furthermore, Groth-Marnat (2003) noted that
assessment is considered the “very foundation of clinical investigation, applied research, and

2
program evaluation” (p.6), and described the recent increase of behavior rating scales in
assessments with children, specifically acknowledging the Behavioral Assessment System for
Children, Conner’s Parent/Teacher Rating Scales, and the Achenbach Child Behavior Checklist
as exemplars.
Perhaps the earliest version of psychological assessment was completed by the likes of
Freud, Jung, and Adler using clinical interviews (Groth-Marnat 2003). Since that time, the
practice of assessment has grown to include a plethora of methods and measures. The difficulty
now becomes how to choose an assessment. Groth-Marnat suggests evaluating the instrument in
regards to its theoretical orientation (Does the measure match its theory?), practical
considerations (Are its length and reading level appropriate?), standardization (Is the current
population similar to the standardization population?), reliability (Are reliability estimates
adequate?), and validity (Will it produce appropriate measurements within the intended use?).
Armed with an understanding of the assets and limitations of assessment, psychologists
are the primary providers of psychological testing for the purposes of diagnosis and treatment
planning (Groth-Marnat, 2003). Assessment can be seen as a psychologist’s unique contribution
to the broad field of mental health. As echoed by Blanton and Jaccard (2006), “measurement is a
cornerstone of psychological research and practice” (p.27).
The Juvenile Offender
According to the Federal Interagency Forum on Child and Family Statistics (2007) there
were 73.7 million children ages 0–17 in the United States in 2006, or 25 percent of the
population. In that year, 67 percent of children ages 0–17 lived with two married parents and
births to unmarried women constituted 37 percent of all U.S. births, the highest level ever
reported. In 2005, 20 percent of school-age children spoke a language other than English at

3
home. The adolescent birth rate, among females ages 15-17, fell to 2.1 % in 2005. In 2005, 18
percent of all children ages 0–17 lived in poverty. The percentage of children with at least one
parent working year round, was 78.3 percent in 2005. In 2005, 40 percent of households with
children had one or more housing problems like cost burden, physically inadequate housing and
crowded housing. In 2005, 68 percent of Caucasian; 66 percent of Asian-American children; 50
percent of African-American; and 45 percent of Hispanic/Latino children (ages 3-5) were read to
daily. In 2005, 5 percent of children ages 4–17 were reported by a parent to have serious
emotional or behavioral difficulties. These statistics are not intended to scare, but to simply
represent what our youth are experiencing. Considering that so many children are not having
their essential needs met is testament to the need for services. It was for precisely this reason that
the Juvenile Court System was created (Snyder & Sickmund, 2006).
The juvenile justice movement began in the 19th century with an interest in discontinuing
the practice of treating juvenile offenders as miniature adults (Snyder & Sickmund, 2006). As
early as 1825, the Society for the Prevention of Juvenile Delinquency was advocating for the
separation of juvenile and adult offenders, which led to the creation of privately operated youth
detention centers. These centers came under scrutiny for various charges of abuse and the states
began to take over control of many facilities. Illinois passed the Juvenile Court Act of 1899 on
April 4th, thus creating the nation’s first state juvenile court in Cook County (Chicago is the
current county seat) on July 3, 1899. Under the doctrine of parens patriae (the state as parent)
the state’s main focus was on the welfare of youth. Thirty-one new states followed with
establishing their own juvenile courts over the next 11 years. By 1925, all but two states had
developed juvenile courts (Snyder & Sickmund, 2006).

4
In 2004, law enforcement agencies in the United States made an estimated 2.2 million
arrests of persons under age 18, 16% of all arrests (Snyder, 2006). In 2004, for the tenth
consecutive year, the rate of juvenile arrests for Violent Crime Index offenses— murder, forcible
rape, robbery, and aggravated assault—declined. Specifically, between 1994 and 2004, the
juvenile arrest rate for Violent Crime Index offenses fell 49%. As a result, the juvenile Violent
Crime Index arrest rate in 2004 was at its lowest level since at least 1980. From its peak in 1993
to 2004, the juvenile arrest rate for murder fell 77%. Between 1980 and 2004, the juvenile arrest
rate for simple assault increased 106% for males and 290% for females. The disparity in violent
crime arrest rates for black juveniles and white juveniles declined from 6-to-1 in 1980 to 4- to-1
in 2004 (Snyder, 2006).
Snyder and Sickmund (2006) noted that of the 2.2 million arrests 29% were female, 68%
were ages 16-17, 71% were Caucasian, 27% were African-American, 1% were American Indian,
and 2% were Asian-American. Violent and drug arrest rates for young juveniles rose from 1980
to 2003 as their overall arrest rate fell. For youth ages 10–12 the Property Crime Index fell 51%
between 1980 and 2003 and the Violent Crime Index arrest rate increased 27%.
Teplin, Abram, McClelland, Mericle, Dulcan, and Washburn (2006) presented data from
the Northwestern Juvenile Project, which measured the prevalence of alcohol, drug, and mental
disorders among youth detained at the Cook County Juvenile Temporary Detention Center in
Illinois. The project used the Diagnostic Interview Schedule for Children (DISC) Version 2.3 to
assess and diagnose a random sample of youth at the detention center between November 20,
1995, and June 14, 1998. The stratified sample (by gender, race-ethnicity, age, and legal status)
of 1,829 youths included 1,172 males (64.1 percent) and 657 females (35.9 percent), 1,005
African-Americans (54.9 percent), 524 Hispanics/Latinos (28.7 percent), 296 Caucasians (16.2
5
percent), and 4 detainees of other racial and ethnic groups (0.2 percent). The mean age for the
youths was 14.9 years old. The detention center’s total population included 90 percent male with
racial classifications of African-American (77.9 percent), Hispanic/Latino (16.0 percent),
Caucasian (5.6 percent), and other racial or ethnic groups (0.5 percent). The percentage of mental
health disorders in this sample averaged 66.3% for males and 73.8% for females. The
percentages of mental health disorders across ethnicity totaled 64.6 % for African-American,
82% for Caucasian, and 70.4% for Hispanic/Latino males and conversely were 70.9% for
African-American, 86.1 % for Caucasian, and 75.9% for Hispanic/Latino female youth.
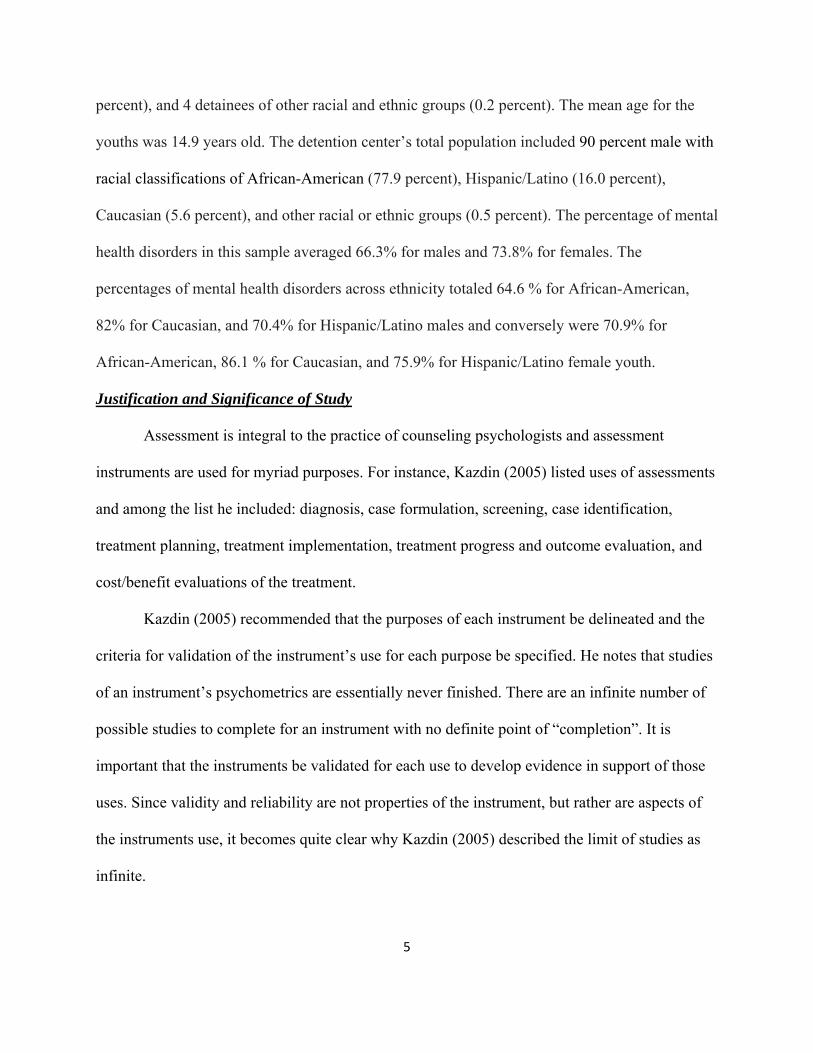
Justification and Significance of Study
Assessment is integral to the practice of counseling psychologists and assessment
instruments are used for myriad purposes. For instance, Kazdin (2005) listed uses of assessments
and among the list he included: diagnosis, case formulation, screening, case identification,
treatment planning, treatment implementation, treatment progress and outcome evaluation, and
cost/benefit evaluations of the treatment.
Kazdin (2005) recommended that the purposes of each instrument be delineated and the
criteria for validation of the instrument’s use for each purpose be specified. He notes that studies
of an instrument’s psychometrics are essentially never finished. There are an infinite number of
possible studies to complete for an instrument with no definite point of “completion”. It is
important that the instruments be validated for each use to develop evidence in support of those
uses. Since validity and reliability are not properties of the instrument, but rather are aspects of
the instruments use, it becomes quite clear why Kazdin (2005) described the limit of studies as
infinite.

6
With the importance of assessment in various applications, the validation of an
instrument becomes necessary for effective provision of the psychological services. The
movement toward evidence-based assessment (EBA) has recently begun appearing in the
literature (Mash & Hunsley, 2005). Achenbach (2005) specified that evidence for the methods
and measures for all assessment purposes are needed. He noted that the evidence-based treatment
(EBT) movement pushed forth without first considering how to effectively identify and measure
the problems that are to be treated and the outcomes following those treatments. Achenbach
stated that EBA and EBT will aide in “understanding, preventing, and ameliorating child
psychopathology” (p.547).
Testing the “functioning” of instruments across populations and purposes is necessary.
In an official publication by the Office of Juvenile Justice and Delinquency Prevention, Grisso
and Underwood (2004) state “instruments that provide evidence of reliability and validity with
youth in the juvenile justice system are preferable to those that do not” (p.12). Grisso and
Underwood also listed a number of assessment instruments they recommend for use within the
juvenile justice population. Since no studies, to date, have examined the BASC-2’s validity
within this specific population, it is not surprising that the BASC-2 did not appear on their list.
Although the BASC-2 was not listed, several other instruments with which the BASC-2 has
demonstrated convergent validity (like the Child Behavior Checklist) did appear on the list. The
BASC-2 is a commonly used behavioral rating scale which has been recommended for the
assessment of conduct problems (McMahan & Frick, 2005) and demonstrates promise for
effective use with juvenile offenders, but validity studies for this purpose are lacking.
7
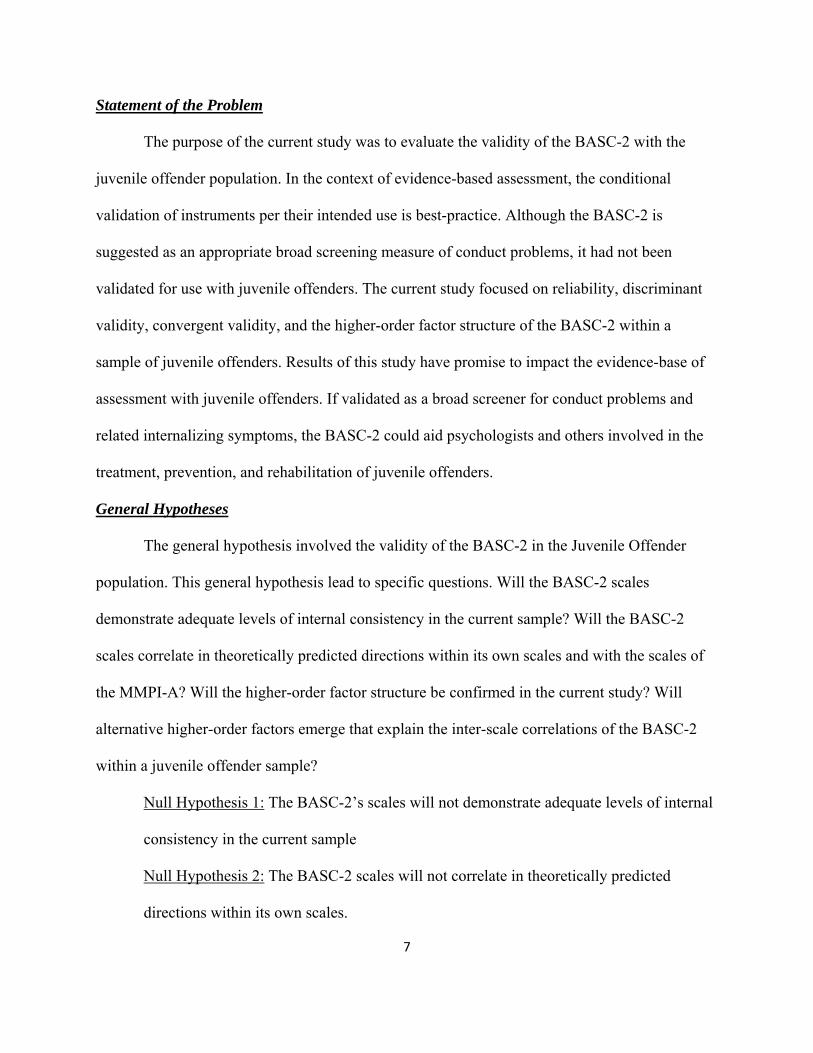
Statement of the Problem
The purpose of the current study was to evaluate the validity of the BASC-2 with the
juvenile offender population. In the context of evidence-based assessment, the conditional
validation of instruments per their intended use is best-practice. Although the BASC-2 is
suggested as an appropriate broad screening measure of conduct problems, it had not been
validated for use with juvenile offenders. The current study focused on reliability, discriminant
validity, convergent validity, and the higher-order factor structure of the BASC-2 within a
sample of juvenile offenders. Results of this study have promise to impact the evidence-base of
assessment with juvenile offenders. If validated as a broad screener for conduct problems and
related internalizing symptoms, the BASC-2 could aid psychologists and others involved in the
treatment, prevention, and rehabilitation of juvenile offenders.
General Hypotheses
The general hypothesis involved the validity of the BASC-2 in the Juvenile Offender
population. This general hypothesis lead to specific questions. Will the BASC-2 scales
demonstrate adequate levels of internal consistency in the current sample? Will the BASC-2
scales correlate in theoretically predicted directions within its own scales and with the scales of
the MMPI-A? Will the higher-order factor structure be confirmed in the current study? Will
alternative higher-order factors emerge that explain the inter-scale correlations of the BASC-2
within a juvenile offender sample?
Null Hypothesis 1: The BASC-2’s scales will not demonstrate adequate levels of internal
consistency in the current sample
Null Hypothesis 2: The BASC-2 scales will not correlate in theoretically predicted
directions within its own scales.

8
Null Hypothesis 3: The BASC-2 scales will not correlate in theoretically predicted
directions with the scales of the MMPI-A.
Null Hypothesis 4: The higher-order factor structure will not be confirmed in the sample.
Null Hypothesis 5: No alternative higher-order factors will emerge to explain the inter-
scale correlations of the BASC-2 within a juvenile offender sample.
Definition of Terms
Juvenile Offender: In the current study, juvenile offender was defined as any youth, 18 years or
older, than has been arrested for committing a crime or violating a law. Also, the term juvenile
offender will be synonymous with the term juvenile delinquent.
Construct: A construct was defined in this study has a hypothetical phenomenon which cannot be
directly observed and is therefore latent.
Evidence-Based Treatment (EBT): The predominant definition in the literature for evidence-
based treatment is the recognition of the connection between current research on treatment
efficacy, the criteria for the research evidence, and the use of these treatments in empirically
validated ways.
Evidence-Based Assessment (EBA): Evidence-based assessment is an approach that utilizes
research and theory to select the constructs, methods, and measures for an assessment purpose
and the process of the assessment.

9
CHAPTER 2
REVIEW OF RELATED RESEARCH
Evidenced-based Assessments
The evidence-based treatment (EBT) or evidence-based practice in psychology (EBPP)
movement has its earliest roots with Lightner Witmer’s first clinic in 1896, but the modern state
of the movement has gained speed over the past 20 years (American Psychological Association
2006). The literature is replete with studies reporting empirical support of specific treatments for
use with clients (see Silverman & Hinshaw, 2008 for a review) and there are even guidelines to
help evaluate EBT guidelines (American Psychological Association 2002). In this same light,
psychologists are calling for evidence based assessments (EBA) and Achenbach (2005) mentions
that “without EBA, EBT may be like a magnificent house with no foundation” (p. 547).
Hunsley and Mash (2007) describe EBA as a three-pronged approach including research
and theory, methods and measures, and the process of an unfolding assessment. They explain
assessment as being a decision-making process which unfolds by iteratively testing new
hypotheses. The process entails integrating and interpreting data from different instruments and
informants for the explicit purpose of the unfolding assessment. EBA guidelines or standards
would provide a level of insurance that assessment procedures and instruments are used for valid
purposes based on research and theory; however, to date these guidelines are still in
developmental stages, which leaves room for faulty assessment procedures. The clinical
application of several commonly used assessments (specifically the Rorschach and Thematic
Apperception Test) appears to have “outstripped empirical evidence” (Hunsley & Mash, 2007;
p.31), which means many evaluations are being conducted with tests that don’t meet professional
standards.
10
Mash and Hunsley (2005) note that the use of assessments only becomes valid when the
purposes and populations for that assessment have been evaluated and deemed appropriate.
Mash and Hunsley call for “replicated evidence for a measure's concurrent, predictive,
discriminative, and (ideally) incremental validity” (p. 372) to establish it as evidence-based. One
study with a convenience sample is not enough. Hunsley and Mash (2007) discuss three critical
aspects of EBA; 1) research and theory, 2) psychometrics, and 3) the entire assessment process.
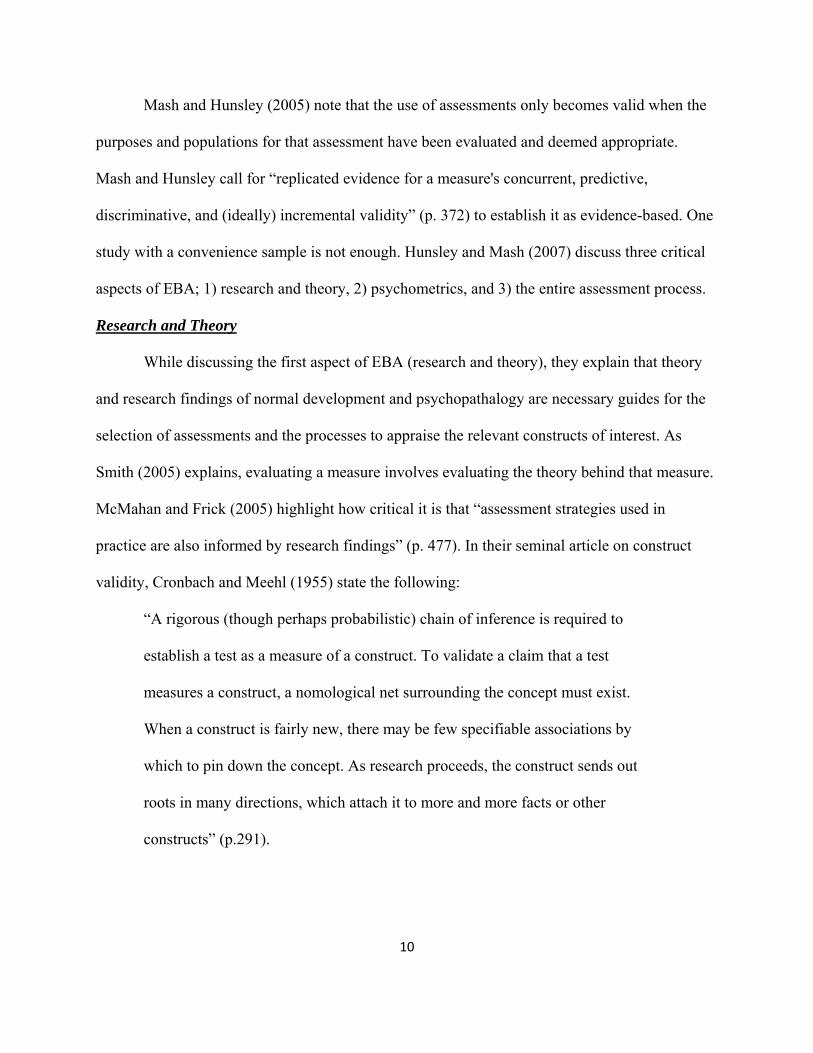
Research and Theory
While discussing the first aspect of EBA (research and theory), they explain that theory
and research findings of normal development and psychopathalogy are necessary guides for the
selection of assessments and the processes to appraise the relevant constructs of interest. As
Smith (2005) explains, evaluating a measure involves evaluating the theory behind that measure.
McMahan and Frick (2005) highlight how critical it is that “assessment strategies used in
practice are also informed by research findings” (p. 477). In their seminal article on construct
validity, Cronbach and Meehl (1955) state the following:
“A rigorous (though perhaps probabilistic) chain of inference is required to
establish a test as a measure of a construct. To validate a claim that a test
measures a construct, a nomological net surrounding the concept must exist.
When a construct is fairly new, there may be few specifiable associations by
which to pin down the concept. As research proceeds, the construct sends out
roots in many directions, which attach it to more and more facts or other
constructs” (p.291).

11
Cronbach and Meehl’s (1955) discussion of a nomological net speaks to the need for a
coherent theory to exist around the construct of interest. With such a theory in place, hypotheses
of associations can be made for the construct (as measured) with other constructs (again, as
measured). These associations can then be tested to add to the validation of the target measure
and target construct.
Reliability and Validity
In the second aspect of EBA, Hunsley and Mash (2007) discuss selecting
psychometrically sound instruments. They discuss the necessity of using instruments which have
demonstrated adequate levels of reliability, validity, and incremental validity for each purpose
for which they are used. Hunsley and Mash (2007) described the current professional standards
of a psychometrically sound instrument as including standardizations, relevant norms, and
appropriate levels of reliability and validity. They also assert that “blanket recommendations to
use reliable and valid measures when evaluating treatments are tantamount to writing a recipe for
baking hippopotamus cookies that begins with the instruction ‘use one hippopotamus,’ without
directions for securing the main ingredient” (Mash & Hunsley, 2005; p. 364).
Reliability and validity are not properties of the instrument itself; they are properties of
the specific use of that instrument, which makes it difficult to pinpoint exact criteria. The
“hippopotamus” in this sense is the overarching concept of construct validity which has been
called “an umbrella term, describing a process for theory validation that subsumes specific test
validation operations” (Smith, 2005; p. 396). The test-user therefore needs clear guidance on
how to evaluate an instrument for his or her specific purposes and population or sample.
Internal consistency has been described as “a measure of the ‘here-and-now, on-the-spot’
reliability” (p. 291; Charter, 2003), and also as the correlation estimate of the current instrument
12
score with an alternate form test that was never administered (Ponterotto & Ruckdeschel, 2007).
The acceptable reliabilities for research are lower than what is acceptable for clinicians (.90) and
others involved with high-stakes decisions. Ponterotto and Ruckdeschel (2007) note that internal
consistency is affected by both the number of items in the subscale and the mean inter-item
correlation within it. With the inter-item correlation held constant, adding items will increase
alpha. The same is true for increasing the inter-item correlations. Interestingly, sample variance
can increase alpha because “when scores are bunched together, a small change in raw score will
lead to marked changes in relative rankings. If variance is greater, it is more likely that a small
change in raw score will not affect the relative rankings” (p.1001; Ponterotto & Ruckdeschel,
2007).
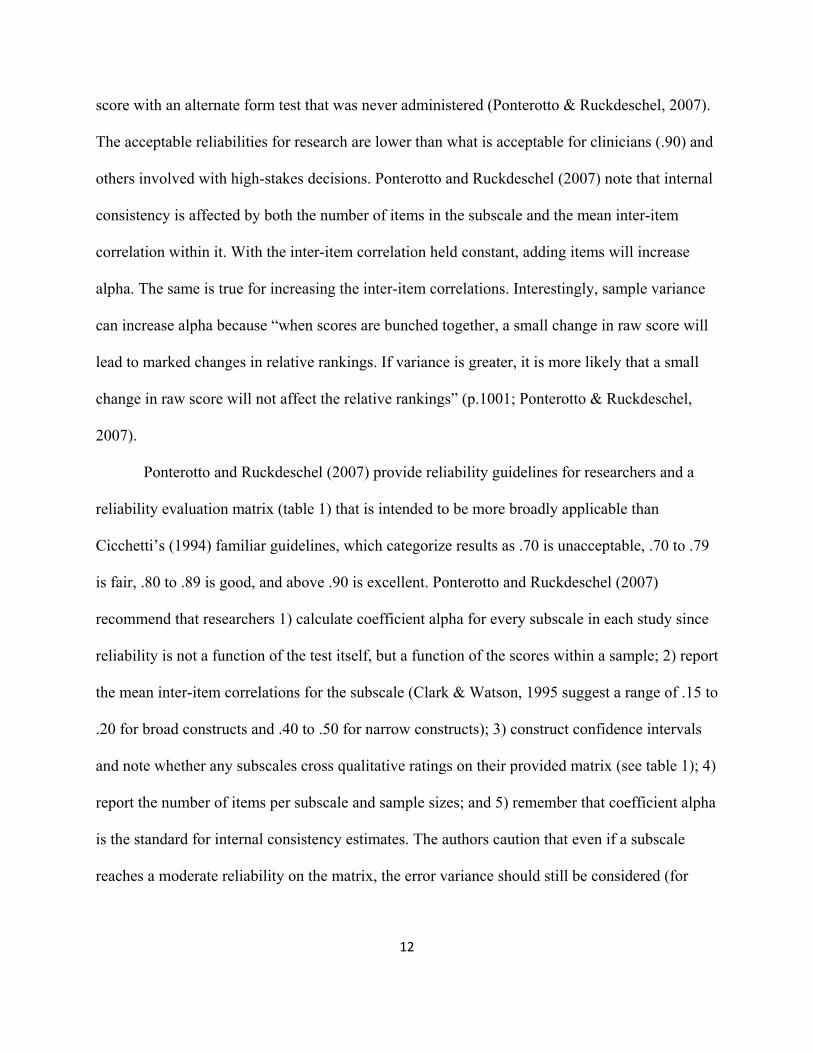
Ponterotto and Ruckdeschel (2007) provide reliability guidelines for researchers and a
reliability evaluation matrix (table 1) that is intended to be more broadly applicable than
Cicchetti’s (1994) familiar guidelines, which categorize results as .70 is unacceptable, .70 to .79
is fair, .80 to .89 is good, and above .90 is excellent. Ponterotto and Ruckdeschel (2007)
recommend that researchers 1) calculate coefficient alpha for every subscale in each study since
reliability is not a function of the test itself, but a function of the scores within a sample; 2) report
the mean inter-item correlations for the subscale (Clark & Watson, 1995 suggest a range of .15 to
.20 for broad constructs and .40 to .50 for narrow constructs); 3) construct confidence intervals
and note whether any subscales cross qualitative ratings on their provided matrix (see table 1); 4)
report the number of items per subscale and sample sizes; and 5) remember that coefficient alpha
is the standard for internal consistency estimates. The authors caution that even if a subscale
reaches a moderate reliability on the matrix, the error variance should still be considered (for

13
instance, a 6 item scale with alpha .65 with less than 100 subjects would have an error variance
of 35% even with a moderate level of reliability).
Table 1, Matrix for Evaluating Internal Consistency Alphas
Items Per Scale Rating Sample Size N < 100 N = 100-300 N > 300
< 6 Excellent .75 .80 .85 Good .70 .75 .80 Moderate .65 .70 .75 Fair .60 .65 .70
7-11 Excellent .80 .85 .90 Good .75 .80 .85 Moderate .70 .75 .80 Fair .65 .70 .75
> 12 Excellent .85 .90 .90 Good .80 .85 - Moderate .75 .80 .85 Fair .70 .75 .80
*Adapted from (Ponterotto & Ruckdeschel, 2007)
Messick (1995) noted that “validity is not a property of the test or assessment as such, but
rather of the meaning of the test scores” (p. 741). Therefore, validity exists in the use of the test
or measure and not necessarily in the test itself. Since an individual measure is “just one of an
extensible set of indicators of the construct” (p. 742; Messick, 1995), the validation of the
various measures for their uses within specific populations adds to the evidence for validity of
that construct.
Smith (2005) provides the perspective that evidence of construct validity is always open
to criticism and reevaluation. He notes whenever a new investigation of an instrument’s
construct validity is undertaken, the new pieces of evidence add to the burgeoning argument for
or against its validation. Similarly, Messick (1995) characterizes validity as being “broadly
defined as nothing less than an evaluative summary of both the evidence for and the actual—as

14
well as potential—consequences of score interpretation and use (i.e., construct validity conceived
comprehensively)” (p. 742).
Smith (2005) offers a five-step model of construct validation which includes (1)
specification of theory, (2) development of hypotheses predicted by that theory, (3) specification
research designs to test the hypotheses, (4) interpretation of the fit between resulting data and
predictions, and (5) revision of the theory and the constructs. Smith describes step 4 as the most
essential part of validation studies and involves the typical validity studies (convergent,
discriminant, etc.).
Messick (1995) identifies 6 aspects of construct validity that function as validity criteria;
content, substantive, structural, generalizability, external, and consequential aspects. Content
aspect involves content relevance, representativeness, and technical quality. Substantive involves
theoretical and empirical evidence. Structural involves the scoring and construct structure.
Generalizability involves the extent to which the score properties and interpretations generalize.
External involves convergent and discriminant validity. Consequential involves the value of the
scores for decision-making and the consequences of test use, or stated differently, the clinical
usefulness of assessments.
Mash and Hunsley (2005) state, “solid evidence to support the usefulness of assessment
for improving treatment outcomes for children who are assessed is lacking” (p. 362). Their
declaration is a call for studies of incremental and clinical utility of instruments. Hunsley (2003)
describes incremental validity as the increase in predictive or discriminative power gained by the
addition of the instrument of focus. Hunsley adds that when the question focuses on the
meaningfulness of the increase, clinical utility is being addressed. Clinical utility involves a
weighing of the costs (time and money), decision-making improvements, and treatment impacts

15
of the instrument in reference to other available instruments, with the ultimate question being
whether or not to include the instrument in an assessment.
While discussing clinical utility of assessment instruments, Hunsley and Mash (2007)
articulate that “utility, even from an instrument as intensively researched as the MMPI-2, should
not be assumed” (p.33). They caution that little research is conducted on the clinical utility or
incremental validity of assessment instruments. Incremental validity is essentially established
when an instrument adds predictive data beyond what would already be available with other
information with consideration given to both time and money for the “cost” of the assessment.
Hunsley and Mash (2007) state in regards to clinical utility that “an emphasis on garnering
evidence regarding actual improvements in both decisions made by clinicians and service
outcomes experienced by patients and clients is at the heart of clinical utility” (p.45).
The Assessment Process
The third aspect of EBA, the entire assessment process, is described as having little
supporting evidence to date and that the assessment process should be empirically validated
(Hunsley & Mash, 2007).While presenting the Wechsler intelligence tests as being “among the
psychometrically strongest psychological instruments available” (p.32), Hunsley and Mash
(2007) warn against the common practice of interpreting inter-subtest score discrepancies. They
note that “nothing is to be gained, and much is to be potentially lost, by considering subtest
profiles” (p.32). This stands as an excellent example of a highly regarded test being used in a
manner not based in evidence.
Kazdin (2005) states, “in principle no finite number of studies can exhaust one type of
validity (e.g.,construct validity) or provide normative data from all possible samples (e.g.,
various combinations of ethnic, race, gender, sex, and age groups) at different points in time

16
(e.g., cohorts)” (p.550). Therefore, the process of validation is continuous without ever “proving”
validity, but rather accumulating evidence in support of it (Smith 2005). Mash and Hunsley
(2005) specify that most child assessments are conducted for the purposes of diagnosis and case
formulation, screening, prognosis and predictions, treatment design and planning, treatment
monitoring, and treatment evaluation. In light of the need to evaluate the validity of the various
uses of instruments, their discussion of the myriad uses brings to mind the mythological story of
Sisyphus who was condemned to an eternity of rolling a boulder uphill only to watch it roll back
down again. The good news however, is that our task of building evidence is not as hopeless as
Sisyphus’s task may seem. We aren’t building sand castles in high-tide, but rather mounting
boulders of evidence that will provide the foundation for validating the uses of instruments.
EBA for Specific Purposes with Children and Adolescents
For the current study, the greater population of interest is that of childhood/adolescence.
As Kazdin (2005) notes, a problem with validating measures of childhood dysfunction is the lack
of true gold standards for comparisons. It is difficult to fully evaluate the validity of an
instrument’s use without established criterion. Since psychology is generally interested in latent
constructs, the measuring of such constructs becomes difficult to verify. Criterion-validity
provides one way of validating an instrument’s measurement of a construct. Cronbach and Meehl
(1955) describe criterion-related validity as subsuming predictive validity and concurrent
validity. As discussed previously, instrument validation does not emerge from just one type of
validity or from one study of its psychometrics. Evidence-based assessment guidelines, although
not yet complete, are being established for specific assessment purposes.
Fletcher, Francis, Morris, and Lyon (2005)explain that youth with a learning disorder
(LD) are different than youth with mental retardation, emotional/behavioral disturbances, or

17
environmental causes of underachievement, although they share similar symptom presentations.
The authors note the inherent difficulty in ruling out other disorders or influencing factors when
presentations have symptom overlap. They evaluated four approaches to the assessment of LD.
The first and most common approach, IQ/achievement discrepancy (two-test model), had
problems with regression to the mean, meaning that on a subsequent test or alternative test, the
individual’s score will tend toward the mean (higher or lower depending). There were also issues
with discrepancy cut-offs in terms of unreliability of scores. This approach was also shown to
have limited validity in meta-analytic studies. The second approach evaluated, the low
achievement approach, has problems with measurement error. The third approach, intra-
individual differences, was noted as having validity problems. Response to instruction (RTI), the
forth approach, has demonstrated reliability and validity, but not fully adequate for identifying
LD.
In terms of the process of assessment for LD, Fletcher, Francis, Morris, and Lyon (2005)
boldly state, “We find little value in the idea of evaluating a child in a single assessment and
concluding that the child has LD based on an IQ-achievement discrepancy, low achievement, or
profiles on neuropsychological tests, largely because such assessments are not directly related to
treatment and the diagnosis itself is not reliable” (p.519). They state that not until after proper
treatment has been attempted, should children be diagnosed as LD. They insist upon first
allowing the child the opportunity to learn and therefore endorse a “treat and test” model over a
“test and treat” model. They recommend a hybrid-model combining the RTI and low-
achievement approaches.
In a similar vein, Silverman and Ollendick (2005) attempt to provide an overview of
where the field is in its evidence-based assessment of anxiety related disorders in children. They

18
define anxiety as including avoidance, worry, and physiological arousal. Silverman and
Ollendick advocate for a pragmatic approach to assessment that involves selecting the instrument
that will be most useful for the setting, not just the test-users favorite instrument. The authors
caution against settling in to an assessment routine that didn’t embrace a concerted effort to
select the test based on considerations of person and purpose. They explain that clinical
interviews are prone to error and interviewer based variance; however, they state that semi-
structured or structured interviews “are necessary from an evidence-based perspective” (p.384).
Therefore, the selection of the procedures and protocols for the interview are paramount for
maintaining an evidence-based assessment. They caution that most of the psychometric
properties of rating scales for anxiety (including the Revised Manifest Anxiety Scale) have been
completed on only community samples, thus highlighting the need for cross-validation of the
instruments in other samples. They state the need for verifying the “real world” anxiety related
symptoms associated with norm-referenced scores on the rating scales. The scores demonstrate a
place on a distribution which may or may not reflect the magnitude of anxiety.
Silverman and Ollendick (2005) explain that it is important to assess for comorbidity of
disorders and suggest a sequence of assessing for primary anxiety disorder diagnoses co-
occurring first with other anxiety disorders, then with depression, and finally with externalizing
disorders like ADHD, oppositional defiant disorder, or conduct disorder. The authors note that
youth with comorbid disorders experience more “impairment” and that their symptoms are more
likely to persist. In the article, the authors voice their struggle with the notion of how much
evidence is needed before describing an instrument or method as evidence-based. They describe
grappling with whether or not to even include recommendations. They therefore provide a
tentative set of recommendations: heed the arbitrary metrics of instruments, be aware that the

19
parent and youth reports are often discordant and consider both without pre-specifying one to be
better than the other, assess for comorbid disorders, and use an interview with a rating scale for
screening purposes.
Youngstrom, Findling, Youngstrom, and Calabrese (2005) reviewed the literature on
pediatric bipolar disorder (PBD). They note the field is calling for earlier onset diagnoses of
bipolar disorder. The authors cite research showing that 95,000 children and adolescents were
being medicated for bipolar disorder in 2001. They acknowledged it is unknown whether the
youth currently assessed as meeting bipolar disorder criteria will demonstrate the classic adult
presentation when older. Without longitudinal studies with agreed-upon diagnostic criteria for
PBD, the course of the disorder may never be known.
In terms of attitudes toward PBD, Youngstrom, Findling, Youngstrom, and Calabrese
(2005) identify different types of practitioners that either 1) don’t endorse the diagnosis in
childhood, 2) believe ADHD medication failure equals BP, or 3) feel unprepared to assess such a
low base-rate disorder. They explain that due to its strong heritability, the genetic predispositions
for BP exist from day one and as noted previously, longitudinal and genetic studies will be
needed to verify the continuation of what is thought of as PBD to the adult BD. They suggest
that family history does not count youth in or out for a BD diagnosis, but provides useful
information, specifically for treatment considerations since lithium response may demonstrate
heritability. They explain the most common comorbid disorders in youth are ADHD,
oppositional defiant disorder, conduct disorder, and learning disorders. The authors state that
comorbidity may complicate the diagnosis of PBD because clinicians will not see a clean-cut
version of BD and may recognize the co-occurring disorder at the exclusion of BD. They suggest
using personal baselines to differentiate (for instance) between the child’s normal level of high

20
energy/activity and his or her manic state. They also caution about symptom overlap (bipolar
depressive episode vs. unipolar and ADHD vs. mania).
Youngstrom, Findling, Youngstrom, and Calabrese (2005) recommend utilizing multi-
informant interviews or gathering collateral data (i.e. school or medical records) and specify
information to consider in a diagnostic interview for PBD. They recommend that practitioners
maintain an open stance to encountering PBD (don’t pretend it doesn’t exist at all), establish base
rates for their particular setting, and gather a detail family history. Youngstrom, et al. suggest a
truncated approach to assessment beginning with screening instruments that lead into more
focused evaluation. They endorse using information from the assessment in an actuarial
approach to estimate the individual’s odds of having the disorder. The authors advise using
multi-source/informant data, evaluating for spontaneous changes of mood, assesing for elevated
mood and grandiosity (which are symptoms that are more specific to BD than other related
symptoms like irritability and explosiveness), and engaging in ongoing assessment to the extent
possible by extending the interview over multiple sessions or throughout treatment. They
recommend continuous evaluation of key constructs during treatment and in reference to the
literature on PBD, they suggest maintaining a critical perspective because research is not uniform
with operational definitions of PBD and to stay current because the literature on PBD changes
quickly.
In Klein, Dougherty, and Olino’s (2005) review of the adolescent depression literature,
describe support for the continuity of adolescent depression into adult depression with similar
presentations between adolescents and adults. The authors note that clinicians must determine
whether MDD or DD criteria are met, rule out exclusionary diagnosis (medical conditions,
bipolar, etc.), assess symptoms that may affect treatment (i.e. suicidality), explore the previous

21
course of depression, evaluate comorbidity, and assess social functioning, family environment,
school functioning, stressors, traumas, family history, and previous treatment outcomes. They
recommend using multiple information sources and caution clinicians to be aware of the
attenuation effect (the tendency for symptom ratings to decrease with multiple assessments)
which might mimic clinical improvement during treatment. They state that assessment of
depression in children typically involves interviews and/or rating scales. They report that most
depression rating scales do not discriminate well between depression and anxiety and that there
is limited research on the incremental validity of interviews and rating scales for depression.
They note that validation of treatment utility of the instruments should be a priority, while noting
that there are few guidelines for determining clinical meaningfulness of rating scale scores to
evaluate the ongoing outcomes of treatment. They recommend using a semi-structured interview
like the K-SADS as well as using clinician and self-report rating scales for treatment evaluation.
They also recommend using parent and self-rating scales for screening, but caution against their
use in high or low base rate settings because of limited evidence of specificity and sensitivity.
Pelham, Fabiano, and Massetti (2005) discuss the evidence-based assessment of attention
deficit/hyperactivity disorder (ADHD).They reported that effective screenings for ADHD can be
made quickly and economically with parent and teacher assessments. They state that lengthy
DSM based interviews do not add any incremental validity over brief multi-informant rating
scales like the BASC (they did not review the BASC-2) and that research does not support the
notion that elaborate DSM based diagnostic interviews increase diagnostic precision. They also
explain that adding information about classroom verbal intrusions, seatwork completion and
accuracy, and evaluations of whether the child has the required supplies at school would increase
diagnostic confidence beyond multi-informant rating scales by including more objective
22
measurements. The authors state that once the diagnosis is made, assessment and treatment focus
should turn toward the child’s specific impairments and what causes, maintains, or exacerbates
them (the client in context). Ongoing assessment should not focus on the DSM’s diagnostic
criteria beyond the initial diagnosis. Pelham, Fabiano, and Massetti (2005) state that rating scales
“must be combined with a clinical interview or additional paper-and-pencil questions” (p.416) to
rule out other diagnoses. Suggestions are also made that evaluations should include ecological
areas of functioning (social relations, family relations, teacher relations, and academic progress).
They call for future research to cross-validate instruments with other demographic groupings or
samples.
McMahan and Frick (2005) summarize the research on conduct problems in adolescents
and the implications for evidence-based assessment. In this review, they recommend the BASC-2
as an assessment for conduct problems (CP) for the following purposes: a broad screener for CP
behaviors, a focused assessment of overt/covert CP, and a broad screener for comorbid
adjustment and peer interaction problems. Furthermore, they cite the BASC-2 among the few
instruments that have been used “extensively in clinical practice and research with children and
adolescents with CP” (p.481).
McMahan and Frick (2005) state, “understanding the common comorbid problems has
proven to be very important for understanding and treating children and adolescents with CP” (p.
485). They describe the primary tasks of diagnosis and screening as (1) identifying the types and
severity of the youth's problems and determine and determine associated impairments; (2)
evaluate for other impairments from other disorders; (3) determine antecedents and factors
exacerbating or contributing to the continuation of these problems; and (4) determine which
23
developmental pathway is most consistent with the youth's pattem of CP, comorbid conditions,
and risk factors.
Behavioral Assessment System for Children- second edition (BASC-2)
There is a dearth of research on Reynold and Kamphaus’s (2004) recently published
BASC-2. The literature contains many publications using the original BASC with possibly the
most recent study being completed by Evans and Oehler-Stinnett (2008). Due to the paucity of
research on the BASC-2, a complete review of this literature is possible.
In one study, Bergeron, Floyd, McCormack, and Farmer (2008) investigated the
dependability of externalizing composites and scales on the BASC-2 Teacher Report Scale-
Children (TRS-C) and the Achenbach System of Empirically Based Assessment Teacher Report
Form for Ages 6-18 (ASEBA TRF). In their study, they evaluated the variance associated with
students, raters, instruments, and occasions. The researchers had 6 teacher pairs (12 teachers
across 6 classes) rate a random set of 10 students in their classes on the BASC-2 TRS-C and the
ASEBA TRF twice over a period of 1-3 weeks. For the BASC-2 TRS-C, test-retest correlations
were all between .83 and .93, inter-rater correlations were between .72 and .79, and the
correlations with the ASEBA TRF were between .86 and .90 for the externalizing scales and
composite.
In another study, Heng and Wirrell (2006) utilized the BASC-2 Parent Report Scales,
Child and Adolescent versions (BASC-2 PRS-C and BASC-2 PRS-A respectively) in a study of
youth with migraines. The researchers investigated the between group differences (N=69) on the
BASC-2 PRS composite and subscales. The groups were composed of youth with migraines and
their siblings (as a control group) who did not have headache. The researchers found two
significant differences; the migraine group was higher on the Internalizing Composite and higher

24
on the Somatization Subscale. For the youth with migraines, the researchers found significant
correlations between total sleep disturbance scores (as measured by the Child Sleep Habits
Questionnaire) and the following BASC-2 scales and composites: Hyperactivity, Depression,
Somatization, Atypicality, Attention Problems, Adaptability, Activities of Daily Living,
Behavioral Symptoms, Externalizing Behavior, Internalizing Behavior, and Adaptability Skills.
In her review, Tan (2007) cited that the BASC-2 can “purportedly be used to assess all
aspects of the federal definition of severe emotional disturbance, to design Individualized
Education Programs (IEPs) for emotionally disturbed children in the manifestation determination
process, and to develop family service plans” (p. 121). In reviewing the reliability estimates for
scales and composites, she concluded that “individual scales should not be used for important
decisions about individual students” and that “caution should thus be exercised in using
individual scales of the PRS and SRP” (p. 122). She concluded “the psychometric properties of
the BASC-2 are adequate, and the composite scales can be used with confidence, but
interpretation of individual scales should be done with caution” (p. 124).
In my own review of the BASC-2 manual (Reynolds and Kamphaus 2004), I drew
similar conclusions to Tan’s (2007) about scale reliability estimates. Internal consistency
estimates for scales and composites in the general and clinical norm samples were nearly all
adequately high, but the composites reliabilities were consistently higher. Specifically, the scale
internal consistencies for the general sample ranged from .61 to .89 and .64 to .90 for the clinical
sample. Using Ponterotto and Ruckdeschel’s (2007) guidelines for evaluating internal
consistency alphas with samples larger than 300, the ratings would be .90 is excellent, .85 is
good, .80 is moderate, and .75 is fair. The reader can clearly see that the scale alphas ranged
from unacceptable to excellent rating categories.

25
On the other hand, the composites ranged from .83 to .95 for the general sample and .82
to .96 for the clinical sample (Reynolds and Kamphaus 2004). These values occupy rating
categories between moderate and excellent. Test-retest reliability was investigated on intervals
between 14 and 51 days for 107 adolescents with adjusted correlations ranging from .74-.84 for
composites and .61-.84 for scales, nearly identical to internal consistency values for scales, but
slightly lower for the composites. Standard error of measurement (SEM) values are statistical
replications of the internal consistency patterns, but may be easier to conceptualize because they
can be presented in Z-score units. These values range (in Z-score units) from 2.0 to 4.1 for the
general composites and 2.0 to 4.4 for the clinical composites, while the general scales range from
3.3 to 6.2 and the clinical scales range from 3.2 to 6.2. The large potential variation in Z-scores
(6.2) due to unreliability of scales provides credence to Tan’s (2007) statement that clinical
decisions should be based solely on scales, but to use the composites instead.
Weis and Smenner (2007) completed a study of the Behavioral Assessment System for
Children, Self-Report, Adolescent version (BASC SRP-A) (note, they did not use the BASC-2)
with 970 adolescents (16-18 years), 290 of them also completed the Minnesota Multiphasic
Personality Inventory, Adolescent version (MMPI-A). Of the 970 adolescents 75% were male.
Ethnicities included Caucasian (60%), Latino (24%), African American (10%), Asian American
(5%), and Native American (1%). Adolescents were being treated at two residential treatment
programs for youth with disruptive behavior problems. The reasons for referral included chronic
truancy (92%), substance abuse (75%), nonviolent antisocial behavior leading to arrest (50%),
and physical aggression leading to arrest (25%). Sixty-one % had been previously arrested and
14% had been removed from parents’ homes because of behavior problems.
26
Weis and Smenner (2007) stated “adequate fit of the proposed model to this referred
sample would support the generalizability of the factor structure and the use of its components
with disruptive youth” (p. 113). They also stated “clinically significant deviations in norm-
referenced scores would support the utility of the SRP as a means to identify at-risk youth” (p.
113). Results of a confirmatory factor analysis (CFA) supported the BASC composites, but
suggested that the Sense of Inadequacy and Locus of Control scales load on the School
Maladjustment composite and the Depression scale loads on the Clinical Maladjustment and
Personal Adjustment composites. They used Steiger’s (1980) method to test the magnitude of
correlations between scales that were theoretically similar and dissimilar; the results were mixed
for convergent and discriminant validity. They noted that the Clinical Maladjustment composite
was correlated with the MMPI-A clinical scales, but was better viewed as an “omnibus measure
of social, emotional, and behavioral dysfunction rather than as a measure of internalizing
symptoms per se” (p. 123) and that Anxiety, Depression, Somatization, and Sense of Inadequacy
scales showed the best convergent and discriminant validity. They noted the Locus of Control
scale should “be viewed as a general indicator of psychosocial distress and impairment rather
than as a measure of locus of control” (p. 124). The Personal Adjustment composite had mixed
results; the Relations with Parents scale was judged to be a “relatively pure indicator of family
conflict and disruptive behavior,” and that the Interpersonal Relations, Self-Esteem, and Self-
Reliance scales seem to measure “the absence of depression, anxiety, and social impairment” (p.
124). The researchers found little support for the convergent/ discriminant or discriminative
validity of the School Maladjustment composite; however, the Sensation Seeking scale was
judged a good measure of “impulsivity, emotionality, and extroversion” (p. 124). They then
separated the adolescents into groups based on problems at home (BASC PRS,) and problems at

27
school (BASC TRS) with scores greater than or equal to 70 clinical or less than or equal to 30
adaptive as the impaired group and less than 60 clinical or greater than 40 adaptive as normal
group.
In studies completed by Reynolds and Kamphaus (2004) the BASC-2 has demonstrated
appropriate levels of convergent and discriminant validity. Scale and composite validity was
investigated by the authors in several ways. They explored the scale intercorrelations and scale
factor groupings; correlations with other measures; and scale profiles of specific diagnostic
populations. Scale intercorrelations were in predicted directions with clinical scales being
positively related with other clinical scales and negatively related to adaptive scales.The
intercorrelations from the item development sample were submitted to confirmatory factor
analysis (CFA) and exploratory factor analysis (EFA). The authors began with a CFA model
based on the composites from the BASC, modification indexes (MIs) were used for model fit
improvements, and a 4th factor emerged for the Inattentive and Hyperactivity scales. Reynolds
and Kamphaus then used EFA to explore 3-factor and 4-factor solutions for alternative scale
groupings for composites. The authors concluded that the 4-factor CFA solution was supported
by the EFA. Correlation studies with other measures provided additional support of scale validity
for the BASC-2 SRP-A. Clinical profiles were created for several diagnostic groups: Attention-
Deficit/Hyperactivity Disorder, Bipolar Disorder, Emotional/Behavioral Disturbance, Hearing
Impairment, Learning Disability, Mental Retardation or Developmental Delay, Motor
Impairment, Pervasive Developmental Disorders, and Speech of Language Disorder. T-score
mean profiles for each group were computed based on the general combined sex norms.

28
CHAPTER 3
METHOD
Description of Sample
The data for the current study were gathered as part of the standard intake
procedures for counseling and psychological evaluation clients referred by the Department of
Juvenile Justice to the Juvenile Counseling and Assessment Program (JCAP). All youth
consented to completing a battery of intake instruments prior to initiating counseling services
with JCAP or assessment instruments as part of a psychological evaluation. The sample for the
current study included 205 adolescents with an average age of 15.42. The percentage difference
by gender was 52.2% male and 47.8% female. The data was collected either as part of an
individual counseling intake (42.0%), group counseling intake (29.3%), psychological evaluation
(25.4%) or focused data collection at a detention center (3.4%). The grade level disbursement for
the sample included 2.6% in 6th grade, 9.7% in 7th grade, 23.0% in 8th grade, 35.2% in 9th grade,
21.4% in 10th grade, 7.7% in 11th grade, and .5% in 12th grade. The clients’ self-labeled ethnicity
disbursement was 63.7% African-American, 20.4% Caucasian, 10.4% Hispanic/Latino, 1.5%
Asian-American/Pacific, 2.5% “Multiracial”, and .5% each for “Native-American-Mexican”,
“White-Mexican”, and “Caucasian-Egyptian”.
Statistical Analysis
The current study utilized a combination of techniques to evaluate the psychometric
properties of the Behavioral Assessment System for Children, Second Edition (BASC-2) and the
higher-order factor structure of its scales. Internal consistency estimates were computed for each
scale of the instrument. The item response values were set to 0=Never, 1=Sometimes, 2=Often,
3=Almost Always and 0=False, 2=True; these values are the values used by Reynolds and
29
Kamphaus (2004) in development of the BASC-2. Convergent and discriminant validity was
evaluated with correlations between the BASC-2 scales and composites with MMPI-A scales in
theoretically meaningful directions. Confirmatory factor analysis (CFA) was used to evaluate the
fit of the sample’s covariance matrix of scale scores with the proposed higher-order factor
structure of the BASC-2 (figure 1), as described by Reynolds and Kamphaus (2004). Exploratory
factor analysis (EFA) was then conducted to explore for alternative factor structures. The scale
scores of the BASC-2 represent individual first-level factors; the covariance matrix of these
scores was used for confirmatory analysis and the correlation matrix will be used for factor
exploration.
Prior to beginning factor analysis, minimum sample sizes were determined for the CFA
and the EFA based on the suggestions of (MacCallum, Widaman et al. 1999; Jackson 2001;
MacCallum, Widaman et al. 2001; Hogarty, Hines et al. 2005; Mundfrom, Shaw et al. 2005)
with good confidence that a sample of 200 response sets would be adequate for the CFA models
and to reproduce any “true” factors in the EFA. Next, the data was screened for outliers using an
SPSS macro (normtest), developed by DeCarlo (1997) and using Stem-and-Leaf plots. The score
distributions were evaluated for skew and kurtosis, followed by a review of the Kaiser-Meyer-
Olkin Measure of Sampling Adequacy (provided by SPSS) to determine if the covariance and
correlation matrices were suited for factor analysis.
Gorsuch (1983) suggested using principle axis factoring (PAF) when exploring for factor
structure and using principle component analysis when reducing the number of items or scales.
Because the current study involved an exploratory portion, PAF was used to explore alternative
factor structures. The number of factors to rotate was identified with a combination of scree plot
evaluation (Zwick & Velicer, 1986), parallel analysis (Zwick & Velicer, 1986; O’Conner, 2000),

30
simple structure, and interpretability criteria. A direct oblimin (delta=0) rotation was used and
the cut-off value for factor loadings will be set at .30.
Figure 1, Composite to Scale Relationships on BASC-2 SRP-A *Note, the dotted lines denote inverse relationships, rectangles represent scales, and ovals represent composites.
Attitude to School
Attitude to
Self‐Reliance
Sensation Seeking
Atypicality
Self‐Esteem
Interpersonal Relations
Relations with Parents
Locus of Control
Social Stress
Anxiety
Depression
Sense of
Somatization
Attention Problems
Hyperactivity
School Problems
Internalizing Problems
Inattention/ Hyperactivity
Personal Adjustment
Emotional Symptoms
School Problems
31
Instruments
The Behavioral Assessment System for Children-Second Edition (BASC-2) is a
multidimensional, multimethod assessment system for evaluating behavior and self-perceptions
of children and young adult (Reynolds and Kamphaus 2004). The BASC-2 consists of three
separate components; the rating scales, the Sturctured Developmental History (SDH) form, and
the Student Observation System (SOS) used to record classroom observations. The rating scales
consist of three versions; the Parent Rating Scale (PRS), the Teacher Rating Scale (TRS), and the
Self-Report of Personality (SRP). The system was designed to evaluate the student’s behaviors
from three perspectives; the student’s (self), the teacher’s, and the parent’s. The student’s
perspective is gathered through the SRP rating scales for ages 8-25 years (8-11, Child; 12-21,
Adolescent; and 18-25, College). The teacher’s perspective is gathered with the TRS rating
scales and the SOS observation form. The TRS has separate rating scales for preschool (ages 2-5
years), child (6-11 years), and adolescent (12-21 years). The PRS rating scale measures the
parent’s perspective along with the SDH structured background interview. The PRS scales are
seperated for age groupings like the TRS; preschool (2-5), child (6-11), and adolescent (12-21).
Within each version of the rating scales (SRP, PRS, and TRS), individual clinical, adaptive, and
composite scales provide normative comparisons of the student with peers of his/her same age.
The test authors suggest not basing diagnoses, placements, or treatments on BASC-2 results
alone. Rather, they state that “when all the BASC-2 components have been collected along with
a clinical interview and a review of school and clinical records and histories, the professional
will have the information needed for a thorough, comprehensive evaluation of behavior,
personality, and context” (pg. 7; Reynolds & Kamphaus, 2004).

32
The BASC-2 was developed to make improvements on the original BASC (Reynolds &
Kamphaus, 1992). The SRP item improvements and item development for the second-edition
were based on user feedback and review of the original scale items. Specifically, the original
BASC SRP scales tended to “contain more items, have lower reliabilities, and have more
restricted normative distributions” (p.94; Reynolds & Kamphaus, 2004). Students also were
reported to have difficulty choosing between true and false (suggesting a need for a finer
response gradation).
The authors conducted a study of the new 4-point response scale (never, sometimes,
often, almost always: N/S/O/A) for the SRP to test the appropriateness of it versus the T/F
format. They created two versions of the BASC-SRP with the only differences being in response
format (T/F or N/S/O/A) and wording of some items to accommodate the 4-point response
format (for instance if the word often was in the original question, it was removed). 131 students
participated in the study of the SRP-A and 230 participated in the SRP-C. They found internal
consistency to be highest for scales with a mixed response format (T/F and N/S/O/A) and that the
formats varied by scale for test-retest correlations; the N/S/O/A format had higher correlations
on 13 of 26 scales while the T/F had higher correlations on 12 of 26 scales. The authors
concluded that a mixed response format was the best choice.
Item selection for the BASC2-SRP-A was based on the standardization sample of 3,180
students and 256 items. To accommodate the mixed response format, the authors weighted the
T/F responses based on their overall standard deviations. They noted that on average, the T/F
standard deviations were half the size of the N/S/O/A. The selected weight resulted in a scoring
of T/F items as 2/0 and the N/S/O/A as 0/1/2/3. They stated the primary goals of the analyses as
scale reliability, distinctiveness, and interpretability. Specifically, scales should contain items

33
that represent the construct, and correlate with other scales in predicted directions. To
accomplish these goals, the authors performed scale-by-analysis and analysis of all scales
simultaneously using Confirmatory Factor Analysis (CFA) with Amos 5.0, primarily.
Scale item analysis utilized CFA and SPSS based reliability estimates. The authors
guided item-retention decisions based on item-scale correlations, standardized factor loadings,
and theory. In general, they retained items with the highest correlations, highest loadings, and if
they were conceptually good markers of the construct (i.e. illegal drug use for the Conduct
Problems scale). The remaining items were subjected to a full CFA with all scales. Each item
was allowed to load on only one scale and the modification indexes (MIs) were used to gauge the
singular fit of each item with its scale. If the MIs suggested a statistically different fit for an item,
the authors investigated the item and dropped it if it had excessive overlap with another scale or
a low loading with its own scale. The authors reported dropping less than 10% of the items on
any level of form. They also examined the readability levels of items (SRP=2nd grade) and the
bias of test items. To explore the bias, the authors used partial correlations between individual
items and the demographic groups (between females and males, and among African-American,
Hispanic, and white children), and they used Differential Item Functioning estimates; “overall
fewer than five items were removed”, (p.109).
The general norm sample for the SRP-A was representative of the US population by
gender, geographic region, ethnicity, mother’s educational level, and special education
classification. Specifically, the SRP-A general sample included 4.5% AD/HD, 3.1% EBD, 1.1%
MR, 0% PDD, 6.5% LD, and 2.2% Speech/Language. The clinical norm sample for the SRP-A
included students in Special-Education classrooms and clinics, treatment centers for youth with

34
emotional/behavioral issues, or students identified in the general sample as having a
representative issue for a total of 950 youth 12-18 years of age.
T-scores were developed for the normative samples using a linear transformation of raw
scores {LT = [50+(X-M)]/SD}. This transformation maintained the shape of the raw score
distributions, which was reasoned to be a meaningful representation of the population
distribution shape because measurement of uncommon problems often show theoretically
meaningful skew. The authors chose to use this transformation rather than an area transformation
that would have converted the shape to a normal distribution.
The Minnesota Multiphasic Personality Inventory, Adolescent version (MMPI-A) is a
478 item objective measure of personality. The items include a 2-point metric consisting of true
and false as response choices. It is a widely used assessment of adolescent psychopathology in
clinical and research settings (Butcher, Williams et al. 1992). Subjects for the instruments
normative sample were recruited at middle schools and high schools at geographical points
across the United States. The normative sample included data from California, Minnesota, New
York, North Carolina, Ohio, Pennsylvania, Virginia, and Washington state. The normative
sample was adequately stratified by ethnicity/race. The clinical sample for the instrument was
comprised of 420 boys and 293 girls in treatment facilities in the Minneapolis area,
predominately from alcohol and drug treatment facilities. The instrument derives 7 Validity
Scales, 10 Clinical Scales, 31 Clinical Subscales, 15 Content Scales, 31 Content Component
Subscales, and 11 Supplementary Scales.
Data Collection
As noted previously, the data for the current study were gathered from intake batteries
administered to prospective JCAP clients. The youths were referred for counseling services or

35
psychological evaluations by their probation officers or directly by a judge and reported to either
the Department of Juvenile Justice probation office or Juvenile Court for counseling intake
screenings for JCAP services. Psychological evaluations were conducted at the court or
probation buildings in the youth’s county or at the youth’s placement or temporary detention
facility. Counseling intakes were completed by an intake counselor with the prospective client
and guardian(s) and the psychological evaluations were completed by doctoral level students in
counseling psychology. Each youth and guardian signed consent forms for the clinical data from
the intake batteries to be used in research studies conducted by JCAP. The data is archival in
nature and was not collected for the specific purposes of the current study, but for general
research and evaluative studies within JCAP.
Data screening included evaluating validity scores for assessment instruments, screening
for outliers, distribution normality for skew and kurtosis, identification status of CFA models,
and for the EFA the Kaiser-Meyer-Olkin Measure of Sampling Adequacy was also used. Cut-off
scores for validity on the SRP-A were reported in the manual (Reynolds & Kamphaus, 2004) as
the following table. A combination of V, and L values were used in determining if the scores
from a particular administration were valid. A set of scores on the SRP-A was deemed invalid if
it had both a 4 and higher on scale V and a 12 and higher on scale L. The cut-off validity scores
for the MMPI-A were 66 and above for scale L, 90 and above for scale F, and 80 and above for
VRIN and TRIN.
Screening for outliers involved investigating skew, kurtosis, and the distributions of each
variable. A cut-off score of 7 was used for skew and kurtosis. As can be seen in the following
table, most variables demonstrated very low values. Atypicality and Interpersonal Relations were
the only variables in which kurtosis was higher than 2, but no variable demonstrated skew or
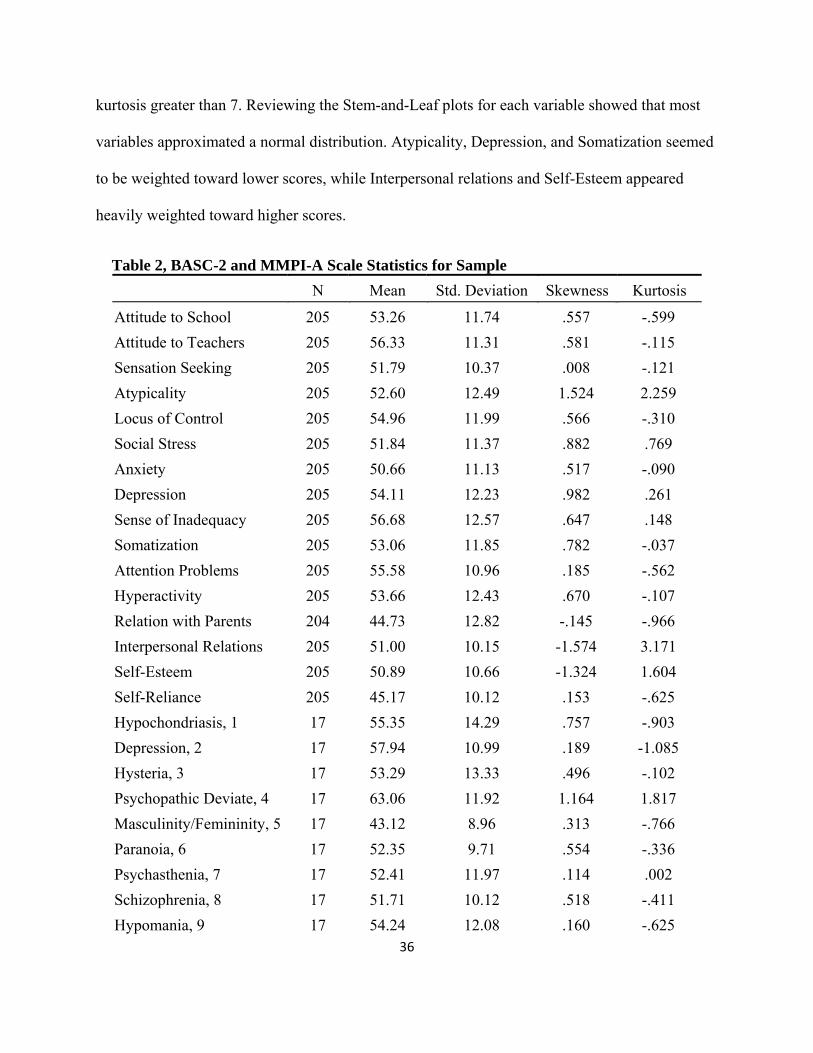
36
kurtosis greater than 7. Reviewing the Stem-and-Leaf plots for each variable showed that most
variables approximated a normal distribution. Atypicality, Depression, and Somatization seemed
to be weighted toward lower scores, while Interpersonal relations and Self-Esteem appeared
heavily weighted toward higher scores.
Table 2, BASC-2 and MMPI-A Scale Statistics for Sample N Mean Std. Deviation Skewness Kurtosis
Attitude to School 205 53.26 11.74 .557 -.599 Attitude to Teachers 205 56.33 11.31 .581 -.115 Sensation Seeking 205 51.79 10.37 .008 -.121 Atypicality 205 52.60 12.49 1.524 2.259 Locus of Control 205 54.96 11.99 .566 -.310 Social Stress 205 51.84 11.37 .882 .769 Anxiety 205 50.66 11.13 .517 -.090 Depression 205 54.11 12.23 .982 .261 Sense of Inadequacy 205 56.68 12.57 .647 .148 Somatization 205 53.06 11.85 .782 -.037 Attention Problems 205 55.58 10.96 .185 -.562 Hyperactivity 205 53.66 12.43 .670 -.107 Relation with Parents 204 44.73 12.82 -.145 -.966 Interpersonal Relations 205 51.00 10.15 -1.574 3.171 Self-Esteem 205 50.89 10.66 -1.324 1.604 Self-Reliance 205 45.17 10.12 .153 -.625 Hypochondriasis, 1 17 55.35 14.29 .757 -.903 Depression, 2 17 57.94 10.99 .189 -1.085 Hysteria, 3 17 53.29 13.33 .496 -.102 Psychopathic Deviate, 4 17 63.06 11.92 1.164 1.817 Masculinity/Femininity, 5 17 43.12 8.96 .313 -.766 Paranoia, 6 17 52.35 9.71 .554 -.336 Psychasthenia, 7 17 52.41 11.97 .114 .002 Schizophrenia, 8 17 51.71 10.12 .518 -.411 Hypomania, 9 17 54.24 12.08 .160 -.625
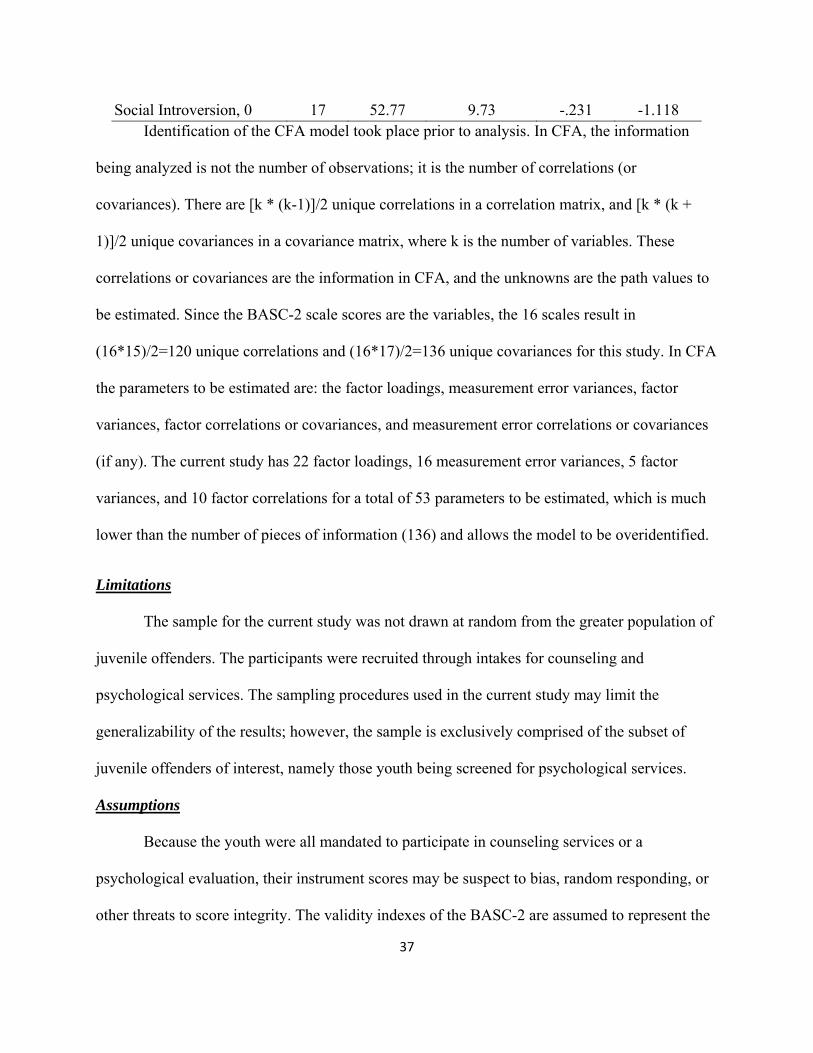
37
Social Introversion, 0 17 52.77 9.73 -.231 -1.118 Identification of the CFA model took place prior to analysis. In CFA, the information
being analyzed is not the number of observations; it is the number of correlations (or
covariances). There are [k * (k-1)]/2 unique correlations in a correlation matrix, and [k * (k +
1)]/2 unique covariances in a covariance matrix, where k is the number of variables. These
correlations or covariances are the information in CFA, and the unknowns are the path values to
be estimated. Since the BASC-2 scale scores are the variables, the 16 scales result in
(16*15)/2=120 unique correlations and (16*17)/2=136 unique covariances for this study. In CFA
the parameters to be estimated are: the factor loadings, measurement error variances, factor
variances, factor correlations or covariances, and measurement error correlations or covariances
(if any). The current study has 22 factor loadings, 16 measurement error variances, 5 factor
variances, and 10 factor correlations for a total of 53 parameters to be estimated, which is much
lower than the number of pieces of information (136) and allows the model to be overidentified.
Limitations
The sample for the current study was not drawn at random from the greater population of
juvenile offenders. The participants were recruited through intakes for counseling and
psychological services. The sampling procedures used in the current study may limit the
generalizability of the results; however, the sample is exclusively comprised of the subset of
juvenile offenders of interest, namely those youth being screened for psychological services.
Assumptions
Because the youth were all mandated to participate in counseling services or a
psychological evaluation, their instrument scores may be suspect to bias, random responding, or
other threats to score integrity. The validity indexes of the BASC-2 are assumed to represent the

38
youth’s appropriateness in responding. The youth in the current study, although a subset of
juvenile offenders receiving mental health services in the southeast, are assumed to be
representative of the greater population of juvenile offenders who may be screened for mental
health services.
Hypotheses
The general hypothesis involved the validity of the BASC-2 in the Juvenile Offender
population and led to specific questions. Will the BASC-2 scales demonstrate adequate levels of
internal consistency in the current sample? Will the BASC-2 scales correlate in theoretically
predicted directions within its own scales and with the scales of the MMPI-A? Will the higher-
order factor structure be confirmed in the current study? Will alternative higher-order factors
emerge that explain the inter-scale correlations of the BASC-2 within a juvenile offender
sample? If factors emerge, will they be conceptually different than the BASC-2 composites? If
the factors are conceptually different, will they be a better fit for the data than the composites in
a separate sample using CFA?
Null Hypothesis 1: The BASC-2 scales will not demonstrate adequate levels of internal
consistency in the current sample
Null Hypothesis 2: The BASC-2 scales will not correlate in theoretically predicted
directions within its own scales.
Null Hypothesis 3: The BASC-2 scales will not correlate in theoretically predicted
directions with the scales of the MMPI-A.
Null Hypothesis 4: The higher-order factor structure will not be confirmed in the sample.
Null Hypothesis 5: No alternative higher-order factors will emerge to explain the inter-
scale correlations of the BASC-2 within a juvenile offender sample.
39
CHAPTER 4
Results
Reliability
Null Hypothesis 1: The BASC-2 scales will not demonstrate adequate levels of internal consistency in the current sample.
Internal consistency is a measure of how closely or similarly each item within a defined
scale varies with the other items within that scale. The reasoning is that if the items are intended
to measure a specific construct; for instance depression, then the ratings or responses for each
item should reflect the degree to which the respondent exhibits the construct. In other words, if a
person has a high level of construct X, then his or her responses will demonstrate that level. If
the scale that measures X is internally consistent, then the value (or level) of each item response
should be relatively consistent with each other.
A high level of internal consistency is desired when attempting to measure a construct
that is clearly defined. Issues emerge when using internal consistency values absent of theory.
Consider the differences between attempting to measure a person’s school performance
(relatively objective construct) and a person’s zest for life (relatively subjective and difficult to
define in many ways). In many ways, clinical syndromes and disorders, like depression, can
manifest broadly and therefore a “tight” scale with an extremely high level of internal
consistency is not necessarily desirable in that it may only be measuring one aspect of depression
(i.e. sleep disturbance or hopelessness). Therefore, for the purposes of this study, theory in
addition to benchmark levels of internal consistency were used to evaluate the appropriateness of
the scale internal consistencies. Specifically, as suggested by Ponterotto and Ruckdeschel (2007),

40
sample size and number of items within the scales were used to identify the quality of the
coefficient alphas.
Table 3, Coefficient Alpha Classifications 7-11 Items >11 Items
Excellent .80 .85
Good .75 .80
Moderate .70 .75
Fair .65 .70
Coefficient alphas were calculated for each scale in the BASC-2 SRP-A (table below).
The following scales demonstrated internal consistency in the excellent range; Attitude to
School, Attitude to Teachers, Atypicality, Locus of Control, Social Stress, Anxiety, Depression,
Sense of Inadequacy, Hyperactivity, Relations with Parents, and Self-Esteem. The scales which
exhibited good consistency were Somatization and Interpersonal Relations. Attention Problems
demonstrated a moderate level of internal consistency while Sensation Seeking and Self-reliance
fell in the unsatisfactory category.
Each scale was also evaluated based on how the items functioned within the scale. The
weakest items of each scale will be the ones that correlate the least with the other items and also
least with the total score for the scale. The strongest items within each scale will be the ones that
are most correlated with the other items and with the total. Occasionally, deleting the weakest
item of a scale can increase the overall internal consistency of a scale. Also, evaluating the
difference in the interpretation of the weakest and strongest item wordings can give insight into

41
the scale itself. For instance, typically the strongest item within the scale can be viewed as the
most representative of the actual construct being measured by the scale.
Table 4, Cronbach Alpha’s for Current Study and for Normative Sample
Cronbach's
Alpha (Current)
N of Items (Current)
Cronbach’s Alpha
(Normative)
Relation with Parents .91 10 .88Depression .88 12 .86
Anxiety .85 13 .86 Self-Esteem .84 8 .82 Atypicality .84 9 .82
Social Stress .84 10 .83 Locus of Control .83 9 .78
Attitude to School .82 7 .82 Hyperactivity .82 7 .74
Attitude to Teachers .81 9 .79 Sense of Inadequacy .81 10 .79
Interp. Relations .79 7 .78 Somatization .76 7 .67
Attention Problems .71 9 .79 Sensation Seeking .64 9 .70
Self-Reliance .60 8 .70 Note, Cronbach Alphas for normative sample are as reported by Reynolds and Kamphaus (2004)
The “weakest” item within Attitude to School was item 70 with an item-total correlation
of .381 and if it were deleted from the scale, alpha would rise to .824. Item 70 reads “My school
feels good to me.” The strongest item (172) would drop alpha to .752 if it were deleted. It has an
item-total correlation of .784 and reads “I hate school.”

42
Sensation Seeking was an unsatisfactorily performing scale and it had two relatively
weak items (items 27, r = .043 and 57, r = .044), however, alpha would rise slightly more (.671
versus .652) if item 57 were dropped. These items read, respectively, “I like loud music” and “I
would rather be a police officer than a teacher.” The latter item immediately appears problematic
for a group of youth who typically have issues with police and educators. If both of these items
were dropped, alpha would rise to .690, not a large increase, but it would raise the scale from an
unsatisfactory level of consistency to a fair level of consistency. The strongest item for this scale,
item 77, reads “I like it when my friends dare me to do something.” If it were deleted, alpha
would drop to .559.
One item in particular in the Atypicality scale, item 149, had a miserable item-total
correlation (r = .212) and would raise alpha to .849 if it were dropped. This item reads “Someone
else controls my thoughts.” The strongest item (122) correlated at .733 with the total, reads, “I
hear voices in my head that no one else can hear,” and seems to be a more face valid description
of the clinical definition of Atypicality. If this item was removed, alpha would drop to .803.
Alpha would rise just barely to .878 if item 3 were deleted from the Depression scale.
This item correlated with total at .393 and reads “Nothing goes my way.” The strongest item (33,
“Nobody ever listens to me.”) would drop alpha to .859 if deleted and had an item-total
correlation of .743. On the Somatization scale, deleting item 4 (r = .349, “My muscles get sore a
lot.”) would increase alpha to .762. The deletion of the strongest item within this scale (99, r =
.590, “I feel dizzy.”) would result in dropping alpha to .710. Deleting item 95 (r = .180, “I listen
when people are talking to me.”) would raise alpha for Attention Problems to .722. Deletion of
the strongest item (143, r = .561, “I have trouble paying attention to what I am doing.”) would
drop alpha to .656. Dropping item 118 (r = .334, “I talk while other people are talking.”) from
43
scale Hyperactivity would raise alpha to .822. Deleting the strongest item (124, r = .674, “I have
trouble sitting still.”) would drop alpha to .769. Within scale Self-Esteem, one item in particular
performed much worse than the other items. Item 104 (r = .062, “I am good at things.”) could
increase alpha to .887 if deleted. The strongest item of this scale (74, r = .741, “I like the way I
look.”) would reduce alpha to .802 if deleted.
Several of the scales demonstrated relatively consistent item performance. Essentially,
these scales did not have any absolute standout items as being weak or strong. This is most
obvious when the coefficient alpha drops with the deletion of any individual item. This was the
case for Attitude to Teachers, Locus of Control, Social Stress, Anxiety, Sense of Inadequacy,
Relationship with Parents, Interpersonal Relations, and Self-Reliance.
Item 145 (“My teacher is proud of me.”) was technically the weakest item within the
Attitude to Teachers scale. It correlated with the scale total at .410, but if it were dropped, alpha
would actually drop slightly to .804. In fact, all items within this scale would drop alpha if
removed. Item 85, with an item-total correlation of .564 would drop alpha to .785 if removed. It
reads “ My teacher trusts me.”
Within the scale, Locus of Control, no single item functioned particularly poorly and
dropping any of the items would result in a drop in alpha. The weakest item (36) reads “My
parents have too much control over my life,” had an item-total correlation of .406, and would
drop alpha slightly to .830. The strongest item (66, “My parents blame too many of their
problems on me.”) would drop alpha to .801 and had an item-total correlation of .658.
Dropping any of the items within Social Stress would result in a drop in a reduction in
internal consistency. The weakest item (165, “I feel that others do not like the way I do things”)
would drop alpha to .829 and had an item-total correlation of .456, while the strongest item (116,
44
“I am left out of things.”) correlated with the total at .678 and would drop alpha to .813 if
deleted. The weakest item in Anxiety (20, “I worry about little things.”) would drop alpha to .847
and the strongest (110, “I worry, but I don’t know why.”) would drop it to .828. The item-total
correlations for these items, respectively, were .373 and .647.
All item deletions within Sense of Inadequacy would reduce alpha. The weakest item-
total correlation (r = .347) was for item 30 (“I cover up my work when the teacher walks by.”)
Deleting this item would drop alpha to .810, while dropping item 120 (r = .640, “I want to do
better, but I can’t.”) would result in alpha = .776.
Deleting any of the items from scale Relationship with Parents will reduce alpha. The
smallest drop in alpha (.910) would come from deleting item 132 (r = .542, “My mother and
father like my friends.”) and the largest drop in alpha (.895) would result from deleting item 126
(r = .797, “My parents are easy to talk to.”).
Interpersonal Relations presents no item deletions that could result in an increase in
alpha. The weakest item (13, r = .433) would reduce alpha to .775 and the strongest item (43, r =
.599) would reduce alpha to .751. These items read, respectively, “My classmates don’t like me”
and “Other children don’t like to be with me.”
In terms of internal consistency, Self-Reliance was the worst performing scale, but no
item deletions would result in an increase in alpha. The worst performing item (46) would only
slightly reduce alpha (.595) if it were deleted and the strongest item (123) would reduce alpha to
.500 if deleted. The item-total correlations of this items were .181 and .508, respectively, and
read “I can handle most things on my own” and “I am good at making decisions.”
45
Validity
Null Hypothesis 2: The BASC-2 scales will not correlate in theoretically predicted directions within its own scales.
The scales within an instrument, like the BASC-2, often measure various dimensions of a
broader construct. In the case of the BASC-2 SRP-A, the scales are multidimensional
representations of the youths personality and behavioral functioning. It contains both clinical and
adaptive scales that would be predicted to correlate negatively with each other. Also, it would be
expected that the scales which purport to measure aspects of a particular higher-order construct
(i.e. the composites) would correlate more highly than scales which measure drastically different
higher-order constructs. Inter-scale correlations were computed between all scales of the BASC-
2 (see table below).
The adaptive scales and the clinical scales appear, for the most part, to be negatively
correlated, as predicted. All of the significant correlations between clinical and adaptive scales
were in the negative direction except for one, rs-r,ss = .227, p<.001. this correlation between Self-
Reliance and Sensation Seeking represents two scales that do not absolutely dictate adaptive or
clinical polarities. For instance, being high in Sensation Seeking is not as “clinical” as being, for
example, high in Depression. The same holds for Self-Reliance and therefore it is understandable
that these two scales did not show a discernable pattern of correlations across any of the scales.
Self-Reliance didn’t relevantly correlate with any other scale and Sensation Seeking, for
example, had 10 scale correlations under .30, 8 under .20, and 3 under .05. It’s highest
correlation, r = .484, p<.001, was with Hyperactivity and is likely the most appropriate scale, of
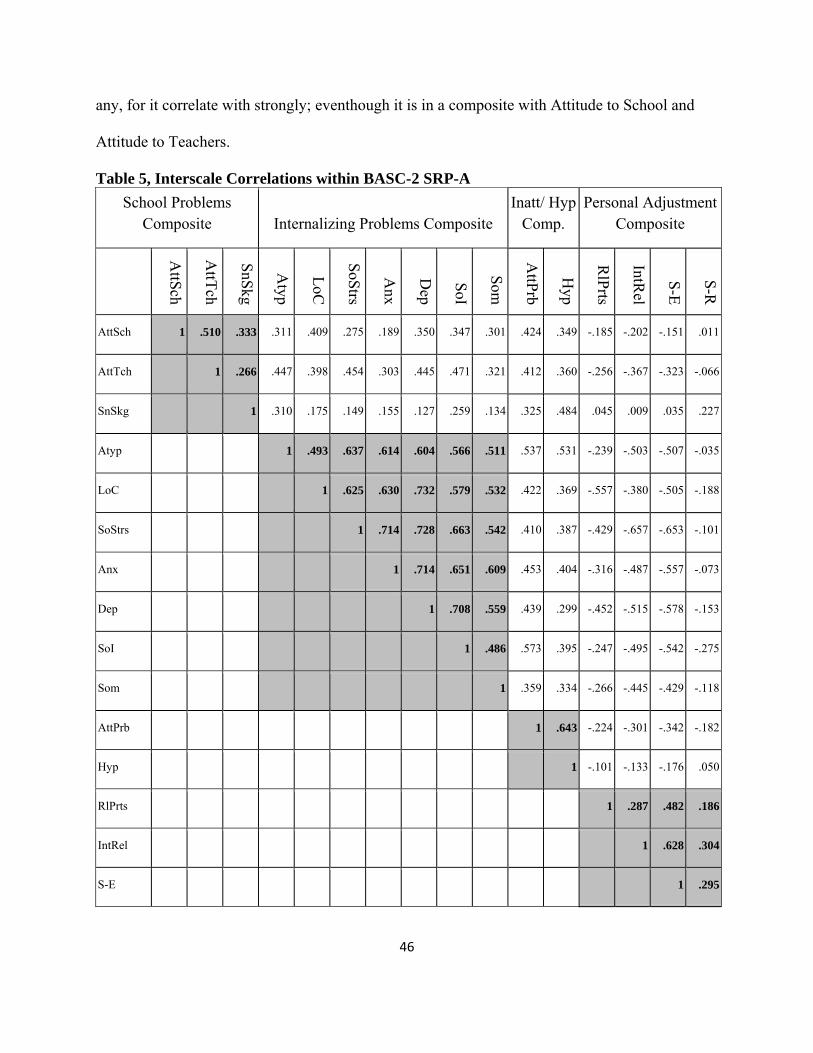
46
any, for it correlate with strongly; eventhough it is in a composite with Attitude to School and
Attitude to Teachers.
Table 5, Interscale Correlations within BASC-2 SRP-A School Problems
Composite Internalizing Problems Composite Inatt/ Hyp
Comp. Personal Adjustment
Composite
AttSch
AttTch
SnSkg
Atyp
LoC
SoStrs
Anx
Dep
SoI
Som
AttPrb
Hyp
RlPrts
IntRel
S-E
S-R
AttSch 1 .510 .333 .311 .409 .275 .189 .350 .347 .301 .424 .349 -.185 -.202 -.151 .011
AttTch 1 .266 .447 .398 .454 .303 .445 .471 .321 .412 .360 -.256 -.367 -.323 -.066
SnSkg 1 .310 .175 .149 .155 .127 .259 .134 .325 .484 .045 .009 .035 .227
Atyp 1 .493 .637 .614 .604 .566 .511 .537 .531 -.239 -.503 -.507 -.035
LoC 1 .625 .630 .732 .579 .532 .422 .369 -.557 -.380 -.505 -.188
SoStrs 1 .714 .728 .663 .542 .410 .387 -.429 -.657 -.653 -.101
Anx 1 .714 .651 .609 .453 .404 -.316 -.487 -.557 -.073
Dep 1 .708 .559 .439 .299 -.452 -.515 -.578 -.153
SoI 1 .486 .573 .395 -.247 -.495 -.542 -.275
Som 1 .359 .334 -.266 -.445 -.429 -.118
AttPrb 1 .643 -.224 -.301 -.342 -.182
Hyp 1 -.101 -.133 -.176 .050
RlPrts 1 .287 .482 .186
IntRel 1 .628 .304
S-E 1 .295

47
S-R 1
Attitude to Teachers and Attitude to School correlated with each other as expected, r =
.510, p<.001. They did not correlate as well with Sensation Seeking, as mentioned previously.
The Internalizing Problems Composite demonstrated all positive and significant correlations
between the scales. The interscale correlations ranged from .486 to .714. Attention Problems and
Hyperactivity correlated well, as expected, r = .643, p<.001. The scales within the Personal
Adjustment Composite were mixed. They were all positive and significant, but the magnitude
was not as great as would be hoped with three of the six correlations being below .30 and one
was just barely greater than .30.
Null Hypothesis 3: The BASC-2 scales will not correlate in theoretically predicted directions with the scales of the MMPI-A.
The MMPI-A is one of the most widely used personality assessment instrument.
Correlating the scales from the BASC-2 with the scales of the MMPI-A can give insight into
how well the BASC-2 is measuring the constructs which are similar to the constructs measured
by the MMPI-A. Essentially, if two scales that purport to measure the same or similar construct
correlate strongly with each other, it provides confidence that they are valid measurements of
that particular construct. The table below presents the correlations, note that shaded areas are
broadly expected correlations and the highlighted cells are specifically expected correlations.
In general, it was expected that the scales within the School Problems and
Inattentive/Hyperactive Composites would correlate positively with the externalizing scales
involving impulse control and emotional lability (i.e. scales 4 and 9). It was also expected that
the Personal Adjustment Composite scales would negatively correlate with all scales and the

48
Internalizing Problems scales would correlate positively with the more internalizing scales
(scales 1-3 and 6-8). Specific correlations were expected to be positive between Sensation
Seeking and scale 9; Atypicality and scale 8; Anxiety and scales 3, 6, and 7; Depression and
scale 2; Somatization and scales 1 and 3; and the Personal Adjustment scales and scale 4.
Table 6, BASC-2 SRP-A Correlations with MMPI-A
Hypo, 1
Dep, 2
Hyst, 3
Psych Dev, 4
Masc/Fem
, 5
Paran, 6
Psychasth, 7
Schiz, 8
Hypom
an, 9
Soc Intr, 0
AttSch .297 -.112 .182 .286 .199 .127 .119 .348 .297 .081
AttTch .219 -.045 .233 .094 .025 .153 .227 .268 .038 .090
SnSkg .087 -.410 -.058 -.166 -.340 .222 .139 .307 .574* -.289
Atyp .613** .490* .567* .664** .414 .581* .513* .746** .231 .096
LoC .411 .391 .475 .702** .605* .520* .386 .613** .128 .283
SoStrs .526* .588* .632** .873** .515* .623** .469 .585* .029 .188
Anx .463 .638** .504* .809** .661** .602* .509* .595* .112 .240
Dep .396 .642** .504* .754** .517* .770** .478 .551* -.074 .220
SoI .218 .393 .299 .651** .237 .645** .379 .539* .201 -.023
Som .559* .449 .663** .647** .417 .528* .524* .680** .239 .236
AttPrb .242 .216 .059 .196 -.283 .407 .576* .476 .194 .309
Hyp .389 .035 .061 .097 -.041 .213 .490* .546* .283 .235
RlPrts -.412 -.466 -.490* -.664** -.423 -.374 -.361 -.265 .177 -.310
IntRel -.374 -.666** -.571* -.798** -.484* -.545* -.320 -.381 .154 -.261

49
S-E -.487* -.741** -.688** -.838** -.521* -.640** -.445 -.444 .184 -.284
S-R -.314 -.396 -.166 -.442 .052 -.565* -.721** -.566* -.391 -.485*
As the table shows, the “externalizing” scales of the BASC-2 did not correlate well with
the predicted scales (4 and 9) on the MMPI-A. The general expectation that the “internalizing”
scales would correlate with scales 1-3 and 6-8 was confirmed quite well. Finally, the expectation
that the “adaptive” scales would correlate negatively with all MMPI-A scales was very well
supported.
In evaluating the specific correlations expected to occur, it can be noticed that all were in
the predicted direction and of relevant magnitude. Although the sample size was very small
(n=17), all but one correlation (Self-Reliance/Scale 4, r = -.442, p>.05) reached statistical
significance. Sensation Seeking and scale 9 (Hypomania), r = .574; (r = .574); Anxiety and scale
3 (Hysteria), r = .504; Anxiety and scale 6 (Paranoia), r = .602; Anxiety and scale 7
(Psychasthenia), r = .509; and Somatization and scale 1 (Hypochondriasis), r = .559 were all
significant at p< .05. The remaining correlations: Atypicality and scale 8 (Schizophrenia), r =
.746; Depression and scale 2 (Depression), r = .642; Somatization and scale 3 (Hysteria), r =
.663; Relation with Parents and scale 4 (Psychopathic Deviate), r = -.664; Interpersonal Relations
and scale 4 (Psychopathic Deviate), r = -.798; and Self-Esteem and scale 4 (Psychopathic
Deviate), r = -.838 were all significant at p < .01.
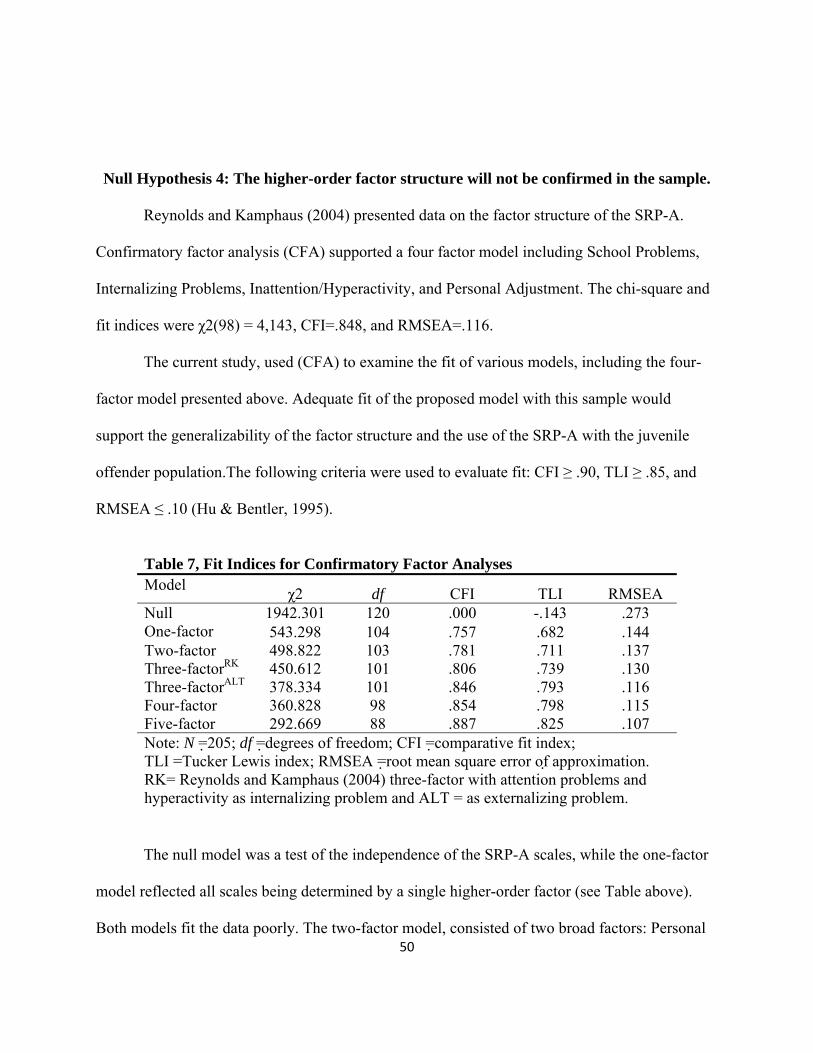
50
Null Hypothesis 4: The higher-order factor structure will not be confirmed in the sample.
Reynolds and Kamphaus (2004) presented data on the factor structure of the SRP-A.
Confirmatory factor analysis (CFA) supported a four factor model including School Problems,
Internalizing Problems, Inattention/Hyperactivity, and Personal Adjustment. The chi-square and
fit indices were χ2(98) = 4,143, CFI=.848, and RMSEA=.116.
The current study, used (CFA) to examine the fit of various models, including the four-
factor model presented above. Adequate fit of the proposed model with this sample would
support the generalizability of the factor structure and the use of the SRP-A with the juvenile
offender population.The following criteria were used to evaluate fit: CFI ≥ .90, TLI ≥ .85, and
RMSEA ≤ .10 (Hu & Bentler, 1995).
Table 7, Fit Indices for Confirmatory Factor Analyses Model χ2 df CFI TLI RMSEA Null 1942.301 120 .000 -.143 .273 One-factor 543.298 104 .757 .682 .144 Two-factor 498.822 103 .781 .711 .137 Three-factorRK 450.612 101 .806 .739 .130 Three-factorALT 378.334 101 .846 .793 .116 Four-factor 360.828 98 .854 .798 .115 Five-factor 292.669 88 .887 .825 .107 Note: N =205; df =degrees of freedom; CFI =comparative fit index; TLI =Tucker Lewis index; RMSEA =root mean square error of approximation. RK= Reynolds and Kamphaus (2004) three-factor with attention problems and hyperactivity as internalizing problem and ALT = as externalizing problem.
The null model was a test of the independence of the SRP-A scales, while the one-factor
model reflected all scales being determined by a single higher-order factor (see Table above).
Both models fit the data poorly. The two-factor model, consisted of two broad factors: Personal

51
Maladjustment and Personal Adjustment. This model loaded all of the scales whose elevations
suggest clinical and behavioral problems onto the Personal Maladjustment factor and let the
loadings of the adaptive scales remain as reflections of the Personal Adjustment factor (see Table
??). The factors in this model and all subsequent multi-factor models were allowed to correlate (r
= –.796) but residuals were not. This model also fit the data poorly.
The three-factor models consisted of factors representing adjustment, externalizing, and
internalizing. The three- factorRK model represents the model as tested by Reynolds and
Kamphaus (2004) and resulted in relatively adequate fit; χ2(101) = 4,887, CFI=.821, and
RMSEA=.124. This model fit less well in the current sample than the developer’s sample.
Results showed the correlation between Externalizing Problems and Internalizing Problems was
.659. The correlation between Externalizing Problems and Personal Adjustment was -.398 and
the correlation between Internalizing Problems and Personal Adjustment was -.804.
In the other three- factorALT model, Externalizing Problems was a merge of the scales
representing the Inattention/Hyperactivity and the School Problems composites of the SRP-A,
Internalizing Problems and Personal Adjustment were not changed from the configuration of the
SRP-A. Results showed the correlation between Externalizing Problems and Internalizing
Problems was .683. The correlation between Externalizing Problems and Personal Adjustment
was -.391 and the correlation between Internalizing Problems and Personal Adjustment was -
.824. The three-factorALT model provided a borderline-acceptable fit with the data, but was a
better fit with the data (AIC = 480.334) than the other three-factorRK model (AIC = 552.612) and
the two factor model (AIC = 596.822).
The four-factor model consisted of the same factors that represent the SRP-A composites
except the cross loadings associated with the Emotional Symptoms Index were removed, leaving

52
only the main composites of School Problems, Internalizing Problems, Inattention/Hyperactivity,
and Personal Adjustment; therefore, this model is a simplified version of the SRP-A composites.
Results showed the correlation between School Problems and Internalizing Problems at .624, the
correlation between School Problems and Personal Adjustment at -.379, and the correlation
between School Problems and Inattention/Hyperactivity at .744. The correlation Internalizing
Problems with Inattention/Hyperactivity was .653 and with Personal Adjustment was -.823. The
correlation between Personal Adjustment and Inattention/Hyperactivity was -.393. The model
provided moderate fit with the data. Furthermore, the four-factor model provided better fit with
the data (AIC = 468.828) than the three-factor model (AIC = 480.334).
The five-factor model was the model as proposed within the BASC-2 SRP-A. This model
included the factors of the four-factor model, but added cross-loadings with some scales and a
fifth factor, the Emotional Symptoms Index. Because this index overlaps with the other
composites, correlation estimates will not be reported. The correlations between the other factors
are as follows; School Problems and Interpersonal Problems, r = .654; School Problems and
Personal Adjustment, r = -.481; School Problems and Inattention/Hyperactivity, r = .757;
Internalizing Problems and Personal Adjustment, r = -.481; Internalizing Problems and
Inattention/Hyperactivity, r = .673; and Personal Adjustment and Inattention/Hyperactivity, r = -
.448. This model provided borderline acceptable fit and better fit with the data (AIC = 420.669)
compared with the simplified four-factor model (AIC = 468.828) and the standardized parameter
estimates per factor can be found in table 8.

53
Table 8, Standardized Parameter Estimates for Five-factor Model
Factors
Scale Personal
Adjustment Inattention/
HyperactivityInterpersonal
Problems School
Problems
Emotional Symptoms
Index
Self-Reliance -.163 - - - .068
Self-Esteem .608 - - - .032
Interpersonal Relations .686 - - - -
Relations with Parents .515 - - - -
Hyperactivity - .774 - - -
Attention Problems - .831 - - -
Somatization - - - - -
Sense of Inadequacy - - .881 - .017
Depression - - .814 - -.010
Anxiety - - .749 - -.014
Social Stress - - .714 - -.027
Locus of Control - - .773 - -
Atypicality - - .735 - -
Sensation Seeking - - - .514 -
Attitude to Teachers - - - .673 -
Attitude to Teachers - - - .679 -

54
Null Hypothesis 5: No alternative higher-order factors will emerge to explain the inter-scale correlations of the BASC-2 within a juvenile offender sample.
To evaluate the final hypothesis, exploratory factor analysis (EFA) was used. Factors
were extracted with principle axis factoring. This was determined to be the appropriate method
of extraction because the ultimate purpose of the current study was akin to scale development
(Comrey, 1988). The scree plot, parallel analysis, simple structure, and interpretability were used
to identify the number of factors. In reviewing the scree plot, Zwick and Velicer (1986) suggest
identifying the point at which the smaller eigenvalues form a straight line and to retain the
eigenvalues falling above this line. The scree plot for the current sample (figure below)
suggested a 3-factor solution.
In a study conducted by Zwick and Velicer (1986), it was noted that parallel analysis
(PA) was highly accurate at identifying the number of factors to retain, and when in error would
have a tendency toward overestimation. A macro program written for SPSS (O'Connor, 2000)
was used to compare the actual eigenvalues for each factor to randomly generated eigenvalues.
Based on the criteria that a “real” factor must have an eigenvalue greater than the generated
eignevalue, the analysis suggested a 6-factor solution (table 9).
Principle axis factoring was conducted for 3, 4, 5, and 6 factor solutions. Since the scree
suggested a 3-factor solution and the parallel analysis (PA) suggested a 6-factor solution the
factor structure for each solution between these two values (i.e. 4 and 5 factor solutions) were
also explored. The 3, 4, 5, and 6 factor solutions were rotated as oblique because the theory
behind the scale suggested inter-factor correlations as well as a hierarchical structure of the
domains according to the composites. Each extraction was subjected to a direct oblimin (delta=0)

55
rotation and a .40 cutoff value was used for identifying salient factor loadings. Dual loadings of
.30 were allowed in an attempt to allow for the same structure to emerge as used in the SRP-A.
Table 9, Parallel Analysis Results # Factors Actual Generated
1 6.650254 .588874
2 1.472813 .473503
3 .559254 .389834
4 .506439 .314790
5 .357622 .243911
6 .241213 .183281
The 6-factor solution (78.803 % variance explained) produced one factor that was not
well-determined (only one salient loading). The 5-factor (74.541% variance explained) produced
the same one-loading (Self-Reliance) factor as the 6-factor solution. The 4-factor (69.331%
variance explained), and 3-factor (63.116%) all produced well-determined factors (generally at
least 3 loadings higher than .40, but as few as 2 allowed for the current study to allow for the
composites to emerge as in the SRP-A). Off factor loadings of .30 or higher were judged to be
potential cross-loadings and the corresponding items were evaluated for theoretical-fit.
Factor interpretability was then taken into account for each factor within each solution (3,
4, 5, and 5 factor solutions). Based on the conceptual cohesion within each factor, it was
determined that the 3-factor solution did not provide adequate interpretability. The 5 and 6-factor
solutions provided some theoretically meaningful factors, but did not reveal full well-defined
factors. The 4-factor solution presented a balance between interpretable factors and simple
structure. It also mostly recreated the scale composites per the SRP-A. Anxiety, Social Stress,

56
Atypicality, Depression, Somatization, and Sense of Inadequacy loading onto the same factor.
Attitude to School, Attitude to Teachers, and Sensation Seeking loaded onto another factor, and
Self-Esteem, Interpersonal Relations, and Self-Reliance also loaded onto one factor. Attention
Problems and Hyperactivity loaded together, but with the “school problem” scales, while Locus
of Control and Relations with Parents loaded together.
Figure 2, EFA 4-factor Structure
Attitude to School
Attitude to
Self‐Reliance
Sensation Seeking
Atypicality
Self‐Esteem
Interpersonal Relations
Relations with Parents
Locus of Control
Social Stress
Anxiety
Depression
Sense of
Somatization
Attention Problems
Hyperactivity
Factor 1
Factor 3
Factor 4
Factor 2
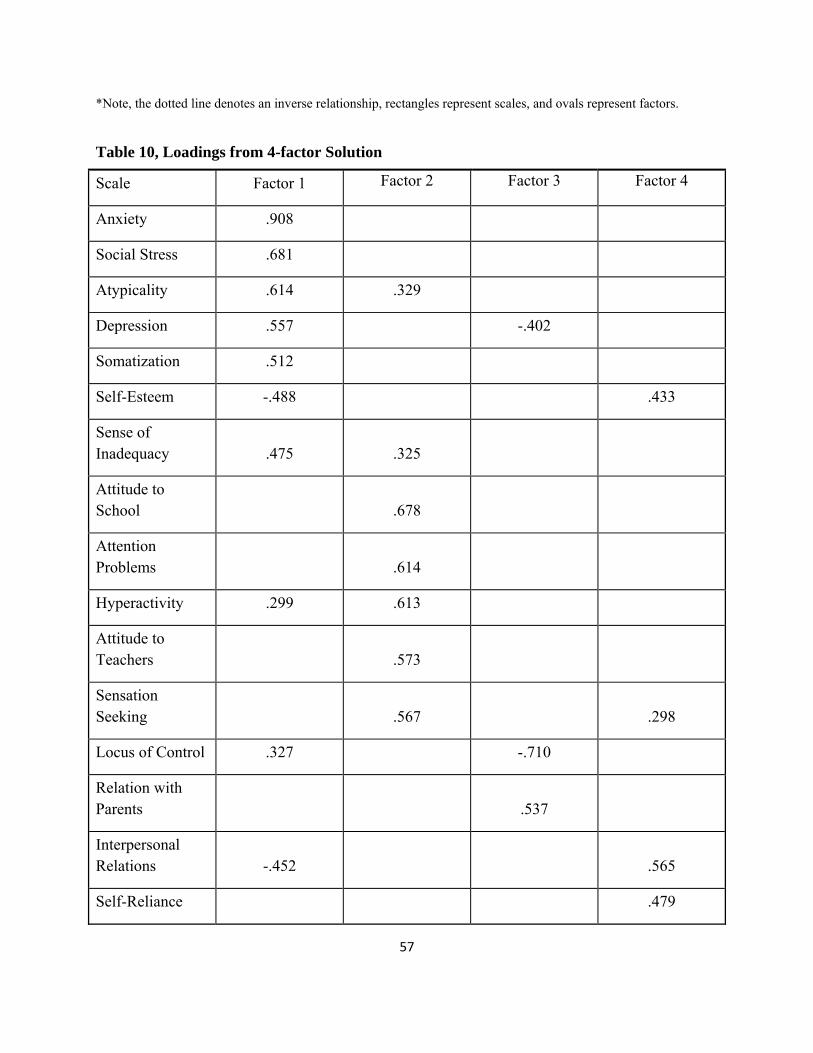
57
*Note, the dotted line denotes an inverse relationship, rectangles represent scales, and ovals represent factors.
Table 10, Loadings from 4-factor Solution
Scale Factor 1 Factor 2 Factor 3 Factor 4
Anxiety .908
Social Stress .681
Atypicality .614 .329
Depression .557 -.402
Somatization .512
Self-Esteem -.488 .433
Sense of Inadequacy .475 .325
Attitude to School .678
Attention Problems .614
Hyperactivity .299 .613
Attitude to Teachers .573
Sensation Seeking .567 .298
Locus of Control .327 -.710
Relation with Parents .537
Interpersonal Relations -.452 .565
Self-Reliance .479

58
CHAPTER 5
DISCUSSION AND SUMMARY
Summary
Assessment is integral to the practice of counseling psychologists and assessment
instruments are used for myriad purposes. For instance, Kazdin (2005) listed uses of assessments
and among the list he included: diagnosis, case formulation, screening, case identification,
treatment planning, treatment implementation, treatment progress and outcome evaluation, and
cost/benefit evaluations of the treatment.
Kazdin (2005) recommended that the purposes of each instrument be delineated and the
criteria for validation of the instrument’s use for each purpose be specified. He noted that studies
of an instrument’s psychometrics are essentially never finished. There are an infinite number of
possible studies to complete for an instrument with no definite point of “completion”. It is
important that the instruments be validated for each use to develop evidence in support of those
uses. Since validity and reliability are not properties of the instrument, but rather are aspects of
the instruments use, it becomes quite clear why Kazdin (2005) described the limit of studies as
infinite.
With the importance of assessment in various applications, the validation of an
instrument becomes necessary for effective provision of the psychological services. The
movement toward evidence-based assessment (EBA) has recently begun appearing in the
literature (Mash and Hunsley 2005). Achenbach (2005) specified that evidence for the methods

59
and measures for all assessment purposes are needed. He noted that the evidence-based treatment
(EBT) movement pushed forth without first considering how to effectively identify and measure
the problems that are to be treated and the outcomes following those treatments. Achenbach
(2005) mentioned that “without EBA, EBT may be like a magnificent house with no foundation”
and that EBA and EBT will aide in “understanding, preventing, and ameliorating child
psychopathology” (p.547).
Testing the “functioning” of instruments across populations and purposes is necessary.
In an official publication by the Office of Juvenile Justice and Delinquency Prevention, Grisso
and Underwood (2004) state “instruments that provide evidence of reliability and validity with
youth in the juvenile justice system are preferable to those that do not” (p.12). The BASC-2 is a
commonly used behavioral rating scale which has been recommended for the assessment of
conduct problems (McMahan & Frick, 2005) and demonstrates promise for effective use with
juvenile offenders, but validity studies for this purpose are lacking.
The purpose of the current study was to evaluate the validity of the BASC-2 with the
juvenile offender population. In the context of evidence-based assessment, the conditional
validation of instruments per their intended use is best-practice. Although the BASC-2 is
suggested as an appropriate broad screening measure of conduct problems, it had not been
validated for use with juvenile offenders. The current study focused on reliability, discriminant
validity, convergent validity, and the higher-order factor structure of the BASC-2 within a
sample of juvenile offenders. Results of this study have promise to impact the evidence-base of
assessment with juvenile offenders. By validating a broad screener for conduct problems and
related internalizing symptoms, the BASC-2 could aid psychologists and others involved in the
treatment, prevention, and rehabilitation of juvenile offenders.
60
Discussion of Findings
Groth-Marnat (2003) suggested evaluating an instrument in regards to its theoretical
orientation (Does the measure match its theory?), practical considerations (Are its length and
reading level appropriate?), standardization (Is the current population similar to the
standardization population?), reliability (Are reliability estimates adequate?), and validity (Will it
produce appropriate measurements within the intended use?). The current study focused on
answering the last two questions about reliability and validity. Since reliability and validity are
not properties of the instrument itself; rather properties of the specific use of that instrument, this
study evaluated them in the exact context in which the BASC-2 would be used, namely,
psychological evaluations and screening assessments.
Reliability
In the pursuit of answering the questions about reliability, this study utilized item-level
analysis of the scales within the BASC-2 SRP-A. Overall, the scales performed quite well with
11(Attitude to School, Attitude to Teachers, Atypicality, Locus of Control, Social Stress,
Anxiety, Depression, Sense of Inadequacy, Hyperactivity, Relations with Parents, and Self-
Esteem) of the 16 scales demonstrating “excellent” levels of internal consistency. Two scales
(Somatization and Interpersonal Relations) demonstrated “good” levels of internal consistency
with one scale (Sensation Seeking) in the “moderate” range and one (Self-Reliance) in the
“unacceptable” range.
Reliability of variables is important when making determinations about meaningful
differences between scores and when making interpretations of score elevations. Based on these
61
results, it is safe to say that the vast majority of scales held up very well when administered to
youth from a juvenile offender population. The scales also closely reproduced and in some cases
improved upon the coefficient alphas from the normative sample used by the test developers.
When sample sizes increase, alpha coefficients increase too, therefore, it would be expected that
the alphas from the test developers would be higher than those from the current study. For
example, Ponterotto and Ruckdeschel (2007) provide interpretive values for “excellent” levels of
internal consistency in a study with N < 100 at .75 and with N > 300 at .85, a 10 point difference
in the cutoff values. Comparing the coefficient values from the normative sample and the current
study shows that 11 of 16 scales demonstrated higher levels of internal consistency in the current
study and only four demonstrated lower alphas, one of which was only lower by .01. It can
therefore be argued that the individual scales of the BASC-2 SRP-A, when scored from
responses of juvenile offenders, performed at least as well as when administered by the test
developers to the normative sample.
Validity
The current study evaluated validity in several ways. First, convergent and discriminant
validity was evaluated with correlations between the BASC-2 and itself and with the MMPI-A.
Then CFA and EFA were used to evaluate the structure of the factors being measured by the
BASC-2. The results overall support the construct validity of the BASC-2.
Convergent validity evaluates how well a score positively correlates with a similar score,
while discriminant validity relates to a score either not correlating with a dissimilar score or
negatively correlating with an oppositely polarized score. The best convergent and discriminant
validity evidence was noted with the scales of the Internalizing Problems composite. These
scales correlated very well with each other and were appropriately negatively correlated with the
62
scales of the Personal Adjustment composite. Each of these scales also had specific scales on the
MMPI-A with which they were expected to correlate and they were all also expected to generally
correlate with the scales representing internalizing problems. The correlations supported the
validity for these scales.
The Inattention/ Hyperactivity composite provided reasonable evidence of validity and
the two scales of this composite strongly correlated with each other. The correlations with
MMPI-A scales were mixed. To start, it was difficult to specify how these scales should correlate
as there were no specific MMPI-A scales that measure attention or hyperactivity. It was
hypothesized that they would best correlate with the more externalizing, impulsive scales. Based
on this particular expectation, the BASC-2 scales did not perform adequately. In fact, the highest
correlations were found with the Psychasthenia and Schizophrenia scales.
The School Problems composite did not demonstrate correlations as expected. The two
school scales correlated well with each other, but the third scale (Sensation Seeking) of the
composite did not demonstrate strong predicted correlations within the composite, but did
demonstrate a strong correlation with Hyperactivity (theoretically meaningful, but not predicted).
When correlated with the MMPI-A, it was expected that the School Composite would correlate
with the more externalizing, impulsive, and oppositional scales. These general correlations did
not emerge, but a specifically predicted relationship emerged between Sensation Seeking and
Hypomania, providing strong convergent validity support.
Overall, reasonable evidence emerged to support the convergent and discriminant validity
of the BASC-2. The internalizing scales strongly correlated in expected directions with the
specified scales, while the other scales of the BASC-2 adequately correlated in this study. The
63
predicted correlations between BASC-2 scales and MMPI-A scales were very strong and all
emerged as predicted.
The structure of the BASC-2 was evaluated in support of its factorial validity. The SRP-
A was supported with adequate fit for the full five-factor model as proposed by Reynolds and
Kamphaus (2004). This result suggests that the scores on the SRP-A from administrations with
youth from a juvenile offender population can be meaningfully interpreted in respect to a five-
factor higher order structure. The four factor model was supported, although the five-factor was a
better fit, and the current study, surprisingly, demonstrated a better fit between the model and the
data, χ2(98) = 360.83, CFI=.854, and RMSEA=.115, than the normative sample, χ2(98) = 4,143,
CFI=.848, and RMSEA=.116, as reported by Reynolds and Kamphaus (2004).
Two alternative three factor models were tested and demonstrated moderate fit. One
model was the three-factors that Reynolds and Kamphaus (2004) proposed with Attention
Problems and Hyperactivity loading onto the Internalizing Problems composite rather than onto
their own individual composite. The other three-factor model was constructed by this writer and
included Attention Problems and Hyperactivity loading onto the School Problems composite
(renamed Externalizing Problems) because ADHD symptoms were conceptualized as more
“behavioral” than the clinical scales of the Internalizing Composite and a better conceptual fit
with the School Problems composite. Although the other three-factor was not as good of a fit for
the data, χ2(101) = 378.33, CFI=.846, and RMSEA=.116, as the four or five-factor models, it
was a much better fit than the three-factor model, χ2(101) = 450.61, CFI=.806, and
RMSEA=.130, as proposed by Reynolds and Kamphaus (2004).
The CFA, used theory to specify the models a priori and then test their fit with the data.
EFA, however, was used to explore the factorial structure suggested by the data. The best
64
balance between well-defined, interpretable factors and simple structure emerged with a four-
factor model. The data resulted in some recreations of the SRP-A composites, but the structure
did not fully re-emerge. The clinical scales of the Internalizing Problems composite almost all re-
emerged in one factor except for Locus of Control which negatively loaded onto a single factor
with Relations with Parents. The Personal Adjustment composite re-emerged except for
Relations with Parents as noted previously, the School Problems composite fully re-emerged
with additional scales (Attention Problems and Hyperactivity) as theorized in the previously
mentioned “Externalizing” composite.
Overall, the construct validity of the BASC-2 was supported by the current study.
Factorial validity emerged with adequate fit of the proposed higher-order factor structure and the
factors were mostly confirmed through exploratory analysis as well. The convergent and
discriminate validity results further support the construct validity of the SRP-A being used as a
clinical assessment instrument with the juvenile offender population.
Limitations to Internal Validity
Whenever utilizing self-report data in a study, a threat to internal validity is introduced.
The current study used two self-report measures with a population that is involved with the
justice system. Often, in situations involving legal aspects, youth may be inclined to withhold
some of their responses to appear more favorable on the instruments. The current study protected
against this by screening validity indicators from the instruments prior to analysis, but the threat
still exists.
Convergent and discriminant validity were evaluated with a small sample (n = 17) of
youth who completed both instruments. Nearly all of the specified inter-scale correlations were
significant, even with the small sample size. The results are impressive given the level of

65
correlations, but confidence in the results can be fully reached without a larger sample.
Therefore, the small sample size can provide trends for the correlations, but cannot be assumed
to be representative of the population.
Limitations to External Validity
The selection method for the current study was not randomized and the generalizability
of the results is limited to a degree by this. On the other hand, the data was gathered in the exact
manner in which it would be collected during the actual use and administration of the instrument
with this particular population. Therefore the generalizability of the results is limited in that the
selection was not randomized from with the juvenile offender population, but generalizability
was also improved because the data was gathered from the actual clinical administration of the
instrument per its intended use.
Implications for Future Research
The sample size for the current study was adequate for the analysis conducted, but a
larger sample size would provide further confidence in the results. Particularly, further research
studies could evaluate the first order factor structure of the BASC-2 SRP-A within the juvenile
offender population. The current study confirmed the scales with an evaluation of internal
consistency, but with a much larger sample (approximately 600-1,000), the first order factors
could also be confirmed. Even though the scales demonstrated excellent internal consistency for
the most part, it would be beneficial to evaluate how well the full structural model proposed by
Reynolds and Kamphaus (2004) could be confirmed within the current population. It could also
be of benefit to analyze the specific item functionings within this population to determine if any
appear inappropriate for the population.

66
The current study sought to confirm and explore the construct validity of the instrument
within the juvenile offender population. Additional research could be conducted to expand on
this study by evaluating the incremental validity. An instrument that is valid and measures what
it intends to measures is vital, but an instrument that is valid and also provides relevant
information beyond what is already available is incrementally valid. For instance, does the SRP-
A have predictive or discriminant validity? The current study did not explore these questions and
future research could extend the current results in this way.
It is also of interest as to whether the SRP-A maintains construct validity in a more
specified subsample of the juvenile offender population. Juvenile offenders are a heterogeneous
population and although they share some similarities, overall these youth can be quite different
from each other. In this light, a particular subset of the greater juvenile offender population may
be of interest for future validity studies.
Implications for Practice
The current study evaluated the validity of an instrument in clinical use with a specific
population. In this light, it is a study with a focus on providing evidence toward decisions about
using this instrument with this particular population. The results of the current study support the
use of the BASC-2 SRP-A within the juvenile offender population for the clinical purposes of
psychological evaluations and screening assessments.
The current author recommends the BASC-2 SRP-A to be used as a broad screening and
assessment instrument within the juvenile offender population. The current results provide
evidence that the factorial validity of the SRP-A is stable within this population and that the
scales and composites of the instrument are interpretable within the population. In other words,
the evidence suggests that the scales seem to be measuring what they were intended to measure
67
and that the composites are appropriate combinations of the scales. Caution should be used with
interpreting differences, elevations, or fluctuations in scores of the less reliable scales, namely
Self-Reliance and Sensation Seeking. Although evidence emerged to support the validity of these
scales, the variability within these two scales is to such a degree as to warrant caution when
determining the meaningfulness of a specific score.
The scales of the Internalizing Problems composite emerged as leaders in this instrument.
They demonstrated strong levels of internal consistency, strong inter-scale correlations, evidence
of convergent and discriminant validity, and structural consistency in the CFA and EFA. This
evidence overwhelmingly endorses the use of these scales in making clinical inferences,
diagnoses, or determinations of treatment needs. The internalizing scales are therefore strongly
recommended for clinical use.
Conclusion
The purpose of the current study was to evaluate the construct validity of the BASC-2
SRP-A when used as a broad screening instrument within the juvenile offender population.
Although the BASC-2 is suggested as an appropriate broad screening measure of conduct
problems, it had not previously been validated for use with juvenile offenders. Results of the
study support the construct validity of this instrument for this use within this population.
The scales almost all presented strong evidence of internal consistency except for Self-
Reliance and Sensation Seeking. These two scales presented marginal levels of consistency that
were unacceptable. In evaluating correlations for convergent and discriminant validity, all of the
specified individual scale to scale correlations provided strong evidence of validity. Specifically
Sensation Seeking and Hypomania; Atypicality and Schizophrenia; Anxiety and Hysteria,
Paranoia, and Psychasthenia; Depression and Depression; Somatization and Hypochondiasis and
68
Hysteria; and Relationship with Parents, Interpersonal Relations, Self-Esteem, and Self-Reliance
with Psychopathic Deviate were expected to correlate and resulted in strong correlations.
Factorial validity was supported during confirmatory and exploratory factor analysis. The
full higher-order structure of the SRP-A was confirmed as an adequate fit for the data.
Alternative models with four and three factors were found to be acceptable fits for the data, but
not as good of a fit as the full five-factor model. If the scales were to be divided into just three
factors (externalizing, internalizing, and personal adjustment) it is recommended that the
alternative model, with Attention Problems and Hyperactivity loading onto the externalizing
problems factor, be chosen over the three-factor model proposed by the test developers. During
EFA, the Internalizing Problems composite nearly completely emerged, while the externalizing
factor from the three-factor model emerged in place of the School Problems and
Inattention/Hyperactivity composites.
Overall, the BASC-2 SRP-A performed quite well within the current sample. The data for
this study was gathered during the clinical administration of the instrument and can therefore be
generalized to this use with this population. Based on the results of the current study, the SRP-A
can be recommended for use as a broad screening instrument for the juvenile offender
population.
69
References
American Psychological Association (2002). "Criteria for evaluating treatment guidelines."
American Psychologist 57(12): 1052-1059.
American Psychological Association (2006). "Evidence-Based Practice in Psychology."
American Psychologist 61(4): 271-285.
Benjamin, L. T., Jr. (2007). A brief history of modern psychology. Malden, MA, US, Blackwell
Publishing.
Bergeron, R., R. G. Floyd, et al. (2008). "The generalizability of externalizing behavior
composites and subscale scores across time, rater, and instrument." School Psychology
Review 37(1): 91-108.
Blanton, H. and J. Jaccard (2006). "Arbitrary Metrics in Psychology." American Psychologist
61(1): 27-41.
Butcher, J. N., C. L. Williams, et al. (1992). Minnesota Multiphasic Personality Inventory—
Adolescent (MMPI-A): Manual for administration, scoring, and interpretation.
Minneapolis, University of Minnesota Press.
Cicchetti, D. V. (1994). "Guidelines, criteria, and rules of thumb for evaluating normed and
standardized assessment instruments in psychology." Psychological Assessment 6(4):
284-290.
Cronbach, L. J. and P. E. Meehl (1955). "Construct validity in psychological tests."
Psychological Bulletin 52(4): 281-302.

70
DeCarlo, L. T. (1997). "On the meaning and use of kurtosis." Psychological Methods 2(3): 292-
307.
Evans, L. G. and J. Oehler-Stinnett (2008). "Validity of the OSU Post-Traumatic Stress Disorder
Scale and the Behavior Assessment System for Children Self-Report of Personality with
child tornado survivors." Psychology in the Schools 45(2): 121-131.
Federal Interagency Forum on Child and Family Statistics (2007). America’s Children: Key
National Indicators of Well-Being Washington, DC:, U.S. Government Printing Office.
Fletcher, J. M., D. J. Francis, et al. (2005). "Evidence-Based Assessment of Learning Disabilities
in Children and Adolescents." Journal of Clinical Child and Adolescent Psychology
34(3): 506-522.
Gorsuch, R. L. (1983). Factor analysis Hillsdale, N.J. :, L. Erlbaum Associates,.
Grisso, T. and L. A. Underwood (2004). Screening and Assessing Mental Health and Substance
Use Disorders Among Youth in the Juvenile Justice System. A Resource Guide for
Practitioners. Washington, DC: US, Department of Justice, Office of Justice Programs,
Office of Juvenile Justice and Delinquency Prevention.
Groth-Marnat, G. (2003). Handbook of psychological assessment (4th ed.). Hoboken, NJ, US,
John Wiley & Sons Inc.
Heng, K. and E. Wirrell (2006). "Sleep disturbance in children with migraine." Journal of Child
Neurology 21(9): 761-766.
Hogarty, K. Y., C. V. Hines, et al. (2005). "The Quality of Factor Solutions in Exploratory
Factor Analysis: The Influence of Sample Size, Communality, and Overdetermination."
Educational and Psychological Measurement 65(2): 202-226.

71
Hunsley, J. (2003). "Introduction to the Special Section on Incremental Validity and Utility in
Clinical Assessment." Psychological Assessment 15(4): 443-445.
Hunsley, J. and E. J. Mash (2007). "Evidence-based assessment." Annual Review of Clinical
Psychology 3: 29-51.
Jackson, D. L. (2001). "Sample Size and Number of Parameter Estimates in Maximum
Likelihood confirmatory factor analysis: A Monte Carlo investigation." Structural
Equation Modeling 8(2): 205-223.
Klein, D. N., L. R. Dougherty, et al. (2005). "Toward Guidelines for Evidence-Based
Assessment of Depression in Children and Adolescents." Journal of Clinical Child and
Adolescent Psychology 34(3): 412-432.
MacCallum, R. C., K. F. Widaman, et al. (2001). "Sample size in factor analysis: The role of
model error." Multivariate Behavioral Research 36(4): 611-637.
MacCallum, R. C., K. F. Widaman, et al. (1999). "Sample size in factor analysis." Psychological
Methods 4(1): 84-99.
Mash, E. J. and J. Hunsley (2005). "Evidence-Based Assessment of Child and Adolescent
Disorders: Issues and Challenges." Journal of Clinical Child and Adolescent Psychology
34(3): 362-379.
McMahon, R. J. and P. J. Frick (2005). "Evidence-Based Assessment of Conduct Problems in
Children and Adolescents." Journal of Clinical Child and Adolescent Psychology 34(3):
477-505.
Mundfrom, D. J., D. G. Shaw, et al. (2005). "Minimum Sample Size Recommendations for
Conducting Factor Analyses." International Journal of Testing 5(2): 159-168.

72
Pelham, W. E., Jr., G. A. Fabiano, et al. (2005). "Evidence-Based Assessment of Attention
Deficit Hyperactivity Disorder in Children and Adolescents." Journal of Clinical Child
and Adolescent Psychology 34(3): 449-476.
Reynolds, C. R. and R. W. Kamphaus (2004). Behavior assessment system for children
Circle Pines, MN, American Guidance Service.
Silverman, W. K. and T. H. Ollendick (2005). "Evidence-Based Assessment of Anxiety and Its
Disorders in Children and Adolescents." Journal of Clinical Child and Adolescent
Psychology 34(3): 380-411.
Smith, G. T. (2005). "On Construct Validity: Issues of Method and Measurement."
Psychological Assessment 17(4): 396-408.
Snyder, H. N. (2006). Juvenile Arrests 2004. Washington, DC: US, Department of Justice,
Office of Justice Programs, Office of Juvenile Justice and Delinquency Prevention.
Snyder, H. N. and M. Sickmund (2006). Juvenile Offenders and Victims: 2006 National Report.
Washington, DC: U.S. , Department of Justice, Office of Justice Programs, Office of
Juvenile Justice and Delinquency Prevention.
Tan, C. S. (2007). "Test Review Behavior assessment system for children (2nd ed.)." Assessment
for Effective Intervention 32(2): 121-124.
Teplin, L. A., K. M. Abram, et al. (2006). Psychiatric Disorders of Youth in Detention.
Washington DC: US, Department of Justice, Office of Justice Programs, Office of
Juvenile Justice and Delinquency Prevention.
Watkins, C. E. (1992). "Historical influences on the use of assessment methods in counseling
psychology." Counselling Psychology Quarterly 5(2): 177-188.

73
Weis, R. and L. Smenner (2007). "Construct validity of the Behavior Assessment System for
Children (BASC) Self-Report of Personality: Evidence from adolescents referred to
residential treatment." Journal of Psychoeducational Assessment 25(2): 111-126.
Youngstrom, E. A., R. L. Findling, et al. (2005). "Toward an Evidence-Based Assessment of
Pediatric Bipolar Disorder." Journal of Clinical Child and Adolescent Psychology 34(3):
433-448.
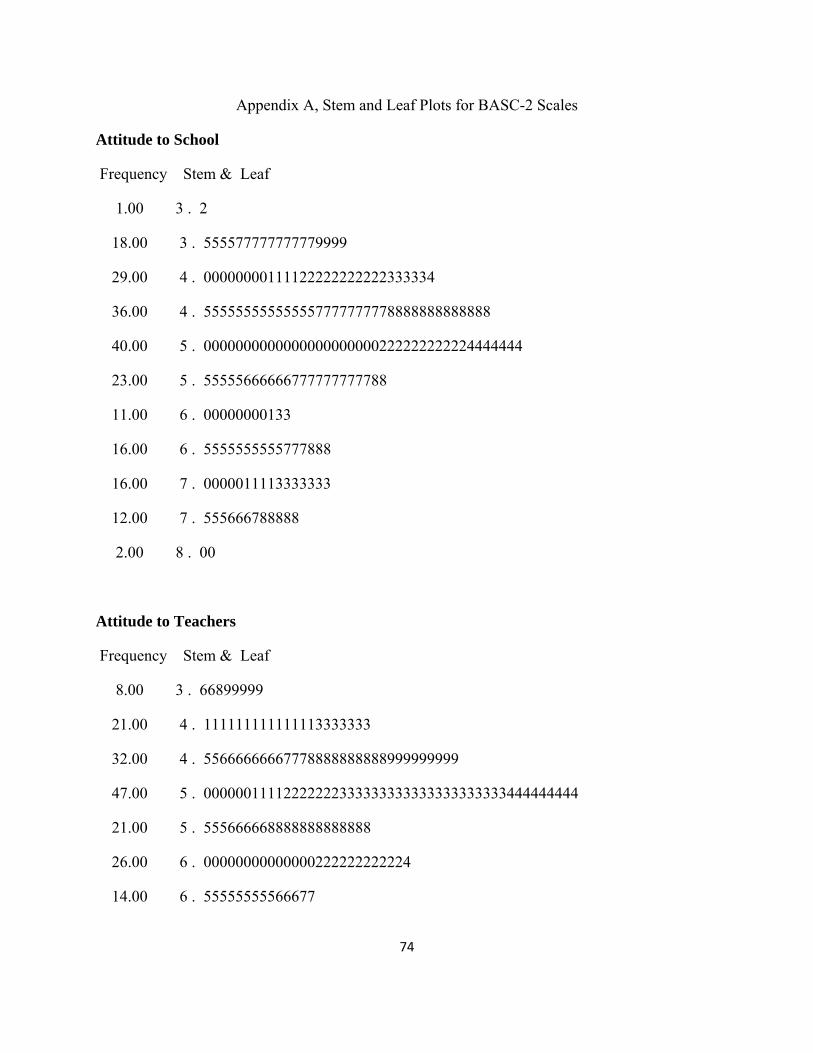
74
Appendix A, Stem and Leaf Plots for BASC-2 Scales
Attitude to School
Frequency Stem & Leaf
1.00 3 . 2
18.00 3 . 555577777777779999
29.00 4 . 00000000111122222222222333334
36.00 4 . 555555555555557777777778888888888888
40.00 5 . 0000000000000000000000222222222224444444
23.00 5 . 55555666666777777777788
11.00 6 . 00000000133
16.00 6 . 5555555555777888
16.00 7 . 0000011113333333
12.00 7 . 555666788888
2.00 8 . 00
Attitude to Teachers
Frequency Stem & Leaf
8.00 3 . 66899999
21.00 4 . 111111111111113333333
32.00 4 . 55666666667778888888888999999999
47.00 5 . 00000011112222222333333333333333333333444444444
21.00 5 . 555666668888888888888
26.00 6 . 00000000000000222222222224
14.00 6 . 55555555566677
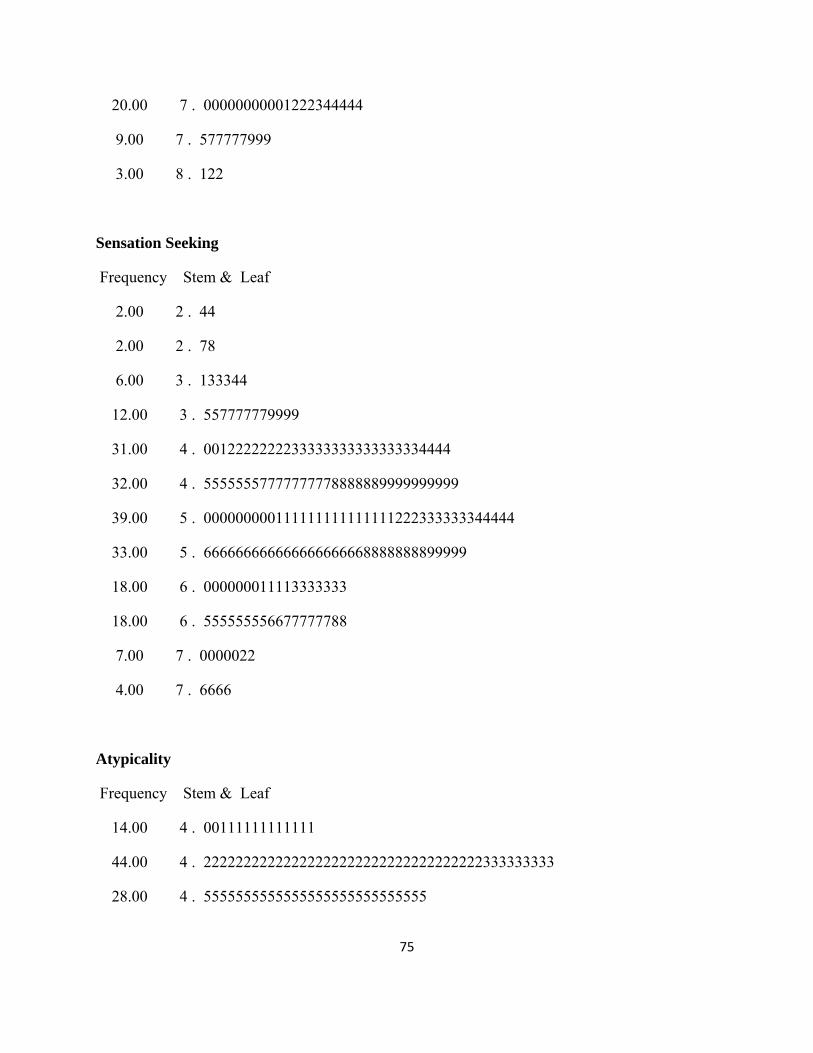
75
20.00 7 . 00000000001222344444
9.00 7 . 577777999
3.00 8 . 122
Sensation Seeking
Frequency Stem & Leaf
2.00 2 . 44
2.00 2 . 78
6.00 3 . 133344
12.00 3 . 557777779999
31.00 4 . 0012222222233333333333333334444
32.00 4 . 55555557777777778888889999999999
39.00 5 . 000000000111111111111111222333333344444
33.00 5 . 666666666666666666668888888899999
18.00 6 . 000000011113333333
18.00 6 . 555555556677777788
7.00 7 . 0000022
4.00 7 . 6666
Atypicality
Frequency Stem & Leaf
14.00 4 . 00111111111111
44.00 4 . 22222222222222222222222222222222222333333333
28.00 4 . 5555555555555555555555555555

76
2.00 4 . 66
22.00 4 . 8888888888888888888888
13.00 5 . 0000000000000
15.00 5 . 222222333333333
3.00 5 . 445
6.00 5 . 666677
9.00 5 . 899999999
4.00 6 . 1111
6.00 6 . 222223
10.00 6 . 4455555555
1.00 6 . 6
3.00 6 . 888
8.00 7 . 00000000
2.00 7 . 33
1.00 7 . 5
3.00 7 . 667
1.00 7 . 8
Locus of Control
Frequency Stem & Leaf
17.00 3 . 66666666777889999
24.00 4 . 000111111244444444444444
33.00 4 . 666666666666666666888888888888889
31.00 5 . 0000111111111111222222222333344

77
36.00 5 . 555555555555555667777777788888888888
23.00 6 . 00000002222222444444444
11.00 6 . 66667789999
10.00 7 . 0111123344
12.00 7 . 666666666888
4.00 8 . 0333
3.00 8 . 555
Social Stress
Frequency Stem & Leaf
2.00 3 . 44
22.00 3 . 5556666788888888999999
31.00 4 . 0000000000000111111333333333333
38.00 4 . 55555555555555557777777779999999999999
38.00 5 . 11111111111111111111113333333333333333
27.00 5 . 555666666666666666678888889
21.00 6 . 000000222222222444444
10.00 6 . 6666666669
5.00 7 . 01122
1.00 7 . 6
2.00 8 . 00

78
Anxiety
Frequency Stem & Leaf
8.00 3 . 22223444
27.00 3 . 555555566777777788888888899
28.00 4 . 0000011222222222222233444444
35.00 4 . 55555555555556666677777888888888888
41.00 5 . 00000000111111222333333344444444444444444
27.00 5 . 666666667778888889999999999
13.00 6 . 0011222223444
12.00 6 . 555777777778
7.00 7 . 0001233
3.00 7 . 679
2.00 8 . 00
Depression
Frequency Stem & Leaf
46.00 4 . 0000000000000000111111111111113333333333333333
46.00 4 . 5555555555555666666667777777777778888889999999
27.00 5 . 000111111111111122333333444
30.00 5 . 555555555556667778888888899999
17.00 6 . 01111111111222344
8.00 6 . 66668889
12.00 7 . 000000122223
7.00 7 . 5668888
7.00 8 . 0222233

79
Sense of Inadequacy
Frequency Stem & Leaf
.00 3 .
7.00 3 . 5555788
32.00 4 . 00000000000011222222244444444444
19.00 4 . 6666677777799999999
44.00 5 . 00000000000001111111111223344444444444444444
23.00 5 . 66666666667788888888889
29.00 6 . 00000001111111222233344444444
20.00 6 . 55555555556668888889
10.00 7 . 0000011223
7.00 7 . 5555577
3.00 8 . 134
3.00 8 . 566
Somatization
Frequency Stem & Leaf
3.00 3 . 999
61.00 4 . 0000000000000000000000000000000000000000000011233334444444444
28.00 4 . 6666666777777777777777777999
24.00 5 . 000000001122222333333334
32.00 5 . 66666666666666666666668899999999
26.00 6 . 00000222222333333333333333
9.00 6 . 566888999

80
7.00 7 . 1113334
8.00 7 . 66666777
3.00 8 . 224
3.00 8 . 677
Attention Problems
Frequency Stem & Leaf
1.00 3 . 4
15.00 3 . 556666688888889
16.00 4 . 1111111333333344
22.00 4 . 5555555556777777999999
52.00 5 . 0000000000000011111111122222222222244444444444444444
24.00 5 . 555666666666788888889999
22.00 6 . 0000000001122333333334
31.00 6 . 5555555556666666667777778888899
6.00 7 . 000222
13.00 7 . 5555567777889
2.00 8 . 02
Hyperactivity
Frequency Stem & Leaf
1.00 3 . 3
26.00 3 . 66666666666666888999999999
22.00 4 . 1111222222222233444444
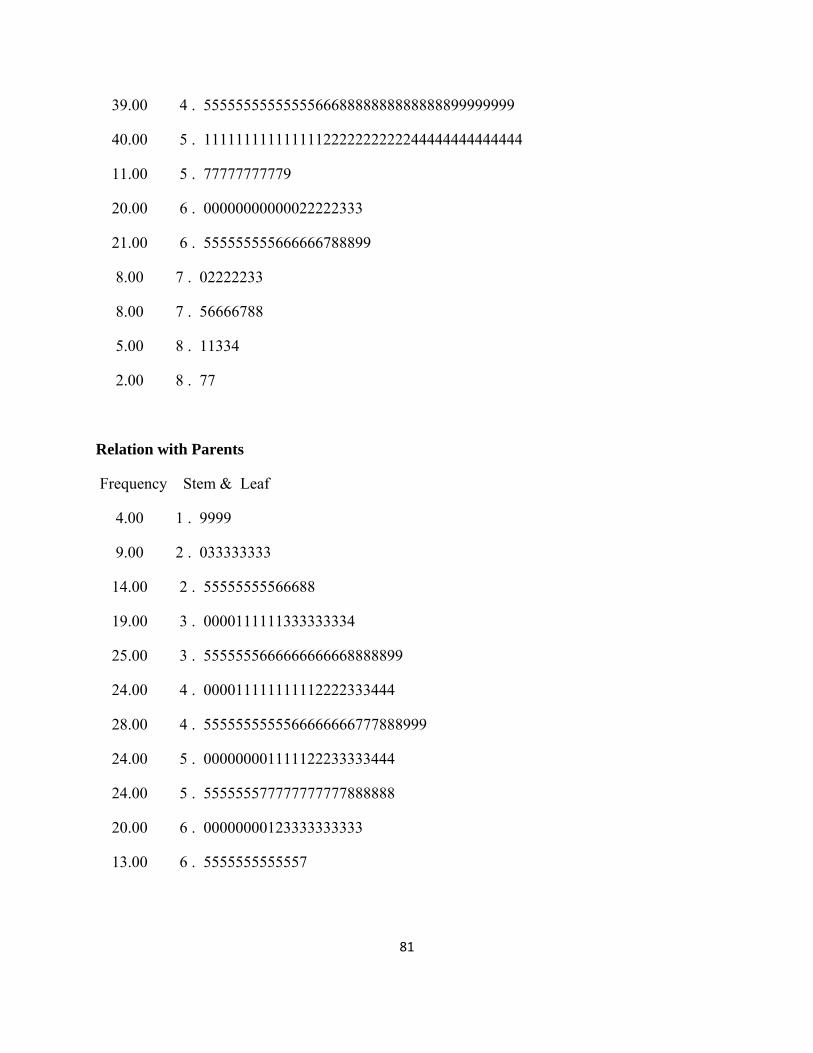
81
39.00 4 . 555555555555556668888888888888899999999
40.00 5 . 1111111111111112222222222244444444444444
11.00 5 . 77777777779
20.00 6 . 00000000000022222333
21.00 6 . 555555555666666788899
8.00 7 . 02222233
8.00 7 . 56666788
5.00 8 . 11334
2.00 8 . 77
Relation with Parents
Frequency Stem & Leaf
4.00 1 . 9999
9.00 2 . 033333333
14.00 2 . 55555555566688
19.00 3 . 0000111111333333334
25.00 3 . 5555555666666666668888899
24.00 4 . 000011111111112222333444
28.00 4 . 5555555555566666666777888999
24.00 5 . 000000001111122233333444
24.00 5 . 555555577777777777888888
20.00 6 . 00000000123333333333
13.00 6 . 5555555555557

82
Interpersonal Relations
Frequency Stem & Leaf
2.00 2 . 69
4.00 3 . 1144
9.00 3 . 566779999
16.00 4 . 2222222222222222
27.00 4 . 555555555555555555555588999
45.00 5 . 011111222222222222222222222222222333333333344
61.00 5 . 5555555555555555555555566666666666667777889999999999999999999
33.00 6 . 122222222222222222222222222222222
Self-Esteem
Frequency Stem & Leaf
2.00 2 . 33
3.00 2 . 778
6.00 3 . 033333
14.00 3 . 56667779999999
19.00 4 . 0112222222223333333
18.00 4 . 555555555557778888
33.00 5 . 000000000000222222222222222222344
51.00 5 . 555555555556666677777777777777777777777777777789999
53.00 6 . 00000000000000000000011111111111111122222222222222222
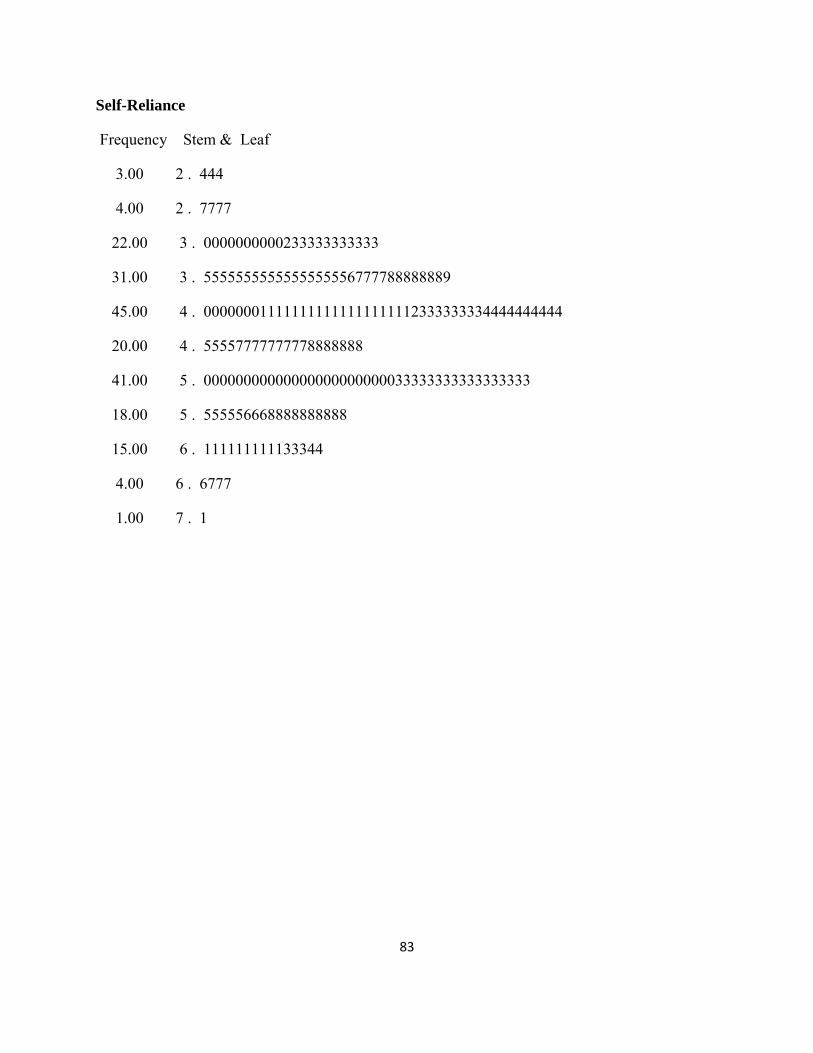
83
Self-Reliance
Frequency Stem & Leaf
3.00 2 . 444
4.00 2 . 7777
22.00 3 . 0000000000233333333333
31.00 3 . 5555555555555555556777788888889
45.00 4 . 000000011111111111111111112333333334444444444
20.00 4 . 55557777777778888888
41.00 5 . 00000000000000000000000033333333333333333
18.00 5 . 555556668888888888
15.00 6 . 111111111133344
4.00 6 . 6777
1.00 7 . 1

84
Appendix B, BASC-2 Scale Cronbach Alphas and Item-Total Correlations
Attitude to School
r = .819 Item-Total Correlation
Cronbach's Alpha if Item
Deleted
item010 .525 .804 I don't care about school.
item040 .534 .800 I don't like thinking about school.
item070 .381 .824 My school feels good to me.
item082 .688 .772 School is boring.
item112 .492 .807 I get bored in school.
item142 .552 .796 I feel like I want to quit school.
item172 .784 .752 I hate school.
Sensation Seeking
r = .638
Corrected Item-Total Correlation
Cronbach's Alpha if Item
Deleted
item027 .043 .652 I like loud music.
item047 .374 .605 I like to take chances.
item057 .044 .671 I would rather be a police officer than a teacher.
item077 .522 .559 I like it when my friends dare me to do something.
item087 .347 .605 I like to play rough sports.
item107 .291 .617 I like to experiment with new things.
item117 .359 .600 I like to ride in a car that is going fast.

85
item137 .442 .577 I like to be the first one to try new things.
item147 .442 .581 I like to dare others to do things.
Atypicality
r = .840 Corrected Item-Total Correlation
Cronbach's Alpha if Item
Deleted
item062 .458 .835 Sometimes, when alone, I hear my name.
item092 .698 .805 I feel like people are out to get me.
item100 .671 .810 Someone wants to hurt me.
item119 .495 .830 Even when alone, I feel like someone is watching me.
item122 .733 .803 I hear voices in my head that no one else can hear.
item130 .536 .825 I see weird things.
item149 .212 .849 Someone else controls my thoughts.
item152 .430 .836 I do things over and over and can't stop.
item160 .699 .807 I hear things that others cannot hear.
Depression
r = .877
Corrected Item-Total Correlation
Cronbach's Alpha if Item
Deleted
item003 .393 .878 Nothing goes my way.
item008 .504 .872 I used to be happier.
item021 .446 .875 Nothing is fun anymore.

86
item033 .743 .859 Nobody ever listens to me.
item038 .697 .860 I just don't care anymore.
item051 .622 .864 I don't seem to do anything right.
item063 .683 .863 Nothing ever goes right for me.
item068 .671 .864 Nothing about me is right.
item081 .690 .859 I feel like my life is getting worse and worse.
item093 .645 .862 I feel depressed.
item098 .477 .874 No one understands me.
item111 .433 .875 I feel sad.
Somatization
r = .759
Corrected Item-Total Correlation
Cronbach's Alpha if Item
Deleted
item004 .349 .762 My muscles get sore a lot.
item009 .485 .731 I often have headaches.
item034 .555 .712 Often I feel sick in my stomach.
item039 .452 .735 Sometimes my ears hurt for no reason.
item064 .538 .722 I get sick more than others.
item069 .450 .737 My stomach gets upset more than most people's.
item099 .590 .710 I feel dizzy.

87
Attention Problems
r = .713
Corrected Item-Total Correlation
Cronbach's Alpha if Item
Deleted
item005 .402 .685 People tell me I should pay more attention.
item035 .458 .674 I think that I have a short attention span.
item053 .544 .656 I have attention problems.
item065 .268 .709 I give up easily.
item083 .278 .707 I forget things.
item095 .180 .722 I listen when people are talking to me.
item113 .518 .661 I have trouble paying attention to the teacher.
item125 .270 .709 I pay attention when someone is telling me how to do something.
item143 .561 .656 I have trouble paying attention to what I am doing.
Hyperactivity
r = .816
Corrected Item-Total Correlation
Cronbach's Alpha if Item
Deleted
item088 .647 .775 I have trouble standing still in lines.
item118 .334 .822 I talk while other people are talking.
item124 .674 .769 I have trouble sitting still.
item134 .570 .789 I feel like I have to get up and move around.
item148 .462 .806 I talk without waiting for others to say something.
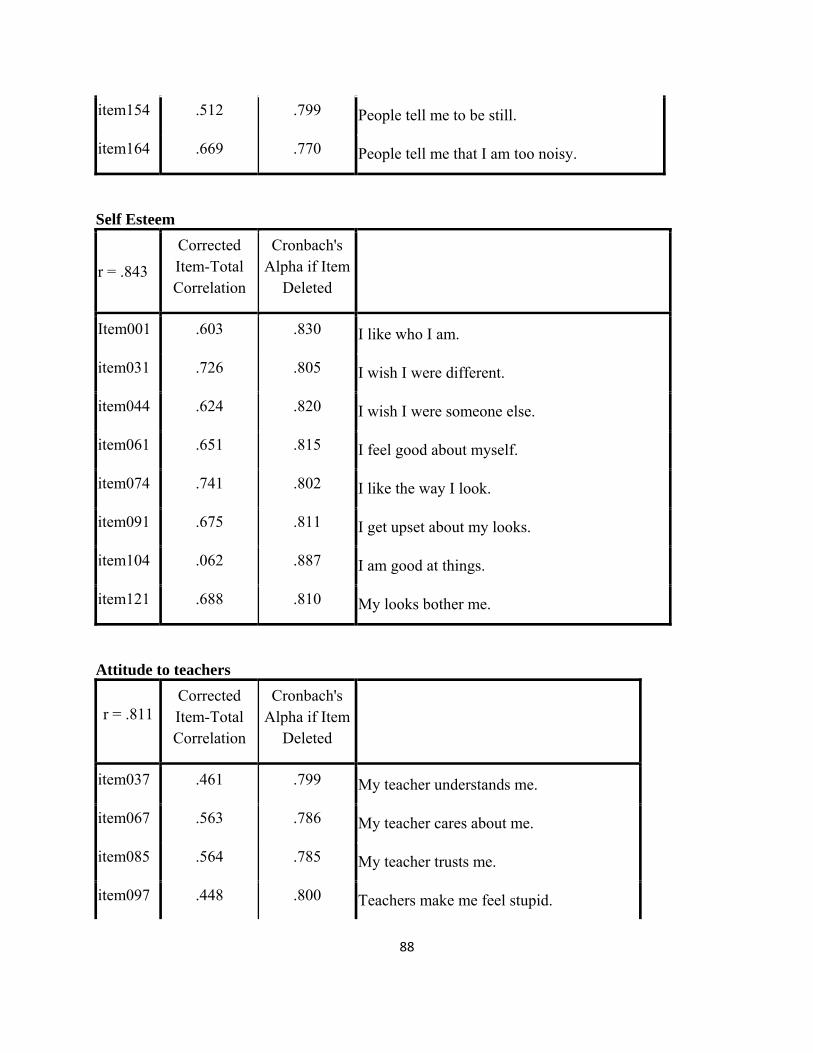
88
item154 .512 .799 People tell me to be still.
item164 .669 .770 People tell me that I am too noisy.
Self Esteem
r = .843
Corrected Item-Total Correlation
Cronbach's Alpha if Item
Deleted
Item001 .603 .830 I like who I am.
item031 .726 .805 I wish I were different.
item044 .624 .820 I wish I were someone else.
item061 .651 .815 I feel good about myself.
item074 .741 .802 I like the way I look.
item091 .675 .811 I get upset about my looks.
item104 .062 .887 I am good at things.
item121 .688 .810 My looks bother me.
Attitude to teachers
r = .811 Corrected Item-Total Correlation
Cronbach's Alpha if Item
Deleted
item037 .461 .799 My teacher understands me.
item067 .563 .786 My teacher cares about me.
item085 .564 .785 My teacher trusts me.
item097 .448 .800 Teachers make me feel stupid.
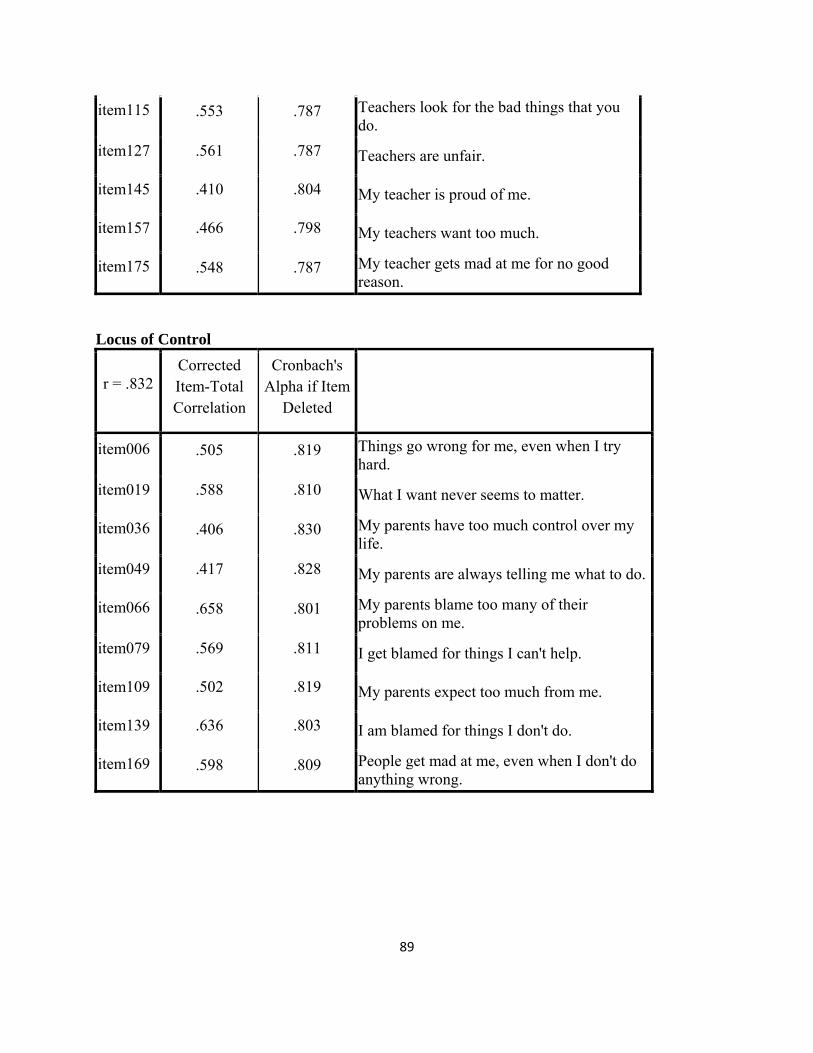
89
item115 .553 .787 Teachers look for the bad things that you do.
item127 .561 .787 Teachers are unfair.
item145 .410 .804 My teacher is proud of me.
item157 .466 .798 My teachers want too much.
item175 .548 .787 My teacher gets mad at me for no good reason.
Locus of Control
r = .832 Corrected Item-Total Correlation
Cronbach's Alpha if Item
Deleted
item006 .505 .819 Things go wrong for me, even when I try hard.
item019 .588 .810 What I want never seems to matter.
item036 .406 .830 My parents have too much control over my life.
item049 .417 .828 My parents are always telling me what to do.
item066 .658 .801 My parents blame too many of their problems on me.
item079 .569 .811 I get blamed for things I can't help.
item109 .502 .819 My parents expect too much from me.
item139 .636 .803 I am blamed for things I don't do.
item169 .598 .809 People get mad at me, even when I don't do anything wrong.
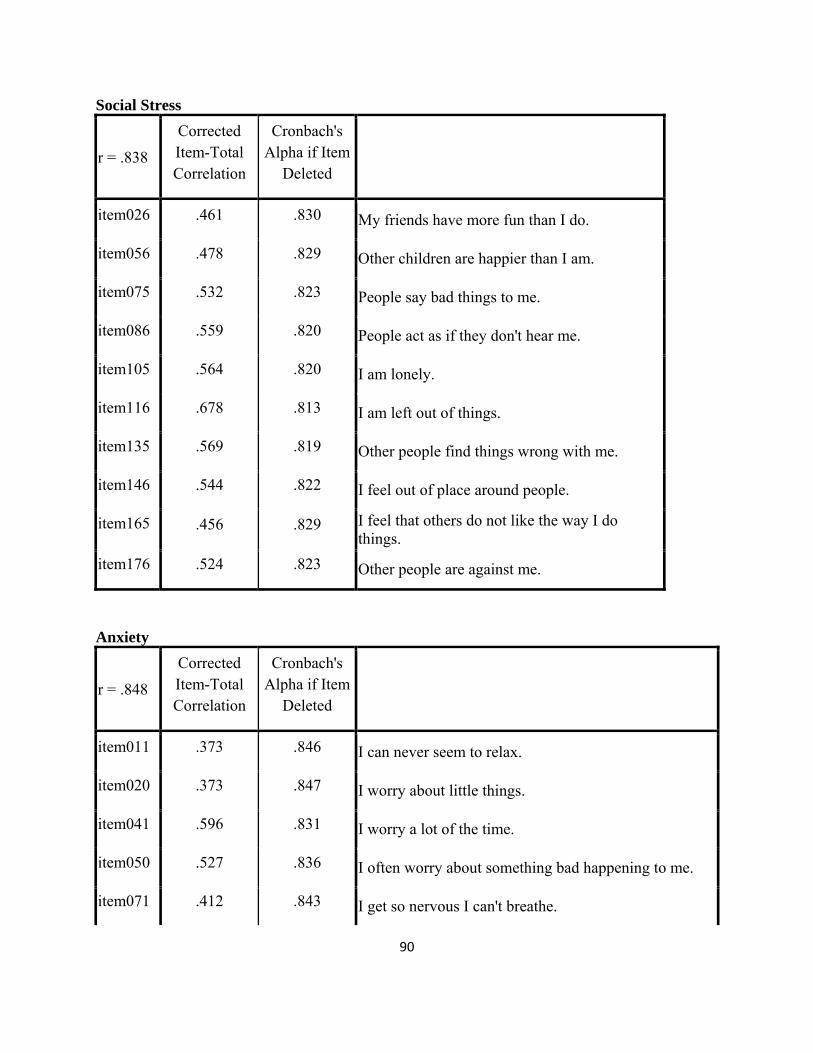
90
Social Stress
r = .838
Corrected Item-Total Correlation
Cronbach's Alpha if Item
Deleted
item026 .461 .830 My friends have more fun than I do.
item056 .478 .829 Other children are happier than I am.
item075 .532 .823 People say bad things to me.
item086 .559 .820 People act as if they don't hear me.
item105 .564 .820 I am lonely.
item116 .678 .813 I am left out of things.
item135 .569 .819 Other people find things wrong with me.
item146 .544 .822 I feel out of place around people.
item165 .456 .829 I feel that others do not like the way I do things.
item176 .524 .823 Other people are against me.
Anxiety
r = .848
Corrected Item-Total Correlation
Cronbach's Alpha if Item
Deleted
item011 .373 .846 I can never seem to relax.
item020 .373 .847 I worry about little things.
item041 .596 .831 I worry a lot of the time.
item050 .527 .836 I often worry about something bad happening to me.
item071 .412 .843 I get so nervous I can't breathe.

91
item080 .619 .829 I worry when I go to bed at night.
item101 .415 .843 I feel guilty about things.
item108 .577 .834 I get nervous.
item110 .647 .828 I worry but I don't know why.
item131 .583 .832 I get nervous when things do not go the right way for me.
item138 .415 .843 Little things bother me.
item140 .589 .831 I worry about what is going to happen.
item170 .431 .842 I am afraid of a lot of things.
Sense of Inadequacy
r = .811
Corrected Item-Total Correlation
Cronbach's Alpha if Item
Deleted
item024 .476 .796 I never seem to get anything right.
item030 .347 .810 I cover up my work when the teacher walks by.
item054 .468 .797 Most things are harder for me than for others.
item060 .454 .799 I never quite reach my goal.
item084 .583 .785 Even when I try hard, I fail.
item090 .480 .796 I am disappointed with my grades.
item114 .515 .791 When I take tests, I can't think.
item120 .640 .776 I want to do better, but I can't.
item144 .573 .788 I fail at things.
item150 .398 .803 I quit easily.

92
Relationship with Parents
r = .911
Corrected Item-Total Correlation
Cronbach's Alpha if Item
Deleted
item042 .625 .905 I get along well with my parents.
item072 .696 .901 I am proud of my parents.
item102 .549 .910 I like going places with my parents.
item126 .797 .895 My parents are easy to talk to.
item132 .542 .910 My mother and father like my friends.
item141 .672 .903 My mother and father help me if I ask them to.
item155 .686 .902 My parents listen to what I say.
item156 .714 .900 I like to be close to my parents.
item171 .737 .899 My parents trust me.
item173 .756 .897 My parents are proud of me.
Interpersonal Relations
r = .787
Corrected Item-Total Correlation
Cronbach's Alpha if Item
Deleted
item013 .433 .775 My classmates don't like me.
item043 .599 .751 Other children don't like to be with me.
item073 .515 .760 Other kids hate to be with me.
item103 .488 .764 I feel that nobody likes me.
item133 .579 .748 People think I am fun to be with.

93
item151 .559 .751 I am slow to make new friends.
item163 .495 .767 I am liked by others.
Self Reliance
r = .596
Corrected Item-Total Correlation
Cronbach's Alpha if Item
Deleted
item016 .249 .576 If I have a problem, I can usually work it out.
item046 .181 .595 I can handle most things on my own.
item076 .306 .560 I am dependable.
item106 .180 .597 I can solve difficult problems by myself.
item123 .508 .500 I am good at making decisions.
item136 .363 .541 I like to make decisions on my own.
item153 .215 .586 My friends come to me for help.
item166 .381 .534 I am someone you can rely on.

94
Appendix C, Results from Confirmatory Factor Analysis
Standardized Parameter Estimates for the One- and Two-factor Models
Two-Factor One-Factor
Scale Personal
Adjustment Personal
Maladjustment Overall
Functioning
Self-Reliance .323 - -.195
Self-Esteem .856 - -.696
Interpersonal Relations .737 - -.644
Relations with Parents .528 - -.473
Hyperactivity - .498 .480
Attention Problems - .598 .588
Somatization - .663 .661
Sense of Inadequacy - .800 .795
Depression - .857 .855
Anxiety - .814 .809
Social Stress - .844 .853
Locus of Control - .767 .766
Atypicality - .745 .740
Sensation Seeking - .248 .228
Attitude to Teachers - .540 .539
Attitude to Teachers - .416 .408
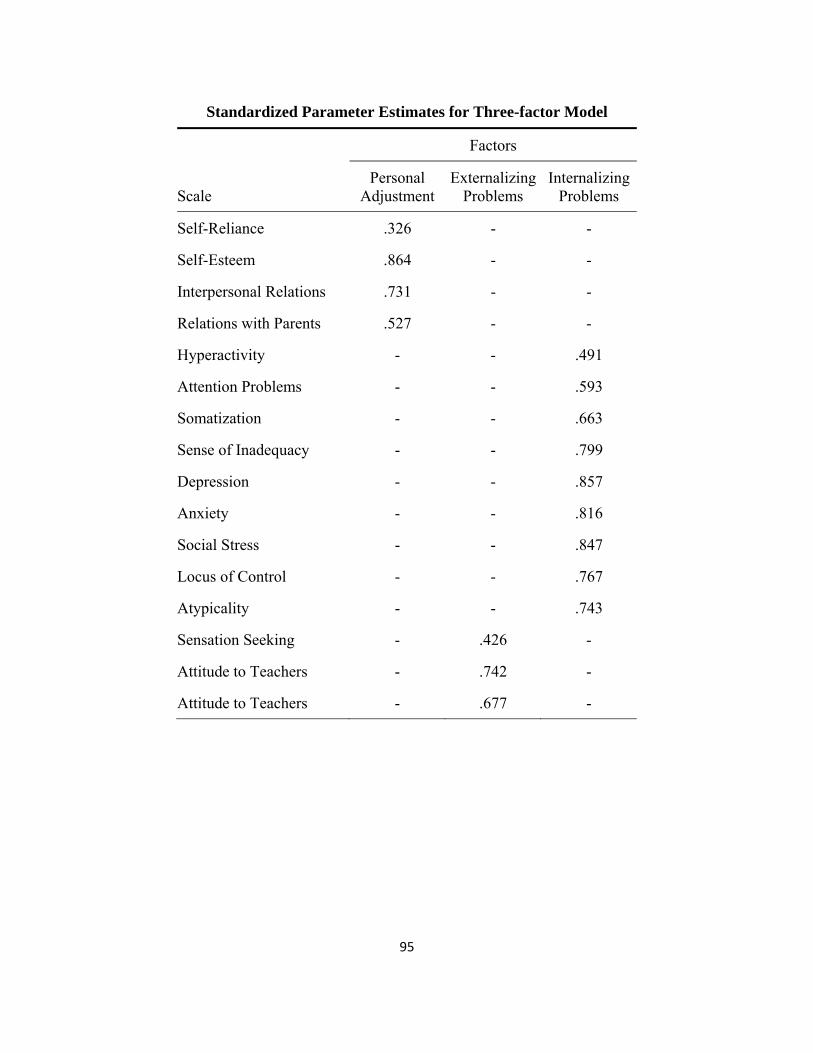
95
Standardized Parameter Estimates for Three-factor Model
Factors
Scale Personal
Adjustment Externalizing
Problems Internalizing
Problems
Self-Reliance .326 - -
Self-Esteem .864 - -
Interpersonal Relations .731 - -
Relations with Parents .527 - -
Hyperactivity - - .491
Attention Problems - - .593
Somatization - - .663
Sense of Inadequacy - - .799
Depression - - .857
Anxiety - - .816
Social Stress - - .847
Locus of Control - - .767
Atypicality - - .743
Sensation Seeking - .426 -
Attitude to Teachers - .742 -
Attitude to Teachers - .677 -

96
Standardized Parameter Estimates for Three-factor* Model
Factors
Scale Personal
Adjustment Externalizing
Problems Internalizing
Problems
Self-Reliance .319 - -
Self-Esteem .855 - -
Interpersonal Relations .739 - -
Relations with Parents .529 - -
Hyperactivity - .762 -
Attention Problems - .781 -
Somatization - - .664
Sense of Inadequacy - - .793
Depression - - .860
Anxiety - - .822
Social Stress - - .854
Locus of Control - - .766
Atypicality - - .737
Sensation Seeking - .500 -
Attitude to Teachers - .580 -
Attitude to Teachers - .567 -

97
Standardized Parameter Estimates for Four-factor Model
Factors
Scale Personal
Adjustment Inattention/
HyperactivityInterpersonal
Problems School
Problems
Self-Reliance .319 - - -
Self-Esteem .856 - - -
Interpersonal Relations .738 - - -
Relations with Parents .529 - - -
Hyperactivity - .773 - -
Attention Problems - .832 - -
Somatization - - .663 -
Sense of Inadequacy - - .794 -
Depression - - .862 -
Anxiety - - .821 -
Social Stress - - .854 -
Locus of Control - - .766 -
Atypicality - - .736 -
Sensation Seeking - - - .479
Attitude to Teachers - - - .700
Attitude to Teachers - - - .683

98
Appendix D, Results from Exploratory Factor Analysis

99
Loadings from 5-factor Solution
Factor 1 Factor 2 Factor 3 Factor 4 Factor 5
Interpersonal Relations
-.851
Social Stress .695 .253
Self-Esteem -.599
Atypicality .544 .393
Anxiety .482 .321 .381 .296
Sense of Inadequacy
.402 .363
Somatization .363 .278
Hyperactivity .797
Attention Problems
.727 -.274
Sensation Seeking
.469
Self-Reliance .747
Locus of Control
.907
Relation with Parents
-.578
Depression .390 .530
Attitude to School
-.615
Attitude to Teachers
.284 -.551
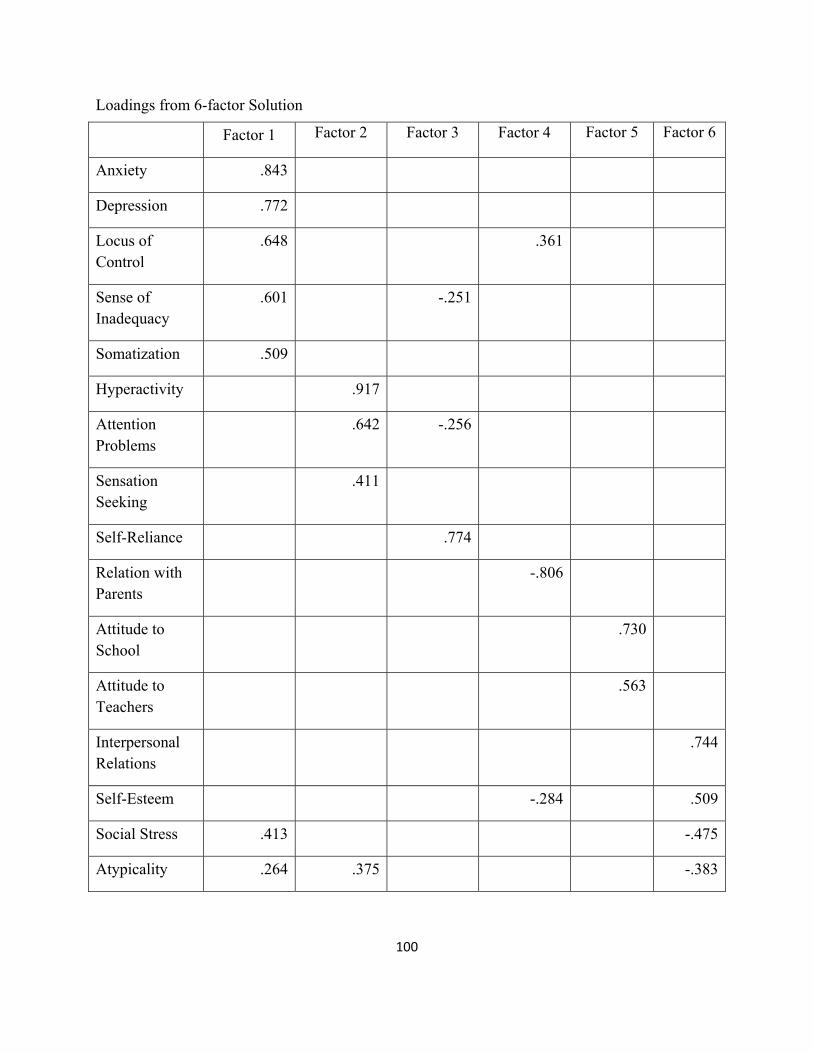
100
Loadings from 6-factor Solution
Factor 1 Factor 2 Factor 3 Factor 4 Factor 5 Factor 6
Anxiety .843
Depression .772
Locus of Control
.648 .361
Sense of Inadequacy
.601 -.251
Somatization .509
Hyperactivity .917
Attention Problems
.642 -.256
Sensation Seeking
.411
Self-Reliance .774
Relation with Parents
-.806
Attitude to School
.730
Attitude to Teachers
.563
Interpersonal Relations
.744
Self-Esteem -.284 .509
Social Stress .413 -.475
Atypicality .264 .375 -.383