Embed Size (px)
Citation preview
Plaza Three, 101-2000 Argentia Rd. Mississauga, Ontario Canada L5N 1V9 Phone: (905) 272-3600 Fax: (905) 272-3602 e-mail: [email protected]
In association with:
Peel Enterprise Zone Business Case
February 23, 2018

Peel Enterprise Zone Business Case
PEEL GOODS MOVEMENT – REGION OF PEEL
Watson & Associates Economists Ltd.
Table of Contents
EXECUTIVE SUMMARY ................................................................................... 1
1. INTRODUCTION .................................................................................. 15
1.1 Terms of Reference ................................................................................................................... 15
1.2 Goods Movement Sector Defined ........................................................................................ 16
1.3 Importance of Goods Movement Sector ............................................................................. 16
2. THE PEEL ENTERPRISE ZONE CONCEPT ............................................ 18
2.1 Freight Villages Overview ........................................................................................................ 18
2.2 Freight Village Examples/Case Studies ................................................................................. 21
2.3 Exploring the Case for a Peel Enterprise Zone in Peel ........................................................ 29
3. EMPLOYMENT LAND NEEDS ASSOCIATED WITH THE GOODS
MOVEMENT SECTOR IN PEEL ............................................................ 33
3.1 Macro-Economic Trends .......................................................................................................... 33
3.2 Importance of Goods Movement Sector in Peel Region .................................................. 38
3.3 Goods Movement Employment Forecast in Peel Region, 2006-2041 ............................. 39
3.4 Impact of Goods Movement Sector on Peel Region Employment Land Needs ......... 41
3.5 General Location and Market Attributes Related to the Goods Movement
Sector ................................................................................................................................... 42
3.6 Employment Land Supply Opportunities in Peel Region ................................................... 43
3.7 Conclusions ................................................................................................................................ 43
4. SITE SELECTION ANALYSIS ................................................................. 45
4.1 General Location Requirements ............................................................................................ 45
4.2 Stakeholder Workshop ............................................................................................................. 55
4.3 Site Selection Criteria ................................................................................................................ 57
4.4 Preferred Location Option ....................................................................................................... 59
Peel Enterprise Zone Business Case
PEEL GOODS MOVEMENT – REGION OF PEEL
Watson & Associates Economists Ltd.
5. OVERVIEW OF CAPITAL INFRASTRUCTURE NEEDS AND
SERVICING COSTS .............................................................................. 64
5.1 Roads ........................................................................................................................................... 64
5.2 Water & Wastewater ................................................................................................................ 74
6. GOVERNANCE STRUCTURE .............................................................. 81
7. FISCAL IMPACT ANALYSIS ................................................................. 82
8. ECONOMIC IMPACT ANALYSIS ....................................................... 90
8.1 Methodology ............................................................................................................................. 90
8.2 Output, GDP, Labour Income and Jobs ............................................................................... 91
8.3 Direct Effects, Indirect Effects, and Induced Effects .......................................................... 92
8.4 Short-Term Economic Impacts (Construction) ..................................................................... 93
8.5 Long-Term Economic Impacts (Goods Movement Employment) .................................. 94
8.6 External Economic Impacts ..................................................................................................... 96
8.7 Summary of Economic Impact Analysis ............................................................................... 98
9. CONCLUSION ................................................................................... 100
Appendix A – Land Use Schedules of Local Municipalities
Appendix B – Stakeholder Workshop Discussion Guide
Appendix C – Site Evaluation Scoring
Appendix D – Road Network Maps
Appendix E – Trip Generation Forecast
Appendix F – Supplementary Fiscal Impact Analysis
Peel Enterprise Zone Business Case
PEEL GOODS MOVEMENT – REGION OF PEEL
Watson & Associates Economists Ltd. Page 1
EXECUTIVE SUMMARY
Continuing the efforts of previous studies on freight villages, the Region of Peel is
exploring the feasibility of a Peel Enterprise Zone (PEZ) in the Region as a strategy to
address issues related to Goods Movement land use and employment density. This
business case report looks exclusively at the feasibility of a PEZ in the Region of Peel.
The study undertakes a feasibility analysis through planning, economic and fiscal
factors. For the purposes of this type of study, a specific site was selected for which
to measure these factors. The conclusion of the study is to understand the
feasibility of a PEZ for the selected site and for sites that share similar features.
The Goods Movement sector forms an integral part of the Region of Peel’s
economic development and employment growth potential. The Region of Peel
comprises a high concentration of Goods Movement related industries which
contribute significantly to the local, provincial and national economies.
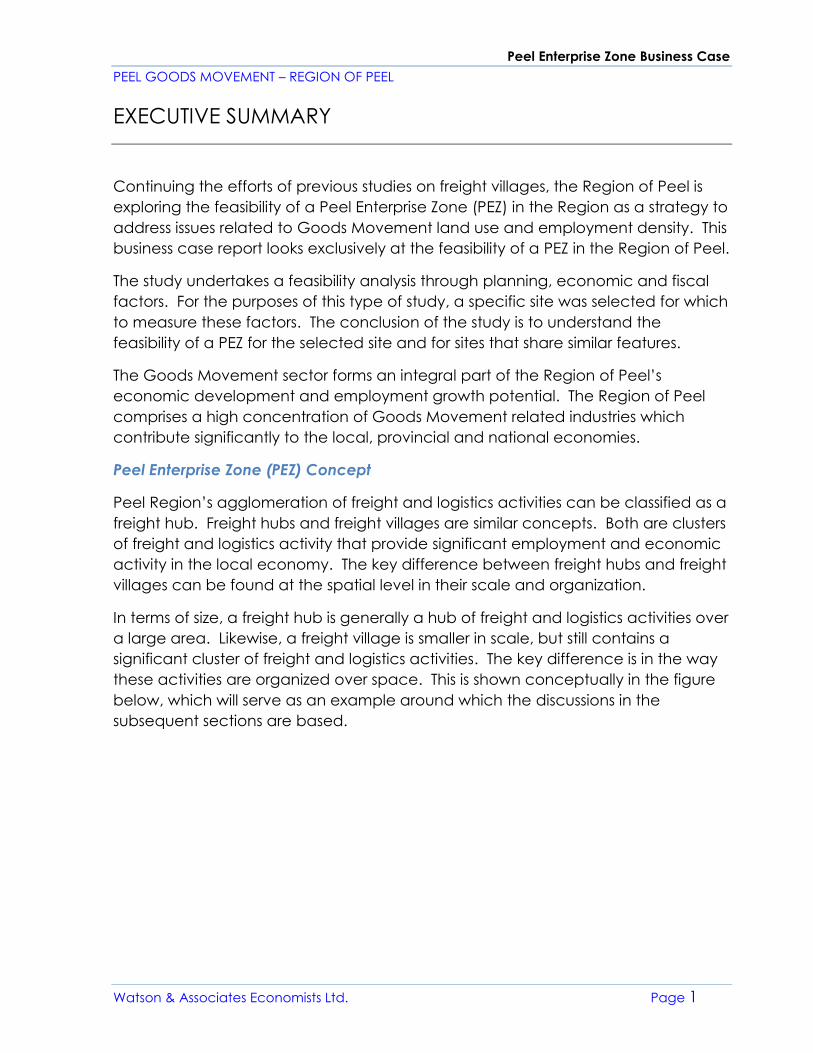
Peel Enterprise Zone (PEZ) Concept
Peel Region’s agglomeration of freight and logistics activities can be classified as a
freight hub. Freight hubs and freight villages are similar concepts. Both are clusters
of freight and logistics activity that provide significant employment and economic
activity in the local economy. The key difference between freight hubs and freight
villages can be found at the spatial level in their scale and organization.
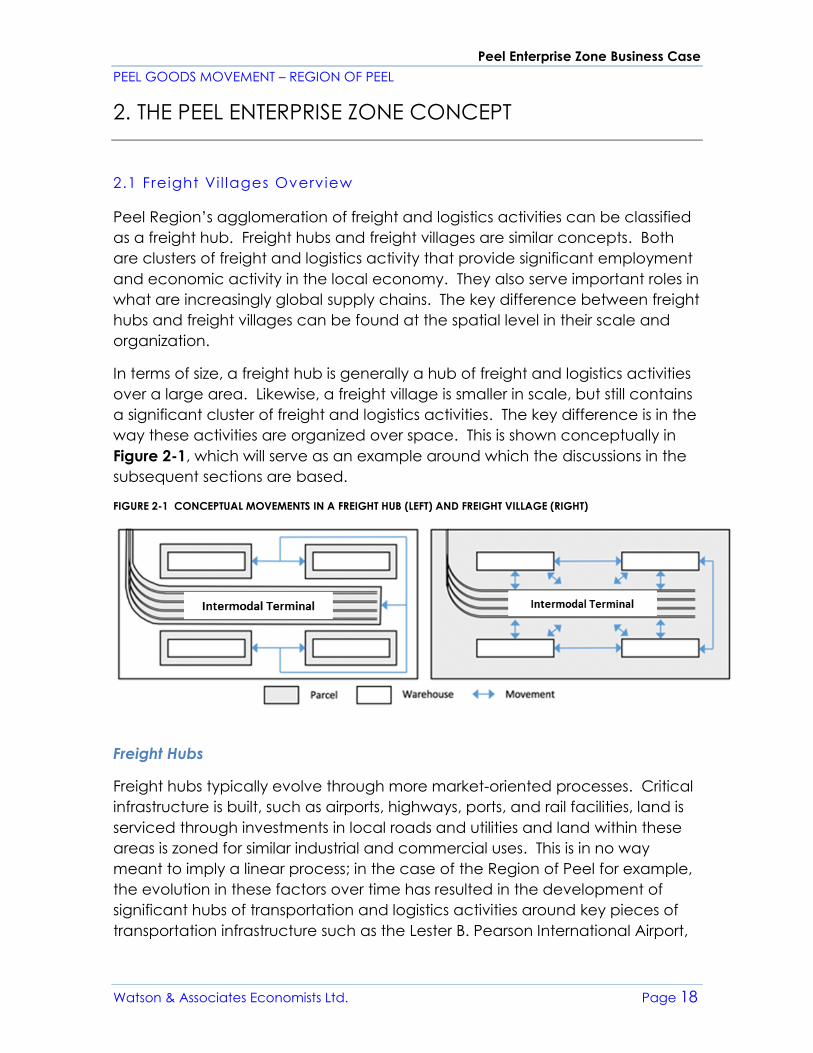
In terms of size, a freight hub is generally a hub of freight and logistics activities over
a large area. Likewise, a freight village is smaller in scale, but still contains a
significant cluster of freight and logistics activities. The key difference is in the way
these activities are organized over space. This is shown conceptually in the figure
below, which will serve as an example around which the discussions in the
subsequent sections are based.
Peel Enterprise Zone Business Case
PEEL GOODS MOVEMENT – REGION OF PEEL
Watson & Associates Economists Ltd. Page 2
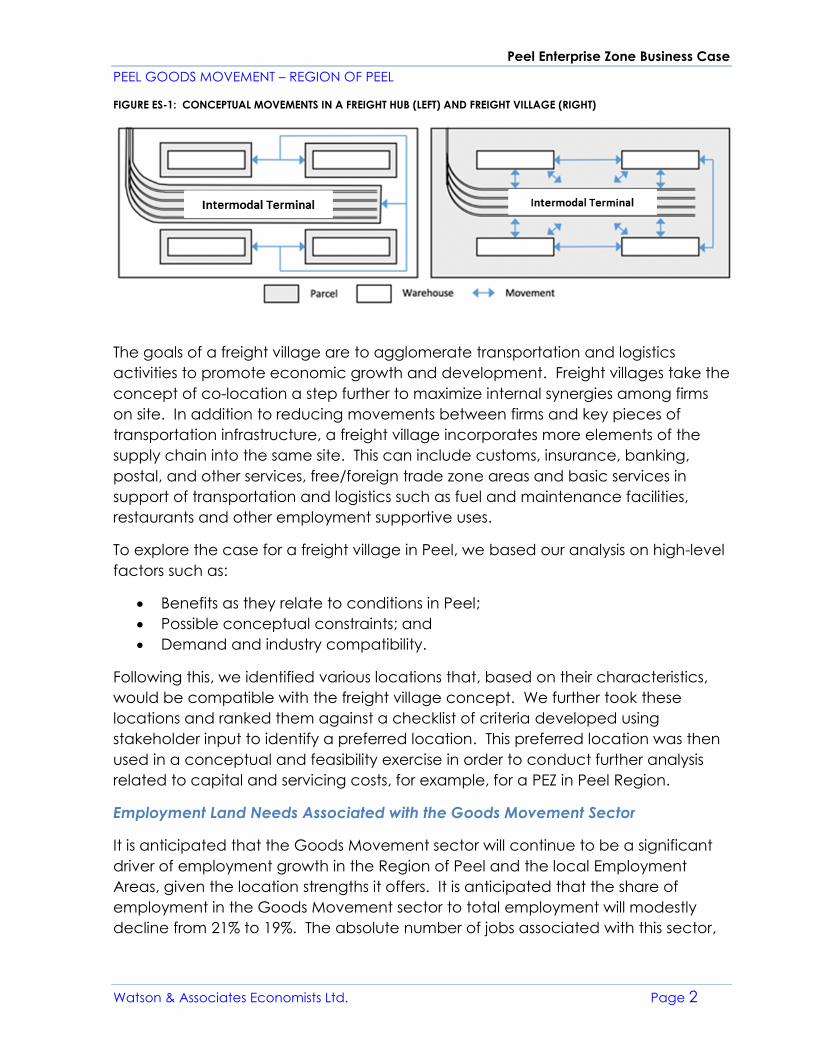
FIGURE ES-1: CONCEPTUAL MOVEMENTS IN A FREIGHT HUB (LEFT) AND FREIGHT VILLAGE (RIGHT)
The goals of a freight village are to agglomerate transportation and logistics
activities to promote economic growth and development. Freight villages take the
concept of co-location a step further to maximize internal synergies among firms
on site. In addition to reducing movements between firms and key pieces of
transportation infrastructure, a freight village incorporates more elements of the
supply chain into the same site. This can include customs, insurance, banking,
postal, and other services, free/foreign trade zone areas and basic services in
support of transportation and logistics such as fuel and maintenance facilities,
restaurants and other employment supportive uses.
To explore the case for a freight village in Peel, we based our analysis on high-level
factors such as:
• Benefits as they relate to conditions in Peel;
• Possible conceptual constraints; and
• Demand and industry compatibility.
Following this, we identified various locations that, based on their characteristics,
would be compatible with the freight village concept. We further took these
locations and ranked them against a checklist of criteria developed using
stakeholder input to identify a preferred location. This preferred location was then
used in a conceptual and feasibility exercise in order to conduct further analysis
related to capital and servicing costs, for example, for a PEZ in Peel Region.
Employment Land Needs Associated with the Goods Movement Sector
It is anticipated that the Goods Movement sector will continue to be a significant
driver of employment growth in the Region of Peel and the local Employment
Areas, given the location strengths it offers. It is anticipated that the share of
employment in the Goods Movement sector to total employment will modestly
decline from 21% to 19%. The absolute number of jobs associated with this sector,
Peel Enterprise Zone Business Case
PEEL GOODS MOVEMENT – REGION OF PEEL
Watson & Associates Economists Ltd. Page 3
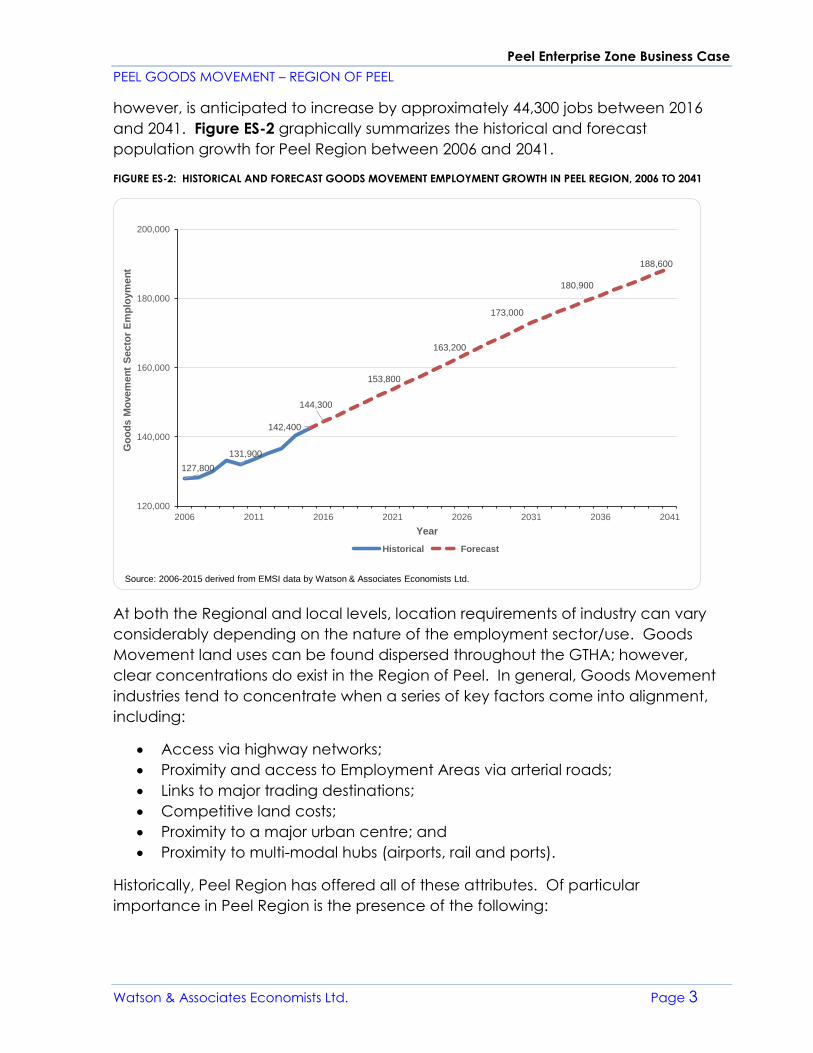
however, is anticipated to increase by approximately 44,300 jobs between 2016
and 2041. Figure ES-2 graphically summarizes the historical and forecast
population growth for Peel Region between 2006 and 2041.
FIGURE ES-2: HISTORICAL AND FORECAST GOODS MOVEMENT EMPLOYMENT GROWTH IN PEEL REGION, 2006 TO 2041
At both the Regional and local levels, location requirements of industry can vary
considerably depending on the nature of the employment sector/use. Goods
Movement land uses can be found dispersed throughout the GTHA; however,
clear concentrations do exist in the Region of Peel. In general, Goods Movement
industries tend to concentrate when a series of key factors come into alignment,
including:
• Access via highway networks;
• Proximity and access to Employment Areas via arterial roads;
• Links to major trading destinations;
• Competitive land costs;
• Proximity to a major urban centre; and
• Proximity to multi-modal hubs (airports, rail and ports).
Historically, Peel Region has offered all of these attributes. Of particular
importance in Peel Region is the presence of the following:
127,800
131,900
142,400
144,300
153,800
163,200
173,000
180,900
188,600
120,000
140,000
160,000
180,000
200,000
2006 2011 2016 2021 2026 2031 2036 2041
Go
od
s M
ovem
en
t S
ecto
r E
mp
loym
en
t
Year
Historical Forecast
Source: 2006-2015 derived from EMSI data by Watson & Associates Economists Ltd.
Peel Enterprise Zone Business Case
PEEL GOODS MOVEMENT – REGION OF PEEL
Watson & Associates Economists Ltd. Page 4
• TPIA;
• CN Intermodal Yard in Brampton;
• 400-series highway connections to surrounding Ontario and U.S. employment
markets; and
• Market choice of greenfield employment lands.
It is anticipated that the Goods Movement sector will continue to be a significant
driver of employment growth in Peel and, more specifically, the Region’s
Employment Areas given the location strength that support this sector. While there
is demand for this sector in Peel, the current vacant designated employment land
supply is diminishing and, as a result, the opportunity to accommodate this industry
on designated employment lands is limited.
Site Selection Analysis
While a PEZ could offer value to Peel in terms of offering benefits such as reduced
truck traffic on roads and responding to demand among transportation and
logistics firms, an important consideration is location. To analyze this, an initial
planning exercise was undertaken to highlight several guiding factors based on
best practices. An ideal location for a freight village will exhibit the following
characteristics:
1. A large contiguous area of greenfield land available for development,
preferably on employment designated land;
2. Serviced land or planned-to-be-serviced lands, in terms of water and
wastewater infrastructure;
3. Close to existing or planned capital improvements in transportation
infrastructure;
4. Close to existing or planned major highways;
5. Close to existing or planned rail intermodal facilities; and
6. Separate from conflicting land uses.
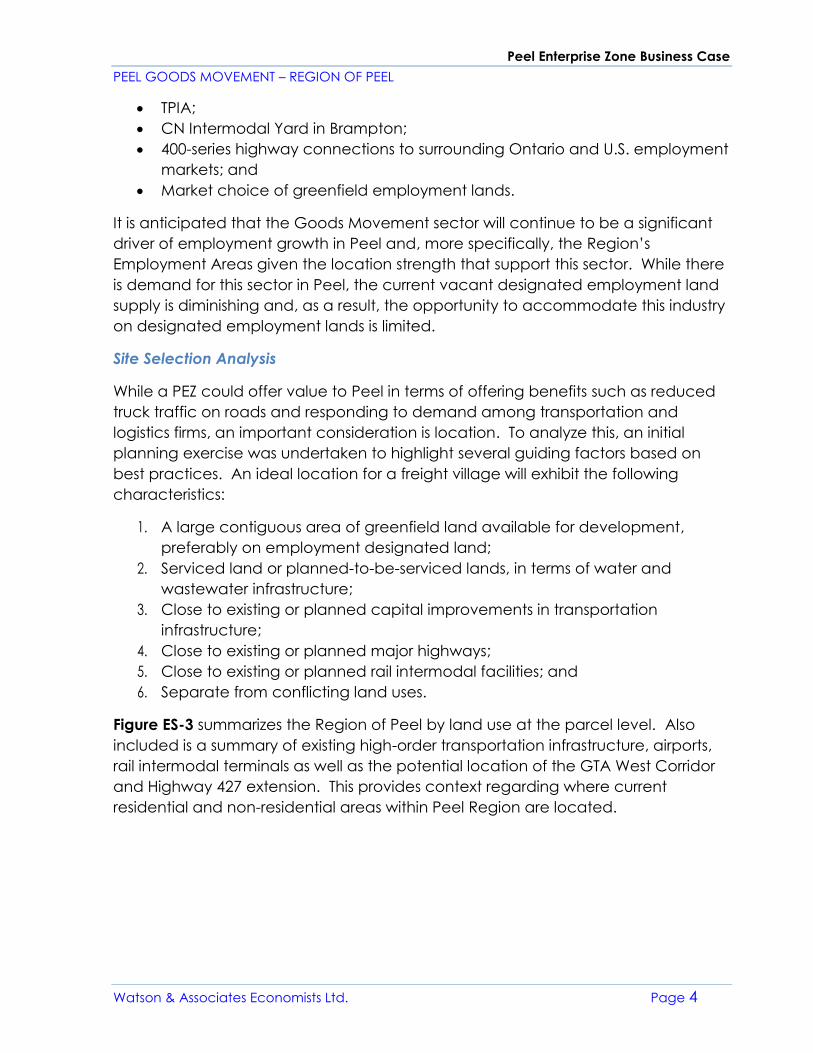
Figure ES-3 summarizes the Region of Peel by land use at the parcel level. Also
included is a summary of existing high-order transportation infrastructure, airports,
rail intermodal terminals as well as the potential location of the GTA West Corridor
and Highway 427 extension. This provides context regarding where current
residential and non-residential areas within Peel Region are located.
Peel Enterprise Zone Business Case
PEEL GOODS MOVEMENT – REGION OF PEEL
Watson & Associates Economists Ltd. Page 5
FIGURE ES-3: PEEL REGION PARCEL-BASED DEVELOPED LAND USE - 2013
Source: Region of Peel, WSP
This map was used to identify undeveloped sites (i.e. greenfields). Areas with
greatest potential are those near transportation infrastructure such as those
located on/near regional roadways, provincial highways, provincial freeways,
Peel Enterprise Zone Business Case
PEEL GOODS MOVEMENT – REGION OF PEEL
Watson & Associates Economists Ltd. Page 6
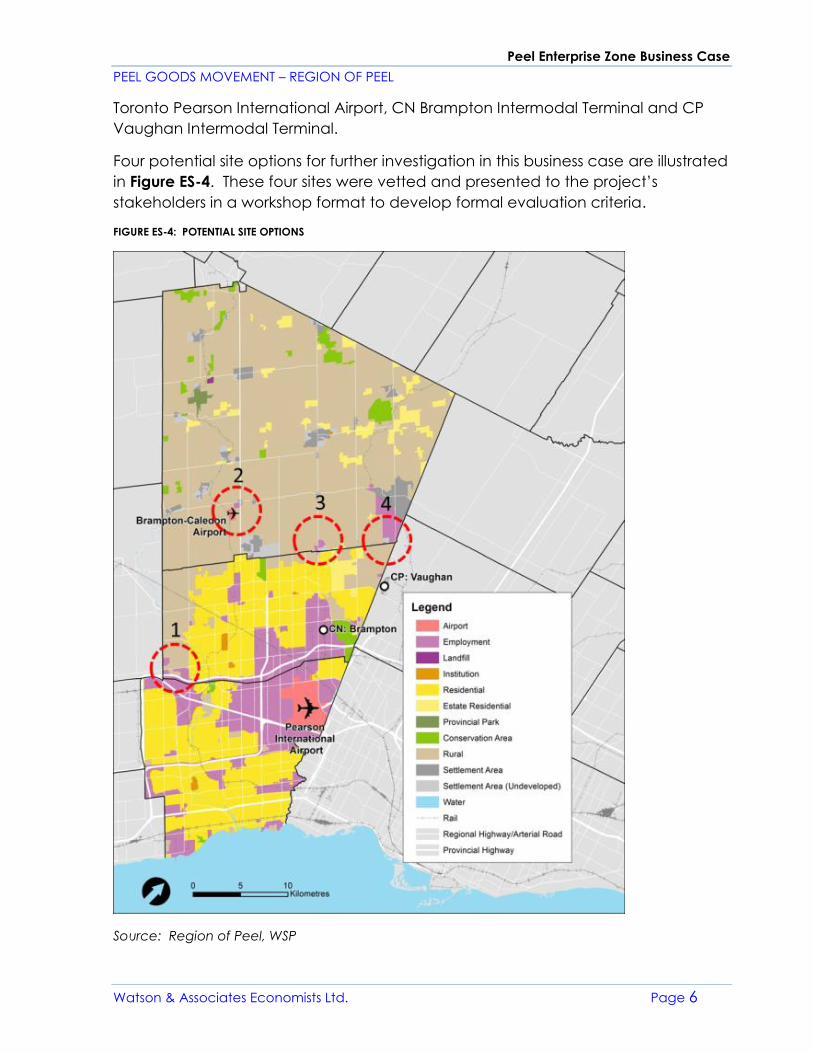
Toronto Pearson International Airport, CN Brampton Intermodal Terminal and CP
Vaughan Intermodal Terminal.
Four potential site options for further investigation in this business case are illustrated
in Figure ES-4. These four sites were vetted and presented to the project’s
stakeholders in a workshop format to develop formal evaluation criteria.
FIGURE ES-4: POTENTIAL SITE OPTIONS
Source: Region of Peel, WSP
Peel Enterprise Zone Business Case
PEEL GOODS MOVEMENT – REGION OF PEEL
Watson & Associates Economists Ltd. Page 7
The stakeholder engagement was a process for informing, consulting and
collaborating with select stakeholders. The stakeholders from the project included:
• Technical agency representatives;
• Industry representatives; and
• Provincial, municipal and regional land use and transportation planning
staff.
A workshop was held to gather feedback on local and regional land use and
transportation planning preferences, economic development opportunities and
business and industry needs as they relate to a PEZ in the context of Peel Region.
During the stakeholder workshop and subsequent follow up with local municipal
staff, a preliminary review of the sites was completed. Feedback received from
local municipalities discussed the vision of both Mississauga and Brampton and the
compatibility with a PEZ. The preliminary review showed that sites in both
Mississauga and Brampton would not be viable options for a PEZ. The rationale for
this is premised on land availability constraints, cost of land and differing planning
objectives and visions with the proposed PEZ.
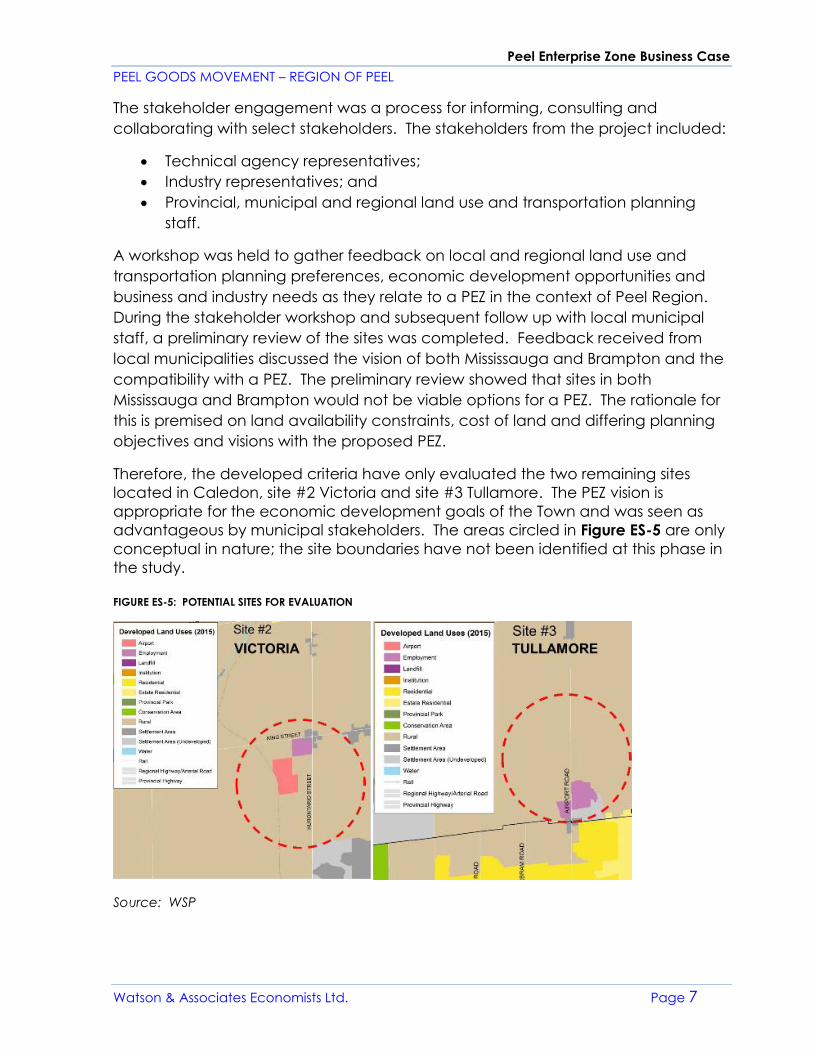
Therefore, the developed criteria have only evaluated the two remaining sites
located in Caledon, site #2 Victoria and site #3 Tullamore. The PEZ vision is
appropriate for the economic development goals of the Town and was seen as
advantageous by municipal stakeholders. The areas circled in Figure ES-5 are only
conceptual in nature; the site boundaries have not been identified at this phase in
the study.
FIGURE ES-5: POTENTIAL SITES FOR EVALUATION
Source: WSP
Peel Enterprise Zone Business Case
PEEL GOODS MOVEMENT – REGION OF PEEL
Watson & Associates Economists Ltd. Page 8
Overview of the Site Selection Criteria
This site selection criteria were used to select a preferred location option from the
two potential sites. The criteria are comprised of 16 criteria in four categories:
transportation, infrastructure, land use and market.
Transportation criteria are related to connectivity and proximity: the site’s proximity
to key transportation nodes in the region (e.g. highways, airport, rail), and available
infrastructure to provide sufficient access to the site for both Goods Movement and
for future employees.
Infrastructure criteria are related to non-transportation infrastructure that is needed
to support the development of the site (e.g. water and wastewater). These criteria
prioritize sites with existing or planned infrastructure that can support the site as
they require large capital investments to be expanded.
Land use criteria assess the site’s compatibility with the appropriateness of the site
in terms of size/configuration, surrounding land uses, and potential for expansion.
Market criteria measure the site’s appeal to industry and potential tenants of the
PEZ site.
Preferred Location Option
The results of the evaluation criteria identify Tullamore to be the preferred location
to further investigate the feasibility of a PEZ in Peel Region. The characteristics of
the site that make it preferable over the Victoria site include:
• Proximity to rail intermodal;
• Proximity to transit;
• Serviced by water; and
• Market demand.
Site Characteristics
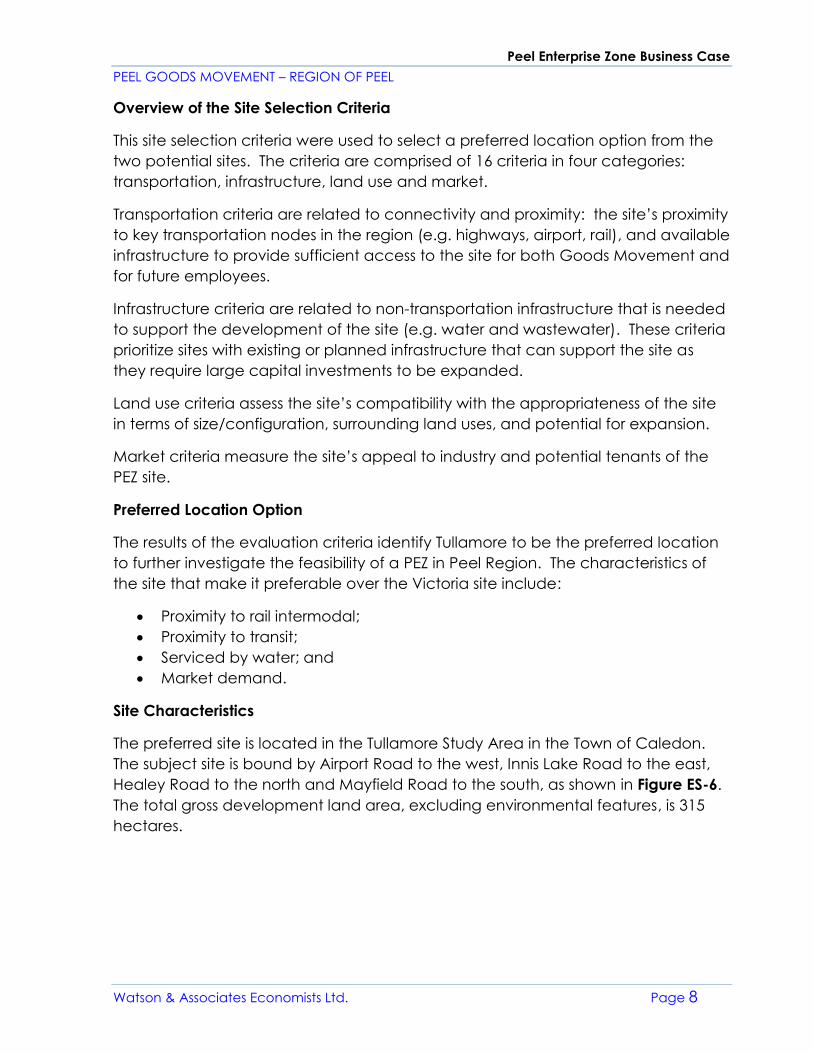
The preferred site is located in the Tullamore Study Area in the Town of Caledon.
The subject site is bound by Airport Road to the west, Innis Lake Road to the east,
Healey Road to the north and Mayfield Road to the south, as shown in Figure ES-6.
The total gross development land area, excluding environmental features, is 315
hectares.
Peel Enterprise Zone Business Case
PEEL GOODS MOVEMENT – REGION OF PEEL
Watson & Associates Economists Ltd. Page 9
FIGURE ES-6: TULLAMORE VACANT LAND SITE
Source: Watson & Associates Economists Ltd.
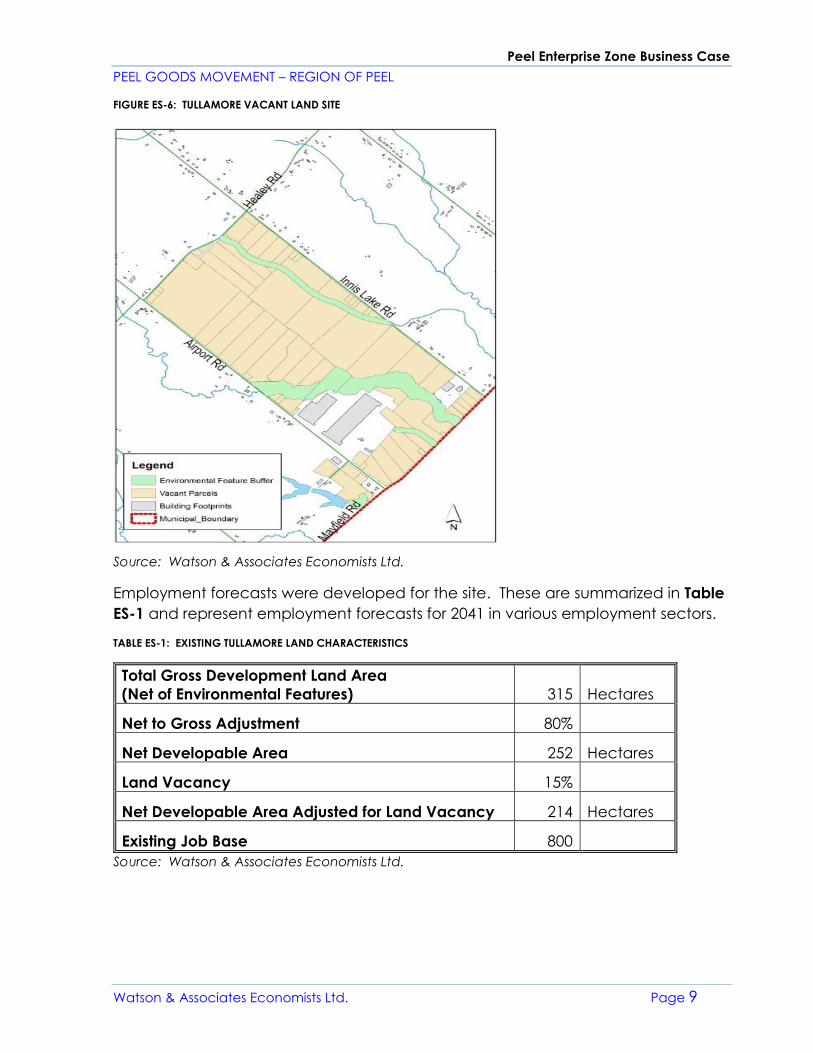
Employment forecasts were developed for the site. These are summarized in Table
ES-1 and represent employment forecasts for 2041 in various employment sectors.
TABLE ES-1: EXISTING TULLAMORE LAND CHARACTERISTICS
Total Gross Development Land Area
(Net of Environmental Features) 315 Hectares
Net to Gross Adjustment 80%
Net Developable Area 252 Hectares
Land Vacancy 15%
Net Developable Area Adjusted for Land Vacancy 214 Hectares
Existing Job Base 800
Source: Watson & Associates Economists Ltd.
Peel Enterprise Zone Business Case
PEEL GOODS MOVEMENT – REGION OF PEEL
Watson & Associates Economists Ltd. Page 10
Capital Infrastructure Needs and Servicing Costs
WSP completed a high-level review of the current and future capital infrastructure
needs around the Tullamore site in order to determine the feasibility of a PEZ. This
review provides an overview of the road network conditions around the site,
identifies current and potential constraints, and estimates the increase in traffic. This
review also proposes transportation improvements to account for the growth in truck
volumes expected from a PEZ.
Under current assumptions, the planned roadway improvements for Mayfield Road
indicate adequate capacity to account for the increased traffic volume; no
capital improvements have been suggested.
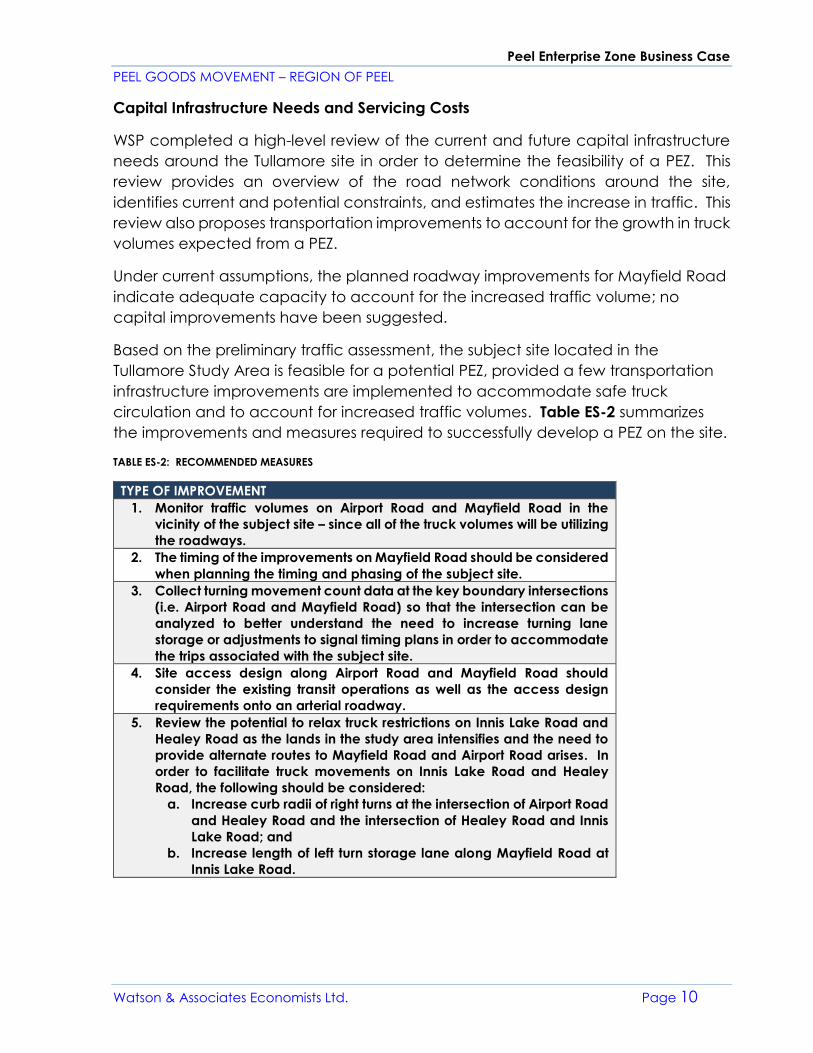
Based on the preliminary traffic assessment, the subject site located in the
Tullamore Study Area is feasible for a potential PEZ, provided a few transportation
infrastructure improvements are implemented to accommodate safe truck
circulation and to account for increased traffic volumes. Table ES-2 summarizes
the improvements and measures required to successfully develop a PEZ on the site.
TABLE ES-2: RECOMMENDED MEASURES
TYPE OF IMPROVEMENT
1. Monitor traffic volumes on Airport Road and Mayfield Road in the
vicinity of the subject site – since all of the truck volumes will be utilizing
the roadways.
2. The timing of the improvements on Mayfield Road should be considered
when planning the timing and phasing of the subject site.
3. Collect turning movement count data at the key boundary intersections
(i.e. Airport Road and Mayfield Road) so that the intersection can be
analyzed to better understand the need to increase turning lane
storage or adjustments to signal timing plans in order to accommodate
the trips associated with the subject site.
4. Site access design along Airport Road and Mayfield Road should
consider the existing transit operations as well as the access design
requirements onto an arterial roadway.
5. Review the potential to relax truck restrictions on Innis Lake Road and
Healey Road as the lands in the study area intensifies and the need to
provide alternate routes to Mayfield Road and Airport Road arises. In
order to facilitate truck movements on Innis Lake Road and Healey
Road, the following should be considered:
a. Increase curb radii of right turns at the intersection of Airport Road
and Healey Road and the intersection of Healey Road and Innis
Lake Road; and
b. Increase length of left turn storage lane along Mayfield Road at
Innis Lake Road.
Peel Enterprise Zone Business Case
PEEL GOODS MOVEMENT – REGION OF PEEL
Watson & Associates Economists Ltd. Page 11
The site could be used as a PEZ without removing the truck restrictions imposed on
Innis Lake Road and Healey Road. Removing the truck restrictions, however, will
improve truck traffic around the site and should still be considered as a potential
improvement by the Region.
Water/Wastewater
WSP estimated the water demands and wastewater flows corresponding to the PEZ
development. This estimate was based on the forecast 2041 total population
(employment) estimates for the PEZ site as well as proposed land uses on the site.
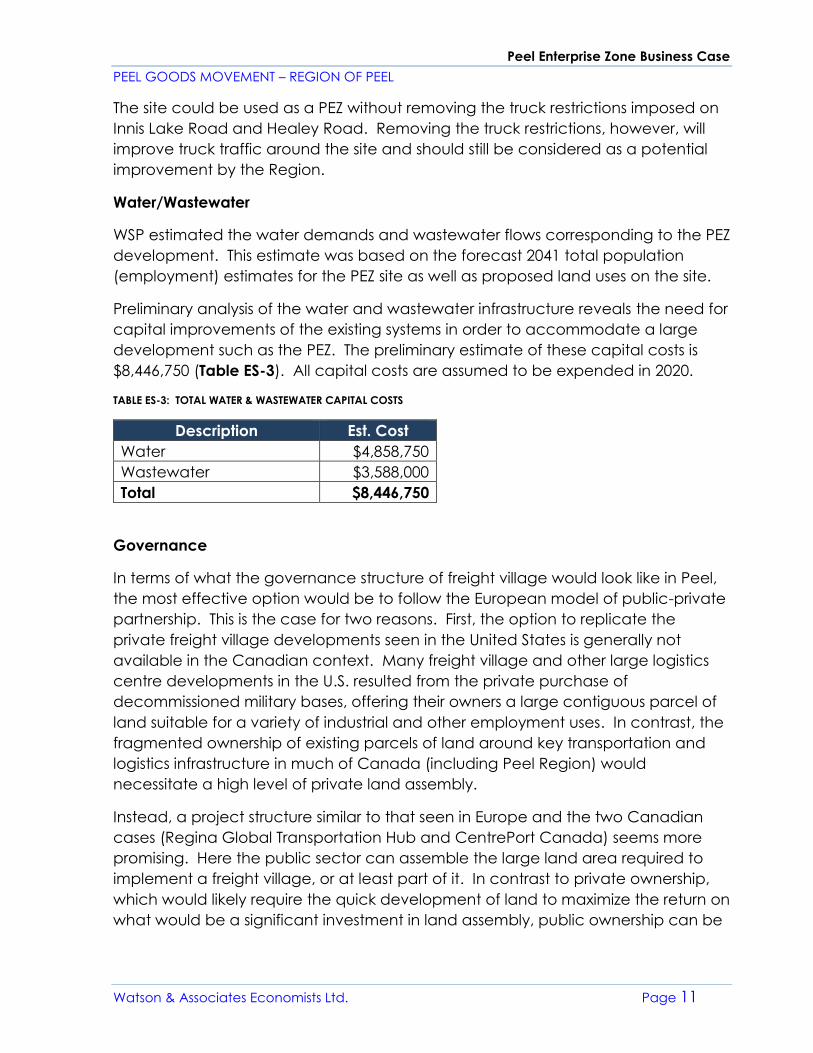
Preliminary analysis of the water and wastewater infrastructure reveals the need for
capital improvements of the existing systems in order to accommodate a large
development such as the PEZ. The preliminary estimate of these capital costs is
$8,446,750 (Table ES-3). All capital costs are assumed to be expended in 2020.
TABLE ES-3: TOTAL WATER & WASTEWATER CAPITAL COSTS
Description Est. Cost
Water $4,858,750
Wastewater $3,588,000
Total $8,446,750
Governance
In terms of what the governance structure of freight village would look like in Peel,
the most effective option would be to follow the European model of public-private
partnership. This is the case for two reasons. First, the option to replicate the
private freight village developments seen in the United States is generally not
available in the Canadian context. Many freight village and other large logistics
centre developments in the U.S. resulted from the private purchase of
decommissioned military bases, offering their owners a large contiguous parcel of
land suitable for a variety of industrial and other employment uses. In contrast, the
fragmented ownership of existing parcels of land around key transportation and
logistics infrastructure in much of Canada (including Peel Region) would
necessitate a high level of private land assembly.
Instead, a project structure similar to that seen in Europe and the two Canadian
cases (Regina Global Transportation Hub and CentrePort Canada) seems more
promising. Here the public sector can assemble the large land area required to
implement a freight village, or at least part of it. In contrast to private ownership,
which would likely require the quick development of land to maximize the return on
what would be a significant investment in land assembly, public ownership can be
Peel Enterprise Zone Business Case
PEEL GOODS MOVEMENT – REGION OF PEEL
Watson & Associates Economists Ltd. Page 12
used to master plan an area at a more calculated pace to achieve high levels of
efficiency and synergies among tenants.
Beyond the role of public capital in securing project feasibility, a PPP structure also
brings private-sector stakeholders to the table as partners in managing a freight
village project, ensuring their voices are heard in management decisions and
soliciting greater buy-in from firms for locating on site.
Fiscal Impact
The fiscal impact assessment methodology provides an operating and capital cost
analysis related to the preferred PEZ site location. The operating cost analysis
involves calculating the revenues and expenditures attributable to the existing
development, which are estimated on a proportionate basis. That is, operating
revenue and expenditure dollars are assigned by distributing the operating cost
and revenues on a per capita and per employee basis. Tax revenue is calculated
based on the total tax rate applicable to the subject area and proposed non-
residential development types. The assessment assumptions are based on a survey
of similar non-residential buildings within the local and regional market area within
Peel Region.
In accordance with the estimated annual operating revenues and expenditures
assigned to the PEZ, an annual net fiscal surplus of $2.45 million has been identified
at full buildout of the subject lands.
With respect to capital costs, a total of $64 million has been identified with respect
to water and wastewater infrastructure to service the subject lands. It is noted that
the majority of the water and wastewater infrastructure costs identified for the
subject lands are associated with local services internal to the development. The
local water and sewer mains may be required as a local service and thus would be
constructed and paid for by the developer(s).
It is further noted that capital cost impacts associated with other hard and soft
Regional services have not been assessed as part of this analysis. Furthermore,
local municipal capital costs (e.g. roads) have not been assessed as part of this
analysis.
As development proceeds, the Region will receive DC revenue related to new
non-residential development. Based on (current) 2017 DC rates, the proposed PEZ
would generate a total of $114.2 million in DC revenues.
DCs are the primary financing source for eligible growth-related capital works. DCs
represent a one-time capital funding source, which will fund a portion of the
Region’s capital costs. The external water and wastewater works may have a
Peel Enterprise Zone Business Case
PEEL GOODS MOVEMENT – REGION OF PEEL
Watson & Associates Economists Ltd. Page 13
benefit to existing development component (i.e. non-growth-related component)
as well as a post-period benefit component. As planning is still in the early stages,
this has yet to be determined but should be reviewed as part of the next Region of
Peel and Town of Caledon DC study process. The local water and sewer mains
may be required as a local service and thus would be constructed and paid for by
the developer(s).
Economic Impact
The development of and operations within a PEZ would create opportunities for
increased economic activity in the form of jobs, GDP and economic output. This
economic activity will be generated from both the construction of the necessary
infrastructure needed for the facility and through the business operations occurring
on the site.
The short-term economic impacts have been calculated based on the estimated
water/wastewater capital expenditures required to develop the PEZ site. The
development of water/wastewater construction capital costs are described in
section 5.2. All capital costs are assumed to be expended in 2020. As a result, the
short-term economic impacts represent a 2020 forecast.
It is estimated that the short-impacts due to the capital infrastructure investment
will generate an estimated $7.7 million in GDP and generate 75 full-time equivalent
employees during the construction period in 2020.
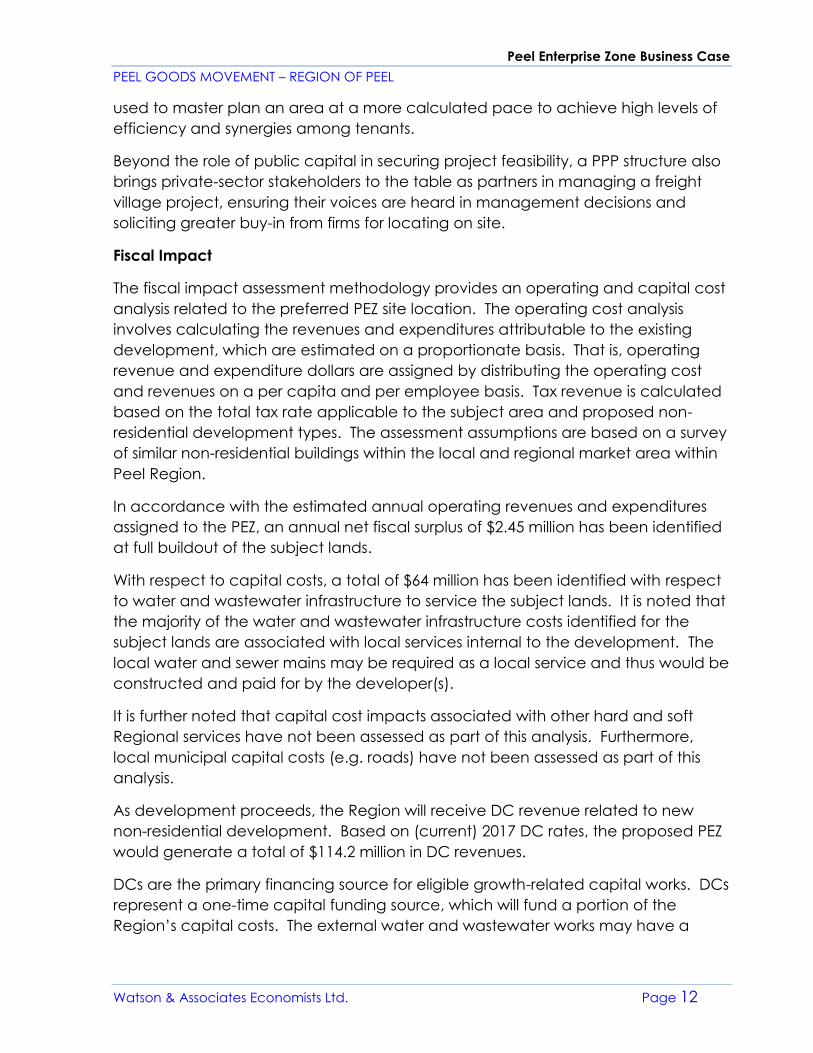
The long-term economic impacts have been calculated based on the estimated
employment creation. The employment forecast is based on the following sectors:
employment supportive uses, manufacturing, multi-tenant office and Goods
Movement. A summary of the long-term economic impacts is shown in the table
below. The cumulative economic impacts for GDP are estimated to be $1.1 billion,
with a compounded annual growth rate of 19.2%.
TABLE ES-4: SUMMARY OF LONG-TERM PEZ ECONOMIC IMPACTS (IN $2017 MILLIONS)
Impact
2021
Forecast 2041 Forecast
Output $64.7 $2,154.5
GDP $32.5 $1,083.6
Labour $19.1 $635.9
Jobs 331 11,070
Peel Enterprise Zone Business Case
PEEL GOODS MOVEMENT – REGION OF PEEL
Watson & Associates Economists Ltd. Page 14
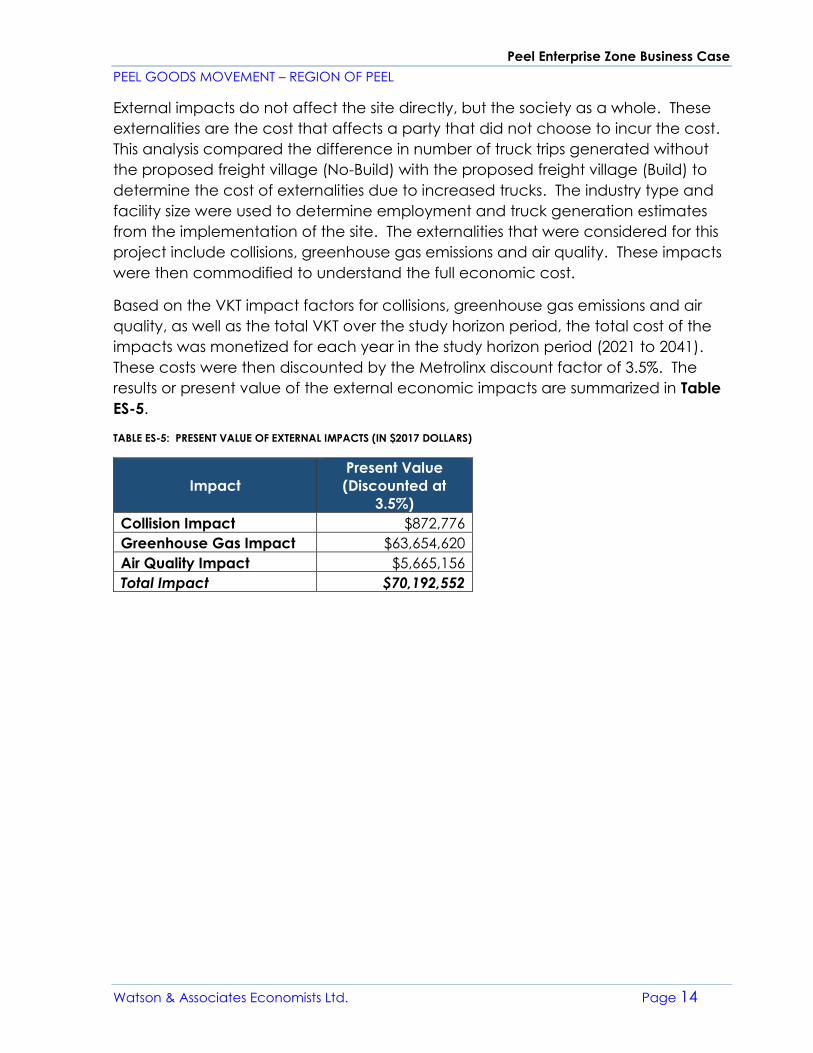
External impacts do not affect the site directly, but the society as a whole. These
externalities are the cost that affects a party that did not choose to incur the cost.
This analysis compared the difference in number of truck trips generated without
the proposed freight village (No-Build) with the proposed freight village (Build) to
determine the cost of externalities due to increased trucks. The industry type and
facility size were used to determine employment and truck generation estimates
from the implementation of the site. The externalities that were considered for this
project include collisions, greenhouse gas emissions and air quality. These impacts
were then commodified to understand the full economic cost.
Based on the VKT impact factors for collisions, greenhouse gas emissions and air
quality, as well as the total VKT over the study horizon period, the total cost of the
impacts was monetized for each year in the study horizon period (2021 to 2041).
These costs were then discounted by the Metrolinx discount factor of 3.5%. The
results or present value of the external economic impacts are summarized in Table
ES-5.
TABLE ES-5: PRESENT VALUE OF EXTERNAL IMPACTS (IN $2017 DOLLARS)
Impact
Present Value
(Discounted at
3.5%)
Collision Impact $872,776
Greenhouse Gas Impact $63,654,620
Air Quality Impact $5,665,156
Total Impact $70,192,552
Peel Enterprise Zone Business Case
PEEL GOODS MOVEMENT – REGION OF PEEL
Watson & Associates Economists Ltd. Page 15
1. INTRODUCTION
1.1 Terms of Reference
The Region of Peel retained Watson & Associates Economists Ltd. and WSP
Group in 2016 to prepare a business case analysis with respect a proposed
Peel Enterprise Zone (PEZ) within the Region of Peel. This study builds on the
results of the Peel Region Goods Movement Density Discussion Paper,1 which
recommends that the Region of Peel explore opportunities to accommodate
the needs and facilitate the development of the Goods Movement sector in
Peel Region. More specifically, this study has been prepared in direct response
to Action Item #21 of the Peel Region Goods Movement Strategic Plan, 2012 to
2016,2 which identifies the need for the Region of Peel to develop an
economic business case for a Freight Village.
Continuing the efforts of previous studies on freight villages, the Region of Peel
is exploring the feasibility of a PEZ in the Region as a strategy to address issues
related to Goods Movement land use and employment density. This business
case report looks exclusively at the feasibility of a PEZ in the Region of Peel. The
successfulness of a PEZ as a land use strategy is beyond the current scope and
should be further explored by the Region.
A PEZ aligns with the concept of a freight village, but the term “PEZ” has been
coined to maintain consistency with the nomenclature of past work on Goods
Movement by emphasizing the intended employment growth of the facility,
aligning with existing land use terminology, and supporting the positive growth
and partnerships that can foster in this development. For the remainder of the
report, “PEZ” will be used for reference to Peel-specific development, but
“freight village” will be used for reference to best practice concepts.
The study undertakes a feasibility analysis through economic and fiscal factors.
For the purposes of this type of study, a specific site was selected for which to
measure these factors. The conclusion of the study is to understand the
feasibility of a PEZ for the selected site and for sites that share similar features.
1 Peel Goods Movement, Employment Density Discussion Paper. October 21, 2015. Watson &
Associates Economists Ltd., in association with Meridian Planning and WSP Group. 2 Peel Region Goods Movement Strategic Plan, 2012 to 2016. Region of Peel. April 2012
Peel Enterprise Zone Business Case
PEEL GOODS MOVEMENT – REGION OF PEEL
Watson & Associates Economists Ltd. Page 16
The study explores, in detail, the following topics:
1. An Overview of the Goods Movement Growth District Concept
2. Employment Land Needs Associated with the Goods Movement
Sector in Peel Region
3. Site Selection Analysis and Preferred Location Options
4. An Overview of Capital Infrastructure Needs and Servicing Costs
5. Fiscal and Economic Impacts
The observations in each section intend to inform the overall recommendations
and feasibility of a PEZ in the Region of Peel.
1.2 Goods Movement Sector Defined
Goods movement refers to the transportation system, infrastructure and policy
that enable the movement of goods and services. The Goods Movement
sector includes air, rail, water, pipeline and truck transportation industries, as
well as warehousing, storage and logistics companies and support activities for
transportation (including numerous public agencies, private firms, and
individual shippers and receivers). Goods move through and within Peel
Region for a variety of reasons, including local deliveries, processing and
production (i.e. movement of materials and components to and from
manufacturing facilities), imports and exports (i.e. shipping of commodities and
goods).
1.3 Importance of Goods Movement Sector
The Goods Movement sector forms an integral part of the Region of Peel’s
economic development and employment growth potential. The Region of
Peel comprises a high concentration of Goods Movement related industries
which contribute significantly to the local, provincial and national economies.
Freight transportation, warehousing and manufacturing account for
approximately one-fifth of Peel’s employment base and a significant share of
industrial development activity over the past decade has been in the Goods
Movement sector. The Region of Peel home to over 2,000 trucking companies,
which represents 25% of all truck activity in Ontario and accounts for
approximately $1.8 billion worth of Goods Movement through Peel every day.3
Goods Movement is the largest industrial employment growth sector within the
GTHA and the Region of Peel. To maintain its competitive edge, the Region of
3 Peel Goods Movement, Strategic Goods Movement Network Study Technical Report, April 25, 2013,
Region of Peel.
Peel Enterprise Zone Business Case
PEEL GOODS MOVEMENT – REGION OF PEEL
Watson & Associates Economists Ltd. Page 17
Peel must ensure the efficient movement of goods through and within the
Region to attract industry and investments.4
4 Peel Region Goods Movement Strategic Plan (2012-2016). Status Update. June, 2014.
Peel Enterprise Zone Business Case
PEEL GOODS MOVEMENT – REGION OF PEEL
Watson & Associates Economists Ltd. Page 18
2. THE PEEL ENTERPRISE ZONE CONCEPT
2.1 Freight Vi l lages Overview
Peel Region’s agglomeration of freight and logistics activities can be classified
as a freight hub. Freight hubs and freight villages are similar concepts. Both
are clusters of freight and logistics activity that provide significant employment
and economic activity in the local economy. They also serve important roles in
what are increasingly global supply chains. The key difference between freight
hubs and freight villages can be found at the spatial level in their scale and
organization.
In terms of size, a freight hub is generally a hub of freight and logistics activities
over a large area. Likewise, a freight village is smaller in scale, but still contains
a significant cluster of freight and logistics activities. The key difference is in the
way these activities are organized over space. This is shown conceptually in
Figure 2-1, which will serve as an example around which the discussions in the
subsequent sections are based.
FIGURE 2-1 CONCEPTUAL MOVEMENTS IN A FREIGHT HUB (LEFT) AND FREIGHT VILLAGE (RIGHT)
Freight Hubs
Freight hubs typically evolve through more market-oriented processes. Critical
infrastructure is built, such as airports, highways, ports, and rail facilities, land is
serviced through investments in local roads and utilities and land within these
areas is zoned for similar industrial and commercial uses. This is in no way
meant to imply a linear process; in the case of the Region of Peel for example,
the evolution in these factors over time has resulted in the development of
significant hubs of transportation and logistics activities around key pieces of
transportation infrastructure such as the Lester B. Pearson International Airport,
Peel Enterprise Zone Business Case
PEEL GOODS MOVEMENT – REGION OF PEEL
Watson & Associates Economists Ltd. Page 19
the CN Brampton Intermodal Terminal, and the provincial highway
infrastructure that surrounds and moves through the Region.
While successful, the evolution of economic activity within these hubs is not
optimal from both a land use and transportation perspective. Movement
associated with Goods Movement and logistics is movement intensive,
particularly for trips occurring over the “last mile.”
From a land use perspective, more market-oriented development patterns (i.e.
industry selecting locations based on land costs) mean that the locations of
some firms may not lend itself to optimal and efficient transportation flows. For
example, as mentioned previously, many transportation and logistics firms are
movement intensive, particularly over the “last mile” of a trip, whether it be
making final deliveries, picking up containers from an intermodal terminal for
de-stuffing (unloading cargo), or empty hauls to return containers and trailers.
With this in mind, more market-oriented development patterns can result in
sub-optimal locations where some firms may be located next to an intermodal
terminal but are engaged in a business that will never or rarely make use of it,
while those that use it daily may be located further away.
From a transportation perspective, these patterns of separate land uses on
small parcels around key pieces of transportation infrastructure funnel all
movements to municipal road networks, which create the potential for choke
points in the movement of goods, particularly as overall levels of congestion
increase. Similarly, even if a frequent user of a terminal is located close to the
terminal itself, a lack of integration that results from separate land parcels
means they too must use the local road network alongside other firms. This is
demonstrated in the blue lines in Figure 2-1, where several users of an
intermodal terminal must travel longer distances on the same path to reach
the terminal itself which creates longer travel times, higher transportation costs,
and the potential for delay as well as greater negative externalities to
neighbouring land uses and other road network users.
Freight Villages
Similar to a freight hub, the goals of a freight village are to agglomerate
transportation and logistics activities to promote economic growth and
development. But rather than control patterns of development only through
zoning, the key difference between a freight hub and a freight village is that
the freight village takes a more intentional and master planning approach to
policy and planning. The goal of this approach is to master-plan the locations
of transport and logistics activities in a way that excess movements are
Peel Enterprise Zone Business Case
PEEL GOODS MOVEMENT – REGION OF PEEL
Watson & Associates Economists Ltd. Page 20
reduced, the impact of negative externalities to communities are minimized,
and synergies among land uses are maximized.
This occurs by providing a “park” or “campus” style layout in which transport
and logistics activities can occur and intensity of movements that arise in this
sector can be accommodated. This reduces the potential chokepoints that
can occur with freight hubs when movements are funneled onto municipal
road networks and the many entry and egress points that arise from separate
land uses. This is similar to the way mixed use and compact communities
create walkable neighbourhoods, by reducing travel distances for local trips.
To fully realize the benefits of this layout, the users of a
freight village are co-located to best ensure synergies
between uses. If a rail intermodal terminal is within the
freight village, firms that regularly make use of it are
encouraged to co-locate within the same area.
Combined with an open layout, this enables these firms
to access their containers in a timely fashion. By
avoiding travel on municipal roads, terminal tractors or
shunt trucks can be used instead of full-size trucks to
transfer containers to and from the terminal and
warehouse. This can be seen conceptually in the right
panel of Figure 2-1 where co-location on a single parcel enables
transportation and logistics activities to move unimpeded by the constraints of
municipal roads and their capacities.
Freight villages take the concept of co-location a step further to maximize
internal synergies among firms on site. In addition to reducing movements
between firms and key pieces of transportation infrastructure, a freight village
incorporates more elements of the supply chain into the same site. This can
include customs, insurance, banking, postal, and other services, free/foreign
trade zone areas and basic services in support of transportation and logistics
such as fuel and maintenance facilities, restaurants and day-care facilities.
Other value added through a freight village can include features such as
shared investments in tracking technologies and services such as skills training
and human resources. Some freight villages even engage in educational
partnerships to support the labour force needs of the industries in the freight
village.
The types of synergies outlined above are increasingly being realized at a
smaller scale through co-located intermodal terminals. In the past it was
common for rail carriers to locate and operate an intermodal terminal within a
Terminal tractors or
shunt trucks are
tractors used to move
semi-trailers within a
cargo yard, warehouse
facility or intermodal
yard. These are smaller
in size and use less
energy compared to
road trucks.
Peel Enterprise Zone Business Case
PEEL GOODS MOVEMENT – REGION OF PEEL
Watson & Associates Economists Ltd. Page 21
singular site, as seen in the example of the CN Brampton Intermodal Terminal.
Private rail operators are now increasingly leading or entering into partnership
agreements to locate significant intermodal customers on the same site as an
intermodal terminal, resulting in a larger site overall.
These types of partnership agreements can be seen in Canada at the CPR
Vaughan and Calgary Intermodal Terminals and the CN Calgary Logistics Park.
Canada also features two newer projects that have developed through
partnerships between the public and private sectors. Both CentrePort in
Winnipeg, MB and the Global Transportation Hub in Regina are developing
around intermodal terminals that serve as an anchor for attracting
transportation and logistics firms. In the United States, two examples of
privately-developed co-located intermodal terminals include the CenterPoint
developments in Chicago and Kansas City. Some of these case studies are
further discussed in Section 2.2.
Together these elements maximize the concept of co-location by
concentrating transportation and logistics-related movements and reducing
transportation costs. As such, in contrast to a freight hub, the end result is a
promotion of synergistic relationships among tenants within and around a
freight village to achieve a level of efficiency that would not be possible
without coordinated freight-oriented master-planning. Such agglomeration of
transportation and logistics activity is also inward-looking in that the
concentration of activities within a single site reduces the potential for
congestion on municipal road networks and other negative externalities for
different land uses within the neighbouring area.
2.2 Freight Vi l lage Examples/Case Studies
To better illustrate the freight village concept and how it differs from other
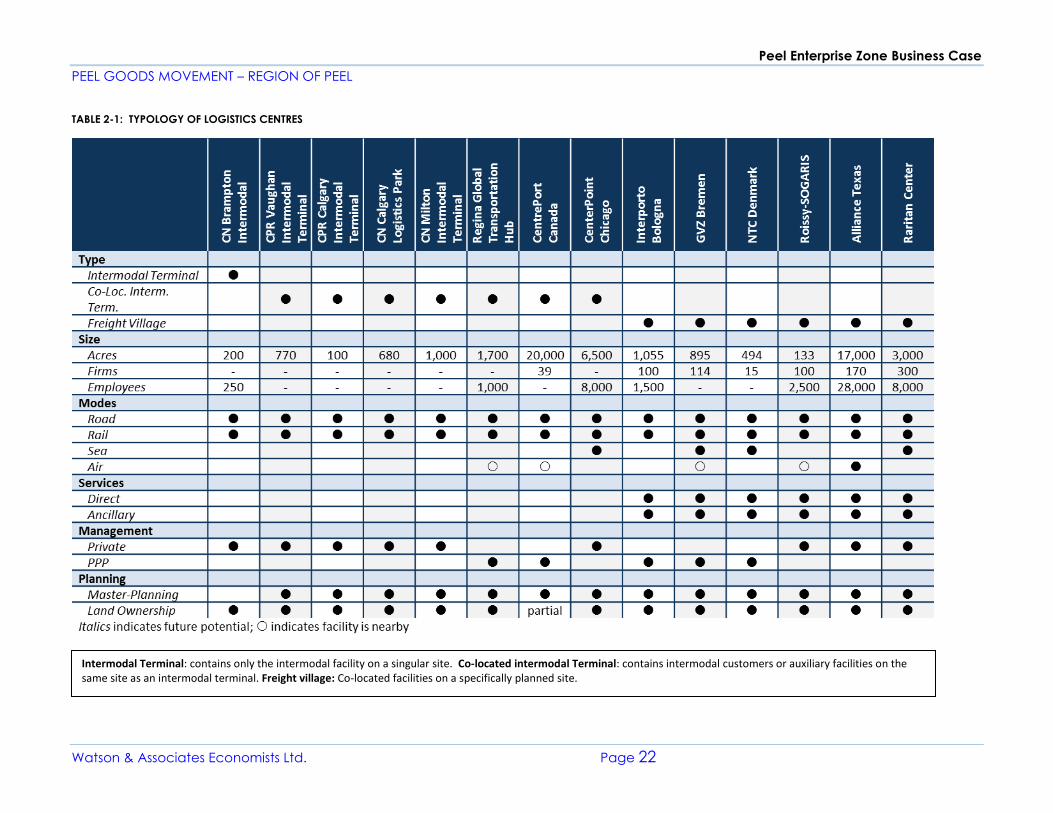
types of logistics centres, Table 2-1 on the next page provides an overview of
several freight villages and a number of intermodal terminals. Here it can be
seen that these logistics centres have much in common. They feature road
and rail connections, with some offering air and barge service and all maintain
control over land within the site. They differ in the size of the site, degree of
master planning and public-sector involvement, and the provision of direct
and ancillary services to support transportation and logistics activities.
To explore how such differences manifest themselves in practice, brief
overviews of best practice case studies are provided in this section.
Peel Enterprise Zone Business Case
PEEL GOODS MOVEMENT – REGION OF PEEL
Watson & Associates Economists Ltd. Page 22
TABLE 2-1: TYPOLOGY OF LOGISTICS CENTRES
Intermodal Terminal: contains only the intermodal facility on a singular site. Co-located intermodal Terminal: contains intermodal customers or auxiliary facilities on the same site as an intermodal terminal. Freight village: Co-located facilities on a specifically planned site.
Peel Enterprise Zone Business Case
PEEL GOODS MOVEMENT – REGION OF PEEL
Watson & Associates Economists Ltd. Page 23
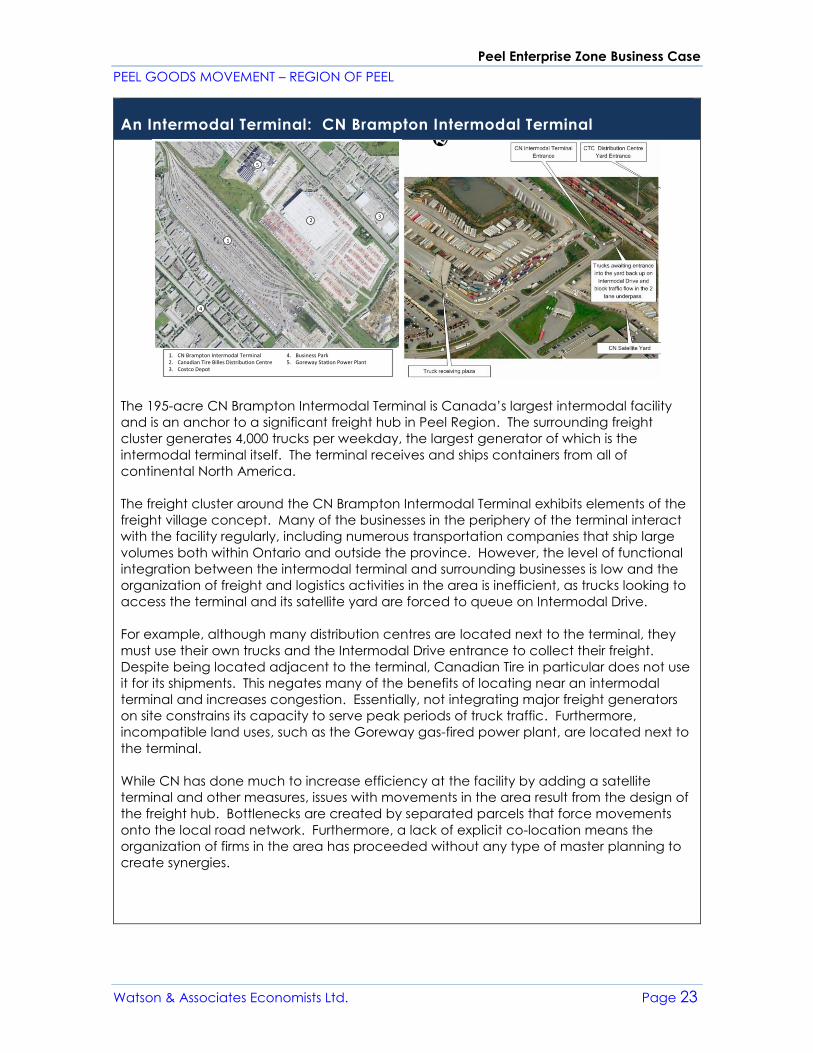
An Intermodal Terminal: CN Brampton Intermodal Terminal
The 195-acre CN Brampton Intermodal Terminal is Canada’s largest intermodal facility
and is an anchor to a significant freight hub in Peel Region. The surrounding freight
cluster generates 4,000 trucks per weekday, the largest generator of which is the
intermodal terminal itself. The terminal receives and ships containers from all of
continental North America.
The freight cluster around the CN Brampton Intermodal Terminal exhibits elements of the
freight village concept. Many of the businesses in the periphery of the terminal interact
with the facility regularly, including numerous transportation companies that ship large
volumes both within Ontario and outside the province. However, the level of functional
integration between the intermodal terminal and surrounding businesses is low and the
organization of freight and logistics activities in the area is inefficient, as trucks looking to
access the terminal and its satellite yard are forced to queue on Intermodal Drive.
For example, although many distribution centres are located next to the terminal, they
must use their own trucks and the Intermodal Drive entrance to collect their freight.
Despite being located adjacent to the terminal, Canadian Tire in particular does not use
it for its shipments. This negates many of the benefits of locating near an intermodal
terminal and increases congestion. Essentially, not integrating major freight generators
on site constrains its capacity to serve peak periods of truck traffic. Furthermore,
incompatible land uses, such as the Goreway gas-fired power plant, are located next to
the terminal.
While CN has done much to increase efficiency at the facility by adding a satellite
terminal and other measures, issues with movements in the area result from the design of
the freight hub. Bottlenecks are created by separated parcels that force movements
onto the local road network. Furthermore, a lack of explicit co-location means the
organization of firms in the area has proceeded without any type of master planning to
create synergies.
Peel Enterprise Zone Business Case
PEEL GOODS MOVEMENT – REGION OF PEEL
Watson & Associates Economists Ltd. Page 24
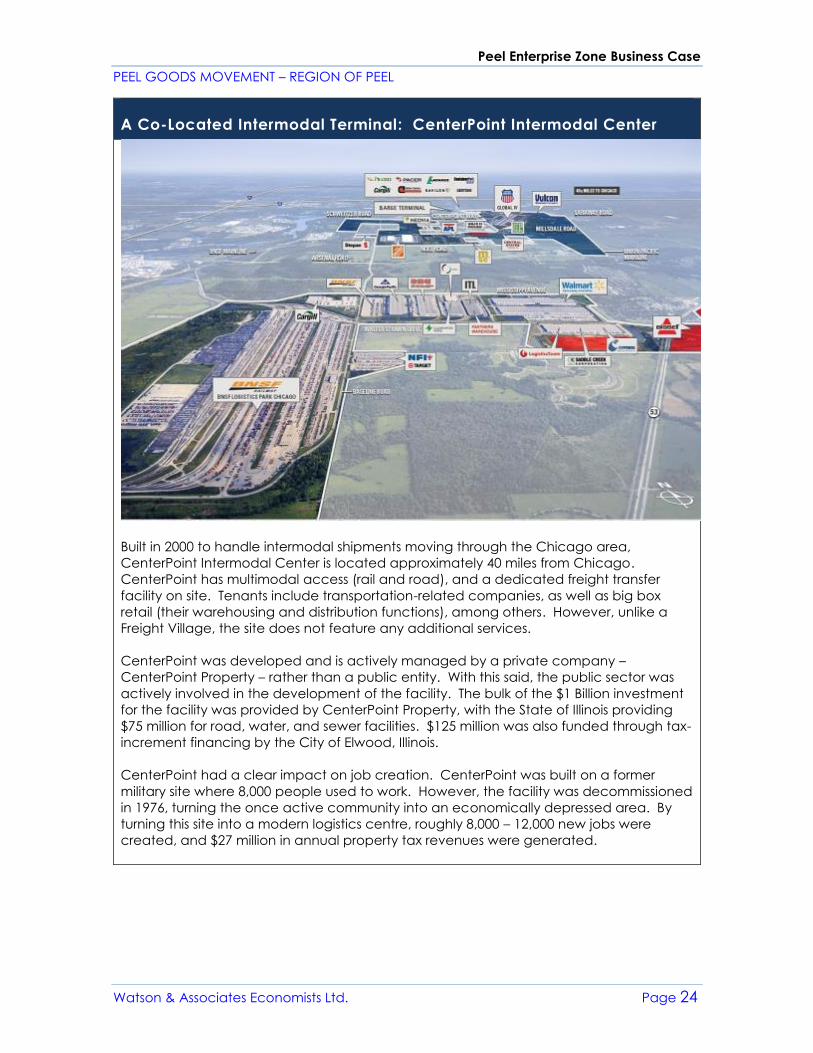
A Co-Located Intermodal Terminal: CenterPoint Intermodal Center
Built in 2000 to handle intermodal shipments moving through the Chicago area,
CenterPoint Intermodal Center is located approximately 40 miles from Chicago.
CenterPoint has multimodal access (rail and road), and a dedicated freight transfer
facility on site. Tenants include transportation-related companies, as well as big box
retail (their warehousing and distribution functions), among others. However, unlike a
Freight Village, the site does not feature any additional services.
CenterPoint was developed and is actively managed by a private company –
CenterPoint Property – rather than a public entity. With this said, the public sector was
actively involved in the development of the facility. The bulk of the $1 Billion investment
for the facility was provided by CenterPoint Property, with the State of Illinois providing
$75 million for road, water, and sewer facilities. $125 million was also funded through tax-
increment financing by the City of Elwood, Illinois.
CenterPoint had a clear impact on job creation. CenterPoint was built on a former
military site where 8,000 people used to work. However, the facility was decommissioned
in 1976, turning the once active community into an economically depressed area. By
turning this site into a modern logistics centre, roughly 8,000 – 12,000 new jobs were
created, and $27 million in annual property tax revenues were generated.
Peel Enterprise Zone Business Case
PEEL GOODS MOVEMENT – REGION OF PEEL
Watson & Associates Economists Ltd. Page 25
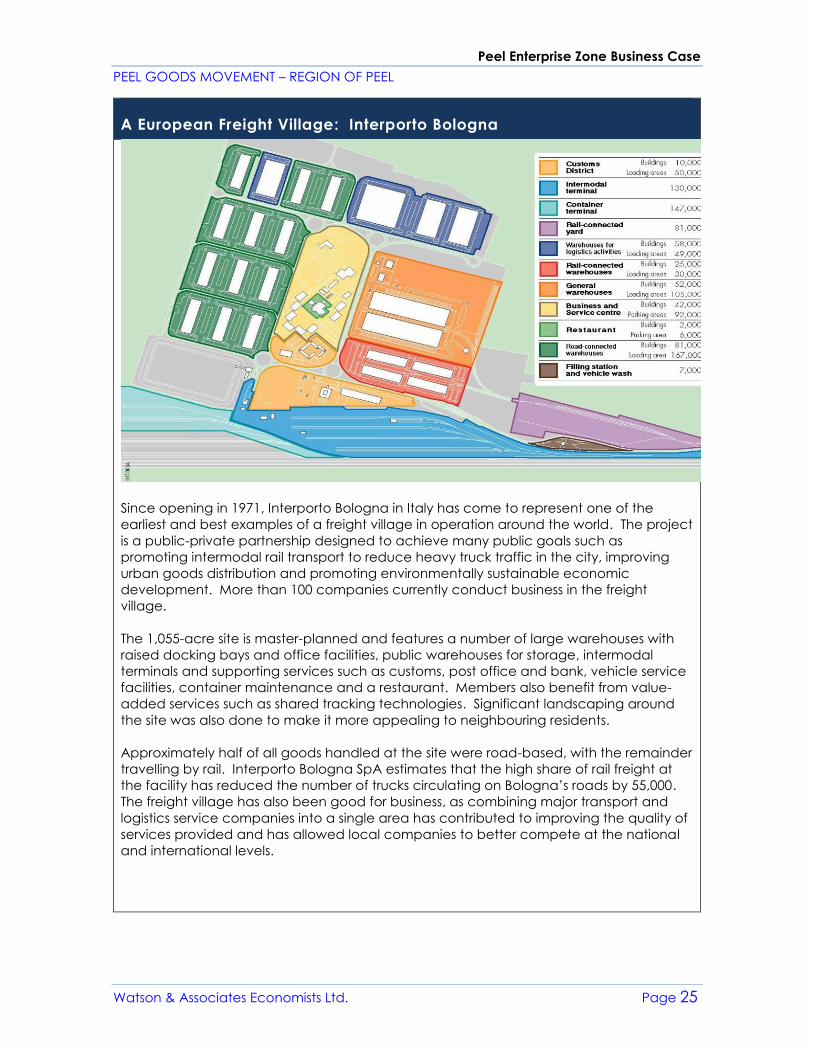
A European Freight Village: Interporto Bologna
Since opening in 1971, Interporto Bologna in Italy has come to represent one of the
earliest and best examples of a freight village in operation around the world. The project
is a public-private partnership designed to achieve many public goals such as
promoting intermodal rail transport to reduce heavy truck traffic in the city, improving
urban goods distribution and promoting environmentally sustainable economic
development. More than 100 companies currently conduct business in the freight
village.
The 1,055-acre site is master-planned and features a number of large warehouses with
raised docking bays and office facilities, public warehouses for storage, intermodal
terminals and supporting services such as customs, post office and bank, vehicle service
facilities, container maintenance and a restaurant. Members also benefit from value-
added services such as shared tracking technologies. Significant landscaping around
the site was also done to make it more appealing to neighbouring residents.
Approximately half of all goods handled at the site were road-based, with the remainder
travelling by rail. Interporto Bologna SpA estimates that the high share of rail freight at
the facility has reduced the number of trucks circulating on Bologna’s roads by 55,000.
The freight village has also been good for business, as combining major transport and
logistics service companies into a single area has contributed to improving the quality of
services provided and has allowed local companies to better compete at the national
and international levels.
NYMTC Freight Villages
Task 3, Page
(a) Existing Facilities
(b) Current and Future Expansion Areas
Source: Interporto Bologna S.p.A.
Figure 9. Interporto Bologna Layout
Peel Enterprise Zone Business Case
PEEL GOODS MOVEMENT – REGION OF PEEL
Watson & Associates Economists Ltd. Page 26
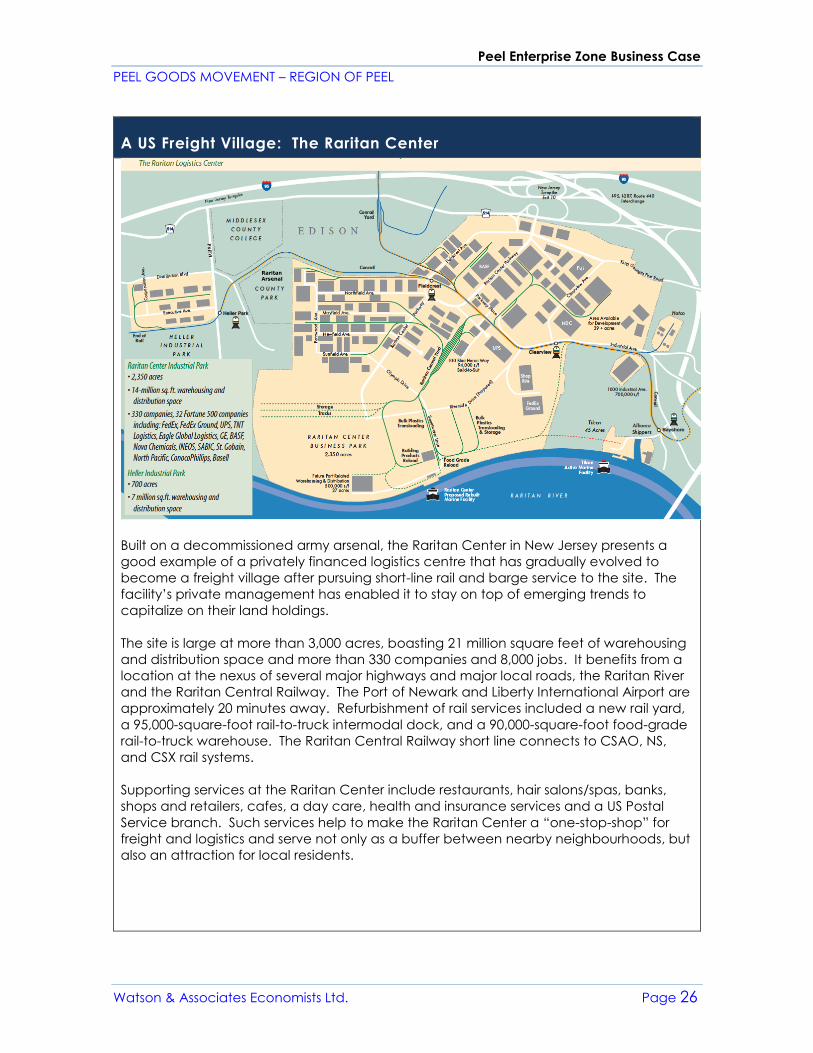
A US Freight Village: The Raritan Center
Built on a decommissioned army arsenal, the Raritan Center in New Jersey presents a
good example of a privately financed logistics centre that has gradually evolved to
become a freight village after pursuing short-line rail and barge service to the site. The
facility’s private management has enabled it to stay on top of emerging trends to
capitalize on their land holdings.
The site is large at more than 3,000 acres, boasting 21 million square feet of warehousing
and distribution space and more than 330 companies and 8,000 jobs. It benefits from a
location at the nexus of several major highways and major local roads, the Raritan River
and the Raritan Central Railway. The Port of Newark and Liberty International Airport are
approximately 20 minutes away. Refurbishment of rail services included a new rail yard,
a 95,000-square-foot rail-to-truck intermodal dock, and a 90,000-square-foot food-grade
rail-to-truck warehouse. The Raritan Central Railway short line connects to CSAO, NS,
and CSX rail systems.
Supporting services at the Raritan Center include restaurants, hair salons/spas, banks,
shops and retailers, cafes, a day care, health and insurance services and a US Postal
Service branch. Such services help to make the Raritan Center a “one-stop-shop” for
freight and logistics and serve not only as a buffer between nearby neighbourhoods, but
also an attraction for local residents.
Peel Enterprise Zone Business Case
PEEL GOODS MOVEMENT – REGION OF PEEL
Watson & Associates Economists Ltd. Page 27
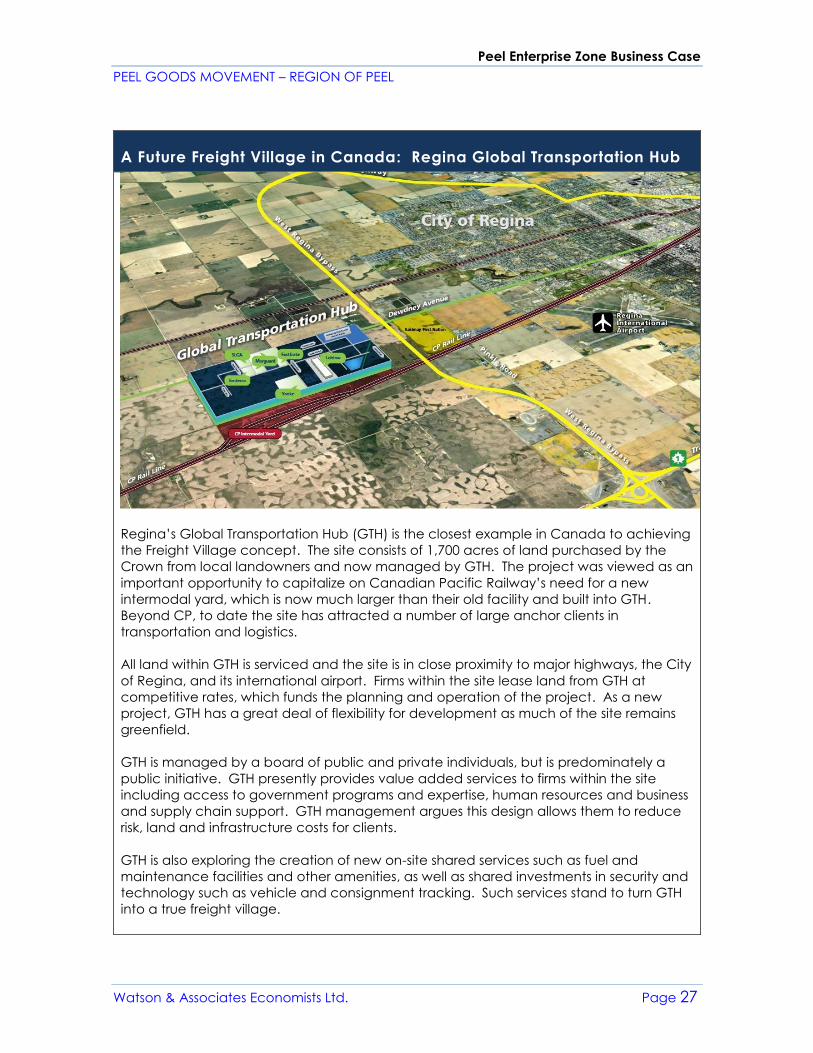
A Future Freight Village in Canada: Regina Global Transportation Hub
Regina’s Global Transportation Hub (GTH) is the closest example in Canada to achieving
the Freight Village concept. The site consists of 1,700 acres of land purchased by the
Crown from local landowners and now managed by GTH. The project was viewed as an
important opportunity to capitalize on Canadian Pacific Railway’s need for a new
intermodal yard, which is now much larger than their old facility and built into GTH.
Beyond CP, to date the site has attracted a number of large anchor clients in
transportation and logistics.
All land within GTH is serviced and the site is in close proximity to major highways, the City
of Regina, and its international airport. Firms within the site lease land from GTH at
competitive rates, which funds the planning and operation of the project. As a new
project, GTH has a great deal of flexibility for development as much of the site remains
greenfield.
GTH is managed by a board of public and private individuals, but is predominately a
public initiative. GTH presently provides value added services to firms within the site
including access to government programs and expertise, human resources and business
and supply chain support. GTH management argues this design allows them to reduce
risk, land and infrastructure costs for clients.
GTH is also exploring the creation of new on-site shared services such as fuel and
maintenance facilities and other amenities, as well as shared investments in security and
technology such as vehicle and consignment tracking. Such services stand to turn GTH
into a true freight village.
Peel Enterprise Zone Business Case
PEEL GOODS MOVEMENT – REGION OF PEEL
Watson & Associates Economists Ltd. Page 28
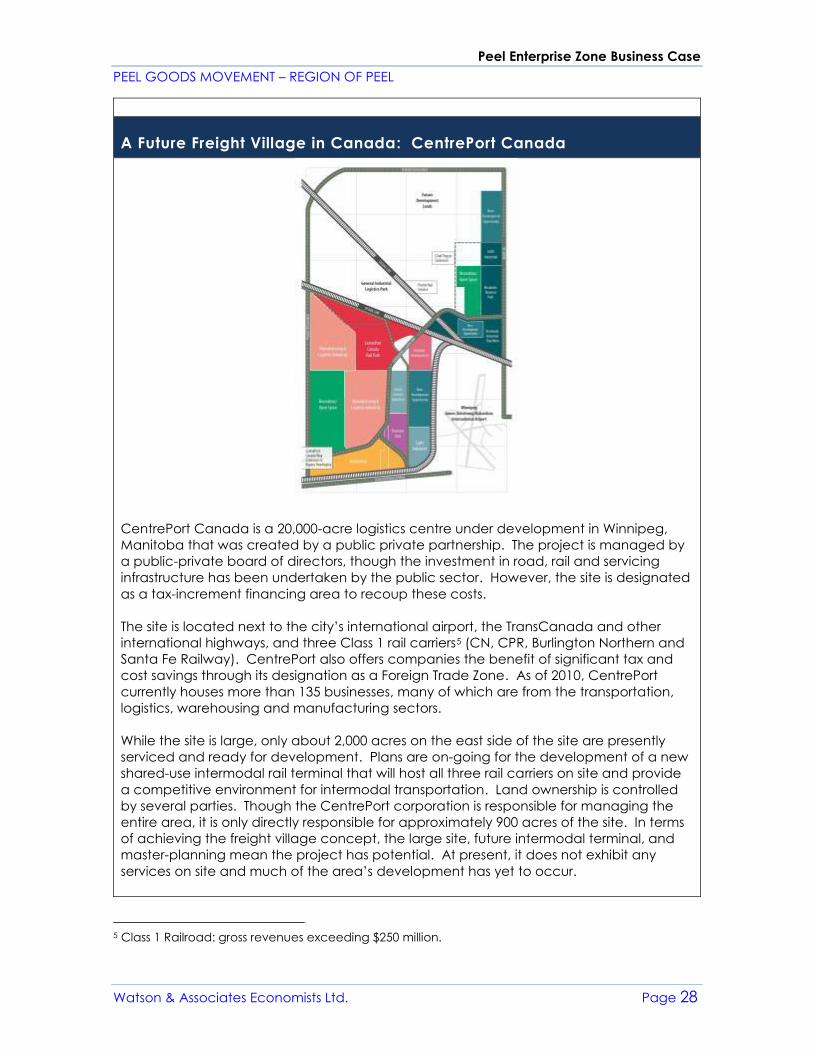
A Future Freight Village in Canada: CentrePort Canada
CentrePort Canada is a 20,000-acre logistics centre under development in Winnipeg,
Manitoba that was created by a public private partnership. The project is managed by
a public-private board of directors, though the investment in road, rail and servicing
infrastructure has been undertaken by the public sector. However, the site is designated
as a tax-increment financing area to recoup these costs.
The site is located next to the city’s international airport, the TransCanada and other
international highways, and three Class 1 rail carriers5 (CN, CPR, Burlington Northern and
Santa Fe Railway). CentrePort also offers companies the benefit of significant tax and
cost savings through its designation as a Foreign Trade Zone. As of 2010, CentrePort
currently houses more than 135 businesses, many of which are from the transportation,
logistics, warehousing and manufacturing sectors.
While the site is large, only about 2,000 acres on the east side of the site are presently
serviced and ready for development. Plans are on-going for the development of a new
shared-use intermodal rail terminal that will host all three rail carriers on site and provide
a competitive environment for intermodal transportation. Land ownership is controlled
by several parties. Though the CentrePort corporation is responsible for managing the
entire area, it is only directly responsible for approximately 900 acres of the site. In terms
of achieving the freight village concept, the large site, future intermodal terminal, and
master-planning mean the project has potential. At present, it does not exhibit any
services on site and much of the area’s development has yet to occur.
5 Class 1 Railroad: gross revenues exceeding $250 million.
Peel Enterprise Zone Business Case
PEEL GOODS MOVEMENT – REGION OF PEEL
Watson & Associates Economists Ltd. Page 29
2.3 Exploring the Case for a Peel Enterprise Zone in Peel
To explore the case for a freight village in Peel, we will base our analysis on
high-level factors such as:
• Benefits as they relate to conditions in Peel
• Possible conceptual constraints
• Demand and industry compatibility
Following this, in Section 4 we identified various locations that based on their
characteristics would be compatible with the freight village concept. We
further took these locations and ranked them against a checklist of criteria
developed using stakeholder input to identify a preferred location. This
preferred location was then used in a conceptual and feasibility exercise in
order to conduct further analysis related to capital and servicing costs, for
example, for a PEZ in Peel Region.
PEZ Benefits
Higgins and Ferguson (2011) noted a number of benefits that arise from freight
village implementations around the world, both in theory and practice. In the
broadest sense, freight villages can achieve both private and public goals.
For industry, freight villages have been shown to enable the achievement of
higher levels of efficiency, productivity and profitability from the synergies that
result from co-location and master-planning. Such benefits are important for
giving firms a competitive advantage as global supply chains become
increasingly complex.
Freight villages as a concept, align well with policy and planning goals in Peel
at the regional and local municipal levels. Freight villages can overall reduce
the negative externalities involved in transportation and logistics activities. This
includes reductions in noise, pollution, traffic congestion, road maintenance
(by localizing movements within a specific site), and also the increased use of
other transportation options through the promotion of intermodal movements.
These are facilitated by the campus-style layout of a freight village,
concentrating these movements within a single area. In the case of Interporto
Bologna there is evidence that it can result in significant reductions in truck
traffic on local roads. Freight villages also produce employment and
economic development by attracting a large number of jobs to specific sites in
freight and logistics activities and freight-oriented services.
Peel Enterprise Zone Business Case
PEEL GOODS MOVEMENT – REGION OF PEEL
Watson & Associates Economists Ltd. Page 30
Conceptual Constraints
It is important to note that freight villages, also have several shortcomings.
Primary among them is that the success of a freight village depends on the
ability to attract firms to locate within the site. Because transportation and
logistics activities generally take place in an open market, this means the
freight village is subject to market demand and must present a clear value
proposition to firms.
The achievement of high levels of synergies also requires not only attracting
firms, but the right type of firms that will make best use of infrastructure and
complement existing freight village tenants. For publicly managed freight
villages in particular, this can create a potential source of conflict as there may
be pressures to build out the site as quickly as possible regardless of tenant
demand. Recognizing this, a balance must be struck between generally
attracting firms and attracting the right firms to co-locate in order to maximize
potential synergies. One solution is during the master planning process, to set
aside prime land around key infrastructure according to a vision for the best
uses and users of the site.
A further issue relates to achieving employment densities for new greenfield
development. Transportation and logistics activities in general are land
intensive and with often low on-site labour requirements, which can result in
low employment densities. Increasing automation in this sector stands to
reduce densities even further over the long term. However, project
management, the provision of complementary services on site and a more
campus-style development pattern has the potential to lead to higher levels of
employment in general and employment intensity in particular within a freight
village site.
Demand and Industry Compatibility
If a freight village is to be successful, it must respond to demand for particular
site and locational characteristics among transportation and logistics firms.
While such information on firm demand is typically difficult to obtain in a
systematic manner, recent research by Jakubicek and Woudsma (2011) and
Woudsma (2012) offers valuable insight on industry locational decisions in the
Ontario context.
Contrasting this information with the features of a potential freight village
reveals a strong base of demand. Data from a 2011 survey of 42 members of
the Supply Chain and Logistics Canada association, in which 83% of
respondents were from Ontario, revealed factors of high, neutral and low
Peel Enterprise Zone Business Case
PEEL GOODS MOVEMENT – REGION OF PEEL
Watson & Associates Economists Ltd. Page 31
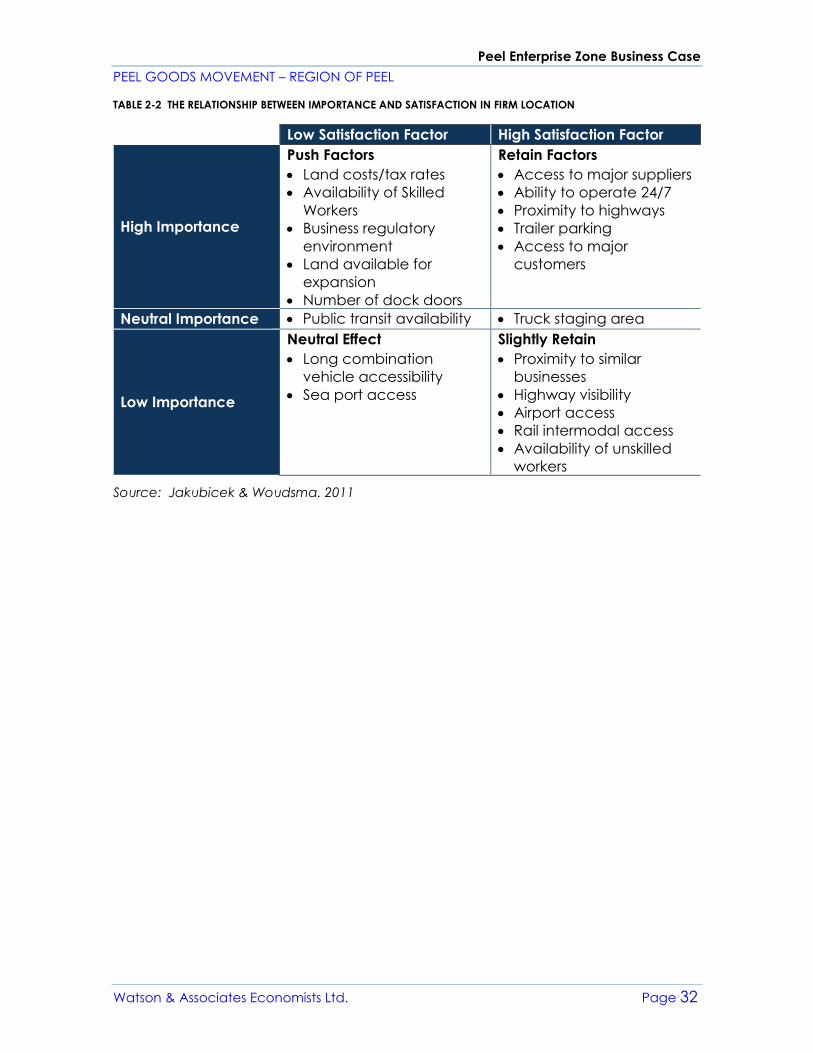
importance and a respondent’s present satisfaction with them (Table 2-2). It
can be seen that respondents identified proximity to major transportation
infrastructure, access to major customers and suppliers, operating hours and
site parking as factors of major importance. These were also factors they were
presently satisfied with in their current locations.
However, respondents also noted factors of high importance that they were
not presently satisfied with and may influence them to relocate. These include
high land costs and tax rates, the availability of skilled workers and land for
expansion, a burdensome regulatory environment and the number of dock
doors in their present facility.
These high importance factors could be addressed through a freight village
concept. If such a facility is in the right location by being proximate to high-
order transportation infrastructure, important suppliers, and a major market of
customers and skilled workers, offers land at reasonable rates with room for
expansion and ample room to conduct freight operations, it provides a solution
that many transportation and logistics firms are looking for in a location.
Furthermore, by ensuring that factors that are listed as high importance but low
satisfaction are addressed, a freight village may offer a competitive
advantage compared to other locations in the region.
It is also worth noting the factors rated as low importance in terms of a firm’s
locational decisions include proximity to rail intermodal facilities and airport
access. According to survey respondents, having rail intermodal facilities on
site, at a location close to the airport is not essential.
It is still important to keep in mind that while such factors may be of low
importance based on surveys, they may be crucial for some firms. This would
need to be explored in the context of the Region of Peel’s Goods Movement
industry. Finally, accessibility to sea ports and long combination vehicles are
both factors of low present satisfaction and low importance, as they do not
provide a competitive advantage to a freight village compared to the more
important factors highlighted above.
Peel Enterprise Zone Business Case
PEEL GOODS MOVEMENT – REGION OF PEEL
Watson & Associates Economists Ltd. Page 32
TABLE 2-2 THE RELATIONSHIP BETWEEN IMPORTANCE AND SATISFACTION IN FIRM LOCATION
Low Satisfaction Factor High Satisfaction Factor
High Importance
Push Factors
• Land costs/tax rates
• Availability of Skilled
Workers
• Business regulatory
environment
• Land available for
expansion
• Number of dock doors
Retain Factors
• Access to major suppliers
• Ability to operate 24/7
• Proximity to highways
• Trailer parking
• Access to major
customers
Neutral Importance • Public transit availability • Truck staging area
Low Importance
Neutral Effect
• Long combination
vehicle accessibility
• Sea port access
Slightly Retain
• Proximity to similar
businesses
• Highway visibility
• Airport access
• Rail intermodal access
• Availability of unskilled
workers
Source: Jakubicek & Woudsma. 2011
Peel Enterprise Zone Business Case
PEEL GOODS MOVEMENT – REGION OF PEEL
Watson & Associates Economists Ltd. Page 33
3. EMPLOYMENT LAND NEEDS ASSOCIATED WITH THE
GOODS MOVEMENT SECTOR IN PEEL
The following Chapter provides an analysis of the key macro-economic trends
that are shaping the economy in the Region of Peel, including the importance
of the Goods Movement sector in Peel and the future outlook of this sector. An
examination of the anticipated land needs of the Goods Movement sector
and its impact on employment lands in Peel Region is provided. In
accordance with available data, most of the employment trends referenced
in this sector cover the 2006 to 2014 period.
3.1 Macro-Economic Trends
The Ontario economy is facing significant structural changes. Over the past
decade, the economic base, as measured by GDP output, has shifted from
goods-producing sectors (i.e. manufacturing, utilities and primary) to services-
producing ones. Much of this shift has occurred in the past ten years, driven by
GDP declines in the manufacturing sector which were most significant
immediately following the 2008/2009 global economic downturn.
Manufacturing, a significant component of the provincial economy, has seen
its relative share of GDP decline from 21% in 2003 to 13% in 2013 largely as a
result of increased global competition.6 The challenges of the manufacturing
sector are also reflected in the Ontario labour force, which declined by 31%
over the 2004 to 2014 period.7 It is important to note, however, that provincial
labour force rates in the manufacturing sector have been relatively stable
since 2010. In contrast, service-based sectors such as financial and business
services have seen significant increases over the past decade. Growth in
service-based sectors has been driven by strong growth in domestic demand,
particularly in consumer spending.
Structural changes in the economy are changing the character of economic
activities on employment lands and impacting the built form and character of
Employment Areas in Ontario. Over the past decade, the composition of
industrial employment in Ontario has evolved, with less emphasis on domestic
manufacturing driven by increased outsourcing of production to emerging
global markets. While manufacturing remains vitally important to the provincial
economy with respect to jobs and economic output, this sector is not
6 Derived from Statistics Canada CANSIM Table 379-0028 – Gross domestic product (GDP) at basic
prices, by Watson & Associates Economists Ltd. 7 Derived from Statistics Canada Labour Force Survey data by Watson & Associates Economists Ltd.
Peel Enterprise Zone Business Case
PEEL GOODS MOVEMENT – REGION OF PEEL
Watson & Associates Economists Ltd. Page 34
anticipated to support strong domestic labour force growth in the future.
Looking forward, there will continue to be a manufacturing focus in Ontario
and Peel Region. Industrial processes, however, have become more capital
intensive and automated as local industries are required to streamline
production through increased product innovation, specialization and
integration of technology. This means that as the domestic manufacturing
sector continues to gradually recover, economic output will increase, yet
modest employment growth is anticipated in the sector.
While the manufacturing sector has steadily contracted over the past decade,
there have been growth opportunities in other forms of industrial development.
Post-recession (i.e. post-2009) industrial development has been largely oriented
to large-scale industrial buildings housing wholesale trade, distribution and
logistics. This has been driven by increasing demand in the Goods Movement
sector to store and manage the distribution/transportation of goods produced
locally as well as goods imported from abroad. These facilities tend to be land-
extensive and typically located in greenfield areas which are accessible via
road and rail, and offer future expansion potential. This trend, combined with
increased automation in the manufacturing sector, has resulted in a decrease
in average employment density levels on employment lands across many
GTHA municipalities.
The GTHA has a dynamic and competitive economic base which is highly
diverse. The regional economy is comprised of a mix of mature and emerging
industry clusters and contains a significant industrial and office market base.
Similar to the provincial economy as a whole, the nature of the GTHA economy
is changing. Over the past two decades, the composition of GTHA
employment has gradually shifted from a goods-producing economy to a
services-producing economy, led by employment growth in sectors such as
accommodation and food, health care and social assistance, professional,
scientific and technical services and retail trade.
Despite the 2008/09 global economic slowdown, GTHA employment levels
have steadily increased in almost all major areas of the service sector since
2006. Since then, employment growth in the service sector has averaged 2.3%
annually. Many of these sectors, including professional, scientific and technical
services, financial services, information and cultural industries, education
services, health care, social services and real estate, represent a large portion
of the “knowledge-based” and “creative-class” economy.8 A number of the
uses within these sectors are permitted on employment lands across the GTHA
8 Richard Florida, The Rise of the Creative Class. 2002
Peel Enterprise Zone Business Case
PEEL GOODS MOVEMENT – REGION OF PEEL
Watson & Associates Economists Ltd. Page 35
and represent a growing share of the employment base on employment lands,
most notably in heavily populated urban GTHA municipalities.
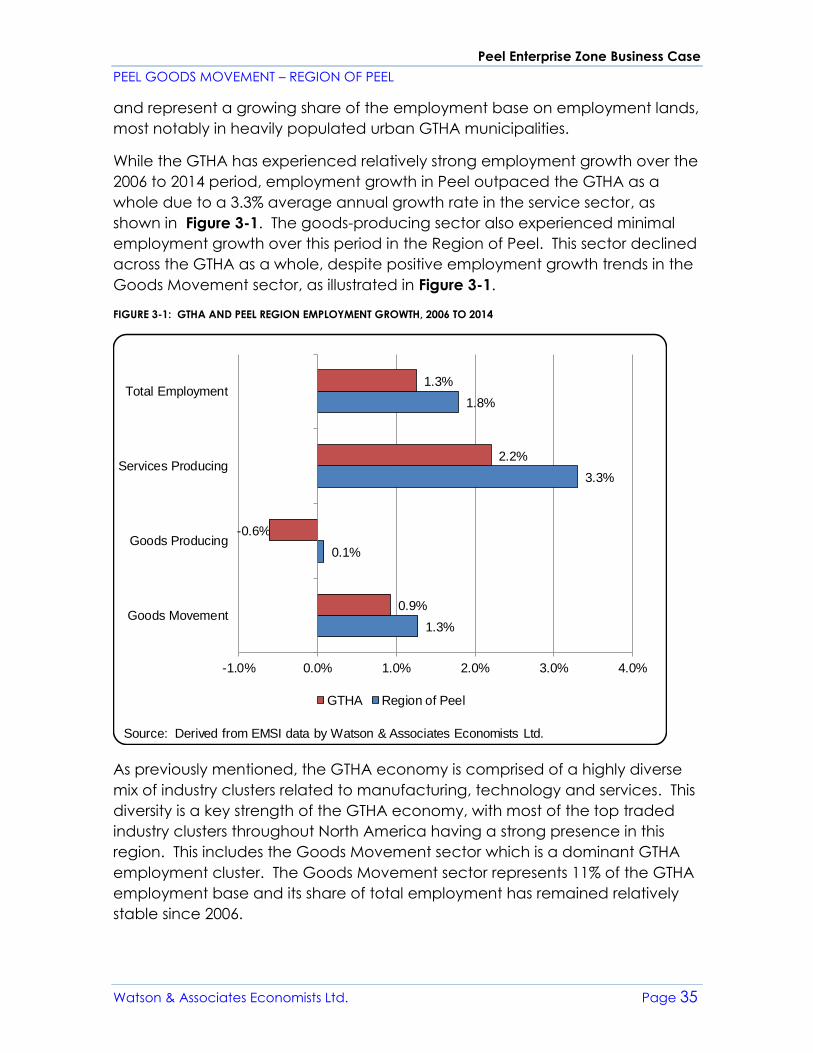
While the GTHA has experienced relatively strong employment growth over the
2006 to 2014 period, employment growth in Peel outpaced the GTHA as a
whole due to a 3.3% average annual growth rate in the service sector, as
shown in Figure 3-1. The goods-producing sector also experienced minimal
employment growth over this period in the Region of Peel. This sector declined
across the GTHA as a whole, despite positive employment growth trends in the
Goods Movement sector, as illustrated in Figure 3-1.
FIGURE 3-1: GTHA AND PEEL REGION EMPLOYMENT GROWTH, 2006 TO 2014
As previously mentioned, the GTHA economy is comprised of a highly diverse
mix of industry clusters related to manufacturing, technology and services. This
diversity is a key strength of the GTHA economy, with most of the top traded
industry clusters throughout North America having a strong presence in this
region. This includes the Goods Movement sector which is a dominant GTHA
employment cluster. The Goods Movement sector represents 11% of the GTHA
employment base and its share of total employment has remained relatively
stable since 2006.
1.3%
0.1%
3.3%
1.8%
0.9%
-0.6%
2.2%
1.3%
-1.0% 0.0% 1.0% 2.0% 3.0% 4.0%
Goods Movement
Goods Producing
Services Producing
Total Employment
GTHA Region of Peel
Source: Derived from EMSI data by Watson & Associates Economists Ltd.
Peel Enterprise Zone Business Case
PEEL GOODS MOVEMENT – REGION OF PEEL
Watson & Associates Economists Ltd. Page 36
Ontario’s Goods Movement sector is highly concentrated in the GTHA
municipalities which are located within proximity to the Toronto Pearson
International Airport (TPIA). Other regional infrastructure attributes, including
access to 400-series highways and intermodal facilities in Brampton and
Vaughan, have also played a key role in driving demand and spatial
distribution patterns within this sector across the GTHA.
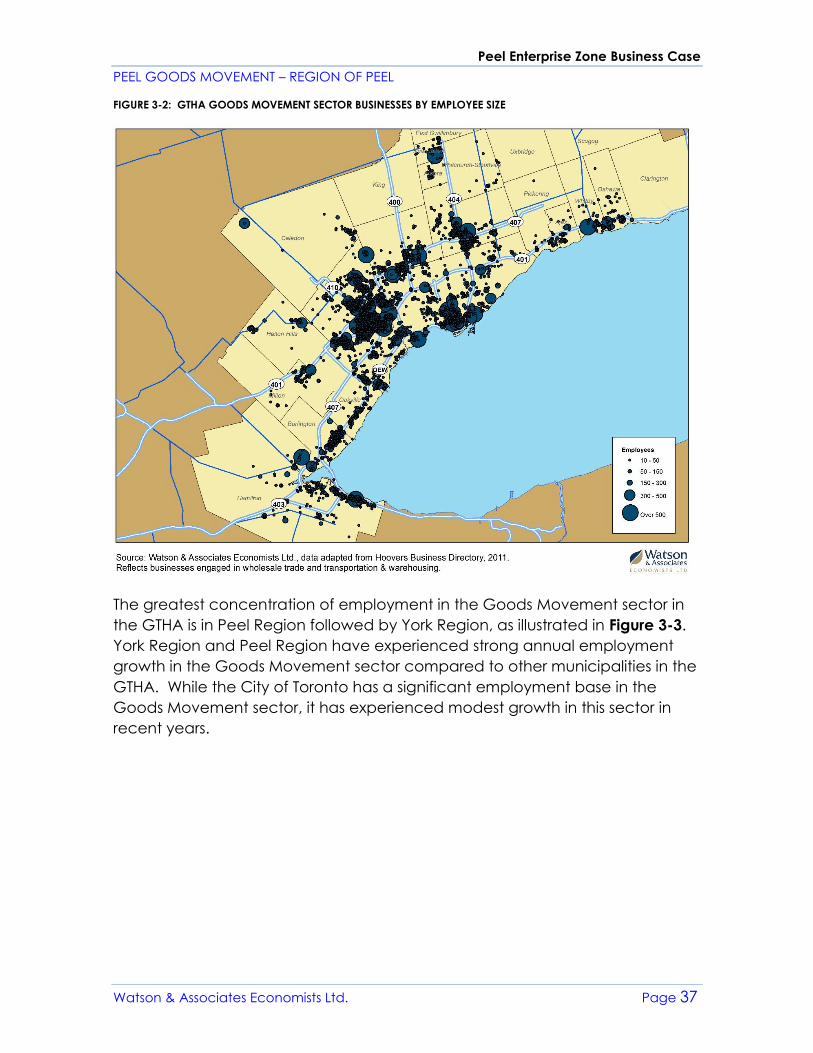
The spatial distribution of the Goods Movement sector in the GTHA is illustrated
in Figure 3-2. As shown, the Goods Movement sector is primarily concentrated
in the west and north of the GTHA. The location of transportation and
warehousing businesses is largely concentrated in Peel Region and the City of
Toronto. In Peel Region, businesses are concentrated near the TPIA, the
Brampton CN Intermodal and major 400-series highway corridors, particularly
where two 400-series highways intersect. Other major Goods Movement nodes
outside of Peel include the Highway 400/407 area of Vaughan, the Highway
404/407 area of Richmond Hill/Markham and the Highway 401 corridor in
Milton. The Canadian Pacific Intermodal Facility within the Vaughan Enterprise
Zone will continue to drive growth and investment in the transportation and
warehousing sector in York Region, particularly in the City of Vaughan.
Peel Enterprise Zone Business Case
PEEL GOODS MOVEMENT – REGION OF PEEL
Watson & Associates Economists Ltd. Page 37
FIGURE 3-2: GTHA GOODS MOVEMENT SECTOR BUSINESSES BY EMPLOYEE SIZE
The greatest concentration of employment in the Goods Movement sector in
the GTHA is in Peel Region followed by York Region, as illustrated in Figure 3-3.
York Region and Peel Region have experienced strong annual employment
growth in the Goods Movement sector compared to other municipalities in the
GTHA. While the City of Toronto has a significant employment base in the
Goods Movement sector, it has experienced modest growth in this sector in
recent years.
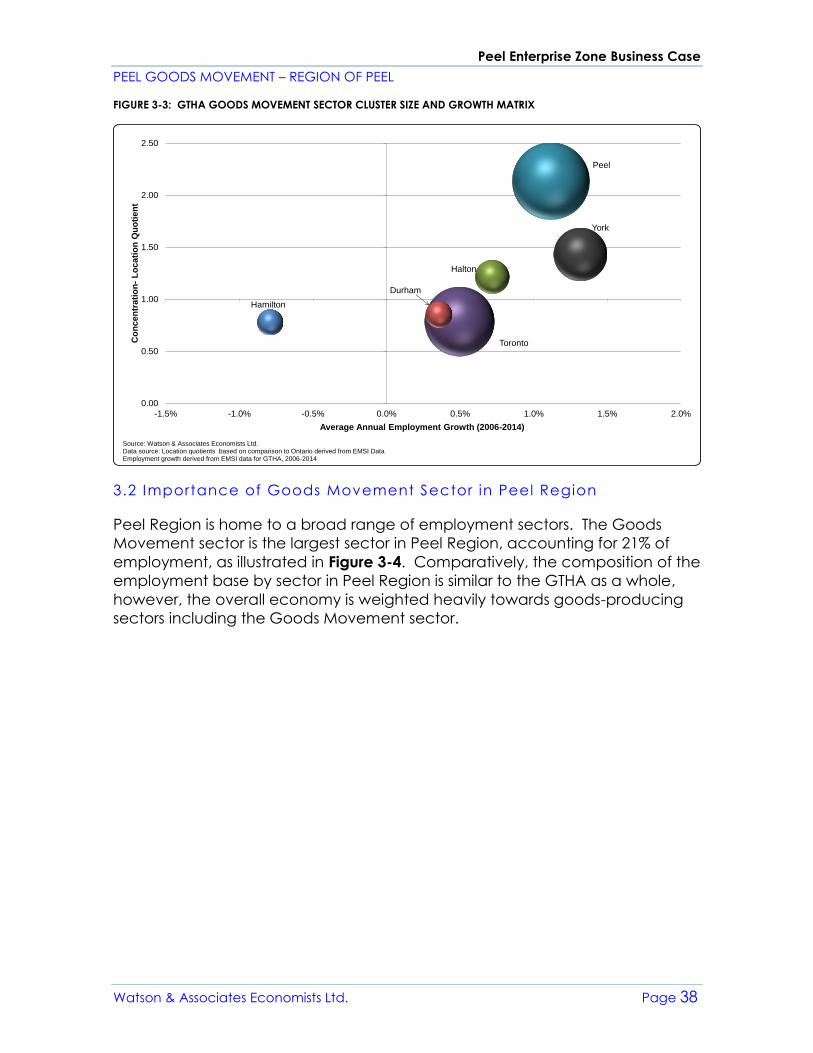
Peel Enterprise Zone Business Case
PEEL GOODS MOVEMENT – REGION OF PEEL
Watson & Associates Economists Ltd. Page 38
FIGURE 3-3: GTHA GOODS MOVEMENT SECTOR CLUSTER SIZE AND GROWTH MATRIX
3.2 Importance of Goods Movement Sector in Peel Region
Peel Region is home to a broad range of employment sectors. The Goods
Movement sector is the largest sector in Peel Region, accounting for 21% of
employment, as illustrated in Figure 3-4. Comparatively, the composition of the
employment base by sector in Peel Region is similar to the GTHA as a whole,
however, the overall economy is weighted heavily towards goods-producing
sectors including the Goods Movement sector.
Halton
Toronto
Durham
Hamilton
Peel
York
0.00
0.50
1.00
1.50
2.00
2.50
-1.5% -1.0% -0.5% 0.0% 0.5% 1.0% 1.5% 2.0%
Co
ncen
trati
on
-L
ocati
on
Qu
oti
en
t
Average Annual Employment Growth (2006-2014)
Source: Watson & Associates Economists Ltd.Data source: Location quotients based on comparison to Ontario derived from EMSI DataEmployment growth derived from EMSI data for GTHA, 2006-2014
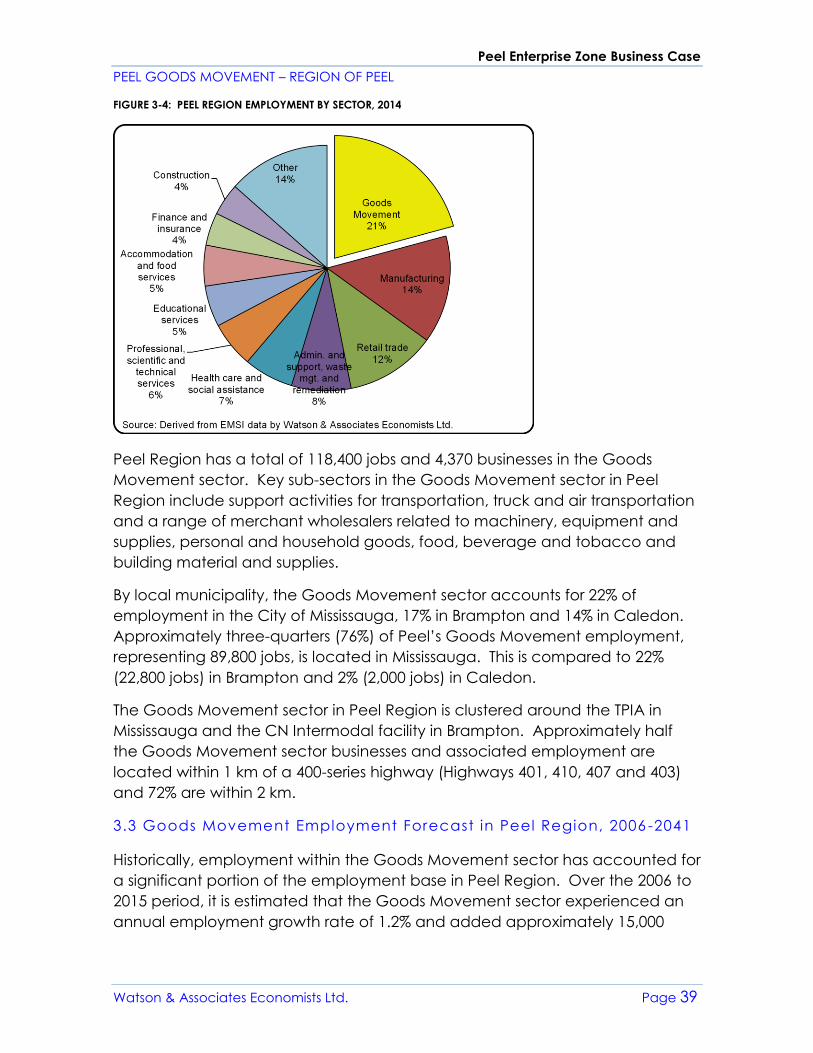
Peel Enterprise Zone Business Case
PEEL GOODS MOVEMENT – REGION OF PEEL
Watson & Associates Economists Ltd. Page 39
FIGURE 3-4: PEEL REGION EMPLOYMENT BY SECTOR, 2014
Peel Region has a total of 118,400 jobs and 4,370 businesses in the Goods
Movement sector. Key sub-sectors in the Goods Movement sector in Peel
Region include support activities for transportation, truck and air transportation
and a range of merchant wholesalers related to machinery, equipment and
supplies, personal and household goods, food, beverage and tobacco and
building material and supplies.
By local municipality, the Goods Movement sector accounts for 22% of
employment in the City of Mississauga, 17% in Brampton and 14% in Caledon.
Approximately three-quarters (76%) of Peel’s Goods Movement employment,
representing 89,800 jobs, is located in Mississauga. This is compared to 22%
(22,800 jobs) in Brampton and 2% (2,000 jobs) in Caledon.
The Goods Movement sector in Peel Region is clustered around the TPIA in
Mississauga and the CN Intermodal facility in Brampton. Approximately half
the Goods Movement sector businesses and associated employment are
located within 1 km of a 400-series highway (Highways 401, 410, 407 and 403)
and 72% are within 2 km.
3.3 Goods Movement Employment Forecast in Peel Region, 2006 -2041
Historically, employment within the Goods Movement sector has accounted for
a significant portion of the employment base in Peel Region. Over the 2006 to
2015 period, it is estimated that the Goods Movement sector experienced an
annual employment growth rate of 1.2% and added approximately 15,000
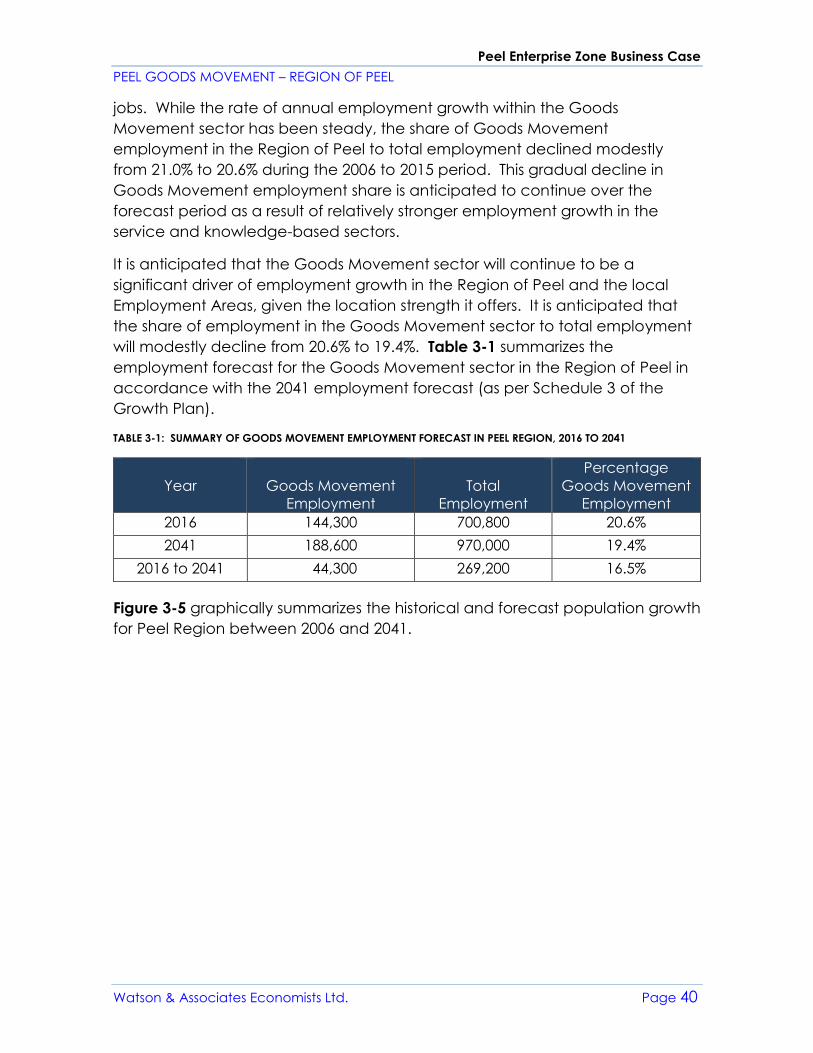
Peel Enterprise Zone Business Case
PEEL GOODS MOVEMENT – REGION OF PEEL
Watson & Associates Economists Ltd. Page 40
jobs. While the rate of annual employment growth within the Goods
Movement sector has been steady, the share of Goods Movement
employment in the Region of Peel to total employment declined modestly
from 21.0% to 20.6% during the 2006 to 2015 period. This gradual decline in
Goods Movement employment share is anticipated to continue over the
forecast period as a result of relatively stronger employment growth in the
service and knowledge-based sectors.
It is anticipated that the Goods Movement sector will continue to be a
significant driver of employment growth in the Region of Peel and the local
Employment Areas, given the location strength it offers. It is anticipated that
the share of employment in the Goods Movement sector to total employment
will modestly decline from 20.6% to 19.4%. Table 3-1 summarizes the
employment forecast for the Goods Movement sector in the Region of Peel in
accordance with the 2041 employment forecast (as per Schedule 3 of the
Growth Plan).
TABLE 3-1: SUMMARY OF GOODS MOVEMENT EMPLOYMENT FORECAST IN PEEL REGION, 2016 TO 2041
Year
Goods Movement
Employment
Total
Employment
Percentage
Goods Movement
Employment
2016 144,300 700,800 20.6%
2041 188,600 970,000 19.4%
2016 to 2041 44,300 269,200 16.5%
Figure 3-5 graphically summarizes the historical and forecast population growth
for Peel Region between 2006 and 2041.
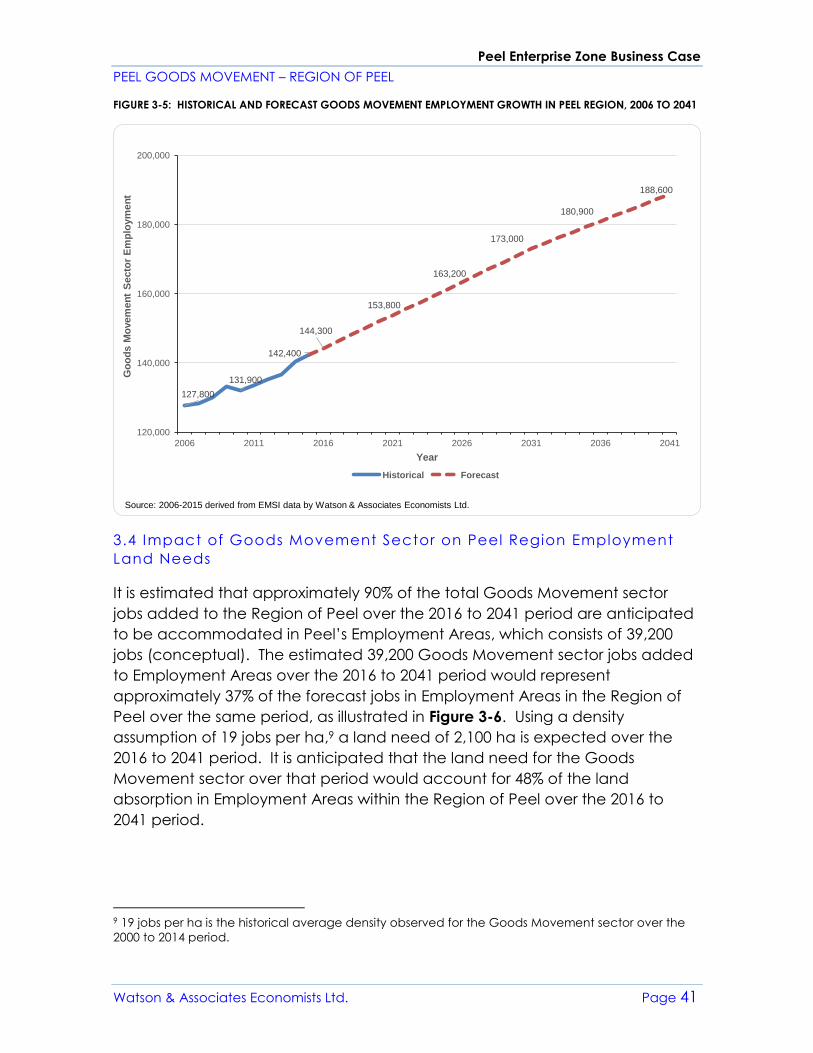
Peel Enterprise Zone Business Case
PEEL GOODS MOVEMENT – REGION OF PEEL
Watson & Associates Economists Ltd. Page 41
FIGURE 3-5: HISTORICAL AND FORECAST GOODS MOVEMENT EMPLOYMENT GROWTH IN PEEL REGION, 2006 TO 2041
3.4 Impact of Goods Movement Sector on Peel Region Employment
Land Needs
It is estimated that approximately 90% of the total Goods Movement sector
jobs added to the Region of Peel over the 2016 to 2041 period are anticipated
to be accommodated in Peel’s Employment Areas, which consists of 39,200
jobs (conceptual). The estimated 39,200 Goods Movement sector jobs added
to Employment Areas over the 2016 to 2041 period would represent
approximately 37% of the forecast jobs in Employment Areas in the Region of
Peel over the same period, as illustrated in Figure 3-6. Using a density
assumption of 19 jobs per ha,9 a land need of 2,100 ha is expected over the
2016 to 2041 period. It is anticipated that the land need for the Goods
Movement sector over that period would account for 48% of the land
absorption in Employment Areas within the Region of Peel over the 2016 to
2041 period.
9 19 jobs per ha is the historical average density observed for the Goods Movement sector over the
2000 to 2014 period.
127,800
131,900
142,400
144,300
153,800
163,200
173,000
180,900
188,600
120,000
140,000
160,000
180,000
200,000
2006 2011 2016 2021 2026 2031 2036 2041
Go
od
s M
ovem
en
t S
ecto
r E
mp
loym
en
t
Year
Historical Forecast
Source: 2006-2015 derived from EMSI data by Watson & Associates Economists Ltd.
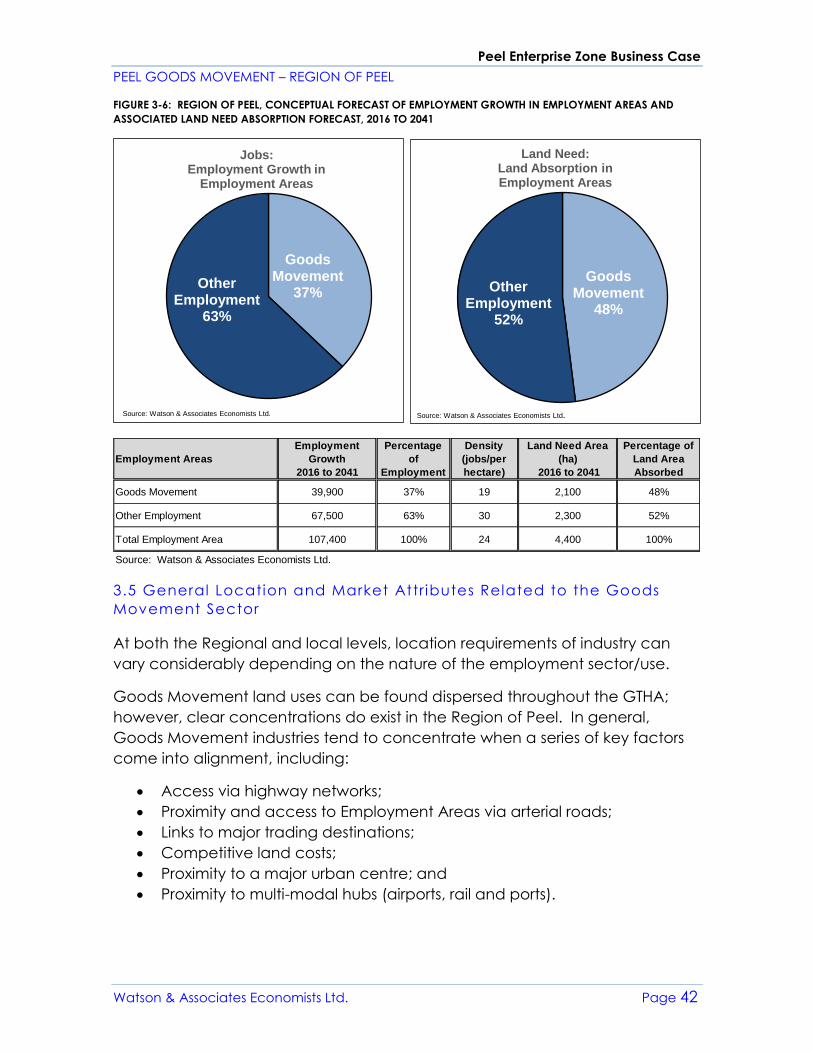
Peel Enterprise Zone Business Case
PEEL GOODS MOVEMENT – REGION OF PEEL
Watson & Associates Economists Ltd. Page 42
FIGURE 3-6: REGION OF PEEL, CONCEPTUAL FORECAST OF EMPLOYMENT GROWTH IN EMPLOYMENT AREAS AND
ASSOCIATED LAND NEED ABSORPTION FORECAST, 2016 TO 2041
3.5 General Location and Market Attr ibutes Related to the Goods
Movement Sector
At both the Regional and local levels, location requirements of industry can
vary considerably depending on the nature of the employment sector/use.
Goods Movement land uses can be found dispersed throughout the GTHA;
however, clear concentrations do exist in the Region of Peel. In general,
Goods Movement industries tend to concentrate when a series of key factors
come into alignment, including:
• Access via highway networks;
• Proximity and access to Employment Areas via arterial roads;
• Links to major trading destinations;
• Competitive land costs;
• Proximity to a major urban centre; and
• Proximity to multi-modal hubs (airports, rail and ports).
Goods Movement
48%
Other Employment
52%
Land Need: Land Absorption in Employment Areas
Source: Watson & Associates Economists Ltd.
Goods Movement
37%Other
Employment 63%
Jobs: Employment Growth in
Employment Areas
Source: Watson & Associates Economists Ltd.
Employment Areas
Employment
Growth
2016 to 2041
Percentage
of
Employment
Density
(jobs/per
hectare)
Land Need Area
(ha)
2016 to 2041
Percentage of
Land Area
Absorbed
Goods Movement 39,900 37% 19 2,100 48%
Other Employment 67,500 63% 30 2,300 52%
Total Employment Area 107,400 100% 24 4,400 100%
Source: Watson & Associates Economists Ltd.
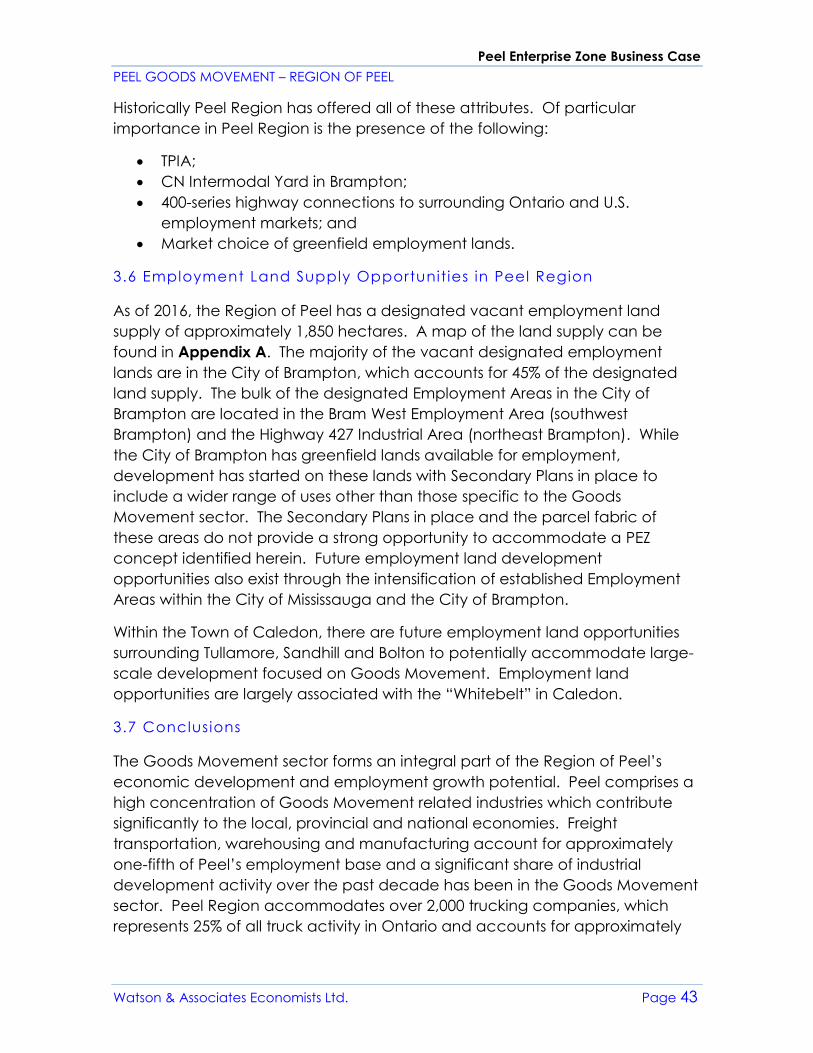
Peel Enterprise Zone Business Case
PEEL GOODS MOVEMENT – REGION OF PEEL
Watson & Associates Economists Ltd. Page 43
Historically Peel Region has offered all of these attributes. Of particular
importance in Peel Region is the presence of the following:
• TPIA;
• CN Intermodal Yard in Brampton;
• 400-series highway connections to surrounding Ontario and U.S.
employment markets; and
• Market choice of greenfield employment lands.
3.6 Employment Land Supply Opportunit ies in Peel Region
As of 2016, the Region of Peel has a designated vacant employment land
supply of approximately 1,850 hectares. A map of the land supply can be
found in Appendix A. The majority of the vacant designated employment
lands are in the City of Brampton, which accounts for 45% of the designated
land supply. The bulk of the designated Employment Areas in the City of
Brampton are located in the Bram West Employment Area (southwest
Brampton) and the Highway 427 Industrial Area (northeast Brampton). While
the City of Brampton has greenfield lands available for employment,
development has started on these lands with Secondary Plans in place to
include a wider range of uses other than those specific to the Goods
Movement sector. The Secondary Plans in place and the parcel fabric of
these areas do not provide a strong opportunity to accommodate a PEZ
concept identified herein. Future employment land development
opportunities also exist through the intensification of established Employment
Areas within the City of Mississauga and the City of Brampton.
Within the Town of Caledon, there are future employment land opportunities
surrounding Tullamore, Sandhill and Bolton to potentially accommodate large-
scale development focused on Goods Movement. Employment land
opportunities are largely associated with the “Whitebelt” in Caledon.
3.7 Conclusions
The Goods Movement sector forms an integral part of the Region of Peel’s
economic development and employment growth potential. Peel comprises a
high concentration of Goods Movement related industries which contribute
significantly to the local, provincial and national economies. Freight
transportation, warehousing and manufacturing account for approximately
one-fifth of Peel’s employment base and a significant share of industrial
development activity over the past decade has been in the Goods Movement
sector. Peel Region accommodates over 2,000 trucking companies, which
represents 25% of all truck activity in Ontario and accounts for approximately
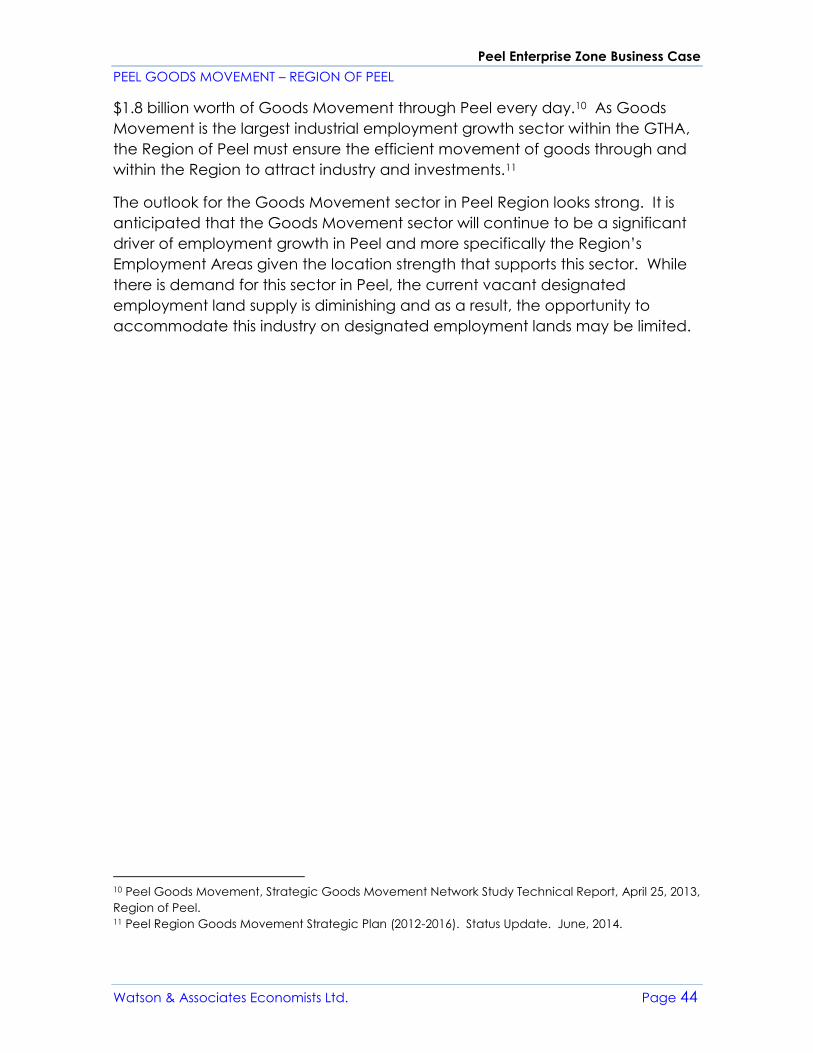
Peel Enterprise Zone Business Case
PEEL GOODS MOVEMENT – REGION OF PEEL
Watson & Associates Economists Ltd. Page 44
$1.8 billion worth of Goods Movement through Peel every day.10 As Goods
Movement is the largest industrial employment growth sector within the GTHA,
the Region of Peel must ensure the efficient movement of goods through and
within the Region to attract industry and investments.11
The outlook for the Goods Movement sector in Peel Region looks strong. It is
anticipated that the Goods Movement sector will continue to be a significant
driver of employment growth in Peel and more specifically the Region’s
Employment Areas given the location strength that supports this sector. While
there is demand for this sector in Peel, the current vacant designated
employment land supply is diminishing and as a result, the opportunity to
accommodate this industry on designated employment lands may be limited.
10 Peel Goods Movement, Strategic Goods Movement Network Study Technical Report, April 25, 2013,
Region of Peel. 11 Peel Region Goods Movement Strategic Plan (2012-2016). Status Update. June, 2014.
Peel Enterprise Zone Business Case
PEEL GOODS MOVEMENT – REGION OF PEEL
Watson & Associates Economists Ltd. Page 45
4. SITE SELECTION ANALYSIS
A business case is premised on a fiscal and economic feasibility assessment of
a PEZ. For this, an assessment of land use and infrastructure is needed,
requiring analysis that is informed by a specific site within the Region. This
section explores conceptual characteristics of a site needed to support a PEZ
in Peel Region, with costing estimates informed by a specific site. A short list of
potential sites was identified that had characteristics most suitable for a PEZ.
With stakeholder input and informed by a literature review, site-selection
criteria were used to evaluate a preferred site to be used to assess the capital,
serving and operating costs and their fiscal and economic impacts.
The process for the preferred site selection is summarized in the figure below
and described in the remainder of this section.
FIGURE 4-1 SITE SELECTION PROCESS
4.1 General Location Requirements
While a PEZ could offer value to Peel in terms of offering benefits such as
reduced truck traffic on roads and responding to demand among
transportation and logistics firms, an important consideration is location. To
analyze this, an initial planning exercise was undertaken to highlight several
guiding factors based on best practices. An ideal location for a freight village
will exhibit the following characteristics:
1. A large contiguous area of greenfield land available for development,
preferably on employment designated land.
Ph
ase
1
General location requiremets and potential sites identified.
Ph
ase
2
Stakeholder Workshop held to present potential sites and draft criteria. P
has
e 3
Specific PEZ site selection criteria developed based on stakeholder input. P
has
e 4
Final Site selection completed based on criteria evaluations of potential sites.
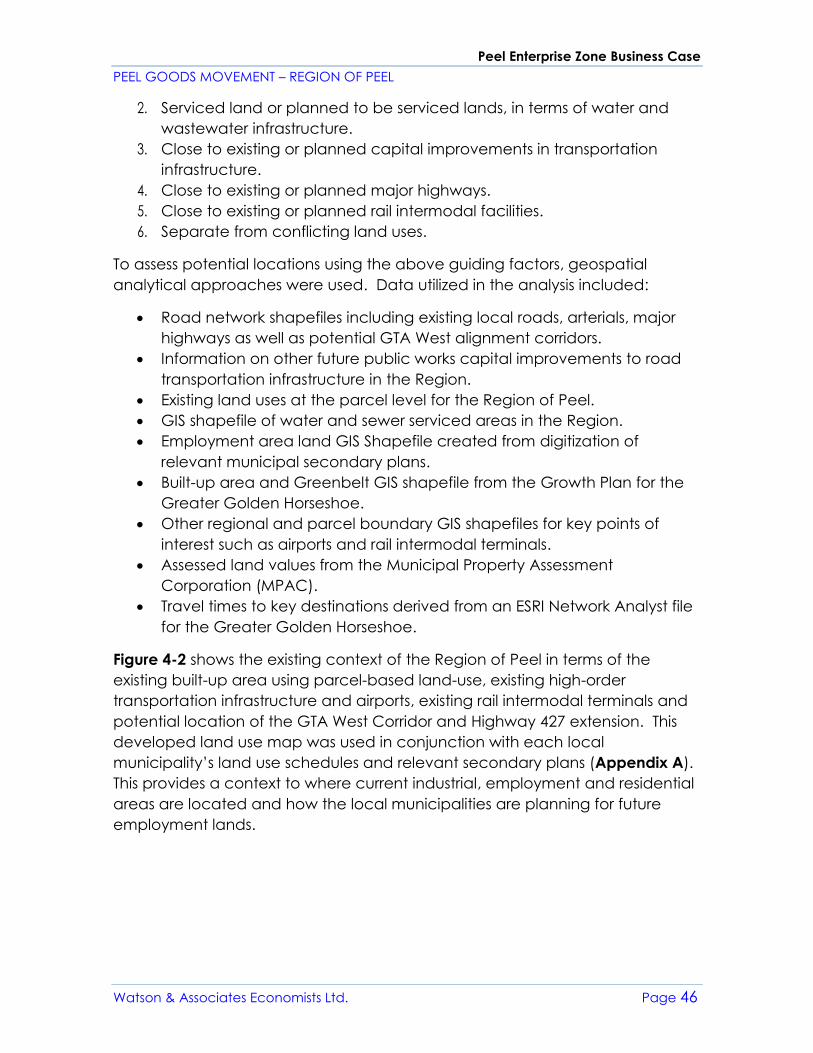
Peel Enterprise Zone Business Case
PEEL GOODS MOVEMENT – REGION OF PEEL
Watson & Associates Economists Ltd. Page 46
2. Serviced land or planned to be serviced lands, in terms of water and
wastewater infrastructure.
3. Close to existing or planned capital improvements in transportation
infrastructure.
4. Close to existing or planned major highways.
5. Close to existing or planned rail intermodal facilities.
6. Separate from conflicting land uses.
To assess potential locations using the above guiding factors, geospatial
analytical approaches were used. Data utilized in the analysis included:
• Road network shapefiles including existing local roads, arterials, major
highways as well as potential GTA West alignment corridors.
• Information on other future public works capital improvements to road
transportation infrastructure in the Region.
• Existing land uses at the parcel level for the Region of Peel.
• GIS shapefile of water and sewer serviced areas in the Region.
• Employment area land GIS Shapefile created from digitization of
relevant municipal secondary plans.
• Built-up area and Greenbelt GIS shapefile from the Growth Plan for the
Greater Golden Horseshoe.
• Other regional and parcel boundary GIS shapefiles for key points of
interest such as airports and rail intermodal terminals.
• Assessed land values from the Municipal Property Assessment
Corporation (MPAC).
• Travel times to key destinations derived from an ESRI Network Analyst file
for the Greater Golden Horseshoe.
Figure 4-2 shows the existing context of the Region of Peel in terms of the
existing built-up area using parcel-based land-use, existing high-order
transportation infrastructure and airports, existing rail intermodal terminals and
potential location of the GTA West Corridor and Highway 427 extension. This
developed land use map was used in conjunction with each local
municipality’s land use schedules and relevant secondary plans (Appendix A).
This provides a context to where current industrial, employment and residential
areas are located and how the local municipalities are planning for future
employment lands.
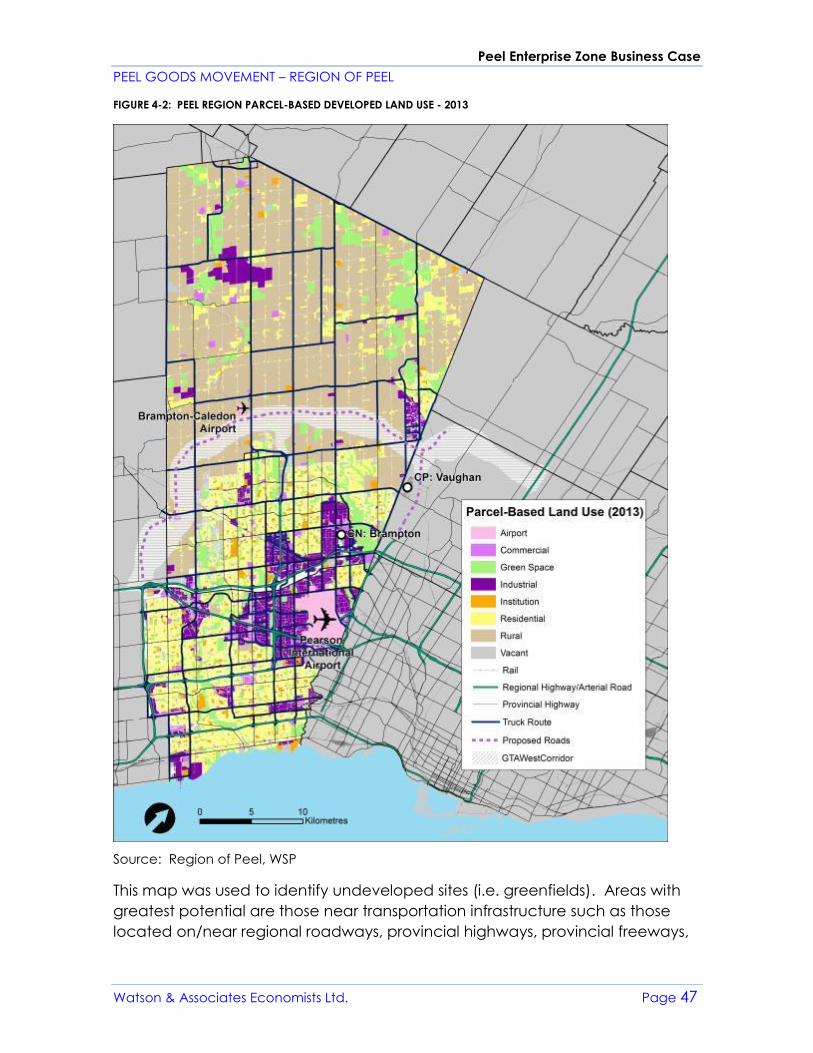
Peel Enterprise Zone Business Case
PEEL GOODS MOVEMENT – REGION OF PEEL
Watson & Associates Economists Ltd. Page 47
FIGURE 4-2: PEEL REGION PARCEL-BASED DEVELOPED LAND USE - 2013
Source: Region of Peel, WSP
This map was used to identify undeveloped sites (i.e. greenfields). Areas with
greatest potential are those near transportation infrastructure such as those
located on/near regional roadways, provincial highways, provincial freeways,
Peel Enterprise Zone Business Case
PEEL GOODS MOVEMENT – REGION OF PEEL
Watson & Associates Economists Ltd. Page 48
Toronto Pearson International Airport, CN Brampton Intermodal Terminal and
CP Vaughan Intermodal Terminal.
Figure 4-3 and Figure 4-4 display the extent of existing water and sewer service
area in Peel. Due to the high cost of extending the municipal infrastructure for
water and wastewater, the process for identifying potential sites only looked at
areas that are already serviced by water and wastewater or are planned for
servicing in the foreseeable future.
Figure 4-5 displays the public works road program for planned road
improvements in the Region over the 2017 to 2031 period. This provides context
for future improvements that may increase capacity of roads to support the
demand from a PEZ.
The Peel Region Goods Movement Economic Impact Analysis Study and the
on-going research of the Peel Region Goods Movement Employment Density
Discussion Paper each completed a similar site selection analysis for a potential
freight village. Both those studies limited the analyses to designated
employment lands. This planning exercise for a PEZ site utilized the analysis
from both those studies but has also expanded the general selection criteria to
include lands that are not specifically designated for employment. The reason
for this is to best accommodate growth despite employment land constrictions.

Peel Enterprise Zone Business Case
PEEL GOODS MOVEMENT – REGION OF PEEL
Watson & Associates Economists Ltd. Page 49
FIGURE 4-3: PEEL REGION WATER SERVICE AREA
Source: Region of Peel, WSP
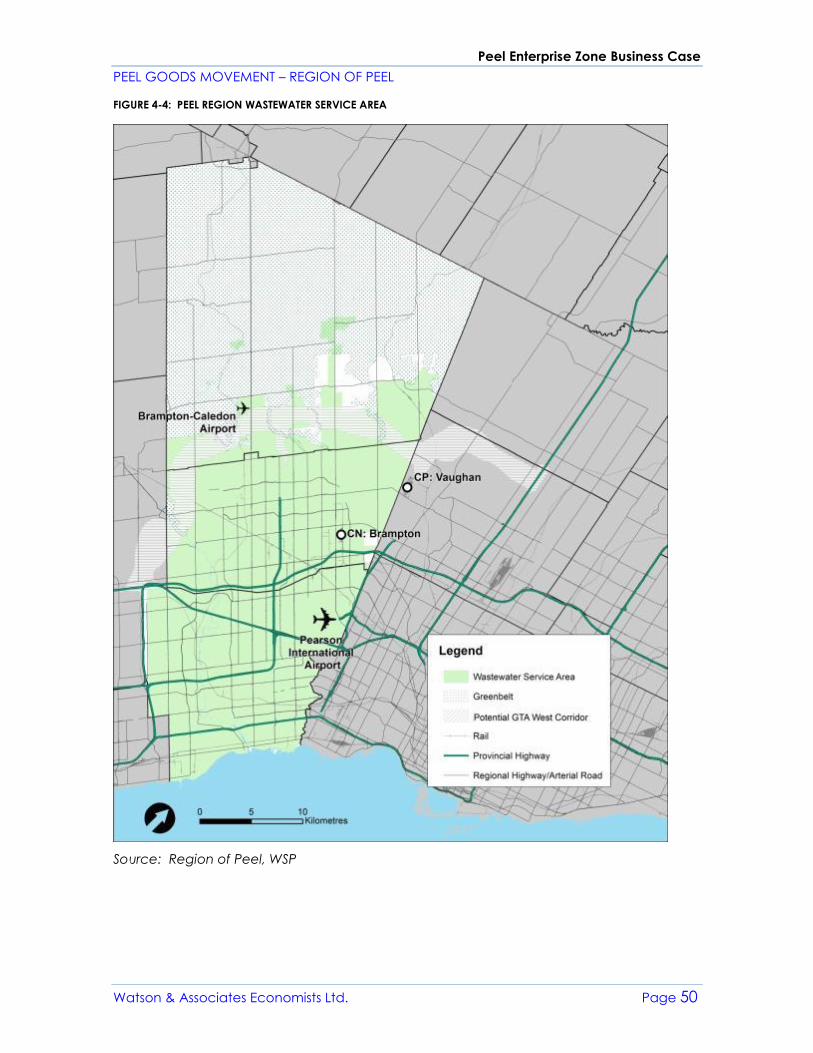
Peel Enterprise Zone Business Case
PEEL GOODS MOVEMENT – REGION OF PEEL
Watson & Associates Economists Ltd. Page 50
FIGURE 4-4: PEEL REGION WASTEWATER SERVICE AREA
Source: Region of Peel, WSP
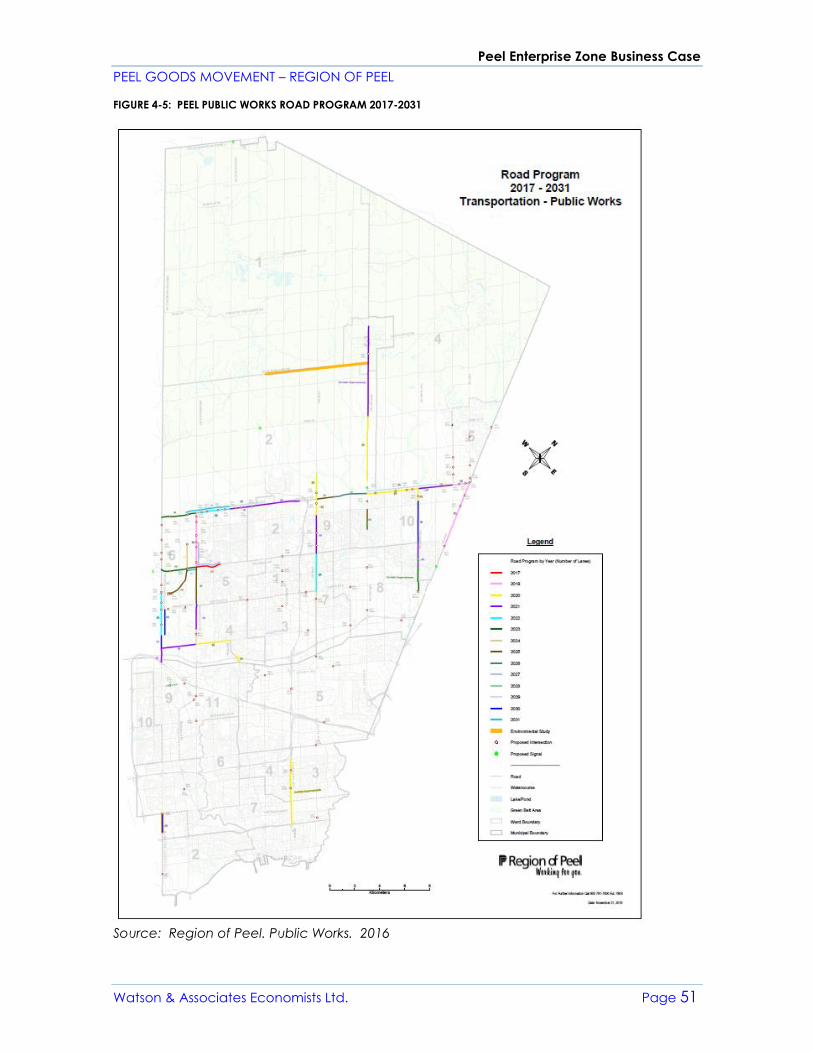
Peel Enterprise Zone Business Case
PEEL GOODS MOVEMENT – REGION OF PEEL
Watson & Associates Economists Ltd. Page 51
FIGURE 4-5: PEEL PUBLIC WORKS ROAD PROGRAM 2017-2031
Source: Region of Peel. Public Works. 2016
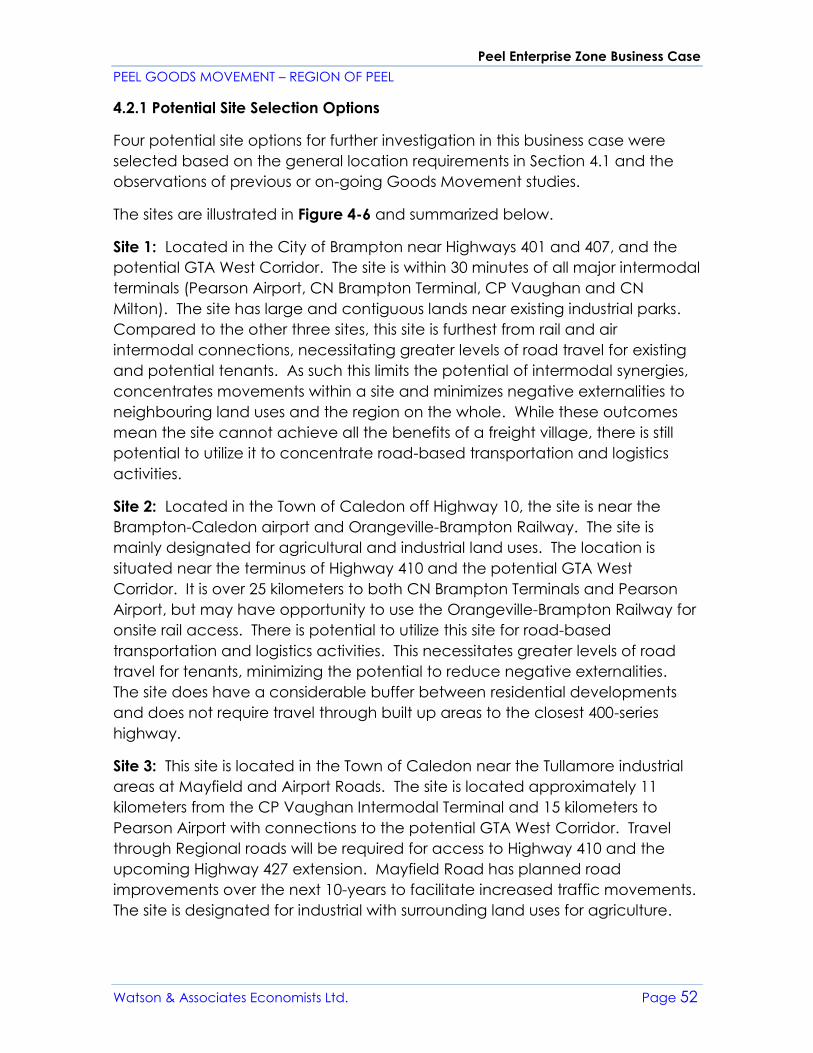
Peel Enterprise Zone Business Case
PEEL GOODS MOVEMENT – REGION OF PEEL
Watson & Associates Economists Ltd. Page 52
4.2.1 Potential Site Selection Options
Four potential site options for further investigation in this business case were
selected based on the general location requirements in Section 4.1 and the
observations of previous or on-going Goods Movement studies.
The sites are illustrated in Figure 4-6 and summarized below.
Site 1: Located in the City of Brampton near Highways 401 and 407, and the
potential GTA West Corridor. The site is within 30 minutes of all major intermodal
terminals (Pearson Airport, CN Brampton Terminal, CP Vaughan and CN
Milton). The site has large and contiguous lands near existing industrial parks.
Compared to the other three sites, this site is furthest from rail and air
intermodal connections, necessitating greater levels of road travel for existing
and potential tenants. As such this limits the potential of intermodal synergies,
concentrates movements within a site and minimizes negative externalities to
neighbouring land uses and the region on the whole. While these outcomes
mean the site cannot achieve all the benefits of a freight village, there is still
potential to utilize it to concentrate road-based transportation and logistics
activities.
Site 2: Located in the Town of Caledon off Highway 10, the site is near the
Brampton-Caledon airport and Orangeville-Brampton Railway. The site is
mainly designated for agricultural and industrial land uses. The location is
situated near the terminus of Highway 410 and the potential GTA West
Corridor. It is over 25 kilometers to both CN Brampton Terminals and Pearson
Airport, but may have opportunity to use the Orangeville-Brampton Railway for
onsite rail access. There is potential to utilize this site for road-based
transportation and logistics activities. This necessitates greater levels of road
travel for tenants, minimizing the potential to reduce negative externalities.
The site does have a considerable buffer between residential developments
and does not require travel through built up areas to the closest 400-series
highway.
Site 3: This site is located in the Town of Caledon near the Tullamore industrial
areas at Mayfield and Airport Roads. The site is located approximately 11
kilometers from the CP Vaughan Intermodal Terminal and 15 kilometers to
Pearson Airport with connections to the potential GTA West Corridor. Travel
through Regional roads will be required for access to Highway 410 and the
upcoming Highway 427 extension. Mayfield Road has planned road
improvements over the next 10-years to facilitate increased traffic movements.
The site is designated for industrial with surrounding land uses for agriculture.
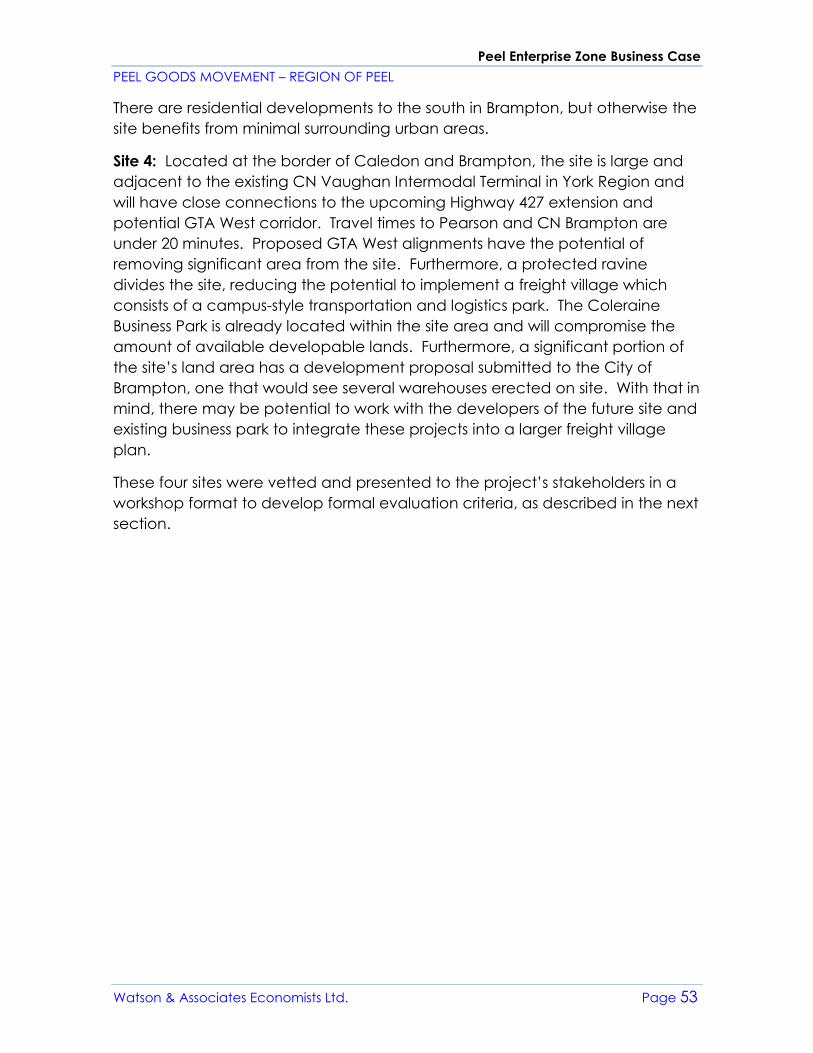
Peel Enterprise Zone Business Case
PEEL GOODS MOVEMENT – REGION OF PEEL
Watson & Associates Economists Ltd. Page 53
There are residential developments to the south in Brampton, but otherwise the
site benefits from minimal surrounding urban areas.
Site 4: Located at the border of Caledon and Brampton, the site is large and
adjacent to the existing CN Vaughan Intermodal Terminal in York Region and
will have close connections to the upcoming Highway 427 extension and
potential GTA West corridor. Travel times to Pearson and CN Brampton are
under 20 minutes. Proposed GTA West alignments have the potential of
removing significant area from the site. Furthermore, a protected ravine
divides the site, reducing the potential to implement a freight village which
consists of a campus-style transportation and logistics park. The Coleraine
Business Park is already located within the site area and will compromise the
amount of available developable lands. Furthermore, a significant portion of
the site’s land area has a development proposal submitted to the City of
Brampton, one that would see several warehouses erected on site. With that in
mind, there may be potential to work with the developers of the future site and
existing business park to integrate these projects into a larger freight village
plan.
These four sites were vetted and presented to the project’s stakeholders in a
workshop format to develop formal evaluation criteria, as described in the next
section.
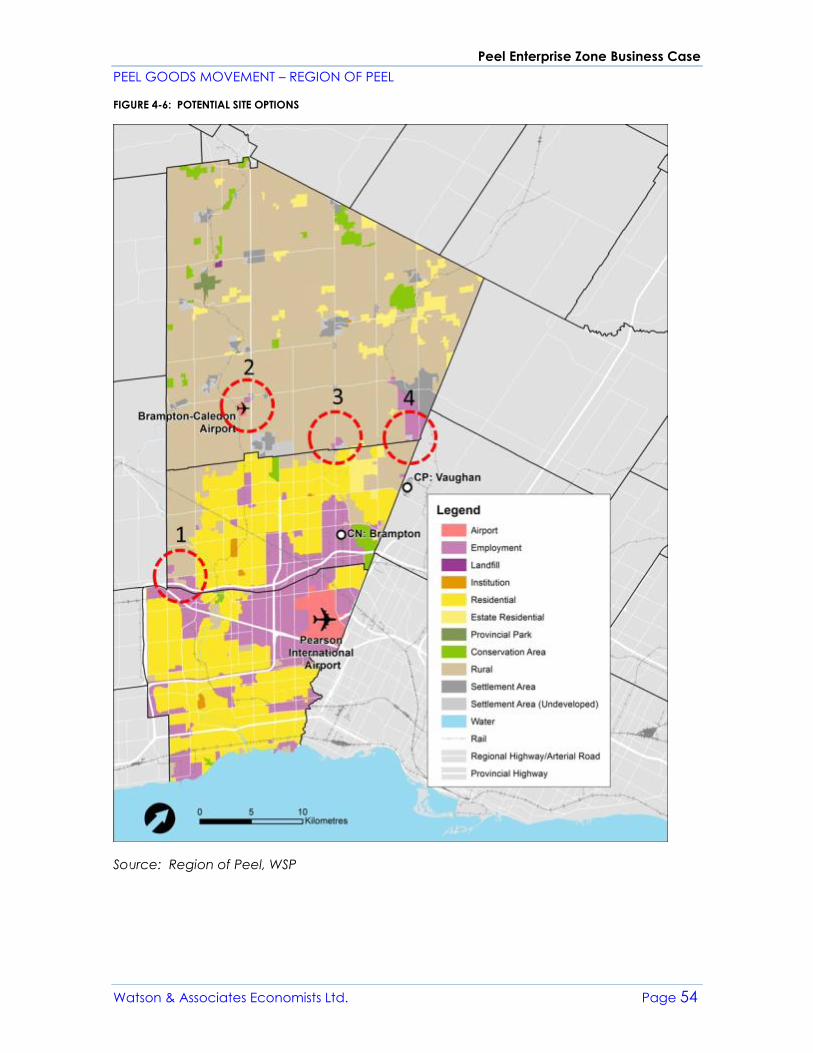
Peel Enterprise Zone Business Case
PEEL GOODS MOVEMENT – REGION OF PEEL
Watson & Associates Economists Ltd. Page 54
FIGURE 4-6: POTENTIAL SITE OPTIONS
Source: Region of Peel, WSP
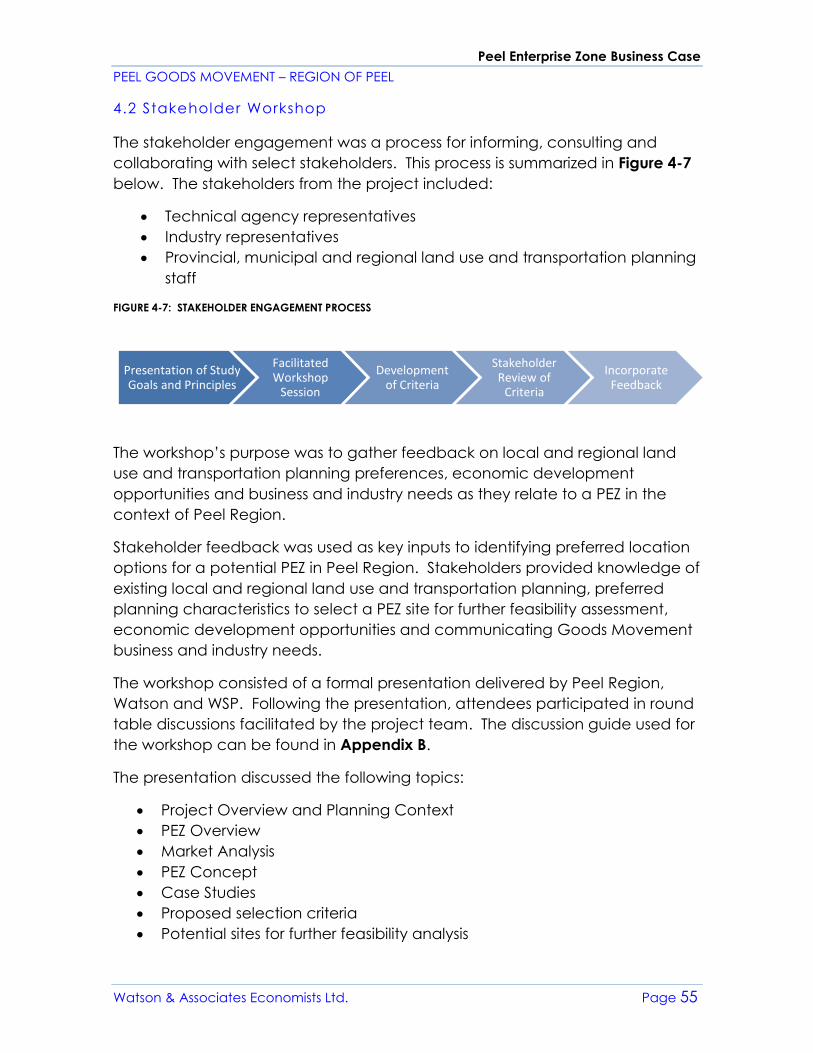
Peel Enterprise Zone Business Case
PEEL GOODS MOVEMENT – REGION OF PEEL
Watson & Associates Economists Ltd. Page 55
4.2 Stakeholder Workshop
The stakeholder engagement was a process for informing, consulting and
collaborating with select stakeholders. This process is summarized in Figure 4-7
below. The stakeholders from the project included:
• Technical agency representatives
• Industry representatives
• Provincial, municipal and regional land use and transportation planning
staff
FIGURE 4-7: STAKEHOLDER ENGAGEMENT PROCESS
The workshop’s purpose was to gather feedback on local and regional land
use and transportation planning preferences, economic development
opportunities and business and industry needs as they relate to a PEZ in the
context of Peel Region.
Stakeholder feedback was used as key inputs to identifying preferred location
options for a potential PEZ in Peel Region. Stakeholders provided knowledge of
existing local and regional land use and transportation planning, preferred
planning characteristics to select a PEZ site for further feasibility assessment,
economic development opportunities and communicating Goods Movement
business and industry needs.
The workshop consisted of a formal presentation delivered by Peel Region,
Watson and WSP. Following the presentation, attendees participated in round
table discussions facilitated by the project team. The discussion guide used for
the workshop can be found in Appendix B.
The presentation discussed the following topics:
• Project Overview and Planning Context
• PEZ Overview
• Market Analysis
• PEZ Concept
• Case Studies
• Proposed selection criteria
• Potential sites for further feasibility analysis
Presentation of Study Goals and Principles
Facilitated Workshop
Session
Development of Criteria
Stakeholder Review of
Criteria
Incorporate Feedback
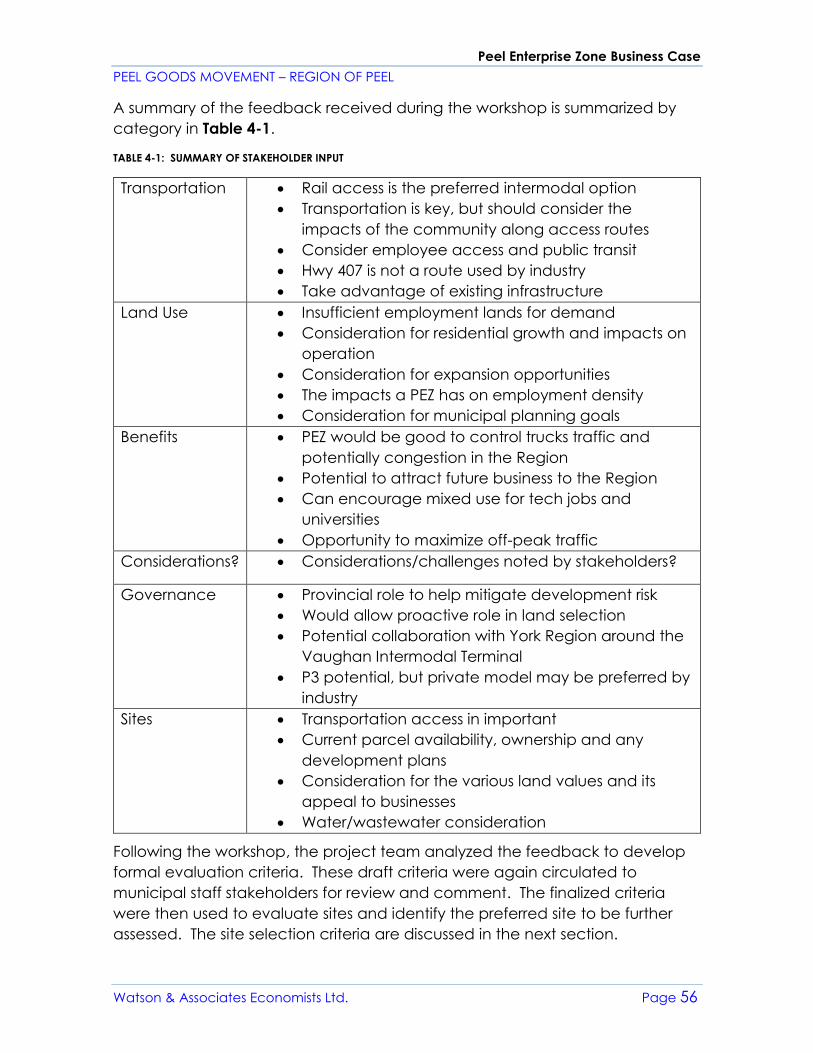
Peel Enterprise Zone Business Case
PEEL GOODS MOVEMENT – REGION OF PEEL
Watson & Associates Economists Ltd. Page 56
A summary of the feedback received during the workshop is summarized by
category in Table 4-1.
TABLE 4-1: SUMMARY OF STAKEHOLDER INPUT
Transportation • Rail access is the preferred intermodal option
• Transportation is key, but should consider the
impacts of the community along access routes
• Consider employee access and public transit
• Hwy 407 is not a route used by industry
• Take advantage of existing infrastructure
Land Use • Insufficient employment lands for demand
• Consideration for residential growth and impacts on
operation
• Consideration for expansion opportunities
• The impacts a PEZ has on employment density
• Consideration for municipal planning goals
Benefits • PEZ would be good to control trucks traffic and
potentially congestion in the Region
• Potential to attract future business to the Region
• Can encourage mixed use for tech jobs and
universities
• Opportunity to maximize off-peak traffic
Considerations? • Considerations/challenges noted by stakeholders?
Governance • Provincial role to help mitigate development risk
• Would allow proactive role in land selection
• Potential collaboration with York Region around the
Vaughan Intermodal Terminal
• P3 potential, but private model may be preferred by
industry
Sites • Transportation access in important
• Current parcel availability, ownership and any
development plans
• Consideration for the various land values and its
appeal to businesses
• Water/wastewater consideration
Following the workshop, the project team analyzed the feedback to develop
formal evaluation criteria. These draft criteria were again circulated to
municipal staff stakeholders for review and comment. The finalized criteria
were then used to evaluate sites and identify the preferred site to be further
assessed. The site selection criteria are discussed in the next section.
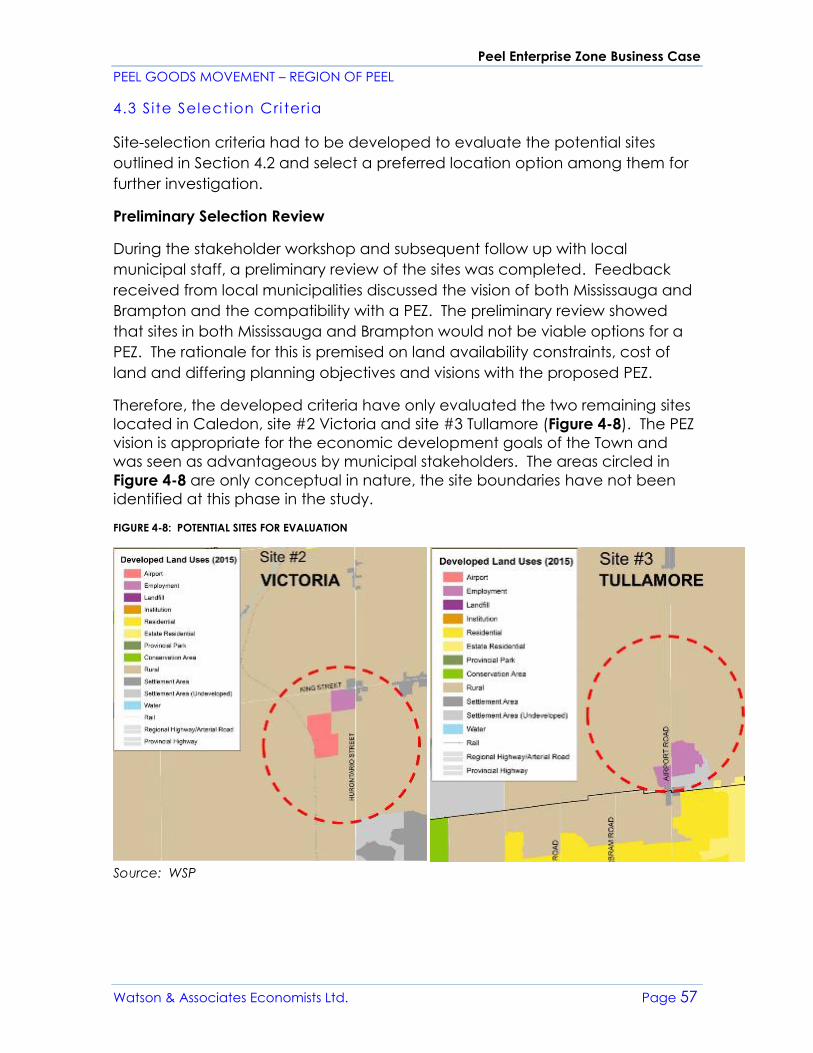
Peel Enterprise Zone Business Case
PEEL GOODS MOVEMENT – REGION OF PEEL
Watson & Associates Economists Ltd. Page 57
4.3 Site Selection Cri teria
Site-selection criteria had to be developed to evaluate the potential sites
outlined in Section 4.2 and select a preferred location option among them for
further investigation.
Preliminary Selection Review
During the stakeholder workshop and subsequent follow up with local
municipal staff, a preliminary review of the sites was completed. Feedback
received from local municipalities discussed the vision of both Mississauga and
Brampton and the compatibility with a PEZ. The preliminary review showed
that sites in both Mississauga and Brampton would not be viable options for a
PEZ. The rationale for this is premised on land availability constraints, cost of
land and differing planning objectives and visions with the proposed PEZ.
Therefore, the developed criteria have only evaluated the two remaining sites
located in Caledon, site #2 Victoria and site #3 Tullamore (Figure 4-8). The PEZ
vision is appropriate for the economic development goals of the Town and
was seen as advantageous by municipal stakeholders. The areas circled in
Figure 4-8 are only conceptual in nature, the site boundaries have not been
identified at this phase in the study.
FIGURE 4-8: POTENTIAL SITES FOR EVALUATION
Source: WSP
Peel Enterprise Zone Business Case
PEEL GOODS MOVEMENT – REGION OF PEEL
Watson & Associates Economists Ltd. Page 58
Overview of the Site Selection Criteria
These site-selection criteria were used to select a preferred location option
from the two potential sites. The final criteria are shown in Table 4-2. The
criteria are comprised of 16 criteria in four categories: transportation,
infrastructure, land use and market.
Transportation criteria are related to connectivity and proximity: the sites
proximity to key transportation nodes in the region (e.g. highways, airport, rail)
and available infrastructure to provide sufficient access to the site for both
Goods Movement and for future employees.
Infrastructure criteria is related to non-transportation infrastructure that is
needed to support the development of the site (e.g. water and wastewater).
These criteria prioritize sites with existing or planned infrastructure that can
support the site as they require large capital investments to be expanded.
Land Use criteria assess the site’s compatibility with the appropriateness of the
site in terms of size/configuration, surrounding land uses, and potential for
expansion.
Market criteria measure the sites appeal to industry and potential tenants of
the PEZ site.
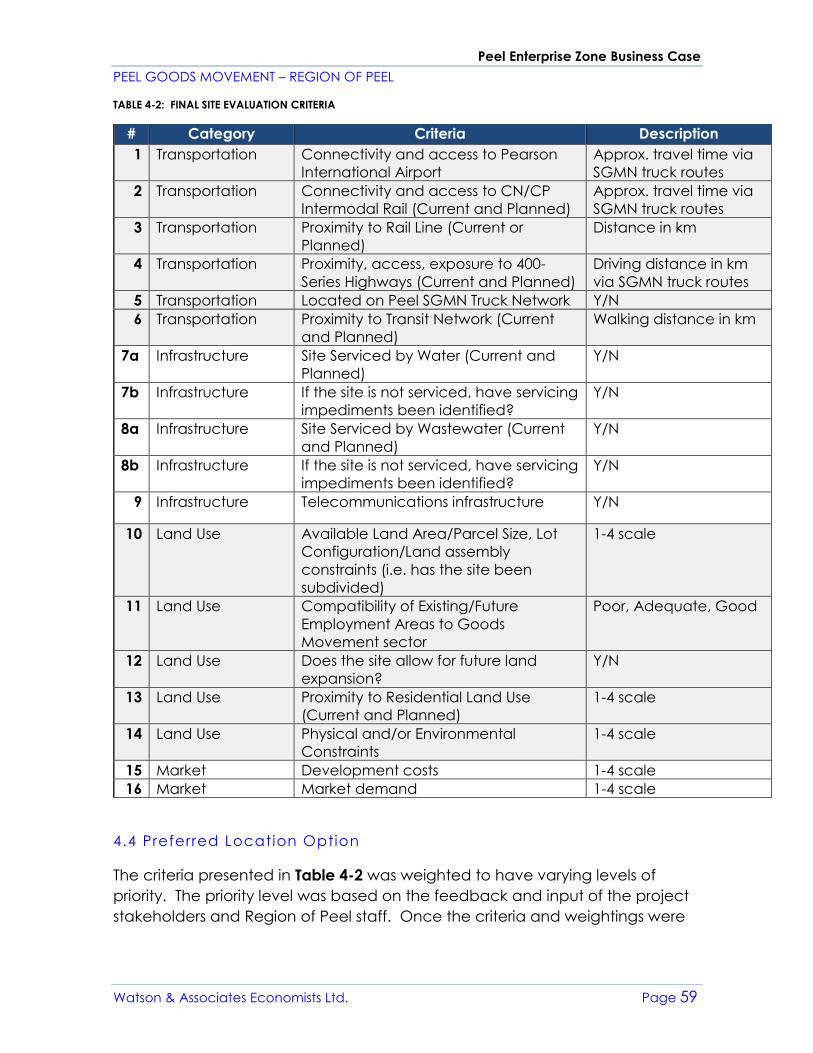
Peel Enterprise Zone Business Case
PEEL GOODS MOVEMENT – REGION OF PEEL
Watson & Associates Economists Ltd. Page 59
TABLE 4-2: FINAL SITE EVALUATION CRITERIA
# Category Criteria Description
1 Transportation Connectivity and access to Pearson
International Airport
Approx. travel time via
SGMN truck routes
2 Transportation Connectivity and access to CN/CP
Intermodal Rail (Current and Planned)
Approx. travel time via
SGMN truck routes
3 Transportation Proximity to Rail Line (Current or
Planned)
Distance in km
4 Transportation Proximity, access, exposure to 400-
Series Highways (Current and Planned)
Driving distance in km
via SGMN truck routes
5 Transportation Located on Peel SGMN Truck Network Y/N
6 Transportation Proximity to Transit Network (Current
and Planned)
Walking distance in km
7a Infrastructure Site Serviced by Water (Current and
Planned)
Y/N
7b Infrastructure If the site is not serviced, have servicing
impediments been identified?
Y/N
8a Infrastructure Site Serviced by Wastewater (Current
and Planned)
Y/N
8b Infrastructure If the site is not serviced, have servicing
impediments been identified?
Y/N
9 Infrastructure Telecommunications infrastructure Y/N
10 Land Use Available Land Area/Parcel Size, Lot
Configuration/Land assembly
constraints (i.e. has the site been
subdivided)
1-4 scale
11 Land Use Compatibility of Existing/Future
Employment Areas to Goods
Movement sector
Poor, Adequate, Good
12 Land Use Does the site allow for future land
expansion?
Y/N
13 Land Use Proximity to Residential Land Use
(Current and Planned)
1-4 scale
14 Land Use Physical and/or Environmental
Constraints
1-4 scale
15 Market Development costs 1-4 scale
16 Market Market demand 1-4 scale
4.4 Preferred Location Option
The criteria presented in Table 4-2 was weighted to have varying levels of
priority. The priority level was based on the feedback and input of the project
stakeholders and Region of Peel staff. Once the criteria and weightings were
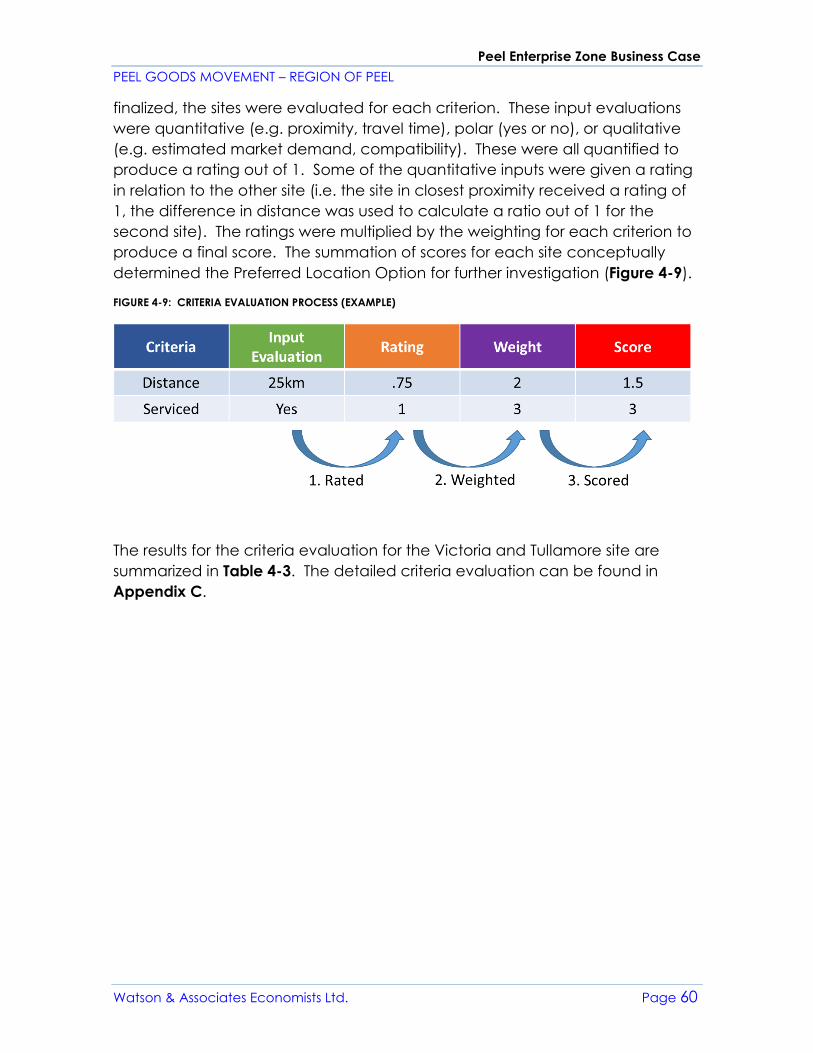
Peel Enterprise Zone Business Case
PEEL GOODS MOVEMENT – REGION OF PEEL
Watson & Associates Economists Ltd. Page 60
finalized, the sites were evaluated for each criterion. These input evaluations
were quantitative (e.g. proximity, travel time), polar (yes or no), or qualitative
(e.g. estimated market demand, compatibility). These were all quantified to
produce a rating out of 1. Some of the quantitative inputs were given a rating
in relation to the other site (i.e. the site in closest proximity received a rating of
1, the difference in distance was used to calculate a ratio out of 1 for the
second site). The ratings were multiplied by the weighting for each criterion to
produce a final score. The summation of scores for each site conceptually
determined the Preferred Location Option for further investigation (Figure 4-9).
FIGURE 4-9: CRITERIA EVALUATION PROCESS (EXAMPLE)
The results for the criteria evaluation for the Victoria and Tullamore site are
summarized in Table 4-3. The detailed criteria evaluation can be found in
Appendix C.
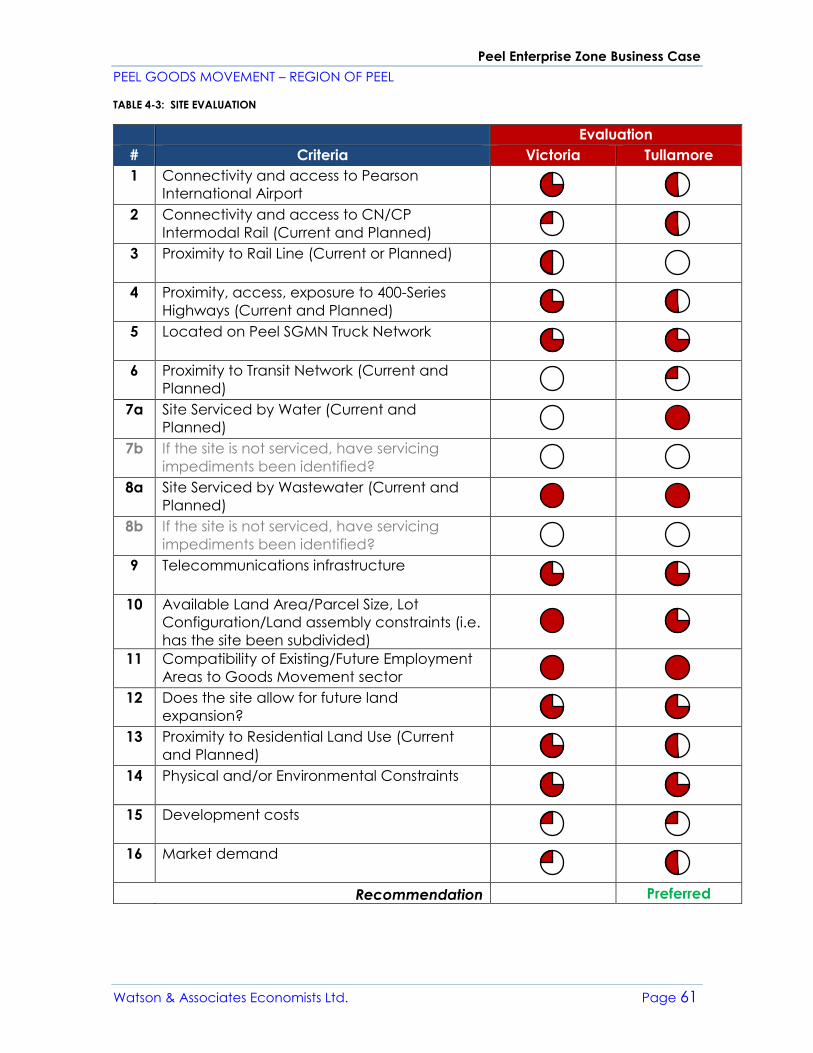
Peel Enterprise Zone Business Case
PEEL GOODS MOVEMENT – REGION OF PEEL
Watson & Associates Economists Ltd. Page 61
TABLE 4-3: SITE EVALUATION
Evaluation
# Criteria Victoria Tullamore
1 Connectivity and access to Pearson
International Airport
2 Connectivity and access to CN/CP
Intermodal Rail (Current and Planned)
3 Proximity to Rail Line (Current or Planned)
4 Proximity, access, exposure to 400-Series
Highways (Current and Planned)
5 Located on Peel SGMN Truck Network
6 Proximity to Transit Network (Current and
Planned)
7a Site Serviced by Water (Current and
Planned)
7b If the site is not serviced, have servicing
impediments been identified?
8a Site Serviced by Wastewater (Current and
Planned)
8b If the site is not serviced, have servicing
impediments been identified?
9 Telecommunications infrastructure
10 Available Land Area/Parcel Size, Lot
Configuration/Land assembly constraints (i.e.
has the site been subdivided)
11 Compatibility of Existing/Future Employment
Areas to Goods Movement sector
12 Does the site allow for future land
expansion?
13 Proximity to Residential Land Use (Current
and Planned)
14 Physical and/or Environmental Constraints
15 Development costs
16 Market demand
Recommendation Preferred
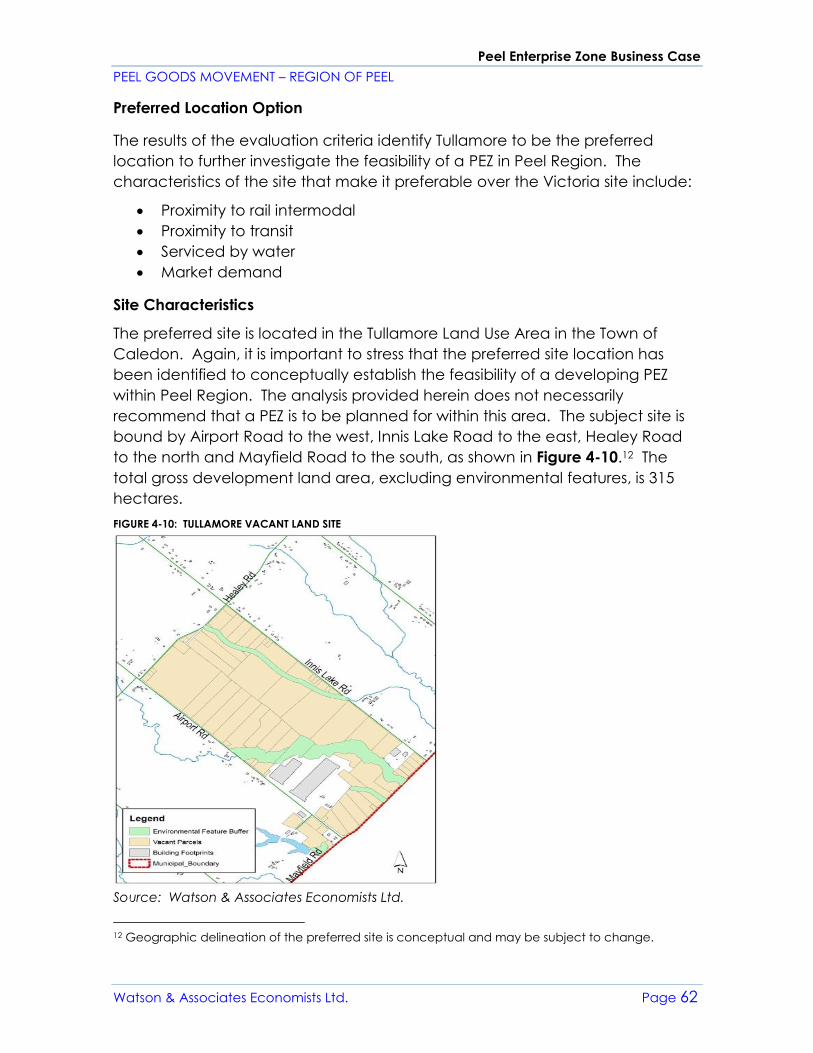
Peel Enterprise Zone Business Case
PEEL GOODS MOVEMENT – REGION OF PEEL
Watson & Associates Economists Ltd. Page 62
Preferred Location Option
The results of the evaluation criteria identify Tullamore to be the preferred
location to further investigate the feasibility of a PEZ in Peel Region. The
characteristics of the site that make it preferable over the Victoria site include:
• Proximity to rail intermodal
• Proximity to transit
• Serviced by water
• Market demand
Site Characteristics
The preferred site is located in the Tullamore Land Use Area in the Town of
Caledon. Again, it is important to stress that the preferred site location has
been identified to conceptually establish the feasibility of a developing PEZ
within Peel Region. The analysis provided herein does not necessarily
recommend that a PEZ is to be planned for within this area. The subject site is
bound by Airport Road to the west, Innis Lake Road to the east, Healey Road
to the north and Mayfield Road to the south, as shown in Figure 4-10.12 The
total gross development land area, excluding environmental features, is 315
hectares.
FIGURE 4-10: TULLAMORE VACANT LAND SITE
Source: Watson & Associates Economists Ltd.
12 Geographic delineation of the preferred site is conceptual and may be subject to change.
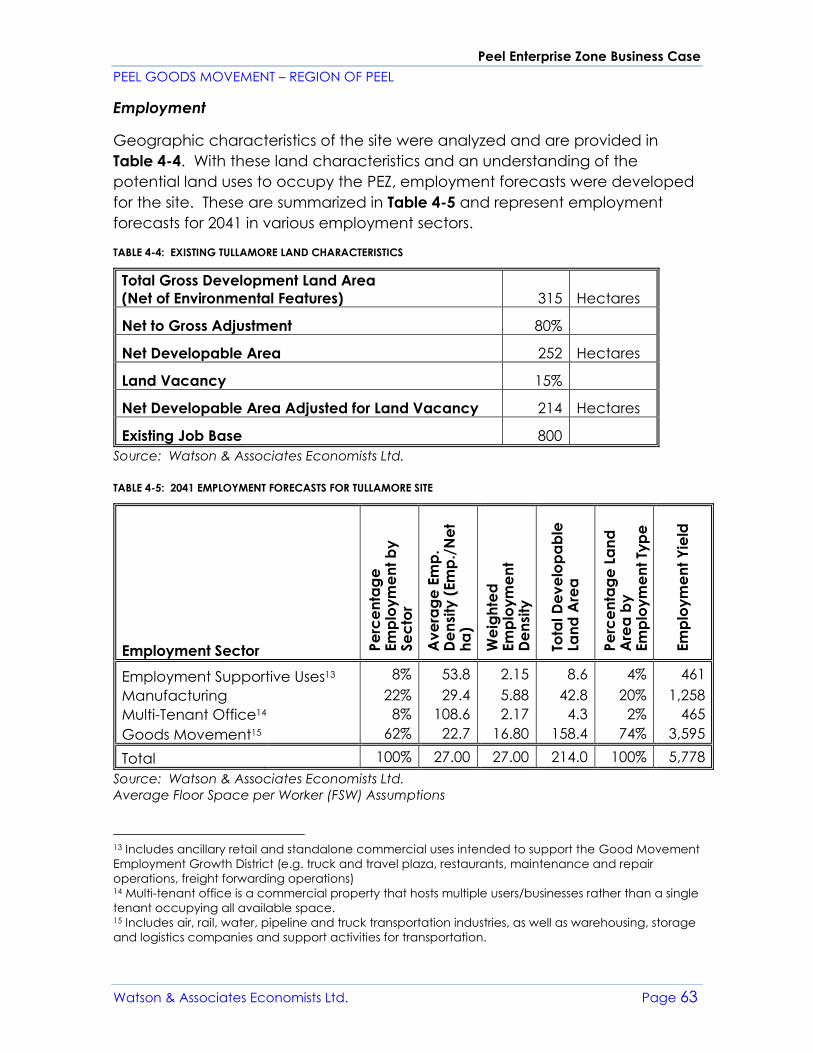
Peel Enterprise Zone Business Case
PEEL GOODS MOVEMENT – REGION OF PEEL
Watson & Associates Economists Ltd. Page 63
Employment
Geographic characteristics of the site were analyzed and are provided in
Table 4-4. With these land characteristics and an understanding of the
potential land uses to occupy the PEZ, employment forecasts were developed
for the site. These are summarized in Table 4-5 and represent employment
forecasts for 2041 in various employment sectors.
TABLE 4-4: EXISTING TULLAMORE LAND CHARACTERISTICS
Total Gross Development Land Area
(Net of Environmental Features) 315 Hectares
Net to Gross Adjustment 80%
Net Developable Area 252 Hectares
Land Vacancy 15%
Net Developable Area Adjusted for Land Vacancy 214 Hectares
Existing Job Base 800
Source: Watson & Associates Economists Ltd.
TABLE 4-5: 2041 EMPLOYMENT FORECASTS FOR TULLAMORE SITE
Employment Sector Pe
rce
nta
ge
Em
plo
ym
en
t b
y
Se
cto
r
Av
era
ge
Em
p.
De
nsi
ty (
Em
p./
Ne
t h
a)
We
igh
ted
Em
plo
ym
en
t D
en
sity
Tota
l D
ev
elo
pa
ble
La
nd
Are
a
Pe
rce
nta
ge
La
nd
A
rea
by
Em
plo
ym
en
t Ty
pe
Em
plo
ym
en
t Y
ield
Employment Supportive Uses13 8% 53.8 2.15 8.6 4% 461
Manufacturing 22% 29.4 5.88 42.8 20% 1,258
Multi-Tenant Office14 8% 108.6 2.17 4.3 2% 465
Goods Movement15 62% 22.7 16.80 158.4 74% 3,595
Total 100% 27.00 27.00 214.0 100% 5,778
Source: Watson & Associates Economists Ltd.
Average Floor Space per Worker (FSW) Assumptions
13 Includes ancillary retail and standalone commercial uses intended to support the Good Movement
Employment Growth District (e.g. truck and travel plaza, restaurants, maintenance and repair
operations, freight forwarding operations) 14 Multi-tenant office is a commercial property that hosts multiple users/businesses rather than a single
tenant occupying all available space. 15 Includes air, rail, water, pipeline and truck transportation industries, as well as warehousing, storage
and logistics companies and support activities for transportation.
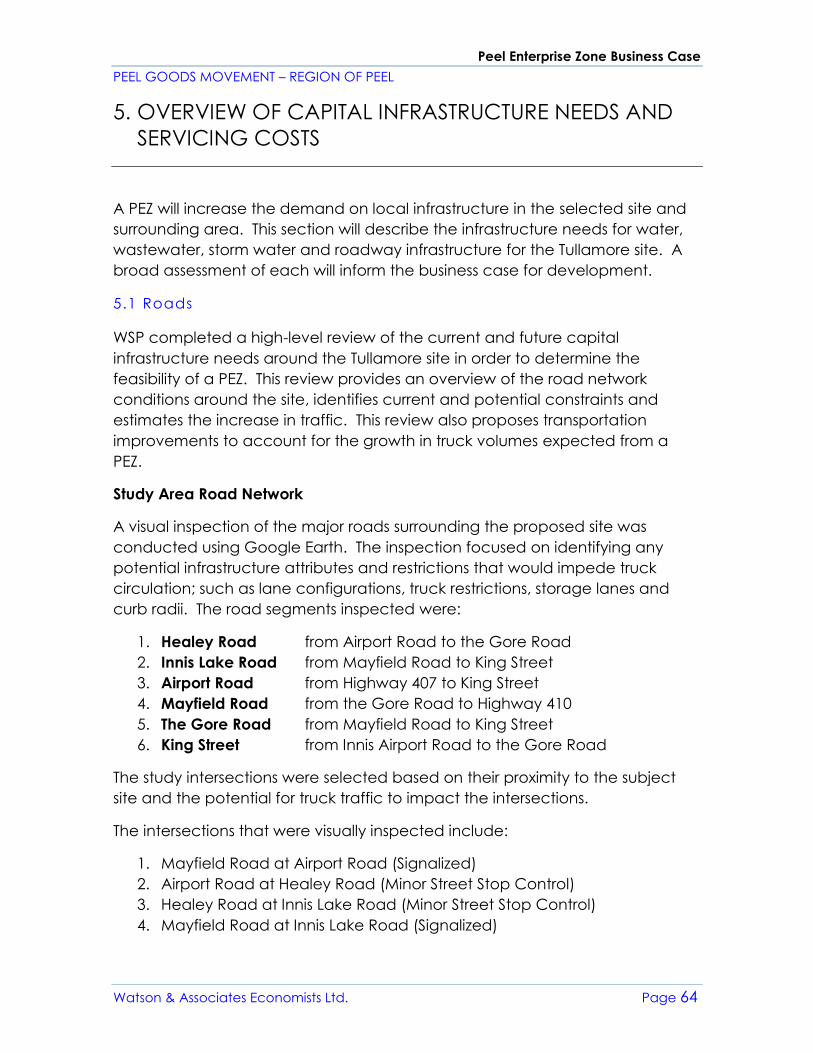
Peel Enterprise Zone Business Case
PEEL GOODS MOVEMENT – REGION OF PEEL
Watson & Associates Economists Ltd. Page 64
5. OVERVIEW OF CAPITAL INFRASTRUCTURE NEEDS AND
SERVICING COSTS
A PEZ will increase the demand on local infrastructure in the selected site and
surrounding area. This section will describe the infrastructure needs for water,
wastewater, storm water and roadway infrastructure for the Tullamore site. A
broad assessment of each will inform the business case for development.
5.1 Roads
WSP completed a high-level review of the current and future capital
infrastructure needs around the Tullamore site in order to determine the
feasibility of a PEZ. This review provides an overview of the road network
conditions around the site, identifies current and potential constraints and
estimates the increase in traffic. This review also proposes transportation
improvements to account for the growth in truck volumes expected from a
PEZ.
Study Area Road Network
A visual inspection of the major roads surrounding the proposed site was
conducted using Google Earth. The inspection focused on identifying any
potential infrastructure attributes and restrictions that would impede truck
circulation; such as lane configurations, truck restrictions, storage lanes and
curb radii. The road segments inspected were:
1. Healey Road from Airport Road to the Gore Road
2. Innis Lake Road from Mayfield Road to King Street
3. Airport Road from Highway 407 to King Street
4. Mayfield Road from the Gore Road to Highway 410
5. The Gore Road from Mayfield Road to King Street
6. King Street from Innis Airport Road to the Gore Road
The study intersections were selected based on their proximity to the subject
site and the potential for truck traffic to impact the intersections.
The intersections that were visually inspected include:
1. Mayfield Road at Airport Road (Signalized)
2. Airport Road at Healey Road (Minor Street Stop Control)
3. Healey Road at Innis Lake Road (Minor Street Stop Control)
4. Mayfield Road at Innis Lake Road (Signalized)
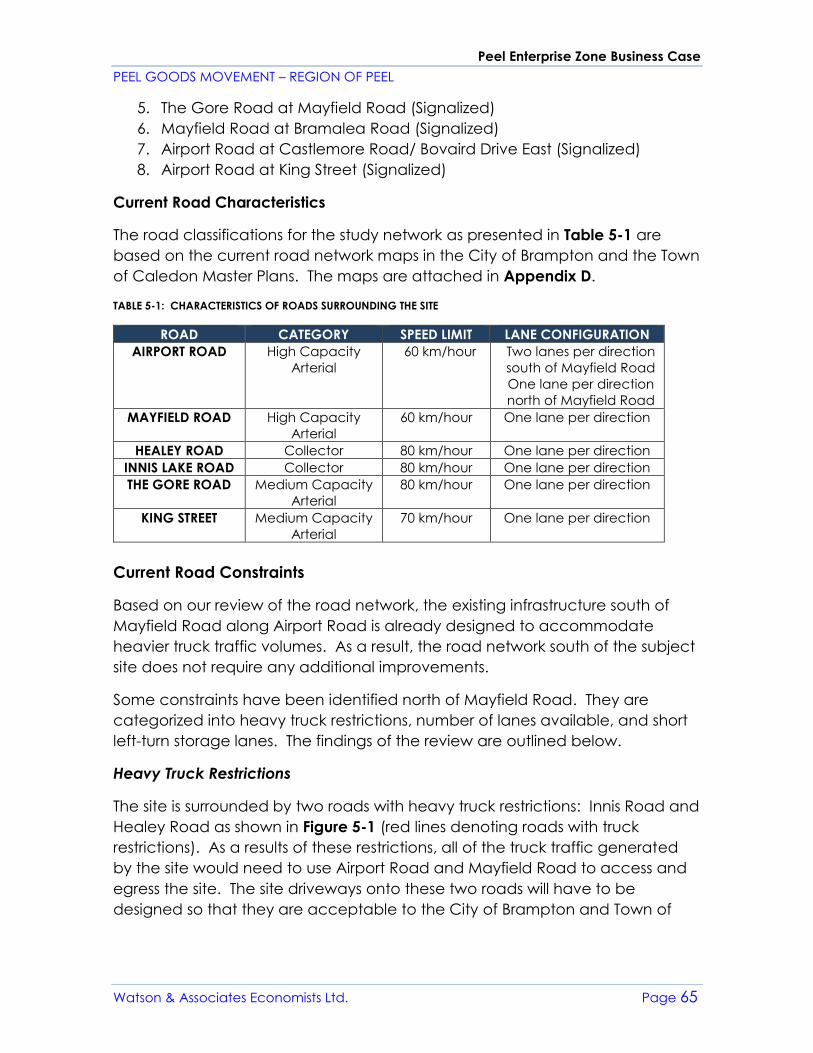
Peel Enterprise Zone Business Case
PEEL GOODS MOVEMENT – REGION OF PEEL
Watson & Associates Economists Ltd. Page 65
5. The Gore Road at Mayfield Road (Signalized)
6. Mayfield Road at Bramalea Road (Signalized)
7. Airport Road at Castlemore Road/ Bovaird Drive East (Signalized)
8. Airport Road at King Street (Signalized)
Current Road Characteristics
The road classifications for the study network as presented in Table 5-1 are
based on the current road network maps in the City of Brampton and the Town
of Caledon Master Plans. The maps are attached in Appendix D.
TABLE 5-1: CHARACTERISTICS OF ROADS SURROUNDING THE SITE
ROAD CATEGORY SPEED LIMIT LANE CONFIGURATION
AIRPORT ROAD High Capacity
Arterial
60 km/hour Two lanes per direction
south of Mayfield Road
One lane per direction
north of Mayfield Road
MAYFIELD ROAD High Capacity
Arterial
60 km/hour One lane per direction
HEALEY ROAD Collector 80 km/hour One lane per direction
INNIS LAKE ROAD Collector 80 km/hour One lane per direction
THE GORE ROAD Medium Capacity
Arterial
80 km/hour One lane per direction
KING STREET Medium Capacity
Arterial
70 km/hour One lane per direction
Current Road Constraints
Based on our review of the road network, the existing infrastructure south of
Mayfield Road along Airport Road is already designed to accommodate
heavier truck traffic volumes. As a result, the road network south of the subject
site does not require any additional improvements.
Some constraints have been identified north of Mayfield Road. They are
categorized into heavy truck restrictions, number of lanes available, and short
left-turn storage lanes. The findings of the review are outlined below.
Heavy Truck Restrictions
The site is surrounded by two roads with heavy truck restrictions: Innis Road and
Healey Road as shown in Figure 5-1 (red lines denoting roads with truck
restrictions). As a results of these restrictions, all of the truck traffic generated
by the site would need to use Airport Road and Mayfield Road to access and
egress the site. The site driveways onto these two roads will have to be
designed so that they are acceptable to the City of Brampton and Town of
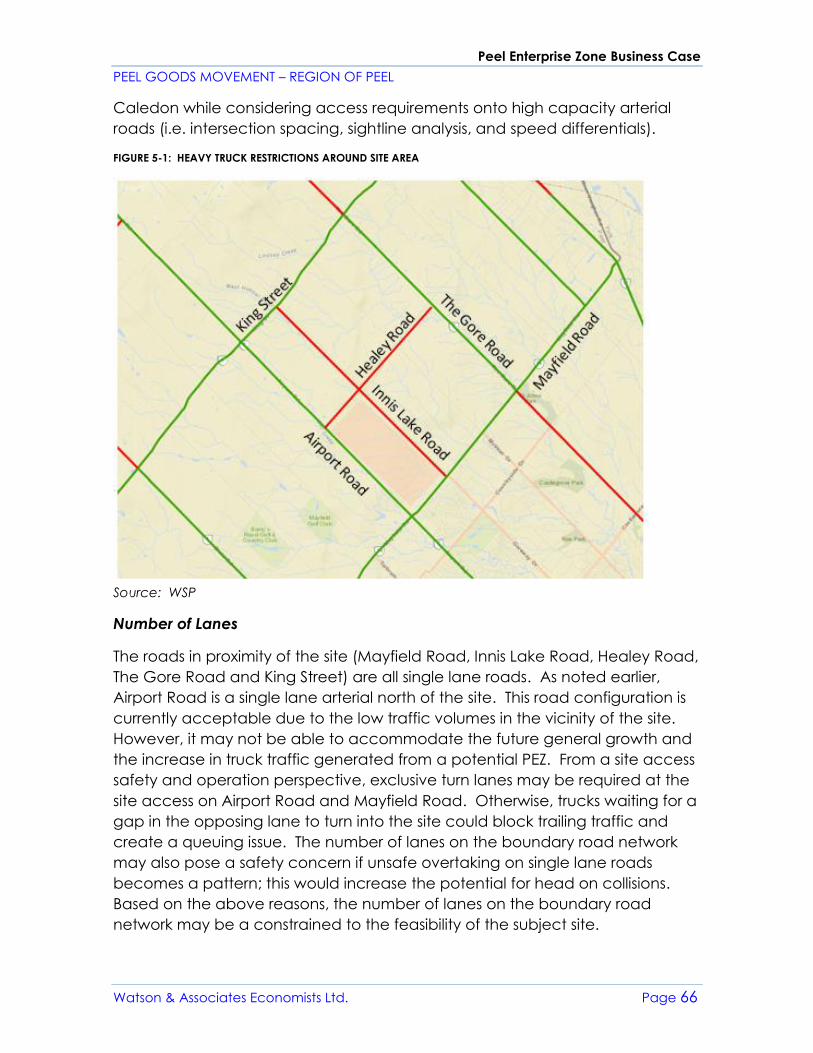
Peel Enterprise Zone Business Case
PEEL GOODS MOVEMENT – REGION OF PEEL
Watson & Associates Economists Ltd. Page 66
Caledon while considering access requirements onto high capacity arterial
roads (i.e. intersection spacing, sightline analysis, and speed differentials).
FIGURE 5-1: HEAVY TRUCK RESTRICTIONS AROUND SITE AREA
Source: WSP
Number of Lanes
The roads in proximity of the site (Mayfield Road, Innis Lake Road, Healey Road,
The Gore Road and King Street) are all single lane roads. As noted earlier,
Airport Road is a single lane arterial north of the site. This road configuration is
currently acceptable due to the low traffic volumes in the vicinity of the site.
However, it may not be able to accommodate the future general growth and
the increase in truck traffic generated from a potential PEZ. From a site access
safety and operation perspective, exclusive turn lanes may be required at the
site access on Airport Road and Mayfield Road. Otherwise, trucks waiting for a
gap in the opposing lane to turn into the site could block trailing traffic and
create a queuing issue. The number of lanes on the boundary road network
may also pose a safety concern if unsafe overtaking on single lane roads
becomes a pattern; this would increase the potential for head on collisions.
Based on the above reasons, the number of lanes on the boundary road
network may be a constrained to the feasibility of the subject site.
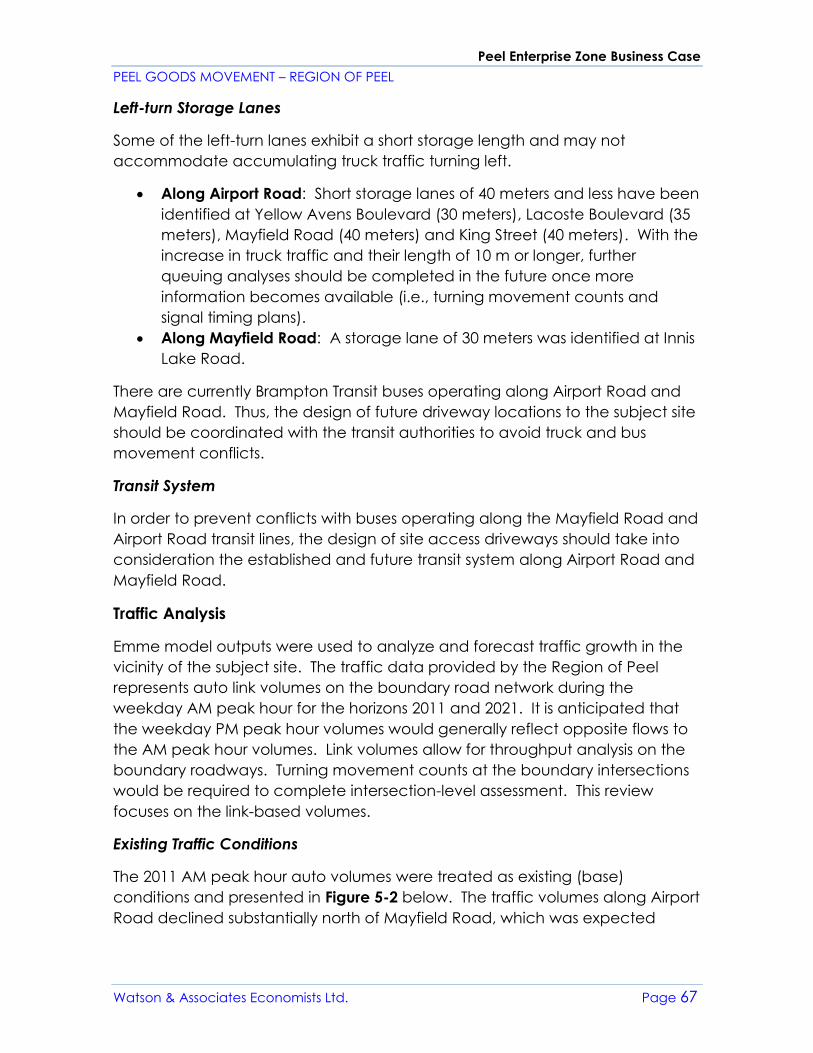
Peel Enterprise Zone Business Case
PEEL GOODS MOVEMENT – REGION OF PEEL
Watson & Associates Economists Ltd. Page 67
Left-turn Storage Lanes
Some of the left-turn lanes exhibit a short storage length and may not
accommodate accumulating truck traffic turning left.
• Along Airport Road: Short storage lanes of 40 meters and less have been
identified at Yellow Avens Boulevard (30 meters), Lacoste Boulevard (35
meters), Mayfield Road (40 meters) and King Street (40 meters). With the
increase in truck traffic and their length of 10 m or longer, further
queuing analyses should be completed in the future once more
information becomes available (i.e., turning movement counts and
signal timing plans).
• Along Mayfield Road: A storage lane of 30 meters was identified at Innis
Lake Road.
There are currently Brampton Transit buses operating along Airport Road and
Mayfield Road. Thus, the design of future driveway locations to the subject site
should be coordinated with the transit authorities to avoid truck and bus
movement conflicts.
Transit System
In order to prevent conflicts with buses operating along the Mayfield Road and
Airport Road transit lines, the design of site access driveways should take into
consideration the established and future transit system along Airport Road and
Mayfield Road.
Traffic Analysis
Emme model outputs were used to analyze and forecast traffic growth in the
vicinity of the subject site. The traffic data provided by the Region of Peel
represents auto link volumes on the boundary road network during the
weekday AM peak hour for the horizons 2011 and 2021. It is anticipated that
the weekday PM peak hour volumes would generally reflect opposite flows to
the AM peak hour volumes. Link volumes allow for throughput analysis on the
boundary roadways. Turning movement counts at the boundary intersections
would be required to complete intersection-level assessment. This review
focuses on the link-based volumes.
Existing Traffic Conditions
The 2011 AM peak hour auto volumes were treated as existing (base)
conditions and presented in Figure 5-2 below. The traffic volumes along Airport
Road declined substantially north of Mayfield Road, which was expected
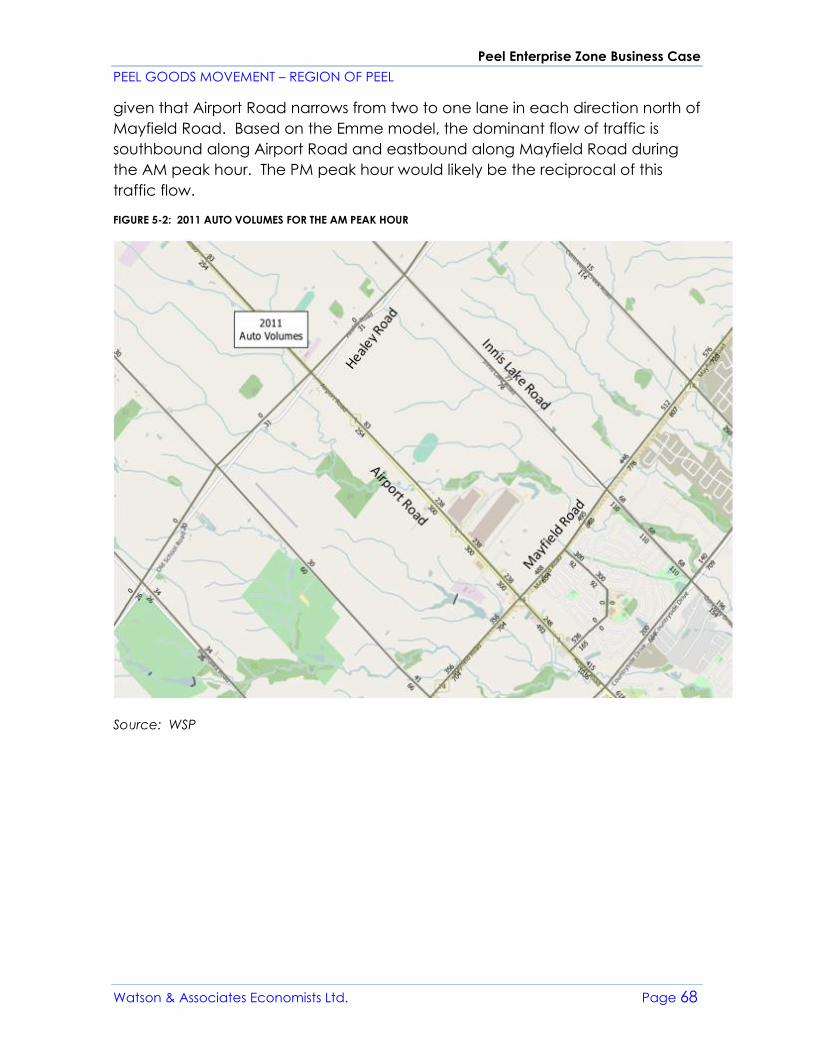
Peel Enterprise Zone Business Case
PEEL GOODS MOVEMENT – REGION OF PEEL
Watson & Associates Economists Ltd. Page 68
given that Airport Road narrows from two to one lane in each direction north of
Mayfield Road. Based on the Emme model, the dominant flow of traffic is
southbound along Airport Road and eastbound along Mayfield Road during
the AM peak hour. The PM peak hour would likely be the reciprocal of this
traffic flow.
FIGURE 5-2: 2011 AUTO VOLUMES FOR THE AM PEAK HOUR
Source: WSP
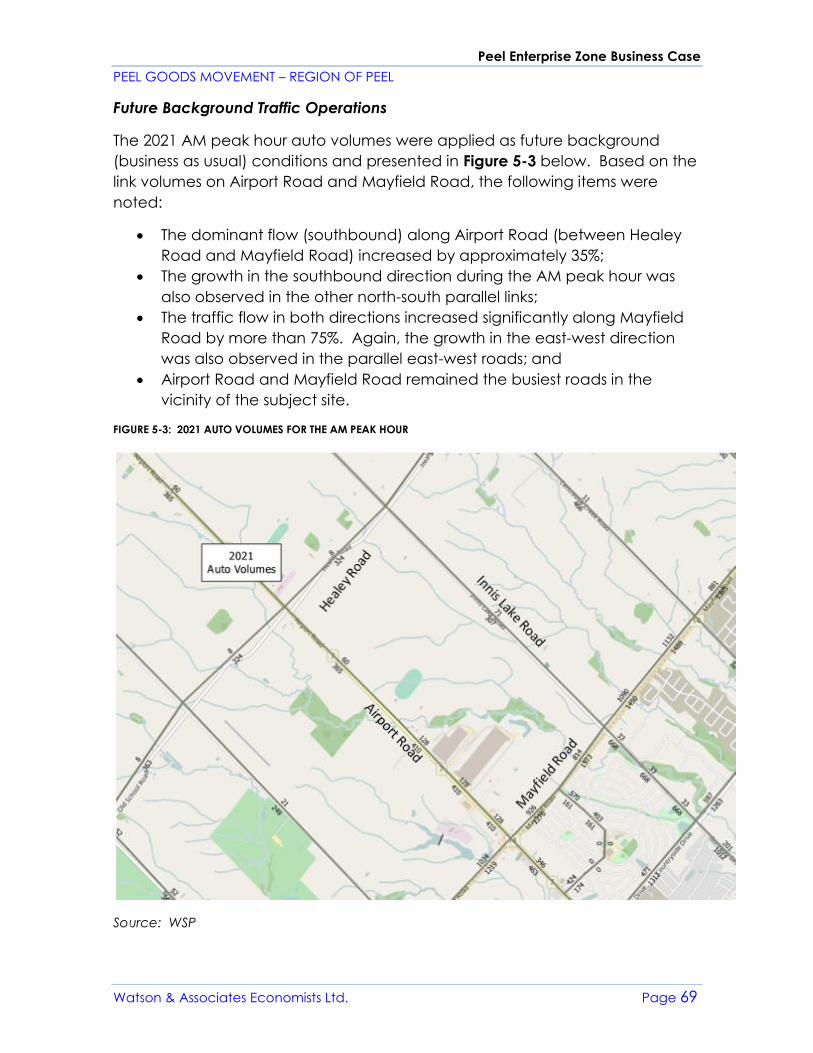
Peel Enterprise Zone Business Case
PEEL GOODS MOVEMENT – REGION OF PEEL
Watson & Associates Economists Ltd. Page 69
Future Background Traffic Operations
The 2021 AM peak hour auto volumes were applied as future background
(business as usual) conditions and presented in Figure 5-3 below. Based on the
link volumes on Airport Road and Mayfield Road, the following items were
noted:
• The dominant flow (southbound) along Airport Road (between Healey
Road and Mayfield Road) increased by approximately 35%;
• The growth in the southbound direction during the AM peak hour was
also observed in the other north-south parallel links;
• The traffic flow in both directions increased significantly along Mayfield
Road by more than 75%. Again, the growth in the east-west direction
was also observed in the parallel east-west roads; and
• Airport Road and Mayfield Road remained the busiest roads in the
vicinity of the subject site.
FIGURE 5-3: 2021 AUTO VOLUMES FOR THE AM PEAK HOUR
Source: WSP
Peel Enterprise Zone Business Case
PEEL GOODS MOVEMENT – REGION OF PEEL
Watson & Associates Economists Ltd. Page 70
Trip Generation and Assignment
The site anticipating land uses that include manufacturing, transportation,
communication, utilities, wholesale trade, retail trade and office uses. Truck trip
generation associated with these uses were calculated by the project team as
a function of developable area and subsequent employment generated.
Details of the trip generation forecast are provided in Appendix E. It is
estimated that the site will generate approximately 217 total truck trips per
hour. Based on the nature of the land uses being considered in the subject
lands, no significant truck peak patterns are expected and thus 217 truck trips
are assumed to be generated during the AM peak hour (as a worst case).
In addition to the truck trip generation, the one-way private auto trip
generation for the AM peak hour was assumed to be 200 inbound vehicles per
hour. This assumption is conservative since it assumes that almost all of the
truck drivers arrive during the AM peak hour via single-occupant trips to the
site.
Given that trucks are not allowed to take Innis Lake Road and Healey Road to
access the site, all of the truck trips generated will take Airport Road or
Mayfield Road to access and egress the site.
To evaluate the worst-case trip assignments, two scenarios have been
considered. The first scenario assigns all of the truck trips generated to Airport
Road and the second scenario assigns the truck trips to Mayfield Road instead.
These are conservative since truck drivers will likely gravitate to the route that
minimizes their delay and may be destined to different directions.
Since the Auto trips generated are not subject to any restrictions, only 50% of
the Auto trips would be assigned to each of the roads around the site.
Future Total Operations
The 2021 future total (FT) link volumes were developed by superimposing the
truck and private auto trip generation onto the 2021 future background link
volumes. As an example,
Figure 5-4 illustrates how future total volumes were calculated on Mayfield
Road in each direction.
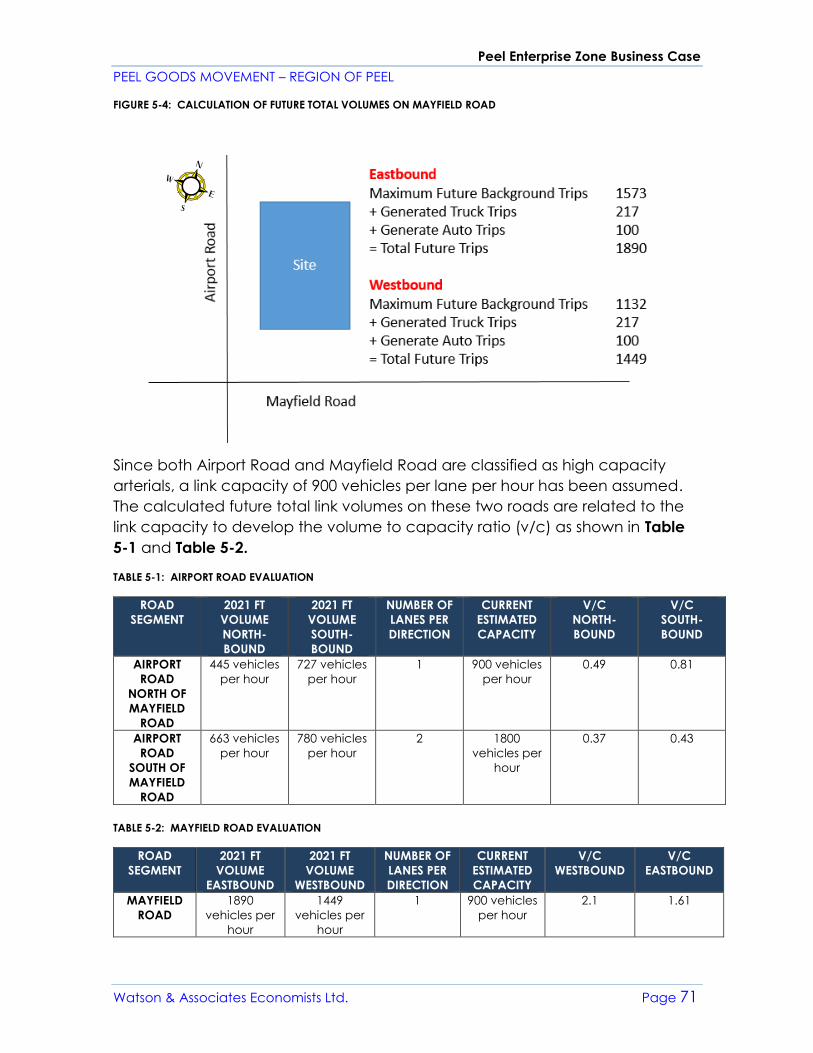
Peel Enterprise Zone Business Case
PEEL GOODS MOVEMENT – REGION OF PEEL
Watson & Associates Economists Ltd. Page 71
FIGURE 5-4: CALCULATION OF FUTURE TOTAL VOLUMES ON MAYFIELD ROAD
Since both Airport Road and Mayfield Road are classified as high capacity
arterials, a link capacity of 900 vehicles per lane per hour has been assumed.
The calculated future total link volumes on these two roads are related to the
link capacity to develop the volume to capacity ratio (v/c) as shown in Table
5-1 and Table 5-2.
TABLE 5-1: AIRPORT ROAD EVALUATION
ROAD
SEGMENT
2021 FT
VOLUME
NORTH-
BOUND
2021 FT
VOLUME
SOUTH-
BOUND
NUMBER OF
LANES PER
DIRECTION
CURRENT
ESTIMATED
CAPACITY
V/C
NORTH-
BOUND
V/C
SOUTH-
BOUND
AIRPORT
ROAD
NORTH OF
MAYFIELD
ROAD
445 vehicles
per hour
727 vehicles
per hour
1 900 vehicles
per hour
0.49 0.81
AIRPORT
ROAD
SOUTH OF
MAYFIELD
ROAD
663 vehicles
per hour
780 vehicles
per hour
2 1800
vehicles per
hour
0.37 0.43
TABLE 5-2: MAYFIELD ROAD EVALUATION
ROAD
SEGMENT
2021 FT
VOLUME
EASTBOUND
2021 FT
VOLUME
WESTBOUND
NUMBER OF
LANES PER
DIRECTION
CURRENT
ESTIMATED
CAPACITY
V/C
WESTBOUND
V/C
EASTBOUND
MAYFIELD
ROAD
1890
vehicles per
hour
1449
vehicles per
hour
1 900 vehicles
per hour
2.1 1.61
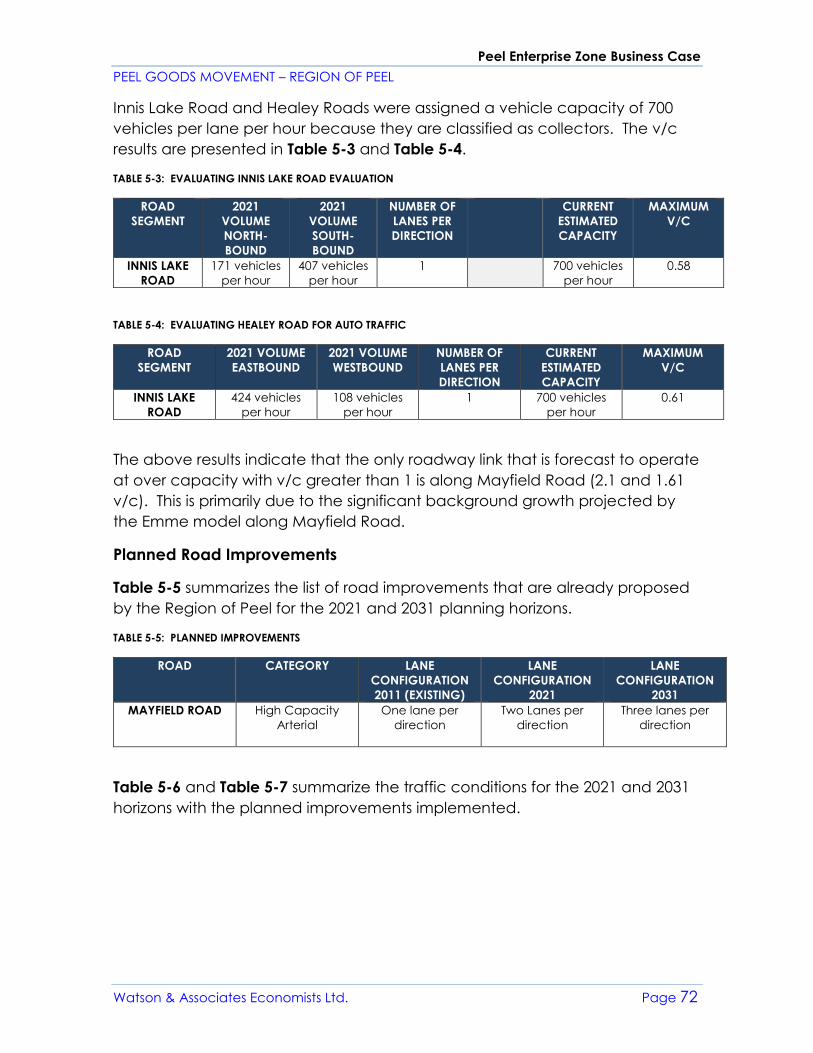
Peel Enterprise Zone Business Case
PEEL GOODS MOVEMENT – REGION OF PEEL
Watson & Associates Economists Ltd. Page 72
Innis Lake Road and Healey Roads were assigned a vehicle capacity of 700
vehicles per lane per hour because they are classified as collectors. The v/c
results are presented in Table 5-3 and Table 5-4.
TABLE 5-3: EVALUATING INNIS LAKE ROAD EVALUATION
ROAD
SEGMENT
2021
VOLUME
NORTH-
BOUND
2021
VOLUME
SOUTH-
BOUND
NUMBER OF
LANES PER
DIRECTION
CURRENT
ESTIMATED
CAPACITY
MAXIMUM
V/C
INNIS LAKE
ROAD
171 vehicles
per hour
407 vehicles
per hour
1 700 vehicles
per hour
0.58
TABLE 5-4: EVALUATING HEALEY ROAD FOR AUTO TRAFFIC
ROAD
SEGMENT
2021 VOLUME
EASTBOUND
2021 VOLUME
WESTBOUND
NUMBER OF
LANES PER
DIRECTION
CURRENT
ESTIMATED
CAPACITY
MAXIMUM
V/C
INNIS LAKE
ROAD
424 vehicles
per hour
108 vehicles
per hour
1 700 vehicles
per hour
0.61
The above results indicate that the only roadway link that is forecast to operate
at over capacity with v/c greater than 1 is along Mayfield Road (2.1 and 1.61
v/c). This is primarily due to the significant background growth projected by
the Emme model along Mayfield Road.
Planned Road Improvements
Table 5-5 summarizes the list of road improvements that are already proposed
by the Region of Peel for the 2021 and 2031 planning horizons.
TABLE 5-5: PLANNED IMPROVEMENTS
ROAD CATEGORY LANE
CONFIGURATION
2011 (EXISTING)
LANE
CONFIGURATION
2021
LANE
CONFIGURATION
2031
MAYFIELD ROAD High Capacity
Arterial
One lane per
direction
Two Lanes per
direction
Three lanes per
direction
Table 5-6 and Table 5-7 summarize the traffic conditions for the 2021 and 2031
horizons with the planned improvements implemented.
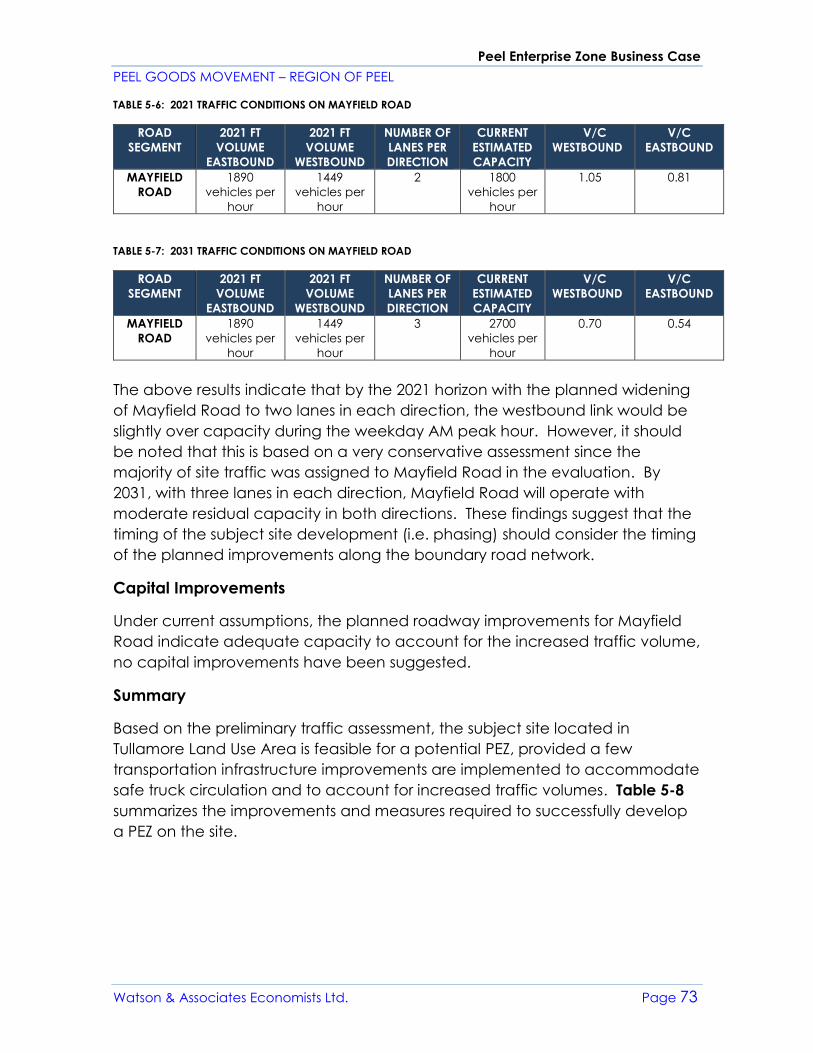
Peel Enterprise Zone Business Case
PEEL GOODS MOVEMENT – REGION OF PEEL
Watson & Associates Economists Ltd. Page 73
TABLE 5-6: 2021 TRAFFIC CONDITIONS ON MAYFIELD ROAD
ROAD
SEGMENT
2021 FT
VOLUME
EASTBOUND
2021 FT
VOLUME
WESTBOUND
NUMBER OF
LANES PER
DIRECTION
CURRENT
ESTIMATED
CAPACITY
V/C
WESTBOUND
V/C
EASTBOUND
MAYFIELD
ROAD
1890
vehicles per
hour
1449
vehicles per
hour
2 1800
vehicles per
hour
1.05 0.81
TABLE 5-7: 2031 TRAFFIC CONDITIONS ON MAYFIELD ROAD
ROAD
SEGMENT
2021 FT
VOLUME
EASTBOUND
2021 FT
VOLUME
WESTBOUND
NUMBER OF
LANES PER
DIRECTION
CURRENT
ESTIMATED
CAPACITY
V/C
WESTBOUND
V/C
EASTBOUND
MAYFIELD
ROAD
1890
vehicles per
hour
1449
vehicles per
hour
3 2700
vehicles per
hour
0.70 0.54
The above results indicate that by the 2021 horizon with the planned widening
of Mayfield Road to two lanes in each direction, the westbound link would be
slightly over capacity during the weekday AM peak hour. However, it should
be noted that this is based on a very conservative assessment since the
majority of site traffic was assigned to Mayfield Road in the evaluation. By
2031, with three lanes in each direction, Mayfield Road will operate with
moderate residual capacity in both directions. These findings suggest that the
timing of the subject site development (i.e. phasing) should consider the timing
of the planned improvements along the boundary road network.
Capital Improvements
Under current assumptions, the planned roadway improvements for Mayfield
Road indicate adequate capacity to account for the increased traffic volume,
no capital improvements have been suggested.
Summary
Based on the preliminary traffic assessment, the subject site located in
Tullamore Land Use Area is feasible for a potential PEZ, provided a few
transportation infrastructure improvements are implemented to accommodate
safe truck circulation and to account for increased traffic volumes. Table 5-8
summarizes the improvements and measures required to successfully develop
a PEZ on the site.
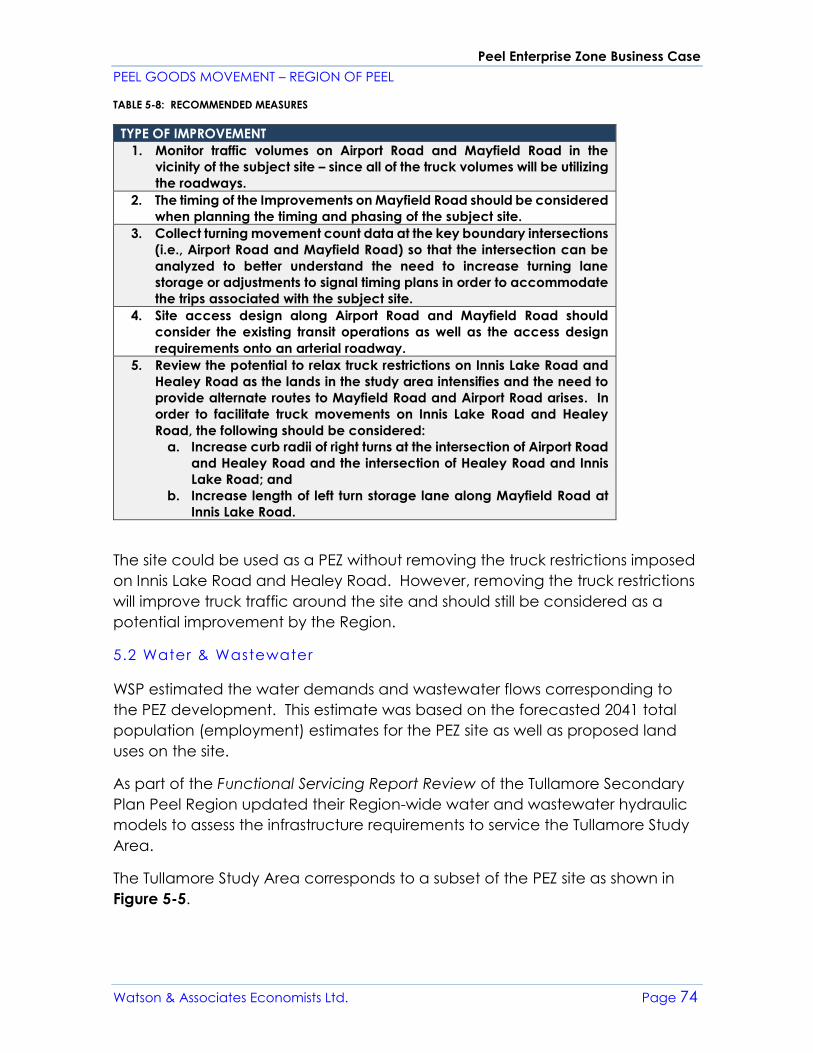
Peel Enterprise Zone Business Case
PEEL GOODS MOVEMENT – REGION OF PEEL
Watson & Associates Economists Ltd. Page 74
TABLE 5-8: RECOMMENDED MEASURES
TYPE OF IMPROVEMENT
1. Monitor traffic volumes on Airport Road and Mayfield Road in the
vicinity of the subject site – since all of the truck volumes will be utilizing
the roadways.
2. The timing of the Improvements on Mayfield Road should be considered
when planning the timing and phasing of the subject site.
3. Collect turning movement count data at the key boundary intersections
(i.e., Airport Road and Mayfield Road) so that the intersection can be
analyzed to better understand the need to increase turning lane
storage or adjustments to signal timing plans in order to accommodate
the trips associated with the subject site.
4. Site access design along Airport Road and Mayfield Road should
consider the existing transit operations as well as the access design
requirements onto an arterial roadway.
5. Review the potential to relax truck restrictions on Innis Lake Road and
Healey Road as the lands in the study area intensifies and the need to
provide alternate routes to Mayfield Road and Airport Road arises. In
order to facilitate truck movements on Innis Lake Road and Healey
Road, the following should be considered:
a. Increase curb radii of right turns at the intersection of Airport Road
and Healey Road and the intersection of Healey Road and Innis
Lake Road; and
b. Increase length of left turn storage lane along Mayfield Road at
Innis Lake Road.
The site could be used as a PEZ without removing the truck restrictions imposed
on Innis Lake Road and Healey Road. However, removing the truck restrictions
will improve truck traffic around the site and should still be considered as a
potential improvement by the Region.
5.2 Water & Wastewater
WSP estimated the water demands and wastewater flows corresponding to
the PEZ development. This estimate was based on the forecasted 2041 total
population (employment) estimates for the PEZ site as well as proposed land
uses on the site.
As part of the Functional Servicing Report Review of the Tullamore Secondary
Plan Peel Region updated their Region-wide water and wastewater hydraulic
models to assess the infrastructure requirements to service the Tullamore Study
Area.
The Tullamore Study Area corresponds to a subset of the PEZ site as shown in
Figure 5-5.
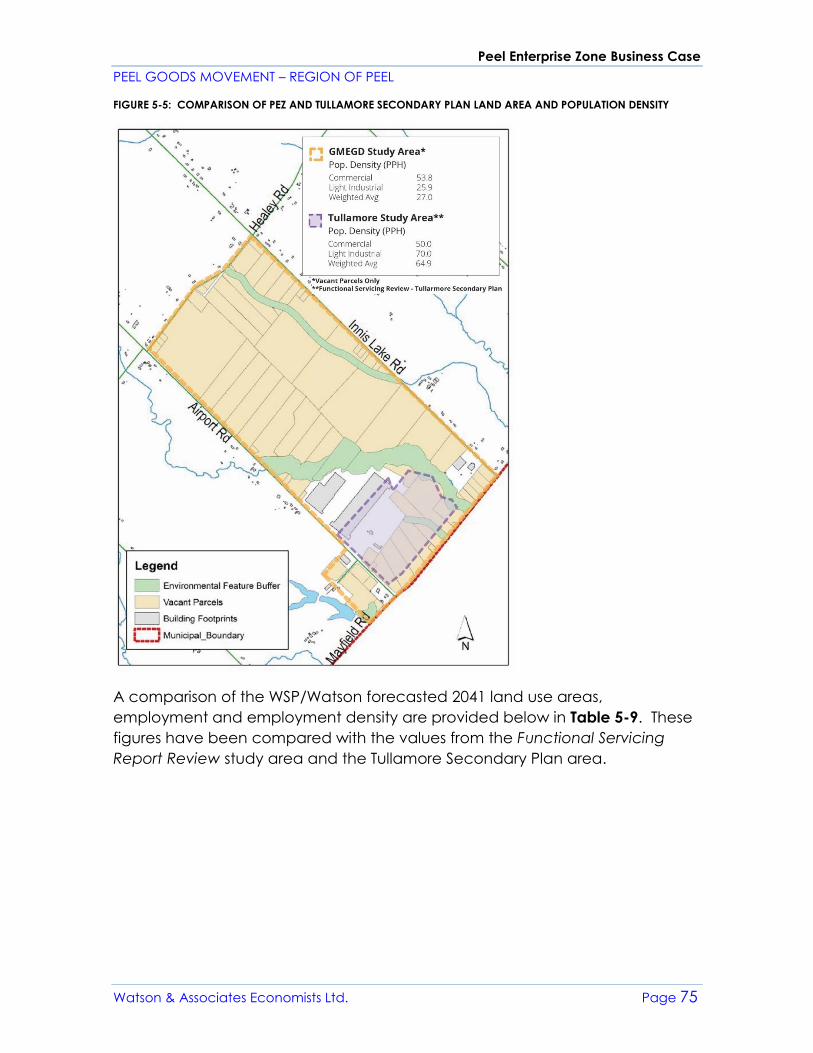
Peel Enterprise Zone Business Case
PEEL GOODS MOVEMENT – REGION OF PEEL
Watson & Associates Economists Ltd. Page 75
FIGURE 5-5: COMPARISON OF PEZ AND TULLAMORE SECONDARY PLAN LAND AREA AND POPULATION DENSITY
A comparison of the WSP/Watson forecasted 2041 land use areas,
employment and employment density are provided below in Table 5-9. These
figures have been compared with the values from the Functional Servicing
Report Review study area and the Tullamore Secondary Plan area.
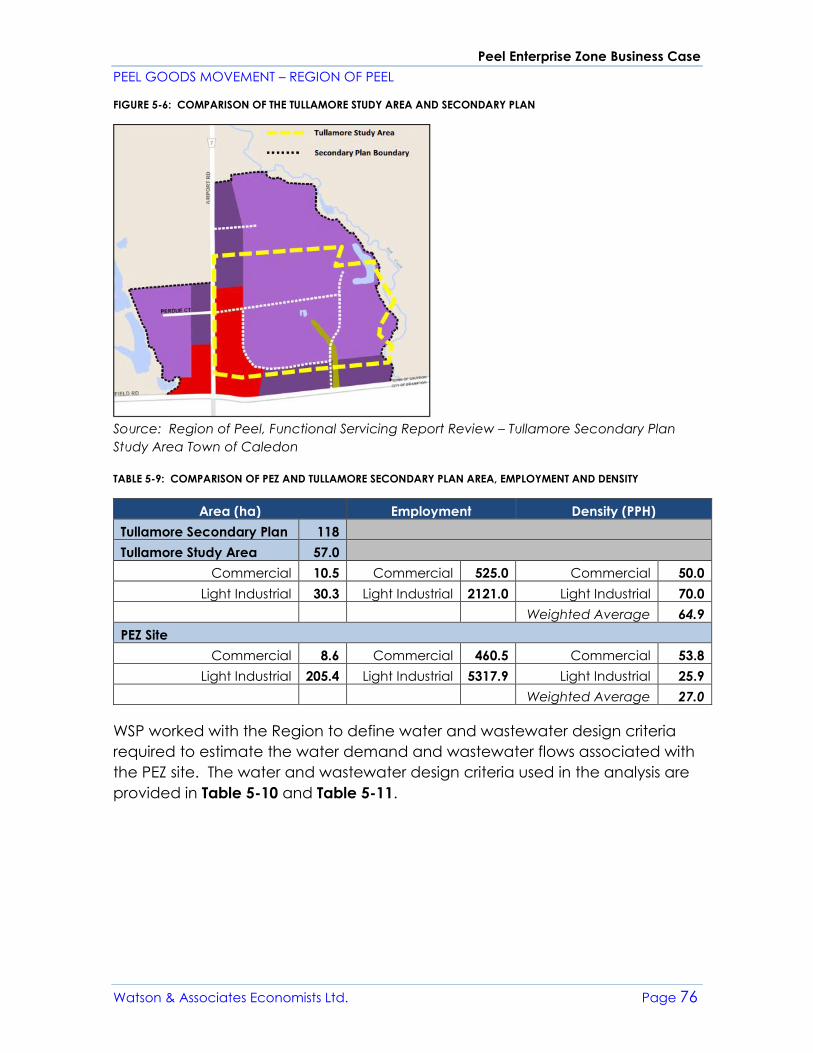
Peel Enterprise Zone Business Case
PEEL GOODS MOVEMENT – REGION OF PEEL
Watson & Associates Economists Ltd. Page 76
FIGURE 5-6: COMPARISON OF THE TULLAMORE STUDY AREA AND SECONDARY PLAN
Source: Region of Peel, Functional Servicing Report Review – Tullamore Secondary Plan
Study Area Town of Caledon
TABLE 5-9: COMPARISON OF PEZ AND TULLAMORE SECONDARY PLAN AREA, EMPLOYMENT AND DENSITY
Area (ha) Employment Density (PPH)
Tullamore Secondary Plan 118
Tullamore Study Area 57.0
Commercial 10.5 Commercial 525.0 Commercial 50.0
Light Industrial 30.3 Light Industrial 2121.0 Light Industrial 70.0
Weighted Average 64.9
PEZ Site
Commercial 8.6 Commercial 460.5 Commercial 53.8
Light Industrial 205.4 Light Industrial 5317.9 Light Industrial 25.9
Weighted Average 27.0
WSP worked with the Region to define water and wastewater design criteria
required to estimate the water demand and wastewater flows associated with
the PEZ site. The water and wastewater design criteria used in the analysis are
provided in Table 5-10 and Table 5-11.
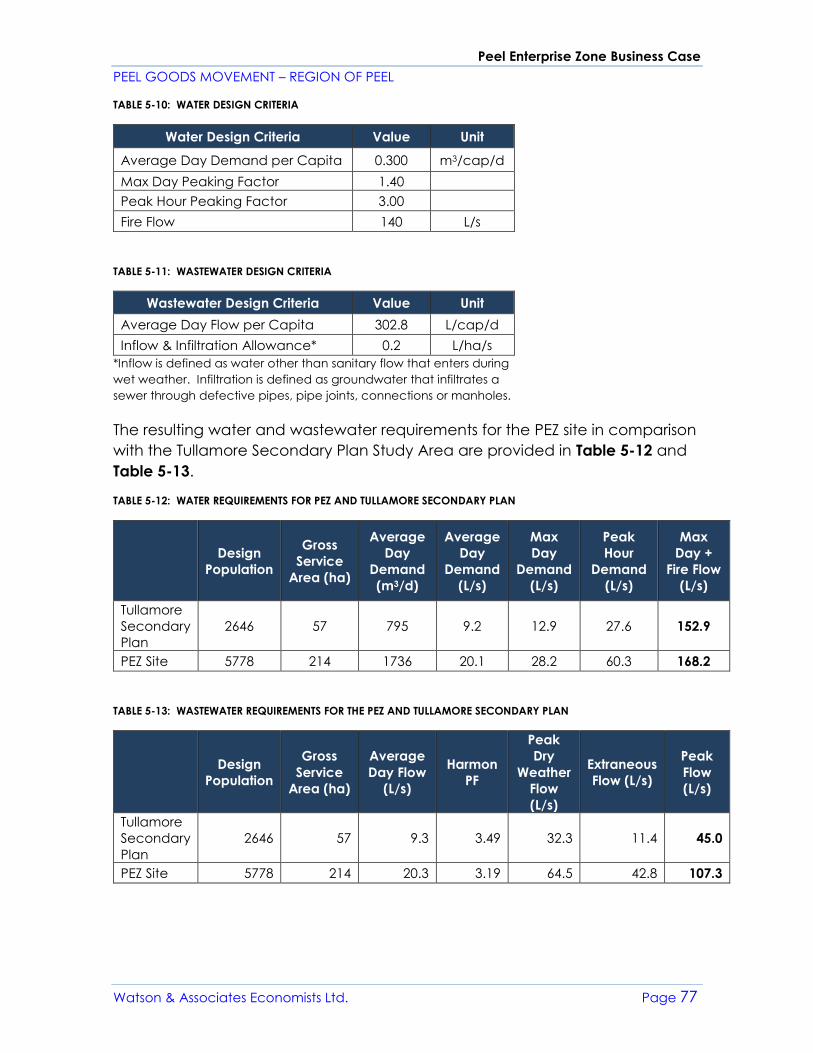
Peel Enterprise Zone Business Case
PEEL GOODS MOVEMENT – REGION OF PEEL
Watson & Associates Economists Ltd. Page 77
TABLE 5-10: WATER DESIGN CRITERIA
Water Design Criteria Value Unit
Average Day Demand per Capita 0.300 m3/cap/d
Max Day Peaking Factor 1.40
Peak Hour Peaking Factor 3.00
Fire Flow 140 L/s
TABLE 5-11: WASTEWATER DESIGN CRITERIA
Wastewater Design Criteria Value Unit
Average Day Flow per Capita 302.8 L/cap/d
Inflow & Infiltration Allowance* 0.2 L/ha/s
*Inflow is defined as water other than sanitary flow that enters during
wet weather. Infiltration is defined as groundwater that infiltrates a
sewer through defective pipes, pipe joints, connections or manholes.
The resulting water and wastewater requirements for the PEZ site in comparison
with the Tullamore Secondary Plan Study Area are provided in Table 5-12 and
Table 5-13.
TABLE 5-12: WATER REQUIREMENTS FOR PEZ AND TULLAMORE SECONDARY PLAN
Design
Population
Gross
Service
Area (ha)
Average
Day
Demand
(m3/d)
Average
Day
Demand
(L/s)
Max
Day
Demand
(L/s)
Peak
Hour
Demand
(L/s)
Max
Day +
Fire Flow
(L/s)
Tullamore
Secondary
Plan
2646 57 795 9.2 12.9 27.6 152.9
PEZ Site 5778 214 1736 20.1 28.2 60.3 168.2
TABLE 5-13: WASTEWATER REQUIREMENTS FOR THE PEZ AND TULLAMORE SECONDARY PLAN
Design
Population
Gross
Service
Area (ha)
Average
Day Flow
(L/s)
Harmon
PF
Peak
Dry
Weather
Flow
(L/s)
Extraneous
Flow (L/s)
Peak
Flow
(L/s)
Tullamore
Secondary
Plan
2646 57 9.3 3.49 32.3 11.4 45.0
PEZ Site 5778 214 20.3 3.19 64.5 42.8 107.3
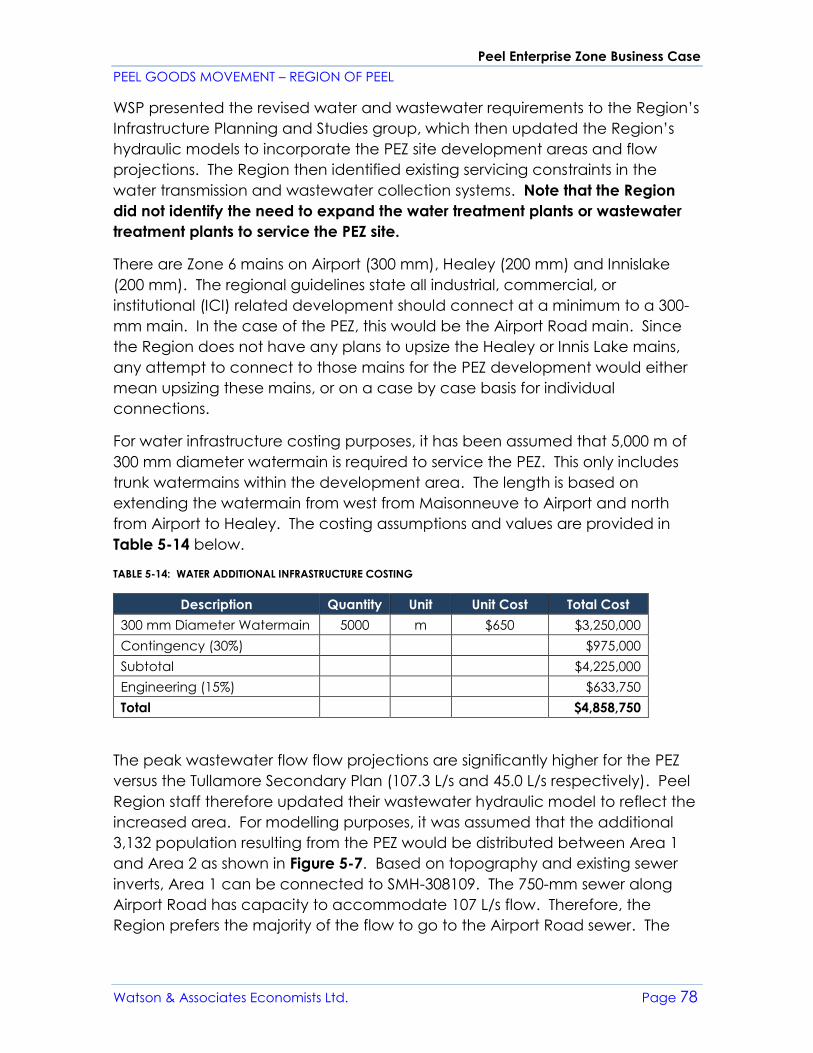
Peel Enterprise Zone Business Case
PEEL GOODS MOVEMENT – REGION OF PEEL
Watson & Associates Economists Ltd. Page 78
WSP presented the revised water and wastewater requirements to the Region’s
Infrastructure Planning and Studies group, which then updated the Region’s
hydraulic models to incorporate the PEZ site development areas and flow
projections. The Region then identified existing servicing constraints in the
water transmission and wastewater collection systems. Note that the Region
did not identify the need to expand the water treatment plants or wastewater
treatment plants to service the PEZ site.
There are Zone 6 mains on Airport (300 mm), Healey (200 mm) and Innislake
(200 mm). The regional guidelines state all industrial, commercial, or
institutional (ICI) related development should connect at a minimum to a 300-
mm main. In the case of the PEZ, this would be the Airport Road main. Since
the Region does not have any plans to upsize the Healey or Innis Lake mains,
any attempt to connect to those mains for the PEZ development would either
mean upsizing these mains, or on a case by case basis for individual
connections.
For water infrastructure costing purposes, it has been assumed that 5,000 m of
300 mm diameter watermain is required to service the PEZ. This only includes
trunk watermains within the development area. The length is based on
extending the watermain from west from Maisonneuve to Airport and north
from Airport to Healey. The costing assumptions and values are provided in
Table 5-14 below.
TABLE 5-14: WATER ADDITIONAL INFRASTRUCTURE COSTING
Description Quantity Unit Unit Cost Total Cost
300 mm Diameter Watermain 5000 m $650 $3,250,000
Contingency (30%) $975,000
Subtotal $4,225,000
Engineering (15%) $633,750
Total $4,858,750
The peak wastewater flow flow projections are significantly higher for the PEZ
versus the Tullamore Secondary Plan (107.3 L/s and 45.0 L/s respectively). Peel
Region staff therefore updated their wastewater hydraulic model to reflect the
increased area. For modelling purposes, it was assumed that the additional
3,132 population resulting from the PEZ would be distributed between Area 1
and Area 2 as shown in Figure 5-7. Based on topography and existing sewer
inverts, Area 1 can be connected to SMH-308109. The 750-mm sewer along
Airport Road has capacity to accommodate 107 L/s flow. Therefore, the
Region prefers the majority of the flow to go to the Airport Road sewer. The
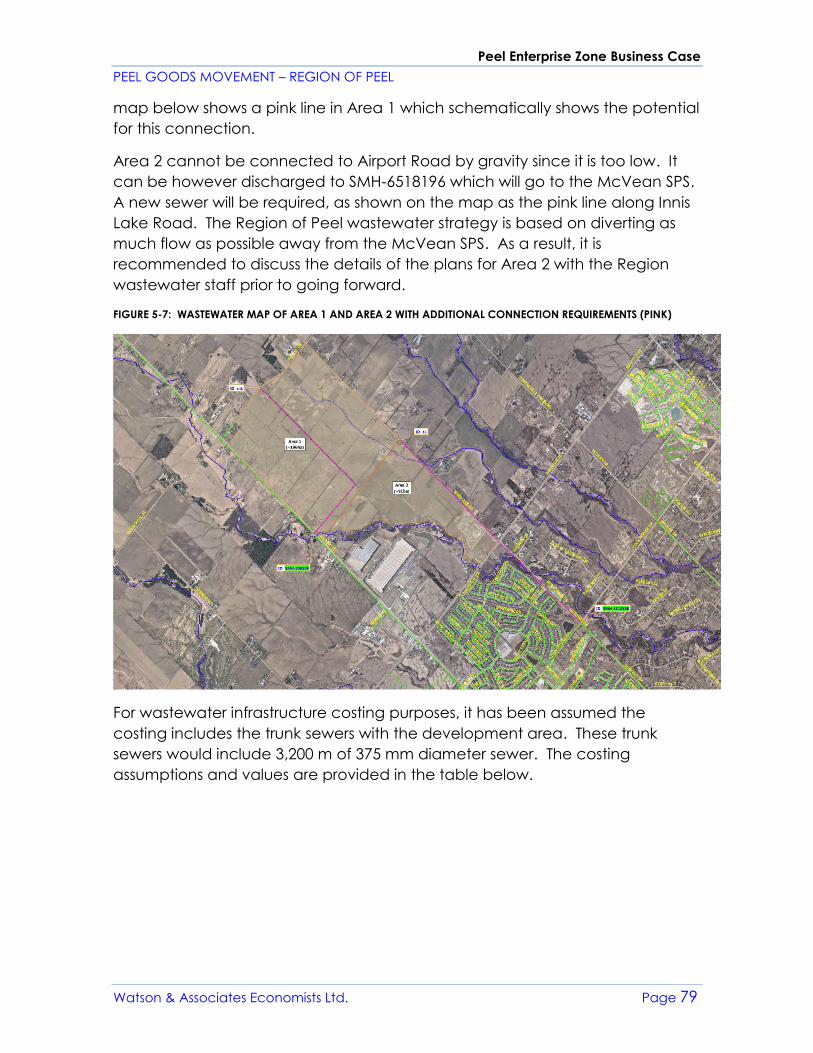
Peel Enterprise Zone Business Case
PEEL GOODS MOVEMENT – REGION OF PEEL
Watson & Associates Economists Ltd. Page 79
map below shows a pink line in Area 1 which schematically shows the potential
for this connection.
Area 2 cannot be connected to Airport Road by gravity since it is too low. It
can be however discharged to SMH-6518196 which will go to the McVean SPS.
A new sewer will be required, as shown on the map as the pink line along Innis
Lake Road. The Region of Peel wastewater strategy is based on diverting as
much flow as possible away from the McVean SPS. As a result, it is
recommended to discuss the details of the plans for Area 2 with the Region
wastewater staff prior to going forward.
FIGURE 5-7: WASTEWATER MAP OF AREA 1 AND AREA 2 WITH ADDITIONAL CONNECTION REQUIREMENTS (PINK)
For wastewater infrastructure costing purposes, it has been assumed the
costing includes the trunk sewers with the development area. These trunk
sewers would include 3,200 m of 375 mm diameter sewer. The costing
assumptions and values are provided in the table below.
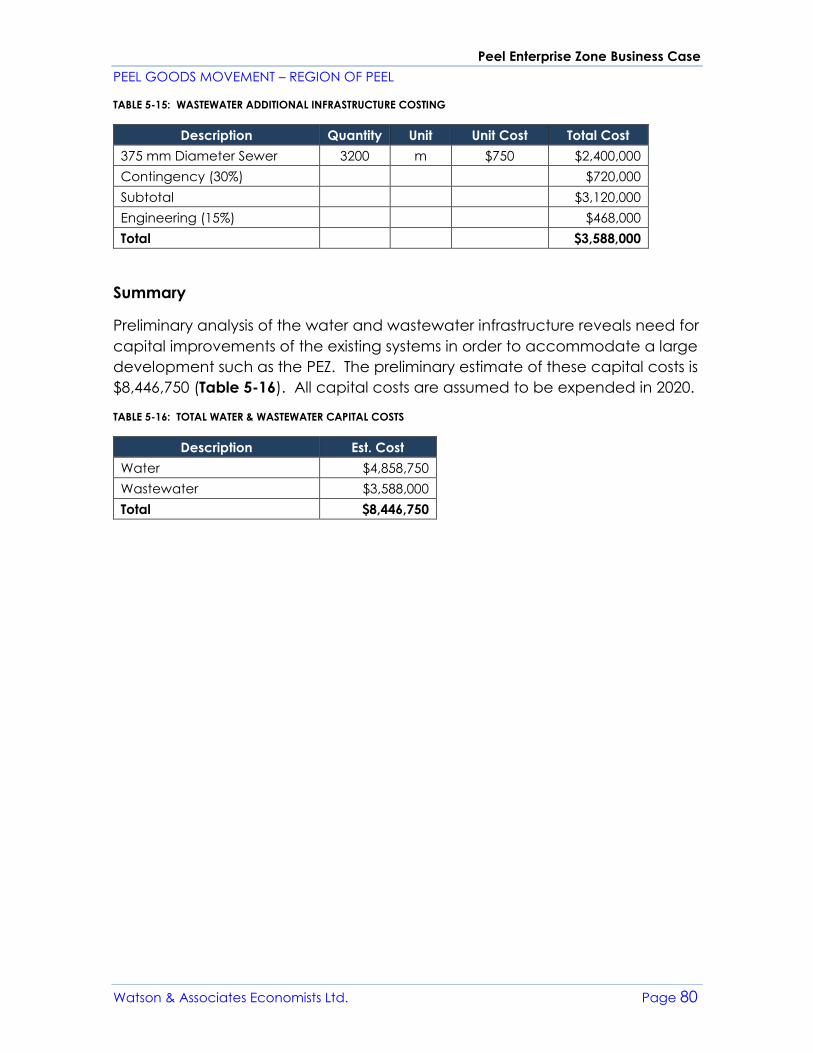
Peel Enterprise Zone Business Case
PEEL GOODS MOVEMENT – REGION OF PEEL
Watson & Associates Economists Ltd. Page 80
TABLE 5-15: WASTEWATER ADDITIONAL INFRASTRUCTURE COSTING
Description Quantity Unit Unit Cost Total Cost
375 mm Diameter Sewer 3200 m $750 $2,400,000
Contingency (30%) $720,000
Subtotal $3,120,000
Engineering (15%) $468,000
Total $3,588,000
Summary
Preliminary analysis of the water and wastewater infrastructure reveals need for
capital improvements of the existing systems in order to accommodate a large
development such as the PEZ. The preliminary estimate of these capital costs is
$8,446,750 (Table 5-16). All capital costs are assumed to be expended in 2020.
TABLE 5-16: TOTAL WATER & WASTEWATER CAPITAL COSTS
Description Est. Cost
Water $4,858,750
Wastewater $3,588,000
Total $8,446,750
Peel Enterprise Zone Business Case
PEEL GOODS MOVEMENT – REGION OF PEEL
Watson & Associates Economists Ltd. Page 81
6. GOVERNANCE STRUCTURE
The genesis of different freight villages around the world has occurred in a
variety of ways. Within the European Union it is common to see freight villages
result from public-private partnerships (PPPs) between different levels of
government, local transportation and logistics associations and private-sector
firms. In contrast, many in the United States have emerged from predominately
private investment, though, even in these cases, projects have benefitted from
public investments in infrastructure surrounding and within the site.
In terms of what the governance structure of freight village would look like in
Peel, the most effective option would be to follow the European model of
public-private partnership. This is the case for two reasons. First, the option to
replicate the private freight village developments seen in the United States is
generally not available in the Canadian context. Many freight village and
other large logistics centre developments in the US resulted from the private
purchase of decommissioned military bases, offering their owners a large
contiguous parcel of land suitable for a variety of industrial and other
employment uses. In contrast, the fragmented ownership of existing parcels of
land around key transportation and logistics infrastructure in much of Canada
(including Peel Region) would necessitate a high level of private land
assembly.
Instead, a project structure similar to that seen in Europe and the two
Canadian cases (Regina Global Transportation Hub and CentrePort Canada)
explored in Section 2.2 seems more promising. Here the public sector can
assemble the large land area required to implement a freight village, or at
least part of it. In contrast to private ownership, which would likely require the
quick development of land to maximize the return on what would be a
significant investment in land assembly, public ownership can be used to
master plan an area at a more calculated pace to achieve high levels of
efficiency and synergies among tenants.
Beyond the role of public capital in securing project feasibility, a PPP structure
also brings private-sector actors to the table as partners in managing a freight
village project, ensuring their voices are heard in management decisions and
soliciting greater buy-in from firms for locating on site.
Peel Enterprise Zone Business Case
PEEL GOODS MOVEMENT – REGION OF PEEL
Watson & Associates Economists Ltd. Page 82
7. FISCAL IMPACT ANALYSIS
Building on sections 2 through 6, a high-level assessment of the Regional fiscal
impacts associated with the preferred PEZ site selection option has been
undertaken.16 Further details are provided in Appendix F.
Fiscal Impact Approach
The fiscal impact assessment methodology provides an operating and capital
cost analysis related to the preferred PEZ site location. The operating cost
analysis involves calculating the revenues and expenditures attributable to the
existing development, which are estimated on a proportionate basis. That is,
operating revenue and expenditure dollars are assigned by distributing the
operating cost and revenues on a per capita and per employee basis. Tax
revenue is calculated based on the total tax rate applicable to the subject
area and proposed non-residential development types. The assessment
assumptions are based on a survey of similar non-residential buildings within the
local and regional market area in Peel Region.
The capital cost (lifecycle) analysis considers the infrastructure anticipated to
be assumed by the Region and allocates the annual lifecycle cost of the asset
over its useful life. We would note that as planning is in the conceptual stages,
local service costs have been estimated. Local service works such as water
and sewer mains have an annual lifecycle impact which has been included in
the net fiscal impact calculations. These costs should be reviewed by the
Region once more detailed development plans are provided.
Summary of the Anticipated Development
Table 7-1 summarizes employment and the associated gross floor area (GFA)
to be generated from the preferred PEZ site. The preferred PEZ site is
anticipated to be fully built out by the year 2041. Forecast employment within
the subject lands is expected to be concentrated by the Goods Movement
sector as well as other industrial land uses. Office uses and employment-
supportive sectors such as retail, and accommodation and food, are assumed
to comprise a small percentage of forecast employment growth for this area.
16 It is noted that the local fiscal impacts related to the Town of Caledon have not been determined
as part of this review, due to the preliminary nature of the PEZ development concept.
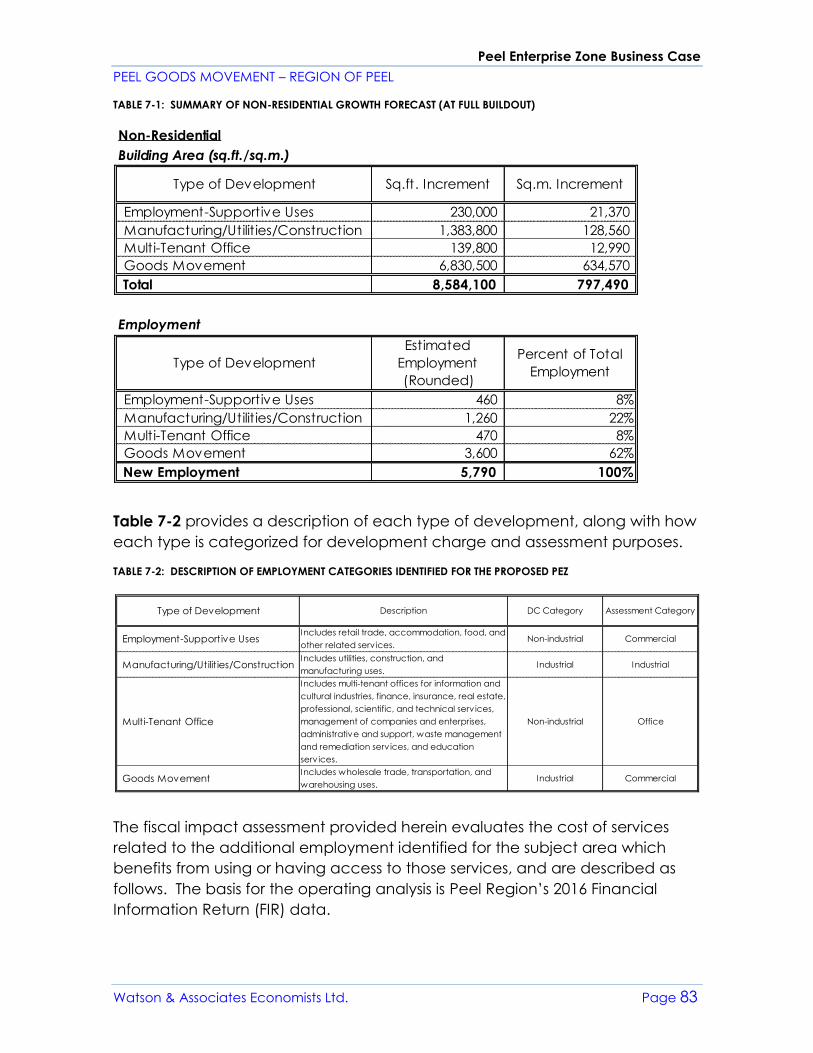
Peel Enterprise Zone Business Case
PEEL GOODS MOVEMENT – REGION OF PEEL
Watson & Associates Economists Ltd. Page 83
TABLE 7-1: SUMMARY OF NON-RESIDENTIAL GROWTH FORECAST (AT FULL BUILDOUT)
Table 7-2 provides a description of each type of development, along with how
each type is categorized for development charge and assessment purposes.
TABLE 7-2: DESCRIPTION OF EMPLOYMENT CATEGORIES IDENTIFIED FOR THE PROPOSED PEZ
The fiscal impact assessment provided herein evaluates the cost of services
related to the additional employment identified for the subject area which
benefits from using or having access to those services, and are described as
follows. The basis for the operating analysis is Peel Region’s 2016 Financial
Information Return (FIR) data.
Non-Residential
Building Area (sq.ft./sq.m.)
Employment-Supportive Uses 230,000 21,370
Manufacturing/Utilities/Construction 1,383,800 128,560
Multi-Tenant Office 139,800 12,990
Goods Movement 6,830,500 634,570
Total 8,584,100 797,490
Employment
Employment-Supportive Uses 460 8%
Manufacturing/Utilities/Construction 1,260 22%
Multi-Tenant Office 470 8%
Goods Movement 3,600 62%
New Employment 5,790 100%
Sq.m. Increment
Percent of Total
Employment
Type of Development Sq.ft. Increment
Type of Development
Estimated
Employment
(Rounded)
Type of Development Description DC Category Assessment Category
Employment-Supportive Uses Includes retail trade, accommodation, food, and
other related serv ices.Non-industrial Commercial
Manufacturing/Utilities/ConstructionIncludes utilities, construction, and
manufacturing uses.Industrial Industrial
Multi-Tenant Office
Includes multi-tenant offices for information and
cultural industries, finance, insurance, real estate,
professional, scientific, and technical serv ices,
management of companies and enterprises,
administrative and support, waste management
and remediation serv ices, and education
serv ices.
Non-industrial Office
Goods MovementIncludes wholesale trade, transportation, and
warehousing uses.Industrial Commercial
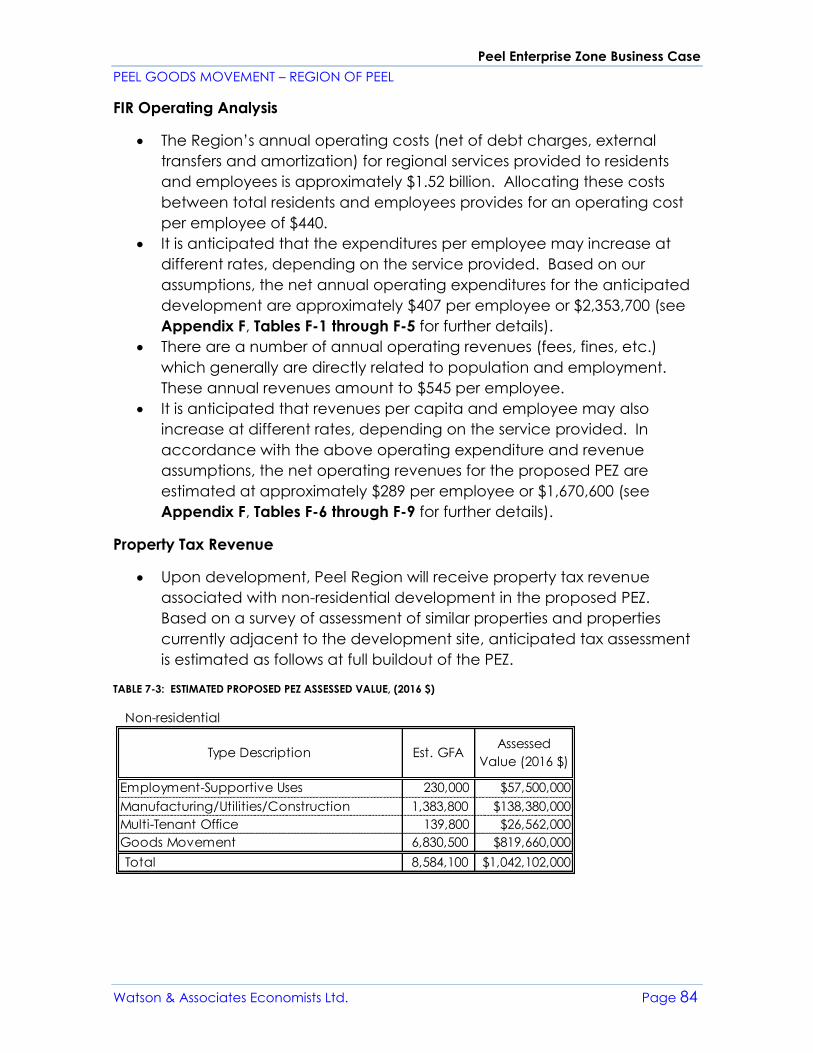
Peel Enterprise Zone Business Case
PEEL GOODS MOVEMENT – REGION OF PEEL
Watson & Associates Economists Ltd. Page 84
FIR Operating Analysis
• The Region’s annual operating costs (net of debt charges, external
transfers and amortization) for regional services provided to residents
and employees is approximately $1.52 billion. Allocating these costs
between total residents and employees provides for an operating cost
per employee of $440.
• It is anticipated that the expenditures per employee may increase at
different rates, depending on the service provided. Based on our
assumptions, the net annual operating expenditures for the anticipated
development are approximately $407 per employee or $2,353,700 (see
Appendix F, Tables F-1 through F-5 for further details).
• There are a number of annual operating revenues (fees, fines, etc.)
which generally are directly related to population and employment.
These annual revenues amount to $545 per employee.
• It is anticipated that revenues per capita and employee may also
increase at different rates, depending on the service provided. In
accordance with the above operating expenditure and revenue
assumptions, the net operating revenues for the proposed PEZ are
estimated at approximately $289 per employee or $1,670,600 (see
Appendix F, Tables F-6 through F-9 for further details).
Property Tax Revenue
• Upon development, Peel Region will receive property tax revenue
associated with non-residential development in the proposed PEZ.
Based on a survey of assessment of similar properties and properties
currently adjacent to the development site, anticipated tax assessment
is estimated as follows at full buildout of the PEZ.
TABLE 7-3: ESTIMATED PROPOSED PEZ ASSESSED VALUE, (2016 $)
Non-residential
Employment-Supportive Uses 230,000 $57,500,000
Manufacturing/Utilities/Construction 1,383,800 $138,380,000
Multi-Tenant Office 139,800 $26,562,000
Goods Movement 6,830,500 $819,660,000
Total 8,584,100 $1,042,102,000
Type Description Est. GFAAssessed
Value (2016 $)
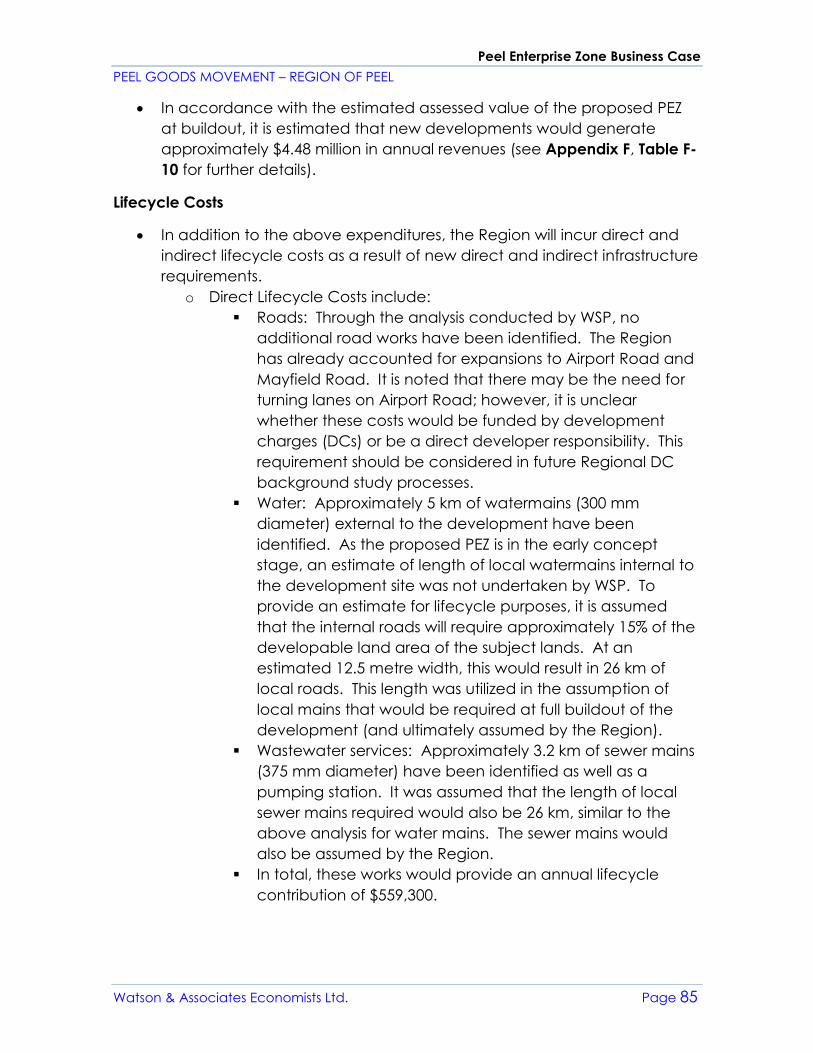
Peel Enterprise Zone Business Case
PEEL GOODS MOVEMENT – REGION OF PEEL
Watson & Associates Economists Ltd. Page 85
• In accordance with the estimated assessed value of the proposed PEZ
at buildout, it is estimated that new developments would generate
approximately $4.48 million in annual revenues (see Appendix F, Table F-
10 for further details).
Lifecycle Costs
• In addition to the above expenditures, the Region will incur direct and
indirect lifecycle costs as a result of new direct and indirect infrastructure
requirements.
o Direct Lifecycle Costs include:
▪ Roads: Through the analysis conducted by WSP, no
additional road works have been identified. The Region
has already accounted for expansions to Airport Road and
Mayfield Road. It is noted that there may be the need for
turning lanes on Airport Road; however, it is unclear
whether these costs would be funded by development
charges (DCs) or be a direct developer responsibility. This
requirement should be considered in future Regional DC
background study processes.
▪ Water: Approximately 5 km of watermains (300 mm
diameter) external to the development have been
identified. As the proposed PEZ is in the early concept
stage, an estimate of length of local watermains internal to
the development site was not undertaken by WSP. To
provide an estimate for lifecycle purposes, it is assumed
that the internal roads will require approximately 15% of the
developable land area of the subject lands. At an
estimated 12.5 metre width, this would result in 26 km of
local roads. This length was utilized in the assumption of
local mains that would be required at full buildout of the
development (and ultimately assumed by the Region).
▪ Wastewater services: Approximately 3.2 km of sewer mains
(375 mm diameter) have been identified as well as a
pumping station. It was assumed that the length of local
sewer mains required would also be 26 km, similar to the
above analysis for water mains. The sewer mains would
also be assumed by the Region.
▪ In total, these works would provide an annual lifecycle
contribution of $559,300.
Peel Enterprise Zone Business Case
PEEL GOODS MOVEMENT – REGION OF PEEL
Watson & Associates Economists Ltd. Page 86
o Indirect Lifecycle Costs: The Region’s 2013 DC background
study17 provides an estimated lifecycle cost for each service
identified in the DC calculation. A proportionate share of the
lifecycle costs has been identified based on the projected growth
of the development relative to the anticipated growth in the Peel
Region DC background study. This provides for additional
external lifecycle costs required for services which may be
indirectly impacted by the proposed PEZ. Annual indirect
lifecycle contributions attributable to the proposed PEZ are
approximately $792,800 (see Appendix F, Tables F-11 and F-12 for
further details).
Based on the foregoing, the estimated annual net fiscal impact on the Region
of Peel is summarized below in Table 7-4. In accordance with the estimated
annual revenues and expenditures assigned to the PEZ, an annual net fiscal
surplus of $2.45 million has been identified at full buildout of the subject lands.
17 The Regional Municipality of Peel Development Charge Background Study – Office Consolidation,
dated November 25, 2015
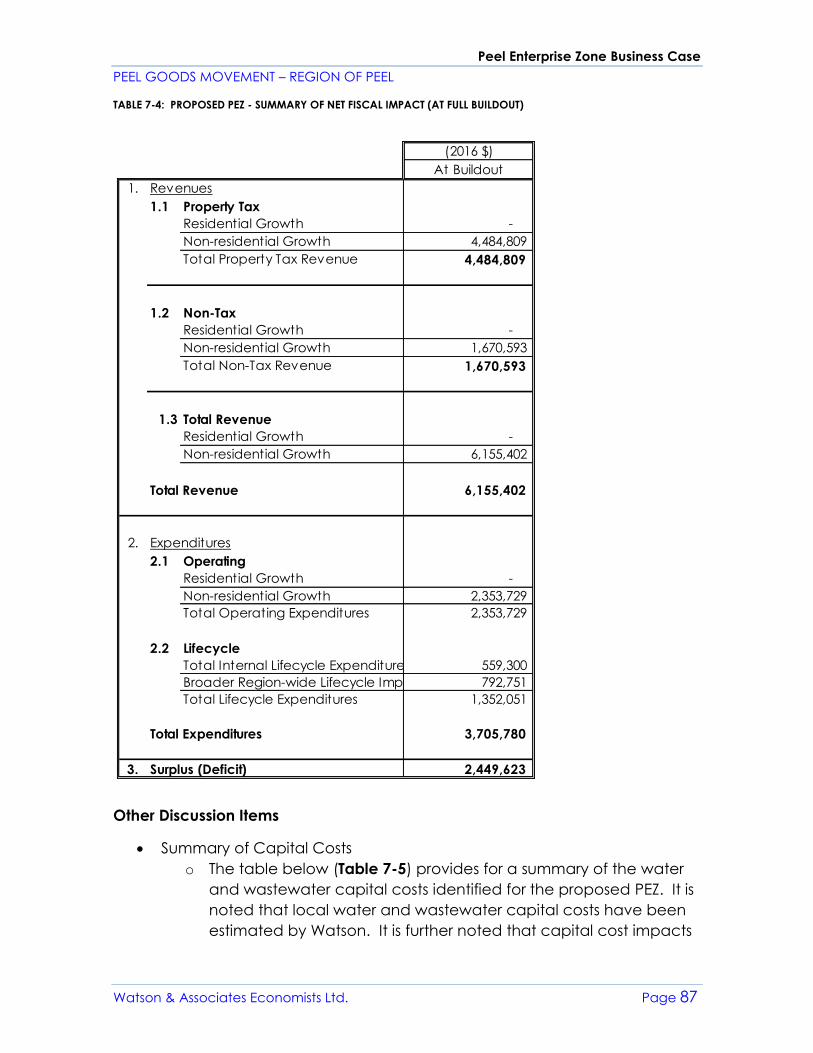
Peel Enterprise Zone Business Case
PEEL GOODS MOVEMENT – REGION OF PEEL
Watson & Associates Economists Ltd. Page 87
TABLE 7-4: PROPOSED PEZ - SUMMARY OF NET FISCAL IMPACT (AT FULL BUILDOUT)
Other Discussion Items
• Summary of Capital Costs
o The table below (Table 7-5) provides for a summary of the water
and wastewater capital costs identified for the proposed PEZ. It is
noted that local water and wastewater capital costs have been
estimated by Watson. It is further noted that capital cost impacts
(2016 $)
At Buildout
1. Revenues
1.1 Property Tax
Residential Growth -
Non-residential Growth 4,484,809
Total Property Tax Revenue 4,484,809
1.2 Non-Tax
Residential Growth -
Non-residential Growth 1,670,593
Total Non-Tax Revenue 1,670,593
1.3 Total Revenue
Residential Growth -
Non-residential Growth 6,155,402
Total Revenue 6,155,402
2. Expenditures
2.1 Operating
Residential Growth -
Non-residential Growth 2,353,729
Total Operating Expenditures 2,353,729
2.2 Lifecycle
Total Internal Lifecycle Expenditures 559,300
Broader Region-wide Lifecycle Impacts 792,751
Total Lifecycle Expenditures 1,352,051
Total Expenditures 3,705,780
3. Surplus (Deficit) 2,449,623
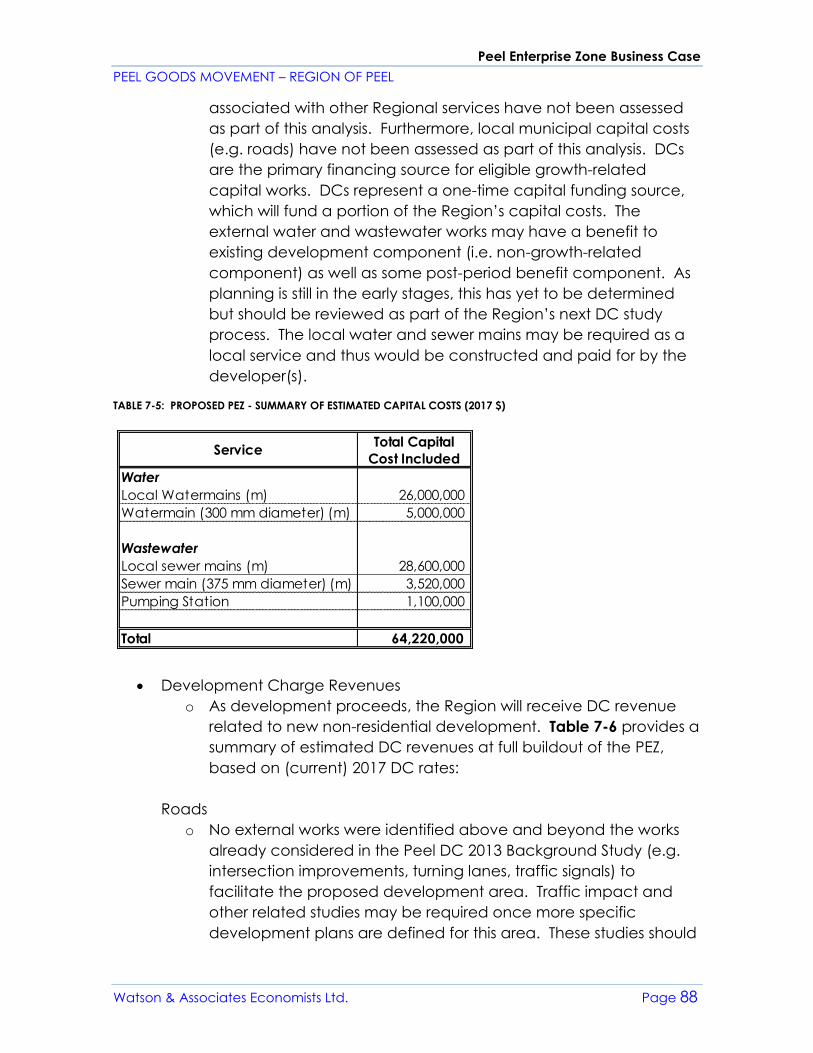
Peel Enterprise Zone Business Case
PEEL GOODS MOVEMENT – REGION OF PEEL
Watson & Associates Economists Ltd. Page 88
associated with other Regional services have not been assessed
as part of this analysis. Furthermore, local municipal capital costs
(e.g. roads) have not been assessed as part of this analysis. DCs
are the primary financing source for eligible growth-related
capital works. DCs represent a one-time capital funding source,
which will fund a portion of the Region’s capital costs. The
external water and wastewater works may have a benefit to
existing development component (i.e. non-growth-related
component) as well as some post-period benefit component. As
planning is still in the early stages, this has yet to be determined
but should be reviewed as part of the Region’s next DC study
process. The local water and sewer mains may be required as a
local service and thus would be constructed and paid for by the
developer(s).
TABLE 7-5: PROPOSED PEZ - SUMMARY OF ESTIMATED CAPITAL COSTS (2017 $)
• Development Charge Revenues
o As development proceeds, the Region will receive DC revenue
related to new non-residential development. Table 7-6 provides a
summary of estimated DC revenues at full buildout of the PEZ,
based on (current) 2017 DC rates:
Roads
o No external works were identified above and beyond the works
already considered in the Peel DC 2013 Background Study (e.g.
intersection improvements, turning lanes, traffic signals) to
facilitate the proposed development area. Traffic impact and
other related studies may be required once more specific
development plans are defined for this area. These studies should
ServiceTotal Capital
Cost Included
Water
Local Watermains (m) 26,000,000
Watermain (300 mm diameter) (m) 5,000,000
Wastewater
Local sewer mains (m) 28,600,000
Sewer main (375 mm diameter) (m) 3,520,000
Pumping Station 1,100,000
Total 64,220,000
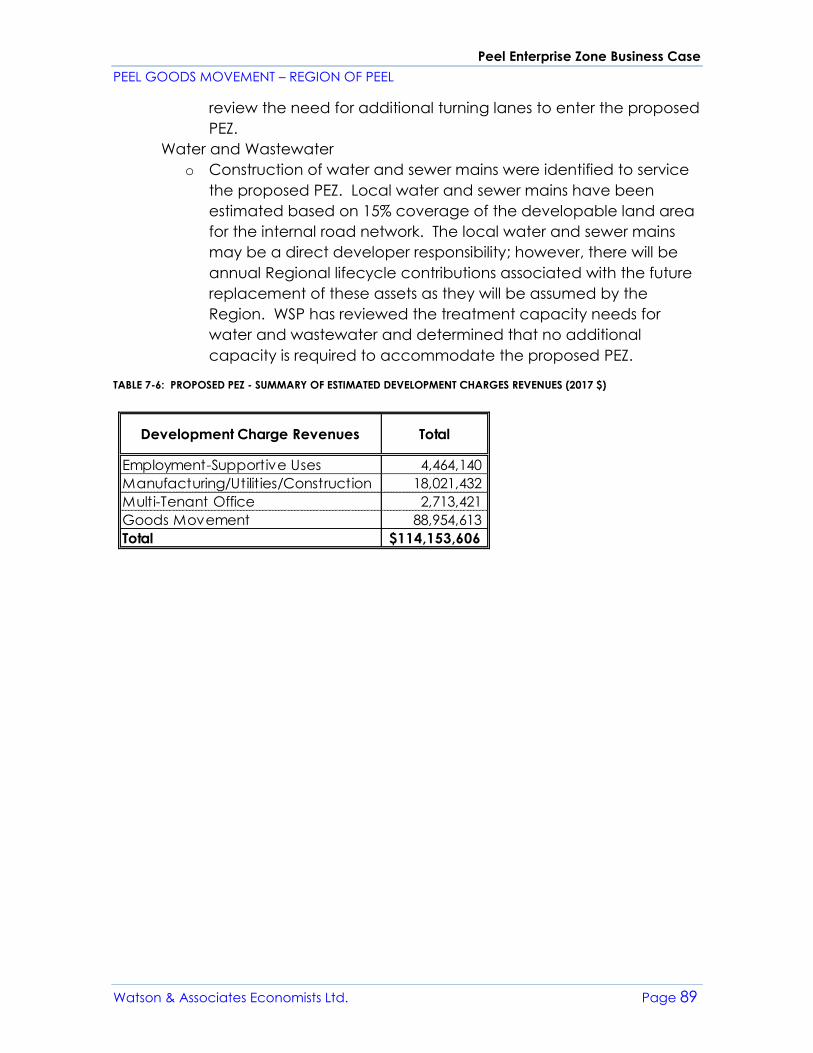
Peel Enterprise Zone Business Case
PEEL GOODS MOVEMENT – REGION OF PEEL
Watson & Associates Economists Ltd. Page 89
review the need for additional turning lanes to enter the proposed
PEZ.
Water and Wastewater
o Construction of water and sewer mains were identified to service
the proposed PEZ. Local water and sewer mains have been
estimated based on 15% coverage of the developable land area
for the internal road network. The local water and sewer mains
may be a direct developer responsibility; however, there will be
annual Regional lifecycle contributions associated with the future
replacement of these assets as they will be assumed by the
Region. WSP has reviewed the treatment capacity needs for
water and wastewater and determined that no additional
capacity is required to accommodate the proposed PEZ.
TABLE 7-6: PROPOSED PEZ - SUMMARY OF ESTIMATED DEVELOPMENT CHARGES REVENUES (2017 $)
Development Charge Revenues Total
Employment-Supportive Uses 4,464,140
Manufacturing/Utilities/Construction 18,021,432
Multi-Tenant Office 2,713,421
Goods Movement 88,954,613
Total 114,153,606$
Peel Enterprise Zone Business Case
PEEL GOODS MOVEMENT – REGION OF PEEL
Watson & Associates Economists Ltd. Page 90
8. ECONOMIC IMPACT ANALYSIS
The development of and operations within a PEZ would create opportunities for
increased economic activity in the form of jobs, GDP and economic output.
This economic activity will be generated from both the construction of the
necessary infrastructure needed for the facility and through the business
operations occurring on the site.
8.1 Methodology
The economic impacts assessed in this study are the result of the construction
of the PEZ (short-term) and employment creation and spending due to the PEZ
(long-term).
An Input-Output (I-O) model was used to simulate the economic impacts of
expenditures on a given basket of goods and services related to construction
(short-term) and freight industries (long-term). An I-O model can be used to
explain how one sector or industry can affect others in the same region,
province or nation. These models are used to simulate the economic impact
of an expenditure on a given basket of goods and services or the output of
one of several industries. I-O analysis is based on information about the flow of
goods and services among various sectors of the economy. It allows for the
calculation of relationships between various aspects of a given economy,
including production, consumption and all inter-industry relationship associated
with the factors of production (labour and capital) and consumption (wages
and income).18
An I-O model relies on the concept that the output of one sector can in turn
become the input for another sector. Within an I-O model the economy is
divided into a matrix of industries, which maps the relationship of the
production of one industry onto the consumption of another industry.
Intermediate goods and services which are used during the production of final
commodities to be used by consumers can be identified within the model. The
simulation results from a "shock" to an I-O model will show the direct and
indirect impacts.19 This allows for the aggregation of all the employment and
value-added (GDP) in the supply chain as goods are produced.
18 Washington State Department of Transportation (WashDOT). Development of a Freight Benefit/Cost
Methodology for Project Planning. June 2013. 19 Statistics Canada. Input-Output Model Simulations: Interprovincial Model. 2013.
Peel Enterprise Zone Business Case
PEEL GOODS MOVEMENT – REGION OF PEEL
Watson & Associates Economists Ltd. Page 91
For the purposes of this study, the Statistics Canada Provincial Input-Output
Multipliers were used to develop the current and future economic impacts.20
The most current year for which provincial Input-Output multipliers are available
is 2013. As a result, one of the main underlying assumptions in this model is
inter-industry relationships associated with the factors of production (labour
and capital) and consumption (wages and income) in Ontario are the same
as those in Peel.
Another further assumption when using the Statistics Canada I-O tables is
industry relationships are fixed, and does not account for changes in industry
relationship. For example, the I-O tables assume technology remains constant
as an input to production for a given industry. Therefore, major future
technological shifts such as automated vehicles are not captured. The current
make-up an industry, and its required inputs, are assumed to remain constant
in the analysis.
8.2 Output, GDP, Labour Income and Jobs
The short- and long-term economic impacts include: output, GDP, labour
income and jobs. A description of these impacts is included in this section.
Output
Output represents the value of industry production. Output consists of goods
and services which are produced during construction of the PEZ and within a
Goods Movement establishment that become available for use outside that
establishment, plus any goods and services produced for own final use by the
establishment.
The price for these goods and services are their selling price at the boundary of
the producing establishment excluding sales and excise taxes levied after the
final stage of production.21 Output by industry is measured as the sum of the
transaction prices of these goods and services, which equates to total business
revenues.
GDP
GDP is the total value-added produced in a region or country, measured as
the monetary value of all the finished goods and services. It includes all public
and private consumption, government outlays, investments and net exports
which occur within a region.
20 Statistics Canada, Industry Accounts Division. Ontario Provincial Input-Output Multipliers. 2013. 21 Statistics Canada. Provincial Input-Output Multipliers. Industry Accounts Division. 2010.
Peel Enterprise Zone Business Case
PEEL GOODS MOVEMENT – REGION OF PEEL
Watson & Associates Economists Ltd. Page 92
GDP is the most appropriate measure for assessing the overall economic
impact of the PEZ construction and subsequent Goods Movement industry
activity, since the value of the productive work is only counted once.
GDP presented herein excludes sales and excise taxes levied after the final
stage of production. For the purposes of this study, GDP is a measure of the
value-added (the unduplicated value of goods and services) to the Peel
economy attributable to the productive activities of PEZ construction and PEZ
tenant industries. For individual companies, GDP represents the difference
between the value of its sales and the cost of its purchases from suppliers.
Jobs
Jobs represent the total employment impact created as a result of
construction (short-term jobs) and PEZ Goods Movement industries (long-term
jobs). Jobs numbers are a function of total annual business revenue for goods
moving industries. Jobs are measured in terms of full-year equivalent positions
for ongoing employment.
Jobs include employees of businesses in the PEZ (direct), those generated by
businesses that support the PEZ (indirect), and those generated from spending
of labor income (induced).
Labour Income
Labour income represents total earnings of employees, consisting of wages
and salaries as well as supplementary labour income. Supplementary labour
income includes items such as: employer contributions to pension funds,
employee welfare funds, unemployment insurance and workers compensation
funds.
The labour income economic impacts will be estimated for the labour income
generated by employees during the construction phase (short-term) of the PEZ
develop and during the business activities occurring in the PEZ (long-term).
8.3 Direct Effects, Indirect Effects, and Induced Effects
The construction and operating activities of a PEZ would impact other industry
sectors through economic multiplier effects. The multiplier effected are
expressed as direct, indirect, and induced effects.
Direct Effects
Direct effects are the economic impacts which result from immediate activities
directly associated with the construction and Goods Movement industries
Peel Enterprise Zone Business Case
PEEL GOODS MOVEMENT – REGION OF PEEL
Watson & Associates Economists Ltd. Page 93
related to the PEZ. Direct effects include the contribution to GDP, labour
income, jobs and revenue from businesses (output). Direct effects have a
multiplying economic impact on business spending on services and supplies
required to support construction and freight supply chains, as well as the
spending of disposable income from employees working in construction and
Goods Movement industries on personal household needs. These two
multiplying effects are referred to as indirect and induced effects respectively
and are described in more detail below.
Indirect Effects
Indirect effects measure the changes due to inter-industry purchases as they
respond to the new demands of the directly affected construction and Goods
Movement industries. This includes all the chain reaction of output up the
supply chain since each of the products purchased and transported will
require, in turn, the production of various inputs.22 The suppliers of these inputs
will in turn employ workers, earn their own business revenue, and pay taxes
which constitute indirect effects. These suppliers will also generate demands
for labour and goods and services produced by other industries.
Induced Effects
Induced effects measure the changes in the production of goods and services
in response to consumer expenditures induced by households' incomes (i.e.,
wages) generated by the production of the direct and indirect requirements
by construction and Goods Movement industries.23 As the employees of the
direct and indirect industries incur pay, they will spend their disposable income
on household needs within the broader economy. This spending will create
further induced effects of the output generated by the Goods Movement
industries.
8.4 Short-Term Economic Impacts (Construction)
The short-term economic impacts have been calculated based on the
estimated water/wastewater capital expenditures required to develop the PEZ
site. The development of water/wastewater construction capital costs are
described in section 5.2. All capital costs are assumed be expended in 2020.
As a result, the short-term economic impacts represent a 2020 forecast.
It has been assumed no transportation capital costs are required to provide
sufficient capacity to the PEZ. Under current assumptions, the planned
22 Statistics Canada. Provincial Input-Output Multipliers. Industry Accounts Division. 2010. 23 Ibid.
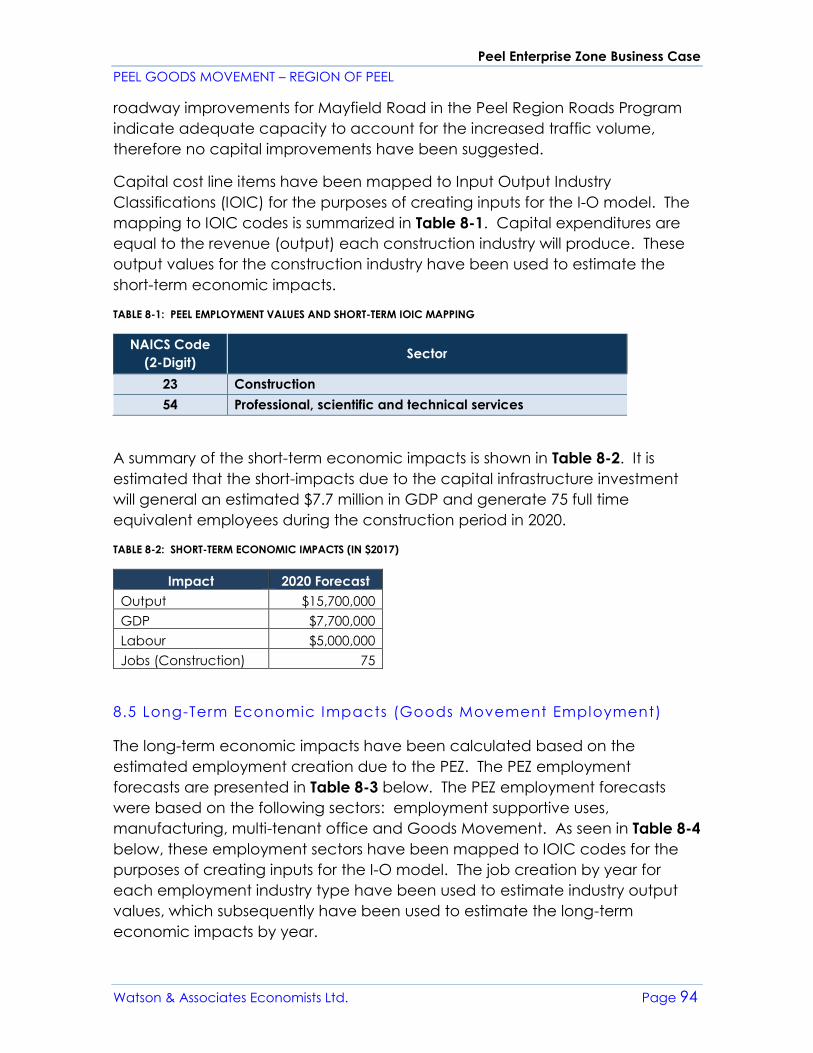
Peel Enterprise Zone Business Case
PEEL GOODS MOVEMENT – REGION OF PEEL
Watson & Associates Economists Ltd. Page 94
roadway improvements for Mayfield Road in the Peel Region Roads Program
indicate adequate capacity to account for the increased traffic volume,
therefore no capital improvements have been suggested.
Capital cost line items have been mapped to Input Output Industry
Classifications (IOIC) for the purposes of creating inputs for the I-O model. The
mapping to IOIC codes is summarized in Table 8-1. Capital expenditures are
equal to the revenue (output) each construction industry will produce. These
output values for the construction industry have been used to estimate the
short-term economic impacts.
TABLE 8-1: PEEL EMPLOYMENT VALUES AND SHORT-TERM IOIC MAPPING
NAICS Code
(2-Digit) Sector
23 Construction
54 Professional, scientific and technical services
A summary of the short-term economic impacts is shown in Table 8-2. It is
estimated that the short-impacts due to the capital infrastructure investment
will general an estimated $7.7 million in GDP and generate 75 full time
equivalent employees during the construction period in 2020.
TABLE 8-2: SHORT-TERM ECONOMIC IMPACTS (IN $2017)
Impact 2020 Forecast
Output $15,700,000
GDP $7,700,000
Labour $5,000,000
Jobs (Construction) 75
8.5 Long-Term Economic Impacts (Goods Movement Employment)
The long-term economic impacts have been calculated based on the
estimated employment creation due to the PEZ. The PEZ employment
forecasts are presented in Table 8-3 below. The PEZ employment forecasts
were based on the following sectors: employment supportive uses,
manufacturing, multi-tenant office and Goods Movement. As seen in Table 8-4
below, these employment sectors have been mapped to IOIC codes for the
purposes of creating inputs for the I-O model. The job creation by year for
each employment industry type have been used to estimate industry output
values, which subsequently have been used to estimate the long-term
economic impacts by year.
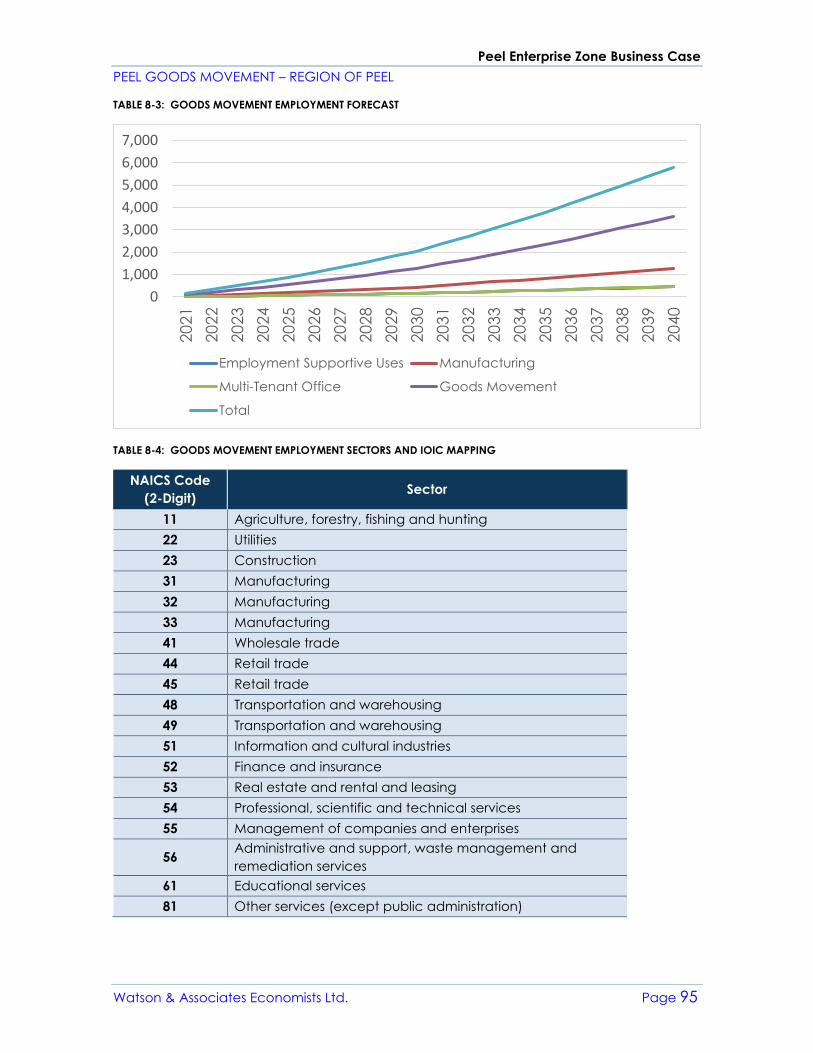
Peel Enterprise Zone Business Case
PEEL GOODS MOVEMENT – REGION OF PEEL
Watson & Associates Economists Ltd. Page 95
TABLE 8-3: GOODS MOVEMENT EMPLOYMENT FORECAST
TABLE 8-4: GOODS MOVEMENT EMPLOYMENT SECTORS AND IOIC MAPPING
NAICS Code
(2-Digit) Sector
11 Agriculture, forestry, fishing and hunting
22 Utilities
23 Construction
31 Manufacturing
32 Manufacturing
33 Manufacturing
41 Wholesale trade
44 Retail trade
45 Retail trade
48 Transportation and warehousing
49 Transportation and warehousing
51 Information and cultural industries
52 Finance and insurance
53 Real estate and rental and leasing
54 Professional, scientific and technical services
55 Management of companies and enterprises
56 Administrative and support, waste management and
remediation services
61 Educational services
81 Other services (except public administration)
0
1,000
2,000
3,000
4,000
5,000
6,000
7,000
20
21
20
22
20
23
20
24
20
25
20
26
20
27
20
28
20
29
20
30
20
31
20
32
20
33
20
34
20
35
20
36
20
37
20
38
20
39
20
40
Employment Supportive Uses Manufacturing
Multi-Tenant Office Goods Movement
Total
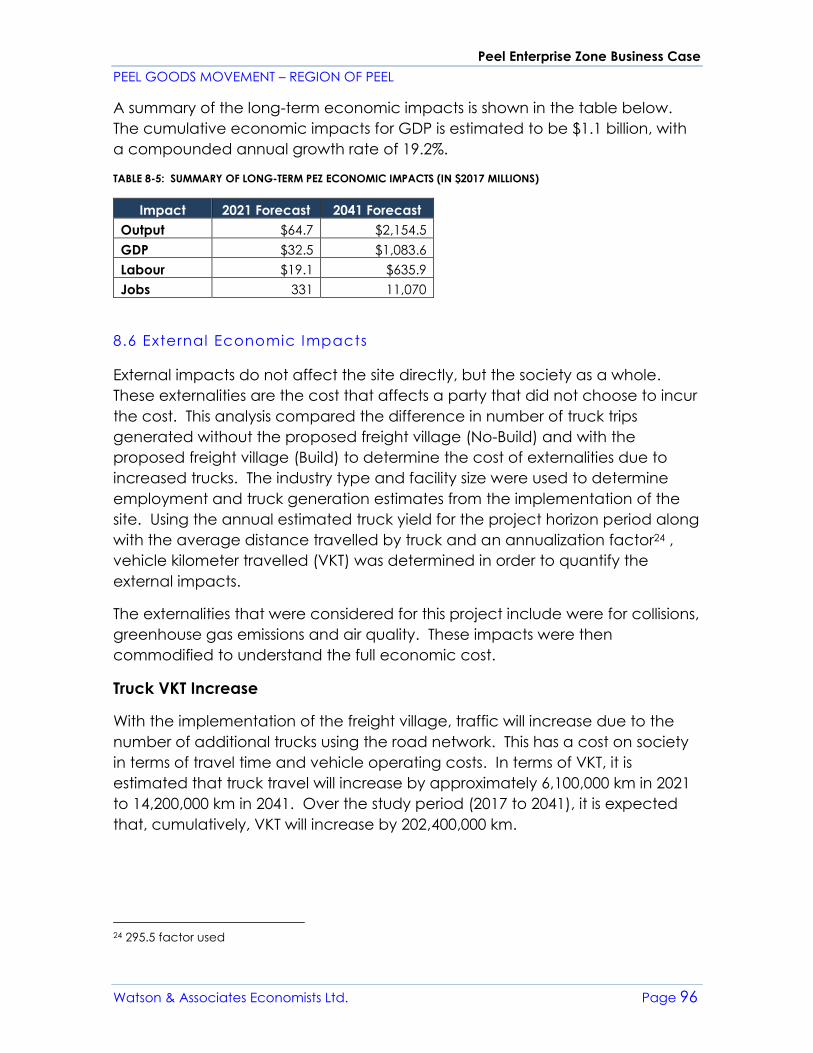
Peel Enterprise Zone Business Case
PEEL GOODS MOVEMENT – REGION OF PEEL
Watson & Associates Economists Ltd. Page 96
A summary of the long-term economic impacts is shown in the table below.
The cumulative economic impacts for GDP is estimated to be $1.1 billion, with
a compounded annual growth rate of 19.2%.
TABLE 8-5: SUMMARY OF LONG-TERM PEZ ECONOMIC IMPACTS (IN $2017 MILLIONS)
Impact 2021 Forecast 2041 Forecast
Output $64.7 $2,154.5
GDP $32.5 $1,083.6
Labour $19.1 $635.9
Jobs 331 11,070
8.6 External Economic Impacts
External impacts do not affect the site directly, but the society as a whole.
These externalities are the cost that affects a party that did not choose to incur
the cost. This analysis compared the difference in number of truck trips
generated without the proposed freight village (No-Build) and with the
proposed freight village (Build) to determine the cost of externalities due to
increased trucks. The industry type and facility size were used to determine
employment and truck generation estimates from the implementation of the
site. Using the annual estimated truck yield for the project horizon period along
with the average distance travelled by truck and an annualization factor24 ,
vehicle kilometer travelled (VKT) was determined in order to quantify the
external impacts.
The externalities that were considered for this project include were for collisions,
greenhouse gas emissions and air quality. These impacts were then
commodified to understand the full economic cost.
Truck VKT Increase
With the implementation of the freight village, traffic will increase due to the
number of additional trucks using the road network. This has a cost on society
in terms of travel time and vehicle operating costs. In terms of VKT, it is
estimated that truck travel will increase by approximately 6,100,000 km in 2021
to 14,200,000 km in 2041. Over the study period (2017 to 2041), it is expected
that, cumulatively, VKT will increase by 202,400,000 km.
24 295.5 factor used
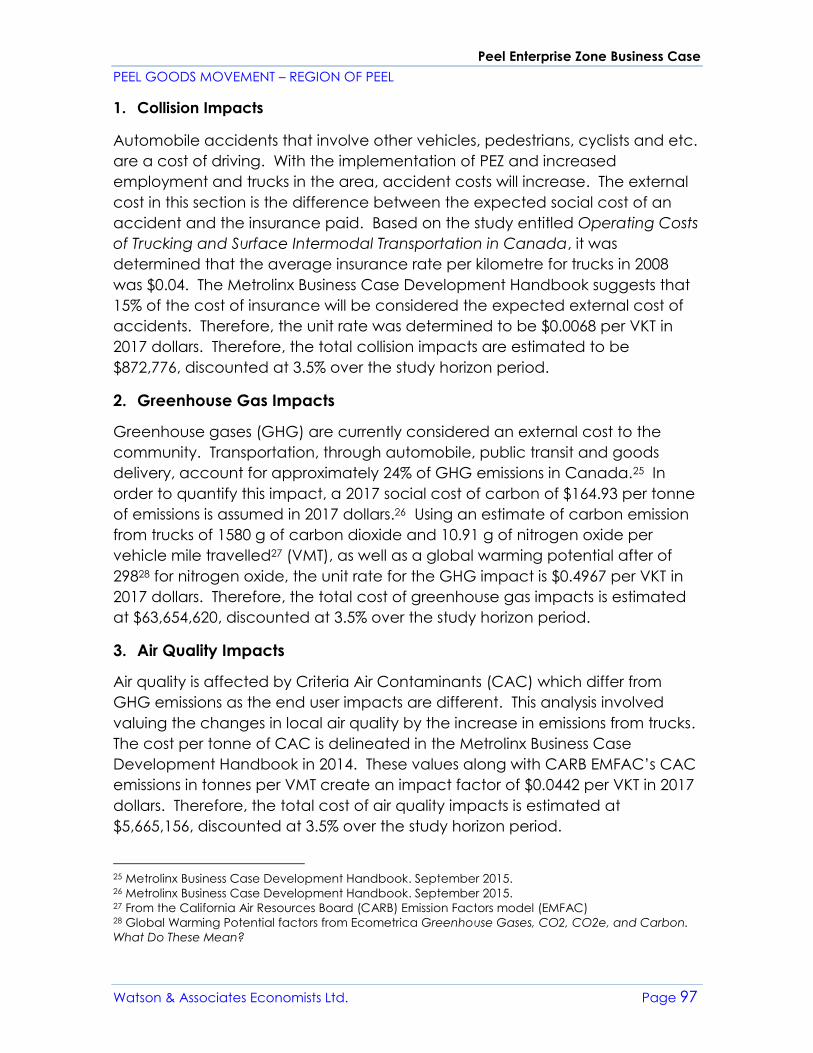
Peel Enterprise Zone Business Case
PEEL GOODS MOVEMENT – REGION OF PEEL
Watson & Associates Economists Ltd. Page 97
1. Collision Impacts
Automobile accidents that involve other vehicles, pedestrians, cyclists and etc.
are a cost of driving. With the implementation of PEZ and increased
employment and trucks in the area, accident costs will increase. The external
cost in this section is the difference between the expected social cost of an
accident and the insurance paid. Based on the study entitled Operating Costs
of Trucking and Surface Intermodal Transportation in Canada, it was
determined that the average insurance rate per kilometre for trucks in 2008
was $0.04. The Metrolinx Business Case Development Handbook suggests that
15% of the cost of insurance will be considered the expected external cost of
accidents. Therefore, the unit rate was determined to be $0.0068 per VKT in
2017 dollars. Therefore, the total collision impacts are estimated to be
$872,776, discounted at 3.5% over the study horizon period.
2. Greenhouse Gas Impacts
Greenhouse gases (GHG) are currently considered an external cost to the
community. Transportation, through automobile, public transit and goods
delivery, account for approximately 24% of GHG emissions in Canada.25 In
order to quantify this impact, a 2017 social cost of carbon of $164.93 per tonne
of emissions is assumed in 2017 dollars.26 Using an estimate of carbon emission
from trucks of 1580 g of carbon dioxide and 10.91 g of nitrogen oxide per
vehicle mile travelled27 (VMT), as well as a global warming potential after of
29828 for nitrogen oxide, the unit rate for the GHG impact is $0.4967 per VKT in
2017 dollars. Therefore, the total cost of greenhouse gas impacts is estimated
at $63,654,620, discounted at 3.5% over the study horizon period.
3. Air Quality Impacts
Air quality is affected by Criteria Air Contaminants (CAC) which differ from
GHG emissions as the end user impacts are different. This analysis involved
valuing the changes in local air quality by the increase in emissions from trucks.
The cost per tonne of CAC is delineated in the Metrolinx Business Case
Development Handbook in 2014. These values along with CARB EMFAC’s CAC
emissions in tonnes per VMT create an impact factor of $0.0442 per VKT in 2017
dollars. Therefore, the total cost of air quality impacts is estimated at
$5,665,156, discounted at 3.5% over the study horizon period.
25 Metrolinx Business Case Development Handbook. September 2015. 26 Metrolinx Business Case Development Handbook. September 2015. 27 From the California Air Resources Board (CARB) Emission Factors model (EMFAC) 28 Global Warming Potential factors from Ecometrica Greenhouse Gases, CO2, CO2e, and Carbon.
What Do These Mean?
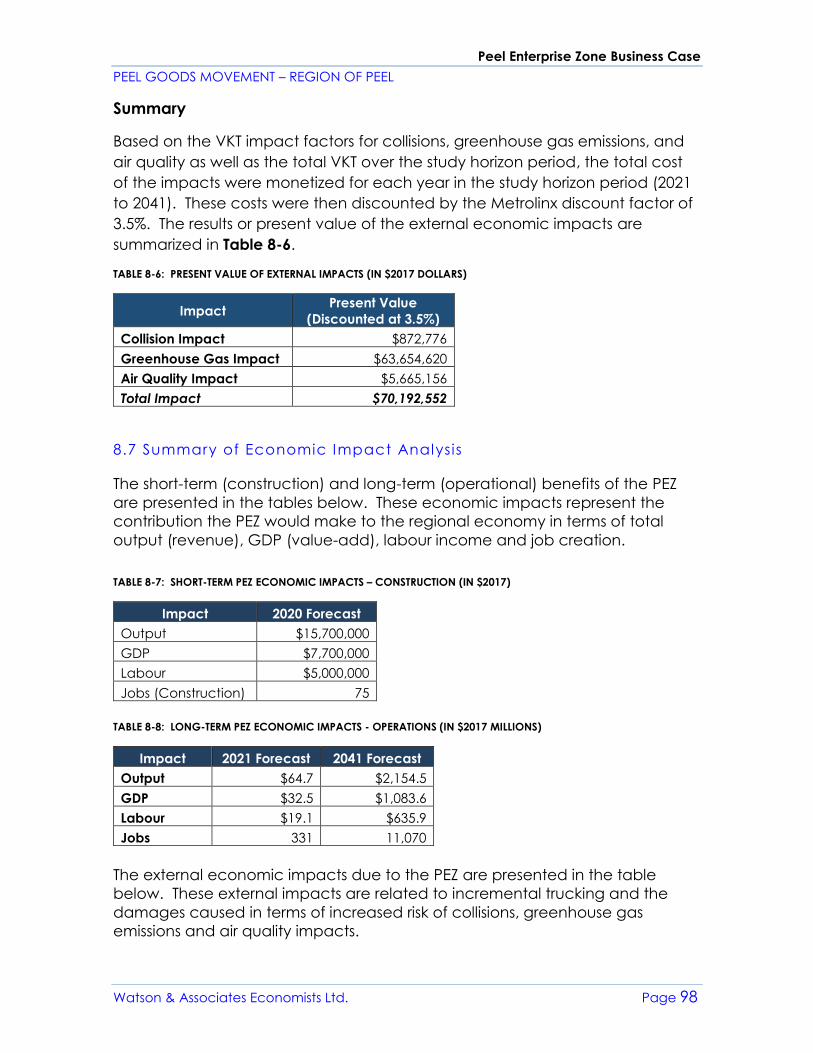
Peel Enterprise Zone Business Case
PEEL GOODS MOVEMENT – REGION OF PEEL
Watson & Associates Economists Ltd. Page 98
Summary
Based on the VKT impact factors for collisions, greenhouse gas emissions, and
air quality as well as the total VKT over the study horizon period, the total cost
of the impacts were monetized for each year in the study horizon period (2021
to 2041). These costs were then discounted by the Metrolinx discount factor of
3.5%. The results or present value of the external economic impacts are
summarized in Table 8-6.
TABLE 8-6: PRESENT VALUE OF EXTERNAL IMPACTS (IN $2017 DOLLARS)
Impact Present Value
(Discounted at 3.5%)
Collision Impact $872,776
Greenhouse Gas Impact $63,654,620
Air Quality Impact $5,665,156
Total Impact $70,192,552
8.7 Summary of Economic Impact Analysis
The short-term (construction) and long-term (operational) benefits of the PEZ
are presented in the tables below. These economic impacts represent the
contribution the PEZ would make to the regional economy in terms of total
output (revenue), GDP (value-add), labour income and job creation.
TABLE 8-7: SHORT-TERM PEZ ECONOMIC IMPACTS – CONSTRUCTION (IN $2017)
Impact 2020 Forecast
Output $15,700,000
GDP $7,700,000
Labour $5,000,000
Jobs (Construction) 75
TABLE 8-8: LONG-TERM PEZ ECONOMIC IMPACTS - OPERATIONS (IN $2017 MILLIONS)
Impact 2021 Forecast 2041 Forecast
Output $64.7 $2,154.5
GDP $32.5 $1,083.6
Labour $19.1 $635.9
Jobs 331 11,070
The external economic impacts due to the PEZ are presented in the table
below. These external impacts are related to incremental trucking and the
damages caused in terms of increased risk of collisions, greenhouse gas
emissions and air quality impacts.
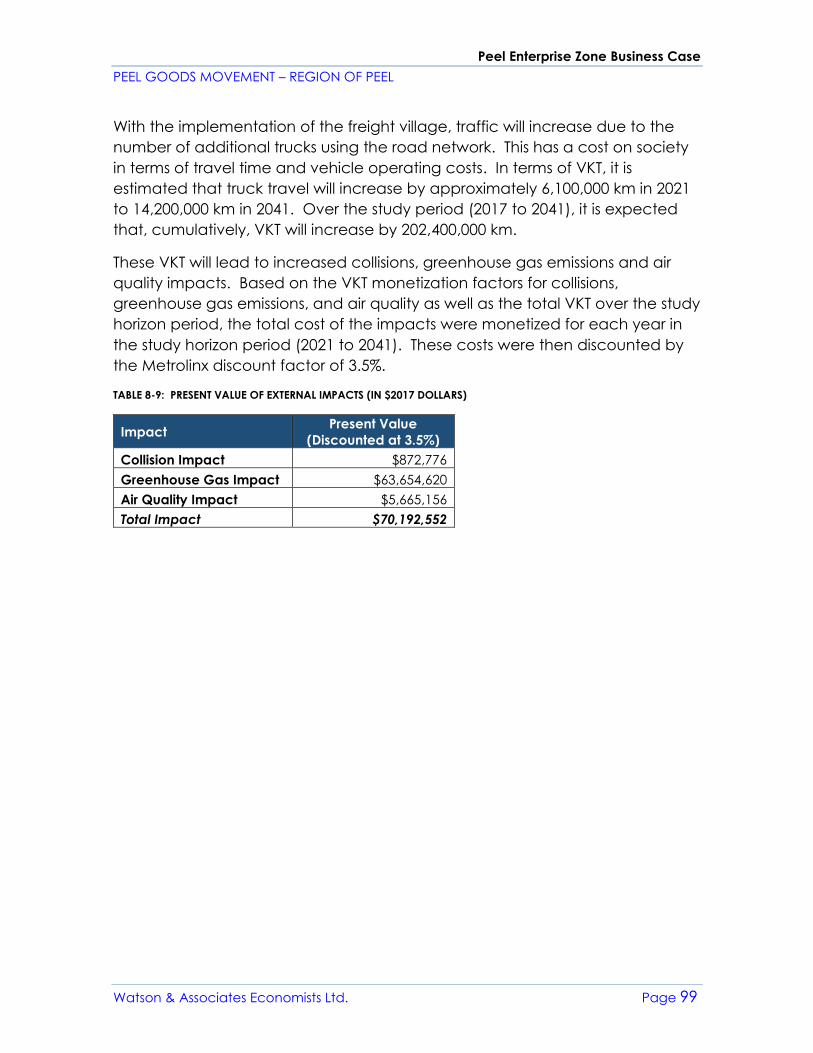
Peel Enterprise Zone Business Case
PEEL GOODS MOVEMENT – REGION OF PEEL
Watson & Associates Economists Ltd. Page 99
With the implementation of the freight village, traffic will increase due to the
number of additional trucks using the road network. This has a cost on society
in terms of travel time and vehicle operating costs. In terms of VKT, it is
estimated that truck travel will increase by approximately 6,100,000 km in 2021
to 14,200,000 km in 2041. Over the study period (2017 to 2041), it is expected
that, cumulatively, VKT will increase by 202,400,000 km.
These VKT will lead to increased collisions, greenhouse gas emissions and air
quality impacts. Based on the VKT monetization factors for collisions,
greenhouse gas emissions, and air quality as well as the total VKT over the study
horizon period, the total cost of the impacts were monetized for each year in
the study horizon period (2021 to 2041). These costs were then discounted by
the Metrolinx discount factor of 3.5%.
TABLE 8-9: PRESENT VALUE OF EXTERNAL IMPACTS (IN $2017 DOLLARS)
Impact Present Value
(Discounted at 3.5%)
Collision Impact $872,776
Greenhouse Gas Impact $63,654,620
Air Quality Impact $5,665,156
Total Impact $70,192,552
Peel Enterprise Zone Business Case
PEEL GOODS MOVEMENT – REGION OF PEEL
Watson & Associates Economists Ltd. Page 100
9. CONCLUSION
Continuing the efforts of previous studies on freight villages, the Region of Peel
is exploring the feasibility of a Peel Enterprise Zone (PEZ) in the Region as a
strategy to address issues related to Goods Movement land use and
employment density. This business case report looks exclusively at the feasibility
of a PEZ in the Region of Peel.
The study undertakes a feasibility analysis through planning, economic and
fiscal factors. For the purposes of this type of study, a specific site was selected
for which to measure these factors. The conclusion of the study is to
understand the feasibility of a PEZ for the selected site and for sites that share
similar features.
The Goods Movement sector forms an integral part of the Region of Peel’s
economic development and employment growth potential. The Region of
Peel comprises a high concentration of Goods Movement related industries
which contribute significantly to the local, provincial and national economies.
Based on a detailed site selection analysis, a preferred site has been identified
in the Town of Caledon to conceptually establish the feasibility of developing a
PEZ within Peel Region. The subject site is bound by Airport Road to the west,
Innis Lake Road to the east, Healey Road to the north and Mayfield Road to
the south, as shown in the figure below.29 The total gross development land
area, excluding environmental features, is 315 hectares.
29 Geographic delineation of the preferred site is conceptual and may be subject to change.
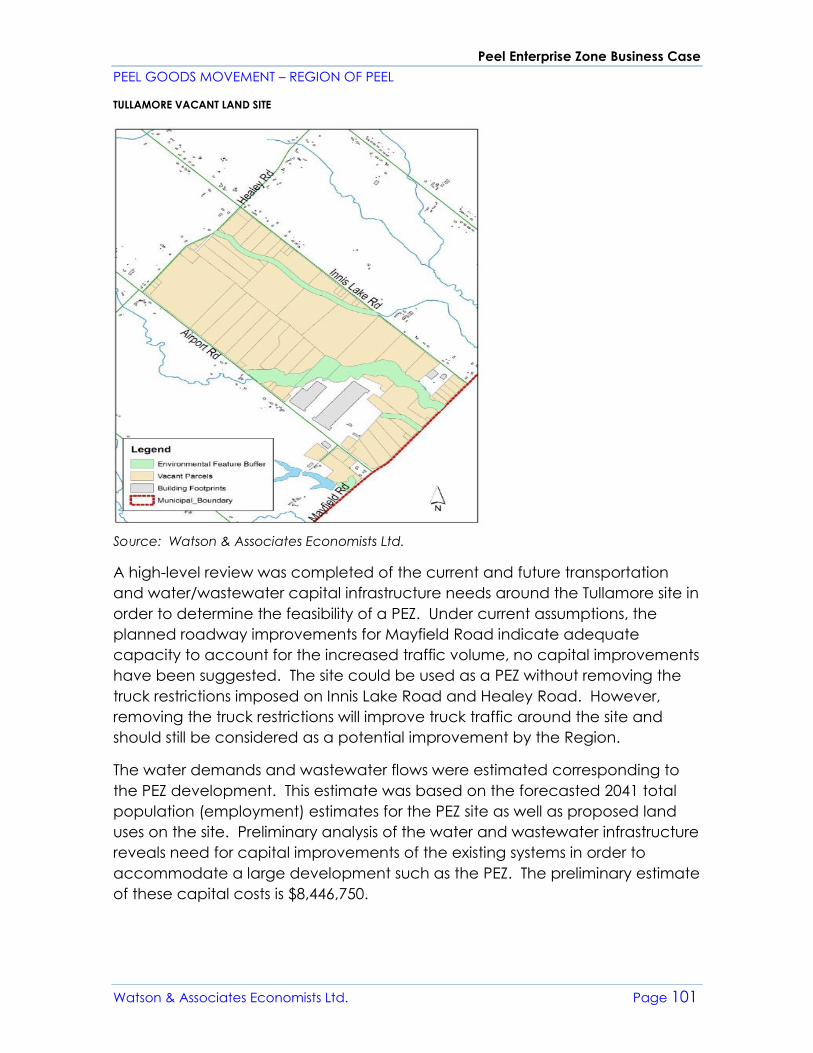
Peel Enterprise Zone Business Case
PEEL GOODS MOVEMENT – REGION OF PEEL
Watson & Associates Economists Ltd. Page 101
TULLAMORE VACANT LAND SITE
Source: Watson & Associates Economists Ltd.
A high-level review was completed of the current and future transportation
and water/wastewater capital infrastructure needs around the Tullamore site in
order to determine the feasibility of a PEZ. Under current assumptions, the
planned roadway improvements for Mayfield Road indicate adequate
capacity to account for the increased traffic volume, no capital improvements
have been suggested. The site could be used as a PEZ without removing the
truck restrictions imposed on Innis Lake Road and Healey Road. However,
removing the truck restrictions will improve truck traffic around the site and
should still be considered as a potential improvement by the Region.
The water demands and wastewater flows were estimated corresponding to
the PEZ development. This estimate was based on the forecasted 2041 total
population (employment) estimates for the PEZ site as well as proposed land
uses on the site. Preliminary analysis of the water and wastewater infrastructure
reveals need for capital improvements of the existing systems in order to
accommodate a large development such as the PEZ. The preliminary estimate
of these capital costs is $8,446,750.
Peel Enterprise Zone Business Case
PEEL GOODS MOVEMENT – REGION OF PEEL
Watson & Associates Economists Ltd. Page 102
The development of and operations within a PEZ would create opportunities for
increased economic activity in the form of jobs, GDP and economic output.
This economic activity will be generated from both the construction of the
necessary infrastructure needed for the facility and through the business
operations occurring on the site.
The short-term economic impacts have been calculated based on the
estimated water/wastewater capital expenditures required to develop the PEZ
site. It is estimated that the short-impacts due to the capital infrastructure
investment will general an estimated $7.7 million in GDP and generate 75 full
time equivalent employees during the construction period in 2020.
The long-term economic impacts have been calculated based on the
estimated employment creation due to the PEZ. The PEZ employment
forecasts were based on the following sectors: employment supportive uses,
manufacturing, multi-tenant office and Goods Movement. The cumulative
economic impacts for GDP is estimated to be $1.1 billion, with the creation of
upwards of 11,000 full time equivalent jobs by 2041.
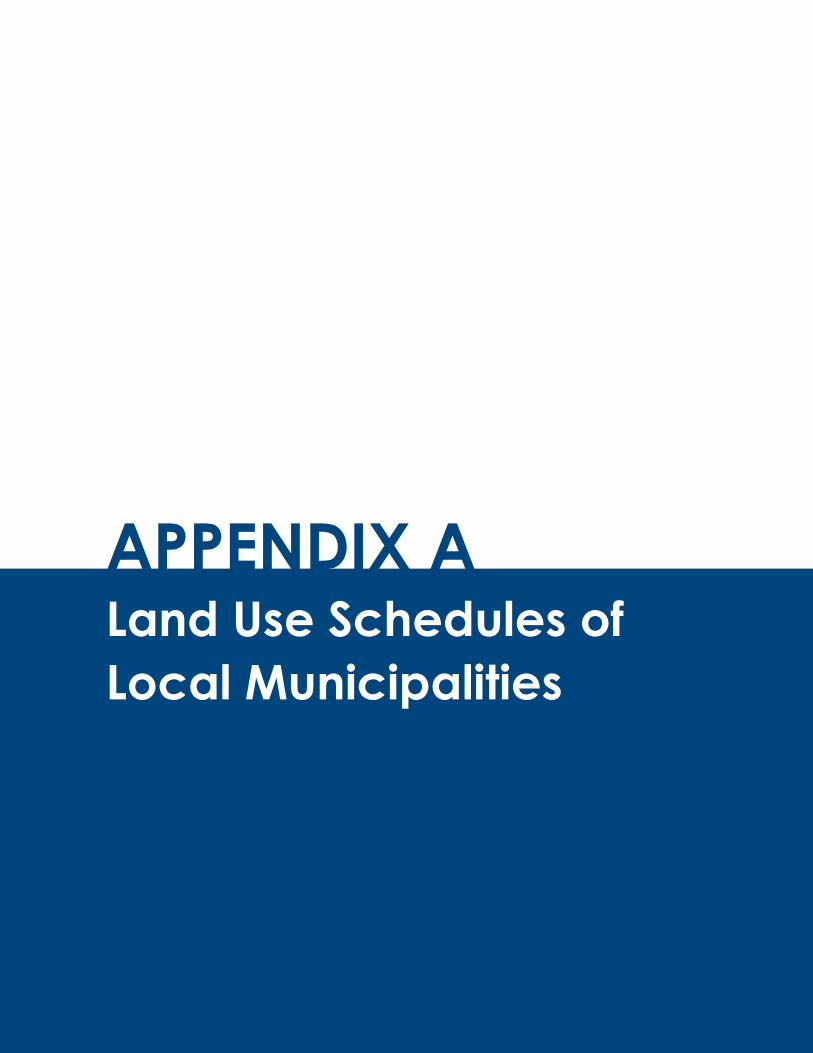
APPENDIX A Land Use Schedules of
Local Municipalities

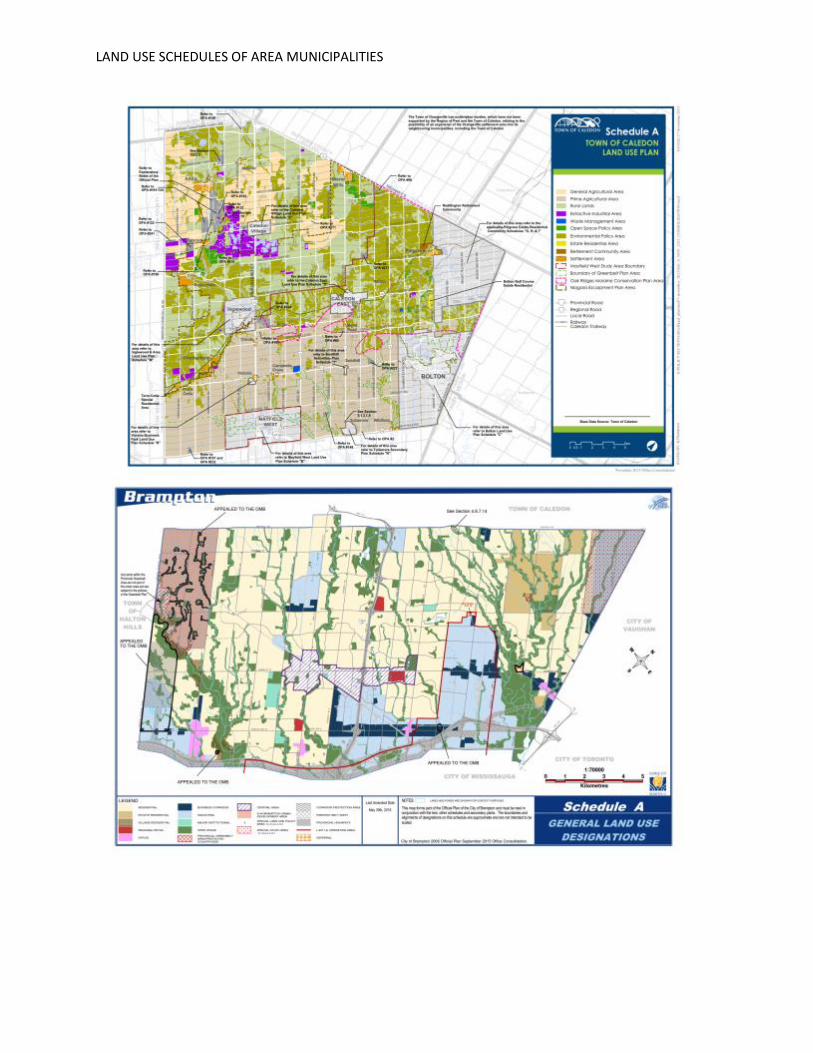
LAND USE SCHEDULES OF AREA MUNICIPALITIES
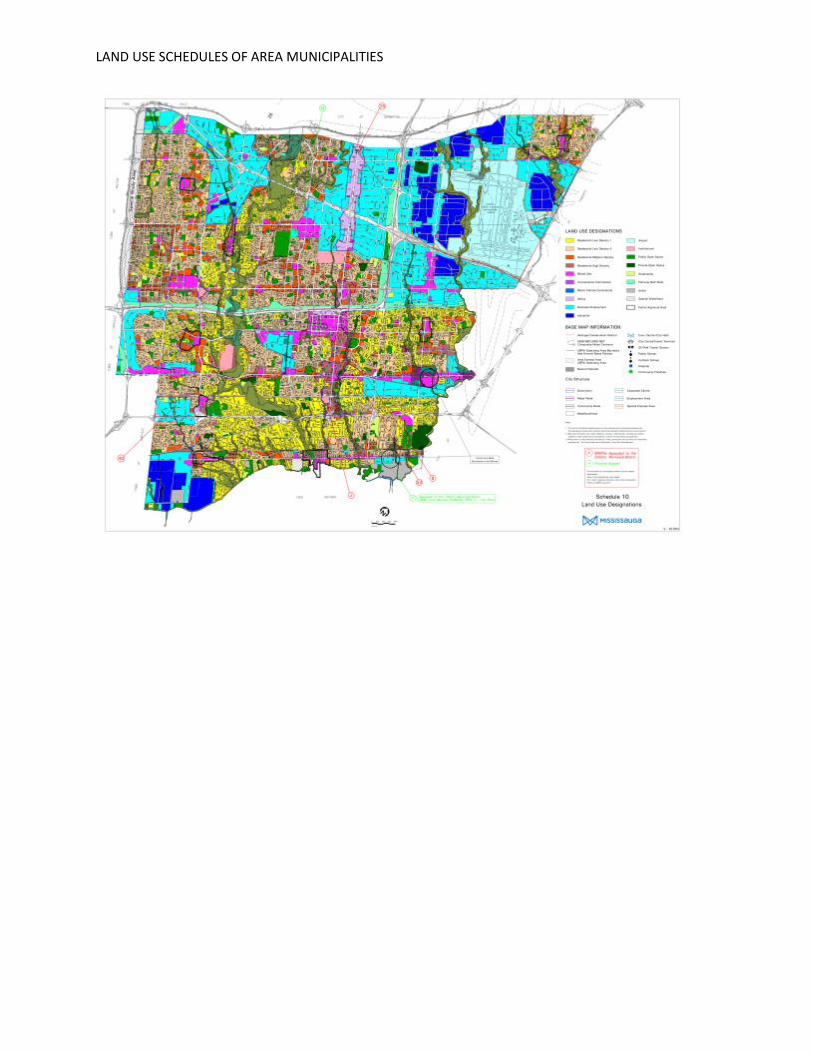
LAND USE SCHEDULES OF AREA MUNICIPALITIES

APPENDIX B Stakeholder Workshop
Discussion Guide

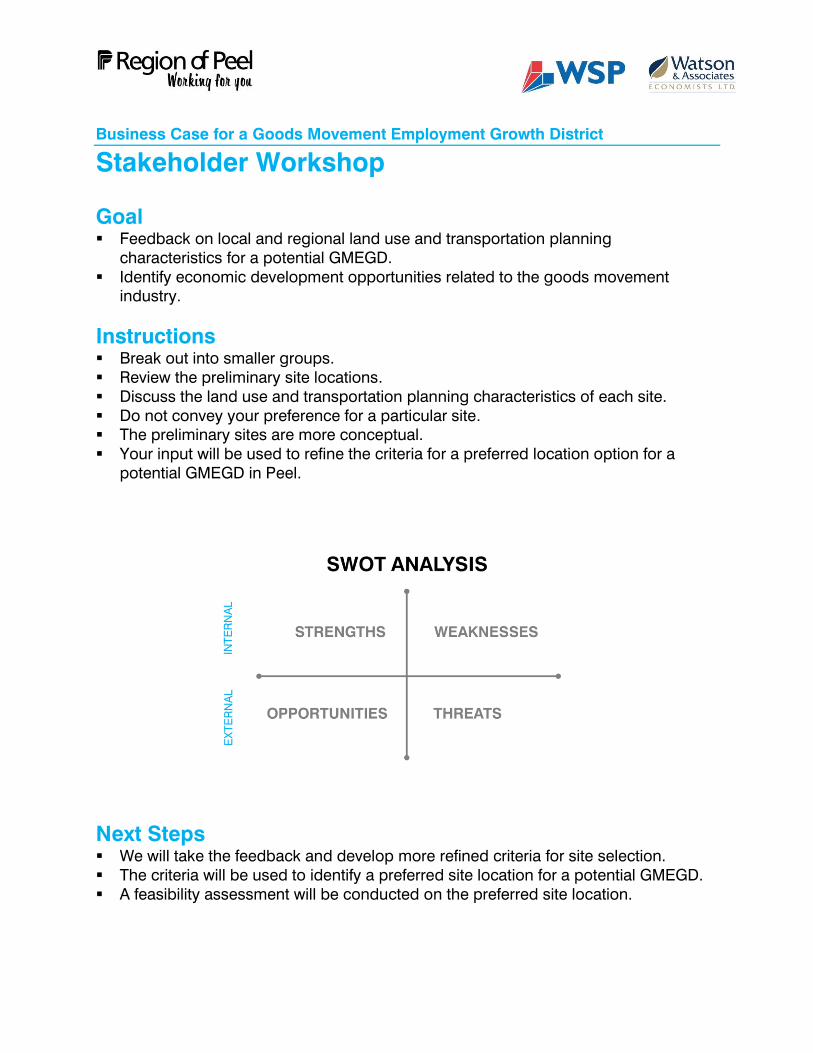
Business Case for a Goods Movement Employment Growth District
Stakeholder Workshop
Goal
Feedback on local and regional land use and transportation planning
characteristics for a potential GMEGD.
Identify economic development opportunities related to the goods movement
industry.
Instructions
Break out into smaller groups.
Review the preliminary site locations.
Discuss the land use and transportation planning characteristics of each site.
Do not convey your preference for a particular site.
The preliminary sites are more conceptual.
Your input will be used to refine the criteria for a preferred location option for a
potential GMEGD in Peel.
Next Steps
We will take the feedback and develop more refined criteria for site selection.
The criteria will be used to identify a preferred site location for a potential GMEGD.
A feasibility assessment will be conducted on the preferred site location.

Discussion Topics
What could be the advantages/benefits of GMEGD from a business and community
perspective?
What could be some disadvantage of a GMEGD from a business and community
perspective?
How could these disadvantages be mitigated?
What are some of the land use and site considerations that would be important for a
GMEGD? (i.e. location, size, characteristics, accessibility, infrastructure needs,
adjacent land uses)
What management models are appealing?
Is there a role for government and what would its involvement entail?
What government policy and support may be needed?

APPENDIX C Site Evaluation Scoring

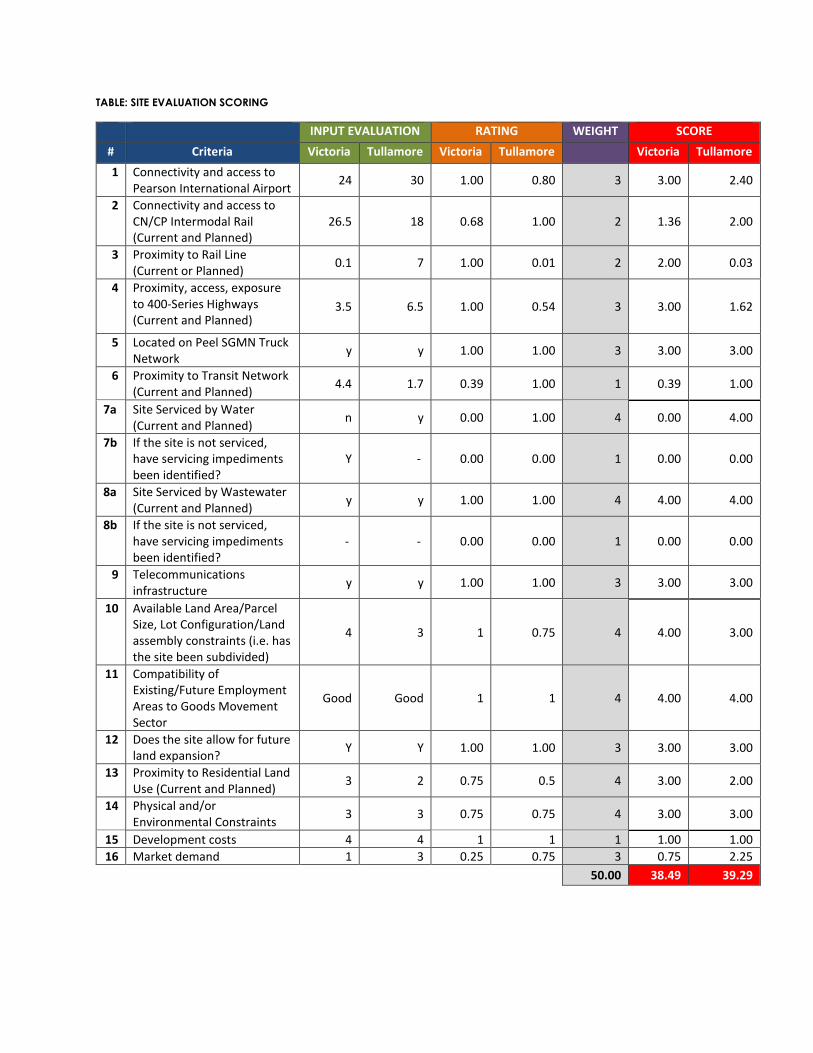
TABLE: SITE EVALUATION SCORING
INPUT EVALUATION RATING WEIGHT SCORE
# Criteria Victoria Tullamore Victoria Tullamore Victoria Tullamore
1 Connectivity and access to Pearson International Airport
24 30 1.00 0.80 3 3.00 2.40
2 Connectivity and access to CN/CP Intermodal Rail (Current and Planned)
26.5 18 0.68 1.00 2 1.36 2.00
3 Proximity to Rail Line (Current or Planned)
0.1 7 1.00 0.01 2 2.00 0.03
4 Proximity, access, exposure to 400-Series Highways (Current and Planned)
3.5 6.5 1.00 0.54 3 3.00 1.62
5 Located on Peel SGMN Truck Network
y y 1.00 1.00 3 3.00 3.00
6 Proximity to Transit Network (Current and Planned)
4.4 1.7 0.39 1.00 1 0.39 1.00
7a Site Serviced by Water (Current and Planned)
n y 0.00 1.00 4 0.00 4.00
7b If the site is not serviced, have servicing impediments been identified?
Y - 0.00 0.00 1 0.00 0.00
8a Site Serviced by Wastewater (Current and Planned)
y y 1.00 1.00 4 4.00 4.00
8b If the site is not serviced, have servicing impediments been identified?
- - 0.00 0.00 1 0.00 0.00
9 Telecommunications infrastructure
y y 1.00 1.00 3 3.00 3.00
10 Available Land Area/Parcel Size, Lot Configuration/Land assembly constraints (i.e. has the site been subdivided)
4 3 1 0.75 4 4.00 3.00
11 Compatibility of Existing/Future Employment Areas to Goods Movement Sector
Good Good 1 1 4 4.00 4.00
12 Does the site allow for future land expansion?
Y Y 1.00 1.00 3 3.00 3.00
13 Proximity to Residential Land Use (Current and Planned)
3 2 0.75 0.5 4 3.00 2.00
14 Physical and/or Environmental Constraints
3 3 0.75 0.75 4 3.00 3.00
15 Development costs 4 4 1 1 1 1.00 1.00
16 Market demand 1 3 0.25 0.75 3 0.75 2.25
50.00 38.49 39.29


APPENDIX D Road Network Maps

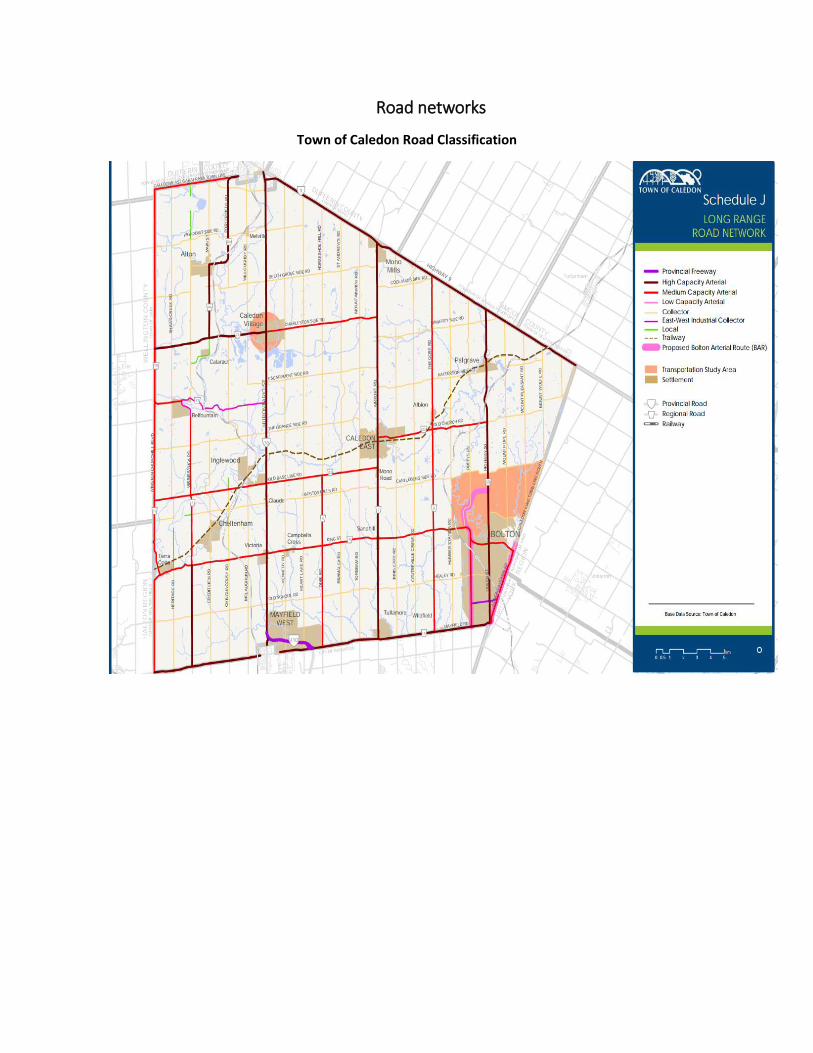
Road networks
Town of Caledon Road Classification
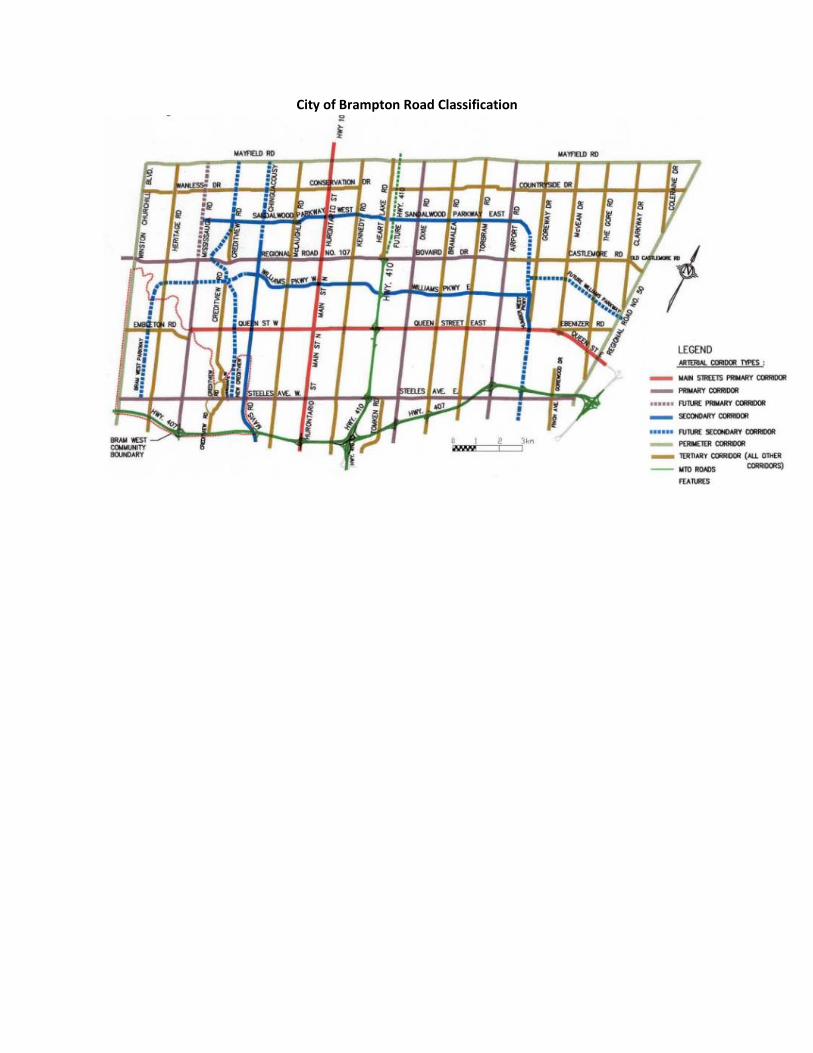
City of Brampton Road Classification

APPENDIX E Trip Generation Forecast

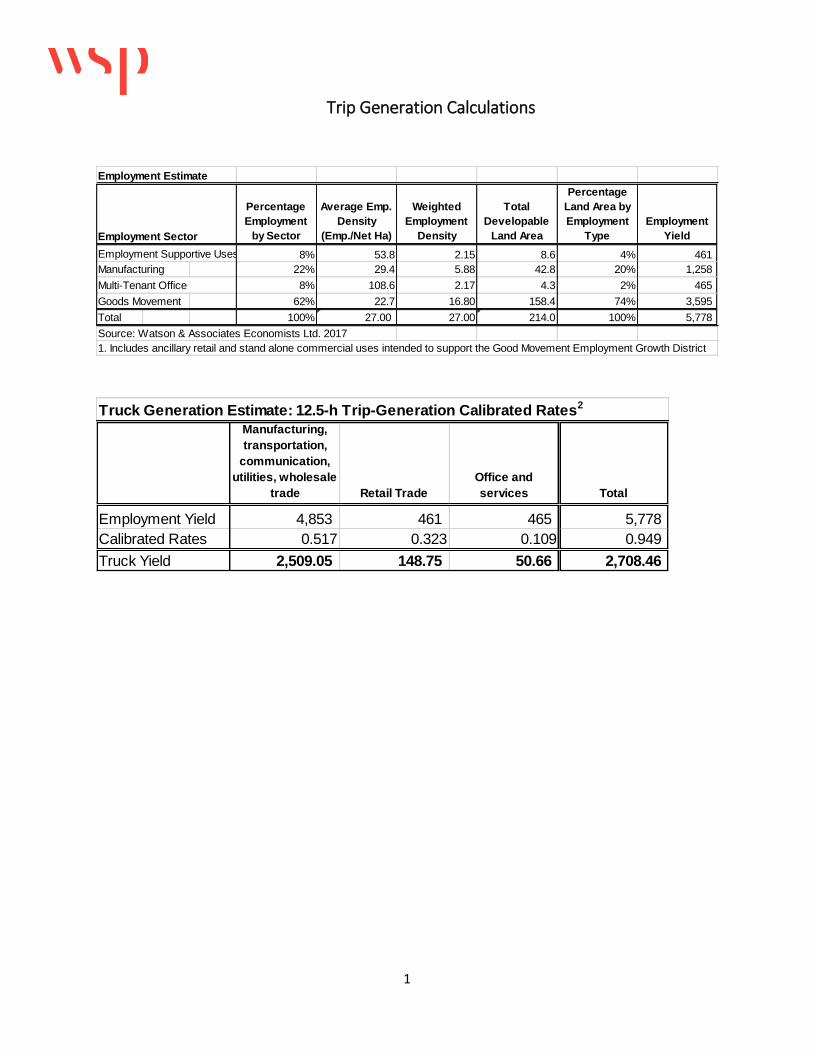
1
Trip Generation Calculations
Employment Estimate
Employment Sector
Percentage
Employment
by Sector
Average Emp.
Density
(Emp./Net Ha)
Weighted
Employment
Density
Total
Developable
Land Area
Percentage
Land Area by
Employment
Type
Employment
Yield
Employment Supportive Uses 1 8% 53.8 2.15 8.6 4% 461
Manufacturing 22% 29.4 5.88 42.8 20% 1,258
Multi-Tenant Office 8% 108.6 2.17 4.3 2% 465
Goods Movement 62% 22.7 16.80 158.4 74% 3,595
Total 100% 27.00 27.00 214.0 100% 5,778
Source: Watson & Associates Economists Ltd. 2017
1. Includes ancillary retail and stand alone commercial uses intended to support the Good Movement Employment Growth District
Truck Generation Estimate: 12.5-h Trip-Generation Calibrated Rates2
Manufacturing,
transportation,
communication,
utilities, wholesale
trade Retail Trade
Office and
services Total
Employment Yield 4,853 461 465 5,778
Calibrated Rates 0.517 0.323 0.109 0.949
Truck Yield 2,509.05 148.75 50.66 2,708.46


APPENDIX F Supplementary Fiscal
Impact Analysis

Peel Enterprise Zone Business Case
PEEL GOODS MOVEMENT – REGION OF PEEL
Watson & Associates Economists Ltd. Page 1
APPENDIX F – SUPPLEMENTARY FISCAL IMPACT ANALYSIS
This Appendix provides additional detailed tables which assess the potential impact
of the proposed G.M.E.G.D. to the Region at full buildout of anticipated non-
residential development for this area. This is done by examining the revenue and
expenditure implications separately, and then together with reference to the net
operating position. Further, a lifecycle cost analysis is provided for the works
required, for both direct and indirect (external works) lifecycle costs.
Operating Expenditure Implications
Table F-1 summarizes the Region’s “Revenue Fund” or “Operating Fund”
transactions for 2016 (based on the Region’s Financial Information Return (F.I.R.)).
This represents a simple “model” of the Region’s financial position for the operating
fund and provides the structure of the financial impact analysis.
Table F-2 modifies the operating expenditures shown in Table F-1 by netting “Interest
on Long Term Debt,” “External Transfers,” and “Amortization” from the total. The
debt charges are for “sunk” investments, unaffected by growth. The external
transfers can vary significantly from year to year and relate largely to capital
expenditures and general reserves, which are addressed separately in this analysis.
Further, amortization is an accounting allocation which seeks to capture annual
replacement costs. As this is based on historic costs, a separate analysis on lifecycle
expenditures (based on future replacement cost) is conducted later in this
appendix. It is therefore appropriate to remove these three classes of expenditures
from the spending base, before determining incremental loss and/or average
operating fund spending levels per capita and employee.
Table F-3 allocates the Region’s existing operating expenditure components
between the needs of residential development and non-residential development
(i.e. industrial, commercial and institutional), based on differences in the amount of
such development and the need for particular types of services in each case. The
expenditure allocation is then presented on a per household/per employee basis.
Table F-4 assesses each of the Region’s key service components in relation to the
proposed development, to determine how the operating costs are likely to be
impacted, based on the characteristics and location of the subject development.
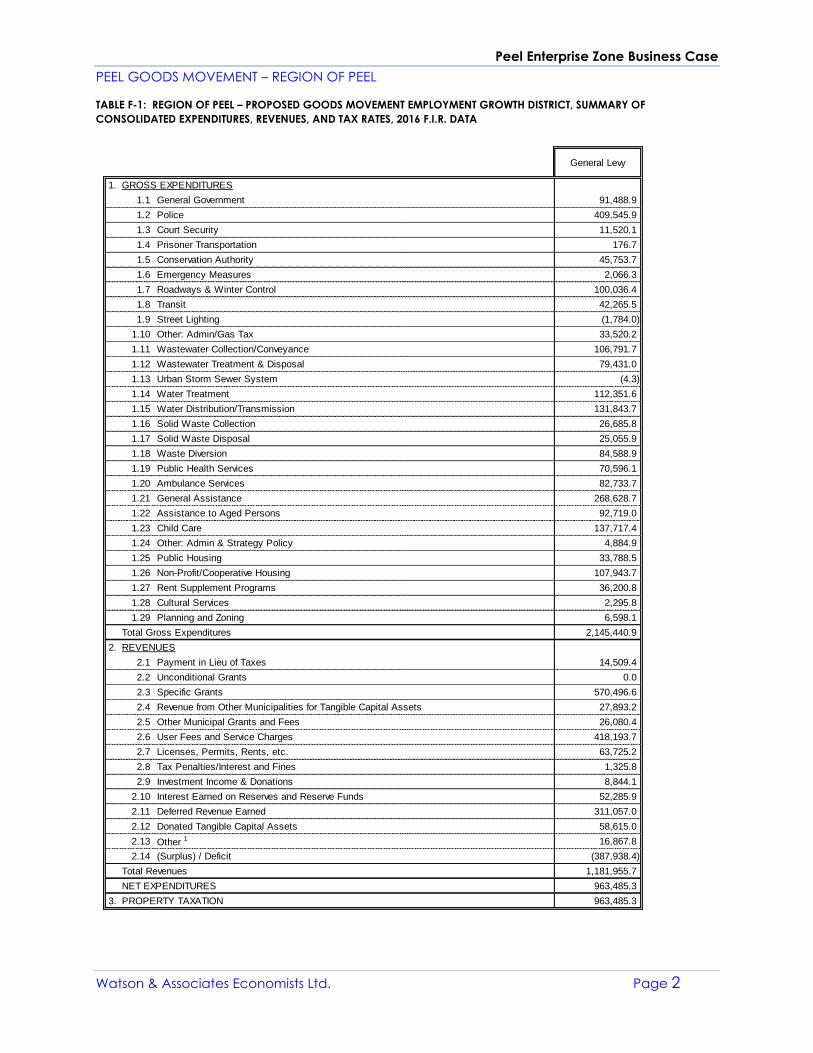
Peel Enterprise Zone Business Case
PEEL GOODS MOVEMENT – REGION OF PEEL
Watson & Associates Economists Ltd. Page 2
TABLE F-1: REGION OF PEEL – PROPOSED GOODS MOVEMENT EMPLOYMENT GROWTH DISTRICT, SUMMARY OF
CONSOLIDATED EXPENDITURES, REVENUES, AND TAX RATES, 2016 F.I.R. DATA
1. GROSS EXPENDITURES
1.1 General Government 91,488.9
1.2 Police 409,545.9
1.3 Court Security 11,520.1
1.4 Prisoner Transportation 176.7
1.5 Conservation Authority 45,753.7
1.6 Emergency Measures 2,066.3
1.7 Roadways & Winter Control 100,036.4
1.8 Transit 42,265.5
1.9 Street Lighting (1,784.0)
1.10 Other: Admin/Gas Tax 33,520.2
1.11 Wastewater Collection/Conveyance 106,791.7
1.12 Wastewater Treatment & Disposal 79,431.0
1.13 Urban Storm Sewer System (4.3)
1.14 Water Treatment 112,351.6
1.15 Water Distribution/Transmission 131,843.7
1.16 Solid Waste Collection 26,685.8
1.17 Solid Waste Disposal 25,055.9
1.18 Waste Diversion 84,588.9
1.19 Public Health Services 70,596.1
1.20 Ambulance Services 82,733.7
1.21 General Assistance 268,628.7
1.22 Assistance to Aged Persons 92,719.0
1.23 Child Care 137,717.4
1.24 Other: Admin & Strategy Policy 4,884.9
1.25 Public Housing 33,788.5
1.26 Non-Profit/Cooperative Housing 107,943.7
1.27 Rent Supplement Programs 36,200.8
1.28 Cultural Services 2,295.8
1.29 Planning and Zoning 6,598.1
Total Gross Expenditures 2,145,440.9
2. REVENUES
2.1 Payment in Lieu of Taxes 14,509.4
2.2 Unconditional Grants 0.0
2.3 Specific Grants 570,496.6
2.4 Revenue from Other Municipalities for Tangible Capital Assets 27,893.2
2.5 Other Municipal Grants and Fees 26,080.4
2.6 User Fees and Service Charges 418,193.7
2.7 Licenses, Permits, Rents, etc. 63,725.2
2.8 Tax Penalties/Interest and Fines 1,325.8
2.9 Investment Income & Donations 8,844.1
2.10 Interest Earned on Reserves and Reserve Funds 52,285.9
2.11 Deferred Revenue Earned 311,057.0
2.12 Donated Tangible Capital Assets 58,615.0
2.13 Other 1 16,867.8
2.14 (Surplus) / Deficit (387,938.4)
Total Revenues 1,181,955.7
963,485.3
3. 963,485.3
General Levy
NET EXPENDITURES
PROPERTY TAXATION
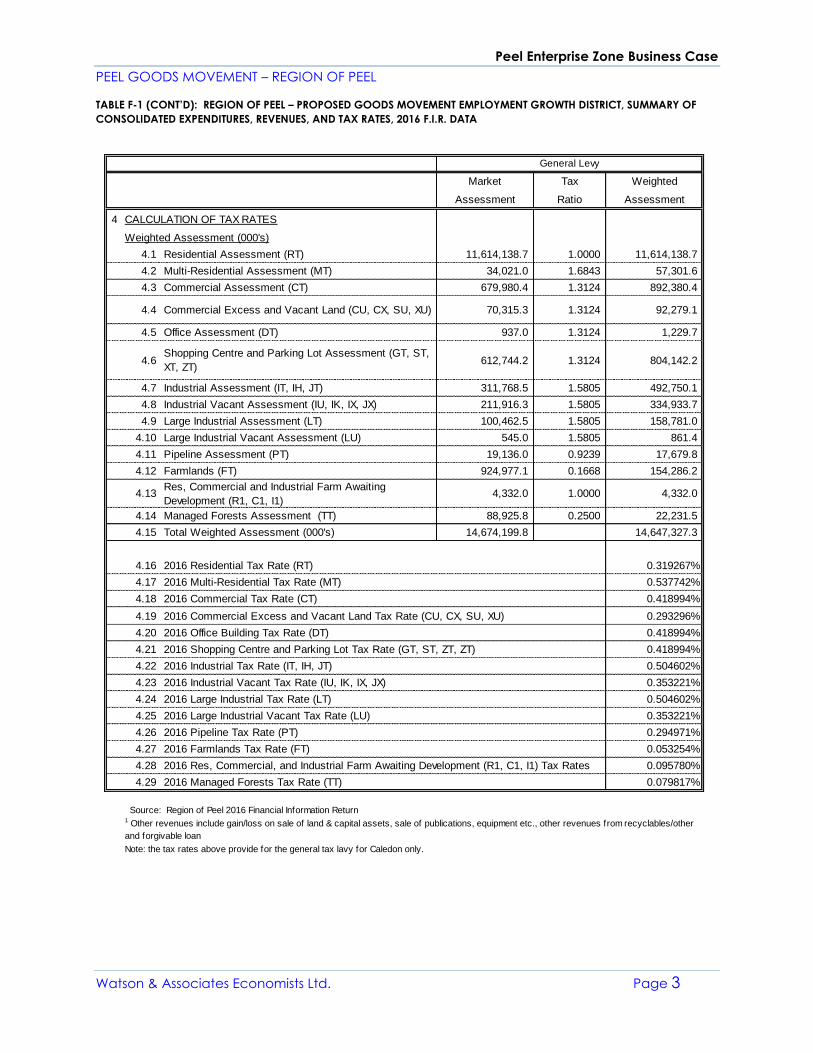
Peel Enterprise Zone Business Case
PEEL GOODS MOVEMENT – REGION OF PEEL
Watson & Associates Economists Ltd. Page 3
TABLE F-1 (CONT’D): REGION OF PEEL – PROPOSED GOODS MOVEMENT EMPLOYMENT GROWTH DISTRICT, SUMMARY OF
CONSOLIDATED EXPENDITURES, REVENUES, AND TAX RATES, 2016 F.I.R. DATA
Market Tax Weighted
Assessment Ratio Assessment
4 CALCULATION OF TAX RATES
Weighted Assessment (000's)
4.1 Residential Assessment (RT) 11,614,138.7 1.0000 11,614,138.7
4.2 Multi-Residential Assessment (MT) 34,021.0 1.6843 57,301.6
4.3 Commercial Assessment (CT) 679,980.4 1.3124 892,380.4
4.4 Commercial Excess and Vacant Land (CU, CX, SU, XU) 70,315.3 1.3124 92,279.1
4.5 Office Assessment (DT) 937.0 1.3124 1,229.7
4.6Shopping Centre and Parking Lot Assessment (GT, ST,
XT, ZT)612,744.2 1.3124 804,142.2
4.7 Industrial Assessment (IT, IH, JT) 311,768.5 1.5805 492,750.1
4.8 Industrial Vacant Assessment (IU, IK, IX, JX) 211,916.3 1.5805 334,933.7
4.9 Large Industrial Assessment (LT) 100,462.5 1.5805 158,781.0
4.10 Large Industrial Vacant Assessment (LU) 545.0 1.5805 861.4
4.11 Pipeline Assessment (PT) 19,136.0 0.9239 17,679.8
4.12 Farmlands (FT) 924,977.1 0.1668 154,286.2
4.13Res, Commercial and Industrial Farm Awaiting
Development (R1, C1, I1)4,332.0 1.0000 4,332.0
4.14 Managed Forests Assessment (TT) 88,925.8 0.2500 22,231.5
4.15 Total Weighted Assessment (000's) 14,674,199.8 14,647,327.3
4.16 2016 Residential Tax Rate (RT) 0.319267%
4.17 2016 Multi-Residential Tax Rate (MT) 0.537742%
4.18 2016 Commercial Tax Rate (CT) 0.418994%
4.19 2016 Commercial Excess and Vacant Land Tax Rate (CU, CX, SU, XU) 0.293296%
4.20 2016 Office Building Tax Rate (DT) 0.418994%
4.21 2016 Shopping Centre and Parking Lot Tax Rate (GT, ST, ZT, ZT) 0.418994%
4.22 2016 Industrial Tax Rate (IT, IH, JT) 0.504602%
4.23 2016 Industrial Vacant Tax Rate (IU, IK, IX, JX) 0.353221%
4.24 2016 Large Industrial Tax Rate (LT) 0.504602%
4.25 2016 Large Industrial Vacant Tax Rate (LU) 0.353221%
4.26 2016 Pipeline Tax Rate (PT) 0.294971%
4.27 2016 Farmlands Tax Rate (FT) 0.053254%
4.28 2016 Res, Commercial, and Industrial Farm Awaiting Development (R1, C1, I1) Tax Rates 0.095780%
4.29 2016 Managed Forests Tax Rate (TT) 0.079817%
Source: Region of Peel 2016 Financial Information Return
Note: the tax rates above provide for the general tax lavy for Caledon only.
1 Other revenues include gain/loss on sale of land & capital assets, sale of publications, equipment etc., other revenues from recyclables/other
and forgivable loan
General Levy
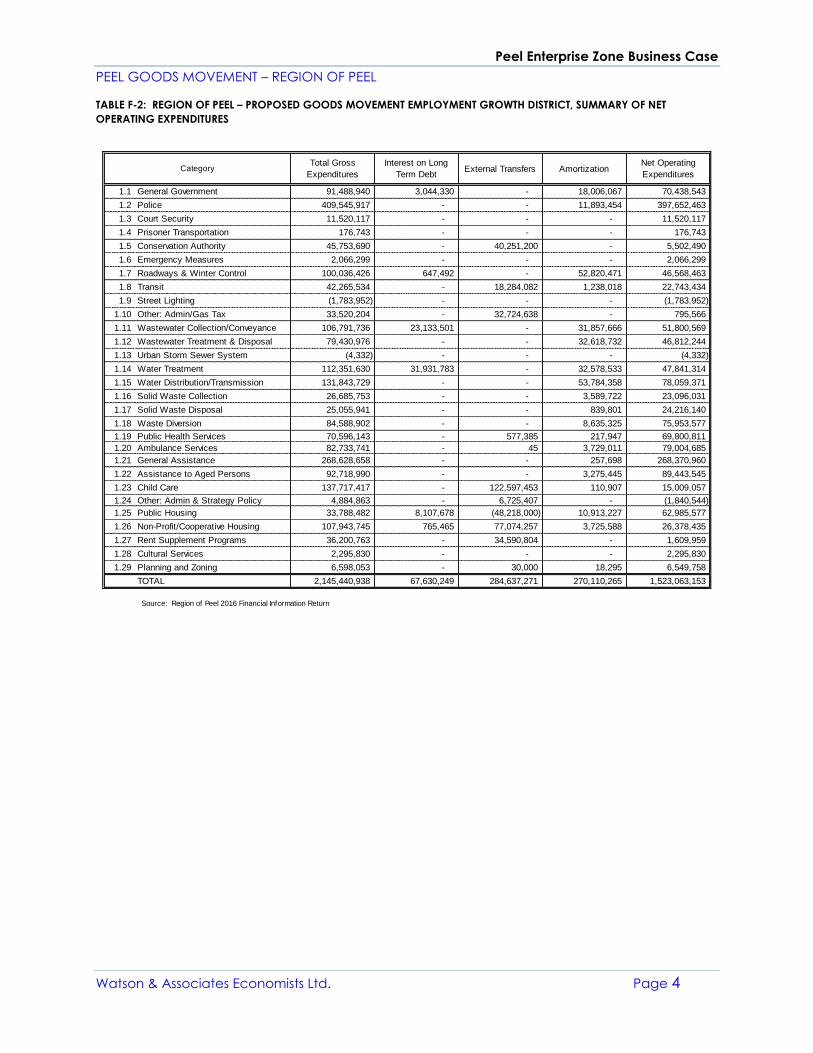
Peel Enterprise Zone Business Case
PEEL GOODS MOVEMENT – REGION OF PEEL
Watson & Associates Economists Ltd. Page 4
TABLE F-2: REGION OF PEEL – PROPOSED GOODS MOVEMENT EMPLOYMENT GROWTH DISTRICT, SUMMARY OF NET
OPERATING EXPENDITURES
Total Gross
Expenditures
Interest on Long
Term DebtExternal Transfers Amortization
Net Operating
Expenditures
1.1 General Government 91,488,940 3,044,330 - 18,006,067 70,438,543
1.2 Police 409,545,917 - - 11,893,454 397,652,463
1.3 Court Security 11,520,117 - - - 11,520,117
1.4 Prisoner Transportation 176,743 - - - 176,743
1.5 Conservation Authority 45,753,690 - 40,251,200 - 5,502,490
1.6 Emergency Measures 2,066,299 - - - 2,066,299
1.7 Roadways & Winter Control 100,036,426 647,492 - 52,820,471 46,568,463
1.8 Transit 42,265,534 - 18,284,082 1,238,018 22,743,434
1.9 Street Lighting (1,783,952) - - - (1,783,952)
1.10 Other: Admin/Gas Tax 33,520,204 - 32,724,638 - 795,566
1.11 Wastewater Collection/Conveyance 106,791,736 23,133,501 - 31,857,666 51,800,569
1.12 Wastewater Treatment & Disposal 79,430,976 - - 32,618,732 46,812,244
1.13 Urban Storm Sewer System (4,332) - - - (4,332)
1.14 Water Treatment 112,351,630 31,931,783 - 32,578,533 47,841,314
1.15 Water Distribution/Transmission 131,843,729 - - 53,784,358 78,059,371
1.16 Solid Waste Collection 26,685,753 - - 3,589,722 23,096,031
1.17 Solid Waste Disposal 25,055,941 - - 839,801 24,216,140
1.18 Waste Diversion 84,588,902 - - 8,635,325 75,953,577
1.19 Public Health Services 70,596,143 - 577,385 217,947 69,800,811
1.20 Ambulance Services 82,733,741 - 45 3,729,011 79,004,685
1.21 General Assistance 268,628,658 - - 257,698 268,370,960
1.22 Assistance to Aged Persons 92,718,990 - - 3,275,445 89,443,545
1.23 Child Care 137,717,417 - 122,597,453 110,907 15,009,057
1.24 Other: Admin & Strategy Policy 4,884,863 - 6,725,407 - (1,840,544)
1.25 Public Housing 33,788,482 8,107,678 (48,218,000) 10,913,227 62,985,577
1.26 Non-Profit/Cooperative Housing 107,943,745 765,465 77,074,257 3,725,588 26,378,435
1.27 Rent Supplement Programs 36,200,763 - 34,590,804 - 1,609,959
1.28 Cultural Services 2,295,830 - - - 2,295,830
1.29 Planning and Zoning 6,598,053 - 30,000 18,295 6,549,758
TOTAL 2,145,440,938 67,630,249 284,637,271 270,110,265 1,523,063,153
Source: Region of Peel 2016 Financial Information Return
Category
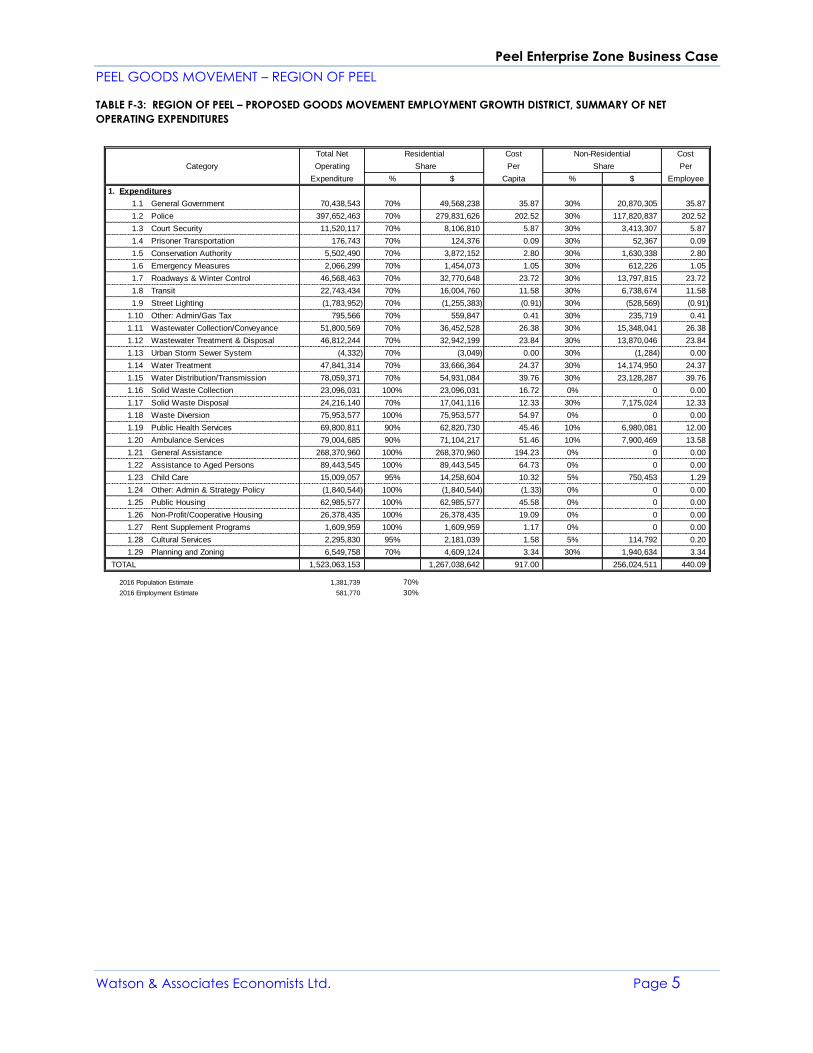
Peel Enterprise Zone Business Case
PEEL GOODS MOVEMENT – REGION OF PEEL
Watson & Associates Economists Ltd. Page 5
TABLE F-3: REGION OF PEEL – PROPOSED GOODS MOVEMENT EMPLOYMENT GROWTH DISTRICT, SUMMARY OF NET
OPERATING EXPENDITURES
Total Net Residential Cost Non-Residential Cost
Operating Share Per Share Per
Expenditure % $ Capita % $ Employee
1. Expenditures
1.1 General Government 70,438,543 70% 49,568,238 35.87 30% 20,870,305 35.87
1.2 Police 397,652,463 70% 279,831,626 202.52 30% 117,820,837 202.52
1.3 Court Security 11,520,117 70% 8,106,810 5.87 30% 3,413,307 5.87
1.4 Prisoner Transportation 176,743 70% 124,376 0.09 30% 52,367 0.09
1.5 Conservation Authority 5,502,490 70% 3,872,152 2.80 30% 1,630,338 2.80
1.6 Emergency Measures 2,066,299 70% 1,454,073 1.05 30% 612,226 1.05
1.7 Roadways & Winter Control 46,568,463 70% 32,770,648 23.72 30% 13,797,815 23.72
1.8 Transit 22,743,434 70% 16,004,760 11.58 30% 6,738,674 11.58
1.9 Street Lighting (1,783,952) 70% (1,255,383) (0.91) 30% (528,569) (0.91)
1.10 Other: Admin/Gas Tax 795,566 70% 559,847 0.41 30% 235,719 0.41
1.11 Wastewater Collection/Conveyance 51,800,569 70% 36,452,528 26.38 30% 15,348,041 26.38
1.12 Wastewater Treatment & Disposal 46,812,244 70% 32,942,199 23.84 30% 13,870,046 23.84
1.13 Urban Storm Sewer System (4,332) 70% (3,049) 0.00 30% (1,284) 0.00
1.14 Water Treatment 47,841,314 70% 33,666,364 24.37 30% 14,174,950 24.37
1.15 Water Distribution/Transmission 78,059,371 70% 54,931,084 39.76 30% 23,128,287 39.76
1.16 Solid Waste Collection 23,096,031 100% 23,096,031 16.72 0% 0 0.00
1.17 Solid Waste Disposal 24,216,140 70% 17,041,116 12.33 30% 7,175,024 12.33
1.18 Waste Diversion 75,953,577 100% 75,953,577 54.97 0% 0 0.00
1.19 Public Health Services 69,800,811 90% 62,820,730 45.46 10% 6,980,081 12.00
1.20 Ambulance Services 79,004,685 90% 71,104,217 51.46 10% 7,900,469 13.58
1.21 General Assistance 268,370,960 100% 268,370,960 194.23 0% 0 0.00
1.22 Assistance to Aged Persons 89,443,545 100% 89,443,545 64.73 0% 0 0.00
1.23 Child Care 15,009,057 95% 14,258,604 10.32 5% 750,453 1.29
1.24 Other: Admin & Strategy Policy (1,840,544) 100% (1,840,544) (1.33) 0% 0 0.00
1.25 Public Housing 62,985,577 100% 62,985,577 45.58 0% 0 0.00
1.26 Non-Profit/Cooperative Housing 26,378,435 100% 26,378,435 19.09 0% 0 0.00
1.27 Rent Supplement Programs 1,609,959 100% 1,609,959 1.17 0% 0 0.00
1.28 Cultural Services 2,295,830 95% 2,181,039 1.58 5% 114,792 0.20
1.29 Planning and Zoning 6,549,758 70% 4,609,124 3.34 30% 1,940,634 3.34
TOTAL 1,523,063,153 1,267,038,642 917.00 256,024,511 440.09
2016 Population Estimate 1,381,739 70%
2016 Employment Estimate 581,770 30%
Category
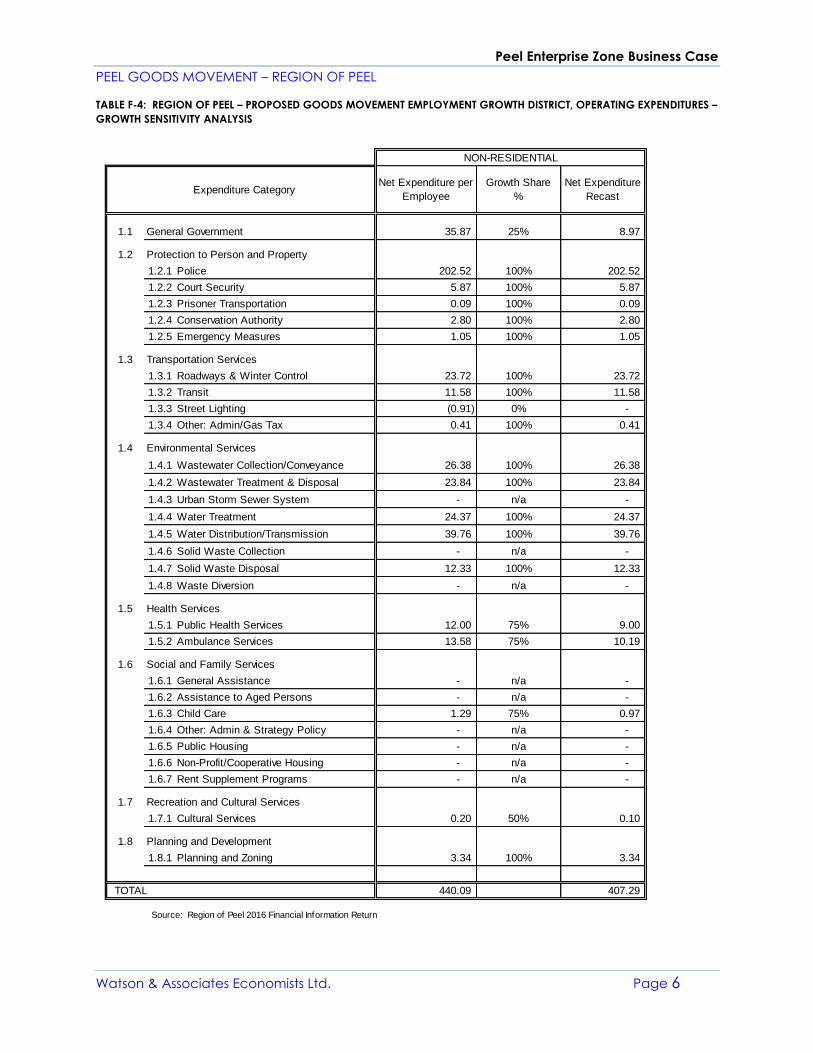
Peel Enterprise Zone Business Case
PEEL GOODS MOVEMENT – REGION OF PEEL
Watson & Associates Economists Ltd. Page 6
TABLE F-4: REGION OF PEEL – PROPOSED GOODS MOVEMENT EMPLOYMENT GROWTH DISTRICT, OPERATING EXPENDITURES –
GROWTH SENSITIVITY ANALYSIS
1.1 General Government 35.87 25% 8.97
1.2 Protection to Person and Property
1.2.1 Police 202.52 100% 202.52
1.2.2 Court Security 5.87 100% 5.87
1.2.3 Prisoner Transportation 0.09 100% 0.09
1.2.4 Conservation Authority 2.80 100% 2.80
1.2.5 Emergency Measures 1.05 100% 1.05
1.3 Transportation Services
1.3.1 Roadways & Winter Control 23.72 100% 23.72
1.3.2 Transit 11.58 100% 11.58
1.3.3 Street Lighting (0.91) 0% -
1.3.4 Other: Admin/Gas Tax 0.41 100% 0.41
1.4 Environmental Services
1.4.1 Wastewater Collection/Conveyance 26.38 100% 26.38
1.4.2 Wastewater Treatment & Disposal 23.84 100% 23.84
1.4.3 Urban Storm Sewer System - n/a -
1.4.4 Water Treatment 24.37 100% 24.37
1.4.5 Water Distribution/Transmission 39.76 100% 39.76
1.4.6 Solid Waste Collection - n/a -
1.4.7 Solid Waste Disposal 12.33 100% 12.33
1.4.8 Waste Diversion - n/a -
1.5 Health Services
1.5.1 Public Health Services 12.00 75% 9.00
1.5.2 Ambulance Services 13.58 75% 10.19
1.6 Social and Family Services
1.6.1 General Assistance - n/a -
1.6.2 Assistance to Aged Persons - n/a -
1.6.3 Child Care 1.29 75% 0.97
1.6.4 Other: Admin & Strategy Policy - n/a -
1.6.5 Public Housing - n/a -
1.6.6 Non-Profit/Cooperative Housing - n/a -
1.6.7 Rent Supplement Programs - n/a -
1.7 Recreation and Cultural Services
1.7.1 Cultural Services 0.20 50% 0.10
1.8 Planning and Development
1.8.1 Planning and Zoning 3.34 100% 3.34
TOTAL 440.09 407.29
Source: Region of Peel 2016 Financial Information Return
Growth Share
%
Net Expenditure
Recast
NON-RESIDENTIAL
Expenditure CategoryNet Expenditure per
Employee
Peel Enterprise Zone Business Case
PEEL GOODS MOVEMENT – REGION OF PEEL
Watson & Associates Economists Ltd. Page 7
The “Growth Share %” column denotes a particular percentage factor in each
case. This factor reflects any variation from the current overall average per
household expenditure level, which is called for in dealing with a development
increment. For instance, if the average existing expenditure for a service is $100 per
employee, economies of scale or other efficiencies may indicate that service costs
for the growth increment alone are likely to be lower than 100% of existing per
capita expenditures. This determination has been based on analysis of the Region’s
budget, discussions with Regional staff as well as experience and best practices
associated with related studies. The provisions made are considered to be
adequate with respect to the proposed development and existing service capacity
in the Region.
These percentage attributions are used to compute average incremental
operating costs per employee, which is reflected in the “Net Expenditure” column.
The per employee expenditure averages are utilized, subsequently, to estimate the
incremental expenditure requirement generated by growth.
Based on the analysis provided in Table F-4, forecast annual expenditures have
been determined. Table F-5 provides for the per employee expenditure by service
amount multiplied by the assumed absorption of growth over the assumed
development horizon. The total line provides for the product of this calculation.
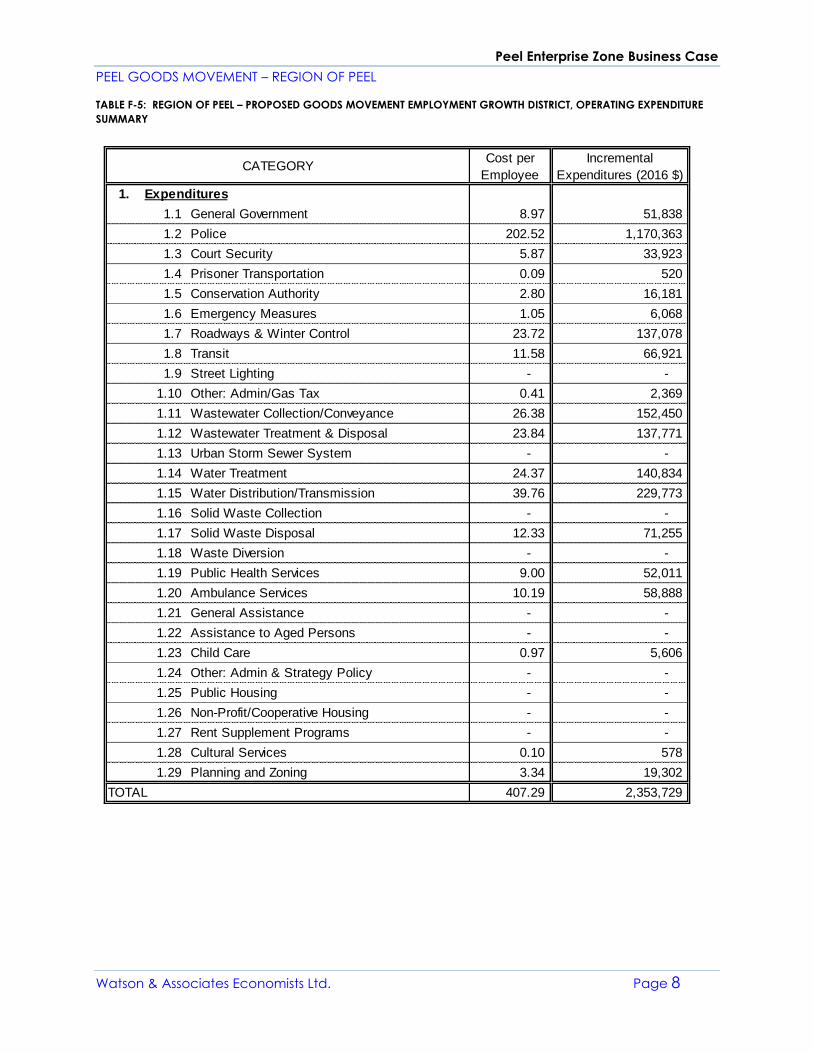
Peel Enterprise Zone Business Case
PEEL GOODS MOVEMENT – REGION OF PEEL
Watson & Associates Economists Ltd. Page 8
TABLE F-5: REGION OF PEEL – PROPOSED GOODS MOVEMENT EMPLOYMENT GROWTH DISTRICT, OPERATING EXPENDITURE
SUMMARY
Cost per
Employee
Incremental
Expenditures (2016 $)
1. Expenditures
1.1 General Government 8.97 51,838
1.2 Police 202.52 1,170,363
1.3 Court Security 5.87 33,923
1.4 Prisoner Transportation 0.09 520
1.5 Conservation Authority 2.80 16,181
1.6 Emergency Measures 1.05 6,068
1.7 Roadways & Winter Control 23.72 137,078
1.8 Transit 11.58 66,921
1.9 Street Lighting - -
1.10 Other: Admin/Gas Tax 0.41 2,369
1.11 Wastewater Collection/Conveyance 26.38 152,450
1.12 Wastewater Treatment & Disposal 23.84 137,771
1.13 Urban Storm Sewer System - -
1.14 Water Treatment 24.37 140,834
1.15 Water Distribution/Transmission 39.76 229,773
1.16 Solid Waste Collection - -
1.17 Solid Waste Disposal 12.33 71,255
1.18 Waste Diversion - -
1.19 Public Health Services 9.00 52,011
1.20 Ambulance Services 10.19 58,888
1.21 General Assistance - -
1.22 Assistance to Aged Persons - -
1.23 Child Care 0.97 5,606
1.24 Other: Admin & Strategy Policy - -
1.25 Public Housing - -
1.26 Non-Profit/Cooperative Housing - -
1.27 Rent Supplement Programs - -
1.28 Cultural Services 0.10 578
1.29 Planning and Zoning 3.34 19,302
TOTAL 407.29 2,353,729
CATEGORY
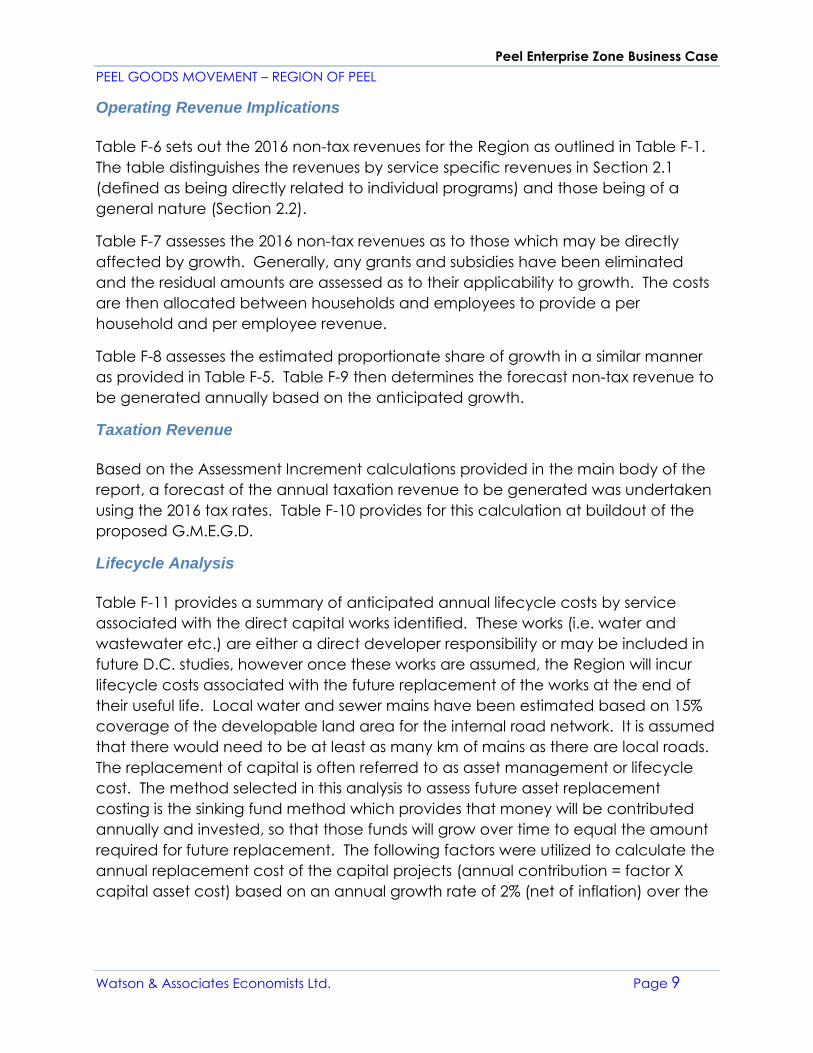
Peel Enterprise Zone Business Case
PEEL GOODS MOVEMENT – REGION OF PEEL
Watson & Associates Economists Ltd. Page 9
Operating Revenue Implications
Table F-6 sets out the 2016 non-tax revenues for the Region as outlined in Table F-1.
The table distinguishes the revenues by service specific revenues in Section 2.1
(defined as being directly related to individual programs) and those being of a
general nature (Section 2.2).
Table F-7 assesses the 2016 non-tax revenues as to those which may be directly
affected by growth. Generally, any grants and subsidies have been eliminated
and the residual amounts are assessed as to their applicability to growth. The costs
are then allocated between households and employees to provide a per
household and per employee revenue.
Table F-8 assesses the estimated proportionate share of growth in a similar manner
as provided in Table F-5. Table F-9 then determines the forecast non-tax revenue to
be generated annually based on the anticipated growth.
Taxation Revenue
Based on the Assessment Increment calculations provided in the main body of the
report, a forecast of the annual taxation revenue to be generated was undertaken
using the 2016 tax rates. Table F-10 provides for this calculation at buildout of the
proposed G.M.E.G.D.
Lifecycle Analysis
Table F-11 provides a summary of anticipated annual lifecycle costs by service
associated with the direct capital works identified. These works (i.e. water and
wastewater etc.) are either a direct developer responsibility or may be included in
future D.C. studies, however once these works are assumed, the Region will incur
lifecycle costs associated with the future replacement of the works at the end of
their useful life. Local water and sewer mains have been estimated based on 15%
coverage of the developable land area for the internal road network. It is assumed
that there would need to be at least as many km of mains as there are local roads.
The replacement of capital is often referred to as asset management or lifecycle
cost. The method selected in this analysis to assess future asset replacement
costing is the sinking fund method which provides that money will be contributed
annually and invested, so that those funds will grow over time to equal the amount
required for future replacement. The following factors were utilized to calculate the
annual replacement cost of the capital projects (annual contribution = factor X
capital asset cost) based on an annual growth rate of 2% (net of inflation) over the
Peel Enterprise Zone Business Case
PEEL GOODS MOVEMENT – REGION OF PEEL
Watson & Associates Economists Ltd. Page 10
average useful life of the asset. These costs are included in the net impact
calculations.
Table F-12 provides for an analysis of the indirect capital costs identified in the
Region’s 2015 D.C. study for each concept. The Region’s 2015 D.C. background
study identifies forecast growth of 286,800 persons and employees combined in
Peel over the 10-year forecast. The combined population and employment
forecast is estimated at 439,800 over the 18-year forecast as per the 2015 Peel
Region D.C. Background Study. Table F-12 calculates the share of the annual
lifecycle contributions identified in the 2015 Peel Region D.C. Background Study by
service which can be allocated to the subject development area. These costs are
included in the net impact calculations.
Assessment Sample
Table F-13 summarizes the assessment sample used to determine the anticipated
tax revenues associated with the proposed G.M.E.G.D.
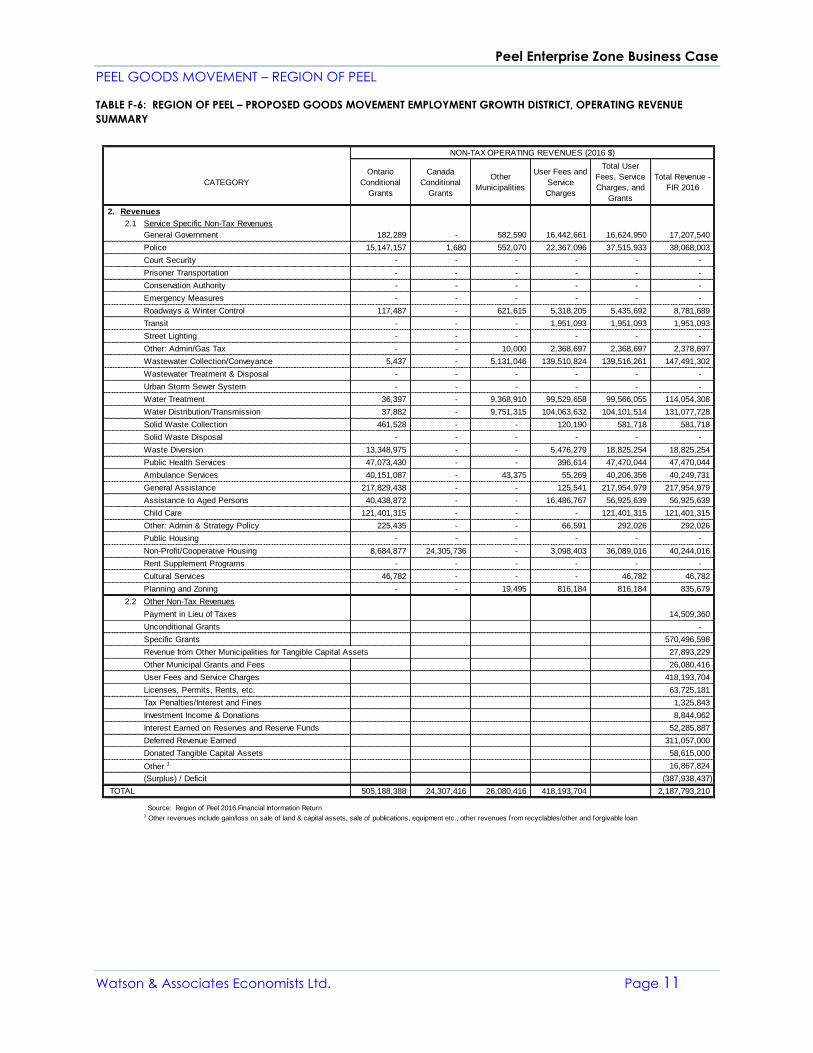
Peel Enterprise Zone Business Case
PEEL GOODS MOVEMENT – REGION OF PEEL
Watson & Associates Economists Ltd. Page 11
TABLE F-6: REGION OF PEEL – PROPOSED GOODS MOVEMENT EMPLOYMENT GROWTH DISTRICT, OPERATING REVENUE
SUMMARY
CATEGORY
Ontario
Conditional
Grants
Canada
Conditional
Grants
Other
Municipalities
User Fees and
Service
Charges
Total User
Fees, Service
Charges, and
Grants
Total Revenue -
FIR 2016
2. Revenues
2.1 Service Specific Non-Tax Revenues
General Government 182,289 - 582,590 16,442,661 16,624,950 17,207,540
Police 15,147,157 1,680 552,070 22,367,096 37,515,933 38,068,003
Court Security - - - - - -
Prisoner Transportation - - - - - -
Conservation Authority - - - - - -
Emergency Measures - - - - - -
Roadways & Winter Control 117,487 - 621,615 5,318,205 5,435,692 8,781,689
Transit - - - 1,951,093 1,951,093 1,951,093
Street Lighting - - - - - -
Other: Admin/Gas Tax - - 10,000 2,368,697 2,368,697 2,378,697
Wastewater Collection/Conveyance 5,437 - 5,131,046 139,510,824 139,516,261 147,491,302
Wastewater Treatment & Disposal - - - - - -
Urban Storm Sewer System - - - - - -
Water Treatment 36,397 - 9,368,910 99,529,658 99,566,055 114,054,308
Water Distribution/Transmission 37,882 - 9,751,315 104,063,632 104,101,514 131,077,728
Solid Waste Collection 461,528 - - 120,190 581,718 581,718
Solid Waste Disposal - - - - - -
Waste Diversion 13,348,975 - - 5,476,279 18,825,254 18,825,254
Public Health Services 47,073,430 - - 396,614 47,470,044 47,470,044
Ambulance Services 40,151,087 - 43,375 55,269 40,206,356 40,249,731
General Assistance 217,829,438 - - 125,541 217,954,979 217,954,979
Assistance to Aged Persons 40,438,872 - - 16,486,767 56,925,639 56,925,639
Child Care 121,401,315 - - - 121,401,315 121,401,315
Other: Admin & Strategy Policy 225,435 - - 66,591 292,026 292,026
Public Housing - - - - - -
Non-Profit/Cooperative Housing 8,684,877 24,305,736 - 3,098,403 36,089,016 40,244,016
Rent Supplement Programs - - - - - -
Cultural Services 46,782 - - - 46,782 46,782
Planning and Zoning - - 19,495 816,184 816,184 835,679
2.2 Other Non-Tax Revenues
Payment in Lieu of Taxes 14,509,360
Unconditional Grants -
Specific Grants 570,496,598
Revenue from Other Municipalities for Tangible Capital Assets 27,893,229
Other Municipal Grants and Fees 26,080,416
User Fees and Service Charges 418,193,704
Licenses, Permits, Rents, etc. 63,725,181
Tax Penalties/Interest and Fines 1,325,843
Investment Income & Donations 8,844,062
Interest Earned on Reserves and Reserve Funds 52,285,887
Deferred Revenue Earned 311,057,000
Donated Tangible Capital Assets 58,615,000
Other 1 16,867,824
(Surplus) / Deficit (387,938,437)
TOTAL 505,188,388 24,307,416 26,080,416 418,193,704 2,187,793,210
Source: Region of Peel 2016 Financial Information Return1 Other revenues include gain/loss on sale of land & capital assets, sale of publications, equipment etc., other revenues from recyclables/other and forgivable loan
NON-TAX OPERATING REVENUES (2016 $)
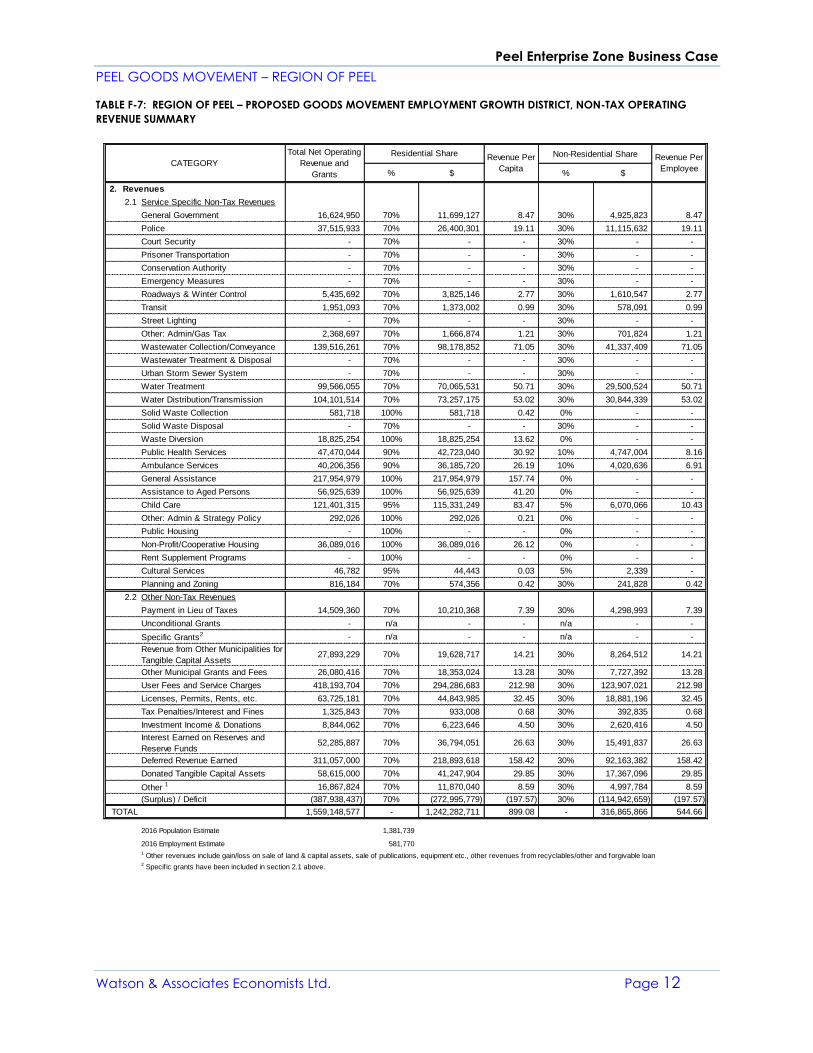
Peel Enterprise Zone Business Case
PEEL GOODS MOVEMENT – REGION OF PEEL
Watson & Associates Economists Ltd. Page 12
TABLE F-7: REGION OF PEEL – PROPOSED GOODS MOVEMENT EMPLOYMENT GROWTH DISTRICT, NON-TAX OPERATING
REVENUE SUMMARY
Non-Residential Share
% $ % $
2. Revenues
2.1 Service Specific Non-Tax Revenues
General Government 16,624,950 70% 11,699,127 8.47 30% 4,925,823 8.47
Police 37,515,933 70% 26,400,301 19.11 30% 11,115,632 19.11
Court Security - 70% - - 30% - -
Prisoner Transportation - 70% - - 30% - -
Conservation Authority - 70% - - 30% - -
Emergency Measures - 70% - - 30% - -
Roadways & Winter Control 5,435,692 70% 3,825,146 2.77 30% 1,610,547 2.77
Transit 1,951,093 70% 1,373,002 0.99 30% 578,091 0.99
Street Lighting - 70% - - 30% - -
Other: Admin/Gas Tax 2,368,697 70% 1,666,874 1.21 30% 701,824 1.21
Wastewater Collection/Conveyance 139,516,261 70% 98,178,852 71.05 30% 41,337,409 71.05
Wastewater Treatment & Disposal - 70% - - 30% - -
Urban Storm Sewer System - 70% - - 30% - -
Water Treatment 99,566,055 70% 70,065,531 50.71 30% 29,500,524 50.71
Water Distribution/Transmission 104,101,514 70% 73,257,175 53.02 30% 30,844,339 53.02
Solid Waste Collection 581,718 100% 581,718 0.42 0% - -
Solid Waste Disposal - 70% - - 30% - -
Waste Diversion 18,825,254 100% 18,825,254 13.62 0% - -
Public Health Services 47,470,044 90% 42,723,040 30.92 10% 4,747,004 8.16
Ambulance Services 40,206,356 90% 36,185,720 26.19 10% 4,020,636 6.91
General Assistance 217,954,979 100% 217,954,979 157.74 0% - -
Assistance to Aged Persons 56,925,639 100% 56,925,639 41.20 0% - -
Child Care 121,401,315 95% 115,331,249 83.47 5% 6,070,066 10.43
Other: Admin & Strategy Policy 292,026 100% 292,026 0.21 0% - -
Public Housing - 100% - - 0% - -
Non-Profit/Cooperative Housing 36,089,016 100% 36,089,016 26.12 0% - -
Rent Supplement Programs - 100% - - 0% - -
Cultural Services 46,782 95% 44,443 0.03 5% 2,339 -
Planning and Zoning 816,184 70% 574,356 0.42 30% 241,828 0.42
2.2 Other Non-Tax Revenues
Payment in Lieu of Taxes 14,509,360 70% 10,210,368 7.39 30% 4,298,993 7.39
Unconditional Grants - n/a - - n/a - -
Specific Grants2 - n/a - - n/a - -
Revenue from Other Municipalities for
Tangible Capital Assets27,893,229 70% 19,628,717 14.21 30% 8,264,512 14.21
Other Municipal Grants and Fees 26,080,416 70% 18,353,024 13.28 30% 7,727,392 13.28
User Fees and Service Charges 418,193,704 70% 294,286,683 212.98 30% 123,907,021 212.98
Licenses, Permits, Rents, etc. 63,725,181 70% 44,843,985 32.45 30% 18,881,196 32.45
Tax Penalties/Interest and Fines 1,325,843 70% 933,008 0.68 30% 392,835 0.68
Investment Income & Donations 8,844,062 70% 6,223,646 4.50 30% 2,620,416 4.50
Interest Earned on Reserves and
Reserve Funds52,285,887 70% 36,794,051 26.63 30% 15,491,837 26.63
Deferred Revenue Earned 311,057,000 70% 218,893,618 158.42 30% 92,163,382 158.42
Donated Tangible Capital Assets 58,615,000 70% 41,247,904 29.85 30% 17,367,096 29.85
Other 1 16,867,824 70% 11,870,040 8.59 30% 4,997,784 8.59
(Surplus) / Deficit (387,938,437) 70% (272,995,779) (197.57) 30% (114,942,659) (197.57)
TOTAL 1,559,148,577 - 1,242,282,711 899.08 - 316,865,866 544.66
2016 Population Estimate 1,381,739
2016 Employment Estimate 581,770
CATEGORY
Total Net Operating
Revenue and
Grants
Residential Share Revenue Per
Capita
Revenue Per
Employee
1 Other revenues include gain/loss on sale of land & capital assets, sale of publications, equipment etc., other revenues from recyclables/other and forgivable loan2 Specif ic grants have been included in section 2.1 above.
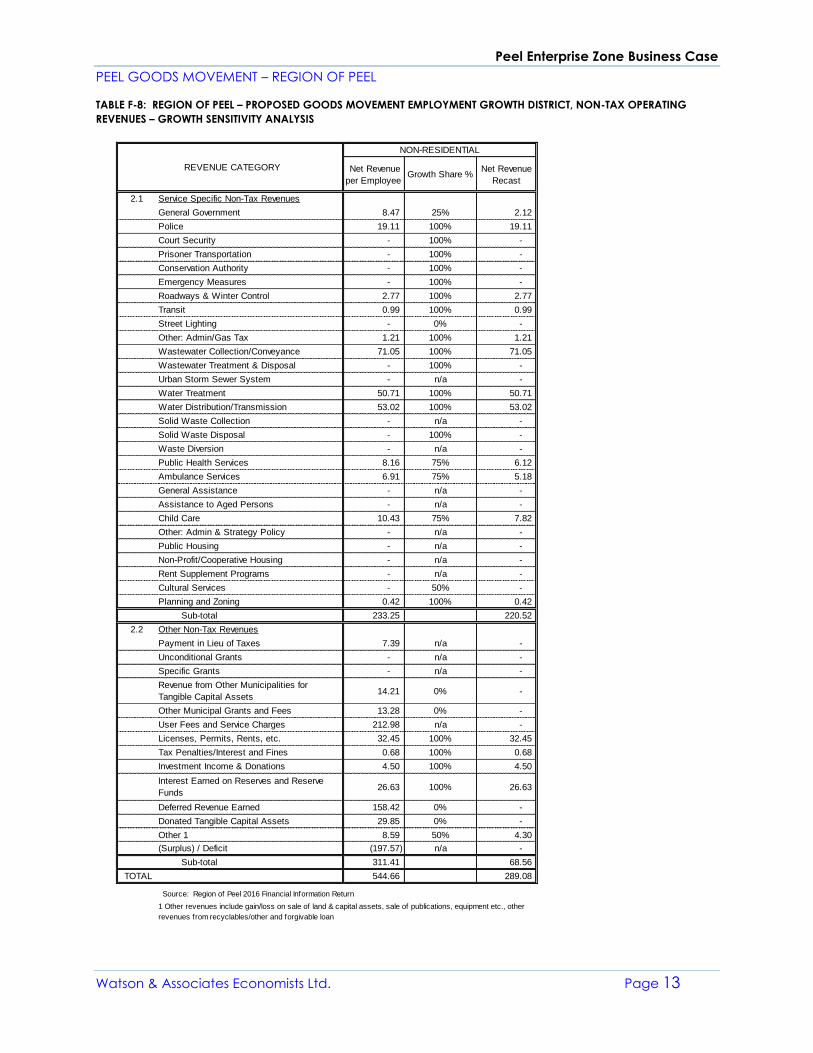
Peel Enterprise Zone Business Case
PEEL GOODS MOVEMENT – REGION OF PEEL
Watson & Associates Economists Ltd. Page 13
TABLE F-8: REGION OF PEEL – PROPOSED GOODS MOVEMENT EMPLOYMENT GROWTH DISTRICT, NON-TAX OPERATING
REVENUES – GROWTH SENSITIVITY ANALYSIS
Net Revenue
per EmployeeGrowth Share %
Net Revenue
Recast
2.1 Service Specific Non-Tax Revenues
General Government 8.47 25% 2.12
Police 19.11 100% 19.11
Court Security - 100% -
Prisoner Transportation - 100% -
Conservation Authority - 100% -
Emergency Measures - 100% -
Roadways & Winter Control 2.77 100% 2.77
Transit 0.99 100% 0.99
Street Lighting - 0% -
Other: Admin/Gas Tax 1.21 100% 1.21
Wastewater Collection/Conveyance 71.05 100% 71.05
Wastewater Treatment & Disposal - 100% -
Urban Storm Sewer System - n/a -
Water Treatment 50.71 100% 50.71
Water Distribution/Transmission 53.02 100% 53.02
Solid Waste Collection - n/a -
Solid Waste Disposal - 100% -
Waste Diversion - n/a -
Public Health Services 8.16 75% 6.12
Ambulance Services 6.91 75% 5.18
General Assistance - n/a -
Assistance to Aged Persons - n/a -
Child Care 10.43 75% 7.82
Other: Admin & Strategy Policy - n/a -
Public Housing - n/a -
Non-Profit/Cooperative Housing - n/a -
Rent Supplement Programs - n/a -
Cultural Services - 50% -
Planning and Zoning 0.42 100% 0.42
Sub-total 233.25 220.52
2.2 Other Non-Tax Revenues
Payment in Lieu of Taxes 7.39 n/a -
Unconditional Grants - n/a -
Specific Grants - n/a -
14.21 0% -
Other Municipal Grants and Fees 13.28 0% -
User Fees and Service Charges 212.98 n/a -
Licenses, Permits, Rents, etc. 32.45 100% 32.45
Tax Penalties/Interest and Fines 0.68 100% 0.68
Investment Income & Donations 4.50 100% 4.50
26.63 100% 26.63
Deferred Revenue Earned 158.42 0% -
Donated Tangible Capital Assets 29.85 0% -
Other 1 8.59 50% 4.30
(Surplus) / Deficit (197.57) n/a -
Sub-total 311.41 68.56
TOTAL 544.66 289.08
Source: Region of Peel 2016 Financial Information Return
Interest Earned on Reserves and Reserve
Funds
1 Other revenues include gain/loss on sale of land & capital assets, sale of publications, equipment etc., other
revenues from recyclables/other and forgivable loan
NON-RESIDENTIAL
REVENUE CATEGORY
Revenue from Other Municipalities for
Tangible Capital Assets
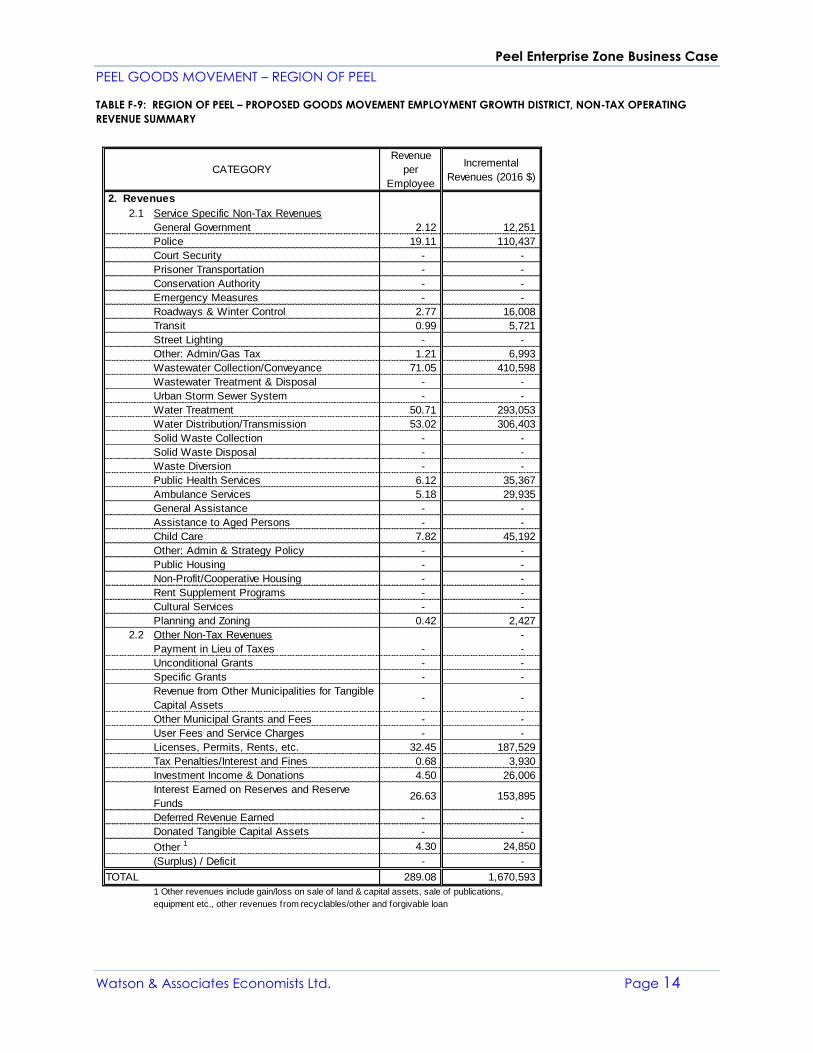
Peel Enterprise Zone Business Case
PEEL GOODS MOVEMENT – REGION OF PEEL
Watson & Associates Economists Ltd. Page 14
TABLE F-9: REGION OF PEEL – PROPOSED GOODS MOVEMENT EMPLOYMENT GROWTH DISTRICT, NON-TAX OPERATING
REVENUE SUMMARY
Revenue
per
Employee
Incremental
Revenues (2016 $)
2. Revenues
2.1 Service Specific Non-Tax Revenues
General Government 2.12 12,251
Police 19.11 110,437
Court Security - -
Prisoner Transportation - -
Conservation Authority - -
Emergency Measures - -
Roadways & Winter Control 2.77 16,008
Transit 0.99 5,721
Street Lighting - -
Other: Admin/Gas Tax 1.21 6,993
Wastewater Collection/Conveyance 71.05 410,598
Wastewater Treatment & Disposal - -
Urban Storm Sewer System - -
Water Treatment 50.71 293,053
Water Distribution/Transmission 53.02 306,403
Solid Waste Collection - -
Solid Waste Disposal - -
Waste Diversion - -
Public Health Services 6.12 35,367
Ambulance Services 5.18 29,935
General Assistance - -
Assistance to Aged Persons - -
Child Care 7.82 45,192
Other: Admin & Strategy Policy - -
Public Housing - -
Non-Profit/Cooperative Housing - -
Rent Supplement Programs - -
Cultural Services - -
Planning and Zoning 0.42 2,427
2.2 Other Non-Tax Revenues -
Payment in Lieu of Taxes - -
Unconditional Grants - -
Specific Grants - -
Revenue from Other Municipalities for Tangible
Capital Assets- -
Other Municipal Grants and Fees - -
User Fees and Service Charges - -
Licenses, Permits, Rents, etc. 32.45 187,529
Tax Penalties/Interest and Fines 0.68 3,930
Investment Income & Donations 4.50 26,006
Interest Earned on Reserves and Reserve
Funds26.63 153,895
Deferred Revenue Earned - -
Donated Tangible Capital Assets - -
Other 1 4.30 24,850
(Surplus) / Deficit - -
TOTAL 289.08 1,670,593
CATEGORY
1 Other revenues include gain/loss on sale of land & capital assets, sale of publications,
equipment etc., other revenues from recyclables/other and forgivable loan
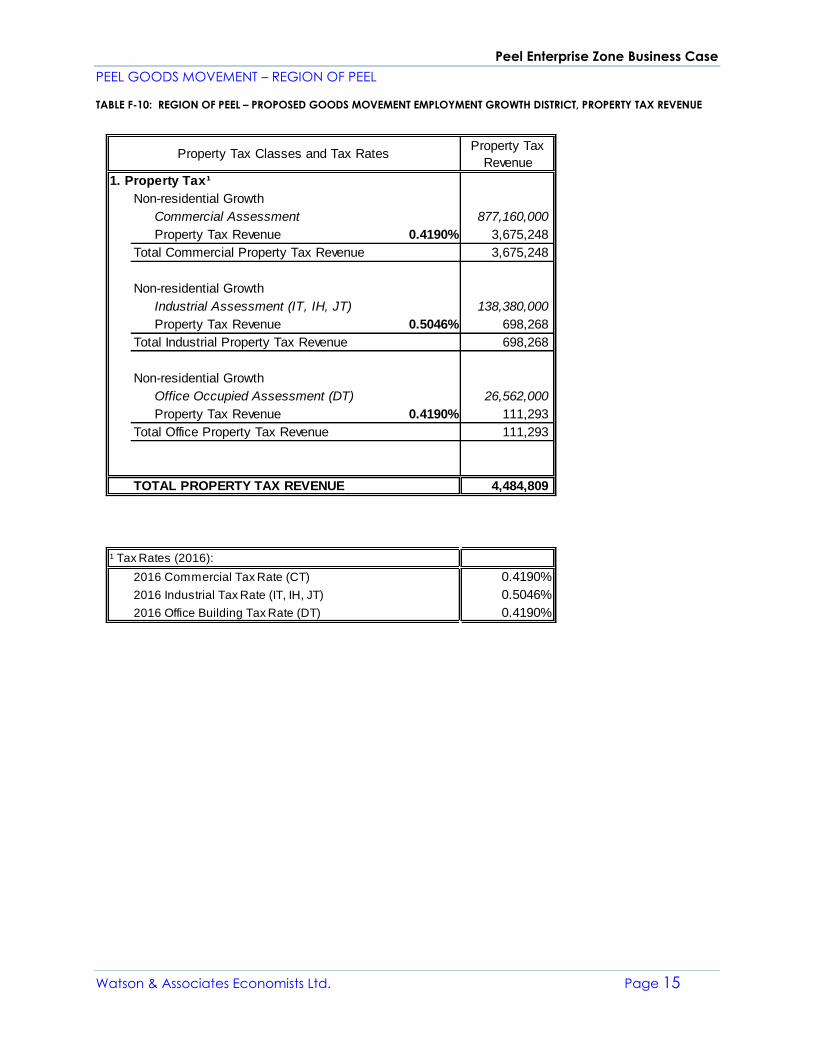
Peel Enterprise Zone Business Case
PEEL GOODS MOVEMENT – REGION OF PEEL
Watson & Associates Economists Ltd. Page 15
TABLE F-10: REGION OF PEEL – PROPOSED GOODS MOVEMENT EMPLOYMENT GROWTH DISTRICT, PROPERTY TAX REVENUE
Property Tax
Revenue
1.1Property Tax¹
Non-residential Growth
Commercial Assessment 877,160,000
Property Tax Revenue 0.4190% 3,675,248
Total Commercial Property Tax Revenue 3,675,248
Non-residential Growth
Industrial Assessment (IT, IH, JT) 138,380,000
Property Tax Revenue 0.5046% 698,268
Total Industrial Property Tax Revenue 698,268
Non-residential Growth
Office Occupied Assessment (DT) 26,562,000
Property Tax Revenue 0.4190% 111,293
Total Office Property Tax Revenue 111,293
TOTAL PROPERTY TAX REVENUE 4,484,809
2016 Commercial Tax Rate (CT) 0.4190%
2016 Industrial Tax Rate (IT, IH, JT) 0.5046%
2016 Office Building Tax Rate (DT) 0.4190%
¹ Tax Rates (2016):
Property Tax Classes and Tax Rates
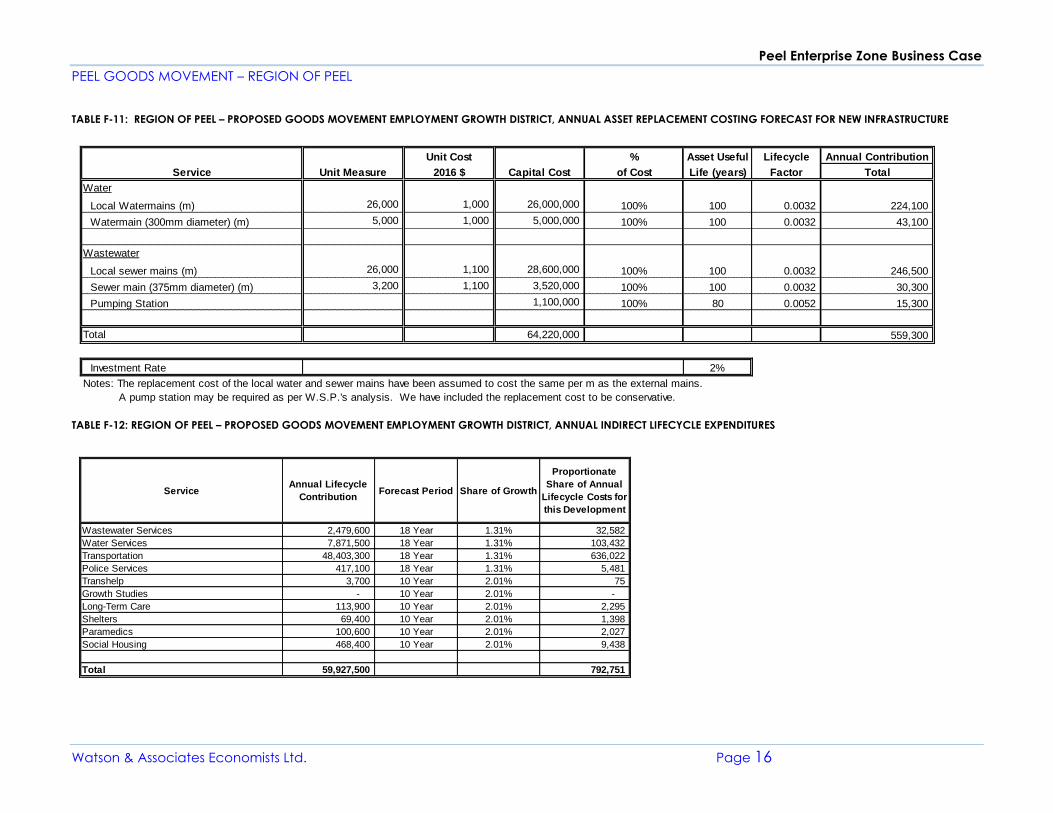
Peel Enterprise Zone Business Case
PEEL GOODS MOVEMENT – REGION OF PEEL
Watson & Associates Economists Ltd. Page 16
TABLE F-11: REGION OF PEEL – PROPOSED GOODS MOVEMENT EMPLOYMENT GROWTH DISTRICT, ANNUAL ASSET REPLACEMENT COSTING FORECAST FOR NEW INFRASTRUCTURE
TABLE F-12: REGION OF PEEL – PROPOSED GOODS MOVEMENT EMPLOYMENT GROWTH DISTRICT, ANNUAL INDIRECT LIFECYCLE EXPENDITURES
Unit Cost % Asset Useful Lifecycle Annual Contribution
Service Unit Measure 2016 $ Capital Cost of Cost Life (years) Factor Total
Water
Local Watermains (m) 26,000 1,000 26,000,000 100% 100 0.0032 224,100
Watermain (300mm diameter) (m) 5,000 1,000 5,000,000 100% 100 0.0032 43,100
Wastewater
Local sewer mains (m) 26,000 1,100 28,600,000 100% 100 0.0032 246,500
Sewer main (375mm diameter) (m) 3,200 1,100 3,520,000 100% 100 0.0032 30,300
Pumping Station 1,100,000 100% 80 0.0052 15,300
Total 64,220,000 559,300
Investment Rate 2%
Notes: The replacement cost of the local water and sewer mains have been assumed to cost the same per m as the external mains.
A pump station may be required as per W.S.P.'s analysis. We have included the replacement cost to be conservative.
ServiceAnnual Lifecycle
ContributionForecast Period Share of Growth
Proportionate
Share of Annual
Lifecycle Costs for
this Development
Wastewater Services 2,479,600 18 Year 1.31% 32,582
Water Services 7,871,500 18 Year 1.31% 103,432
Transportation 48,403,300 18 Year 1.31% 636,022
Police Services 417,100 18 Year 1.31% 5,481
Transhelp 3,700 10 Year 2.01% 75
Growth Studies - 10 Year 2.01% -
Long-Term Care 113,900 10 Year 2.01% 2,295
Shelters 69,400 10 Year 2.01% 1,398
Paramedics 100,600 10 Year 2.01% 2,027
Social Housing 468,400 10 Year 2.01% 9,438
Total 59,927,500 792,751
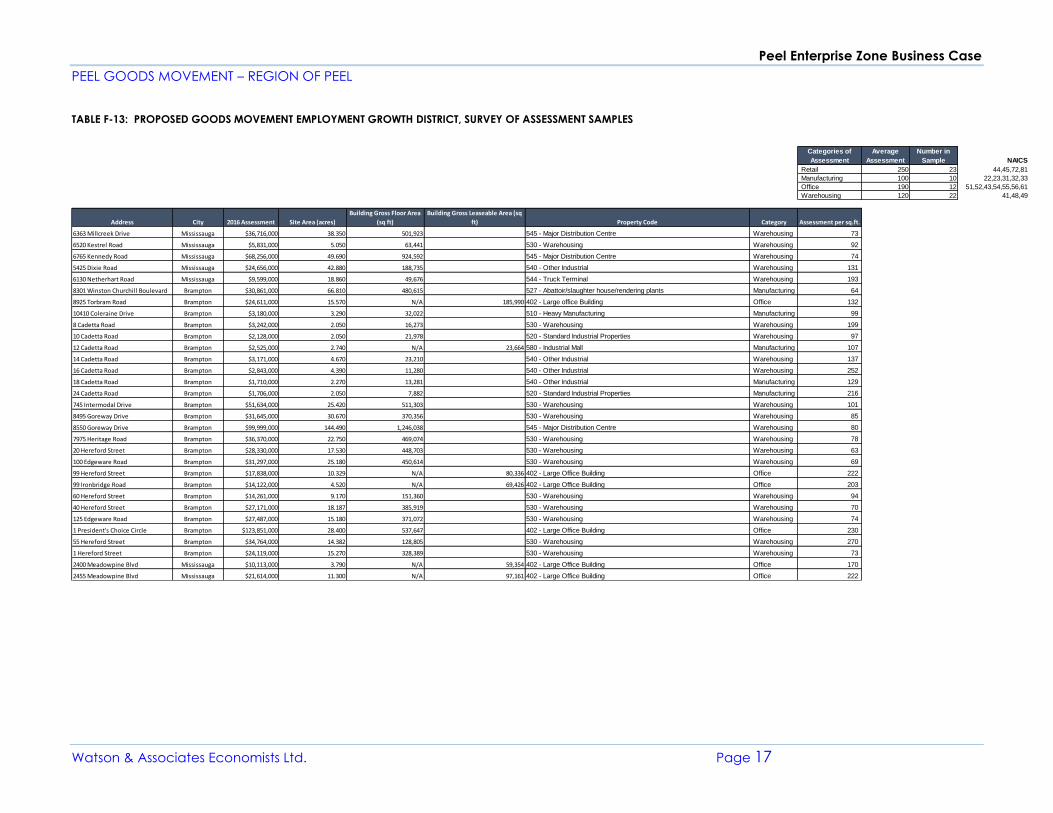
Peel Enterprise Zone Business Case
PEEL GOODS MOVEMENT – REGION OF PEEL
Watson & Associates Economists Ltd. Page 17
TABLE F-13: PROPOSED GOODS MOVEMENT EMPLOYMENT GROWTH DISTRICT, SURVEY OF ASSESSMENT SAMPLES
Categories of
Assessment
Average
Assessment
Number in
Sample NAICS
Retail 250 23 44,45,72,81
Manufacturing 100 10 22,23,31,32,33
Office 190 12 51,52,43,54,55,56,61
Warehousing 120 22 41,48,49
Address City 2016 Assessment Site Area (acres)
Building Gross Floor Area
(sq ft)
Building Gross Leaseable Area (sq
ft) Property Code Category Assessment per sq.ft.
6363 Millcreek Drive Mississauga $36,716,000 38.350 501,923 545 - Major Distribution Centre Warehousing 73
6520 Kestrel Road Mississauga $5,831,000 5.050 63,441 530 - Warehousing Warehousing 92
6765 Kennedy Road Mississauga $68,256,000 49.690 924,592 545 - Major Distribution Centre Warehousing 74
5425 Dixie Road Mississauga $24,656,000 42.880 188,735 540 - Other Industrial Warehousing 131
6130 Netherhart Road Mississauga $9,599,000 18.860 49,676 544 - Truck Terminal Warehousing 193
8301 Winston Churchill Boulevard Brampton $30,861,000 66.810 480,615 527 - Abattoir/slaughter house/rendering plants Manufacturing 64
8925 Torbram Road Brampton $24,611,000 15.570 N/A 185,990 402 - Large office Building Office 132
10410 Coleraine Drive Brampton $3,180,000 3.290 32,022 510 - Heavy Manufacturing Manufacturing 99
8 Cadetta Road Brampton $3,242,000 2.050 16,273 530 - Warehousing Warehousing 199
10 Cadetta Road Brampton $2,128,000 2.050 21,978 520 - Standard Industrial Properties Warehousing 97
12 Cadetta Road Brampton $2,525,000 2.740 N/A 23,664 580 - Industrial Mall Manufacturing 107
14 Cadetta Road Brampton $3,171,000 4.670 23,210 540 - Other Industrial Warehousing 137
16 Cadetta Road Brampton $2,843,000 4.390 11,280 540 - Other Industrial Warehousing 252
18 Cadetta Road Brampton $1,710,000 2.270 13,281 540 - Other Industrial Manufacturing 129
24 Cadetta Road Brampton $1,706,000 2.050 7,882 520 - Standard Industrial Properties Manufacturing 216
745 Intermodal Drive Brampton $51,634,000 25.420 511,303 530 - Warehousing Warehousing 101
8495 Goreway Drive Brampton $31,645,000 30.670 370,356 530 - Warehousing Warehousing 85
8550 Goreway Drive Brampton $99,999,000 144.490 1,246,038 545 - Major Distribution Centre Warehousing 80
7975 Heritage Road Brampton $36,370,000 22.750 469,074 530 - Warehousing Warehousing 78
20 Hereford Street Brampton $28,330,000 17.530 448,703 530 - Warehousing Warehousing 63
100 Edgeware Road Brampton $31,297,000 25.180 450,614 530 - Warehousing Warehousing 69
99 Hereford Street Brampton $17,838,000 10.329 N/A 80,336 402 - Large Office Building Office 222
99 Ironbridge Road Brampton $14,122,000 4.520 N/A 69,426 402 - Large Office Building Office 203
60 Hereford Street Brampton $14,261,000 9.170 151,360 530 - Warehousing Warehousing 94
40 Hereford Street Brampton $27,171,000 18.187 385,919 530 - Warehousing Warehousing 70
125 Edgeware Road Brampton $27,487,000 15.180 371,072 530 - Warehousing Warehousing 74
1 President's Choice Circle Brampton $123,851,000 28.400 537,647 402 - Large Office Building Office 230
55 Hereford Street Brampton $34,764,000 14.382 128,805 530 - Warehousing Warehousing 270
1 Hereford Street Brampton $24,119,000 15.270 328,389 530 - Warehousing Warehousing 73
2400 Meadowpine Blvd Mississauga $10,113,000 3.790 N/A 59,354 402 - Large Office Building Office 170
2455 Meadowpine Blvd Mississauga $21,614,000 11.300 N/A 97,161 402 - Large Office Building Office 222
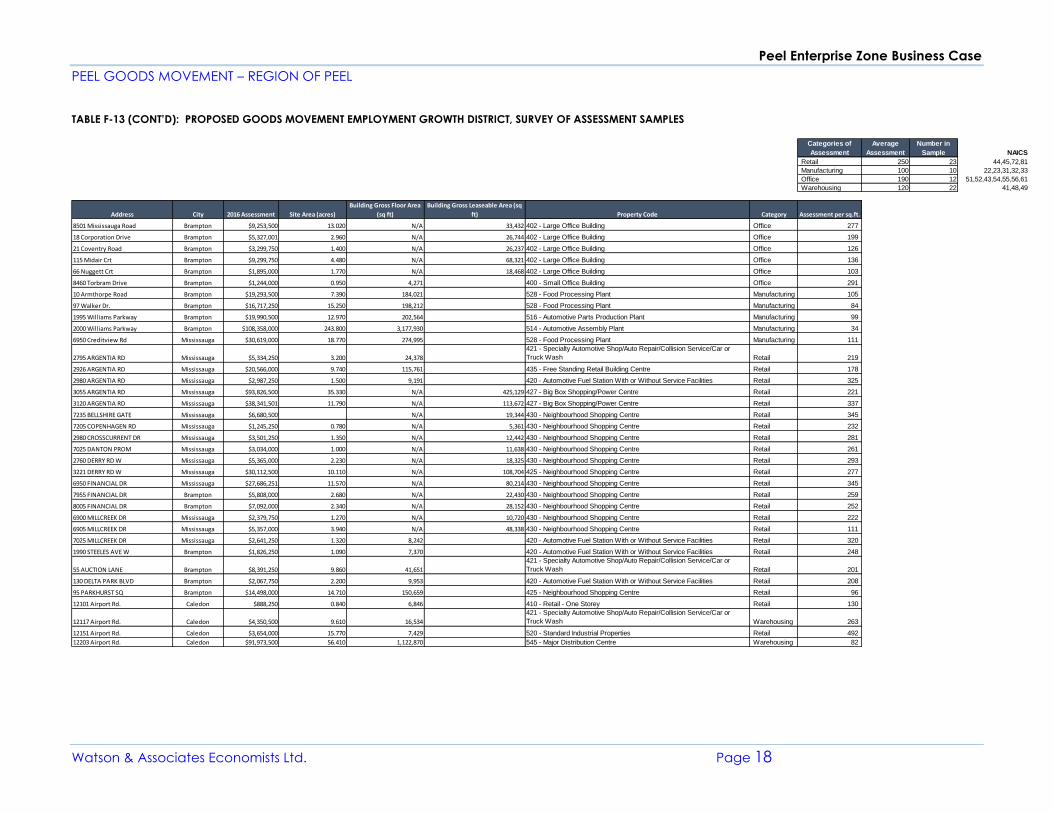
Peel Enterprise Zone Business Case
PEEL GOODS MOVEMENT – REGION OF PEEL
Watson & Associates Economists Ltd. Page 18
TABLE F-13 (CONT’D): PROPOSED GOODS MOVEMENT EMPLOYMENT GROWTH DISTRICT, SURVEY OF ASSESSMENT SAMPLES
Categories of
Assessment
Average
Assessment
Number in
Sample NAICS
Retail 250 23 44,45,72,81
Manufacturing 100 10 22,23,31,32,33
Office 190 12 51,52,43,54,55,56,61
Warehousing 120 22 41,48,49
Address City 2016 Assessment Site Area (acres)
Building Gross Floor Area
(sq ft)
Building Gross Leaseable Area (sq
ft) Property Code Category Assessment per sq.ft.
8501 Mississauga Road Brampton $9,253,500 13.020 N/A 33,432 402 - Large Office Building Office 277
18 Corporation Drive Brampton $5,327,001 2.960 N/A 26,744 402 - Large Office Building Office 199
21 Coventry Road Brampton $3,299,750 1.400 N/A 26,237 402 - Large Office Building Office 126
115 Midair Crt Brampton $9,299,750 4.480 N/A 68,321 402 - Large Office Building Office 136
66 Nuggett Crt Brampton $1,895,000 1.770 N/A 18,468 402 - Large Office Building Office 103
8460 Torbram Drive Brampton $1,244,000 0.950 4,271 400 - Small Office Building Office 291
10 Armthorpe Road Brampton $19,293,500 7.390 184,021 528 - Food Processing Plant Manufacturing 105
97 Walker Dr. Brampton $16,717,250 15.250 198,212 528 - Food Processing Plant Manufacturing 84
1995 Williams Parkway Brampton $19,990,500 12.970 202,564 516 - Automotive Parts Production Plant Manufacturing 99
2000 Williams Parkway Brampton $108,358,000 243.800 3,177,930 514 - Automotive Assembly Plant Manufacturing 34
6950 Creditview Rd Mississauga $30,619,000 18.770 274,995 528 - Food Processing Plant Manufacturing 111
2795 ARGENTIA RD Mississauga $5,334,250 3.200 24,378
421 - Specialty Automotive Shop/Auto Repair/Collision Service/Car or
Truck Wash Retail 219
2926 ARGENTIA RD Mississauga $20,566,000 9.740 115,761 435 - Free Standing Retail Building Centre Retail 178
2980 ARGENTIA RD Mississauga $2,987,250 1.500 9,191 420 - Automotive Fuel Station With or Without Service Facilities Retail 325
3055 ARGENTIA RD Mississauga $93,826,500 35.330 N/A 425,129 427 - Big Box Shopping/Power Centre Retail 221
3120 ARGENTIA RD Mississauga $38,341,501 11.790 N/A 113,672 427 - Big Box Shopping/Power Centre Retail 337
7235 BELLSHIRE GATE Mississauga $6,680,500 N/A 19,344 430 - Neighbourhood Shopping Centre Retail 345
7205 COPENHAGEN RD Mississauga $1,245,250 0.780 N/A 5,361 430 - Neighbourhood Shopping Centre Retail 232
2980 CROSSCURRENT DR Mississauga $3,501,250 1.350 N/A 12,442 430 - Neighbourhood Shopping Centre Retail 281
7025 DANTON PROM Mississauga $3,034,000 1.000 N/A 11,638 430 - Neighbourhood Shopping Centre Retail 261
2760 DERRY RD W Mississauga $5,365,000 2.230 N/A 18,325 430 - Neighbourhood Shopping Centre Retail 293
3221 DERRY RD W Mississauga $30,112,500 10.110 N/A 108,704 425 - Neighbourhood Shopping Centre Retail 277
6950 FINANCIAL DR Mississauga $27,686,251 11.570 N/A 80,214 430 - Neighbourhood Shopping Centre Retail 345
7955 FINANCIAL DR Brampton $5,808,000 2.680 N/A 22,430 430 - Neighbourhood Shopping Centre Retail 259
8005 FINANCIAL DR Brampton $7,092,000 2.340 N/A 28,152 430 - Neighbourhood Shopping Centre Retail 252
6900 MILLCREEK DR Mississauga $2,379,750 1.270 N/A 10,720 430 - Neighbourhood Shopping Centre Retail 222
6905 MILLCREEK DR Mississauga $5,357,000 3.940 N/A 48,338 430 - Neighbourhood Shopping Centre Retail 111
7025 MILLCREEK DR Mississauga $2,641,250 1.320 8,242 420 - Automotive Fuel Station With or Without Service Facilities Retail 320
1990 STEELES AVE W Brampton $1,826,250 1.090 7,370 420 - Automotive Fuel Station With or Without Service Facilities Retail 248
55 AUCTION LANE Brampton $8,391,250 9.860 41,651
421 - Specialty Automotive Shop/Auto Repair/Collision Service/Car or
Truck Wash Retail 201
130 DELTA PARK BLVD Brampton $2,067,750 2.200 9,953 420 - Automotive Fuel Station With or Without Service Facilities Retail 208
95 PARKHURST SQ Brampton $14,498,000 14.710 150,659 425 - Neighbourhood Shopping Centre Retail 96
12101 Airport Rd. Caledon $888,250 0.840 6,846 410 - Retail - One Storey Retail 130
12117 Airport Rd. Caledon $4,350,500 9.610 16,534
421 - Specialty Automotive Shop/Auto Repair/Collision Service/Car or
Truck Wash Warehousing 263
12151 Airport Rd. Caledon $3,654,000 15.770 7,429 520 - Standard Industrial Properties Retail 492
12203 Airport Rd. Caledon $91,973,500 56.410 1,122,870 545 - Major Distribution Centre Warehousing 82