Embed Size (px)
Citation preview

8/8/2019 PEDs and Interference
http://slidepdf.com/reader/full/peds-and-interference 1/28
NASA / CR-2001-210866
Personal Electronic Devices and Their
Interference With Aircraft Systems
Elden Ross
ViGyan, Inc., Hampton, Virginia
National Aeronautics and
Space Administration
Langley Research Center
Hampton, Virginia 23681-2199
Prepared for Langley Research Centerunder Contract NAS1-96014
June 2001

8/8/2019 PEDs and Interference
http://slidepdf.com/reader/full/peds-and-interference 2/28
Available from:
NASA Center for AeroSpace Information (CASI)
7121 Standard Drive
Hanover, MD 21076-1320
(301) 621-0390
National Technical Information Service (NTIS)
5285 Port Royal Road
Springfield, VA 22161-2171
(703) 605-6000

8/8/2019 PEDs and Interference
http://slidepdf.com/reader/full/peds-and-interference 3/28
ABSTRACT
A compilation of data on personal electronic devices (PEDs) attributed to having created
anomalies with aircrat_ systems. Charts and tables display 14 years of incidents reported by
pilots to the Aviation Safety Reporting System (ASRS). Affected systems, incident severity,
sources of anomaly detection, and the most frequently identified PEDs are some of the moresignificant data. Several reports contain incidents of aircraft off course when all systems
indicated on course and of critical events that occurred during landings and takeoffs.
Additionally, PEDs that should receive priority in testing are identified.

8/8/2019 PEDs and Interference
http://slidepdf.com/reader/full/peds-and-interference 4/28
TABLE OFCONTENTS
ABSTRACT..............................................................................................................................INTRODUCTION .....................................................................................................................DEFINITIONS................................................................................................................. 6CREDIBILITY OFPEDEVENTS.............................................................................................RECORDEDPEDEVENTS......................................................................................................PEDEVENTSAND THEENVIRONMENT INWHICH THEY TOOK PLACE.....................10ANOMALY DISCOVERYSOURCES....................................................................................4SYSTEMSTHAT WEREAFFECTED.....................................................................................6PEDsTHAT AFFECTEDAIRCRAFT SYSTEMS...................................................................0CONCLUSIONS......................................................................................................................4

8/8/2019 PEDs and Interference
http://slidepdf.com/reader/full/peds-and-interference 5/28
INTRODUCTION
Theobjectiveof thisreportis to identify and compile incidents of aircraft systems anomahe.
attributed to the use of onboard personal electronic devices (PEDs). It is intended this data
highlight the need for additional research to resolve these types of anomalies as a contribution to
aviation safety.
NASA Langley initiated this data compilation as part of a survey activity supporting it's
comprehensive program to characterize the effects on aircraft flight systems of electromagnetic
(EM) disturbances which can arise from sources such as PEDs, of high intensity radiated fields
(HIRF), and of lightning. The effects of lightning or HIRF on aircraft systems are not addressed
in this paper.
This report is based on the Aviation Safety Reporting System's (ASRS) database.' The charts
and tables represent the fields recorded in those reports and theyear the incident was reported.
Including the years in the charts and tables permits a degree of flexibility for the reader to align
this report with aviation industry related events not contained in the ASRS Database.
It is beyond the scope of this report to define specific procedures for resolving the PED issue, but
some suggestions are included on which devices to test. This report's intent is not to imply thatany of the anomalies addressed here are unique to any specific air transport company, aircraft
manufacturer, aircraft system's manufacturer, PED manufacturer or flight crewmember. Any
mention of a PED by manufacturer's name and or model is directly derived from the ASRS'
report narrative.
Before proceeding it is essential to understand how the ASRS program collects and manages its
data and what the limitations are on using the data. Following are two quotes from the data
provided by the ASRS:
Overview
The Aviation Safety Reporting System (ASRS) was established in 1975 under a
Memorandum of Agreement between the Federal Aviation Administration (FAA) and the
National Aeronautics and Space Administration (NASA). FAA provides most of the
program funding; NASA administers the program and sets its policies in consultationwith the FAA and the aviation community. NASA has chosen to operate the program
through a contractor selected via competitive bidding. The current contractor is Battelle
Memorial Institute.
The ASRS collects, analyzes, and responds to voluntarily submitted aviation safety
incident reports in order to lessen the likelihood of aviation accidents. ASRS data are
used to: identify deficiencies and discrepancies in the National Aviation System (NAS)
so that these can be remedied by appropriate authorities; support policy formulation and
planning for, and improvements to, the NAS; [and] strengthen the foundation of aviation
human factors safety research. This is particularly important since it is generallyconceded that over two-thirds of all awation accidents and incidents have their roots in
human performance errors,
Pilots, air traffic controllers, flight attendants, mechanics, ground personnel, and others
involved in aviation operations submit reports to the ASRS when they are involved in, or
observe, an incident or situation in which aviation safety was compromised. All
submissions are voluntary.
ASRS Reports: Quick Response # 271, November 30, 1994 and Search request # 5532, Januar3' 27, 1999; ASRS
Office, 625 Ellis Street, Suite 305, Mountain View, California 94043; Telephone (650) 969-3969.

8/8/2019 PEDs and Interference
http://slidepdf.com/reader/full/peds-and-interference 6/28
Reportssentto theASRSareheld in strictconfidence.More than300,000reportshavebeensubmittedtodateandnoreporter'sdentity haseverbeenbreachedby theASRS.ASRSde-identifiesreportsbeforeenteringtheminto theincidentdatabase.All personalandorganizationalnamesareremoved.Dates,times,andrelatedinformation,whichcouldbeusedto infer an identity,areeithergeneralizedor eliminated.
TheFAA offersASRSreportersfurtherguaranteesndincentivesto report.It hascommitteditself notto useASRSinformationagainstreportersin enforcementactions.Ithasalsochosentowaivefinesandpenalties,subjectto certainlimitations,forunintentionalviolationsof federalaviationstatutesandregulationsthat arereportedtoASRS.TheFAA's initiation, andcontinuedsupportof theASRSprogramanditswillingnessto waivepenaltiesn qualifying casess ameasureof thevalueit placesonthe safetyinformationgathered,andtheproductsmadepossible,throughincidentreportingto theASRS.
Incidentreportsarereadandanalyzedby ASRS'scorpsof aviationsafetyanalysts.Theanalyststaff is composedentirelyof experiencedpilotsandair traffic controllers.Theiryearsof experienceareuniformlymeasuredn decades,andcoverthefull spectrumofaviationactivity: aircarrier,military, andgeneralaviation;Air Traffic Controlin Towers,TRACONS,Centers,andMilitary Facilities.
Eachreportreceivedby theASRSis readby aminimumof two analysts.Their firstmissionis to identify anyaviationhazardshatarediscussedn reportsandflag thatinformationfor immediateaction.Whensuchhazardsareidentified,analertingmessageis issuedto theappropriateFAA office or aviationauthority.Analysts'secondmissionisto classifyreportsanddiagnosehecausesunderlyingeachreportedevent.Theirobservations,andtheoriginalde-identifiedreport,arethenincorporatednto theASRS'sdatabase.
The databaseprovidesa foundationfor specificproductsandsubsequentesearchaddressingavariety of aviationsafetyissues.ASRS'sdatabasencludesthenarrativessubmittedby reporters(after theyhavebeensanitizedfor identifying details).Thesenarrativesprovideanexceptionallyrich sourceof informationfor policy developmentandhumanfactorsresearch.Thedatabasealsocontainscodedinformationfrom theoriginal reportthatis usedfordataretrievalandstatisticalanalyses.
CaveatRegardingStatisticalUseOf ASRSInformation
Certaincaveatsapplyto theuseof ASRSstatisticaldata.All ASRSreportsarevoluntarily submitted,andthuscannotbeconsideredameasuredandomsampleof thefull populationof like events.Forexample,we receiveseveralthousandaltitudedeviationreportseachyear.Thisnumbermaycompriseoverhalf of all thealtitudedeviationsthatoccur,or it maybejust asmallfractionof total occurrences.Wehavenowayof knowingwhich.
Moreover,notall pilots,controllers,air carriers,or otherparticipantsin theaviation
system,areequallyawareof theASRSor equallywilling to report to us.Thus,thedatareflectreportingbiases.Thesebiases,whicharenot fully knownormeasurable,distortASRSstatistics.A safetyproblemsuchasnearmidaircollisions (NMACS)mayappeartobemorehighlyconcentratedn area"A" thanarea"B" simplybecauseheairmenwhooperaten area'A" aremoresupportiveof theASRSprogramandmoreinclinedto reporttousshouldanNMAC occur.
"http://asrs.arc.nasa.gov/overviexv.htm
8/8/2019 PEDs and Interference
http://slidepdf.com/reader/full/peds-and-interference 7/28
Onlyonethingcanbeknownfor surefromASRSstatistics-- they represent the lowermeasure of the true number of such events that are occurring. For example, if ASRS
receives 300 reports of track deviations in 1993 (this number is purely hypothetical), then
it can be known with certainty that at least 300 such events have occurred in 1993.
Because of these statistical limitations, we believe that the real power of the ASRS lies in
the report narratives. Here pilots, controllers, and others, tell us about aviation safetyincidents and situations in detail. They explain what happened, and more importantly,
why it happened. Using report narratives effectively requires an extra measure of study;
the knowledge derived is well worth the added effort. _
3 ASRS Reports: Quick Response # 271, November 30, 1994 and Search request # 5532, Januar3' 27, 1999.

8/8/2019 PEDs and Interference
http://slidepdf.com/reader/full/peds-and-interference 8/28
DEFINITIONS
CRITICAL/ACFT EQUIPMENTPROBLEM:Aircraft equipmentproblemthatis vital to thesafetyof theflight.
LESSSEVERE/ACFTEQUIPMENTPROBLEM:Not qualifying asacriticalaircraftequipment
problem,
ANOMALY: Deviationfrom thecommonrule-- irregularity;somethingdifferent,abnormal,peculiar,ornot easilyclassified.
ACCIDENT: An occurrenceassociatedwith theoperationof anaircraftthattakesplacebetweenthetimesanypersonboardstheaircraftwith theintentionof flight andaIl suchpersonshavedisembarked,andin whichanypersonsuffersdeathor seriousinjury, or in whichtheaircraftreceivessubstantialdamage.49 CFR830)
INCIDENT: Is anoccurrenceotherthananaccidenthataffectsor couldaffectthe safetyofoperations.49CFR830)
PED: Portable,Personal,or PassengerElectronicDevice
8/8/2019 PEDs and Interference
http://slidepdf.com/reader/full/peds-and-interference 9/28
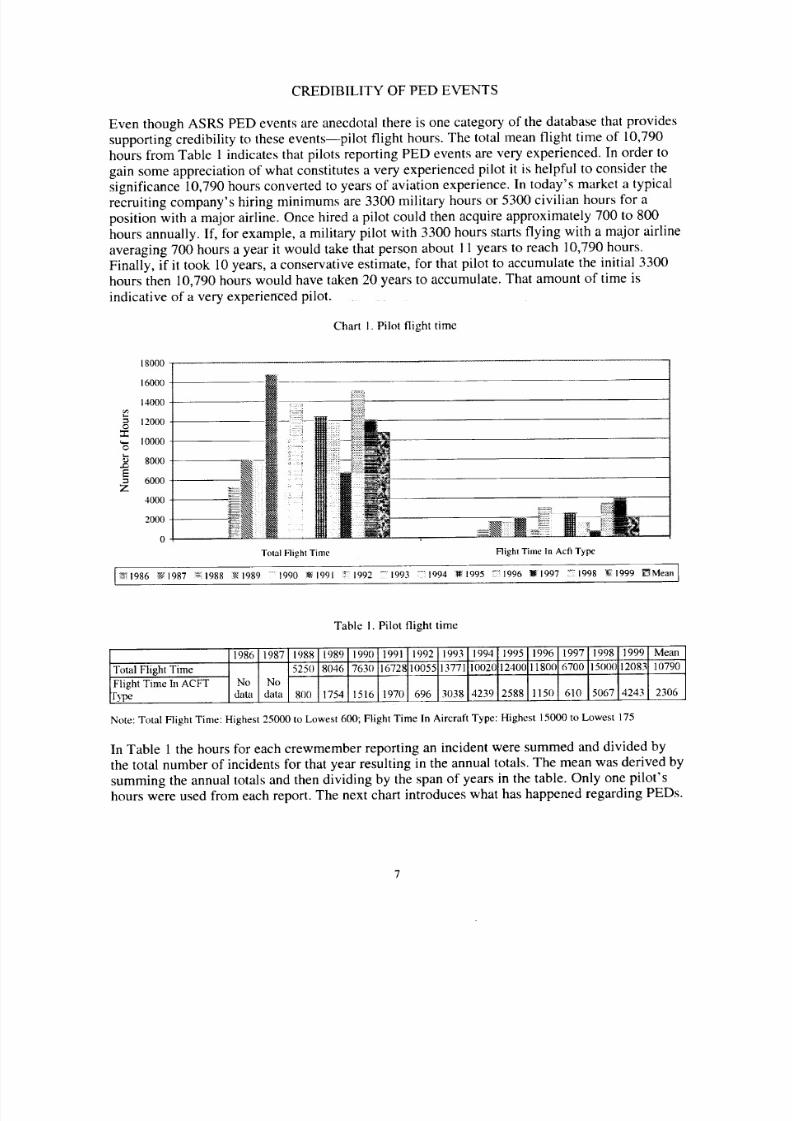
CREDIBILITY OF PED EVENTS
Even though ASRS PED events are anecdotal there is one category of the database that provides
supporting credibility to these events--pilot flight hours. The total mean flight time of 10,790
hours from Table 1 indicates that pilots reporting PED events are very experienced. In order to
gain some appreciation of what constitutes a very experienced pilot it is helpful to consider thesignificance 10,790 hours converted to years of aviation experience. In today's market a typical
recruiting company's hiring minimums are 3300 military hours or 5300 civilian hours for a
position with a major airline. Once hired a pilot could then acquire approximately 700 to 800
hours annually. If, for example, a military pilot with 3300 hours starts flying with a major airline
averaging 700 hours a year it would take that person about 11 years to reach 10,790 hours.
Finally, if it took 10 years, a conservative estimate, for that pilot to accumulate the initial 3300
hours then 10,790 hours would have taken 20 years to accumulate. That amount of time is
indicative of a very experienced pilot.
Chart I. Pilot flight time
18000
16000
14000
12000O
,.,- 10000
8000
E6000
Z
4000
200O
Total Flight Time
[_ 1986 _1987 _1988 ;_:1989 : 1990 • 1991
Flight Time In Acft Type
_: 1992 _ I993 7"_1994 _ 1995 _"1996 W:1997 _":1998 N 1999 _Mean
Table I. Pilot flight time
1986 1987 1988 1989 1990 1991 1992 1993 1994 1995 1996 1997 1998 1999 Mean
Total Flight Time 5250 8046! 7630 6728 10055 13771 1002(', 12400il 1800 6700 15000 12083 10790
Flight Time hi ACFT No No
rype data data 800 1754 1516 1970 696 3038 4239 2588 1150 610 5067 4243 2306
Note: Total Flight Time: Highest 25000 to Lowest 600; Flight Time In Aircraft Type: Highest 15000 to Lowest 175
In Table 1 the hours for each crewmember reporting an incident were summed and divided by
the total number of incidents for that year resulting in the annual totals. The mean was derived by
summing the annual totals and then dividing by the span of years in the table. Only one pilot's
hours were used from each report. The next chart introduces what has happened regarding PEDs.

8/8/2019 PEDs and Interference
http://slidepdf.com/reader/full/peds-and-interference 10/28
RECORDED PED EVENTS
Chart 2, Annual PED incidents
O
E
Z
14
12
10
8
6
4
2
0
1986 1987 1988 1989 1990 1991 1992 1993 1994 1995 1996 1997 1998 1999
Incidents with Anomaly
-Incidents wilhout Anomaly
Tablc 2. Annual PED incidents
1986 1987 1988 1989 1990 1991 1992 1993 1994 1995 1996 1997 1998 1999 Total
hlcidents with Anomal',' 2 2 2 4 7 4 6 14 12 8 2 4 8 I 0 85
-l'ncidcnts without Anoi_lalv| 1 l ........... 1 1 4
Totals ] 2 2 2 5 8 4 6 15 13 8 2 4 8 I0 89
It is important to establish just what has happened regarding onboard PED use. Chart 2, the
initial chart for documenting what has happened, presents all ASRS reports attributed to PEDs.
Additionally, it points out that not every incident of PED use has created an anomaly. Non-
anomaly events are charted here in the interest &objectivity and are not included in any other
charts or tables. 4 Obviously, non-anomaly events represent a low safety risk, however other
charts will identify events of significantly greater risk.
Throughout the entire ASRS Database there were no reports, following a PED anomaly event,
where aircraft systems were found faulty when checked by maintenance personnel. Two
incidents were reported where a navigation line replaceable unit (LRU) was replaced for
precautionary reasons, but no faults were found with either piece of equipment. This would seem
to indicate that equipment has functioned correctly prior to and after exposure to an external
source such as a PED. Not only have anomalies happened, but they have also been associated
with critical system's interference.
4 Out of the four non-anomaly events one happened in the air and three on the ground.
8

8/8/2019 PEDs and Interference
http://slidepdf.com/reader/full/peds-and-interference 11/28
Chart 3. Annual PED incidents by severity
II
0-
1986 1987 1988 1989 1990 1991 1992 1993 1994 1995 1996 1997 1998 1999
Table 3. Annual PED incidents by severity
1986 1987 1988 1989 1990 1991 1992 1993 1994 1995 1996 1997 1998 1999 Totals
I,ess Severe 2 2 4 3 3 3 2 3 4 2 3 5 4 40
Critical 2 1 2 11 9 4 I 1 3 5 39
Not Rated 3 1 1 1 ! 7
Totals 2 2 2 4 7 4 6 14 12 8 3 4 8 10 86
Chart 3 represents anomalies that were designated as critical or less severe. These two categories
represent a flight crew's evaluation of the degree of system interference in relation to safety of
flight. A greater awareness for the safety risks of PED incidents can be gained by viewing Chart
6's depiction of anomalies that happened during landings and takeoffs.
The third data area of what has happened is contained in table 4, page 9, and it identifies the
number of PEDs associated with each anomaly event. The category Single represents events
where only one PED was observed to be in use at the time an anomaly occurred in contrast to the
categories Multiple Similar and Multiple Dissimilar where two or more PEDs were observed to
be in use. This data illustrates the need to separately evaluate the potential for interference of a
single PED and multiple PEDs. Additionally, multiple PEDs may need to be evaluated as groups
of similar and dissimilar devices. It is interesting to note that there was one report where 24
PEDs were observed to have been in use at one time. However, the important point is anomalies
have been created by a single PED.

8/8/2019 PEDs and Interference
http://slidepdf.com/reader/full/peds-and-interference 12/28
Chart 4. Incidents involving single VS multiple PED usage
5o
"3
t,..O
,3
E
Z
45
40
35
30
25
2O
15
10
5
0
42
Single
18
_57-:2! 8
Multiple Similar Mul tipl e Dissimi lar
I
Sin_,le
Multiple Similar
_Mu_ltipleDissimilar
Totals
Tahlc 4. Incidents involving single VS multiple PED usage
,989990,1 11,99:,19 39499599°99799 0 0ooli[ [ 1 4 3 ] ] 33 7 6 1 1 1 4 7 42
1 1 2 2 1 1 8
1 ] I 2 2 4 1 1 2 3 18
2 1 2 5 5 4 5 13 9 1 1 3 6 11 68
PED EVENTS AND THE ENVIRONMENT IN WHICH THEY TOOK PLACE
The next three charts identify where incidents have occurred relative to aircraft specifics and
phase of flight. One would expect the first chart to address aircraft type, but the ASRS data
system did not track aircraft types until 1994. Instead, it tracked aircraft size (wide body, large
transport, etc.) based on weight. The combined analysis of aircraft weights and types yielded
only one supportable observation--PED occurrences have happened to a wide variety of aircraft
regardless of manufacturer or weight. Nonetheless, the database contained one field worthy of
note--cockpit design.
Between 1986 and 1999 there have been significant changes in cockpit design from basic analog
to advanced glass. The ASRS defines advanced cockpits as those fitted with one or anycombination of the following: integrated navigation (NAV), electronic flight instrument system
(EFIS), flat panel liquid crystal display (LCD), cathode ray tube (CRT), flight management
system (FMS) and heads up display (HUD).
10

8/8/2019 PEDs and Interference
http://slidepdf.com/reader/full/peds-and-interference 13/28
Chart5.Aircraftcockpitype
12
10
._8
_6
E4
Z
9
ET_I
i ,iiiNN:_SN_i
+:+::++.....l .i+Not Advanced
'_!1986 +g1987 _1988 _1989 _+1990 _1991
10
_4
, N, , _!
i
Advanced
_1992 _1993 S_1994 _;1995 _1996 _1997 _'1998 _i9991
4 4
Table 5. Aircraft cockpit type
1986 1987 1988 1989 1990 1991 1992 1993 1994 1995 1996 1997 1998 1999 Totals
Not Advanced 1 2 6 3 4 5 9 3 1 3 5 42
Advanced 1 3 1 1 2 10 4 5 3 3 4 4 41
Totals 2 5 7 4 6 15 13 8 3 4 7 9 83
Although the data in Chart 5 appears to indicate that advanced cockpit system's increased faulttolerant characteristic accounted for fewer incidents, without knowing the total number of
aircraft equipped with an advanced cockpit this conclusion is not supportable. _ The fact remains
that PED related anomalies have happened in aircraft with advanced cockpits, and they have
happened at less than desirable moments.
5 A t the time of this report, data reflecting the number of aircraft fitted with a particular 13_peof cockpit for an}" given
year was not obtainable.
11

8/8/2019 PEDs and Interference
http://slidepdf.com/reader/full/peds-and-interference 14/28
Specifically, these were moments when flight crews were already busy with the multiple tasks
involved in landing or taking off. Clearly, Chart 6 on page 11 documents that PED anomalies
have occurred during critical phases of flight. _ Each phase, approach and landing or takeoff and
climb, accounted for approximately 22 percent of all anomalies. Therefore, about 44 percent of
all reported incidents occurred during a critical phase of flight. 7
Chart 6. Phase of flight when incident occurred
e'_
E
Z
50
45
40
35
30
25
20
15
10
5
0
45
Enroute/Cruise
19 19
m 2
1 i p
Approach/Landing Takeoff/Climbout On Ground
Table 6. Phase of flight when incident occurred
1986 1987 198811989 1990 1991 1992 199311994 1995 1996 1997, 1998 1999 Totals
Enroute/Cnlise 2 2 2 3 6 3 3 9 5 1 5 6 47
Approach/Landin 8 1 1 3 4 7 3 2 2 23
Takeoff/Climbout 1 1 2 2 2 1 4 I 2 16
On Ground 1 1 ] 2
Totals 2 2 1 2 I 5 I 7 4 6 1 1121 9 I 3 4 8 I0 88
A broader significance of Chart 6 can be determined by associating its data with the aviation
statistic that 68 percent of all fatal aviation accidents have occurred during a critical phase of
flight. _ Clearly there is a need to reduce or eliminate critical system anomalies from occurring
during these significant flight phases. Additional support for this matter is contained in the next
chart's data.
6 Critical phases of flight are defined, in accordance with FAR 121.542 and FAR 135.100, as "...takeoffs and
landings, all ground operations involving taxiing, and all other flight operations conducted below 10,000 feet, except
cruise fl ight."
7 For detailed examples see line items 33, 46, 48, 50, 53, 55, 59, 61, 62, and 68 in Table 11.
8 (Boe96): Boeing Commercial Airplane Group, Statistical Summa O' of Commercial Jet .4 ircraft Accidents:
worl_,'ide operations 1959-95, 1996.
12

8/8/2019 PEDs and Interference
http://slidepdf.com/reader/full/peds-and-interference 15/28
Chart 7. Altitude of flight when incident occurred
5o
40e_
e--
_ 30
0
E 2O
Z
I0
50
31
Greater Than / Equal To I0,000 fi
B
Less Than 10,000 fl
Table 7. Altitude of flight when incident occurred
1986 1987 1988 1989 199(I 1991 1992 1993 1994 1995 1996 1997 1998 1999 Totals
Greater Than / = To 10_000 fl 1 2 2 2 5 2 2 9 6 5 1 2 5 6 50
Less Than 10,000 II 1 2 ] 1 4 5 6 3 1 1 3 3 31
Totals 2 2 2 4 6 3 6 14 12 8 2 3 8 9 81
Where as the previous chart is based on flight phases, Chart 7 is predicated on altitude and
indicates that approximately 38 percent of all PED incidents happened at altitudes where the
flight crew was required to maintain Sterile Cockpit Rules." These rules restrict flight crew
actions to those considered essential to safe operation of the aircraft. They are applicable at and
below 10,000 feet where landings and takeoffs are typically conducted. The difference between
the 44 percent in the previous chart and the 38 percent of Chart 7 is attributable to the exclusion,
in Chart 7, of approach and climb incidents that happened above 10,000 feet. For clarification,
climb is the extended portion of a takeoff that begins once an aircraft is airborne and ends when
it reaches cruise altitude. Approach is the initial portion of landing that commences when cruise
is departed and continues to runway touchdown. Regardless of the difference, either figure is
sufficient cause for concern.
9 Sterile Cockpit Rules are defined by two regulations. "FAR 121.542/FAR 13 5.100 stipulate flight crew member
duties as: (a) "No certificate holder shall require, nor may any flight crew member perform any duties during a
critical phase of flight except those duties required for the safe operation of the aircraft .... "'(c) "for the purposes of
this section, critical phase of flight involves all ground operations involving taxi, takeoff and landing, and all other
flight operations conducted below 10,000 feet, except cruise flight.
13

8/8/2019 PEDs and Interference
http://slidepdf.com/reader/full/peds-and-interference 16/28
ANOMALY DISCOVERY SOURCES
Chart 8. Sources of anomaly detection
e-,
E
Z
70
60
50
40
30
20
10
0
65
21
Flight Crew Air Traffic Control
Table 8. Sources of anomaly detection
1986 1987 1988 1989 1990 1991 1992 1993 1994 1995 1996 1997 1998 1999 Totals
Flight Crev,' 2 2 2 5 1 4 9 9 ° 8 2 3 8 10 65
Air Traffic Control 2 1 3. 3 2 5 3 1 1 21
Totals 2 ] 2 2 3 8 4 6 14 12 8 3 4 8 10 86
The next significant ASRS data fields are those that address how anomalies have been
discovered. In Chart 8 data has been graphed of air traffic control (ATC) radar plots that were the
basis for notification from ATC to the flight crew their aircraft was off course. At the time of
notification the flight crew had no idea based on display panel data that the aircraft was not
where the panel data indicated. All navigation systems showed on course and displayed no flags,
warnings, or other abnormalities. The major point here is that ATC has initially discovered
almost one fourth of the PED anomalies. These radar plots also represent an independent
resource for confirmation of anomalies. Anomalies were also detected by aircraft systems as is
reflected in the next chart.
14

8/8/2019 PEDs and Interference
http://slidepdf.com/reader/full/peds-and-interference 17/28
Chart 9. NAV Systems' responses to onboard PED operations
e,,,n_
o
E
Z
5o
40
30
20
lO
46
H
::;@,
....::?;•
Indicated By NAV System
15
Not Indicated by NAV System Not Initially Indicated By
Primary NAV System
Table 9. NAV Systems' responses to onboard PED operations
Indicated By NAV System
Not Indicated by NAV System
Not Initially Indicated By Primary" NAV System
Totals
1986 t987 1988 1989 1990 1991 1992 1993 1994 1995 1996 1997 1998 1999 Totals
2 2 2 5 1 7 4 6 1 3 6 7 46
1 3 1 1 4 3 1 1 15
3 I 1 1 103 1
2 2 4 8 4 3 14 I 8 7 2 4 6 7 71
L
NOTE: Indicated By NAV System - off flag, warning signal, data display inconsistency etc.
Not Indicated By NAV System - the opposite of indicated by NAV system
Not Initially Indicated By Primary NAV System - anomaly discovered upon reverting to raw (analog) data
The data for Table 9 was selected from the flightcrew's comments contained in the narrative of
each incident report. Row one is self-explanatory, but rows two and three suggest the possibility
of data transfer problems from analog to digital or the processing of the digital data respectively.
Two significant questions about PEDs remain--which systems have been affected and which
PEDs have been associated with anomalies. The first question is addressed in the next chart and
in Table 1 I.
15

8/8/2019 PEDs and Interference
http://slidepdf.com/reader/full/peds-and-interference 18/28
Engine Fuel
SYSTEMS THAT WERE AFFECTED
Chart 10. Aircraft systems affected by PEDs
Speed Brake Auto
Table 10. Aircraft systems affected by PEDs
- 1986 198'7 1988] 1989] 1990 I 1991 1992 1993 1994 1995 1996 1997 1998 1999 Totals
_ion 2 2 4 [ 6 ] 13 [ 7 3 20 14 I1 2 6 13 9 112
Communications ] 3 1 2 1 7
] 1 1 4 1 7
1 1
A utopilot ....
Ya_v Dampers
Engine Fuel
Controller
Speed Brake Auto
Autothrottles
Totals 2 2 6 6 13171
1 ]
1 1
1 1
6 21 18 18 2 6 13 10 130
Chart 10's significance is the order of magnitude higher that navigation systems above all other
systems were affected by PED anomalies. The systems in this chart and table were identified in
ASRS report narratives and in some cases reflect incidents where more than one system had an
anomaly. Multiple anomalies explain why the total number of affected systems in this chart
exceeds the total number of incidents reported in Chart 1. Greater detail on affected systems is
provided in the following table.
Table 1 l, page 17 and 18, not only lists each system affected by an anomaly, but also lists that
system's corresponding responses. Each line item, 1-86, represents one incident report. This
table's significance is its side-by-side comparison of systems responses with incident severity
and phase of flight.
16

8/8/2019 PEDs and Interference
http://slidepdf.com/reader/full/peds-and-interference 19/28
Table 1 I. Detailed system responses to onboard PED operations
Degree Phase
of of
Anomaly Event Year Severity Flight
i OMEGA NAV on autopilot 5 nm off course;
2 VOR, DME, RNAV sho;ved on course; 'ATCradar showed 12 mi offcourse;
1986 LS Cm
1986 LS Cru
3 VOR repetitive full scale fight deflections;1987 LS Cru
4 VOR both displayed fail flag: squeal for ident;1987 LS Cru
5 VOR CDI 3 - 4 degree split with Capt.'s left & FO's right; ATC radar showed 4 mi fight of course; 1988 C Cru
6 autopilot & yaw dampers uncommanded disengagement; FMGC & air data computer displays lost; 1988 C Cru
7 CDI frequent needle swings; ATC radar showed 3 mi off course; 19'89 LS T/O
8 VOR needle swings;1989 LS Cru
9 VOR track off 23 degrees by ATC radar; magnetic compass 40 degree swings;1989 LS Cru
10 VOR severe deflection to fight; 1989 LS Cm
I 1 VOR intermittent to complete loss of signal; 1990 LS Cru
12 VOR very erratic needle swings left & right; intemfittent flag on /off; 1990 N/R Cru
13 NAV CDIs erratic; 1990 N/R Cru
1_ _OR indicated incorrect station passage; fluctuation to / f rom flag;1990 LS Cru
15 HSI & RMI indicate on course; false lock onto VOR causes 80 nm error in NAVAID location; ATC radar shows N/R Cru
90 deg offcourse; 1990
16 EFIS HSI discrepancy right & left sides;1990 C Ldg
17 CDI & compass 5 - 10 swings left & right; 8 nm offcourse;1990 LS Cru
.18 VOR & RNAV (OMEGA) unreliable;1991 N/R Cm
19 VOR & OMEGA unreliable; ATC radar showed off course several miles; 1991 LS Cru
20 HSI indicated 60 degree difference from whiskey (magnetic) compass1991 LS T/O
21 cockpitindicated on course;courseindicatorbarleft & righttwo needle widths; ATC mdarshows 3-5 ufioff LS Cru
course; 1991
22 Capt.'s & FO's 1LS needles fluctuated 1 1/2 dots opposite of each other;1992 C Ldg
23 heard same music on 132.95 all radios;1992 LS Cm
24 heard static on 124.5; 2nd acft heard same;
25 com 2 loud squeal; couldn't receive; ultimately lost corn 1 & 2; couldn't xmit or receive;
1992 N/R Cru
1992 C T/G
26 VOR indicated on course; ATC radar showed off course;1992 LS Cru
27 HSI & compass 55 degree difference;1992 LS T/O
28 HSI indicated on course; ATC radar showed 7 mi off course;1993 C Cru
29 VORs loss of both with fail flag & full needle deflection; no audio signal;1993 C Cm
30 lost all directional gyros except whiskey (ma,g, netic) compass; then VORs & RMIs lost;1993 C Cm
31 VOR indicated on course; ATC said off course by 7 rim; # 1 compass I 0 - 15 degrees in error;1993 C Cru
32 both sets of LOC & GS (ILS) flags appeared in Capt.'s & FO's displays; during 2nd approach flags were C
intermittent; audio ident had interference on both missed approaches; 1993
Ldg
33 EFIS displays blanked; indicated "missed approach fail"; loss of all automatic NAV functions;1993 C T/O
_ LOCerratic with fulllefl deflection; 1993 C Ldgcompass precessed 10 degrees right; 1993 C Cru
1993 C Cru
1993 C T/O
36 I OMEGA NAV off course;
37 ] HDG flag & AHRS warning on both EHSIs; 20 degree error between Capt.'s & FO's EHSls;
VOR indicated on course; ATC radar showed off course; INS in use; both NAV compasses differed by 40c Cru
38 degrees with the wet (magnetic) compass;1993
39 radio communications lost temporarily due to interference; 1993 I LS Ldg
40 FMS showed on course; ATC radar showed off course 13 mi; next NAVAID FMS indicated 7 mi off course and LS Cru
# 1 and # 2 INSs agreed; # 3 INS agreed with NAV radios as on course;
1993
41 EHSI indicated on course; ATC showed 7 mi off course;42 VORs indicated on course; ATC showed off course;
1993 N/R Cm
1994 LS Cm
43 left engine uncommanded roll back to less than idle;1994 C Gnd
44 both pilot's cockpit displays indicated on course; ATC radar showed off course by 10 mi; event happened a LS Cru
second lime; 1994
45 radar altimeter off flag displayed; both pilots heard static on com radios; 1994 C TIO
46 LOC & GS showed on course, but visual observation by flightcrew showed well left of course;1994 C Ldg
47 VOR (CDI) erratic deviations left & fight;1994 C Cm
48 autopilot uncommanded 30 degree fight turn twice;1994 C Ldg
49 HSIs indicated on course; ATC showed 15 degrees left of course; 1994 C Cru
17

8/8/2019 PEDs and Interference
http://slidepdf.com/reader/full/peds-and-interference 20/28
50 during ILS apch with CDI centered acft is right of course; correction made; at breakout with LOC & GS centered C Ldg
acft appears high; then noted erratic CDI and GS; 1994
51 compass# I & # 2 differed by 15 degrees twice; 1994 C Cru
52 radio altimeter indicated 900 ft when aircraft was al 13,0fl0 ft; GPWS sounded 'too low'; 1994 LS T/O
53 loss of ILS signal with LOC & GS off flags displayed; go around; 1994 C Ldg
54 LOC erratic with left & right drifts from coupe; go around performed followed by uneventful landing; 1995 LS Ldg
55 AD1 display disappeared; "ATT fail" displayed on CRT; FLT director bars crossed and centered; RDM1 displa),ed
all 3 off flags; FO's ND displayed "ATT and HI)G fail"; F/vIA displayed "'no autoland";
56 uncommanded 15 degree left then right turns; FO's HSI and RMI slewing left and right 70 degrees of HDG;
1995
C Ldg
LS Ldg
additional shallow left and right turns; Capt. 's inst ruments unaffected: 1995
57 i LOC # 1 s elected ADI & HSI full left and right deflections; LOC # 2 operated normally; 1995 LS Ldg
58 autopilot uncommanded descent 300 ft; speedbrake uncommanded extension 3/4 full & cycled I/2 to 3/4; C Cru
resistance felt during manual retract; control gained with electronic yoke t rim; ACFT manual ly flown at descent;
during manual retraction of speedbrake noisy thump as lever passed auto anued detent: specdbrakc is fly by wire; t995
59 alternating flashing amber HDG and horizon lights; lost autopilot and aulothrollles; CAPT no FLT director bars C Ldg
or RDMI; FO no primary flight display, but had flight direc!or barsj.. 1995
60 Capt.'s and FO's VOR signal incorrect; intermittent red flag; CD1 needle left and right swings 20 - 30 degrees off LS
course; audible signal interference; 1995
T/L
6t during coupled autopilot approach using all 3 autopilots FLC noticed ACFT left of RNWY; autopilots
disconnected even though they indicated aircraft was centered on course;
C Ldg
1995
62 uncommanded FLT mgmt annunciator went from "pitch = vertical speed" & "autothrottles = speed" to "ALT C
hold" and "vertical speed ann in pitch"; aircraft pitched down I0 degrees; lost 500 ft; 1996
Ldg
63 FMSs went independent of each other; upon landing maintenance check found 20 mi FMS error in spite of FLC's LS
updating FMS when ever .05 - .07 error was noticed; 1996
Ldg
64 difficult)' centering HSI; 8 degree needle split HSI between CAPT & FO: split increased to 15 degrees; 1996 LS Ldg
65 EICAS displayed caution message *EF1S COMP MON' due to disagreement of HDG indicators; 'EFIS coMP' ' LS TIO
MON' displayed due to airspeed indicator's 10 knots difference; message displayed again due to difference in
altimeters and airspeed indicators; FO's instruments reliable in each case; 1997
66 cockpit instruments indicated on course; ATC radar showed 7 mi off course; 1997 LS TIO
67 erroneous VOR / CDI readings; 1997 LS T/O
68 Capt.'s TLS, radio altimeter, and PFD went out; 1997 C T/O
69 FO's CDI fluctuating on all VORTAC stations used; CAPT using F_C. for NAV had no.problem+s; 1998 c Cru
70 NAV CDI fluctuations; 1998 LS Cru
71 both VORs erratic; 1998 LS Ldg
7_ during takeoffGPWS low terrain alert followed by major FMS map shift ofabout 30mi; 1998 C T/O
73 both ADF needles either didn't move or were 40 - 50 degrees in error; 1998 C Cru
74 CDI full deflection left; corrected; drifted left again; CDI & flight director fluctuating right 8 - 10 degrees; 1998 LS Cru75 TCAS I1 false TA; 1998 LS Cru
76 Capt.'s radar altimeter flag intermittently displayed; TCAS 1I annunciated 'TCAS 11fail' ;
77 tone in headsets (confirmed NOKIA mobile phone); NAV and SPD modes disengaged; FLT director command
1998 LS Ldg
N/R Ldg
bars removed; FMS and short range NAV systems not reliable; 1999
78 FLT mode annunciator displayed "HDG error" and "no Autoland'" messages; 30 degree split between left and C
right HDG systems using # 2 CADC; # 1 CADC agreed with standby compass; 1999
T/O
79 # 1 NAV receiver erratic with intemfittent display of to / from flag; 1999 LS Cru
80 VOR CDI erratic + / - 5 degrees; 1999 C Cru
8 t Ix'MS locked up; NAV display & PFD flickered then went blank; RTE and performance data dumped; # I LS Cru
MCDU inop; 1999
82 uncommanded right turn; autopilot tripped with alarm; ILS flag; command bars lost; LOC signal lost; 1999 LS Ldg
83 radar altimeter flag displayed; GPWS & TCAS 11 annunciated 'fail'; VORs flagged; 1999 C Cru
84 VOR 30 degree needle difference between # I and # 2; DME and CDI Capt and FO agreed wilh GFMS and C T/O
# I VOR; 1999
85 radar altimeter flagged; TCAS I1 & GPWS annunciated 'fail'; 1999 C Cm
86 FO's VOR receiver no signal or ident; Capt.'s VOR okay; both tuned to ._ame VOR;
NOTE: See page 19 for applicable abbreviations and acronyms
1999 LS Cm
18

8/8/2019 PEDs and Interference
http://slidepdf.com/reader/full/peds-and-interference 21/28
Abbreviations for Table 1I
acft - aircraft; ALT - altitude; apch - approach; auto - automatic; C - critical; Capt - Captain;
com- communications; COMP - computer; cru - cruise; FLC - Flightcrew; FO - First Officer;
gnd - ground; HDG - heading; ident - Identification; inop - inoperative; ldg - landing: L/S -
less severe; MAG-magnetic; MON
-monitor; N/R
-not reported; nm - nautical miles; rnwy
- runway; rte - route; spd - speed; T/G - takeoff / ground; T/O - takeoff; xmit - transmit;
Acronyms for Table 11
ADI - Attitude direction indicator
AHRS - Attitude-heading reference system
ATC - Air Traffic Control
CADC - Central Air Data Computer
CDI - Course Deviation Indicator
DME - Distance Measuring Equipment
EFIS - Electronic Flight Instrument System
EHSI - Electronic horizontal situation indicator
EICAS - Engine indicating and crew alerting system
FMA - Flight mode annunciation: speed, roll and altitude are the major control functions;
FMGC - Flight management and guidance computer
FMS - Flight management system
GFMS - GPS Flight Management System
GPWS - Ground Proximity Warning System
GS - Glide SlopeHSI - Horizontal Situation Indicator
ILS - Instrument Landing System
INS - Inertial Navigation System
LOC - Localizer receiver and indicator
MCDU - Multifunction control display unit: entry of flight plan, monitoring and revision
NAV - Navigation Receivers
NAVAID - Navigational Aid
OMEGA - A very-low-frequency navigation system
PFD - Primary flight display
RDMI - Radio Distance Magnetic Indicator
RMI - Radio Magnetic Indicator
RNAV - aRea NAVigation
TCAS - Traffic Alert and Collision Avoidance System
TA - Traffic advisory (TCAS)
VOR - VHF Omni directional Receiver
The remaining charts, beginning with Chart 12, identify which PEDs have been associated with
anomalies.
19

8/8/2019 PEDs and Interference
http://slidepdf.com/reader/full/peds-and-interference 22/28
,D
_,=
O
E
Z
PEDs THAT AFFECTED AIRCRAFT SYSTEMS
Chart 12. PEDs affecting aircraft systems
Table 12. PEDs affecting aircraft systems
1986 1987
Cell Phone
Laptop Computer t
PED Not Identified ,v 1
Electronic Game
Tape Player/Recorder 3 2Radio 1 [ 1
CD Pla]cer
Panzer
Digital Movie Player _ "
Dictaphone
Calculator
Portable Television
Personal Digital Ass istant
Totals 5 4
1988 1989
4 4 9
1990
2
2
1
1
12
1991 1992 1993 1994 1995 1996 1997 1998 1999 Totals
I 3 5 5 l 2 2 4 25
I 2 6 3 2 1 3 4 25
2 5 2 1 2 14
I 4 4 2 13
2 1 1 1 131 1 3 12
1 1 1 I I 1 7
2 1 3
2 2
1
1 1
1 1
1 1
5 8 21 15 9 2 5 II 15 118
* Incident reports where a general passenger cabin announcement w as made request ing al le lect ronic devices be mined off and resulted in aircraft
systems returned to normal
! PED Not Ident if ied Category is similar to suspected PED interference events in Bruce Donham's article• A ll other categories on this sheet
correspond to apparent and strong PED correlation events in Mr. Donham's art icle. Reference for article is: gkctronic Interference from
Passenger - Carried Portable Electronic Devices by Bruce Donham, Principal Engineer and Designated Engineering Representative,
Electromagnetic Effects and Antennas, Boeing Commercial Airplanes Group;
http:/Iwww.aerospaceonline.com/contentlnews/article.asp?DoclD= {64ESCA I 1-0708 - 11D4-8C31-009027DE0829 }&Bucket=Current+Features
Chart 12 specifically reflects all PEDs identified in the ASRS database. Clearly, based on their
frequent association with anomalies, celt phones and laptops are prime candidates for PED
testing. This observation also holds true for the next two charts.
20

8/8/2019 PEDs and Interference
http://slidepdf.com/reader/full/peds-and-interference 23/28
Chart 13. PEDs associated with critical anomalies on aircraft systems
"U¢=,
O
_3e_
E
Z
18
16
14
12
10
8
6
16
1+ ii!2 "!
0 -- "_ --
15
i:!
i!:ii
i i
98
54
, + + [] m D
1
Chart 14. PEDs associated with less severe anomalies on aircraft systems
With very few exceptions, it is evident from Charts 13 and 14 that PEDs associated with critical
events were also associated with less severe events and visa versa. The only exceptions were
digital movie players, Dictaphones, and palm pilots• Although cell phones and laptops were most
frequently identified throughout the charts, as a minimum all PEDs associated with criticalevents need to be thoroughly evaluated in order to determine their part in aircraft system's
anomalies.
21

8/8/2019 PEDs and Interference
http://slidepdf.com/reader/full/peds-and-interference 24/28
Table [3. PEDs associated with critical anomalies on aircraft systems
Phone
L a_p
Electronic Game
1986 1987 1988 1989 11990
I 1
PED N ot Identif ied
Radio=
Tape Player/Recorder
CD Pla,;er
Por table Television
Calculator
Totals
1991
0 0 4 0 I 1 0
1992 1993 1994 1995 1996 1997 1998 Totals
2 6 3 2 1 15
2 5 3 2 2 14
2 2 3 1 8
1 3 3 1 8
3 5
1 1 1 4
t 1 3
1 1
1 1
7 20 13 7 1 1 5 59
Table 14. PEDs associated with less severe anomalies on aircraft systems
Phone
1986.=
Lapto p 1 ...
Tape PlayerlRecorder I
PED N ot Identif ied
Radio I
Electronic Game
CD Player
Pager
Dictaphone
Personal D igital A ssistant
Totals 3
1987 1988
11
1
3 ,3
1989 1990 1991 1992 1993 1994 1995 1996 1997 1998 1999
I 2 1 1 1 2 I 1 2 1
2 1 1 I I 1 1
2 l 21 1 2 I 2
1 3 I
1 1 1 1 1
1 I 1
3
1
I
6 fO 4 2 4 3 4 2 4 7 5
Totals
13
9
88
7
5
4
3
1
1
59
It is also obvious in Charts 13 and 14 how significantly each anomaly event affected aircraft
equipment in regards to safety of flight. Severity of an event is defined on page 5.
The remaining charts, 15 through 21, are detailed breakdowns of the PED categories in Chart 12
and reflect any PEDs specifically identified by model or manufacturer. Specifically identified
devices may be prime starting points for testing.
NOTE: All specific manufacturer's names and models of PEDs in Tables 15-21 are as recorded in ASRS Reports. This
information should not be construed to imply these devices have been tested by NASA and found to be in any way
problematic.
Table 15. PED - phone
Cellular Phone
i'qokia
Totals
19861198711988 1989 1990[1991 I 1992 1993 1994 1995 1996 1997 1998 1999 Totals
2 1 3 5 5 1 2 2 3 24
1 1
2 1 3 5 5 1 2 2 4 25
Table 16. PED - Laptop
L_gP
ImpoSed Clone
Toshiba Model 1060 CT
Totals
1986 1987] 1988 1989 1990 1991 1992 1993 1994 1995 1996 1997 1998 1999 Totals
1 I 2 1 2 5 2 2 1 3 4 23
1 1 1
1 , I1 2 1 2 6 3 2 1 3 4 25
22

8/8/2019 PEDs and Interference
http://slidepdf.com/reader/full/peds-and-interference 25/28
NOTE: All specific manufacturer's names and models of PEDs in Tables 15-21 are as recorded in ASRS Reports. This
information should not be construed to imply these devices have been tested by NASA and found to be in any way
problematic.
Table 17. PED - Electronic games
Game Bo)"
Video G ame
Nintendo Electronic Game
Electronic Chess Player
Game Bo)'s w /Cable
Electronic G ame
Totals
1986 1987 1988 1989 1990 1991 1992 1993 1994 1995 1996 1997 1998 1999 Totals
1 1 2 1 5
2 1 3
1 1 2
1 1
1 I
1 1
1 1 3 4 2 I 13
FM Radio
AM/FM/Cassette
Walkman
AM-FM Recorder 1
AM Radio 1
HI: Marine Radio 1
Radio
Totals 1 1 2
Table 18. PED - Radios
1986 1987 1988 1989 1990 1991 1992 1993 1994 1995 1996 1997 1998 1999 Totals
1 1 2 4
1 l 1
Il i .... I
I
1 2 1 l 3 I
3
2
1
1
1
12
Tape Recorder
Tape Player
Walkman Cassette
Totals
Table 19. PED- Tape players
1986 1987 1988 1989 1990 1991 1992 1993 1994 1995 1996 1997 1998 1999 Totals
3 2 5
I 1 1 1 4
1 1 1 1 4
3 2 1 I I 2 1 1 I 13
Table 20. PED - CD players
CDPla),er
KenwoodCD
Totals
1986 1987 1988 1989 1990 1991 1992 [ 1993 1994 1995 1996 1997 1998 1999 Totals
1 [ 1 1 1 1 1 6
]l 11 1 1 I 1 1 7
23

8/8/2019 PEDs and Interference
http://slidepdf.com/reader/full/peds-and-interference 26/28
NOTE: All specific manufacturer's names and models of PEDs in Tables 15-21 are as recorded in ASRS Reports. This
information should not be construed to imply these devices have been tested by NASA and found to be in any way
problematic.
Table 21. PED- Pagers, Dictaphone, Calculator, Portable Television
1986 1987 1988 1989 1990 1991 1992 1993 1994 1995] 1996 1997 1998 1999 Totals
Di_,ital Movie Player 2 2
Pa_.er I 1 2
Pa_er, Pronet 1 1
Dictaphone I 1
Calculator 1 1
Portable Television 1 1
i Palm Pilot 1 1
Totals 1 2 2 2 9
CONCLUSIONS
The data shows that a wide variety of PEDs are suspected of having caused anomalies with
aircraft systems. Although resolving the issue of PEDs interference is a complex task, the data
indicates that cell phones and laptops should be prime candidates for evaluation of their part in
anomalies. Additionally, the anomalies affected navigation systems 86 percent more often than
any other system on the aircraft. If these events were happening at cruise altitudes where a pilot's
workload is lower than for any other flight phase, they might not be cause for concern, but that is
not the case. The data clearly indicates that not only were some events judged as having had a
critical effect on a system, but they also happened during critical stages &flight specifically
landings and takeoffs. Research on single, multiple similar and multiple dissimilar devices and
their interaction with their environment may provide useful data on PEDs interference.
24

8/8/2019 PEDs and Interference
http://slidepdf.com/reader/full/peds-and-interference 27/28

8/8/2019 PEDs and Interference
http://slidepdf.com/reader/full/peds-and-interference 28/28
I Form ApprovedEPORT DOCUMENTATION PAGE OMB NO 0704-0188
Public reporting burden for this collection of information is estimated to average 1hour per response, inc lud ing the t ime for review ing ins truct ions, search ing ex is ting data
sou rces , ga ther ing and ma in taining the data needed, and complet ing and rev iew ing the co llect ion o f informat ion Send comments regarding this burden est imale or any other
aspect ofth is col lect ion of information, inc luding suggestions for reducing this bu rden , to Washing ton Headquar te rs Services, D irectorate for Informa tien Ope ra tions and
Reports, t215 Jeff er son Davis Highway, Sui te I204, Ar lingt on, VA 22202-4302, and to the Office of Management and Budget, Paperwork Reduction Pro ject (0704-0188) ,
Washingtonr DC 20503
1. AGENCY USE ONLY ( Leave blank ) 2. REPORT DATE 3. REPORT TYPE AND DATES COVERED
June 2001 Contractor Report
4. TITLE AND SUBTITLE 5. FUNDING NUMBERS
Portable Electronic Devices and Their Interference With Aircraft Systems
6. AUTHOR(S)
Elden Ross
7. PERFORMING ORGANIZATION NAME(S) AND ADDRESS(ES)
ViGyan, Inc.
30 Research Drive
Hampton, VA 23666
9. SPONSORING/MONITORING AGENCY NAME(S) AND ADDRESS(ES)
National Aeronautics and Space Administration
Langley Research Center
Hampton, VA 23681-2199
C NASI-96014
WU 706-62- ] I-01
8. PERFORMING ORGANIZATION
REPORT NUMBER
10. SPONSORING/MONITORINGAGENCY REPORT NUMBER
NASA/CR-2001-2 i0866
11.SUPPLEMENTARY NOTES
Langley Technical Monitor: Jay J. El)
12a. DISTRIBUTION/AVAILABILITY STATEMENT
Unclassified-Unlimited
Subject Category 33 Distribution: Standard
Availability: NASA CASI (301) 621-0390
12b. DISTRIBUTION CODE
13. ABSTRACT (Maximum 200 words)
A compilation of data on personal electronic devices (PEDs) attributed to having created anomalies with aircraft
systems. Charts and tables display 14 years of incidents reported by pilots to the Aviation Safety Reporting
System (ASRS). Affected systems, incident severity, sources of anomaly detection, and the most frequently
identified PEDs are some of the more significant data. Several reports contain incidents of aircraft off course
when all systems indicated on course and of critical events that occurred during landings and takeoffs.
Additionally, PEDs that should receive priority in testing are identified.
14. SIJB,JECT TERMS
Personal Electronic Devices; ASRS; Portable Electronic Devices; PED; Aircraft;
Interference; EMI
17. SECURITY CLASSIFICATION 18. SECURITY CLASSIRCATION 19. SECURITY CLASSIFICATION
OF REPORT OF THIS PAGE OF ABSTRACT
Unclassified Unclassified Unclassified
15- NUMBER OF PAGES
29
16. PRICE CODE
A03
20. LIMITATION
OF ABSTRACT
UL