Embed Size (px)
Citation preview
7/30/2019 PEBB Survey 2012
http://slidepdf.com/reader/full/pebb-survey-2012 1/32
Overview of results from the
2012 PEBB BRFSSSurvey of State Employees
Results presented on December 18, 2012 to the
Public Employees’ Benefit Board (PEBB) Board Meeting
Stacey Schubert, MPH
[email protected], phone: 971/673-1099Health Promotion and Chronic Disease Prevention,
Oregon Public Health Division
Bdatt.6_PEBB2012BRFSS20121218
7/30/2019 PEBB Survey 2012
http://slidepdf.com/reader/full/pebb-survey-2012 2/32
What is the “BRFSS?”
• Stands for “Behavioral Risk Factor Surveillance System”(pronounced \ 'bur fus\)
• Cross-sectional telephonic survey of Oregon adults
• Conducted continuously since 1988• Questions about health behaviors, risk factors and chronic
diseases
• Mainstay of chronic disease surveillance
Bdatt.6_PEBB2012BRFSS20121218

7/30/2019 PEBB Survey 2012
http://slidepdf.com/reader/full/pebb-survey-2012 3/32
What is the “BRFSS Surveyof State Employees?”
• Designed and supported by OEBB, PEBB and PublicHealth Division
• Contains questions on:
– Demographics – Chronic diseases
– Risk behaviors
– Worksite policies and environments that can influencehealthful choices
Bdatt.6_PEBB2012BRFSS20121218
7/30/2019 PEBB Survey 2012
http://slidepdf.com/reader/full/pebb-survey-2012 4/32
What is the “BRFSS Survey
of State Employees?”• Initial surveying was started in 2005.
• Have now added 2007, 2009 and 2012.
• OEBB members added as an analysis group in 2009
• PEBB members include employees of: – State agencies
– Oregon University System
Bdatt.6_PEBB2012BRFSS20121218
7/30/2019 PEBB Survey 2012
http://slidepdf.com/reader/full/pebb-survey-2012 5/32
Who was surveyed?
• Inclusion Criteria:
– Employees as of March 2, 2012
• Exclusion Criteria:
– Excludes retirees and people receiving insurance post-employment (COBRA)
– Missing or incomplete residential telephone number
Bdatt.6_PEBB2012BRFSS20121218
7/30/2019 PEBB Survey 2012
http://slidepdf.com/reader/full/pebb-survey-2012 6/32
What were survey
respondents like?
Bdatt.6_PEBB2012BRFSS20121218
7/30/2019 PEBB Survey 2012
http://slidepdf.com/reader/full/pebb-survey-2012 7/32
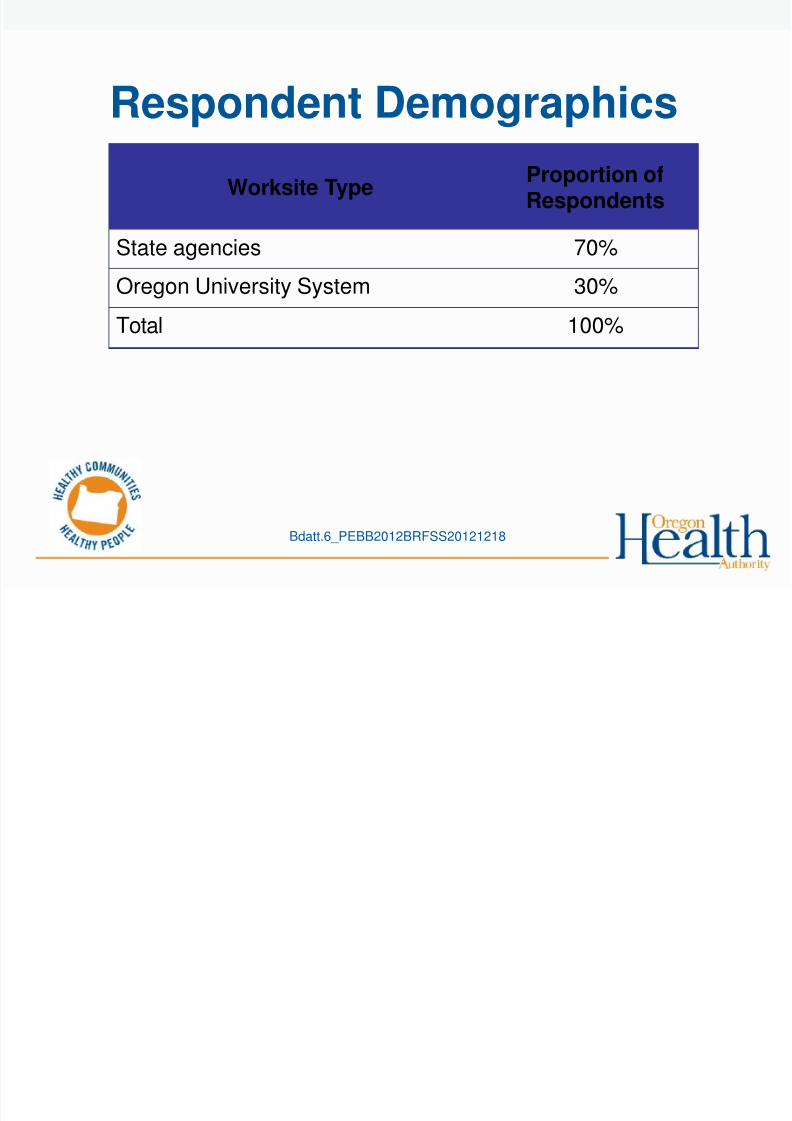
Respondent Demographics
Worksite Type Proportion ofRespondents
State agencies 70%
Oregon University System 30%
Total 100%
Bdatt.6_PEBB2012BRFSS20121218
7/30/2019 PEBB Survey 2012
http://slidepdf.com/reader/full/pebb-survey-2012 8/32
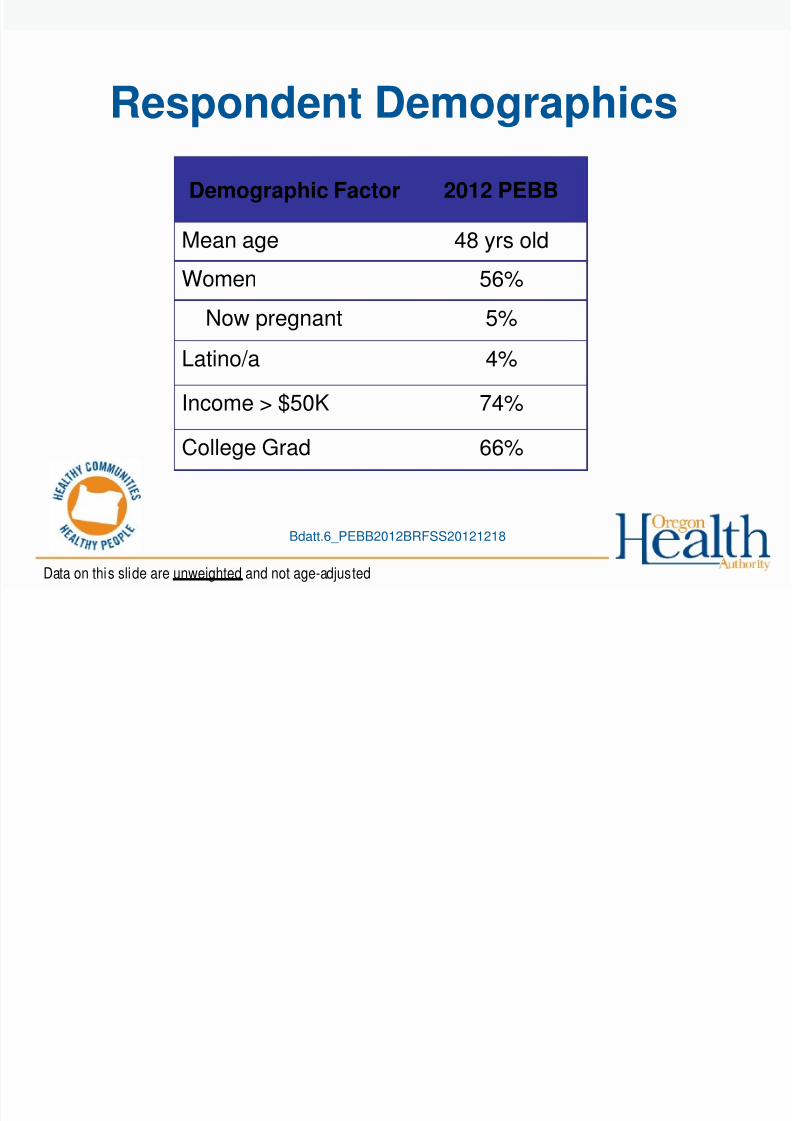
Respondent Demographics
Demographic Factor 2012 PEBB
Mean age 48 yrs old
Women 56%
Now pregnant 5%
Latino/a 4%
Income > $50K
74%College Grad 66%
Data on this slide are unweighted and not age-adjusted
Bdatt.6_PEBB2012BRFSS20121218

7/30/2019 PEBB Survey 2012
http://slidepdf.com/reader/full/pebb-survey-2012 9/32
Respondent Demographics by
EmployerOUS Agencies
Mean age 47 yrs 49 yrs
Women 52% 58%
Now pregnant 5% 5%
Latino/a 4% 4%
Income > $50K
74% 74%College Grad 83% 55%
Data on this slide are unweighted and not age-adjusted
Bdatt.6_PEBB2012BRFSS20121218

7/30/2019 PEBB Survey 2012
http://slidepdf.com/reader/full/pebb-survey-2012 10/32
What are
the results?
Bdatt.6_PEBB2012BRFSS20121218
7/30/2019 PEBB Survey 2012
http://slidepdf.com/reader/full/pebb-survey-2012 11/32
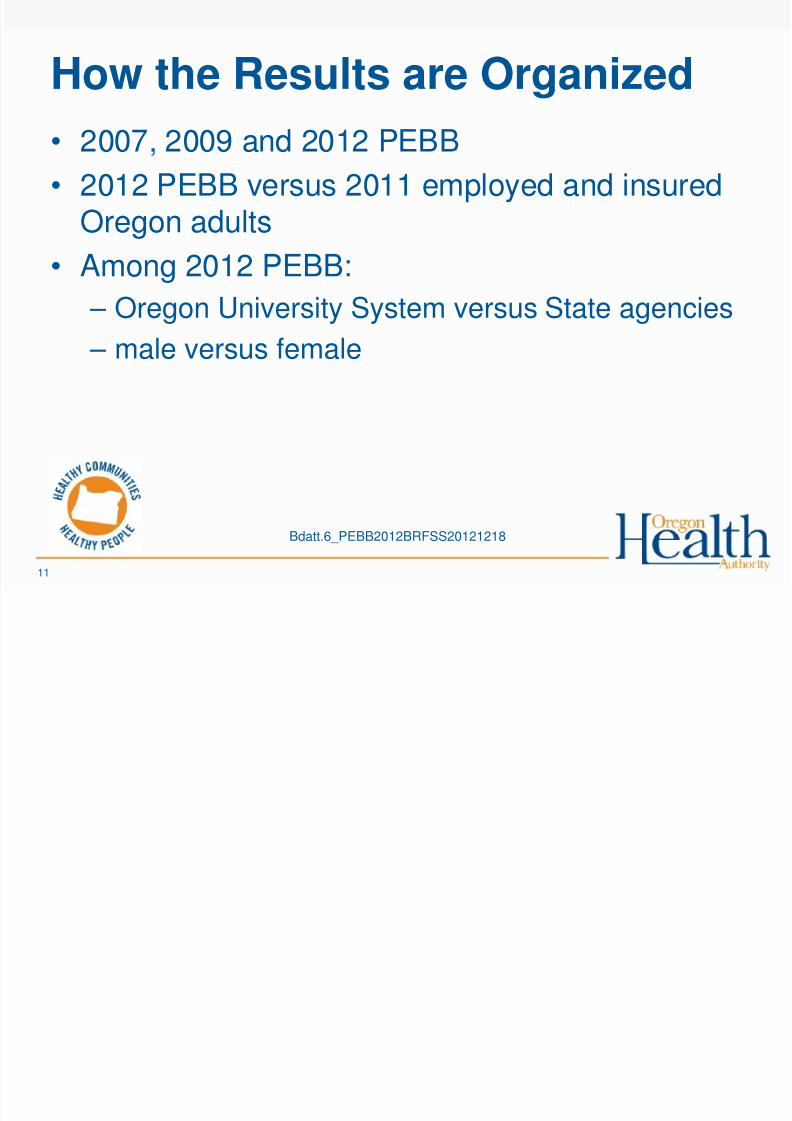
How the Results are Organized
• 2007, 2009 and 2012 PEBB• 2012 PEBB versus 2011 employed and insured
Oregon adults
• Among 2012 PEBB: – Oregon University System versus State agencies
– male versus female
11
Bdatt.6_PEBB2012BRFSS20121218
7/30/2019 PEBB Survey 2012
http://slidepdf.com/reader/full/pebb-survey-2012 12/32
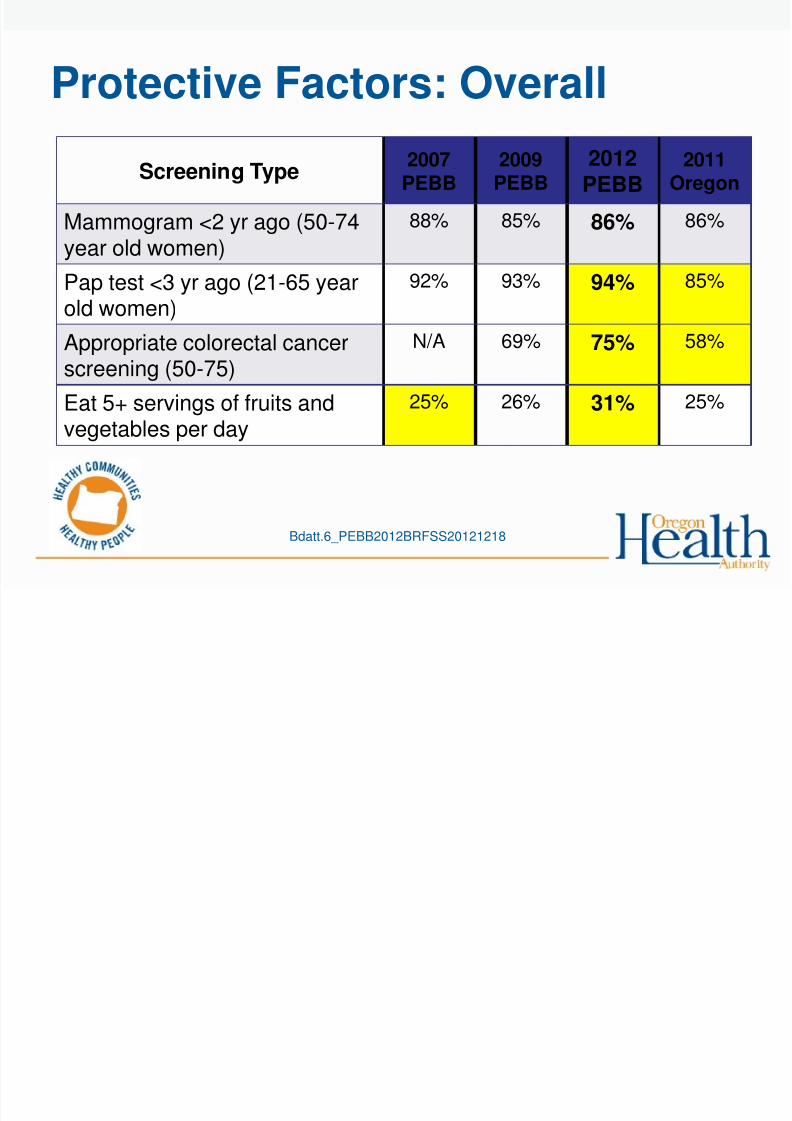
Protective Factors: Overall
Screening Type 2007PEBB
2009PEBB
2012PEBB 2011
Oregon
Mammogram <2 yr ago (50-74year old women)
88% 85% 86% 86%
Pap test <3 yr ago (21-65 yearold women)
92% 93% 94% 85%
Appropriate colorectal cancerscreening (50-75)
N/A 69% 75% 58%
Eat 5+ servings of fruits andvegetables per day
25% 26% 31% 25%
Bdatt.6_PEBB2012BRFSS20121218
7/30/2019 PEBB Survey 2012
http://slidepdf.com/reader/full/pebb-survey-2012 13/32
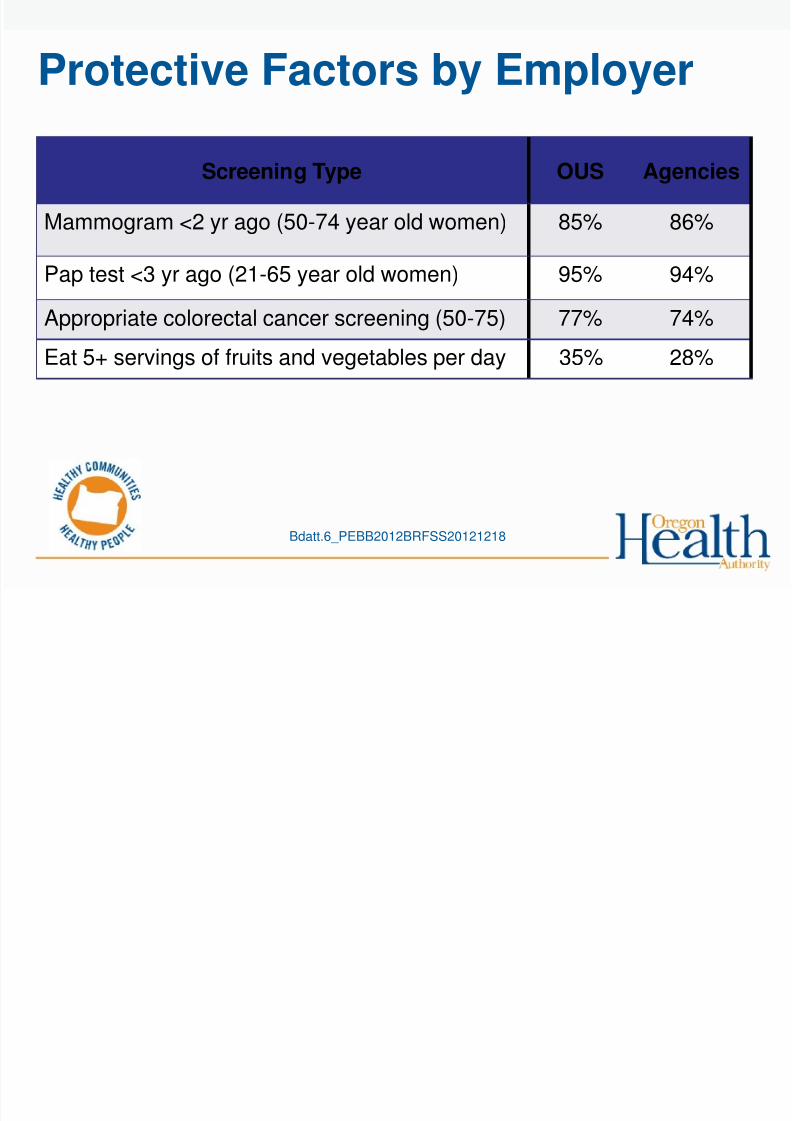
Protective Factors by Employer
Screening Type OUS Agencies
Mammogram <2 yr ago (50-74 year old women) 85% 86%
Pap test <3 yr ago (21-65 year old women) 95% 94%
Appropriate colorectal cancer screening (50-75) 77% 74%
Eat 5+ servings of fruits and vegetables per day 35% 28%
Bdatt.6_PEBB2012BRFSS20121218
7/30/2019 PEBB Survey 2012
http://slidepdf.com/reader/full/pebb-survey-2012 14/32
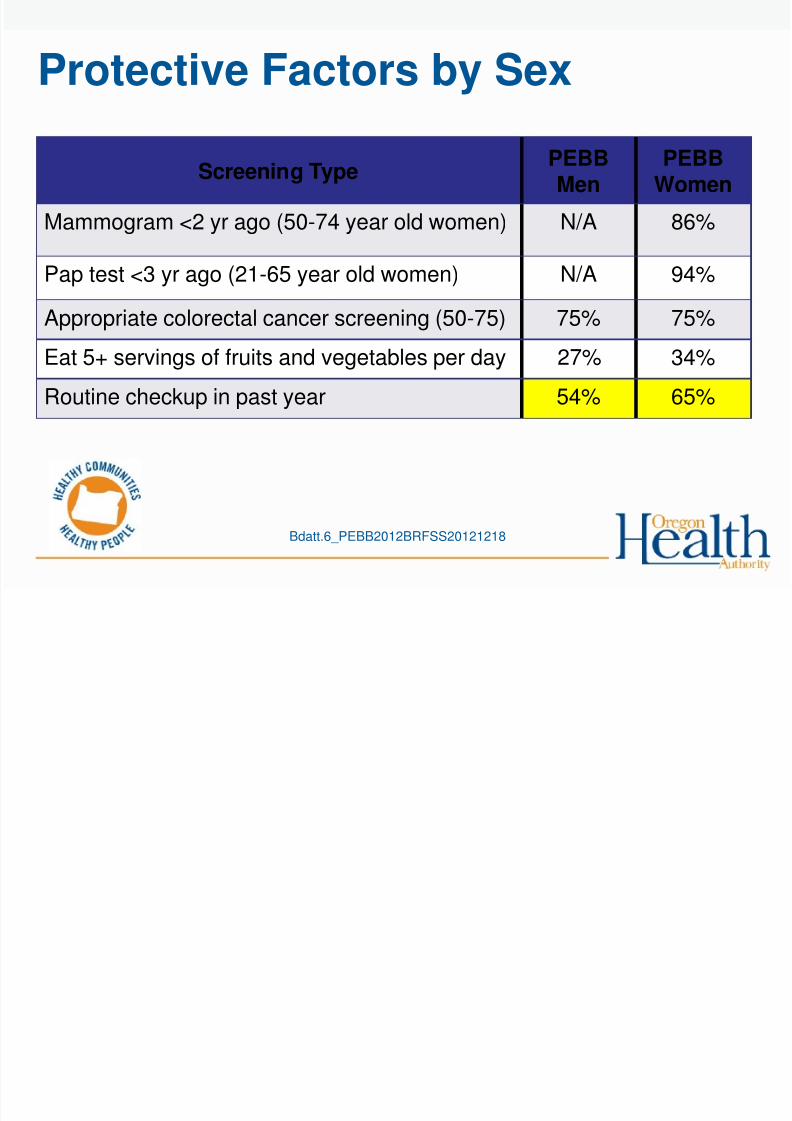
Protective Factors by Sex
Screening Type PEBBMen
PEBBWomen
Mammogram <2 yr ago (50-74 year old women) N/A 86%
Pap test <3 yr ago (21-65 year old women) N/A 94%
Appropriate colorectal cancer screening (50-75) 75% 75%
Eat 5+ servings of fruits and vegetables per day 27% 34%
Routine checkup in past year 54% 65%
Bdatt.6_PEBB2012BRFSS20121218
7/30/2019 PEBB Survey 2012
http://slidepdf.com/reader/full/pebb-survey-2012 15/32
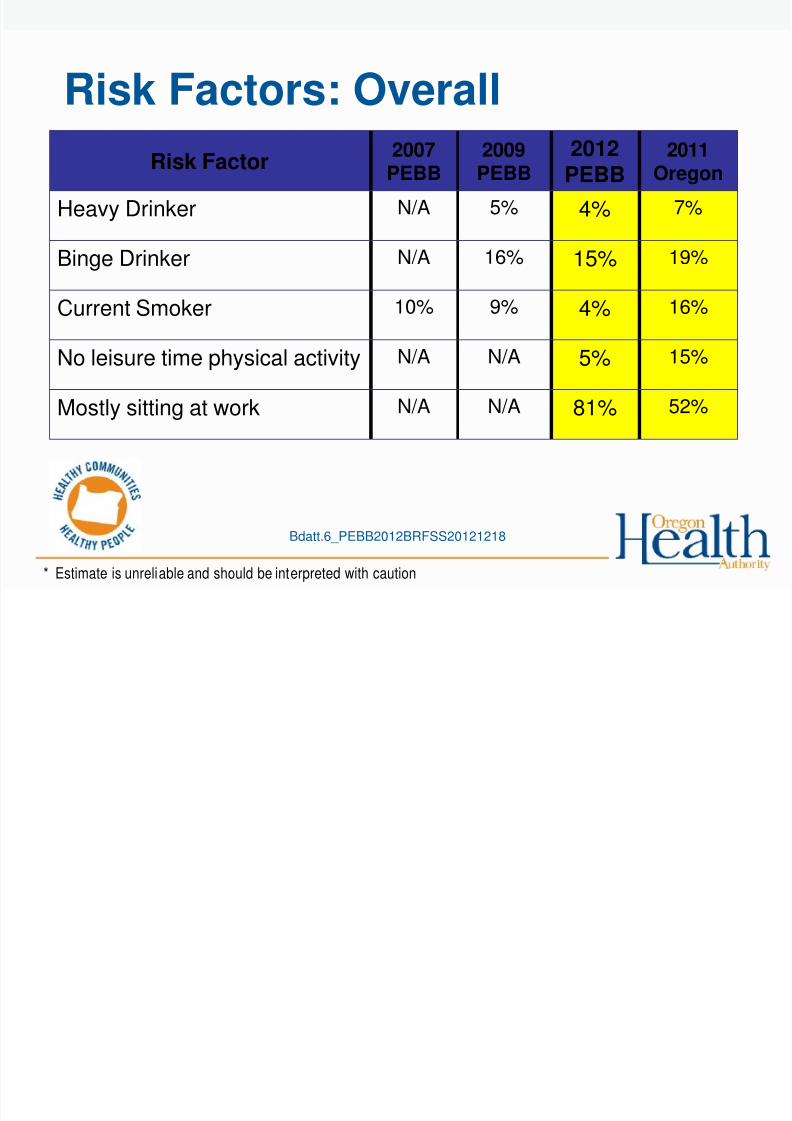
Risk Factors: Overall
Risk Factor 2007
PEBB
2009PEBB
2012PEBB
2011Oregon
Heavy Drinker N/A 5% 4% 7%
Binge Drinker N/A 16% 15% 19%
Current Smoker 10% 9% 4% 16%
No leisure time physical activity N/A N/A 5% 15%
Mostly sitting at work N/A N/A 81% 52%
* Estimate is unreliable and should be interpreted with caution
Bdatt.6_PEBB2012BRFSS20121218

7/30/2019 PEBB Survey 2012
http://slidepdf.com/reader/full/pebb-survey-2012 16/32
Risk Factors by Employer
Risk Factor OUS Agencies
Heavy Drinker 5% 3%
Binge Drinker 15% 14%
Current Smoker 3% 4%
No leisure time physical activity 4% 6%
Mostly sitting at work 77% 84%
* Estimate is unreliable and should be interpreted with caution
Bdatt.6_PEBB2012BRFSS20121218
7/30/2019 PEBB Survey 2012
http://slidepdf.com/reader/full/pebb-survey-2012 17/32
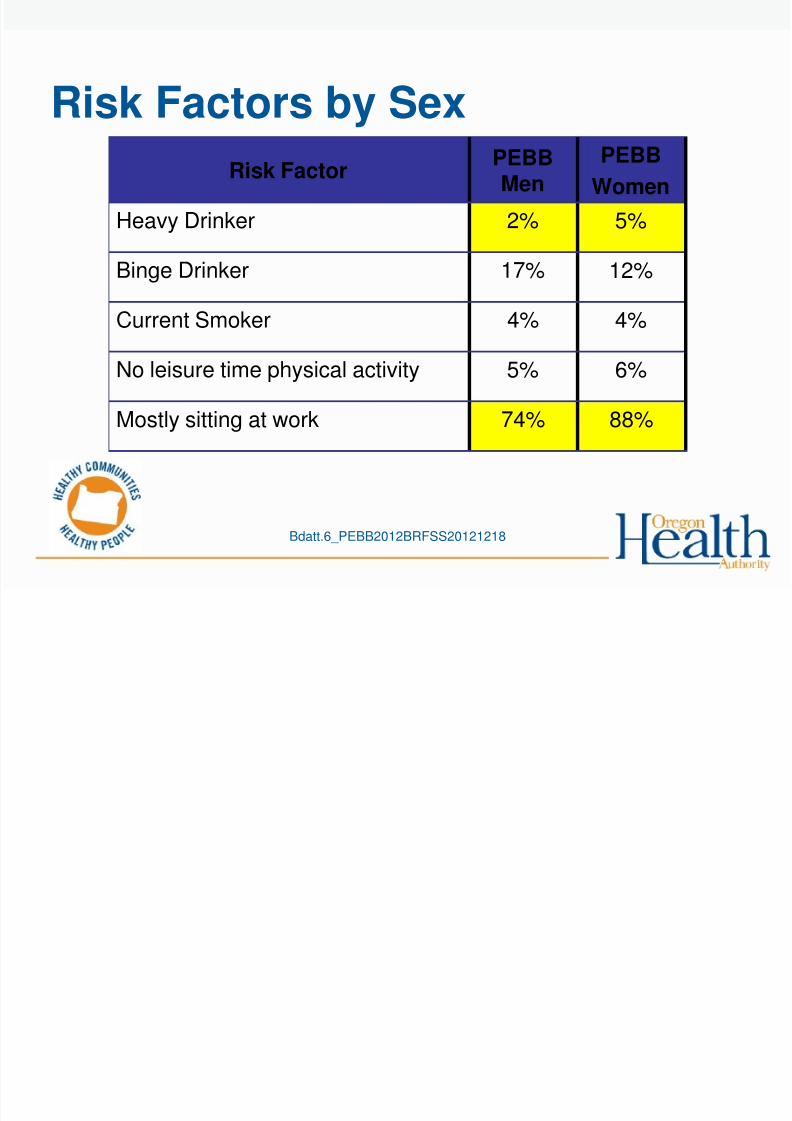
Risk Factors by Sex
Risk Factor PEBBMen
PEBB
Women
Heavy Drinker 2% 5%
Binge Drinker 17% 12%
Current Smoker 4% 4%
No leisure time physical activity 5% 6%
Mostly sitting at work 74% 88%
Bdatt.6_PEBB2012BRFSS20121218
7/30/2019 PEBB Survey 2012
http://slidepdf.com/reader/full/pebb-survey-2012 18/32
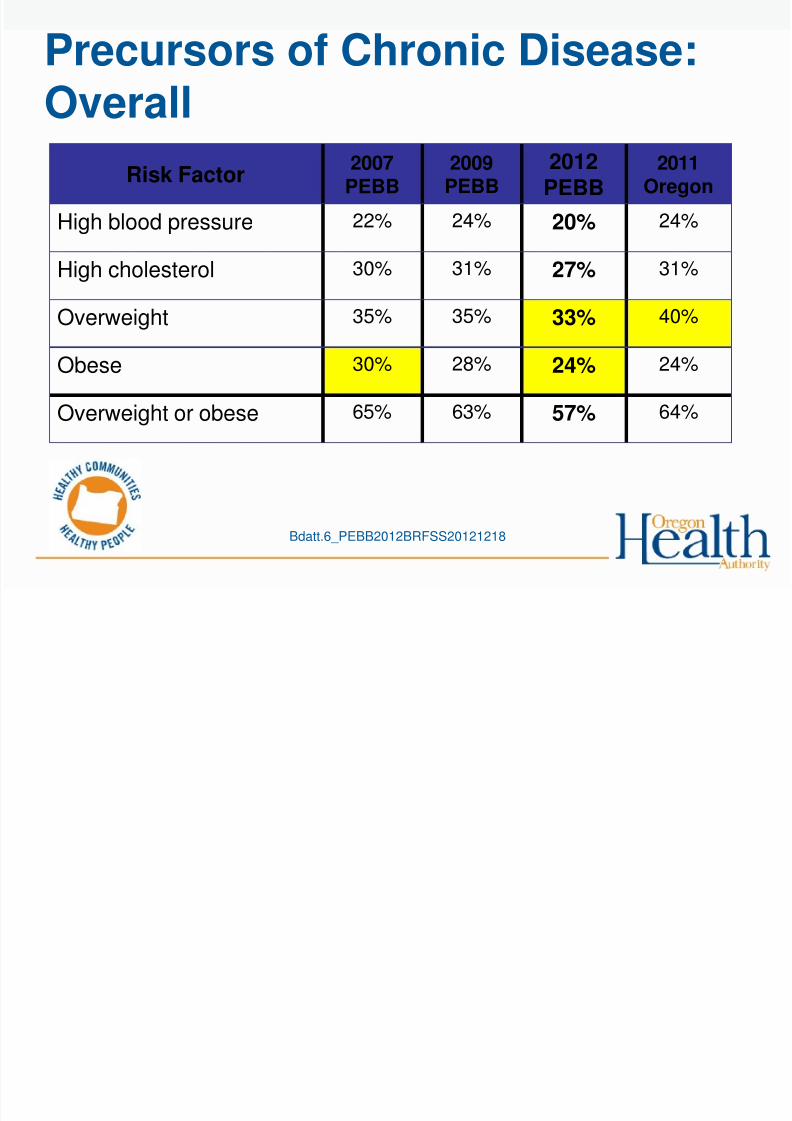
Precursors of Chronic Disease:Overall
Risk Factor 2007
PEBB 2009PEBB
2012PEBB 2011
Oregon
High blood pressure 22% 24% 20% 24%
High cholesterol 30% 31%
27% 31%
Overweight 35% 35% 33% 40%
Obese 30% 28% 24% 24%
Overweight or obese 65% 63% 57% 64%
Bdatt.6_PEBB2012BRFSS20121218
7/30/2019 PEBB Survey 2012
http://slidepdf.com/reader/full/pebb-survey-2012 19/32
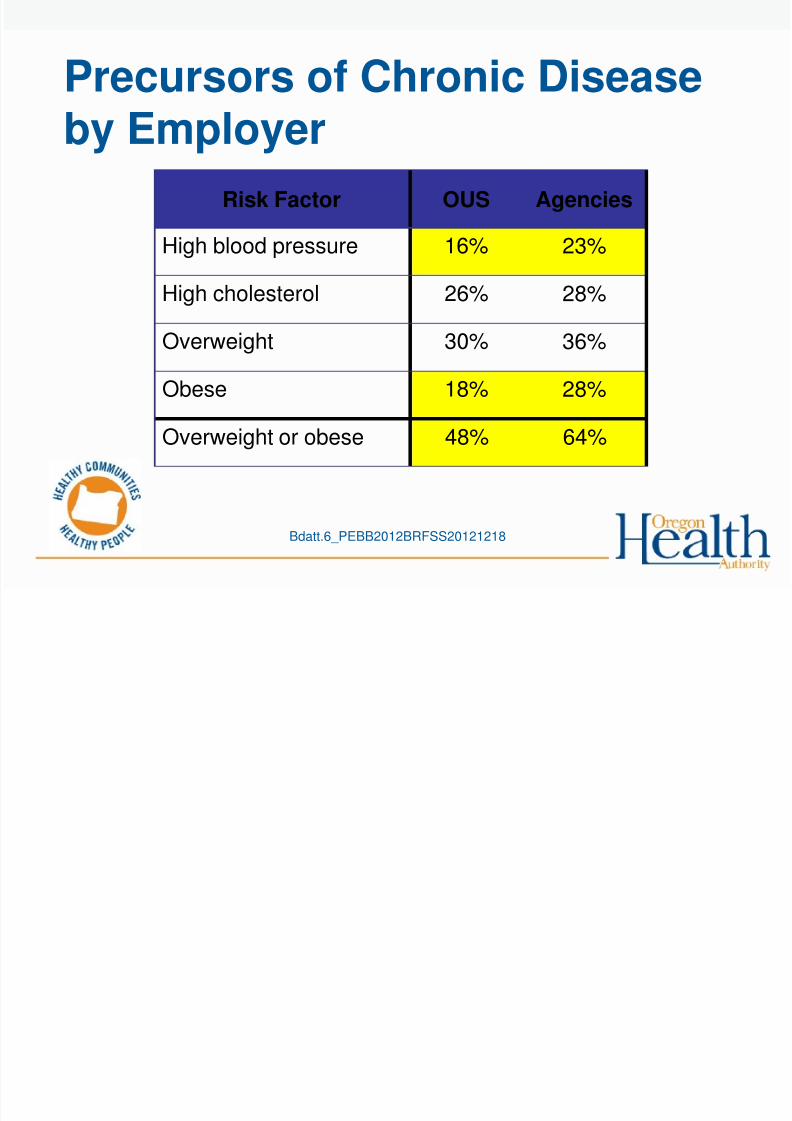
Precursors of Chronic Disease
by EmployerRisk Factor OUS Agencies
High blood pressure 16% 23%
High cholesterol 26% 28%
Overweight 30% 36%
Obese 18% 28%
Overweight or obese 48% 64%
Bdatt.6_PEBB2012BRFSS20121218

7/30/2019 PEBB Survey 2012
http://slidepdf.com/reader/full/pebb-survey-2012 20/32
Precursors of Chronic Disease
by SexRisk Factor
PEBBMen
PEBBWomen
High blood pressure 24% 16%
High cholesterol 30% 25%
Overweight 40% 27%
Obese 24% 24%
Overweight or obese 64% 51%
Bdatt.6_PEBB2012BRFSS20121218
7/30/2019 PEBB Survey 2012
http://slidepdf.com/reader/full/pebb-survey-2012 21/32
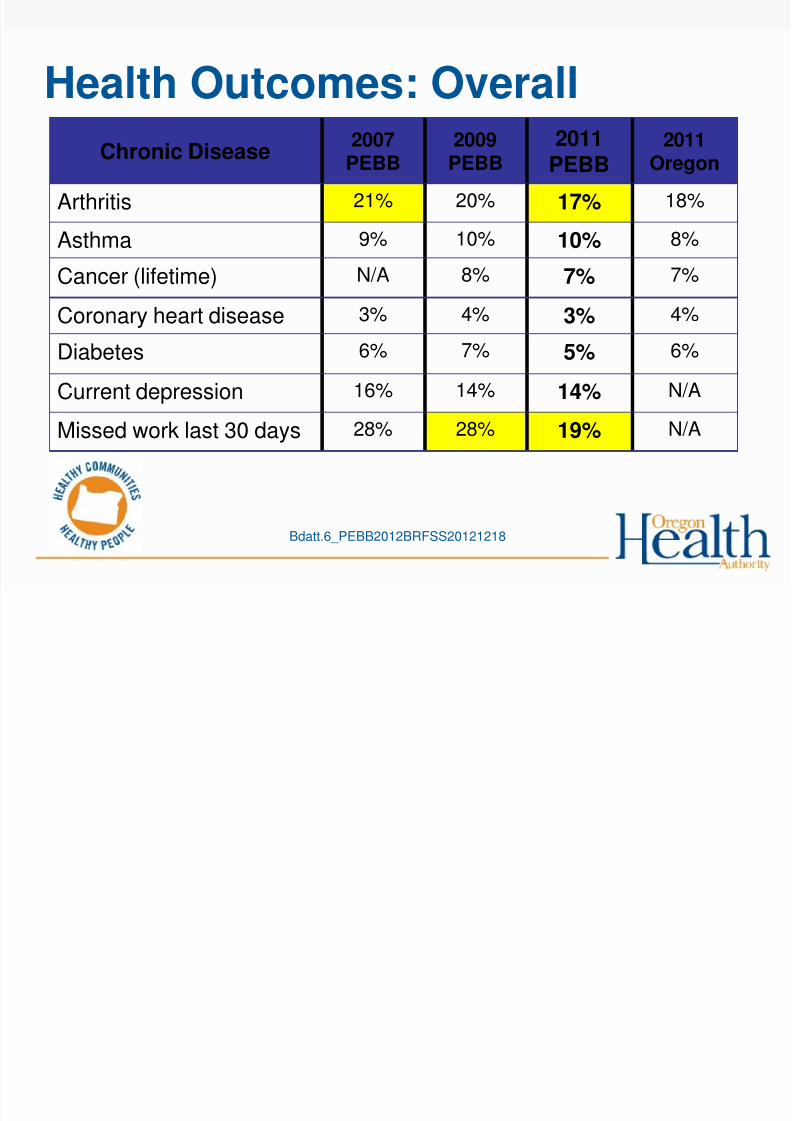
Health Outcomes: Overall
Chronic Disease 2007PEBB
2009PEBB
2011PEBB 2011
Oregon
Arthritis 21% 20% 17% 18%
Asthma 9% 10% 10% 8%
Cancer (lifetime) N/A 8% 7% 7%
Coronary heart disease 3% 4% 3% 4%
Diabetes 6% 7% 5% 6%
Current depression 16% 14% 14% N/A
Missed work last 30 days 28% 28% 19% N/A
Bdatt.6_PEBB2012BRFSS20121218
7/30/2019 PEBB Survey 2012
http://slidepdf.com/reader/full/pebb-survey-2012 22/32
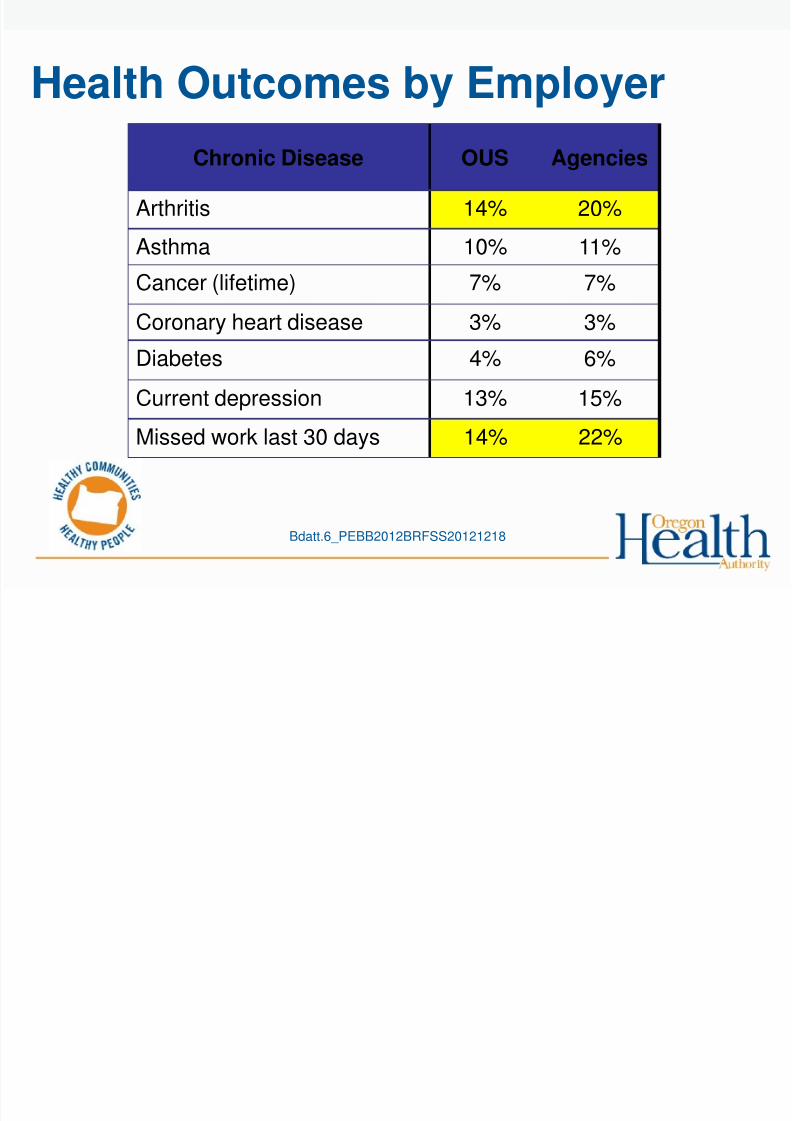
Health Outcomes by Employer
Chronic Disease OUS Agencies
Arthritis 14% 20%
Asthma 10% 11%
Cancer (lifetime) 7% 7%
Coronary heart disease 3% 3%
Diabetes 4% 6%
Current depression 13% 15%
Missed work last 30 days 14% 22%
Bdatt.6_PEBB2012BRFSS20121218
7/30/2019 PEBB Survey 2012
http://slidepdf.com/reader/full/pebb-survey-2012 23/32
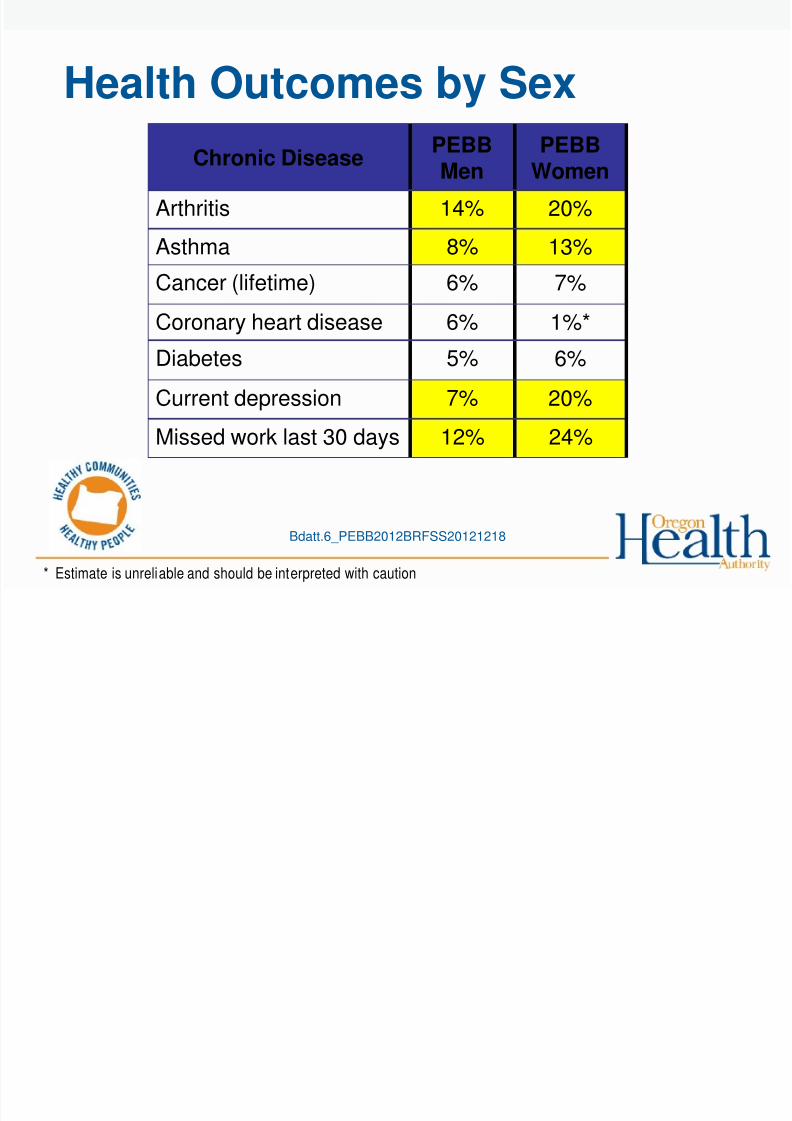
Health Outcomes by Sex
Chronic Disease PEBBMen
PEBBWomen
Arthritis 14% 20%
Asthma 8% 13%
Cancer (lifetime) 6% 7%
Coronary heart disease 6% 1%*
Diabetes 5% 6%
Current depression 7% 20%
Missed work last 30 days 12% 24%
* Estimate is unreliable and should be interpreted with caution
Bdatt.6_PEBB2012BRFSS20121218
7/30/2019 PEBB Survey 2012
http://slidepdf.com/reader/full/pebb-survey-2012 24/32
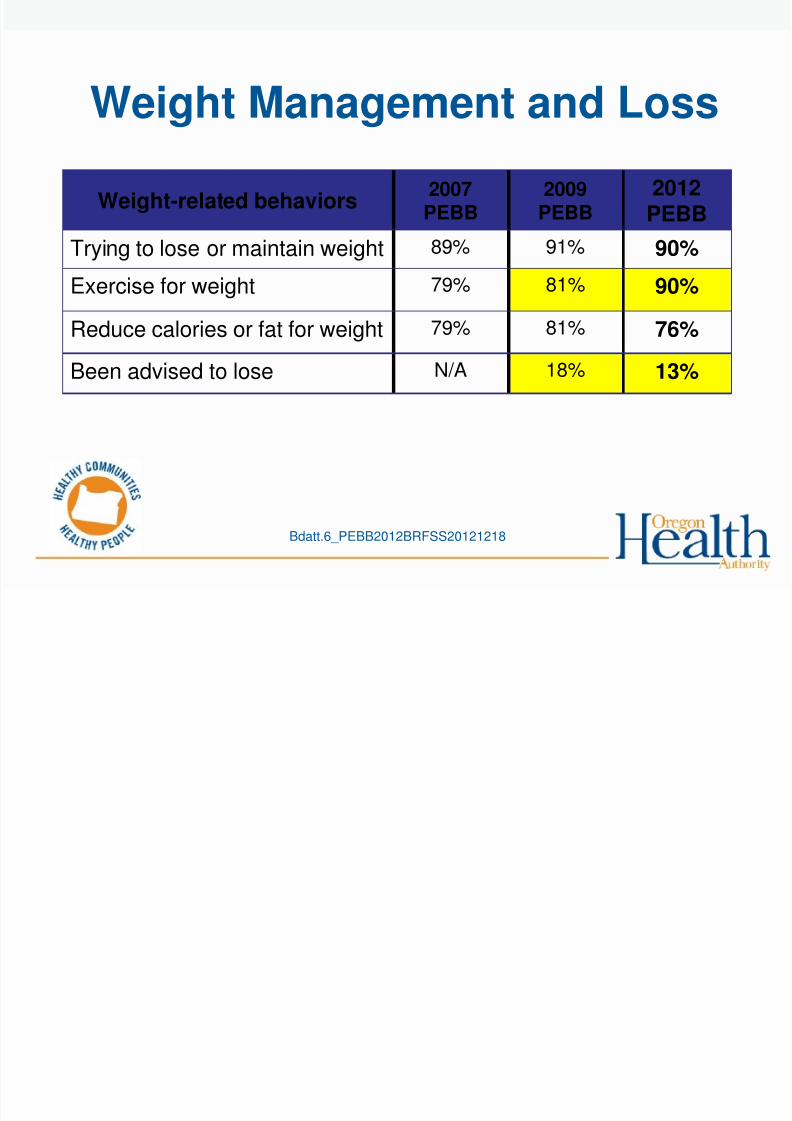
Weight Management and Loss
Weight-related behaviors 2007PEBB
2009PEBB
2012PEBB
Trying to lose or maintain weight 89% 91% 90%
Exercise for weight 79% 81% 90%
Reduce calories or fat for weight 79% 81% 76%
Been advised to lose N/A 18% 13%
Bdatt.6_PEBB2012BRFSS20121218
7/30/2019 PEBB Survey 2012
http://slidepdf.com/reader/full/pebb-survey-2012 25/32
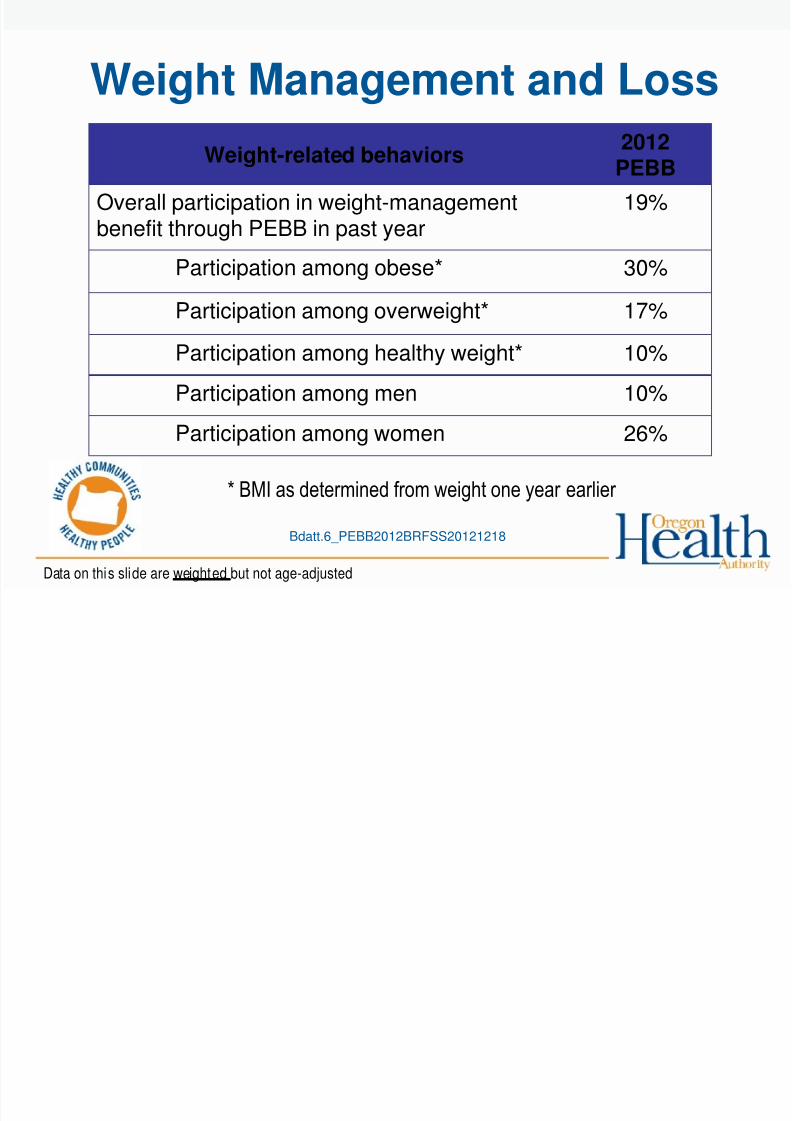
Weight Management and Loss
Weight-related behaviors 2012PEBB
Overall participation in weight-managementbenefit through PEBB in past year
19%
Participation among obese*
30%Participation among overweight* 17%
Participation among healthy weight* 10%
Participation among men 10%
Participation among women 26%
Data on this slide are weighted but not age-adjusted
* BMI as determined from weight one year earlier
Bdatt.6_PEBB2012BRFSS20121218
7/30/2019 PEBB Survey 2012
http://slidepdf.com/reader/full/pebb-survey-2012 26/32
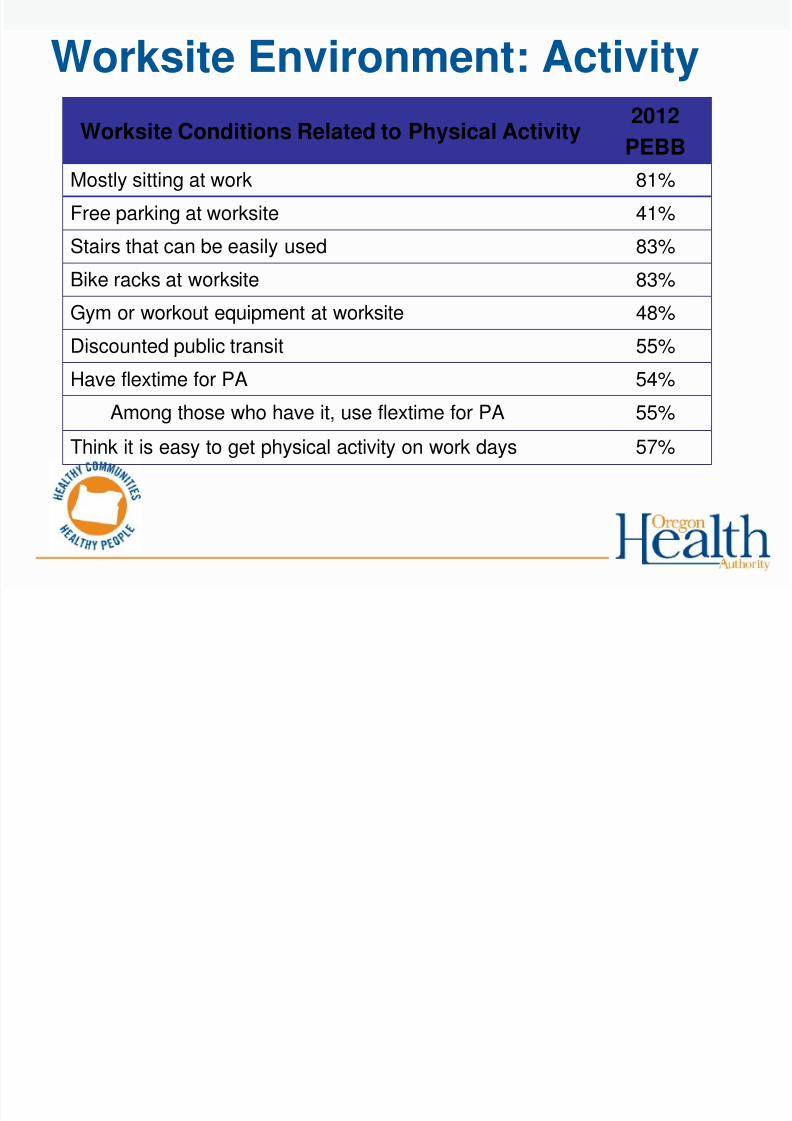
Worksite Environment: Activity
Worksite Conditions Related to Physical Activity
2012
PEBB
Mostly sitting at work 81%
Free parking at worksite 41%
Stairs that can be easily used 83%
Bike racks at worksite 83%Gym or workout equipment at worksite 48%
Discounted public transit 55%
Have flextime for PA 54%
Among those who have it, use flextime for PA 55%Think it is easy to get physical activity on work days 57%
7/30/2019 PEBB Survey 2012
http://slidepdf.com/reader/full/pebb-survey-2012 27/32
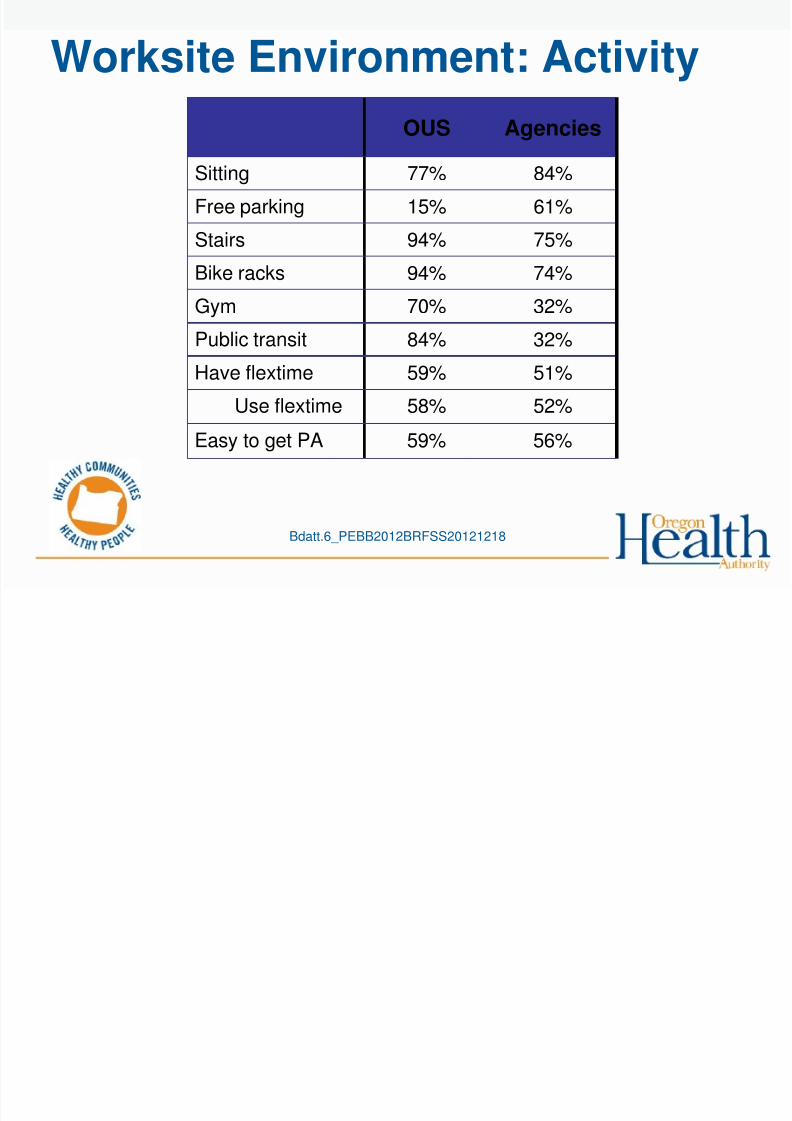
Worksite Environment: Activity
OUS Agencies
Sitting 77% 84%
Free parking 15% 61%
Stairs 94% 75%
Bike racks 94% 74%Gym 70% 32%
Public transit 84% 32%
Have flextime 59% 51%
Use flextime 58% 52%
Easy to get PA 59% 56%
Bdatt.6_PEBB2012BRFSS20121218
7/30/2019 PEBB Survey 2012
http://slidepdf.com/reader/full/pebb-survey-2012 28/32
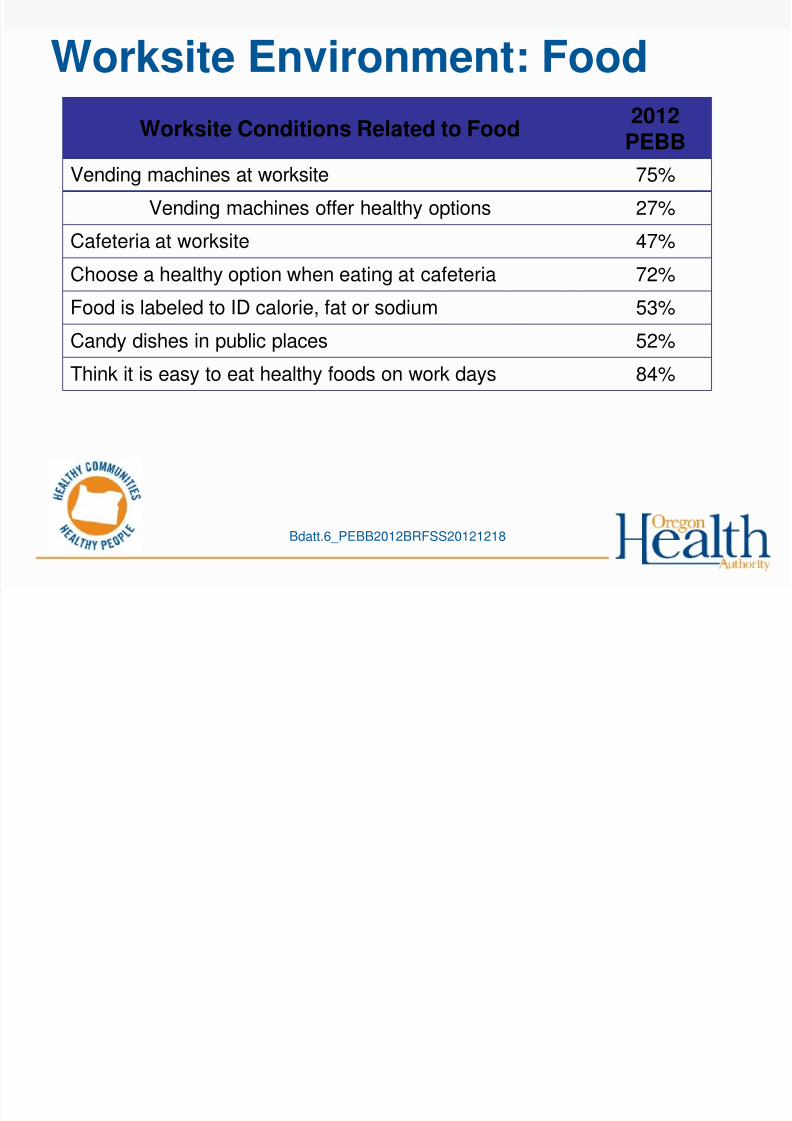
Worksite Environment: Food
Worksite Conditions Related to Food 2012
PEBB
Vending machines at worksite 75%
Vending machines offer healthy options 27%
Cafeteria at worksite 47%
Choose a healthy option when eating at cafeteria 72%Food is labeled to ID calorie, fat or sodium 53%
Candy dishes in public places 52%
Think it is easy to eat healthy foods on work days 84%
Bdatt.6_PEBB2012BRFSS20121218

7/30/2019 PEBB Survey 2012
http://slidepdf.com/reader/full/pebb-survey-2012 29/32
Worksite Environment: Food
OUS Agencies
Vending machines 70% 79%
Vending healthyoptions
24% 30%
Cafeteria 62% 36%
Choose healthyoption
76% 70%
Food is labeled 60% 48%
Candy dishes 48% 54%
Easy to eat healthy 87% 82%
Bdatt.6_PEBB2012BRFSS20121218
7/30/2019 PEBB Survey 2012
http://slidepdf.com/reader/full/pebb-survey-2012 30/32
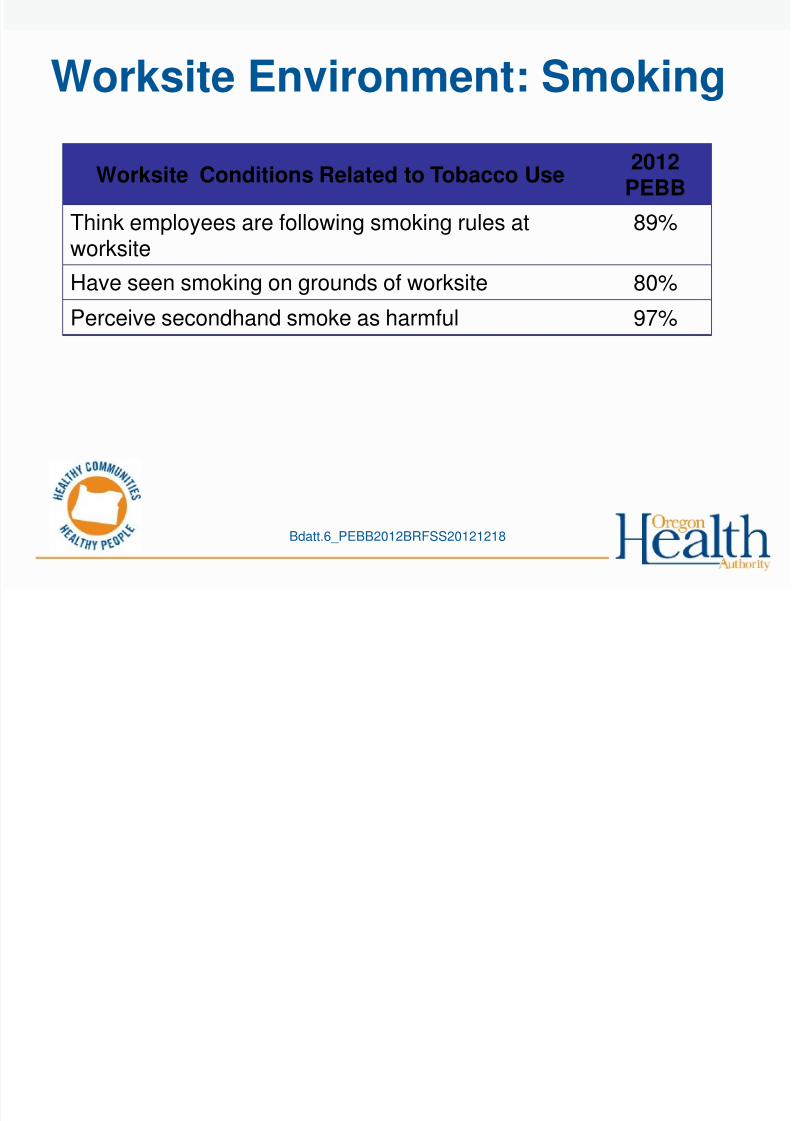
Worksite Environment: Smoking
Worksite Conditions Related to Tobacco Use 2012
PEBB
Think employees are following smoking rules atworksite
89%
Have seen smoking on grounds of worksite 80%
Perceive secondhand smoke as harmful 97%
Bdatt.6_PEBB2012BRFSS20121218

7/30/2019 PEBB Survey 2012
http://slidepdf.com/reader/full/pebb-survey-2012 31/32
Worksite Environment: Smoking
OUS Agencies
Rules followed? 89% 89%
Seen smoking 84% 77%
SHS harmful 96% 98%
Bdatt.6_PEBB2012BRFSS20121218

7/30/2019 PEBB Survey 2012
http://slidepdf.com/reader/full/pebb-survey-2012 32/32
Thank youStacey Schubert, MPH
[email protected], phone: 971/673-1099
Health Promotion and Chronic Disease Prevention,
Oregon Public Health Division
Bdatt.6_PEBB2012BRFSS20121218