Embed Size (px)
Citation preview

University of Plymouth
PEARL https://pearl.plymouth.ac.uk
Faculty of Science and Engineering School of Engineering, Computing and Mathematics
2015-06-01
A Robust Bearing Fault Detection and
Diagnosis Technique for Brushless DC
Motors Under Non-stationary Operating
Conditions
Abed, W
http://hdl.handle.net/10026.1/3638
10.1007/s40313-015-0173-7
Journal of Control, Automation and Electrical Systems
All content in PEARL is protected by copyright law. Author manuscripts are made available in accordance with
publisher policies. Please cite only the published version using the details provided on the item record or
document. In the absence of an open licence (e.g. Creative Commons), permissions for further reuse of content
should be sought from the publisher or author.

1 23
Journal of Control, Automation andElectrical Systemsformerly CONTROLE & AUTOMAÇÃO ISSN 2195-3880 J Control Autom Electr SystDOI 10.1007/s40313-015-0173-7
A Robust Bearing Fault Detection andDiagnosis Technique for Brushless DCMotors Under Non-stationary OperatingConditions
Wathiq Abed, Sanjay Sharma, RobertSutton & Amit Motwani

1 23
Your article is protected by copyright and
all rights are held exclusively by Brazilian
Society for Automatics--SBA. This e-offprint
is for personal use only and shall not be self-
archived in electronic repositories. If you wish
to self-archive your article, please use the
accepted manuscript version for posting on
your own website. You may further deposit
the accepted manuscript version in any
repository, provided it is only made publicly
available 12 months after official publication
or later and provided acknowledgement is
given to the original source of publication
and a link is inserted to the published article
on Springer's website. The link must be
accompanied by the following text: "The final
publication is available at link.springer.com”.

J Control Autom Electr SystDOI 10.1007/s40313-015-0173-7
A Robust Bearing Fault Detection and Diagnosis Techniquefor Brushless DC Motors Under Non-stationary OperatingConditions
Wathiq Abed · Sanjay Sharma · Robert Sutton ·Amit Motwani
Received: 12 May 2014 / Revised: 19 January 2015 / Accepted: 25 February 2015© Brazilian Society for Automatics–SBA 2015
Abstract Rolling element bearing defects are among themain reasons for the breakdown of electrical machines, andtherefore, early diagnosis of these is necessary to avoidmore catastrophic failure consequences. This paper presentsa novel approach for identifying rolling element bearingdefects in brushless DC motors under non-stationary oper-ating conditions. Stator current and lateral vibration mea-surements are selected as fault indicators to extract mean-ingful features, using a discrete wavelet transform. Thesefeatures are further reduced via the application of orthogo-nal fuzzy neighbourhood discriminative analysis. A recurrentneural network is then used to detect and classify the presenceof bearing faults. The proposed system is implemented andtested in simulation on data collected from an experimentalsetup, to verify its effectiveness and reliability in accuratelydetecting and classifying the various faults.
Keywords Fault diagnosis · Rolling bearing · Featureextraction · Feature reduction · Recurrent neural network
1 Introduction
Condition monitoring and fault diagnosis of electric motorsis necessary to optimise maintenance and improve reliabil-ity levels in critical applications such as in aircraft aileronsand rudders (Brown et al. 2009). Faults typically start off asmarginal defects which escalate over time.
W. Abed (B) · S. Sharma · R. Sutton · A. MotwaniSchool of Marine Science and Engineering, University of Plymouth,Plymouth, UKe-mail: [email protected]
Early fault detection and diagnosis (FDD) with conditionmonitoring renders it possible to perform important preven-tion actions, thereby avoiding economically damaging lossesof elements and parts, through an adequate maintenancemanagement system, as well as avoiding stalled production(Tavner 2008).
Bearing faults are common faults in electric motors andrepresent about 40–50 % of all motor faults (Jin et al. 2013).
The bearings of motors used in industrial applications aretypically subject to non-ideal conditions such as overloading,misalignment, electrical fluting and inadequate lubrication(Wu et al. 2013). A bearing structure consists of an inner andouter race, or ring with grooves, and a set of balls or rollingelements placed between these, as shown in Fig. 1. whereBd: The ball diameter, pd: The diameter of the bearing itmeasured from ball centre to opposite ball centre and β : Thecontact angle.
Bearing faults can be classified into two main categories:a single localised defect on a bearing surface, and a gener-alised roughness where a large area of the bearing surfacehas degraded and become irregular (Zhenyu et al. 2009).
The result of such defects is the continued loss of the geo-metric accuracy of the rolling contact surfaces, and gradualdeterioration of the bearing function, leading to increaseddeflection, friction, temperature and vibration.
Many techniques have been used for rolling element bear-ing fault diagnosis and can be classified depending on thetype of measurement involved. These can be, for example,vibration, temperature (Patil et al. 2010) or acoustic mea-surements (Delgado et al. 2011).
Vibration measurement is the most widely used and effec-tive way to detect rolling bearing faults, but does not give aclear indication of faults at low speed. Vibration can be pickedup from other mechanical parts, thus leading to false posi-tives. Furthermore, because vibration signals are related to all
123
Author's personal copy
J Control Autom Electr Syst
Outer race
Inner race
Rolling ball
Fig. 1 Main bearing design parameters
the mechanical elements, they only allow for fault detectionrather than fault diagnosis. In order to increase fault diagno-sis reliability, especially for critical applications, in additionto vibration, the stator current signal can be used as anotherfault indicator (Trajin et al. 2009).
It has been shown to be an effective rolling element bearingfault indicator, especially at low motor speeds (Immovilliet al. 2010). Moreover, the use of a current sensor does notnecessarily increase the cost of the system, as current sensorsalready form part of power protection circuits used in suchsystems (Bediaga et al. 2013).
Thus, the combined use of both vibration and current sig-nals will provide a more robust fault detection and diagnosissystem without a significant increase in cost, and this is theapproach used in this work.
From the measured vibration and current signals, the dis-crete wavelet transform (DWT) is used to obtain the bestfeatures from the signals. Wavelet transformations have beenshown to be a powerful tool for dealing with non-stationaryvibration signals. Kankar et al. (2011) presented two criteriato select the best wavelet features: the first of these is basedon using maximum energy-to-Shannon entropy ratio, whilethe second is based on maximum relative wavelet energy.
To reduce additional computational time for fault classifi-cation, an accurate dimensionality reduction tool is needed toselect the most informative features from the wavelet featureset. Different feature reduction methods such as principlecomponent analysis (PCA) (Zhang et al. 2013) and empiri-cal mode decomposition (EMD) (Camarena et al. 2014) havebeen used to reduce feature redundancy.
In this work, orthogonal fuzzy neighbourhood discrimi-nant analysis (OFNDA), mostly used in medical data analysisbut not previously used in electrical motor fault diagnosis sys-tems, is implemented as a new approach for feature reduction.Basically, OFNDA works to maximise the distance betweenfeatures belonging to different classes, while minimising thedistance between features in the same class (Khushaba et al.2010).
Recently, artificial intelligence (AI) has been introducedinto the fault diagnosis process for condition monitoring,
including techniques based on fuzzy logic (FL) (Xu et al.2009), neural networks (NN) (Mahammed and Hiyama2011), genetic algorithms (GA) (Samanta et al. 2004), adap-tive neuro fuzzy inference systems (ANFIS) (Yilmaz andAyaz 2009) and support vector machines (SVM) (Sugu-maran and Ramachandran 2011). AI aims to generate classi-fying expressions simple enough to be understood easily byhumans (Michie et al. 2009).
Diagnostics of electrical motors operating under constantspeed conditions have been extensively investigated in the lit-erature (Yang et al. 2002; Subhasis et al. 2005) and (Rao et al.2012). For example, artificial neural networks (ANN) pro-vide an excellent mathematical tool for modelling nonlinearsystems, and static multilayer perceptron (MLP) type ANNstrained using the Back- Propagation (BP) algorithm havebeen extensively applied for the fault detection task under sta-tionary operating conditions (Vachtsevanos and Wang 2001).
However, the response of a static network at any instant intime depends only on the value of the input sequence at thatsame time instant. In real-life applications, there are severalcircumstances where the motor is never operating at a con-stant speed or with a constant load, such as in automotive andaircraft applications (Sadough Vanini et al. 2014).
Dynamic neural networks (DNN) are more versatile thantheir static counterparts and provide the capability to learnthe dynamics of complicated nonlinear systems that con-ventional static neural networks cannot model (Xuhong andYigang 2005). DNNs have been successfully applied for faultdiagnosis (Hyun et al. 2010), and studies have shown thattheir use can improve the fault prediction accuracy of elec-tric motor condition monitoring systems.
The aim of the work presented here is to develop a newbearing FDD scheme for Brushless DC (BLDC) motors foruse in high performance applications, which can accuratelydetect faults in real time and provide useful information aboutthe same. In order to achieve this, the novel use of OFNDAfeatures containing meaningful information is fed to a DNN,to diagnose faults during motor operation.
Another novelty lies in the experimental tests carried outusing the aforementioned technique to recognise and clas-sify three different types of localised bearing faults: cracksin both inner and outer races, and crushed bearing-balls. Fur-thermore, while previous work has dealt with fault diagnosisunder stationary operating conditions, in the present workthe rolling element bearing faults are diagnosed under non-stationary load and motor speed conditions.
The technique developed here has also been used success-fully to diagnose unbalanced mechanical loads in trolling orpermanent magnet brushed DC motors (Abed et al. 2014) aswell as its used to diagnosis bearing fault sunder stationaryoperating conditions (Abed et al. 2014).
With regard to the structure and content of the paper, fol-lowing on from this introductory material, Sect. 2 describes
123
Author's personal copy

J Control Autom Electr Syst
Function generator BLDC motor Experiential DC motor with flexible coupling
Variable resistive load
DSD806 Digital Drive Data acquisition system
Fig. 2 Experimental arrangement
the experimental setup and data acquisition system. Sec-tion 3 outlines the fault diagnosis process used in this study,while Sect. 4 details the feature extraction and dimensionalityreduction techniques employed. Section 5 describes the inno-vative fault classification procedure based on a RNN. Sec-tion 6 presents the experimental results obtained and lastly,conclusions are drawn in Sect. 7.
2 Experimental Setup and Data Acquisition
A laboratory prototype motor driver has been built for theexperimental setup, as shown schematically in Fig. 2. Table 1lists the components used for this setup. It consist of a1.2 kW, 4000 rpm, 50 Hz three phase BLDC motor, connectedthrough a flexible coupling (D30 L42 SY) to a permanentmagnet DC motor operating as a generator and acting asa load. The load was varied by using a rheostat connectedto the permanent magnet motor. A 24 V lead–acid batterywas used to supply the BLDC motor, through a digital servodrive DSD806. A three-axis accelerometer ADXL325 witha full-scale range of ±5 g and bandwidth of 0.5–1600Hz wasmounted on the motor bearing to collect vibration signals.Additionally, a current sensor ACS714 was used to read thestator current.
Data from both the sensors were logged to a PC usinga data acquisition system (NI USB-6009) multifunction I/Odevice at a sampling rate of 3 kHz for 30 s periods. WM1Ball Bearings (6000 ZZ) have been used for the study withthe following characteristics: a ball diameter (Bd) of 3mm,a bearing diameter (Pd) of 25mm, inner diameter of 14mm.
Data were logged under healthy operating conditions aswell as with the motor running with each type of bearingdefect (Jin et al. 2013) (inner, outer and ball faults) as shownin Fig. 3. For each of these, the tests were carried out at threedifferent constant speeds (600, 900 and 1200 rpm), while
Table 1 Experiment setup requirements
Item Equipment
1 BLDC motor
2 Flexible coupling
3 DC generator
4 Motor driver
5 DC power supply
6 Variable resistive load
7 Data acquisition system
varying the load from no-load to 100 % of the rated load, andthen again at three different constant loads (no load, 50 %rated load and 100 % rated load) while varying the speedfrom 600 to 1200 rpm. Thus, 24 distinct tests were carriedout to record data under normal and abnormal non-stationaryoperating conditions.
3 Fault Diagnosis Process
The proposed methodology as illustrated in Fig. 4 containsthree stages: first stage is data collection during experimenttest (stator current and vibration signals); second stage isfeatures extraction and reduction and the last stage is faultclassification using a DNN.
It can be seen from the vibration and current signals thatthe amplitude of the time waveform signal under a fault defectis much more than in fault free cases, and generally, theamplitude of the time waveform signal decreases when theload decreases.
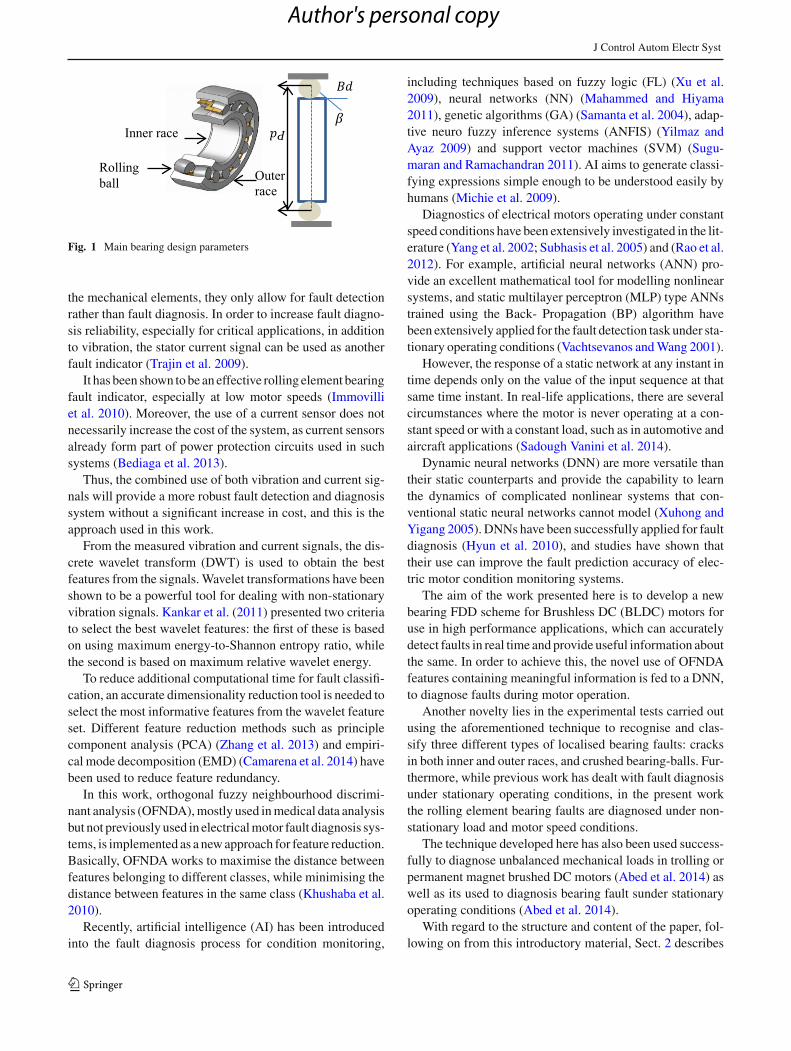
Figures 5, 6, 7 and 8 plot the current and vibration signals,and their respective frequency characteristics, of a BLDCmotor operating under normal conditions and with differentbearing faults, at full load and variable speeds. The signalswere sampled at 3 KHz and have a duration of 30 s.
123
Author's personal copy

J Control Autom Electr Syst
(a)
(b)
(c)
Fig. 3 Bearing defects: a inner-race crack, b outer-race crack,c ball-crush defects
Figure 5 shows the original stator current and raw vibra-tion time waveforms under normal conditions at whileFigs. 6, 7 and 8 represent motor performance at bearing faultsinner race, outer race and ball bearing defects respectively.Generally, the time waveform is very complicated and thegeneral vibration level of the signal is higher than under nor-mal conditions. As can be seen from the vibration and cur-rent signals, the amplitude of the time waveform under faultdefects is much more than in the fault free case, and gen-erally, the amplitude of the time waveform decreases whenload decreases.
4 Feature Extraction and Dimension Reduction
When a single localised bearing fault occurs, the contactbetween the local defect and its mating surface produces animpulse with a short duration and an approximately expo-nential damping rate. If the rotational speed is constant, theimpulse will repeat at a constant interval and this repeti-
Fig. 4 Fault diagnosis process
tion frequency of impulses is called the fault characteris-tic frequency (Wang et al. 2014). However, bearings oftenwork under non-stationary conditions (variable speed, vari-able load).
In such operating conditions, the impulses do not appearperiodically and hence the envelope analysis methods, as wellas any other techniques based on the assumption of constantrotating speed, are no longer applicable. Feature extractionis usually the first step in any pattern recognition systemfollowing the pre-processing step.
Extracting the most significant features is crucially impor-tant in most pattern recognition problems.
Motor signals may be processed using three techniques:time-domain analysis, frequency-domain analysis, and time-frequency analysis. Frequency analysis using fast Fouriertransform (FFT) is not suitable for non-stationary signals.On the other hand, Short Time Fourier Transform (STFT)has limitations related to constant windows for all frequen-cies and is computationally expensive.
Wavelet transforms (WT), on the other hand, have the abil-ity to explore signal features with partial characteristics andanalyse signals with different time and frequency resolutions(Goharrizi and Sepehri 2010). Mathematically, the waveletand scaling functions can be represented as the followingexpressions (Seshadrinath et al. 2014):
123
Author's personal copy
J Control Autom Electr Syst
Fig. 5 Vibration and current signals for motor operating at variable speed and full load with healthy bearing
Fig. 6 Vibration and current signals for motor operating at variable speed and full load with inner-race crack bearing fault
Fig. 7 Vibration and current signals, and respective frequency spectra, for motor operating at variable speed and full load with outer-race crackbearing fault
x (t) =∞∑
n=−∞c (n)∅(t − n
+∞∑
n=0
∞∑
n=∞d ( j, n) 2 j/πγ (2 j t − n) (1)
The scaling c(n) and wavelet d( j, n) coefficients for level jare computed as
c(n)
∫ ∞
−∞x (t)∅ (t − n) dt (2)
123
Author's personal copy
J Control Autom Electr Syst
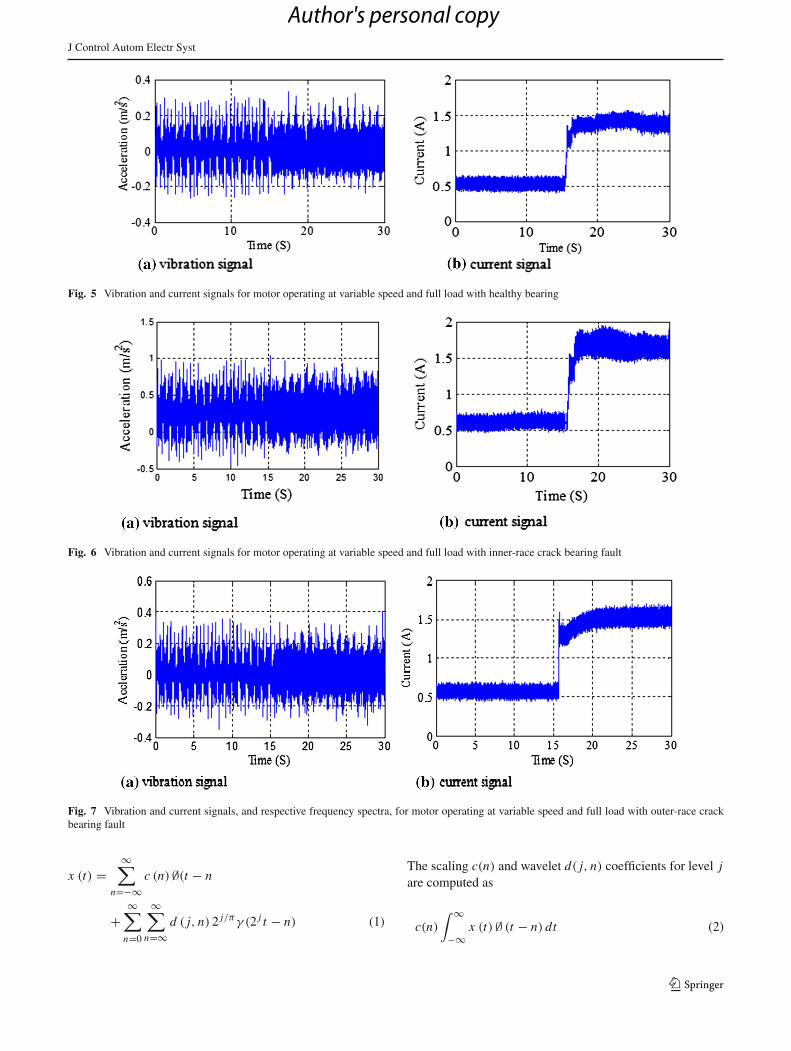
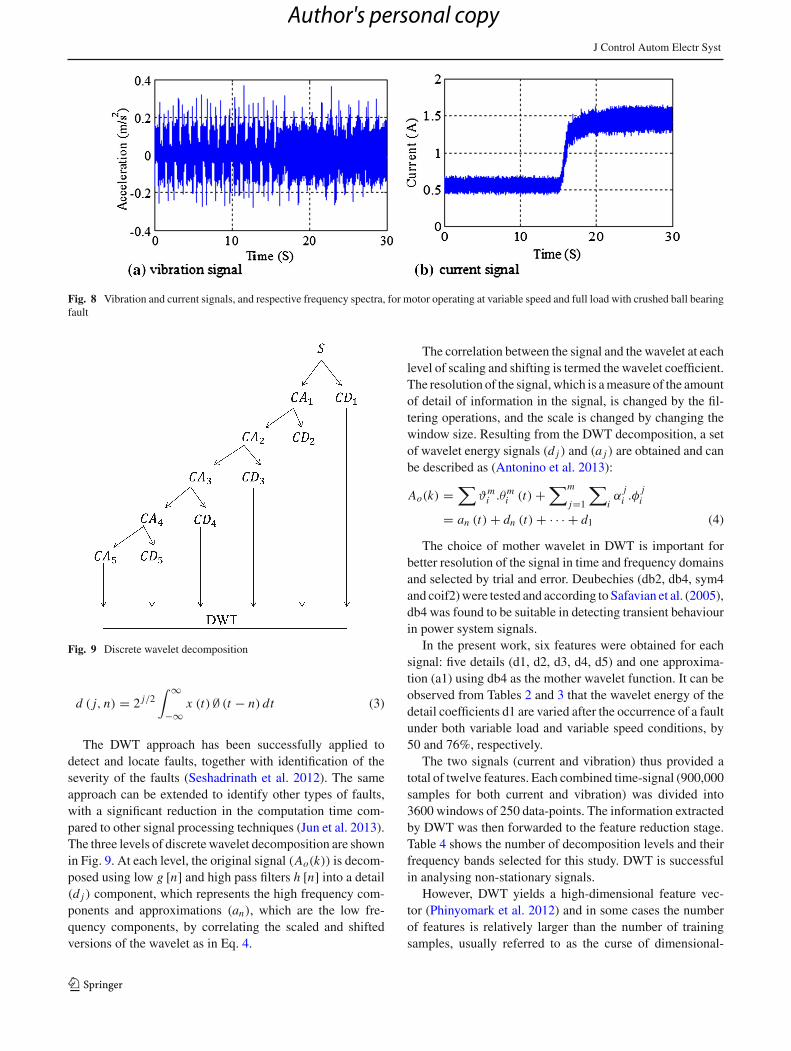
Fig. 8 Vibration and current signals, and respective frequency spectra, for motor operating at variable speed and full load with crushed ball bearingfault
Fig. 9 Discrete wavelet decomposition
d ( j, n) = 2 j/2∫ ∞
−∞x (t)∅ (t − n) dt (3)
The DWT approach has been successfully applied todetect and locate faults, together with identification of theseverity of the faults (Seshadrinath et al. 2012). The sameapproach can be extended to identify other types of faults,with a significant reduction in the computation time com-pared to other signal processing techniques (Jun et al. 2013).The three levels of discrete wavelet decomposition are shownin Fig. 9. At each level, the original signal (Ao(k)) is decom-posed using low g [n] and high pass filters h [n] into a detail(d j ) component, which represents the high frequency com-ponents and approximations (an), which are the low fre-quency components, by correlating the scaled and shiftedversions of the wavelet as in Eq. 4.
The correlation between the signal and the wavelet at eachlevel of scaling and shifting is termed the wavelet coefficient.The resolution of the signal, which is a measure of the amountof detail of information in the signal, is changed by the fil-tering operations, and the scale is changed by changing thewindow size. Resulting from the DWT decomposition, a setof wavelet energy signals (d j ) and (a j ) are obtained and canbe described as (Antonino et al. 2013):
Ao(k) =∑
ϑmi .θm
i (t) +∑m
j=1
∑iα
ji .φ
ji
= an (t) + dn (t) + · · · + d1 (4)
The choice of mother wavelet in DWT is important forbetter resolution of the signal in time and frequency domainsand selected by trial and error. Deubechies (db2, db4, sym4and coif2) were tested and according to Safavian et al. (2005),db4 was found to be suitable in detecting transient behaviourin power system signals.
In the present work, six features were obtained for eachsignal: five details (d1, d2, d3, d4, d5) and one approxima-tion (a1) using db4 as the mother wavelet function. It can beobserved from Tables 2 and 3 that the wavelet energy of thedetail coefficients d1 are varied after the occurrence of a faultunder both variable load and variable speed conditions, by50 and 76%, respectively.
The two signals (current and vibration) thus provided atotal of twelve features. Each combined time-signal (900,000samples for both current and vibration) was divided into3600 windows of 250 data-points. The information extractedby DWT was then forwarded to the feature reduction stage.Table 4 shows the number of decomposition levels and theirfrequency bands selected for this study. DWT is successfulin analysing non-stationary signals.
However, DWT yields a high-dimensional feature vec-tor (Phinyomark et al. 2012) and in some cases the numberof features is relatively larger than the number of trainingsamples, usually referred to as the curse of dimensional-
123
Author's personal copy
J Control Autom Electr Syst
Table 2 Wavelet energy (details and approximate) under variable loadcondition/Joule
a5 d1 d2 d3 d4 d5
99.942 0.028 0.010 0.006 0.007 0.008
Healthy
99.074 0.534 0.170 0.119 0.063 0.056
Faulty bearing at 1200 rpm and variable load
99.773 0.128 0.026 0.020 0.016 0.033
Faulty bearing 900 rpm and variable load
99.913 0.056 0.015 0.007 0.003 0.012
Faulty bearing 600 rpm and variable load
Table 3 Wavelet energy (details and approximate) under variablespeed/Joule
a5 d1 d2 d3 d4 d5
99.885 0.067 0.016 0.010 0.010 0.010
Faulty bearing variable speed and full load
99.722 0.144 0.048 0.030 0.026 0.031
Faulty bearing variable speed and half rated load
99.722 0.143 0.047 0.030 0.026 0.030
Faulty bearing variable speed no load
Table 4 Wavelet frequency bands
Decomposition level Frequency components (Hz)
d1 3000–1500
d2 1500–750
d3 750–325
d4 325–162.5
d5 162.5–81.25
a5 0–162.25
ity, adversely affecting the training and testing speed (Aloket al. 2006). An accurate dimensionality reduction tool isthus needed to remove redundant features information (Pri-eto et al. 2013).
Commonly, dimensionality reduction methods can beimplemented as methods of feature projection and featureselection. In this paper, only the projection method is con-sidered.
The feature projection method attempts to determine thebest combination of original wavelet coefficients and addi-tionally, the features reduced are different from the originalfeatures. OFNDA, is a better technique. Al-Timemy et al.(2013) compared it to other feature reduction techniques,such as Linear Discriminant Analysis (LDA) where singu-larity problems are predominant.
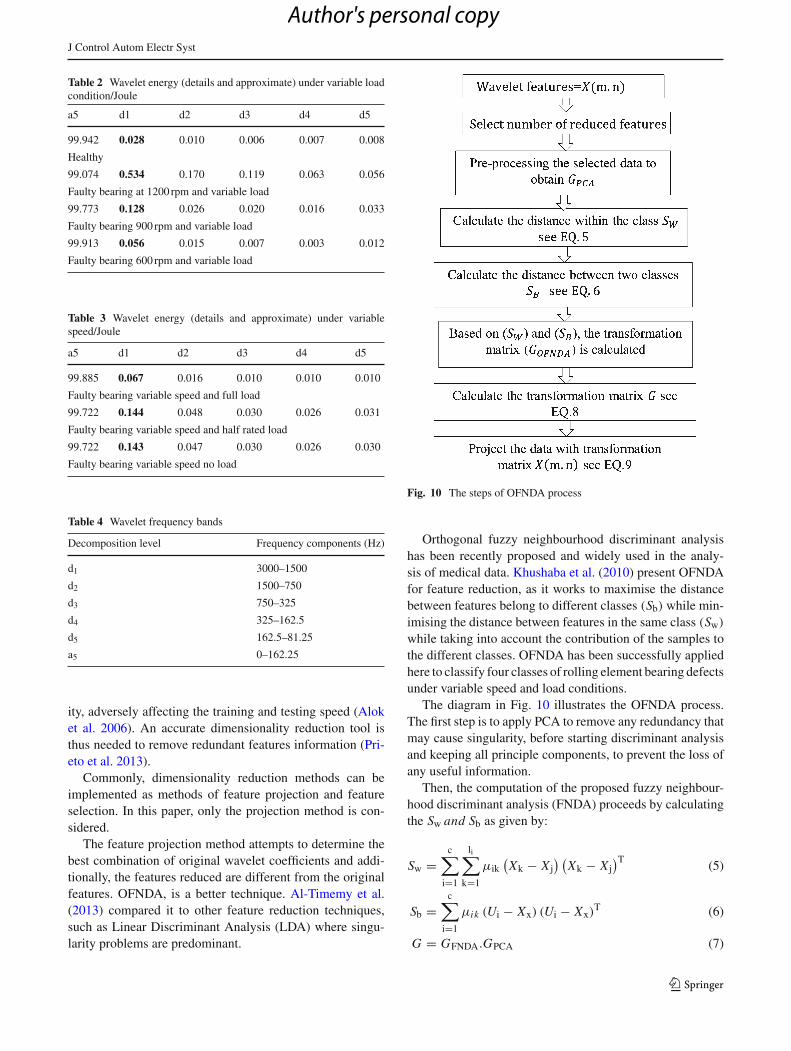
Fig. 10 The steps of OFNDA process
Orthogonal fuzzy neighbourhood discriminant analysishas been recently proposed and widely used in the analy-sis of medical data. Khushaba et al. (2010) present OFNDAfor feature reduction, as it works to maximise the distancebetween features belong to different classes (Sb) while min-imising the distance between features in the same class (Sw)
while taking into account the contribution of the samples tothe different classes. OFNDA has been successfully appliedhere to classify four classes of rolling element bearing defectsunder variable speed and load conditions.
The diagram in Fig. 10 illustrates the OFNDA process.The first step is to apply PCA to remove any redundancy thatmay cause singularity, before starting discriminant analysisand keeping all principle components, to prevent the loss ofany useful information.
Then, the computation of the proposed fuzzy neighbour-hood discriminant analysis (FNDA) proceeds by calculatingthe Sw and Sb as given by:
Sw =c∑
i=1
li∑
k=1
μik(Xk − X j
) (Xk − X j
)T (5)
Sb =c∑
i=1
μik (Ui − Xx) (Ui − Xx)T (6)
G = GFNDA.GPCA (7)
123
Author's personal copy

J Control Autom Electr Syst
GFNDA.GPCA is the OFNDA transformation matrix relatedto PCA and FNDA, respectively.
X (m.n) = X (m.n) .GFNDA (8)
where μik the membership of pattern k in class is i, Xk is theKth sample, and Ui is the mean of the patterns that belong toclass i
5 Recurrent Neural Network (RNN) for Real-timeCondition Monitoring
A DNN structure contains feedback, which, though more dif-ficult to train, provides greater versatility than a static neuralnetwork, which contains only a feed-forward structure.
Dynamic networks have memory and can be trained tolearn sequential or time-varying patterns (Howard et al.2006).
In this work, a nonlinear auto-regressive with exogenousinputs (NARX) model was trained to detect and classify bear-ing faults during non-stationary operation.
This model is a type of RNN that has a delay line on theinput, and the output is fed back to the input by another delayline (Yusuf et al. 2013). Such a network with one hidden layerand four output units is shown in Fig. 11.
The input consists of the three OFNDA features, xOFNDA1 ,
xOFNDA2 , and xOFNDA
3 , and the output of the network con-sists of four units used to indicate a particular bearing faultcondition. The input pattern to the network (input layer) ateach time k consists of the three input features (present anddelayed values), as well as the output feedback, and is formedas:
x(k) =
⎡
⎢⎢⎢⎢⎢⎢⎢⎢⎢⎢⎢⎢⎢⎢⎢⎢⎢⎢⎢⎢⎢⎢⎢⎢⎢⎢⎢⎢⎢⎣
xOFNDA1 (k)
...
xOFNDA1 (k − ndi1)
...
xOFNDA3 (k)
...
xOFNDA3 (k − ndi3)
y1(k − 1)...
y1(k − ndo1)...
y4(k − 1)...
y4(k − ndo4)
⎤
⎥⎥⎥⎥⎥⎥⎥⎥⎥⎥⎥⎥⎥⎥⎥⎥⎥⎥⎥⎥⎥⎥⎥⎥⎥⎥⎥⎥⎥⎦
(9)
where ndi j and ndo j are the number of delays of input featurej and output j respectively. In this case, four input delays andthree output delays were used for all input and output featuresrespectively. The network used is a logistic classifier thatincorporates sigmoid activations in all the hidden and outputunits. For each input pattern x(k), the output of each node iscalculated by forward propagation according to
a(1) (k) =[
1x (k)
]; (10)
a(2)(k) =[
1s(�(1)a(1)(k)
)]
; (11)
y(k) = a(3)(k) = s(�(2)a(2)(k)) (12)
where a(l)i denotes the activation or output of the i th node of
layer l, y is the output vector of the network, �(1) and �(2)
Fig. 11 RNN used for fault diagnosis
123
Author's personal copy

J Control Autom Electr Syst
Table 5 RNN output signification
Output 1 Output 2 Output 3 Output 4 Indication
1 0 0 0 Healthy
0 1 0 0 Inner race
0 0 1 0 Outer race
0 0 0 1 Crushed ball
are the matrices of parameters of the network such that �(l)i j
represents the strength of the connection between the j th oflayer l and node i th node of layer (l + 1), and s(x) is thelogistic function.
S (x) = 1
1 + e−x(13)
For each input pattern, the network outputs four valuesbetween 0 and 1; these output values are rounded to 0 or 1 toindicate a certain fault condition, as shown in Table 5.(
y (k) = [y1 (k) , y2 (k) , y3 (k) , y4 (k)
]T)
(14)
In order to train the network, 60 % of the data from each ofthe data-sets shown in Figs. 5, 6, 7 and 8 was used to produceinput and target patterns for healthy operation and differentbearing fault conditions under variable speed or variable loadoperating modes.
Training consists of minimising the cost function:
J = 1
m
m∑
k=1
4∑
n=1
− [(yt )n (k) ln
(yn (k)
)
+ (1 − (yt )n (k)
)ln
(1 − yn (k)
)](15)
with respect to the network parameters �(1) and �(2), wherem is the number of training samples, and yt is equivalent to’the target output for each one. This process was carried outrecursively using the gradient descent (GD) method accord-ing to:
�(l)i j := �
(l)i j − α
(l)i j for all �(l)
i j (16)
where (l)i j = ∂ J
∂�(l)i j
and α is the learning rate, in which the
initial network parameters were chosen randomly. In order tocalculate the gradient components
(l)i j , the BP method was
used.BP method:For each training pattern x (k),
1. Obtain a(1) (k) , a(2)(k), and y(k) = a(3)(k) according to(6–8)
2. δ(3) (k) = yt (k) − y (k) (17)
Fig. 12 Fault diagnosis test for motor operating at 1200 rpm with vari-able load
3. δ(2)i (k) = a(2)
i (k)(
1 − a(2)i (k)
) ∑4
n=1�
(2)ni δ(3)
n (k) ;i = 1, .., nh (18)
(2)i j = − 1
m
∑m
k=1δ(3)i (k) a(2)
j (k) ; i = 1, . . . , 4;j = 0, . . . , nh (19)
(1)i j = − 1
m
∑m
k=1δ(2)i (k) a(1)
j (k) ; i =1, . . . , nh;j = 0, . . . , ni (20)
where nh is the number of hidden units (not counting the biasunit) and ni the number of input units (not counting the biasunit).
The BP process was applied in two stages. During the firstset of iterations, the (delayed) target values yt were used toconstruct x (k) for computation of y in the first step of the BPprocess, effectively training a network without feedback.
123
Author's personal copy

J Control Autom Electr Syst
Fig. 13 Fault diagnosis test for motor operating at 900 rpm with vari-able load
During a second stage, (past) predictions of the networky were used to construct x (k) in accordance with the truefeedback architecture of the network. Although the gradientscomputed with the BP algorithm in this case are approxima-tions to the true gradient, the errors are small as, after the firstset of iterations, the network is sufficiently trained to outputpredictions close to the target values.
6 Results and Discussion
From the experimental datasets obtained in the laboratory,40 % of each was reserved for testing the trained RNN. Foreach operating condition and each type of fault, a sequence ofdata from the healthy case was prefixed to the data obtained
Fig. 14 Fault diagnosis test for motor operating at variable speed andmaximum loading conditions
from a faulty condition. Wavelet features were obtained foreach one, from which three OFNDA features were obtained,as was done with the training data. The OFNDA features werethen fed to the input of the trained RNN, to test whether itwas capable of detecting and classifying the different faultsaccurately. Figures 12 and 13 shows DNN Performance undervariable load with 900 and rpm speed conditions. In the samemanner, Fig. 14 shows DNN output under variable speedconditions.
The output shown is a combination of the four output unitsof the network calculated as:
yRNN(k) = y1 (k) + 2y2 (k) + 3y3 (k) + 4y4 (k) (21)
so that a healthy condition should output a 1, an outer-racefault a2, an inner-race fault a3, and a crushed ball fault a4.This output is compared with the correct output for each
123
Author's personal copy

J Control Autom Electr Syst
Table 6 Test results undervariable operating conditions Operating load Bearing faults NMC MMCT (s) RT (s)
900 rpm, variable load Inner race 1 0.06 0.20
Outer race 3 0.06 0.36
Ball 5 0.13 0.17
1200 rpm, variable load Inner race 2 0.65 0.40
Outer race 2 0.65 0.75
Ball 2 0.65 0.75
Full load, variable speed Inner race 0 0 0.33
Outer race 0 0 0.33
Ball 0 0 0.70
Table 7 Classification accuracy under variable load
Operating condition Bearing faults Accuracy (%)
OFNDA PCA
1200 rpm Inner race 98.2 97.7
Outer race 96.7 94.3
Ball 96.8 98.4
900 rpm Inner race 99.3 67.6
Outer race 98.2 77.1
Ball 96.8 84.7
600 rpm Inner race 97.2 90.5
Outer race 93.8 87.8
Ball 95.4 86.9
Table 8 Classification accuracy under variable speed
Operating condition Bearing faults Accuracy
OFNDA PCA
Full load Inner race 98.2 92.2
Outer race 98.8 81.3
Ball 97.4 84.7
Half rated load Inner race 94.7 82.4
Outer race 94.0 72.9
Ball 93.3 79.5
No-load Inner race 95.4 96.9
Outer race 97.8 71.3
Ball 96.7 73.9
dataset. It should be noted that unrounded values are shownin the graphs, and misclassification only occurs when therounded value does not coincide with the correct value. Theseare indicated by circles in the graphs.
It should also be noted that the network cannot instantlyrespond to a faulty condition, due to the delay introduced bythe dynamics of the network architecture (feedback loop).
The transition periods are not included in the misclassifi-cation count, but the delay is measured as a separate quantityin Table 6, where NMC is the number of misclassifications
0 10 20 30 40 50 600.5
1
1.5
2
2.5
3
3.5
4
4.5
Time(s)
ANN output.MSE= 0.0008
ANN target
Fig. 15 Overall fault diagnosis test for motor operating at variable loadand speed at 1200 rpm
and MMCT the maximum misclassification time. RT repre-sents the network’s response time to react to the presence ofa fault.
Principle component analysis is one of linear featurereduction techniques used to transfer data to a new orthog-onal basis whose axes are oriented in the directions of themaximum variance of an input data set. It is commonly usedfor feature reduction purposes.
Using OFNDA as a feature reduction tool was tested bycomparison with PCA. The comparison indicated that featurereduction with the OFNDA technique provided better faultclassification accuracy compared to PCA techniques. PCAreduces features by selecting the main three important fea-tures. One of the main drawbacks of PCA is that it works toreduce feature redundancy only, without taking into accountthe relation of features or variables with the specific classlabels, and this will affect classification accuracy.
Furthermore, PCA’s capability will decrease with nonlin-ear data (Jia, 2011). Tables 7 and 8 show the percentagediagnostic accuracy of DNN with OFNDA and PCA. Afterapplying PCA as a feature reduction tool, the overall per-
123
Author's personal copy

J Control Autom Electr Syst
Tabl
e9
Com
pari
son
ofth
epr
opos
edm
etho
dw
ithre
cent
publ
ishe
dw
orks
Ref
eren
ces
Faul
tind
icat
orFe
atur
eex
trac
tion
tool
Feat
ure
dim
ensi
onal
ityre
duct
ion
tool
Cla
ssifi
erC
lass
ifica
tion
accu
racy
(%)
Prie
toet
al.(
2013
)V
ibra
tion
sign
alSt
atis
tical
time
feat
ures
PCA
Stat
icN
N95
Kan
kar
etal
.(20
11)
Vib
ratio
nsi
gnal
Con
tinuo
usw
avel
ettr
ansf
orm
(CW
T)
Stat
icN
N93
SVM
93
SOM
72
Xu
etal
.(20
09)
Vib
ratio
nsi
gnal
CW
TFL
S87
Yus
ufet
al.(
2013
)V
ibra
tion
sign
alD
NN
91
NA
RX
95
Cam
aren
aet
al.(
2014
)C
urre
ntsi
gnal
EM
DSt
atic
NN
90
Sam
anta
etal
.(20
04)
Vib
ratio
nsi
gnal
Stat
istic
altim
efe
atur
esG
ASt
atic
NN
88
Cur
rent
appr
oach
Cur
rent
and
vibr
atio
nsi
gnal
DW
TO
FND
AD
NN
97
centage accuracy reduced at variable load, with 1200, 900,600 rpm and variable speed with no-load conditions
All the duration times of the misclassifications are lessthan 0.7s. In practice, such misclassification times wouldnot be noticeable. Hence, all the misclassifications can beconsidered spontaneous and can be ignored. Fig. 15 shows theoverall fault diagnosis test for a motor operating at variableload and speed at 1200 rpm.
Table 9 shows the comparison of the proposed fault diag-nosis technique with recent published works based on softcomputing techniques, feature extraction and dimensionalityreduction tools. Prieto et al. (2013) used statistics featuresunder different speed and load conditions to train NNs, andthe overall classification accuracy for 25 operating tests is95 % while Kankar et al. (2011) and Samanta et al. (2004)used statistics and wavelet features of vibration signals understationary operating conditions to train and test different softcomputing techniques. Xu et al. (2009), meanwhile, usedcontinuous WT to train fuzzy logic system (FLS) under vari-able speed conditions.
Yusuf et al. (2013) utilised GA to optimised statisticaltime features that used to train DNN. In Camarena et al.(2014), EMD of current signals employed to tran NN undernonstationary operating conditions.
In the current approach, the mean accuracy of each testunder variable load conditions is 97.23, 98.10 and 95.46 %,respectively, and the mean accuracy under variable speedconditions are 98.13, 95.36 and 96.63 %, respectively, andthe overall classification rate of the current approach is about97 %.
7 Conclusions
In this paper, a new intelligent fault diagnosis technique forrolling element bearings in BLDC motors is proposed. Aset of fault scenarios were designed and tested under non-stationary operating conditions, including different motorspeeds and loads. The stator current and raw vibration sig-nals collected from the experimental setup were used as faultindicators.
Discrete wavelet transform was used as an efficient fea-ture extraction method. However, these features alone are notcapable of a good fault classification performance. OFNDAwas applied to obtain the best features for fault classification,and the results show that better classification accuracy wasobtained. These features were fed to a RNN for fault classifi-cation, enabling the fault classifier to incorporate a dynamiccomponent.
The application of these techniques to real data has shownthat they constitute an effective fault classifier in practice,capable of detecting and classifying bearing faults under non-stationary operating conditions fairly accurately.
123
Author's personal copy

J Control Autom Electr Syst
References
Abed, W., Sharma, K., & Sutton, R. (2014). Intelligent fault diagnosisof an unmanned underwater vehicle electric thruster motor. TheGlobal Event for Undersea Defence and Technology Liverpool,UK, 10–12 June.
Abed, W., Sharma, K., & Sutton, R. (2014). Diagnosis of bearing faultof brushless DC motor based on dynamic neural network andorthogonal fuzzy neighborhood discriminant analysis. In 10 Inter-national Conference of the United Kingdom. Automatic ControlCouncil, Loughborough University, UK. doi:10.1109/CONTROL.2014.6915170.
Al-Timemy, H., Bugmann, G., Escudero, J., & Outram, N. (2013). Clas-sification of finger movements for the dexterous hand prosthesiscontrol with surface electromyography. IEEE Journal of Biomed-ical and Health Informatics, 17(3), 608–618.
Alok, S., Kuldip, K., & Godfrey, C. (2006). Class-dependent PCA,MDC and LDA: A combined classifier for pattern classification,Pattern Recognition, 39(7), 1215–1229.
Antonino, J., Aviyente, S., Strangas, G., & Riera-Guasp, M. (2013).Scale invariant feature extraction algorithm for the automatic diag-nosis of rotor asymmetries in induction motors. IEEE Transactionson Industrial Informatics, 9(1), 100–108.
Bediaga, I., Mendizabal, X., Arnaiz, A., & Munoa, J. (2013). Ballbearing damage detection using traditional signal processing algo-rithms. IEEE Instrumentation and Measurement Magazine, 16(2),20–25.
Brown, D., Georgoulas, G., Bae, H., & Vachtsevanos, G. (2009). Par-ticle filter based anomaly detection for aircraft actuator systems.In IEEE Aerospace Conference (pp. 1–13). doi:10.1109/AERO.2009.4839659.
Camarena, D., Valtierra, M., Garcia, A., Osornio, A., & Romero, J.(2014). Empirical mode decomposition and neural networks onFPGA for fault diagnosis in induction motors. The Scientific WorldJournal. doi:10.1155/2014/908140.
Delgado, M., Cusido, J., & Romeral, L. (2011). Bearings fault detectionusing inference tools. In Tech. doi:10.5772/22696.
Goharrizi, Y., & Sepehri, N. (2010). A wavelet-based approach to inter-nal seal damage diagnosis in hydraulic actuators. IEEE Transac-tions on Industrial Electronics, 57(5), 1755–1763.
Howard, D., Mark, B., & Martin, H. (2006). Neural network toolboxfor use with MATLAB. The Mathowrks User’s Guide, Version 5.
Hyun, C., Knowles, J., Fadali, S., & Kwon, L. (2010). Fault detectionand isolation of induction motors using recurrent neural networksand dynamic Bayesian modeling. IEEE Transactions on ControlSystems Technology, 18(2), 430–437.
Immovilli, F., Bellini, A., Rubini, R., & Tassoni, C. (2010). Diagnosisof bearing faults in induction machines by vibration or current sig-nals: A critical comparison. IEEE Transactions on Industry Appli-cations. doi:10.1109/08IAS.2008.26.
Jia, G., Yuan, S., & Tang, C. (2011). Fault diagnosis of roller bearingbased on PCA and multi-class support vector machine. Computerand Computing Technologies in Agriculture. Berlin Heidelberg:Springer. doi:10.1007/978-3-642-18369-0_22.
Jin, X., Zhao, M., Chow, T., & Pecht, M. (2013). Motor bearingfault diagnosis using trace ratio linear discriminant analysis. IEEETransactions on Industrial Electronics, 61(5), 1–11.
Jun, H., Jianzhong, Z., Ming, C., & Zheng, W. (2013). Fault diagno-sis of mechanical unbalance for permanent magnet synchronousmotor drive system under nonstationary condition. In: IEEE energyconversion and exposition conference, USA. doi:10.1109/ECCE.2013.6647169.
Kankar, K., Sharma, C., & Harsha, P. (2011). Fault diagnosis of ballbearings using continuous wavelet transform. Applied Soft Com-puting, 11(2), 2300–2312.
Khushaba, N., Al-Ani, A., & Al-Jumaily, A. (2010). Orthogonal fuzzyneighborhood discriminant analysis for multifunction myoelec-tric hand control. IEEE Transactions on Biomedical Engineering,57(6), 1410–1419.
Mahammed, A., & Hiyama, T. (2011). Fault classification based artifi-cial intelligent methods of induction motor. International Journalof Innovative Computing, Information and Control, 7(9), 5477–5493.
Michie, D., Spiegelhalter, D., & Taylor, C. (2009). Machine learning,neural and statistical classification (1st ed.). Chichester: Ellis Har-wood.
Patil, M., Mathew, J., Rajendrakumar, P., & Desai, S. (2010). A theo-retical model to predict the effect of localized defect on vibrationsassociated with ball bearing. International Journal of MechanicalSciences, 52(9), 1193–1201.
Phinyomark, A., Nuidod, A., Phukpattaranont, P., & Limsakul, C.(2012). Feature extraction and reduction of wavelet transform coef-ficients for EMG pattern classification. Electrical and Electron-ics Engineering, 122(6), http://www.eejournal.ktu.lt/index.phpelt/article/view/1816.
Prieto, D., Cirrincione, G., Espinosa, G., Ortega, A., & Henao, H.(2013). Bearing fault detection by a novel condition-monitoringscheme based on statistical-time features and neural networks.IEEE Transactions on Industrial Electronics, 60(8), 3398–3407.
Rao, B., Pai, S., & Nagabhushana, T. (2012). Failure diagnosis andprognosis of rolling-element bearings using artificial neural net-works: A critical overview. IOP Publishing, Journal of Physics:Conference Series, 364(1), 1–28.
Sadough Vanini, Z. N., Khorasani, K., & Meskin, N. (2014). Faultdetection and isolation of a dual spool gas turbine engine usingdynamic neural networks and multiple model approach. Informa-tion Science, 259, 234–251.
Safavian, L., Kinsner, W., & Turanli, H. (2005). Aquantitative com-parison of different mother wavelets for characterizing transientsin power systems. In IEEE conference on Electrical and Com-puter Engineering, (pp. 1461–1464) doi:10.1109/CCECE.2005.1557253.
Samanta, B., Al-Balushi, R., & Al-Araimi, A. (2004). Bearing faultdetection using artificial neural networks and genetic algorithm.Journal on Applied Signal Processing, 2004(3), 366–377.
Seshadrinath, J., Singh, B., & Panigrahi, K. (2014). Investigation ofvibration signatures for multiple fault diagnosis in variable fre-quency drives using complex wavelets. IEEE Transactions onPower Electronics, 29(2), 936–945.
Seshadrinath, J., Singh, B., & Panigrahi, K. B. (2012). Incipient turnfault detection and condition monitoring of induction machineusing analytical wavelet transform. In IEEE Industry ApplicationsSociety Annual Meeting, USA. doi:10.1109/IAS.2012.6374026.
Subhasis, N., Hamid, T., & Xiaodong, L. (2005). Condition monitoringand fault diagnosis of electrical motors a review. IEEE Transac-tions on Energy Conversion, 20(4), 719–729.
Sugumaran, V., & Ramachandran, I. (2011). Effect of number of fea-tures on classification of roller bearing faults using SVM andPSVM. Expert Systems with Applications, 38(4), 4088–4096.
Tavner, J. (2008). Review of condition monitoring of rotating electricalmachines. Electric Power Applications, IET, 2(4), 215–247.
Trajin, B., Regnier, J., & Faucher, J. (2009). Comparison between statorcurrent and estimated mechanical speed for the detection of bear-ing wear in asynchronous drives. IEEE Transactions on IndustrialElectronics, 56(11), 4700–4709.
Vachtsevanos, G., & Wang, P. (2001). Fault prognosis using dynamicwavelet neural networks. EEE Systems Readiness Technology Con-ference, USA. doi:10.1109/AUTEST.2001.949467.
123
Author's personal copy

J Control Autom Electr Syst
Wang, T., Liang, M., Li, J., & Cheng, W. (2014). Rolling element bearingfault diagnosis via fault characteristic order analysis. MechanicalSystems and Signal Processing, 45(1), 139–153.
Wu, Y., Lai, H., & Lin, S. (2013). Feature extraction for bearing detec-tion identification under variable rotation speed. In 20th Interna-tional Congress on sound and vibration, Thailand. http://www.icsv20.org/index.php?va=viewpage&vaid=175&vasort=title.
Xu, Z., Xuan, J., Shi, T., Wu, B., & Hu, Y. (2009). Application of a mod-ified fuzzy ARTMAP with feature-weight learning for the faultdiagnosis of bearing. Expert Systems with Applications, 36(6),9961–9968.
Xuhong, W., & Yigang, H. (2005). Diagonal recurrent neural net-work based on-line stator winding turn fault detection for induc-tion motors. Electrical Machines and Systems, Proceedings of theEighth International. doi:10.1109/ICEMS.2005.202972.
Yang, H., Mathew, J., & Ma, L. (2002). Intelligent diagnosis of rotatingmachinery faults-a review. In 3rd Asia-Pacific conference on sys-tems integrity and maintenance, Australia. http://eprints.qut.edu.au/17942/1/17942.pdf.
Yilmaz, S., & Ayaz, E. (2009). Adaptive neuro-fuzzy inference sys-tem for bearing fault detection in induction motors using tem-perature, current, vibration data. EUROCON conference, Russia.doi:10.1109/EURCON.2009.5167779.
Yusuf, A., Brown, J., Mackinnon, A., & Papanicolaou, R. (2013).Application of dynamic neural networks with exogenous inputto industrial conditional monitoring. International joint confer-ence on neural networks, USA. 1–8. doi:10.1109/IJCNN.2013.6706762.
Zhang, Y., Zuo, H., & Bai, F. (2013). Classification of fault location andperformance degradation of a roller bearing. Measurement, 46(3),1178–1189.
Zhenyu, Y., Uffe, M., Gerfulf, P., Morten, R., & hakon, B. (2009).A study of rolling-element bearing fault diagnosis using motor’svibration and current signatures, preprints of the 7th IFAC sym-posium on fault detection, supervision and safety of technicalprocesses, Spain. doi:10.3182/20090630-4-ES-2003.00059.
123
Author's personal copy