Embed Size (px)
Citation preview
University of Plymouth
PEARL https://pearl.plymouth.ac.uk
Faculty of Arts and Humanities School of Society and Culture
2015-12
Music-induced emotions can be
predicted from a combination of brain
activity and acoustic features.
Daly, I
http://hdl.handle.net/10026.1/6519
10.1016/j.bandc.2015.08.003
Brain Cogn
All content in PEARL is protected by copyright law. Author manuscripts are made available in accordance with
publisher policies. Please cite only the published version using the details provided on the item record or
document. In the absence of an open licence (e.g. Creative Commons), permissions for further reuse of content
should be sought from the publisher or author.
Brain and Cognition 101 (2015) 1–11
Contents lists available at ScienceDirect
Brain and Cognition
journal homepage: www.elsevier .com/ locate /b&c
Music-induced emotions can be predicted from a combination of brainactivity and acoustic features
http://dx.doi.org/10.1016/j.bandc.2015.08.0030278-2626/� 2015 Elsevier Inc. All rights reserved.
⇑ Corresponding author.E-mail address: [email protected] (I. Daly).
Ian Daly a,⇑, Duncan Williams b, James Hallowell a, Faustina Hwang a, Alexis Kirke b, Asad Malik a,James Weaver a, Eduardo Miranda b, Slawomir J. Nasuto a
aBrain Embodiment Lab, School of Systems Engineering, University of Reading, Reading, UKb Interdisciplinary Centre for Music Research, University of Plymouth, Plymouth, UK
a r t i c l e i n f o
Article history:Received 23 January 2015Revised 3 August 2015Accepted 4 August 2015Available online 3 November 2015
Keywords:MusicAffective state predictionEEGAcoustic featuresMachine learning
a b s t r a c t
It is widely acknowledged that music can communicate and induce a wide range of emotions in the lis-tener. However, music is a highly-complex audio signal composed of a wide range of complex time- andfrequency-varying components. Additionally, music-induced emotions are known to differ greatlybetween listeners. Therefore, it is not immediately clear what emotions will be induced in a given indi-vidual by a piece of music.We attempt to predict the music-induced emotional response in a listener by measuring the activity in
the listeners electroencephalogram (EEG). We combine these measures with acoustic descriptors of themusic, an approach that allows us to consider music as a complex set of time-varying acoustic features,independently of any specific music theory. Regression models are found which allow us to predict themusic-induced emotions of our participants with a correlation between the actual and predictedresponses of up to r ¼ 0:234; p < 0:001.This regression fit suggests that over 20% of the variance of the participant’s music induced emotions
can be predicted by their neural activity and the properties of the music. Given the large amount of noise,non-stationarity, and non-linearity in both EEG and music, this is an encouraging result. Additionally, thecombination of measures of brain activity and acoustic features describing the music played to our par-ticipants allows us to predict music-induced emotions with significantly higher accuracies than eitherfeature type alone (p < 0:01).
� 2015 Elsevier Inc. All rights reserved.
1. Introduction
Music is widely acknowledged to be a powerful method foremotional communication, capable of eliciting a range of differentemotional responses in the listener, such as joy, excitement, andfear (Scherer, 2004). Subsequently, music therapy may be used asa tool for treatment of emotional disorders such as depression(Maratos, Gold, Wang, & Crawford, 2008).
Music therapy is a health intervention in which the music ther-apist uses music as a tool to help their patient with their physicaland/or mental health problems ( Bradt, Magee, Dileo, Wheeler, &McGilloway, 2010; Erkkilä et al., 2011; McDermott, Crellin,Ridder, & Orrell, 2013). For example, in the treatment of depressionmusic therapy has been reported to significantly improve moodwhen compared to standard care alone (Maratos et al., 2008) (for
example antidepressant drugs alone vs. antidepressant drugs andmusic therapy (Chen, 1992)).
The music used in music therapy is selected by the therapistbased upon a combination of the therapists evaluation of theirpatients current psychological state, the therapists expertise andexperience, and the properties of the music that the therapistjudges will be beneficial to the patient (Tamplin & Baker, 2006).
In order to select an appropriate piece of music for use in musictherapy it is necessary to predict how the individual is likely toreact to that piece of music. However, it is a considerable challengeto predict the potential reaction of an individual to a piece of musicthey have not previously heard before. There are large inter-personal differences in emotions induced by listening to a pieceof music, which result from both the music itself and the partici-pant’s own previous and current mental states (Hunter,Schellenberg, & Schimmack, 2010).
These inter-person differences are a result of a wide range ofinfluences and include the individuals prior experiences, their cur-rent mood, and a range of other factors both internal to the person
2 I. Daly et al. / Brain and Cognition 101 (2015) 1–11
and external to them. Broadly speaking, a persons emotionalresponse to a piece of music can be said to be a function of boththe music itself and of the individual.
When considering the piece of music, a number of models havebeen proposed for the relationships between musical structure andsyntax and both the perceived and/or induced emotional responsesof a listener (for example, Thompson & Robitaille (1992), Schubert(1999), Gabrielsson & Lindström (2001), Gabrielsson & Juslin(2003)).
For example, in Russell (1980) and Livingstone and Thompson(2009) the circumplex model of affect and its relationship to musi-cal descriptors is described. In this model, emotional responseshave been plotted across two continuous axes, arousal (excite-ment) and valence (pleasantness), ranging from low to high. Musi-cal descriptors drawn from music theory, such as tempo ormodality, are plotted in this space.
However, while this model is intuitive and can be informativeabout perceptions of the role individual features of music theorymay play in emotional responses, it is not complete. First, due tothe very large inter-person differences in music-induced emotions,music features are not likely, by themselves, to be good predictorsof emotional responses to music. This may be due to a variety offactors, including individual preferences for particular pieces ofmusic, prior experience of music induced emotions, or a partici-pants physiological state as they listen to music (Peretz, Aube, &Armony, 2013).
An alternative approach that has been adopted is to attempt touse physiological measurements of the participant as correlates oftheir emotional responses (Craig, 2005; Kim & André, 2008;Schmidt & Trainor, 2001). Patterns in these physiological measure-ments can be identified and used to attempt to identify a partici-pants emotional response to a piece of music.
An example of this is the use of electrocardiogram (ECG) signalsto identify emotional responses to music (Kim & André, 2008). Asmusic causes listeners to become more excited, this can lead toincreases in heart rate, which is reflected in the recorded ECG sig-nal and, subsequently, classified (Kim & André, 2008). Other phys-iological measures which have been adopted to identify music-induced emotions include the galvanic skin response (GSR)(Craig, 2005), the electromyogram (EMG) recorded from the facialmuscles (Lundqvist, Carlsson, Hilmersson, & Juslin, 2008), and res-piration rate (Etzel, Johnsen, Dickerson, Tranel, & Adolphs, 2006).
Alternatively, a number of researchers have explored variousindices of neural activity as a measure of music-induced emotion.This may be done by, for example, the use of the electroencephalo-gram (EEG) (Schmidt & Trainor, 2001).
Measures of activity in the EEG which have been reported torelate to music-induced emotion include asymmetry of activitywithin the alpha band over the prefrontal cortex (Schmidt &Trainor, 2001), measures of prefrontal asymmetry in the beta fre-quency band, and measures of connectivity between prefrontaland occipital cortical areas (Daly et al., 2014).
The influence of music-induced emotion on the EEG is derivedfrom the neurobiological mechanisms mediating interactions ofmusic with emotions (Peretz, 2009, chap. 5). Music is thought toengage a diverse network of neural structures, with no single path-way bearing responsibility for music-induced emotions. This is evi-denced by the lack of reports of selective loss of all music-inducedemotions due to brain injury, contrasting with the prevalence ofevidence for selective loss of some music-induced emotions. Forexample, ’scary’ and ’sad’ music-induced emotions may be lostafter damage to the amygdala (Gosselin, 2005; Gosselin, Peretz,Johnsen, & Adolphs, 2007) and impaired by Parkinson’s disease(van Tricht, Smeding, Speelman, & Schmand, 2010). This is also evi-denced by findings that preferred musical styles engage a listener’s
default mode network most strongly (Wilkins, Hodges, Laurienti,Steen, & Burdette, 2014).
As a consequence, music-induced emotions relate to a range ofparticular effects in the EEG. These include inter-hemispheric dif-ferences in EEG activity levels (Daly et al., 2014; Flores-Gutiérrezet al., 2007; Schmidt & Trainor, 2001) or changes in EEG over speci-fic regions, such as the pre-frontal cortex (Lin et al., 2010). Takentogether, it has been suggested that musical emotions engage anetwork of both cortical and sub-cortical regions, which producesa range of effects in the EEG (Peretz, 2009, chap. 5).
These effects are widely known to differ between individuals(Hunter et al., 2010). This can occur for a variety of reasons, includ-ing musical preferences (Bauer, Kreutz, & Herrmann, 2015), age(Daly et al., 2014), and emotional intelligence (Jausovec &Jausovec, 2005). Additionally, the EEG is known to be a noisy,non-stationary signal (Daly et al., 2012). Taken together this makesreliable identification of music-induced emotions from the EEG avery challenging problem.
Therefore, we suggest that a combination of both physiologicalmeasures of the listener and acoustic properties of the music maybe used to effectively predict emotional responses to a piece ofmusic. Specifically, we hypothesise that a combination of EEGmea-sures and the acoustic properties of the music may be used to pre-dict the emotional response they will report experiencing whilelistening to the music.
We play a series of musical clips to a group of participants,while recording their EEG. We then extract descriptive featuresof both the acoustic properties of the music and the participant’sEEG. We attempt to use these features to train a regression modelto predict the music-induced emotional responses of theparticipants.
2. Methods
2.1. Measurements
Thirty-one individuals between the ages of 18–66 (median 35,18 female) participated in the study (previously detailed in (Dalyet al., 2014)). All participants were healthy adults who did notreport having any mental health, mood, or psychiatric problems.All participants had normal, or corrected to normal, hearing andvision. Twenty-nine of the participants were right handed (no sig-nificant differences were found in the results from the two lefthanded participants). The electroencephalogram (EEG) wasrecorded from each participant from 19 channels positionedaccording to the International 10/20 system for electrodeplacement.
The participants each listened to 40 pieces of music, which wereuniformly drawn from a set of 110 excerpts from film scores. Thestimuli were taken from a dataset of musical pieces chosen withthe specific purpose of inducing emotional responses in the lis-tener (Eerola & Vuoskoski, 2010).
Each musical clip was played for 12 s, as described in Daly et al.(2014), during which the participants were instructed to look atthe screen and listen to the music without moving. They were thenasked a series of 8 randomly-ordered Likert questions designed toidentify the level of emotional response along 8 axes induced inthem by the music.
These 8 axes allowed the participants to report their music-induced emotions in terms of pleasantness, energy, sadness, anger,tenderness, happiness, fear, and tension. However, as several ofthese categories are likely to be highly correlated, a principal com-ponent analysis (PCA) was used in order to identify a reduced set ofcategories. Three principal components (PCs) were identified,which explained >75% of the variance of the participant’s
I. Daly et al. / Brain and Cognition 101 (2015) 1–11 3
responses. These three PCs are used in subsequent analysis andreferred to as the ’response PCs’. They correspond to each of theaxes of the three-dimensional Schimmack and Grob model of affec-tive states (valence, energy-arousal, and tension-arousal)(Schimmack & Grob, 2000). Further details on the measurementprocedure and the experimental paradigm are reported in Dalyet al. (2014).
From the recorded dataset we extract acoustic features fromeach of the pieces of music played to the participants. We alsoextract physiological features from the participant’s EEG duringeach music listening trial. We then attempt to identify subsets ofthese features which can be used to reliably predict a participant’sreported emotional response to the music along each of the chosenresponse PCs.
2.2. Acoustic features
Each of the musical clips used as stimuli may be described by arange of acoustic features. We select a subset of acoustic featuresbased upon the taxonomy of musical features described inMitrovic, Zeppelzauer, and Breiteneder (2010) and designed tocover the following key musical properties and acoustic featuretypes: temporal features, spectral features, perceptual features,cepstral features, and features describing the beat of the music.
The acoustic features are extracted from each of the musicalstimuli using Matlab and toolboxes Mitrovic et al. (2010) andDubnov (2006). In total 135 acoustic features were extracted fromthe music.
2.2.1. Temporal featuresTemporal features refer to time-varying characteristics
extracted from a signal. Temporal features may describe aspectsof the amplitude and/or the energy of the signal. In this study weuse the following summary temporal features: zero crossings(Kedem, 1986), an amplitude descriptor (Mitrovic, Zeppelzauer, &Breiteneder, 2006), the short-time energy (Zhang & Kuo, 2001),and beats per minute.
Zero crossings rate (ZCR) is defined as the number of zero cross-ings within the audio signal time series in a fixed time window oflength W , which is slid over the length of the signal with no over-lap. The ZCR has been described as a measure of the dominant fre-quency of the signal (Kedem, 1986). It has been used as a feature ina range of problems, for example in music genre classification(Martin Mckinney, 2003). However, for complex music waveforms,it is unclear whether ZCR alone will provide an adequate descrip-tion of the music such that the emotional response of a participantcan be predicted.
Amplitude descriptors separate the audio signal into segmentsof low and high absolute amplitude via adaptive thresholding, inwhich the threshold is adapted based upon the current meanamplitude of the signal. The descriptor is then composed of theduration, variation in duration, and independent energy of thesesegments. This provides a description of the sound in terms of itsenvelope. Amplitude descriptors have been implemented in animalsound recognition but can also be used for describing audio signalssuch as music. This suggests that they are readily adaptable tocomplex waveform analysis such as music (Mitrovic et al., 2010).
Short-time energy provides a description of the signal envelope.As recommended in Mitrovic et al. (2010), we used the definitionfrom Zhang and Kuo (2001) in which short-time energy is definedas the mean energy per window of length W , which is slid over thesignal with no overlap.
Beats per minute may be used to describe the tempo of music.Beats represent a measure of tempo of the audio signal that is away of measuring the change in the patterns of energy in the musicover time (Pampalk, Rauber, & Merkl, 2002).
Beat tracking of the music clips is performed via the dynamicprogramming approach proposed in Ellis (2007). The mean andstandard deviation of the beats per minute are estimated fromeach music clip over the entire duration of the musical stimuli.
2.2.2. Spectral featuresFrequency-based features describe a signal in terms of its spec-
tral content. Thus, the signal must be first translated into the fre-quency domain, for example via application of a Fourier orwavelet transform. Descriptions of the spectral content of the sig-nal can then be extracted. Physical frequency features refer to thephysical properties of the signal, as opposed to how listeners mayperceive the signal (Mitrovic et al., 2010). The spectral features ofinterest are spectral centroid (with the semantic meaning ofbrightness) (Scheirer & Slaney, 1997), autoregressive features(Rabiner, 1979), Daubechies wavelet coefficient histogram (Li,Ogihara, & Li, 2003), spectral flux (Scheirer & Slaney, 1997), spec-tral slope (Morchen, Ultsch, Thies, & Lohken, 2006), and cepstralfeatures, specifically the Mel-cepstral coefficients.
The spectral centroid is defined as the centre of gravity of themagnitude spectrum and is used to identify the point in the fre-quency spectrum of the signal with the greatest concentration ofenergy. Spectral centroid provides a measure of brightness of thesignal, where brightness describes whether an audio signal is dom-inated by low or high frequencies. The greater the dominance ofhigh frequencies in the signal the higher the brightness (Scheirer& Slaney, 1997).
Autoregressive features attempt to describe an audio signal byhow well a linear predictor may estimate each value in the signalbased upon previous values. Thus, this provides a measure of pre-dictability and stability in the signal over time (Mitrovic et al.,2010).
Daubechies wavelet coefficient histogram features (DWCH)provide a measure of the mean frequency content of the audio sig-nal in a set of discrete frequency bands. From each sub-band, thefirst three statistical moments describe the energy and variationand comprise a measure of the energy per sub-band over time.DWCH features have been used in a number of applications,including genre classification (Li et al., 2003).
Spectral flux is defined as the Euclidean norm of the window-to-window differences in spectral amplitude. Spectral flux maybe used to measure the rate of change of the spectrum of the signalover time. Audio signals with lots of large changes in spectrum willhave a high spectral flux, while audio with only a small amount ofchange will have a low spectral flux (Scheirer & Slaney, 1997).Spectral flux is used in a number of applications, including retrievalof musical structure (Li & Ogihara, 2004).
Spectral slope attempts to approximate the shape of the spec-trum by applying a linear regression. The angle of the slope repre-sents the change in frequency content of the signal from low tohigh frequencies and may be used as an alternative feature to iden-tify the relative frequency content of the signal (Morchen et al.,2006).
Cepstral features are defined as frequency-smoothed represen-tations of the log magnitude spectrum that aim to capture timbralcharacteristics and pitch of the signal (Davis & Mermelstein, 1980).They are widely used in speech, music, and environmental noiseprocessing. In this work we employ Mel-frequency cepstral coeffi-cients (MFCCs) as features to describe the audio signals (Stevens,1937).
MFCCs are computed by first converting Fourier coefficients ofthe signal to Mel-scale, where a Mel refers to a difference in pitchthat is noticeable to a human listener. The resulting vectors arethen logarithmized and decorrelated to remove redundant infor-mation. The MFCCs capture the timbre and pitch of the signal by

4 I. Daly et al. / Brain and Cognition 101 (2015) 1–11
providing a representation of the shape of the spectrum (Stevens,1937).
2.2.3. Spectro-temporal featuresThe set of perceptual frequency features used in this analysis
contains features for which there is a specific semantic meaningthat may be attached to the feature. Thus, these features are rele-vant to the human auditory perception of sound. The spectral rolloff point (Scheirer & Slaney, 1997), specific loudness sensation(Pampalk et al., 2002), and Shepard (1964) are investigated.
Spectral roll off is defined as the frequency below which 95% ofthe content of the power spectrum is located. Spectral roll off pro-vides a measure of tonality of the signal (Mitrovic et al., 2010). Ton-ality may be described as an attempt to differentiate tonal soundsfrom noise-like sounds and may be measured by looking at theflatness of the spectrum. The flatter the spectrum the morenoise-like. Spectral roll off as a tonality measure has been usedin music information retrieval (Morchen et al., 2006).
Specific loudness sensation measures the perceived loudness ofan audio signal. This is done by first computing a Bark-scaled spec-trogram before applying spectral masking to extract a measure ofloudness sensation (Pampalk et al., 2002). The bands of the spec-trogram reflect characteristics of the cochlea and inner ear of theauditory system, while the spectral masking reflects the occlusionof quiet sounds by louder sounds when both are present at similarfrequencies (Fastl & Zwicker, 2007).
Chroma is used to measure the pitch of an audio signal. This isdone by measuring a chromagram from the signal, a measure ofthe spectral energy of the signal at each one of 12 different pitchclasses. This measure is based upon the short time Fourier trans-form (Goto, 2006). Chroma also provides a general description ofthe music content at different pitches. Therefore, it is independentof a particular musical theory.
2.3. EEG features
2.3.1. Pre-processingPrior to use of the EEG signals for analysis we first attempted to
remove artefacts from the signals. This was done by first visuallyinspecting the EEG and manually labelling portions of the data thatcontained artefacts. Independent component analysis (ICA) wasthen used to separate the EEG into components containing EEGdata and components containing artefacts.
Artefact-contaminated components were then identified viavisual inspection and removed before reconstruction of the cleanedEEG. Trials within the data were then marked for inclusion in theanalysis if they were not previously labelled as containing elec-tromyogram (EMG) artefacts and they did not contain any ampli-tude values greater than �100 uV.
This resulted in a total of 31.03% of the trials been removed andleft 800 artefact-free trials for analysis. Further details of this arte-fact removal process are reported in Daly et al. (2014).
2.3.2. Feature extractionTwo different types of features were extracted from the EEG;
band-power features and pre-frontal asymmetry features.Band power features were extracted from each of the 19 chan-
nels by taking the mean band power from 0–12 s relative to thestart time of the music. Twenty non-overlapping frequency bandsof width 4 Hz were used from 0 Hz to 80 Hz. Pre-frontal asymme-try is defined here as the difference between the EEG band-poweractivity on channel F3 and the EEG band-power activity on F4within each frequency band.
This results in a set of 400 unique features describing the EEGactivity during each trial.
2.4. Feature search
The set of acoustic features and EEG features are combined tomake a set of 535 candidate features (400 EEG features and 135acoustic features). We attempt to identify a subset of these fea-tures for use in predicting participant-reported music-inducedemotions.
To do this a feature selection method based upon principal com-ponent analysis is used (Daly et al., 2014). This method first uni-formly re-distributes the candidate feature set and coarse grainsit. The covariance matrix is then found between all candidate fea-tures and an additional vector, appended to the candidate featureset, containing the responses PC currently of interest.
Principal component analysis (PCA) is applied to identify thedirection of maximum variance. A participation index is then cal-culated, which defines the involvement of each principal compo-nent with the vector containing the response PC. The top 5’thpercentile of these participation indices identify the feature setwhich is most suitable for identifying the corresponding emotionalresponses to the music reported by the participants.
Further details on the method are reported in Daly et al. (2014).
2.5. Prediction
A model is sought that predicts the emotional responses of theparticipants to the music in terms of each of the response PCs. Lin-ear regression models are fitted to the emotional content of themusic, as reported by the participants and recorded in the responsePCs.
For each response PC a linear regression model is sought thatmaximises the amount of variance in the response PCs explainedby the selected features. This is used to suggest which features willhave the greatest impact on the emotional responses reported bythe listeners.
2.6. Model training
A 10 � 10 cross-fold train and validation scheme is used to firstidentify subsets of features which best relate to each of theresponse PCs and, second, train a regression model using theseresponse PCs. Thus, separate cross-fold procedures are run to findlinear regression models that fit to each of the three response PCs.
Within the training set, in each fold, the regression model istrained by a stepwise training process, which iteratively considerscombinations of the selected features as terms for use in the model.After training, the model is applied to attempt to predict theresponse PCs to each of the trials within the held-out testing set.
2.7. Evaluating the results
The performance of the prediction method is evaluated by iden-tifying how close the predicted response PCs are to the actualrecorded response PCs. This is done for each item in the testingset within each fold of the cross-fold train and validation scheme.
Performance is evaluated by calculating the correlationbetween the actual response PCs and the predicted response PCs.The statistical significance of this correlation is estimatedparametrically.
3. Results
The performance of the prediction approach is evaluated firstfor the combination of both EEG features and acoustic features. Itis then evaluated for EEG features and acoustic features separately.
I. Daly et al. / Brain and Cognition 101 (2015) 1–11 5
3.1. Combined features
Each response PC is considered individually. Feature subsets aresought that can be used to predict the responses of participants tothe music in each trial.
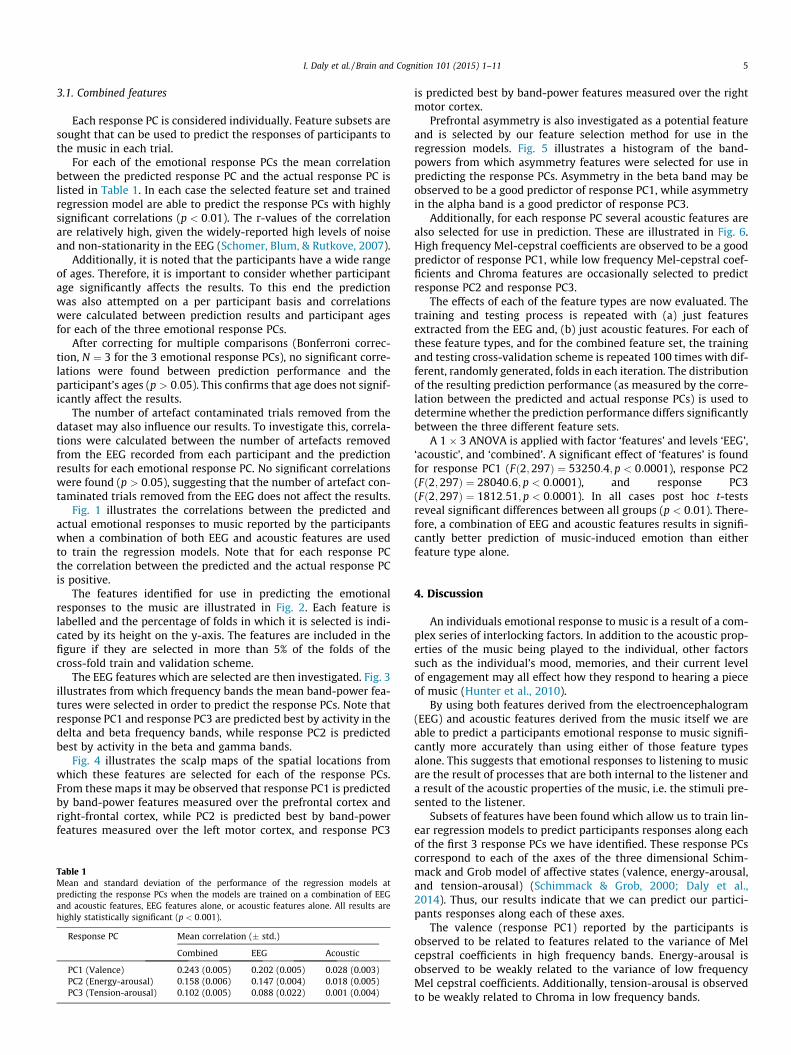
For each of the emotional response PCs the mean correlationbetween the predicted response PC and the actual response PC islisted in Table 1. In each case the selected feature set and trainedregression model are able to predict the response PCs with highlysignificant correlations (p < 0:01). The r-values of the correlationare relatively high, given the widely-reported high levels of noiseand non-stationarity in the EEG (Schomer, Blum, & Rutkove, 2007).
Additionally, it is noted that the participants have a wide rangeof ages. Therefore, it is important to consider whether participantage significantly affects the results. To this end the predictionwas also attempted on a per participant basis and correlationswere calculated between prediction results and participant agesfor each of the three emotional response PCs.
After correcting for multiple comparisons (Bonferroni correc-tion, N ¼ 3 for the 3 emotional response PCs), no significant corre-lations were found between prediction performance and theparticipant’s ages (p > 0:05). This confirms that age does not signif-icantly affect the results.
The number of artefact contaminated trials removed from thedataset may also influence our results. To investigate this, correla-tions were calculated between the number of artefacts removedfrom the EEG recorded from each participant and the predictionresults for each emotional response PC. No significant correlationswere found (p > 0:05), suggesting that the number of artefact con-taminated trials removed from the EEG does not affect the results.
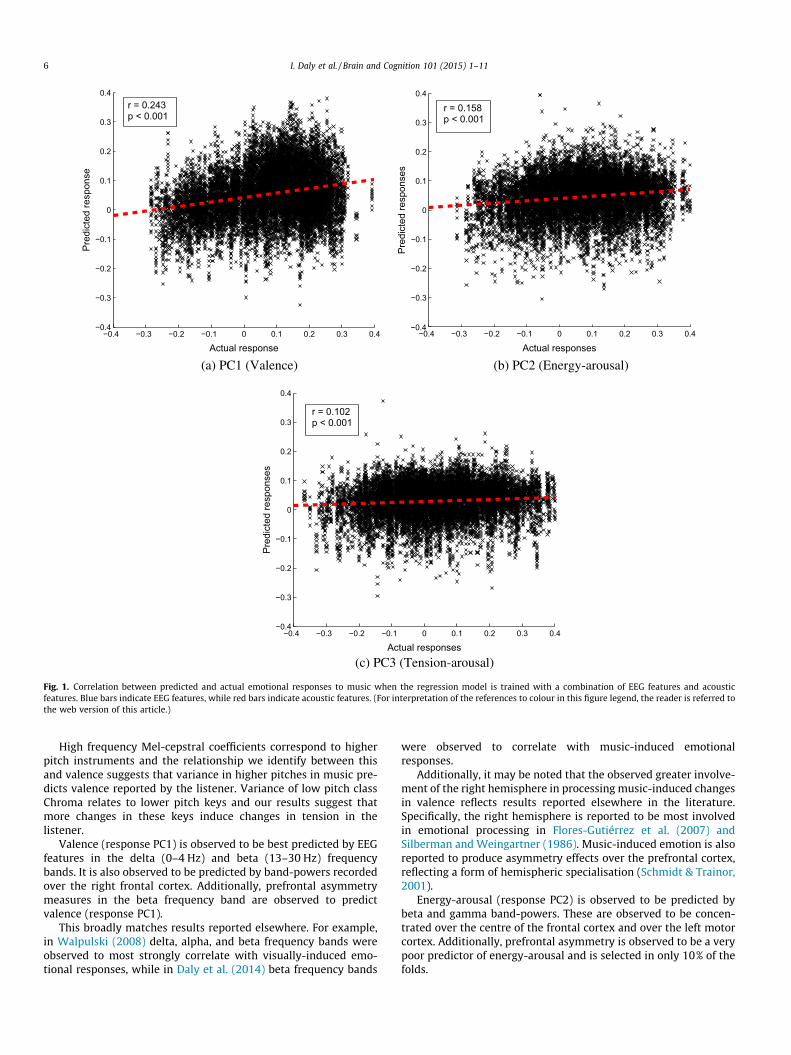
Fig. 1 illustrates the correlations between the predicted andactual emotional responses to music reported by the participantswhen a combination of both EEG and acoustic features are usedto train the regression models. Note that for each response PCthe correlation between the predicted and the actual response PCis positive.
The features identified for use in predicting the emotionalresponses to the music are illustrated in Fig. 2. Each feature islabelled and the percentage of folds in which it is selected is indi-cated by its height on the y-axis. The features are included in thefigure if they are selected in more than 5% of the folds of thecross-fold train and validation scheme.
The EEG features which are selected are then investigated. Fig. 3illustrates from which frequency bands the mean band-power fea-tures were selected in order to predict the response PCs. Note thatresponse PC1 and response PC3 are predicted best by activity in thedelta and beta frequency bands, while response PC2 is predictedbest by activity in the beta and gamma bands.
Fig. 4 illustrates the scalp maps of the spatial locations fromwhich these features are selected for each of the response PCs.From these maps it may be observed that response PC1 is predictedby band-power features measured over the prefrontal cortex andright-frontal cortex, while PC2 is predicted best by band-powerfeatures measured over the left motor cortex, and response PC3
Table 1Mean and standard deviation of the performance of the regression models atpredicting the response PCs when the models are trained on a combination of EEGand acoustic features, EEG features alone, or acoustic features alone. All results arehighly statistically significant (p < 0:001).
Response PC Mean correlation (� std.)
Combined EEG Acoustic
PC1 (Valence) 0.243 (0.005) 0.202 (0.005) 0.028 (0.003)PC2 (Energy-arousal) 0.158 (0.006) 0.147 (0.004) 0.018 (0.005)PC3 (Tension-arousal) 0.102 (0.005) 0.088 (0.022) 0.001 (0.004)
is predicted best by band-power features measured over the rightmotor cortex.
Prefrontal asymmetry is also investigated as a potential featureand is selected by our feature selection method for use in theregression models. Fig. 5 illustrates a histogram of the band-powers from which asymmetry features were selected for use inpredicting the response PCs. Asymmetry in the beta band may beobserved to be a good predictor of response PC1, while asymmetryin the alpha band is a good predictor of response PC3.
Additionally, for each response PC several acoustic features arealso selected for use in prediction. These are illustrated in Fig. 6.High frequency Mel-cepstral coefficients are observed to be a goodpredictor of response PC1, while low frequency Mel-cepstral coef-ficients and Chroma features are occasionally selected to predictresponse PC2 and response PC3.
The effects of each of the feature types are now evaluated. Thetraining and testing process is repeated with (a) just featuresextracted from the EEG and, (b) just acoustic features. For each ofthese feature types, and for the combined feature set, the trainingand testing cross-validation scheme is repeated 100 times with dif-ferent, randomly generated, folds in each iteration. The distributionof the resulting prediction performance (as measured by the corre-lation between the predicted and actual response PCs) is used todetermine whether the prediction performance differs significantlybetween the three different feature sets.
A 1 � 3 ANOVA is applied with factor ‘features’ and levels ‘EEG’,‘acoustic’, and ‘combined’. A significant effect of ‘features’ is foundfor response PC1 (Fð2;297Þ ¼ 53250:4; p < 0:0001), response PC2(Fð2;297Þ ¼ 28040:6; p < 0:0001), and response PC3(Fð2;297Þ ¼ 1812:51; p < 0:0001). In all cases post hoc t-testsreveal significant differences between all groups (p < 0:01). There-fore, a combination of EEG and acoustic features results in signifi-cantly better prediction of music-induced emotion than eitherfeature type alone.
4. Discussion
An individuals emotional response to music is a result of a com-plex series of interlocking factors. In addition to the acoustic prop-erties of the music being played to the individual, other factorssuch as the individual’s mood, memories, and their current levelof engagement may all effect how they respond to hearing a pieceof music (Hunter et al., 2010).
By using both features derived from the electroencephalogram(EEG) and acoustic features derived from the music itself we areable to predict a participants emotional response to music signifi-cantly more accurately than using either of those feature typesalone. This suggests that emotional responses to listening to musicare the result of processes that are both internal to the listener anda result of the acoustic properties of the music, i.e. the stimuli pre-sented to the listener.
Subsets of features have been found which allow us to train lin-ear regression models to predict participants responses along eachof the first 3 response PCs we have identified. These response PCscorrespond to each of the axes of the three dimensional Schim-mack and Grob model of affective states (valence, energy-arousal,and tension-arousal) (Schimmack & Grob, 2000; Daly et al.,2014). Thus, our results indicate that we can predict our partici-pants responses along each of these axes.
The valence (response PC1) reported by the participants isobserved to be related to features related to the variance of Melcepstral coefficients in high frequency bands. Energy-arousal isobserved to be weakly related to the variance of low frequencyMel cepstral coefficients. Additionally, tension-arousal is observedto be weakly related to Chroma in low frequency bands.
−0.4 −0.3 −0.2 −0.1 0 0.1 0.2 0.3 0.4−0.4
−0.3
−0.2
−0.1
0
0.1
0.2
0.3
0.4
Actual response
Pre
dict
ed re
spon
se
r = 0.243p < 0.001
(a) PC1 (Valence)
−0.4 −0.3 −0.2 −0.1 0 0.1 0.2 0.3 0.4−0.4
−0.3
−0.2
−0.1
0
0.1
0.2
0.3
0.4
Actual responses
Pre
dict
ed re
spon
ses
r = 0.158 p < 0.001
(b) PC2 (Energy-arousal)
−0.4 −0.3 −0.2 −0.1 0 0.1 0.2 0.3 0.4−0.4
−0.3
−0.2
−0.1
0
0.1
0.2
0.3
0.4
Actual responses
Pre
dict
ed re
spon
ses
r = 0.102 p < 0.001
(c) PC3 (Tension-arousal)
Fig. 1. Correlation between predicted and actual emotional responses to music when the regression model is trained with a combination of EEG features and acousticfeatures. Blue bars indicate EEG features, while red bars indicate acoustic features. (For interpretation of the references to colour in this figure legend, the reader is referred tothe web version of this article.)
6 I. Daly et al. / Brain and Cognition 101 (2015) 1–11
High frequency Mel-cepstral coefficients correspond to higherpitch instruments and the relationship we identify between thisand valence suggests that variance in higher pitches in music pre-dicts valence reported by the listener. Variance of low pitch classChroma relates to lower pitch keys and our results suggest thatmore changes in these keys induce changes in tension in thelistener.
Valence (response PC1) is observed to be best predicted by EEGfeatures in the delta (0–4 Hz) and beta (13–30 Hz) frequencybands. It is also observed to be predicted by band-powers recordedover the right frontal cortex. Additionally, prefrontal asymmetrymeasures in the beta frequency band are observed to predictvalence (response PC1).
This broadly matches results reported elsewhere. For example,in Walpulski (2008) delta, alpha, and beta frequency bands wereobserved to most strongly correlate with visually-induced emo-tional responses, while in Daly et al. (2014) beta frequency bands
were observed to correlate with music-induced emotionalresponses.
Additionally, it may be noted that the observed greater involve-ment of the right hemisphere in processing music-induced changesin valence reflects results reported elsewhere in the literature.Specifically, the right hemisphere is reported to be most involvedin emotional processing in Flores-Gutiérrez et al. (2007) andSilberman and Weingartner (1986). Music-induced emotion is alsoreported to produce asymmetry effects over the prefrontal cortex,reflecting a form of hemispheric specialisation (Schmidt & Trainor,2001).
Energy-arousal (response PC2) is observed to be predicted bybeta and gamma band-powers. These are observed to be concen-trated over the centre of the frontal cortex and over the left motorcortex. Additionally, prefrontal asymmetry is observed to be a verypoor predictor of energy-arousal and is selected in only 10% of thefolds.
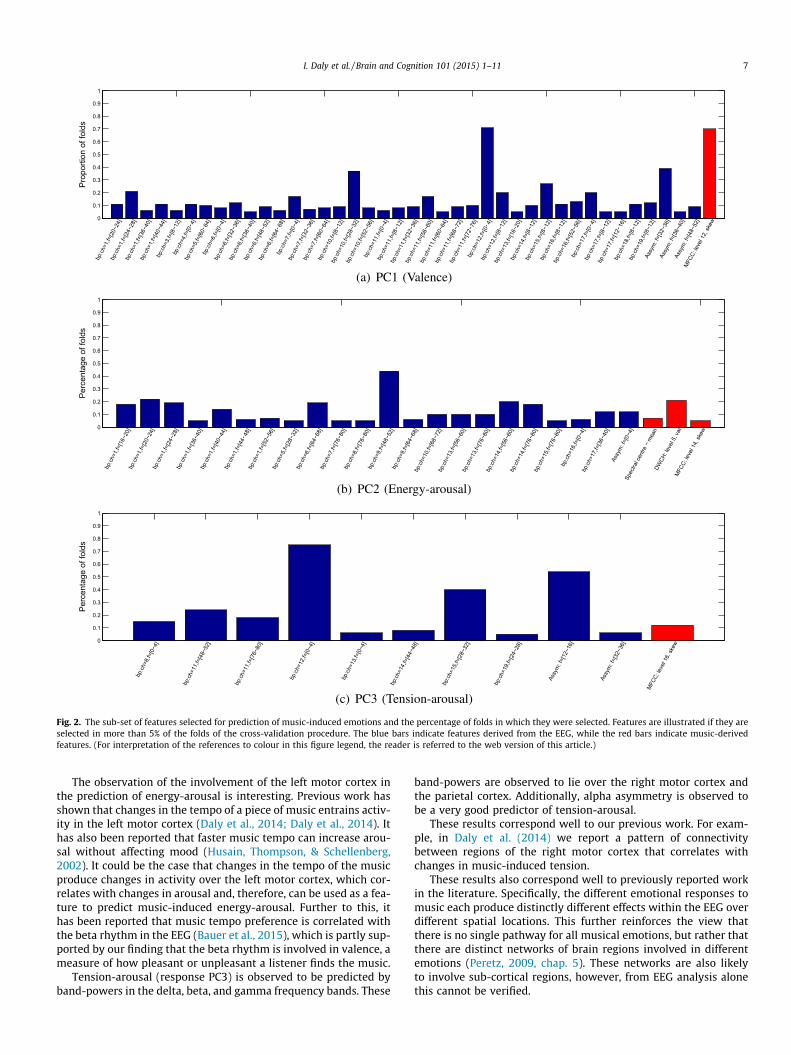
Fig. 2. The sub-set of features selected for prediction of music-induced emotions and the percentage of folds in which they were selected. Features are illustrated if they areselected in more than 5% of the folds of the cross-validation procedure. The blue bars indicate features derived from the EEG, while the red bars indicate music-derivedfeatures. (For interpretation of the references to colour in this figure legend, the reader is referred to the web version of this article.)
I. Daly et al. / Brain and Cognition 101 (2015) 1–11 7
The observation of the involvement of the left motor cortex inthe prediction of energy-arousal is interesting. Previous work hasshown that changes in the tempo of a piece of music entrains activ-ity in the left motor cortex (Daly et al., 2014; Daly et al., 2014). Ithas also been reported that faster music tempo can increase arou-sal without affecting mood (Husain, Thompson, & Schellenberg,2002). It could be the case that changes in the tempo of the musicproduce changes in activity over the left motor cortex, which cor-relates with changes in arousal and, therefore, can be used as a fea-ture to predict music-induced energy-arousal. Further to this, ithas been reported that music tempo preference is correlated withthe beta rhythm in the EEG (Bauer et al., 2015), which is partly sup-ported by our finding that the beta rhythm is involved in valence, ameasure of how pleasant or unpleasant a listener finds the music.
Tension-arousal (response PC3) is observed to be predicted byband-powers in the delta, beta, and gamma frequency bands. These
band-powers are observed to lie over the right motor cortex andthe parietal cortex. Additionally, alpha asymmetry is observed tobe a very good predictor of tension-arousal.
These results correspond well to our previous work. For exam-ple, in Daly et al. (2014) we report a pattern of connectivitybetween regions of the right motor cortex that correlates withchanges in music-induced tension.
These results also correspond well to previously reported workin the literature. Specifically, the different emotional responses tomusic each produce distinctly different effects within the EEG overdifferent spatial locations. This further reinforces the view thatthere is no single pathway for all musical emotions, but rather thatthere are distinct networks of brain regions involved in differentemotions (Peretz, 2009, chap. 5). These networks are also likelyto involve sub-cortical regions, however, from EEG analysis alonethis cannot be verified.

0 10 20 30 40 50 60 70 800
0.1
0.2
0.3
0.4
0.5
0.6
0.7
0.8
0.9
1
Frequency (Hz)
Per
cent
age
of fo
lds
(a) PC1 (Valence)
0 10 20 30 40 50 60 70 800
0.1
0.2
0.3
0.4
0.5
0.6
0.7
0.8
0.9
1
Frequency (Hz)
Per
cent
age
of fo
lds
(b) PC2 (Energy-arousal)
0 10 20 30 40 50 60 70 800
0.1
0.2
0.3
0.4
0.5
0.6
0.7
0.8
0.9
1
Frequency (Hz)
Per
cent
age
of fo
lds
(c) PC3 (Tension-arousal)
Fig. 3. Histograms of the frequency bands from which band-power features are selected for use in the regression models used to predict emotional responses to music.
(a) PC1 (Valence) (b) PC2 (Energy-arousal)
(c) PC3 (Tension-arousal)
Fig. 4. Scalp maps of the spatial locations from which band-power features are
8 I. Daly et al. / Brain and Cognition 101 (2015) 1–11
Thus, the regression models we identify in this study are able toaccurately predict the affective responses of listeners to previouslyunheard pieces of music. The correlation between the predictedaffective responses and the actual responses is highest for valence.This may be due to the selection of the candidate EEG features andacoustic features available in this study more strongly relating tovalence than arousal or the linear regression models better mod-elling relationships between our candidate features and valence.It may also be the case that valence is a more stable, less variable,and hence more easily predicted affective response to music. How-ever, this would need further verification.
The relationships observed in this study are correlational in nat-ure and indicate which acoustic properties of a variety of pieces ofmusic relate to perceived emotions in a population of 31 listeners.However, the complex nature of these interactions means that it isdifficult to determine the specific relationships between thesefeatures.
Thus, if one wishes to modulate the emotions induced by listen-ing to a piece of music, it is not necessarily simply a matter ofmanipulating one acoustic feature of the music independently ofthe others. Rather, both the relationships between the music fea-tures and the listener’s current neurophysiological state needs tobe understood before the emotional response of a listener to a par-ticular piece of music can be predicted.
selected for use in the regression models used to predict emotional responses tomusic.

0 10 20 30 40 50 60 70 800
0.1
0.2
0.3
0.4
0.5
0.6
0.7
0.8
0.9
1
Frequency (Hz)
Per
cent
age
of fo
lds
(a) PC1 (Valence)
0 10 20 30 40 50 60 70 800
0.1
0.2
0.3
0.4
0.5
0.6
0.7
0.8
0.9
1
Frequency (Hz)
Per
cent
age
of fo
lds
(b) PC2 (Energy-arousal)
0 10 20 30 40 50 60 70 800
0.1
0.2
0.3
0.4
0.5
0.6
0.7
0.8
0.9
1
Frequency (Hz)
Per
cent
age
of fo
lds
(c) PC3 (Tension-arousal)
Fig. 5. Histograms of the frequency bands from which asymmetry features are selected for use in the regression models used to predict emotional responses to music. Note,bands have a width of 4 Hz.
I. Daly et al. / Brain and Cognition 101 (2015) 1–11 9
The acoustic features we use are estimated directly from themusic signals via the use of signal processing methods. Therefore,they provide a way of examining the music from a signal process-ing perspective that is independent of any specific music theory.However, consequently the translation between this perspectiveand that provided by specific music theories composed of notes,keys, and scores is not immediately apparent for the majority ofacoustic features. These musical features tend to be structural orhigher-level combinations of various acoustic features. Relatingthe acoustic features we identify as suitable for use in predictingmusic-induced emotion to their corresponding musical featuresis a significant area for further work, which is outside the scopeof this study.
The results reported in this study provide some reinforcementfor findings reported elsewhere that some music properties, suchas tempo, relate to affective states based upon energy and arousal(Husain et al., 2002). They also support findings that valence per-
ceived by listening to music relates to EEG measures including pre-frontal asymmetry.
Finally, our findings may also be compared to results reportedin Livingstone and Thompson (2006) in which relationshipsbetween musical descriptors and perceived emotions aredescribed. In Livingstone and Thompson (2006) pitch is reportedto weakly correlate with valence, a finding also supported by ourwork.
Future work will seek to build upon these findings to constructa generative music system to create novel music containing partic-ular combinations of acoustic properties known to induce particu-lar emotional states. This has applications in, amongst other areas,music therapy, and the emerging field of brain-computer musicinterfacing (Daly et al., 2014; Miranda, Magee, Wilson, Eaton, &Palaniappan, 2011).
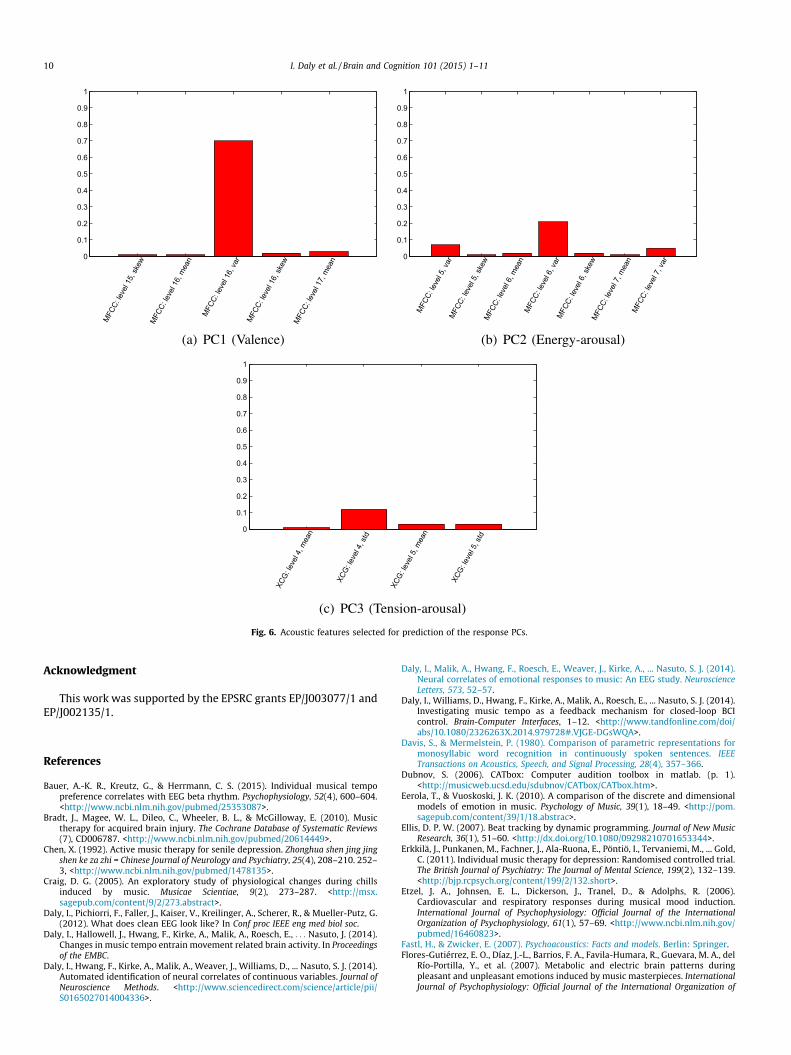
Fig. 6. Acoustic features selected for prediction of the response PCs.
10 I. Daly et al. / Brain and Cognition 101 (2015) 1–11
Acknowledgment
This work was supported by the EPSRC grants EP/J003077/1 andEP/J002135/1.
References
Bauer, A.-K. R., Kreutz, G., & Herrmann, C. S. (2015). Individual musical tempopreference correlates with EEG beta rhythm. Psychophysiology, 52(4), 600–604.<http://www.ncbi.nlm.nih.gov/pubmed/25353087>.
Bradt, J., Magee, W. L., Dileo, C., Wheeler, B. L., & McGilloway, E. (2010). Musictherapy for acquired brain injury. The Cochrane Database of Systematic Reviews(7), CD006787. <http://www.ncbi.nlm.nih.gov/pubmed/20614449>.
Chen, X. (1992). Active music therapy for senile depression. Zhonghua shen jing jingshen ke za zhi = Chinese Journal of Neurology and Psychiatry, 25(4), 208–210. 252–3, <http://www.ncbi.nlm.nih.gov/pubmed/1478135>.
Craig, D. G. (2005). An exploratory study of physiological changes during chillsinduced by music. Musicae Scientiae, 9(2), 273–287. <http://msx.sagepub.com/content/9/2/273.abstract>.
Daly, I., Pichiorri, F., Faller, J., Kaiser, V., Kreilinger, A., Scherer, R., & Mueller-Putz, G.(2012). What does clean EEG look like? In Conf proc IEEE eng med biol soc.
Daly, I., Hallowell, J., Hwang, F., Kirke, A., Malik, A., Roesch, E., . . . Nasuto, J. (2014).Changes in music tempo entrain movement related brain activity. In Proceedingsof the EMBC.
Daly, I., Hwang, F., Kirke, A., Malik, A., Weaver, J., Williams, D., ... Nasuto, S. J. (2014).Automated identification of neural correlates of continuous variables. Journal ofNeuroscience Methods. <http://www.sciencedirect.com/science/article/pii/S0165027014004336>.
Daly, I., Malik, A., Hwang, F., Roesch, E., Weaver, J., Kirke, A., ... Nasuto, S. J. (2014).Neural correlates of emotional responses to music: An EEG study. NeuroscienceLetters, 573, 52–57.
Daly, I., Williams, D., Hwang, F., Kirke, A., Malik, A., Roesch, E., ... Nasuto, S. J. (2014).Investigating music tempo as a feedback mechanism for closed-loop BCIcontrol. Brain-Computer Interfaces, 1–12. <http://www.tandfonline.com/doi/abs/10.1080/2326263X.2014.979728#.VJGE-DGsWQA>.
Davis, S., & Mermelstein, P. (1980). Comparison of parametric representations formonosyllabic word recognition in continuously spoken sentences. IEEETransactions on Acoustics, Speech, and Signal Processing, 28(4), 357–366.
Dubnov, S. (2006). CATbox: Computer audition toolbox in matlab. (p. 1).<http://musicweb.ucsd.edu/sdubnov/CATbox/CATbox.htm>.
Eerola, T., & Vuoskoski, J. K. (2010). A comparison of the discrete and dimensionalmodels of emotion in music. Psychology of Music, 39(1), 18–49. <http://pom.sagepub.com/content/39/1/18.abstrac>.
Ellis, D. P. W. (2007). Beat tracking by dynamic programming. Journal of New MusicResearch, 36(1), 51–60. <http://dx.doi.org/10.1080/09298210701653344>.
Erkkilä, J., Punkanen, M., Fachner, J., Ala-Ruona, E., Pöntiö, I., Tervaniemi, M., ... Gold,C. (2011). Individual music therapy for depression: Randomised controlled trial.The British Journal of Psychiatry: The Journal of Mental Science, 199(2), 132–139.<http://bjp.rcpsych.org/content/199/2/132.short>.
Etzel, J. A., Johnsen, E. L., Dickerson, J., Tranel, D., & Adolphs, R. (2006).Cardiovascular and respiratory responses during musical mood induction.International Journal of Psychophysiology: Official Journal of the InternationalOrganization of Psychophysiology, 61(1), 57–69. <http://www.ncbi.nlm.nih.gov/pubmed/16460823>.
Fastl, H., & Zwicker, E. (2007). Psychoacoustics: Facts and models. Berlin: Springer.Flores-Gutiérrez, E. O., Díaz, J.-L., Barrios, F. A., Favila-Humara, R., Guevara, M. A., del
Río-Portilla, Y., et al. (2007). Metabolic and electric brain patterns duringpleasant and unpleasant emotions induced by music masterpieces. InternationalJournal of Psychophysiology: Official Journal of the International Organization of
I. Daly et al. / Brain and Cognition 101 (2015) 1–11 11
Psychophysiology, 65(1), 69–84. <http://www.ncbi.nlm.nih.gov/pubmed/17466401>.
Gabrielsson, A. & Juslin, P. N. (2003). Emotional expression in music. In Handbook ofaffective sciences (pp. 503–534).
Gabrielsson, A. & Lindström, E. (2001). The influence of musical structure onemotional expression. In Music and emotion: Theory and research (pp. 223–248).
Gosselin, N. (2005). Impaired recognition of scary music following unilateraltemporal lobe excision. Brain, 128(3), 628–640. <http://www.ncbi.nlm.nih.gov/pubmed/15699060>.
Gosselin, N., Peretz, I., Johnsen, E., & Adolphs, R. (2007). Amygdala damage impairsemotion recognition from music. Neuropsychologia, 45(2), 236–244. <http://www.ncbi.nlm.nih.gov/pubmed/16970965>.
Goto, M. (2006). A chorus section detection method for musical audio signals and itsapplication to a music listening station. IEEE Transactions on Audio, Speech andLanguage Processing, 14(5), 1783–1794. <http://dl.acm.org/citation.cfm?id=2209815.2210582>.
Hunter, P. G., Schellenberg, E. G., & Schimmack, U. (2010). Feelings and perceptionsof happiness and sadness induced by music: Similarities, differences, and mixedemotions. Psychology of Aesthetics, 4(1), 47–56.
Husain, G., Thompson, W., & Schellenberg, E. (2002). Effects of musical empo andmode on arousal, mood, and spatial abilities. Music Perception, 20, 151–171.
Jausovec, N., & Jausovec, K. (2005). Differences in induced gamma and upper alphaoscillations in the human brain related to verbal/performance and emotionalintelligence. International Journal of Psychophysiology: Official Journal of theInternational Organization of Psychophysiology, 56(3), 223–235. <http://www.sciencedirect.com/science/article/pii/S0167876004002284>.
Kedem, B. (1986). Spectral analysis and discrimination by zero-crossings.Proceedings of the IEEE, 74(11), 1477–1493.
Kim, J., & André, E. (2008). Emotion recognition based on physiological changes inmusic listening. IEEE Transactions on Pattern Analysis and Machine Intelligence, 30(12), 2067–2083. <http://www.ncbi.nlm.nih.gov/pubmed/18988943>.
Lin, Y.-P., Wang, C.-H., Jung, T.-P., Wu, T.-L., Jeng, S.-K., Duann, J.-R., et al. (2010).EEG-based emotion recognition in music listening. IEEE Transactions on Bio-Medical Engineering, 57(7), 1798–1806. <http://www.ncbi.nlm.nih.gov/pubmed/20442037>.
Li, T., & Ogihara, M. (2004). Music artist style identification by semi-supervisedlearning from both lyrics and content. In Proceedings of the 12th annual ACMinternational conference on Multimedia – MULTIMEDIA ’04 (pp. 364). New York,New York, USA: ACM Press.
Li, T., Ogihara, M., & Li, Q. (2003). A comparative study on content-based musicgenre classification. In Proceedings of the 26th annual international ACM SIGIRconference on research and development in information retrieval – SIGIR ’03(pp. 282). New York, New York, USA: ACM Press.
Livingstone, S. R., & Thompson, W. F. (2006). Multimodal affective interaction.MusicPerception, 24(1), 89–94. <http://espace.library.uq.edu.au/view/UQ:8039>.
Livingstone, R. S., & Thompson, W. F. (2009). The emergence of music from thetheory of mind. Musicae Scientiae, 13(2 Suppl), 83–115. <http://msx.sagepub.com/content/13/2_suppl/83.abstract>.
Lundqvist, L.-O., Carlsson, F., Hilmersson, P., & Juslin, P. N. (2008). Emotionalresponses to music: Experience, expression, and physiology. Psychology ofMusic, 37(1), 61–90. <http://pom.sagepub.com/content/early/2008/10/15/0305735607086048.short>.
Maratos, A. S., Gold, C., Wang, X., & Crawford, M. J. (2008). Music therapy fordepression. The Cochrane Database of Systematic Reviews (1), CD004517. <http://www.ncbi.nlm.nih.gov/pubmed/18254052>.
Martin Mckinney, J. B. (2003). Features for audio and music classification. InProceedings of the international symposium on music information retrieval.
McDermott, O., Crellin, N., Ridder, H. M., & Orrell, M. (2013). Music therapy indementia: A narrative synthesis systematic review. International Journal ofGeriatric Psychiatry, 28(8), 781–794. <http://www.ncbi.nlm.nih.gov/pubmed/23080214>.
Miranda, E. R., Magee, W. L., Wilson, J. J., Eaton, J., & Palaniappan, R. (2011). Brain-Computer Music Interfacing (BCMI): From basic research to the real world ofspecial needs. Music and Medicine, 3(3), 134–140.
Mitrovic, D., Zeppelzauer, M., & Breiteneder, C. (2006). Discrimination and retrievalof animal sounds. In 2006 12th International multi-media modelling conference.IEEE (pp. 339–343).
Mitrovic, D., Zeppelzauer, M., & Breiteneder, C. (2010). Features for content-basedaudio retrieval. In Advances in computers (Vol. 78, pp. 71–150).
Morchen, F., Ultsch, A., Thies, M., & Lohken, I. (2006). Modeling timbre distance withtemporal statistics from polyphonic music. IEEE Transactions on Audio, Speechand Language Processing, 14(1), 81–90.
Pampalk, E., Rauber, A., & Merkl, D. (2002). Content-based organization andvisualization of music archives. In Proceedings of the tenth ACM internationalconference on Multimedia – MULTIMEDIA ’02 (pp. 570). New York, New York,USA: ACM Press.
Peretz, I. (2009). Towards a neurobiology of musical emotions – Oxford scholarship.Handbook of Music and Emotion: Theory, Research, Applications, 99–126. <http://www.oxfordscholarship.com/view/10.1093/acprof:oso/9780199230143.001.0001/acprof-9780199230143-chapter-5>.
Peretz, I., Aube, W., & Armony, J. L. (2013). Toward a neurobiology of musicalemotions. In The Evolution of Emotional Communication: From Sounds inNonhuman Mammals to Speech and Music in Man (pp. 277–299). OxfordUniversity Press. <http://books.google.com/books?hl=en&lr=&id=EQvmZn1Ino4C&pgis=1>.
Rabiner (1979). Digital processing of speech signals. Pearson Education.<http://books.google.com/books?id=JAIj5fucWiUC&pgis=1>.
Russell, J. A. (1980). A circumplex model of affect. Journal of Personality and SocialPsychology, 1161–1178.
Scheirer, E., & Slaney, M. (1997). Construction and evaluation of a robustmultifeature speech/music discriminator. 1997 IEEE international conference onacoustics, speech, and signal processing (Vol. 2, pp. 1331–1334). IEEE Comput.Soc. Press.
Scherer, K. R. (2004). Which emotions can be induced by music? What are theunderlying mechanisms? And how can we measure them? Journal of New MusicResearch, 33(3), 239–251.
Schimmack, U., & Grob, A. (2000). Dimensional models of core affect: A quantitativecomparison by means of structural equation modeling. European Journal ofPersonality, 14(4), 21.
Schmidt, L. A., & Trainor, L. J. (2001). Frontal brain electrical activity (EEG)distinguishes valence and intensity of musical emotions. Cognition & Emotion,15(4), 487–500. <http://dx.doi.org/10.1080/02699930126048>.
Schomer, D. L., Blum, A. S., & Rutkove, S. B. (2007). The clinical neurophysiologyprimer. In A. S. Blum & S. B. Rutkove (Eds.). Totowa, NJ: Humana Press. <http://www.springerlink.com/content/m6v44115r6803181/>.
Schubert, E. (1999). Measurement and time series analysis of emotion in music.<http://philpapers.org/rec/SCHMAT-13>.
Shepard, R. N. (1964). Circularity in judgments of relative pitch. The Journal of theAcoustical Society of America, 36(12), 2346.
Silberman, E. K., & Weingartner, H. (1986). Hemispheric lateralization of functionsrelated to emotion. Brain and Cognition, 5(3), 322–353. <http://www.sciencedirect.com/science/article/pii/0278262686900357>.
Stevens, S. S. (1937). A scale for the measurement of the psychological magnitudepitch. The Journal of the Acoustical Society of America, 8(3), 185.
Tamplin, J., & Baker, F. (2006). Music therapy methods in neurorehabilitation: Aclinician’s Manual. Jessica Kingsley Publishers. <http://books.google.com/books?hl=en&lr=&id=iIu3rAsairEC&pgis=1>.
Thompson, W., & Robitaille, B. (1992). Can composers express emotions throughmusic? Empirical Studies of the Arts, 10, 79–89.
van Tricht, M. J., Smeding, H. M. M., Speelman, J. D., & Schmand, B. A. (2010).Impaired emotion recognition in music in Parkinson’s disease. Brain andCognition, 74(1), 58–65. <http://www.sciencedirect.com/science/article/pii/S027826261000076X>.
Walpulski, M. (2008). EEG representation of emotion evoking pictures. Tech. Rep.,<http://essay.utwente.nl/58961/1/scriptie_M_Walpsuki.pdf>.
Wilkins, R. W., Hodges, D. A., Laurienti, P. J., Steen, M., & Burdette, J. H. (2014).Network science and the effects of music preference on functional brainconnectivity: From Beethoven to Eminem. Scientific Reports, 4, 6130. <http://www.nature.com/srep/2014/140828/srep06130/full/srep06130.html>.
Zhang, T., & Kuo, C. (2001). Content-based audio classification and retrieval foraudiovisual data parsing. Springer.