Embed Size (px)
Citation preview

NetBrain
PE V4.1 Help
1
Contents 1 Installation and License ........................................................................................... 1
1.1 Install NetBrain Workstation Personal Edition 4.1 .................................... 1
1.1.1 System requirement ........................................................................... 1
1.1.2 Install NetBrain Workstation Personal Edition 4.1 ............................. 1
1.2 Uninstall NetBrain Workstation Personal Edition 4.1 ............................... 2
1.3 Activate a Trial License .............................................................................. 3
2 Quick Start on Learning network knowledge via PE ............................................... 5
2.1 Documenting Learning Process ................................................................. 5
2.1.1 Build your Experimental Environment ............................................... 5
2.1.2 Execute Telnet/SSH CLI commands .................................................... 9
2.1.3 Collect show-command data ........................................................... 11
2.1.4 Write Map Notes .............................................................................. 16
2.2 Show your maps on Visual Learning Community ................................... 17
3 Work on Qmaps: ................................................................................................... 19
3.1 Create a map ........................................................................................... 19
3.1.1 ImportConfig files to create a dynamic Qmap ................................. 19
3.1.2 Discover Live Network (Load Dynamips .Net File) ........................... 21
3.2 Master Map Page .................................................................................... 24
3.2.1 Drag/ Drop device and extend its neighbors ................................... 25
3.2.2 Remove Device Configuration file from the Master Map Page ....... 26
3.2.3 Copy and Past Device Configuration Files ........................................ 27
3.3 View Properties of a Network Object ..................................................... 28
3.3.1 Device Properties ............................................................................. 28
3.3.2 Interface properties ......................................................................... 33
3.3.3 QmapPage properties ...................................................................... 36
3.4 Manage data inside a Qmap ................................................................... 37
3.4.1 Manage the map page ..................................................................... 37
3.4.2 Manage map notes .......................................................................... 38
3.4.3 Manage map DataFolders ................................................................ 42
3.4.4 Manage Attachment Files ................................................................ 45
3.5 Edit Maps ................................................................................................ 46
3.5.1 Basic editing operations ................................................................... 46
3.5.2 Change the map scale ...................................................................... 47
3.5.3 Auto layout ....................................................................................... 49
3.5.4 Draw shapes ..................................................................................... 49
3.5.5 Draw a device and a link manually................................................... 50
3.6 Copy a map ............................................................................................. 53
4 Use Maps to Understand Your Network ............................................................... 56
4.1 Tip window .............................................................................................. 56
4.1.1 Save a tip as a note .......................................................................... 57
4.1.2 Pinup/unpin a tip ............................................................................. 58
2
4.1.3 Show and Hide a tip ......................................................................... 58
4.2 Highlight .................................................................................................. 58
4.2.1 Highlight routing protocols .............................................................. 58
4.2.2 Highlight Multicasting mode ............................................................ 60
4.2.3 Highlight MPLS VRF .......................................................................... 61
4.2.4 Highlight interface rate .................................................................... 62
5 Network Access ..................................................................................................... 63
5.1 Device Settings ........................................................................................ 63
5.2 Access a live network device ................................................................... 65
5.2.1 Ping ................................................................................................... 65
5.2.2 Traceroute ........................................................................................ 66
5.2.3 Telnet/SSH ........................................................................................ 71
5.2.4 Windows Ping .................................................................................. 75
5.2.5 View device info via web browser ................................................... 76
5.2.6 Add new external tools .................................................................... 77
6 Retrieve and Manage Live Data ............................................................................ 79
6.1 Retrieve Live Data from a Device ............................................................ 79
6.2 Batch retrieve live data ........................................................................... 82
6.3 Customize show commands ................................................................... 84
6.3.1 Define a show command template .................................................. 84
6.3.2 Execute show commands ................................................................. 86
6.3.3 View and compare show commands ............................................... 96
6.4 Managing Live Data ................................................................................. 99
6.4.1 Creating a Map DataFolder .............................................................. 99
6.4.2 Exporting from and Importing to a Map DataFolder ..................... 100
7 Analysis toolkits .................................................................................................. 101
7.1 Live data toolkit ..................................................................................... 101
7.1.1 Route table toolkit ......................................................................... 101
7.1.2 ARP table toolkit ............................................................................ 104
7.1.3 CDP table toolkit ............................................................................ 105
7.1.4 MAC table toolkit ........................................................................... 106
7.2 Route propagation ................................................................................ 109
7.3 Comparison Analysis ............................................................................. 112
7.3.1 Compare configuration and routing .............................................. 112
7.3.2 Compare other live data ................................................................ 116
8 User Interface ...................................................................................................... 117
8.1 Start Page .............................................................................................. 117
8.2 Menu Bar............................................................................................... 118
8.2.1 Main Menu ..................................................................................... 118
8.2.2 Home Menu ................................................................................... 118
8.2.3 Map Menu ...................................................................................... 119
8.2.4 View Menu ..................................................................................... 120
8.2.5 Help Menu ..................................................................................... 120
8.3 Quick Access Bar ................................................................................... 121

3
8.4 Context Menu ....................................................................................... 121
8.4.1 Context Menu of a L3 Qmap page ................................................. 121
8.4.2 Context Menu of a device .............................................................. 122
8.5 Right Click Menu of an Object .............................................................. 122
8.6 Options .................................................................................................. 124
9 Upgrade NetBrain System ................................................................................... 124
9.1 Auto Update .......................................................................................... 124
9.2 Manual Update ..................................................................................... 126
NetBrain PEV4.1 Help
Page | 1
1 Installation and License
1.1 Install NetBrain Workstation Personal Edition 4.1
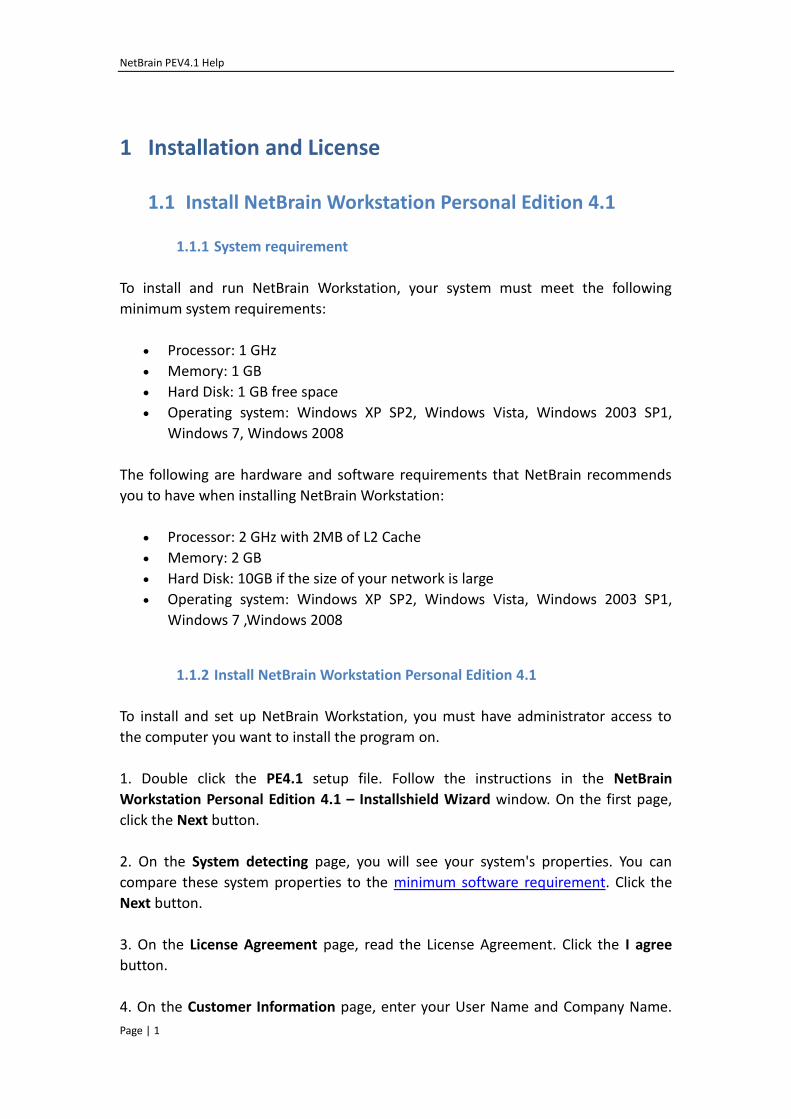
1.1.1 System requirement
To install and run NetBrain Workstation, your system must meet the following
minimum system requirements:
Processor: 1 GHz
Memory: 1 GB
Hard Disk: 1 GB free space
Operating system: Windows XP SP2, Windows Vista, Windows 2003 SP1,
Windows 7, Windows 2008
The following are hardware and software requirements that NetBrain recommends
you to have when installing NetBrain Workstation:
Processor: 2 GHz with 2MB of L2 Cache
Memory: 2 GB
Hard Disk: 10GB if the size of your network is large
Operating system: Windows XP SP2, Windows Vista, Windows 2003 SP1,
Windows 7 ,Windows 2008
1.1.2 Install NetBrain Workstation Personal Edition 4.1
To install and set up NetBrain Workstation, you must have administrator access to
the computer you want to install the program on.
1. Double click the PE4.1 setup file. Follow the instructions in the NetBrain
Workstation Personal Edition 4.1 – Installshield Wizard window. On the first page,
click the Next button.
2. On the System detecting page, you will see your system's properties. You can
compare these system properties to the minimum software requirement. Click the
Next button.
3. On the License Agreement page, read the License Agreement. Click the I agree
button.
4. On the Customer Information page, enter your User Name and Company Name.
NetBrain PEV4.1 Help
Page | 2
Click the Next button.
5. On the Choose Destination Location page, click the Next button to install NetBrain
Workstation to the default folder.
Tip: To select a different folder, click the Browse button and specify a folder.
6. On the Start Copying Files page, you will see a summary of the installation settings;
to make any changes to the installation settings, click on the Back button. Click the
Install button to begin installing.
7. On the InstallShield Wizard Complete page, click the Finish button.
1.2 Uninstall NetBrain Workstation Personal Edition 4.1
To remove NetBrain Workstation from your computer, you must have administrator
access to your computer to remove programs.
1. Click Start > Programs >NetBrain > Workstation Personal Edition 4.1> Uninstall
Workstation Personal Edition 4.1. The NetBrain Workstation Personal Edition Plus –
Installshield Wizard window opens.
2. Inside the Welcome page, select either the Repair option or the Remove option.
Select the Repair option to restore all program settings back to their original
state.
Select the Remove optionto remove NetBrain Workstation from your
computer entirely.
3. If you select the Remove option, you will be prompted with a message confirming
your decision for removal. Click Yes to continue, click No to return to the previous
step.
4. At the User Data page, you are given the option to delete your user data. If you
want to delete the user data, check the Delete all existing user data option.
Tip: If you delete all existing user data, you will lose all of your workspace data.
However, Qmaps you saved will not be deleted.
5. Click the Finish button.
NetBrain PEV4.1 Help
Page | 3
1.3 Activate a Trial License
Before you use NetBrain Workstation PE4.1+, you must activate the license. NetBrain
PE4.1+ license will expire in one year after the first activation. You can renew your
license upon certain criteria.
This section includes the following topics:
Activate PE license
PE license limitation
Activate PE license
1. Launch NetBrain Workstation Personal Edition 4.1.
2. Fill in the Email and Activation Key and click the Next button to start the activation
process. After verification, the PE plus license will be activated and you will be able to
use the program as long as you would like to.
If you do not have the Activation Key, click the fill out a short form.
Fill in the form. The fields with an (*) are required, such as the First Name, Last
Name, Email Address and Company. Then click the Submit button and NetBrain will
send you the Activation Key for the PE license.
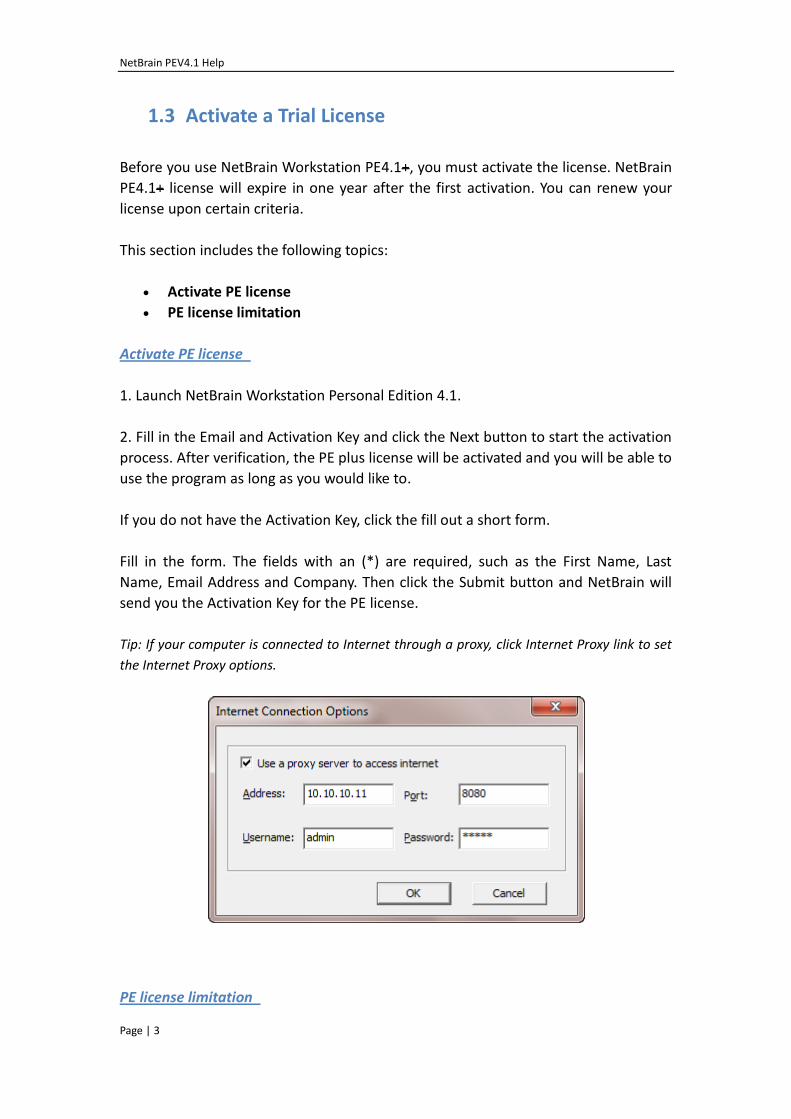
Tip: If your computer is connected to Internet through a proxy, click Internet Proxy link to set
the Internet Proxy options.
PE license limitation

NetBrain PEV4.1 Help
Page | 4
NetBrain Workstation PE4.1 is a free edition and has the following limitations
compared to NetBrain workstation Operation Edition (OE) and Consultant Edition
(CE):
a) Only one Qmap can be opened within PE workstation. You can close it first and
then open other Qmaps.
b) The maximum number of devices in each Qmap page is 12.
c) The maximum size of the device configuration file is 12KB.
d) The maximum length of the hostname is 12.
NetBrain PEV4.1 Help
Page | 5
2 Quick Start on Learning network knowledge via PE
NetBrain Personal Edition can help you gainnetwork knowledge more efficiently. You
can import your dynamips lab into Workstation and then work on the lab from
NetBrain. All of your network tasks can be presented and documented from the map.
And you can share your Qmaps with others and download others’ Qmap.
2.1 Documenting Learning Process
With NetBrain PE Workstation, one can take the following steps to document a CCIE
learning course.
1. Build your experimental environment
2. Execute Telnet/SSH CLI commands
3. Collect show-command data
4. Write map notes
2.1.1 Build your Experimental Environment
The first step is to build your own experimental environment. You may build a real
lab or a virtual lab via dynamics/GNS3. You can easily setup your workspace at
NetBrain PE Workstation for these types of labs. In case you cannot access a lab, you
can just import network configurations into NetBrain Workstation.
Import configuration files
You can import configuration files into NetBrain. Refer to Importing configuration
files for details.
Import the virtual lab
To use tools such as dynamics/GNS3 to build your virtual network lab, please enable
the reverse telnet to devices and configure the IP connections properly. Then save
the configuration files of the network devices as a .net file that can be imported to
NetBrain Workstation.
NetBrain PEV4.1 Help
Page | 6
To import dynamips lab
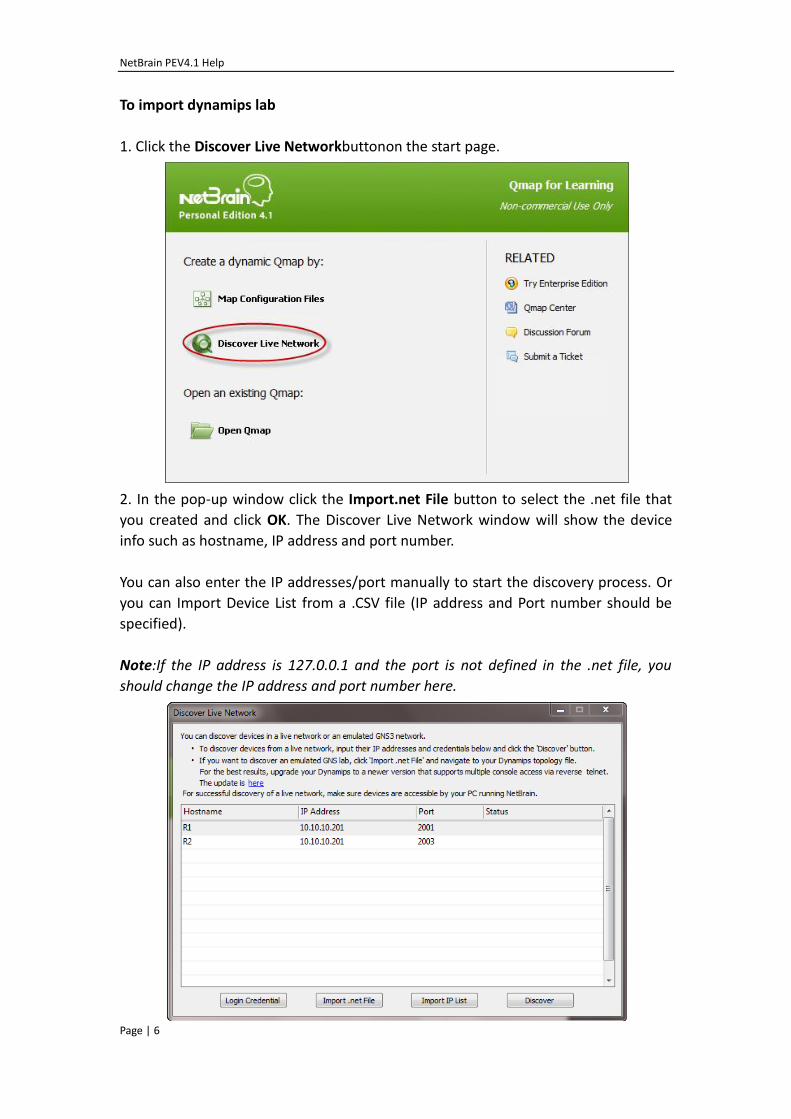
1. Click the Discover Live Networkbuttonon the start page.
2. In the pop-up window click the Import.net File button to select the .net file that
you created and click OK. The Discover Live Network window will show the device
info such as hostname, IP address and port number.
You can also enter the IP addresses/port manually to start the discovery process. Or
you can Import Device List from a .CSV file (IP address and Port number should be
specified).
Note:If the IP address is 127.0.0.1 and the port is not defined in the .net file, you
should change the IP address and port number here.
NetBrain PEV4.1 Help
Page | 7
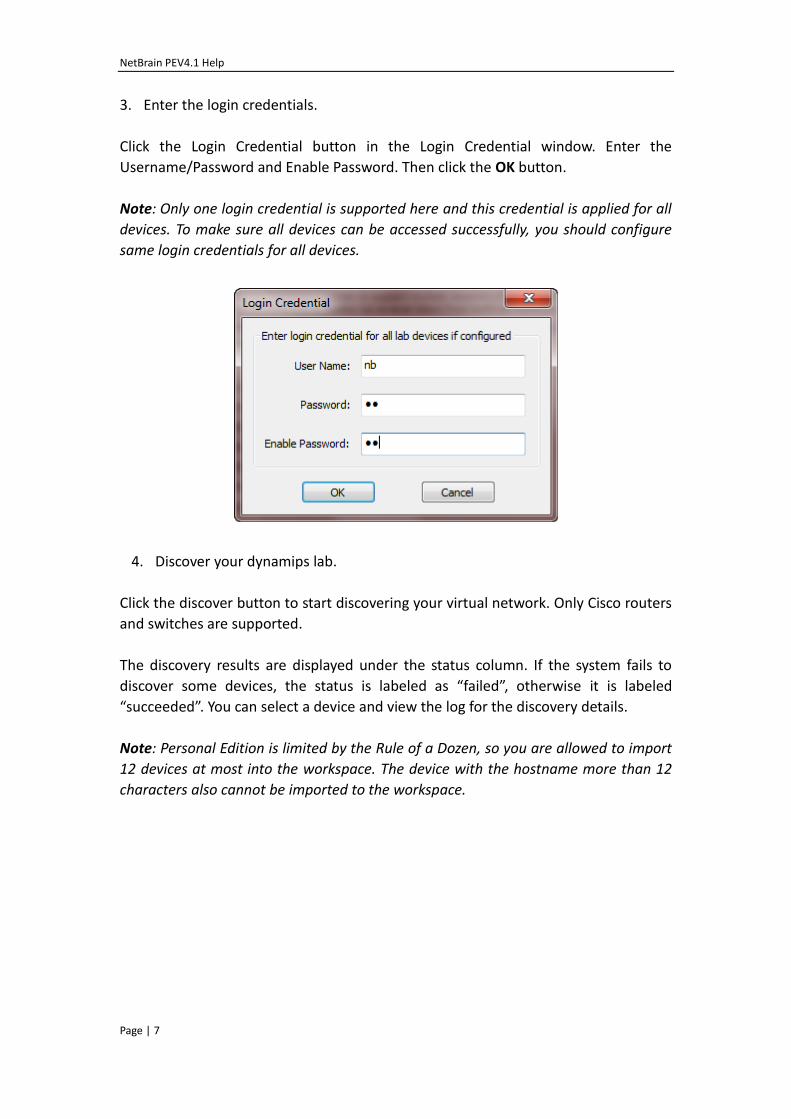
3. Enter the login credentials.
Click the Login Credential button in the Login Credential window. Enter the
Username/Password and Enable Password. Then click the OK button.
Note: Only one login credential is supported here and this credential is applied for all
devices. To make sure all devices can be accessed successfully, you should configure
same login credentials for all devices.
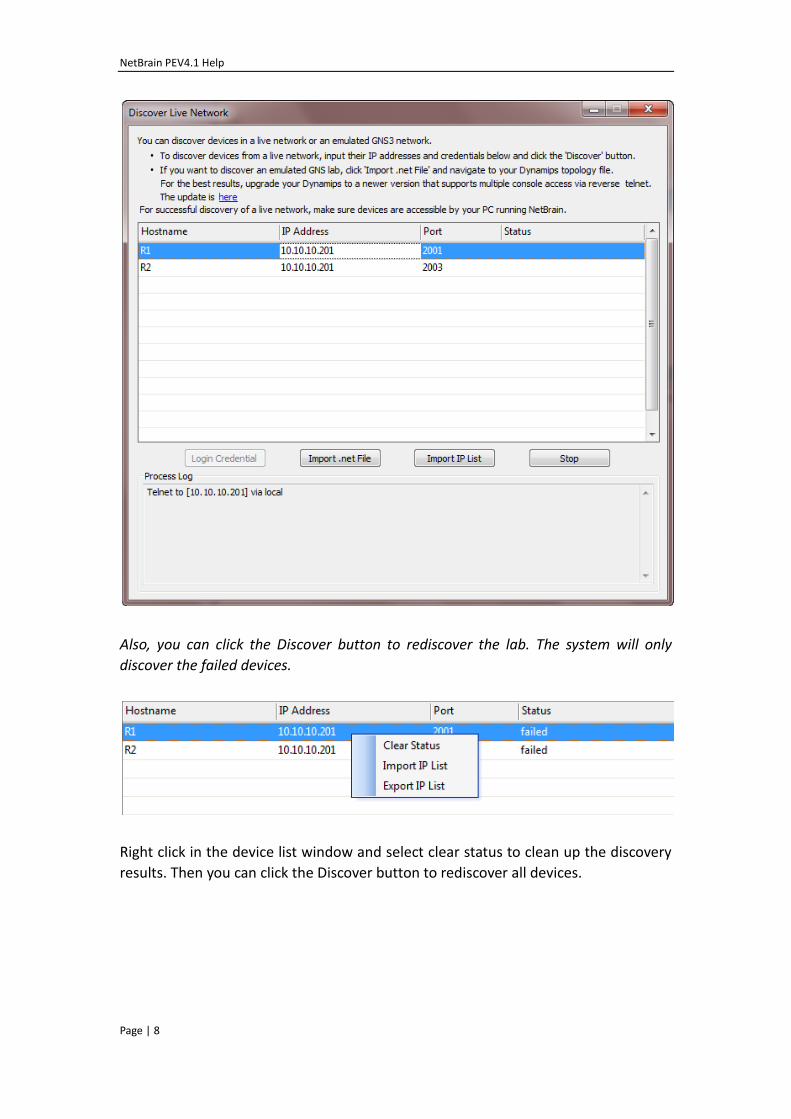
4. Discover your dynamips lab.
Click the discover button to start discovering your virtual network. Only Cisco routers
and switches are supported.
The discovery results are displayed under the status column. If the system fails to
discover some devices, the status is labeled as “failed”, otherwise it is labeled
“succeeded”. You can select a device and view the log for the discovery details.
Note: Personal Edition is limited by the Rule of a Dozen, so you are allowed to import
12 devices at most into the workspace. The device with the hostname more than 12
characters also cannot be imported to the workspace.
NetBrain PEV4.1 Help
Page | 8
Also, you can click the Discover button to rediscover the lab. The system will only
discover the failed devices.
Right click in the device list window and select clear status to clean up the discovery
results. Then you can click the Discover button to rediscover all devices.
NetBrain PEV4.1 Help
Page | 9
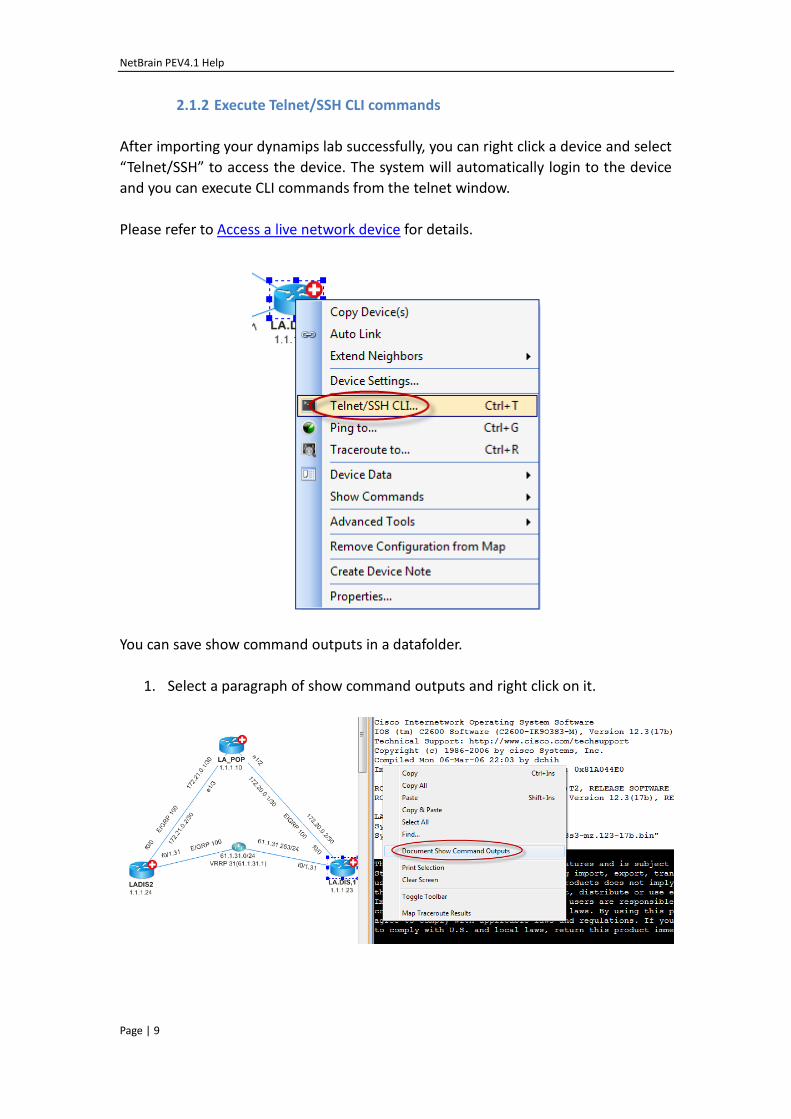
2.1.2 Execute Telnet/SSH CLI commands
After importing your dynamips lab successfully, you can right click a device and select
“Telnet/SSH” to access the device. The system will automatically login to the device
and you can execute CLI commands from the telnet window.
Please refer to Access a live network device for details.
You can save show command outputs in a datafolder.
1. Select a paragraph of show command outputs and right click on it.
NetBrain PEV4.1 Help
Page | 10
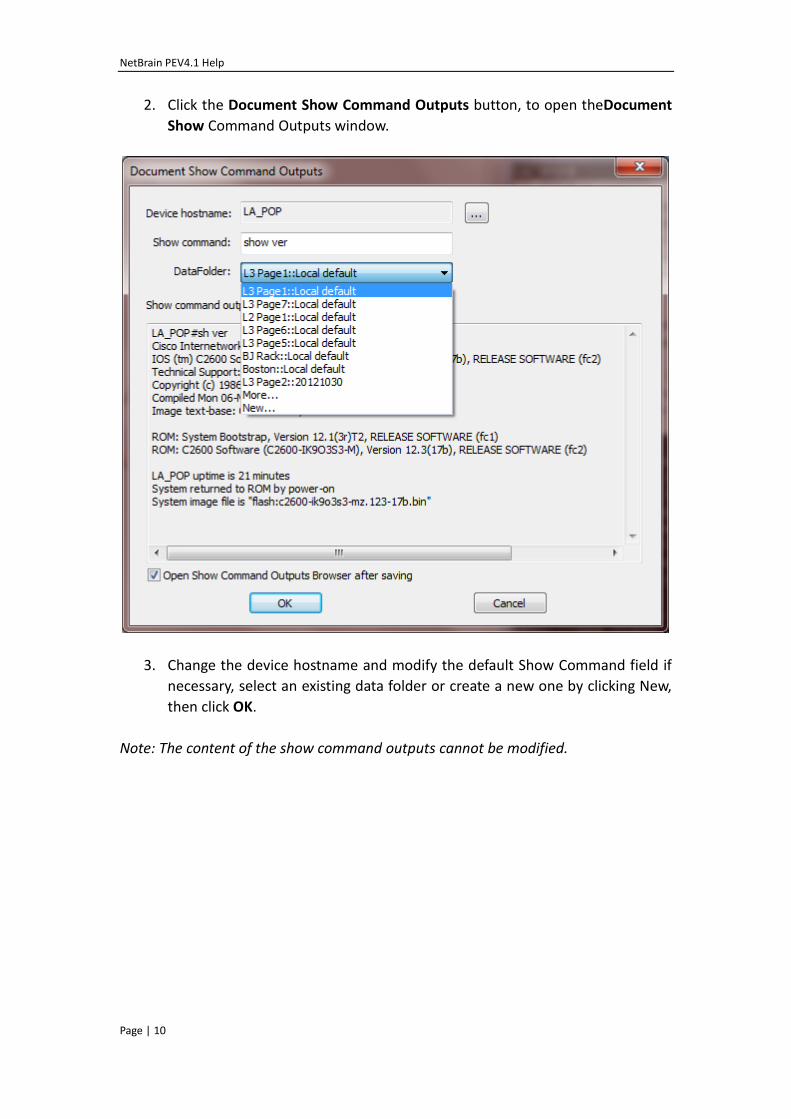
2. Click the Document Show Command Outputs button, to open theDocument
Show Command Outputs window.
3. Change the device hostname and modify the default Show Command field if
necessary, select an existing data folder or create a new one by clicking New,
then click OK.
Note: The content of the show command outputs cannot be modified.
NetBrain PEV4.1 Help
Page | 11
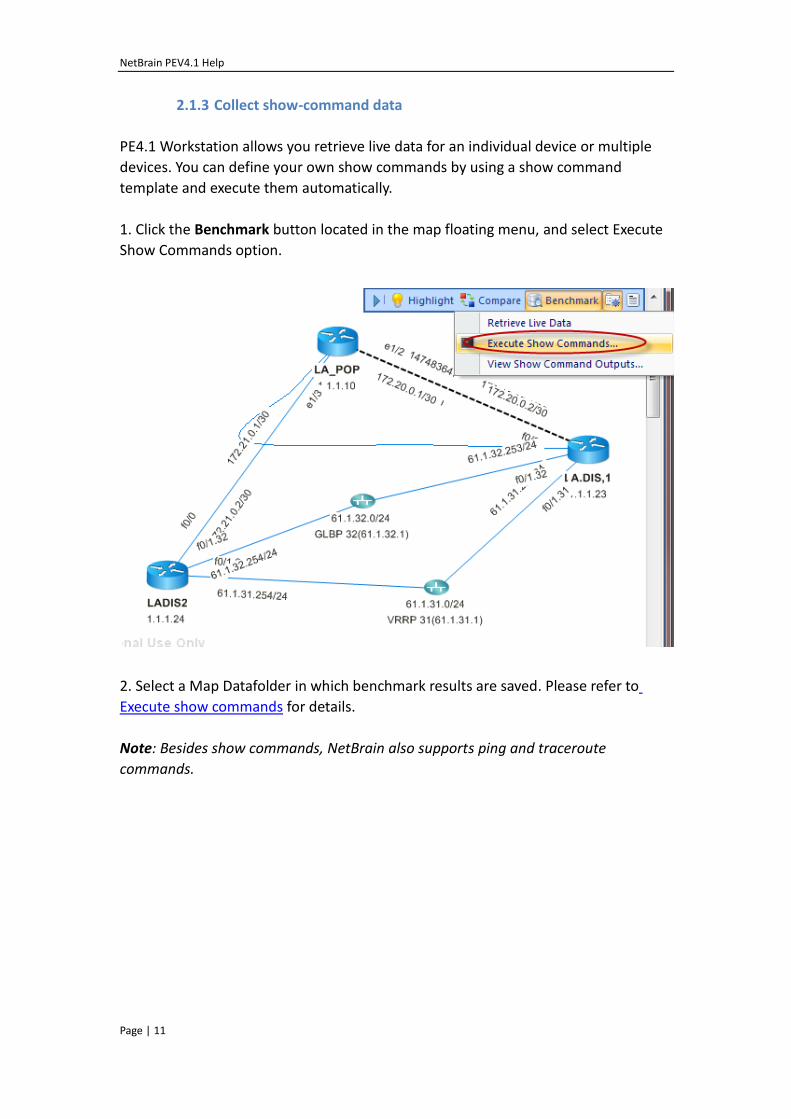
2.1.3 Collect show-command data
PE4.1 Workstation allows you retrieve live data for an individual device or multiple
devices. You can define your own show commands by using a show command
template and execute them automatically.
1. Click the Benchmark button located in the map floating menu, and select Execute
Show Commands option.
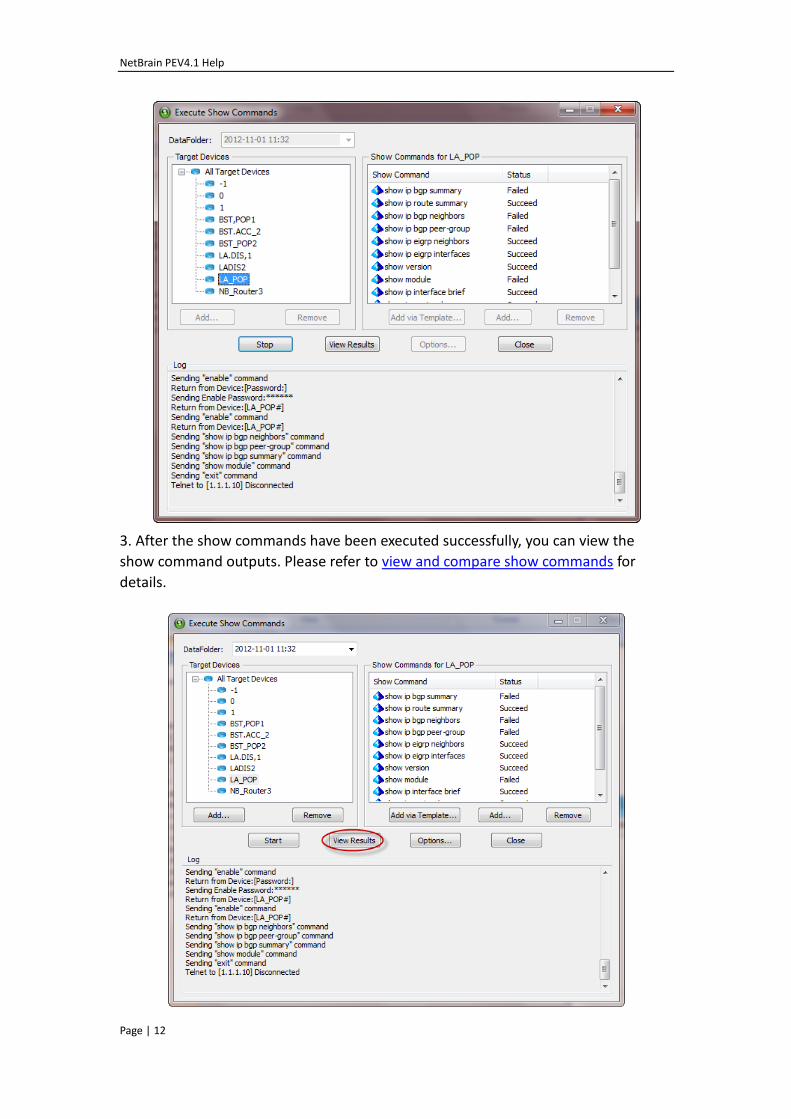
2. Select a Map Datafolder in which benchmark results are saved. Please refer to
Execute show commands for details.
Note: Besides show commands, NetBrain also supports ping and traceroute
commands.
NetBrain PEV4.1 Help
Page | 12
3. After the show commands have been executed successfully, you can view the
show command outputs. Please refer to view and compare show commands for
details.
NetBrain PEV4.1 Help
Page | 13
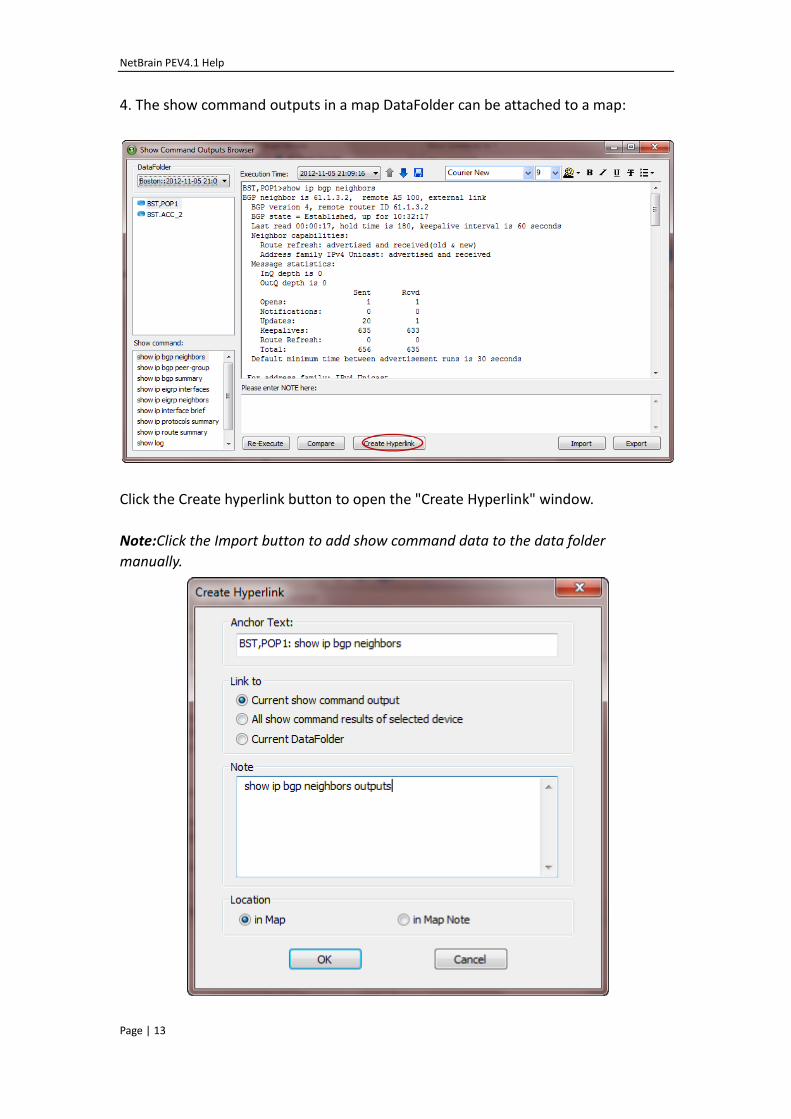
4. The show command outputs in a map DataFolder can be attached to a map:
Click the Create hyperlink button to open the "Create Hyperlink" window.
Note:Click the Import button to add show command data to the data folder
manually.
NetBrain PEV4.1 Help
Page | 14
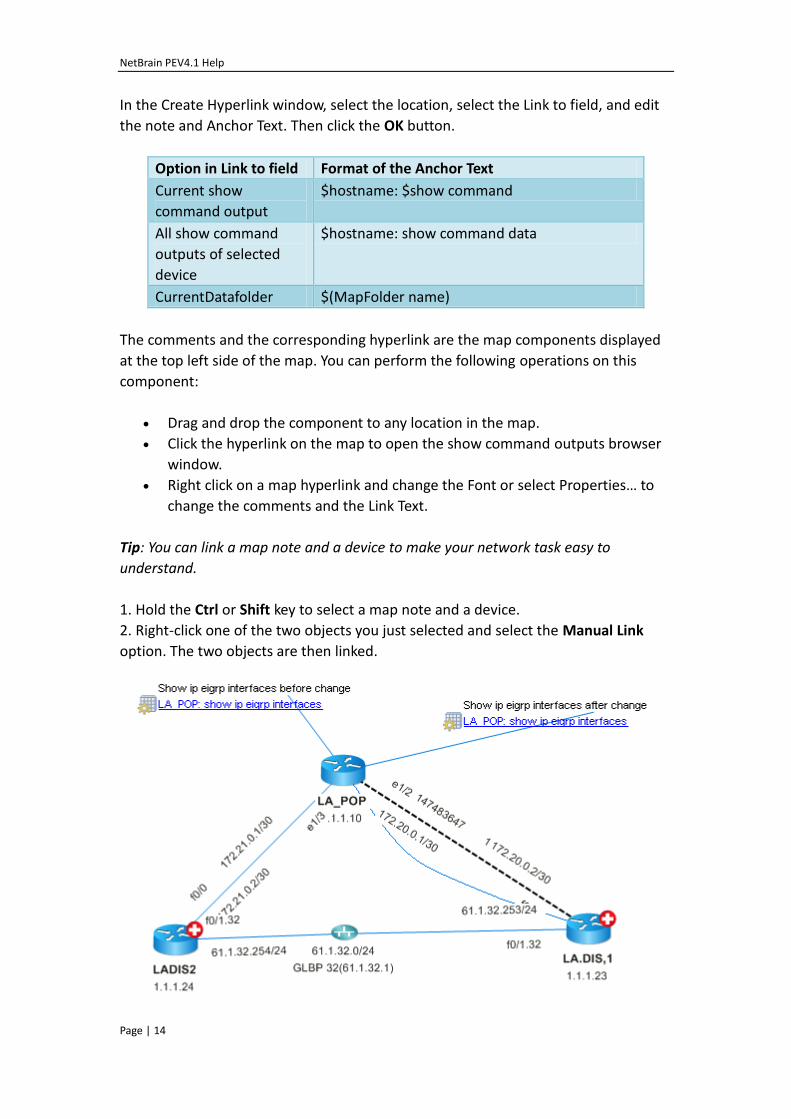
In the Create Hyperlink window, select the location, select the Link to field, and edit
the note and Anchor Text. Then click the OK button.
Option in Link to field Format of the Anchor Text
Current show
command output
$hostname: $show command
All show command
outputs of selected
device
$hostname: show command data
CurrentDatafolder $(MapFolder name)
The comments and the corresponding hyperlink are the map components displayed
at the top left side of the map. You can perform the following operations on this
component:
Drag and drop the component to any location in the map.
Click the hyperlink on the map to open the show command outputs browser
window.
Right click on a map hyperlink and change the Font or select Properties… to
change the comments and the Link Text.
Tip: You can link a map note and a device to make your network task easy to
understand.
1. Hold the Ctrl or Shift key to select a map note and a device.
2. Right-click one of the two objects you just selected and select the Manual Link
option. The two objects are then linked.
NetBrain PEV4.1 Help
Page | 15
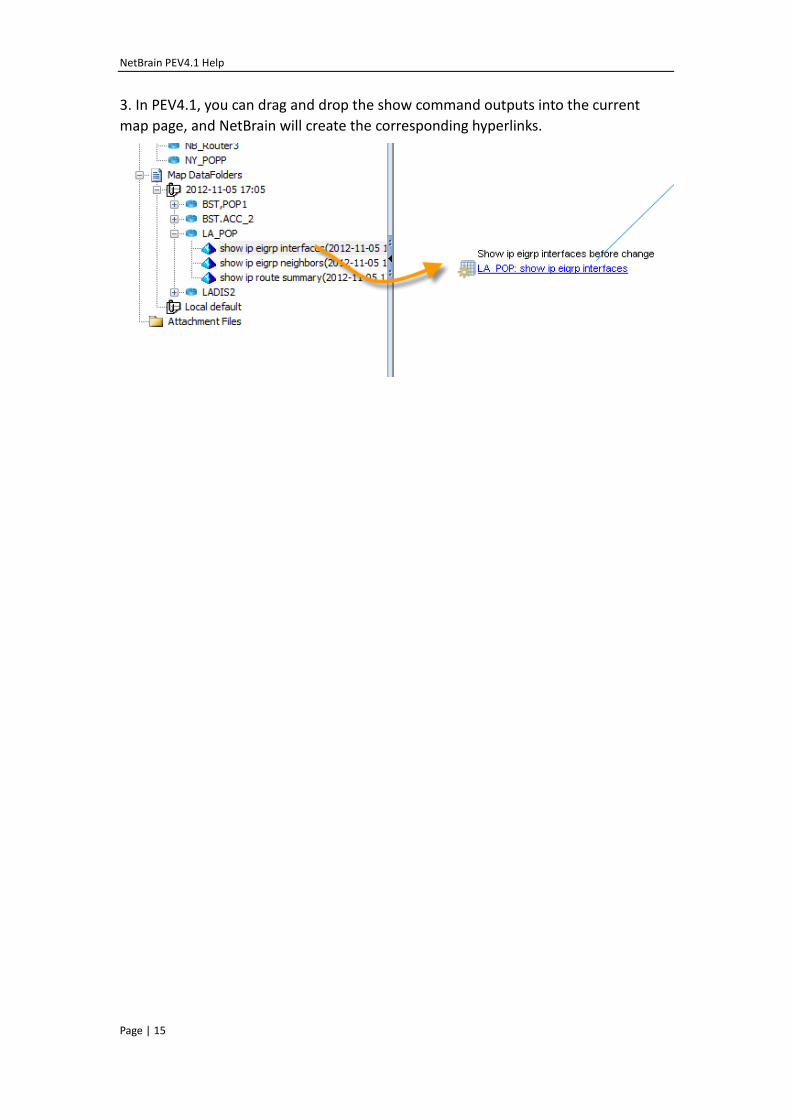
3. In PEV4.1, you can drag and drop the show command outputs into the current
map page, and NetBrain will create the corresponding hyperlinks.
NetBrain PEV4.1 Help
Page | 16
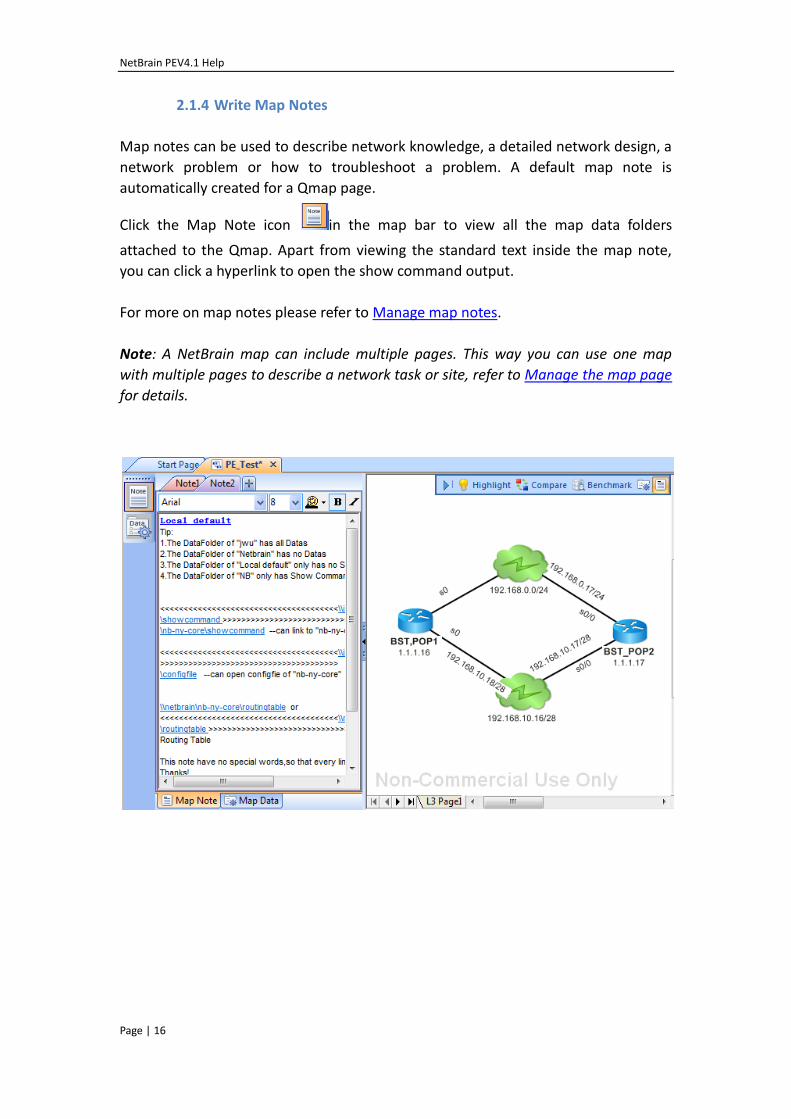
2.1.4 Write Map Notes
Map notes can be used to describe network knowledge, a detailed network design, a
network problem or how to troubleshoot a problem. A default map note is
automatically created for a Qmap page.
Click the Map Note icon in the map bar to view all the map data folders
attached to the Qmap. Apart from viewing the standard text inside the map note,
you can click a hyperlink to open the show command output.
For more on map notes please refer to Manage map notes.
Note: A NetBrain map can include multiple pages. This way you can use one map
with multiple pages to describe a network task or site, refer to Manage the map page
for details.
NetBrain PEV4.1 Help
Page | 17
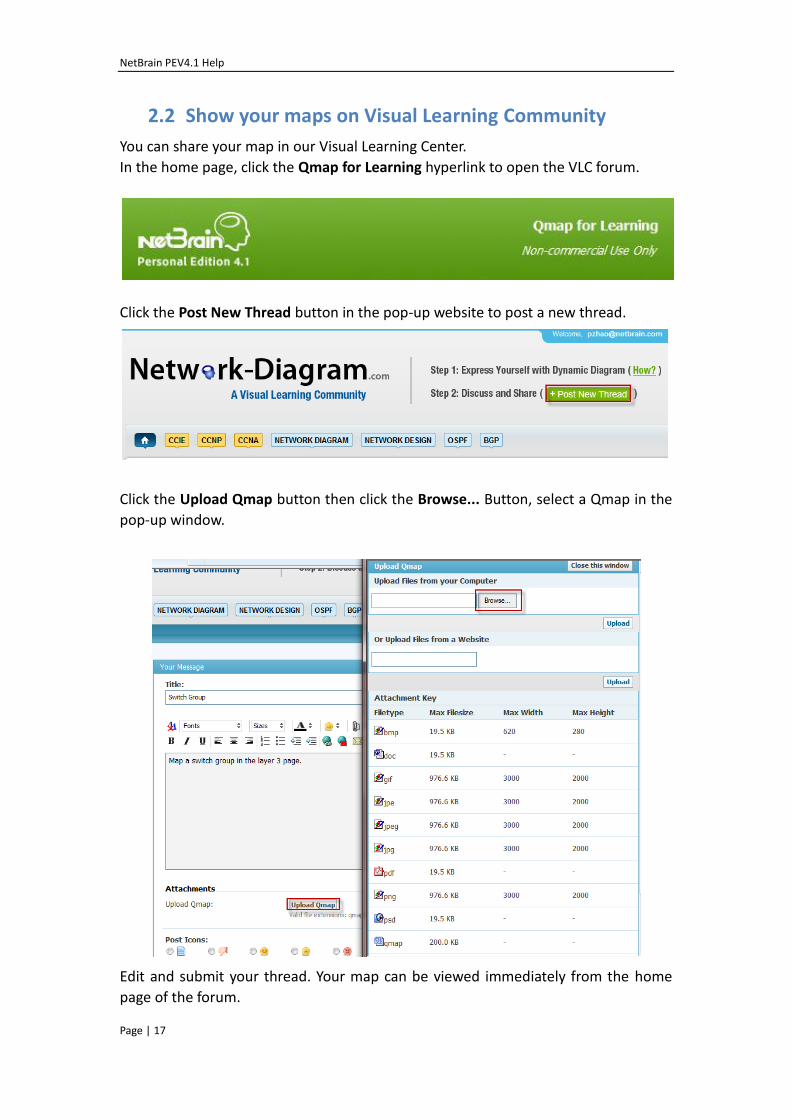
2.2 Show your maps on Visual Learning Community
You can share your map in our Visual Learning Center.
In the home page, click the Qmap for Learning hyperlink to open the VLC forum.
Click the Post New Thread button in the pop-up website to post a new thread.
Click the Upload Qmap button then click the Browse... Button, select a Qmap in the
pop-up window.
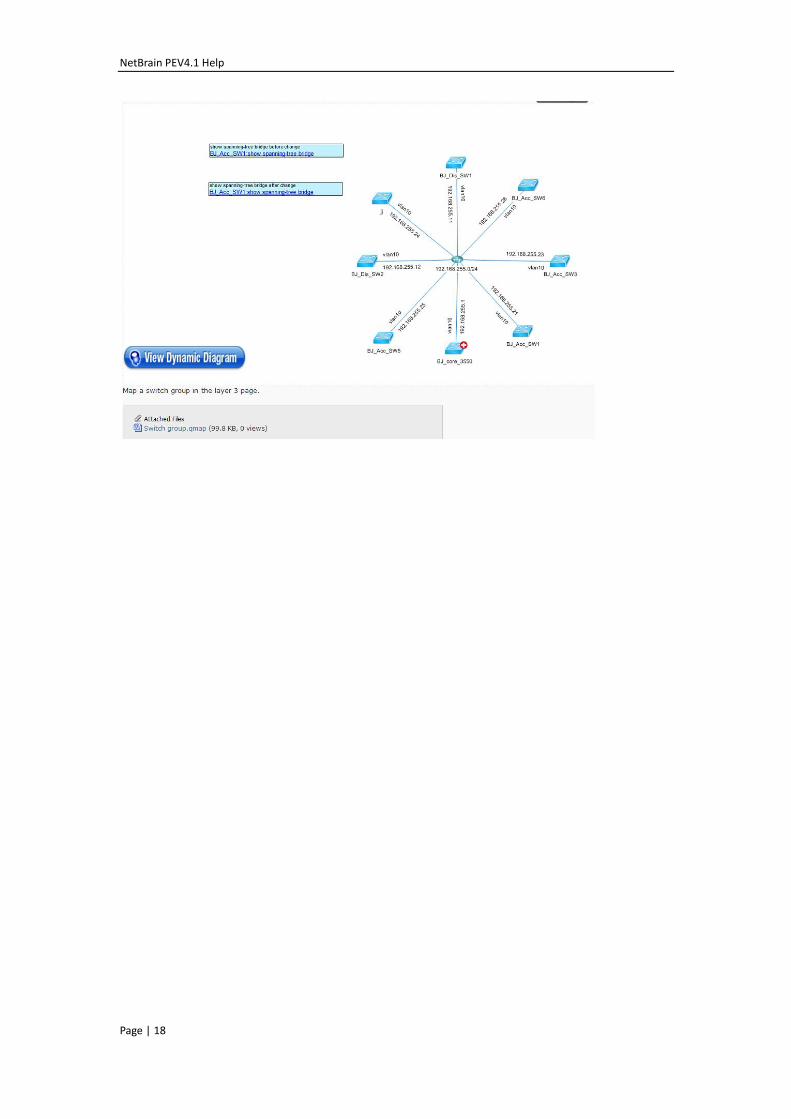
Edit and submit your thread. Your map can be viewed immediately from the home
page of the forum.
NetBrain PEV4.1 Help
Page | 18
NetBrain PEV4.1 Help
Page | 19
3 Work on Qmaps:
3.1 Create a map
In PEV4.1, everything is saved in the Qmaps, including configuration files, show
command outputs, topology files and other attachments. So simply creating a Qmap
including all the elements is enoughto study. You are only allowed to work on one
Qmap using PEV4.1, alternatively, you can create multiple map pages to
includeadditionalworkspaces. And more, you can easily switch to other map pagesto
change your current workspace.
Important Note: Currently, only Cisco devices are supported within PE4.1 (including
Cisco IOS Router, IOS-XR, IOS-XE, Cisco IOS Switch, Nexus Switch, Cisco Pix Firewall,
ASA Firewall, Cisco WAP). If you want to map out devices of other vendor like Juniper,
HP, please try NetBrain’s OE/CE software.
3.1.1 ImportConfig files to create a dynamic Qmap
Importing configuration files is the first step to create a dynamic Qmap. Before this
step, you need to retrieve the configuration files of your network devices and save
them as text files.
To import configuration files
1. Click the Home tab from the ribbon and select the Map Configuration Files button
( ). The Import Configuration Files window opens.
NetBrain PEV4.1 Help
Page | 20
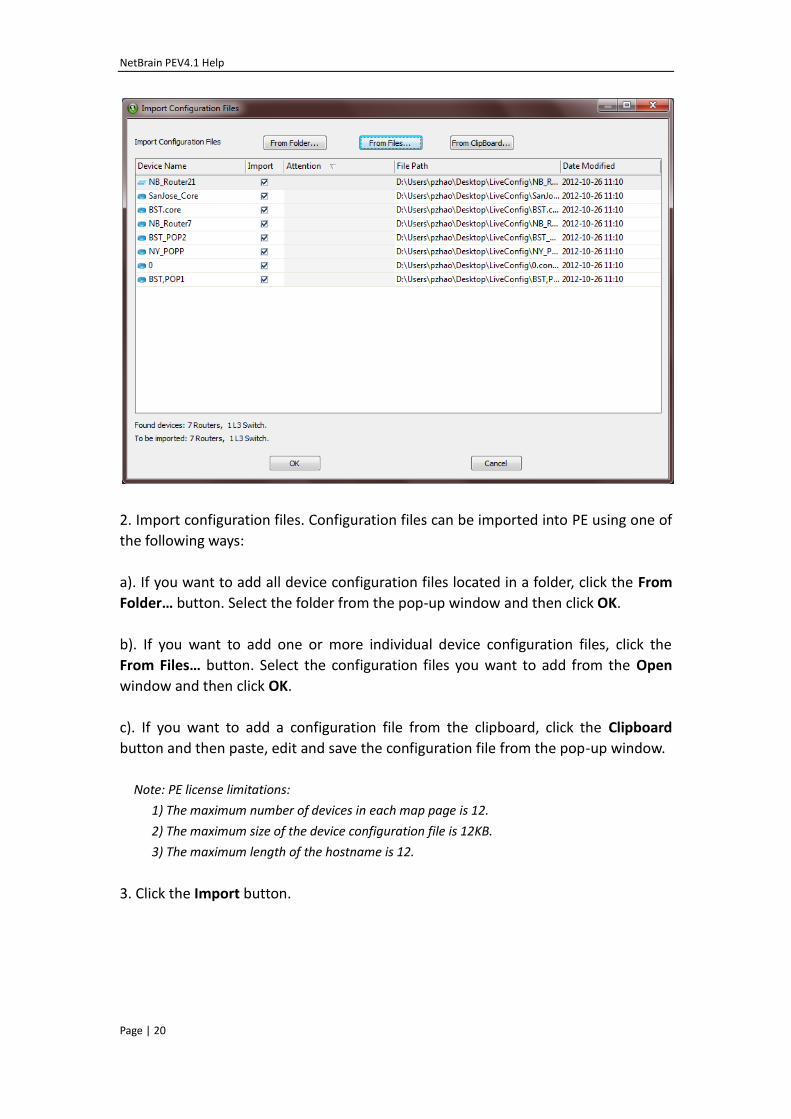
2. Import configuration files. Configuration files can be imported into PE using one of
the following ways:
a). If you want to add all device configuration files located in a folder, click the From
Folder… button. Select the folder from the pop-up window and then click OK.
b). If you want to add one or more individual device configuration files, click the
From Files… button. Select the configuration files you want to add from the Open
window and then click OK.
c). If you want to add a configuration file from the clipboard, click the Clipboard
button and then paste, edit and save the configuration file from the pop-up window.
Note: PE license limitations:
1) The maximum number of devices in each map page is 12.
2) The maximum size of the device configuration file is 12KB.
3) The maximum length of the hostname is 12.
3. Click the Import button.
NetBrain PEV4.1 Help
Page | 21
3.1.2 Discover Live Network (Load Dynamips .Net File)
To use tools such as dynamics/GNS3 to build your virtual network lab, please enable
the reverse telnet to devices and configure the IP connections properly. Then save
the configuration files of the network devices as a .net file that can be imported to
NetBrain Workstation to create a Qmap.
How to import dynamips lab to map devices
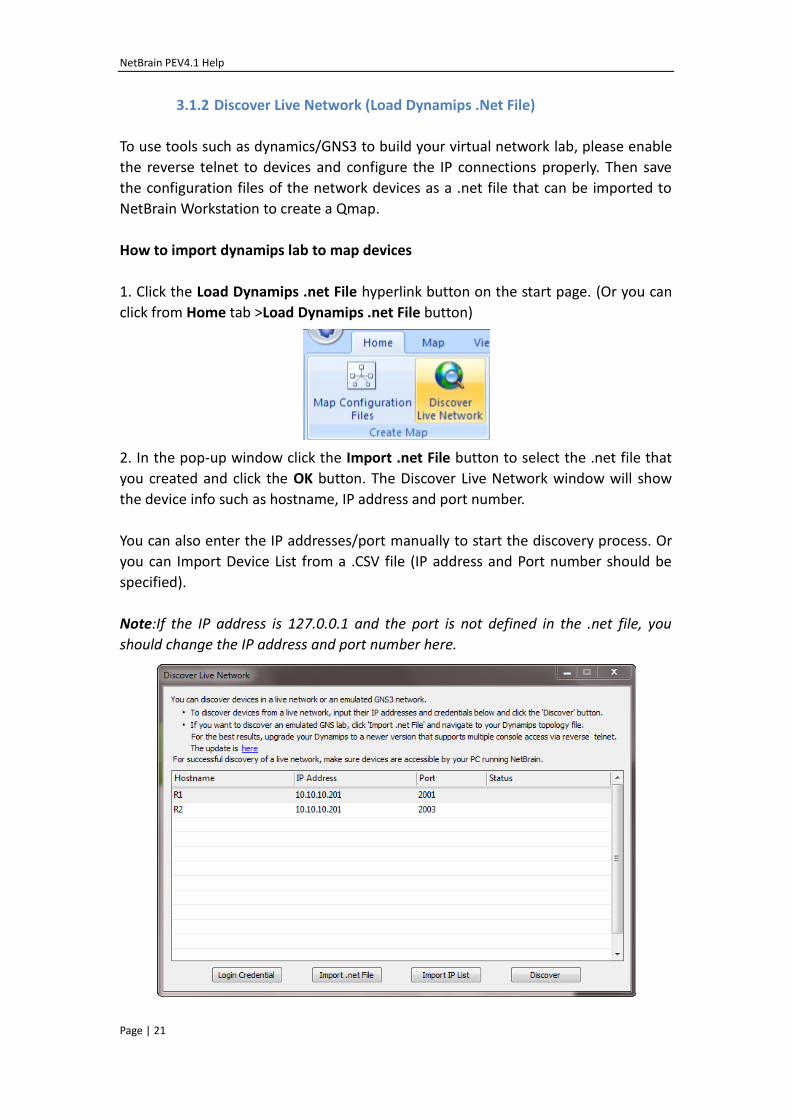
1. Click the Load Dynamips .net File hyperlink button on the start page. (Or you can
click from Home tab >Load Dynamips .net File button)
2. In the pop-up window click the Import .net File button to select the .net file that
you created and click the OK button. The Discover Live Network window will show
the device info such as hostname, IP address and port number.
You can also enter the IP addresses/port manually to start the discovery process. Or
you can Import Device List from a .CSV file (IP address and Port number should be
specified).
Note:If the IP address is 127.0.0.1 and the port is not defined in the .net file, you
should change the IP address and port number here.
NetBrain PEV4.1 Help
Page | 22
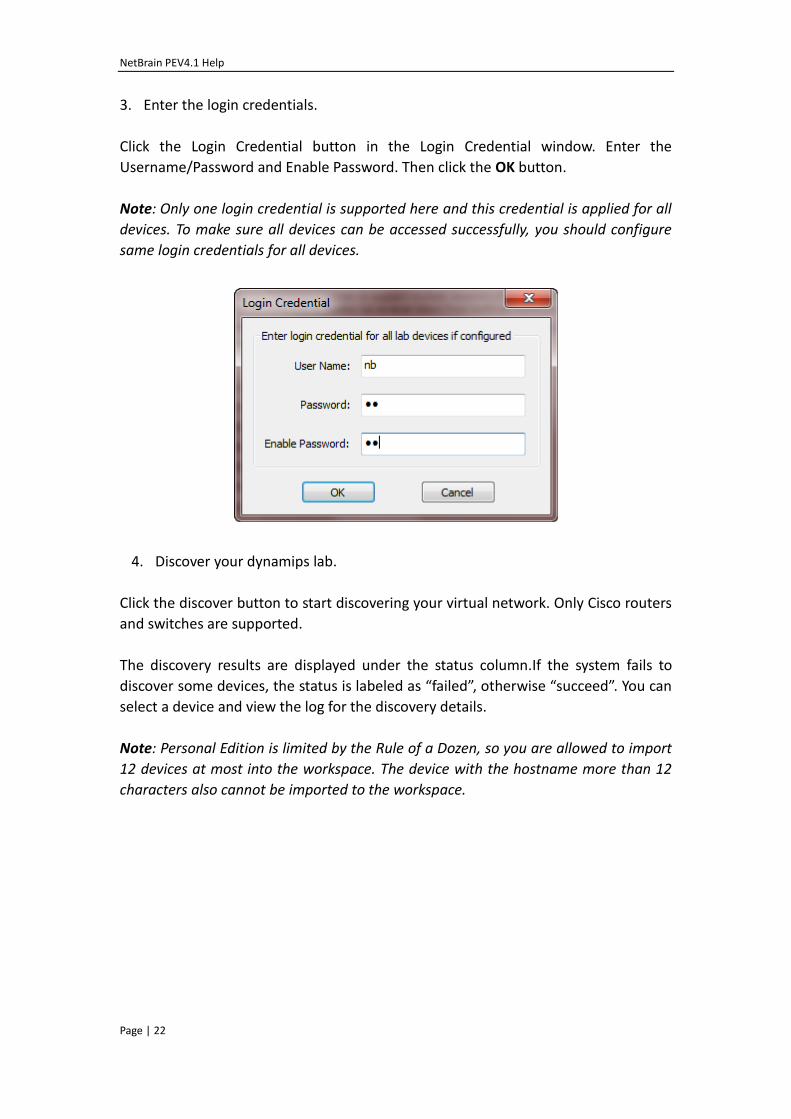
3. Enter the login credentials.
Click the Login Credential button in the Login Credential window. Enter the
Username/Password and Enable Password. Then click the OK button.
Note: Only one login credential is supported here and this credential is applied for all
devices. To make sure all devices can be accessed successfully, you should configure
same login credentials for all devices.
4. Discover your dynamips lab.
Click the discover button to start discovering your virtual network. Only Cisco routers
and switches are supported.
The discovery results are displayed under the status column.If the system fails to
discover some devices, the status is labeled as “failed”, otherwise “succeed”. You can
select a device and view the log for the discovery details.
Note: Personal Edition is limited by the Rule of a Dozen, so you are allowed to import
12 devices at most into the workspace. The device with the hostname more than 12
characters also cannot be imported to the workspace.
NetBrain PEV4.1 Help
Page | 23
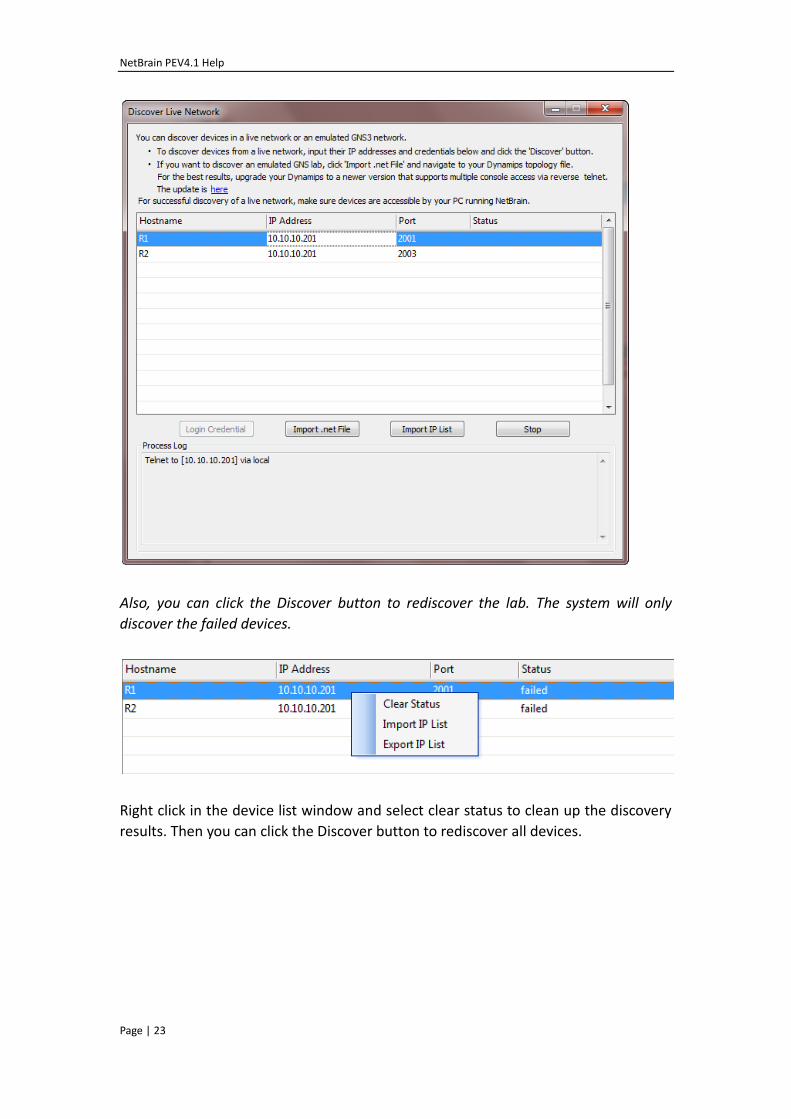
Also, you can click the Discover button to rediscover the lab. The system will only
discover the failed devices.
Right click in the device list window and select clear status to clean up the discovery
results. Then you can click the Discover button to rediscover all devices.
NetBrain PEV4.1 Help
Page | 24
3.2 Master Map Page
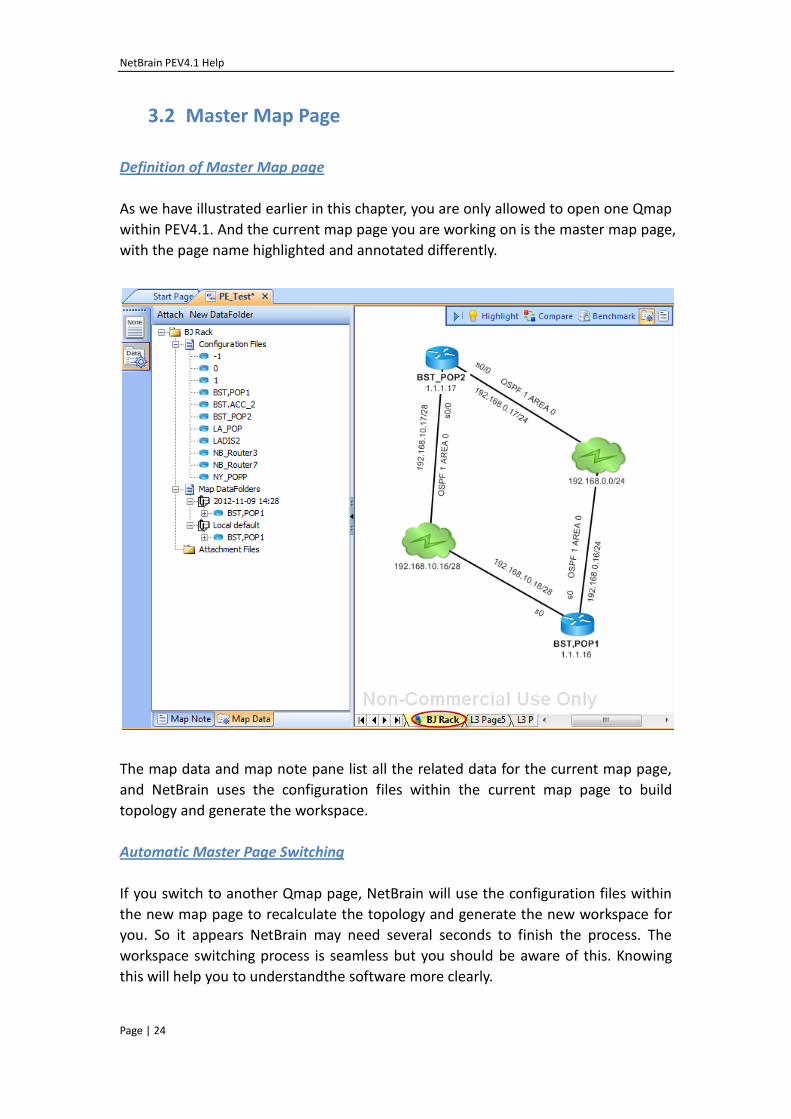
Definition of Master Map page
As we have illustrated earlier in this chapter, you are only allowed to open one Qmap
within PEV4.1. And the current map page you are working on is the master map page,
with the page name highlighted and annotated differently.
The map data and map note pane list all the related data for the current map page,
and NetBrain uses the configuration files within the current map page to build
topology and generate the workspace.
Automatic Master Page Switching
If you switch to another Qmap page, NetBrain will use the configuration files within
the new map page to recalculate the topology and generate the new workspace for
you. So it appears NetBrain may need several seconds to finish the process. The
workspace switching process is seamless but you should be aware of this. Knowing
this will help you to understandthe software more clearly.
NetBrain PEV4.1 Help
Page | 25
3.2.1 Drag/ Drop device and extend its neighbors
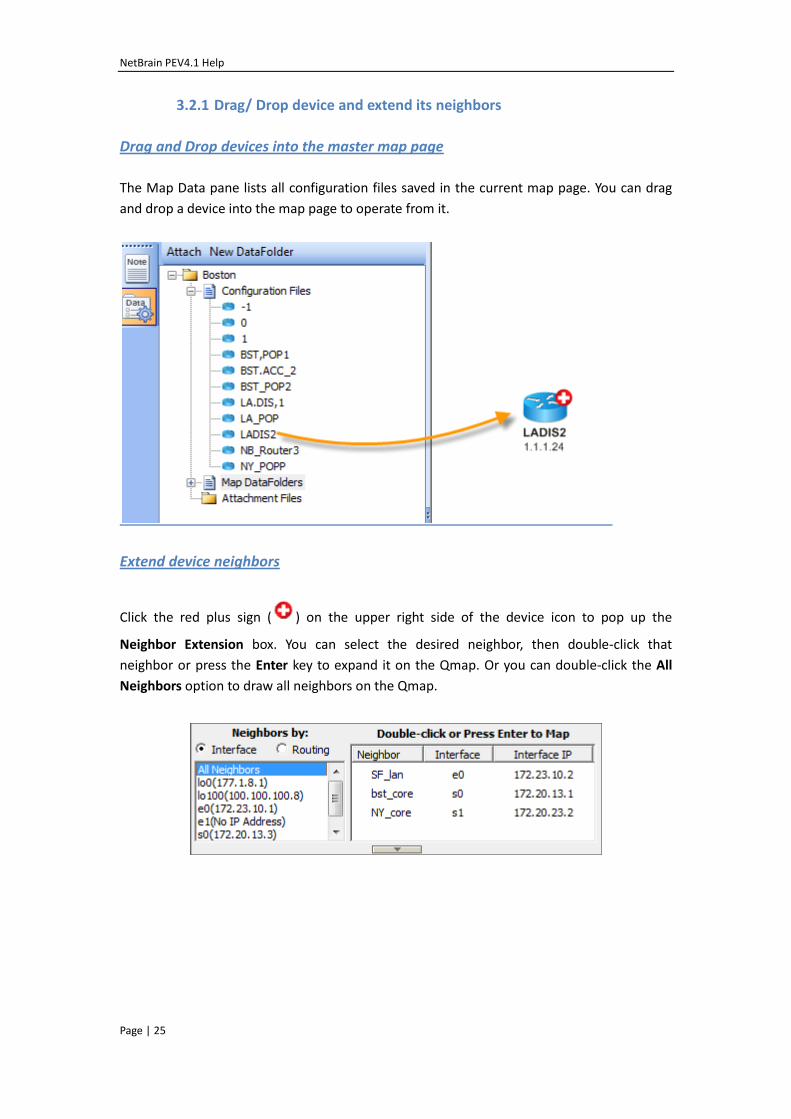
Drag and Drop devices into the master map page
The Map Data pane lists all configuration files saved in the current map page. You can drag
and drop a device into the map page to operate from it.
Extend device neighbors
Click the red plus sign ( ) on the upper right side of the device icon to pop up the
Neighbor Extension box. You can select the desired neighbor, then double-click that
neighbor or press the Enter key to expand it on the Qmap. Or you can double-click the All
Neighbors option to draw all neighbors on the Qmap.
NetBrain PEV4.1 Help
Page | 26
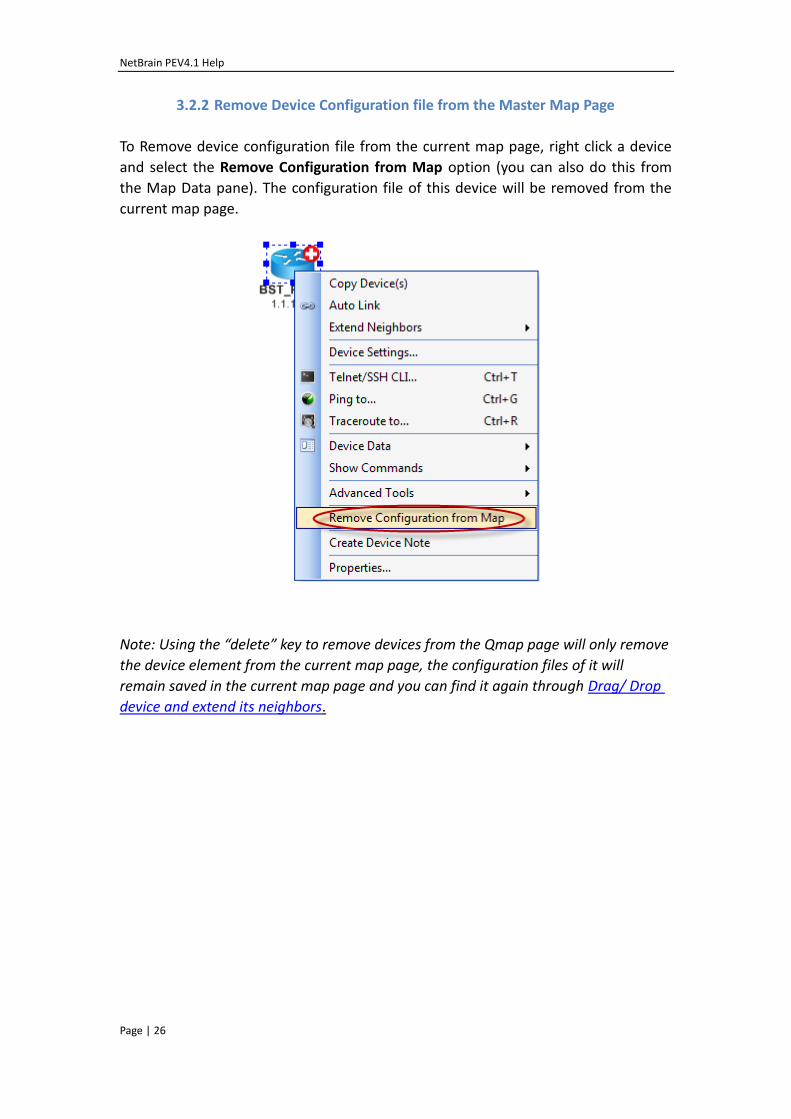
3.2.2 Remove Device Configuration file from the Master Map Page
To Remove device configuration file from the current map page, right click a device
and select the Remove Configuration from Map option (you can also do this from
the Map Data pane). The configuration file of this device will be removed from the
current map page.
Note: Using the “delete” key to remove devices from the Qmap page will only remove
the device element from the current map page, the configuration files of it will
remain saved in the current map page and you can find it again through Drag/ Drop
device and extend its neighbors.
NetBrain PEV4.1 Help
Page | 27
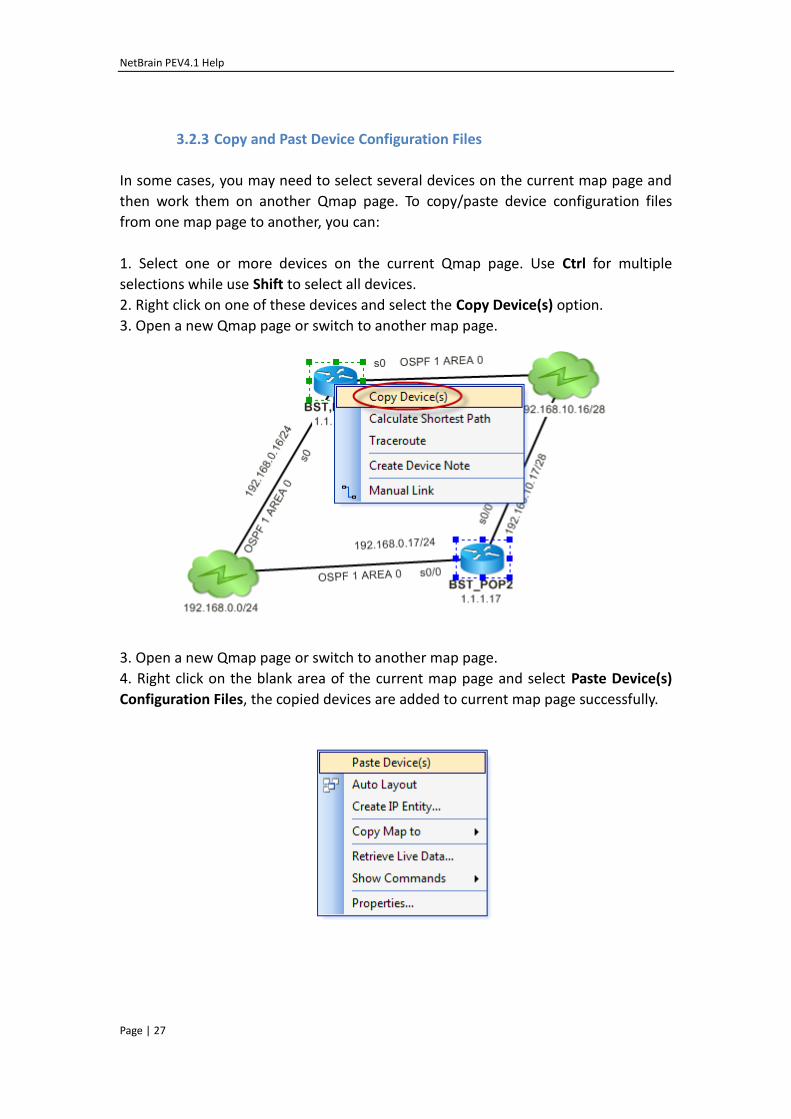
3.2.3 Copy and Past Device Configuration Files
In some cases, you may need to select several devices on the current map page and
then work them on another Qmap page. To copy/paste device configuration files
from one map page to another, you can:
1. Select one or more devices on the current Qmap page. Use Ctrl for multiple
selections while use Shift to select all devices.
2. Right click on one of these devices and select the Copy Device(s) option.
3. Open a new Qmap page or switch to another map page.
3. Open a new Qmap page or switch to another map page.
4. Right click on the blank area of the current map page and select Paste Device(s)
Configuration Files, the copied devices are added to current map page successfully.
NetBrain PEV4.1 Help
Page | 28
3.3 View Properties of a Network Object
The properties of a network object are displayed in the Properties pane.
In the workspace pane or a map, select an object such as a router or an interface, its
properties are displayed in the properties pane.
Tip: You can right-click an object and select the Properties pane. The Properties pane
opens to display the properties of the selected object.
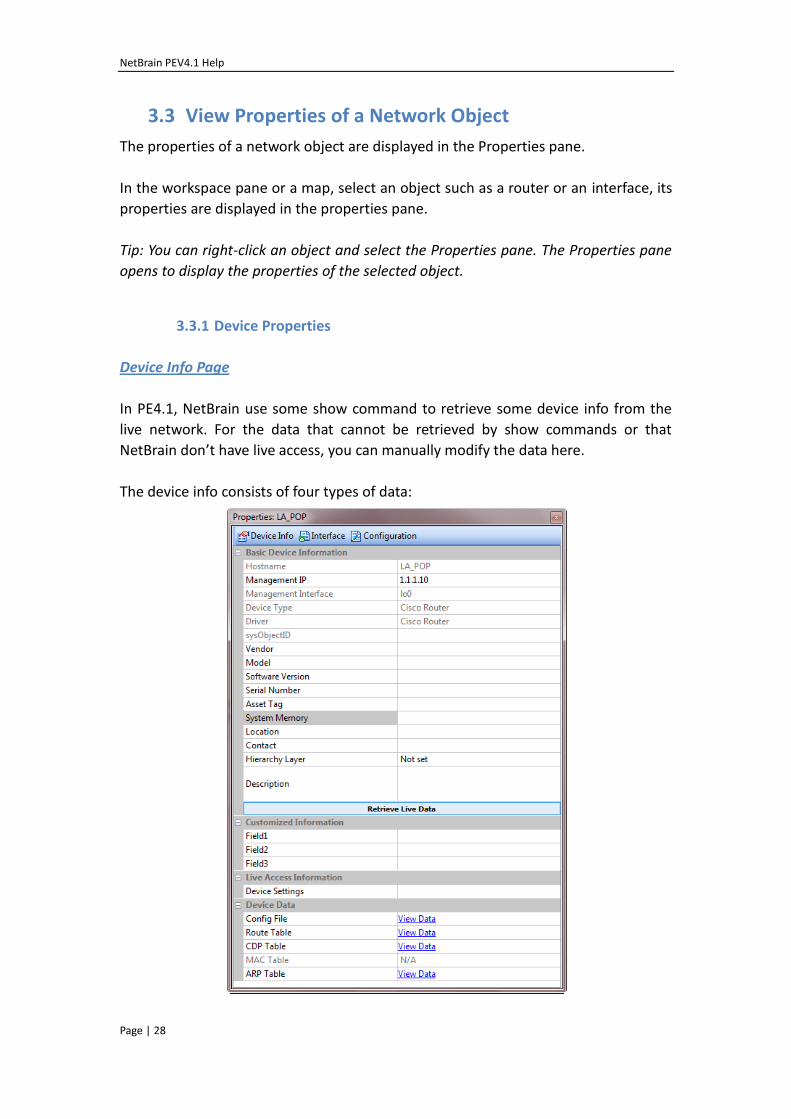
3.3.1 Device Properties
Device Info Page
In PE4.1, NetBrain use some show command to retrieve some device info from the
live network. For the data that cannot be retrieved by show commands or that
NetBrain don’t have live access, you can manually modify the data here.
The device info consists of four types of data:
NetBrain PEV4.1 Help
Page | 29
Basic device information
Field Description
Hostname The device hostname, used to identify a device.
Management IP The management IP address.
Management Interface The interface with the management IP address configured.
Device Type The type of this device.
Driver The driver of this device.
sysObjectID The sysObjectID of this device. (empty in PE4.1 version)
Vendor The vendor of this device.
Model The model of this device.
Software Version Software Version of this device, for example, 11.1(12) for a
Cisco router means IOS 11.1(12).
Serial Number Serial Number of this device
Asset Tag The label for this device
System Memory The system memory of this device
Location The location of this device
Contact Contact information for this device
Hierarchy Layer The hierarchy of this device. The value can be: Not set,
Core, Distribution or Access.
Description Description for the device (maximum 256 characters)
Retrieve live data Click this button to retrieve the device date from the live
network.
Customized Information
By default three customized fields are displayed here: field 1, field 2 and field 3. You
can set the values for these fields in the properties pane.
Live Access Information
Fields Description
Device Settings Device settings of this device. Refer to Device Settings for
details.
Device Data
Device data includes Configuration File, Route Table, CDP Table, MAC Table and ARP
Table.
Click the View Data button to view the data in the current map page. If a type of data
is not applied to the certain type of devices, e.g., a router does not have MAC table,
it will be labeled as N/A.
NetBrain PEV4.1 Help
Page | 30
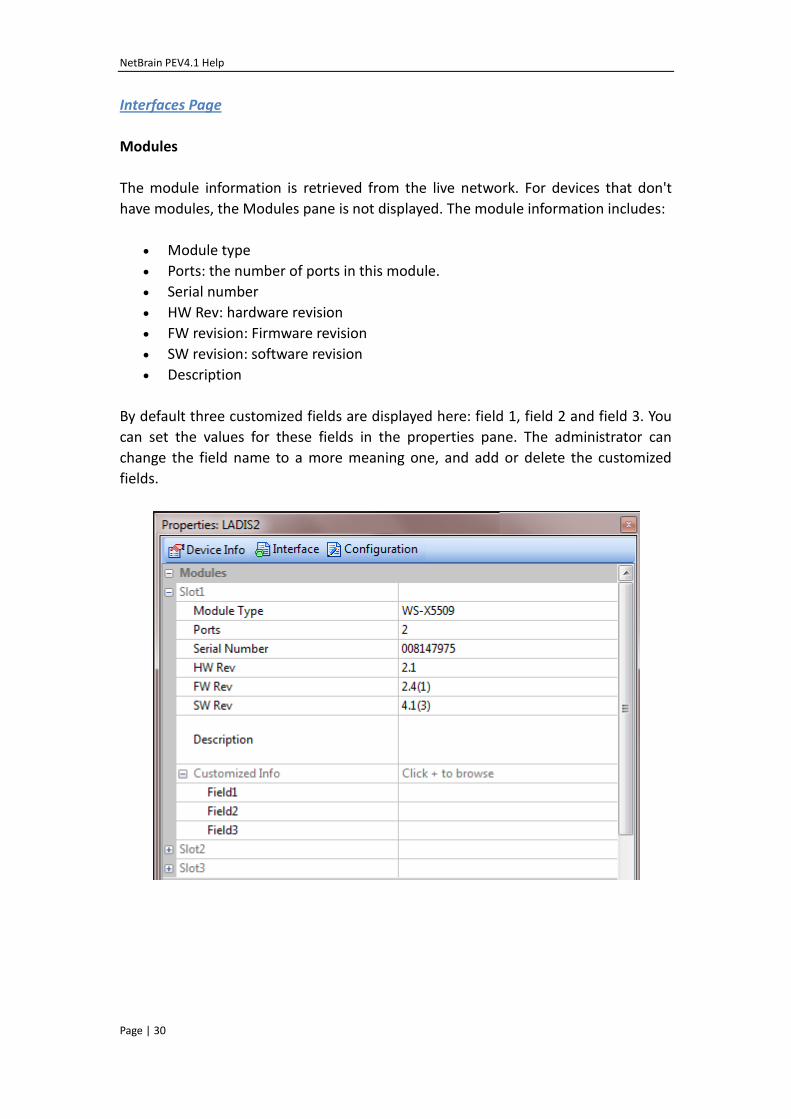
Interfaces Page
Modules
The module information is retrieved from the live network. For devices that don't
have modules, the Modules pane is not displayed. The module information includes:
Module type
Ports: the number of ports in this module.
Serial number
HW Rev: hardware revision
FW revision: Firmware revision
SW revision: software revision
Description
By default three customized fields are displayed here: field 1, field 2 and field 3. You
can set the values for these fields in the properties pane. The administrator can
change the field name to a more meaning one, and add or delete the customized
fields.
NetBrain PEV4.1 Help
Page | 31
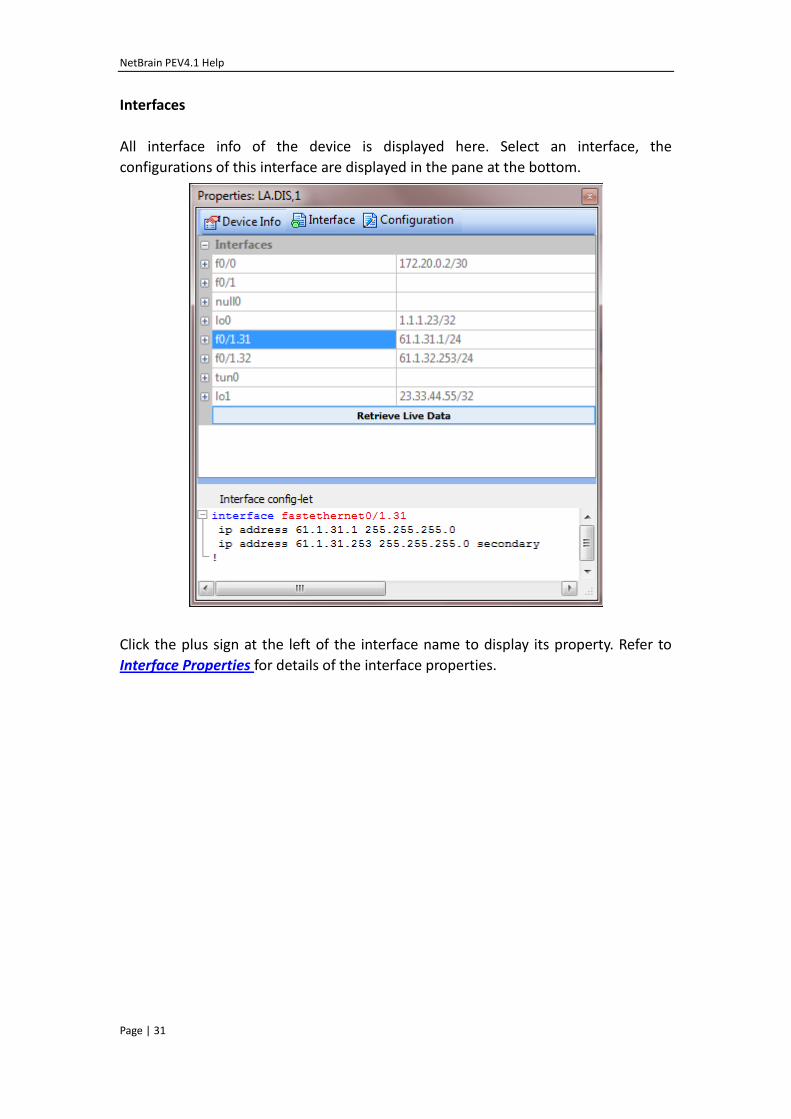
Interfaces
All interface info of the device is displayed here. Select an interface, the
configurations of this interface are displayed in the pane at the bottom.
Click the plus sign at the left of the interface name to display its property. Refer to
Interface Properties for details of the interface properties.
NetBrain PEV4.1 Help
Page | 32
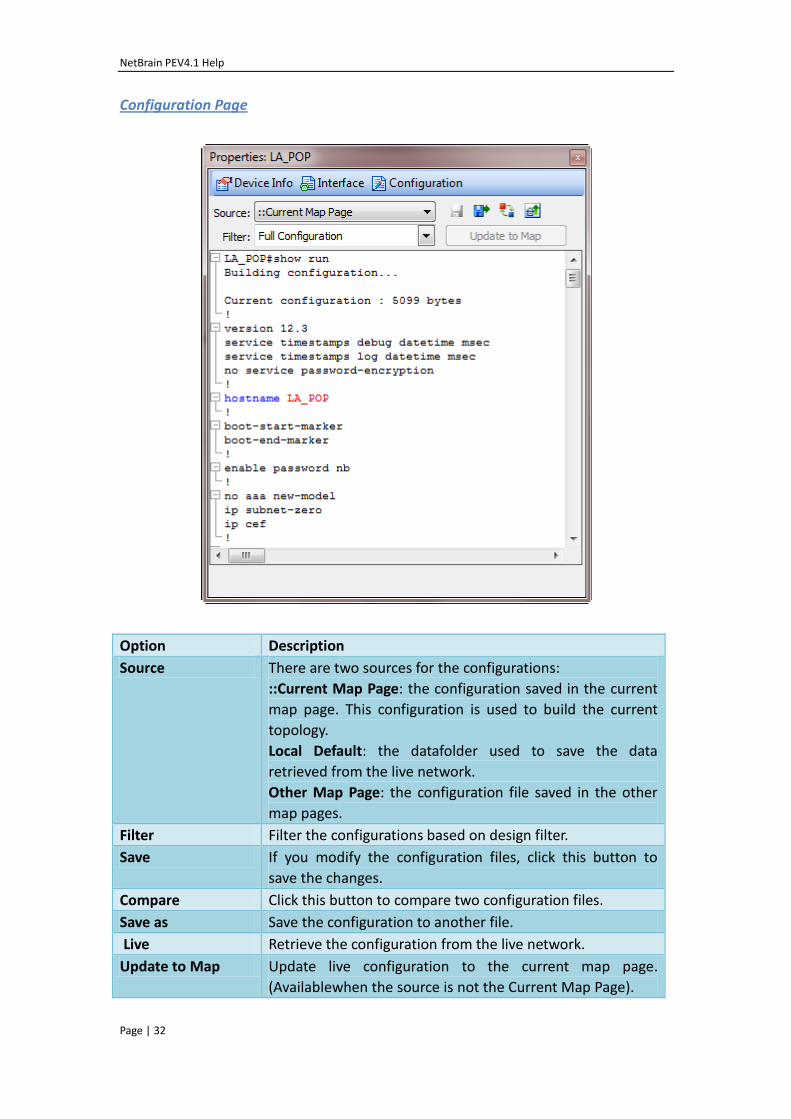
Configuration Page
Option Description
Source There are two sources for the configurations:
::Current Map Page: the configuration saved in the current
map page. This configuration is used to build the current
topology.
Local Default: the datafolder used to save the data
retrieved from the live network.
Other Map Page: the configuration file saved in the other
map pages.
Filter Filter the configurations based on design filter.
Save If you modify the configuration files, click this button to
save the changes.
Compare Click this button to compare two configuration files.
Save as Save the configuration to another file.
Live Retrieve the configuration from the live network.
Update to Map Update live configuration to the current map page.
(Availablewhen the source is not the Current Map Page).
NetBrain PEV4.1 Help
Page | 33
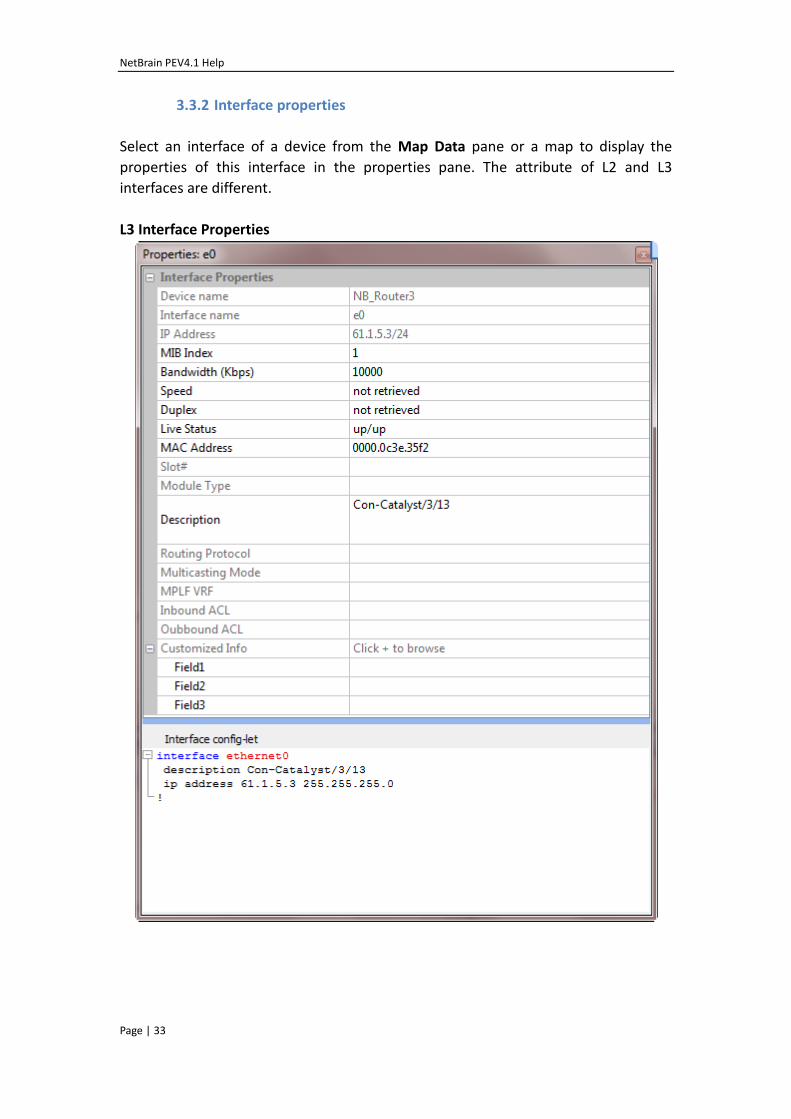
3.3.2 Interface properties
Select an interface of a device from the Map Data pane or a map to display the
properties of this interface in the properties pane. The attribute of L2 and L3
interfaces are different.
L3 Interface Properties
NetBrain PEV4.1 Help
Page | 34
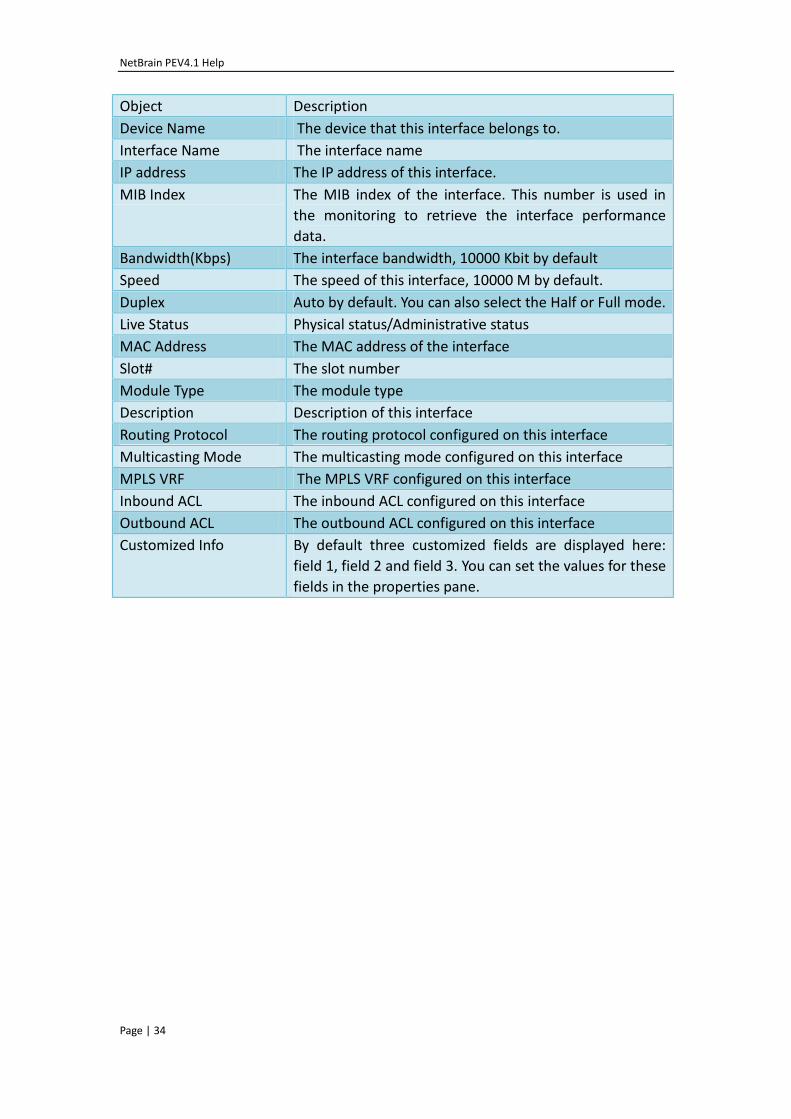
Object Description
Device Name The device that this interface belongs to.
Interface Name The interface name
IP address The IP address of this interface.
MIB Index The MIB index of the interface. This number is used in
the monitoring to retrieve the interface performance
data.
Bandwidth(Kbps) The interface bandwidth, 10000 Kbit by default
Speed The speed of this interface, 10000 M by default.
Duplex Auto by default. You can also select the Half or Full mode.
Live Status Physical status/Administrative status
MAC Address The MAC address of the interface
Slot# The slot number
Module Type The module type
Description Description of this interface
Routing Protocol The routing protocol configured on this interface
Multicasting Mode The multicasting mode configured on this interface
MPLS VRF The MPLS VRF configured on this interface
Inbound ACL The inbound ACL configured on this interface
Outbound ACL The outbound ACL configured on this interface
Customized Info By default three customized fields are displayed here:
field 1, field 2 and field 3. You can set the values for these
fields in the properties pane.
NetBrain PEV4.1 Help
Page | 35
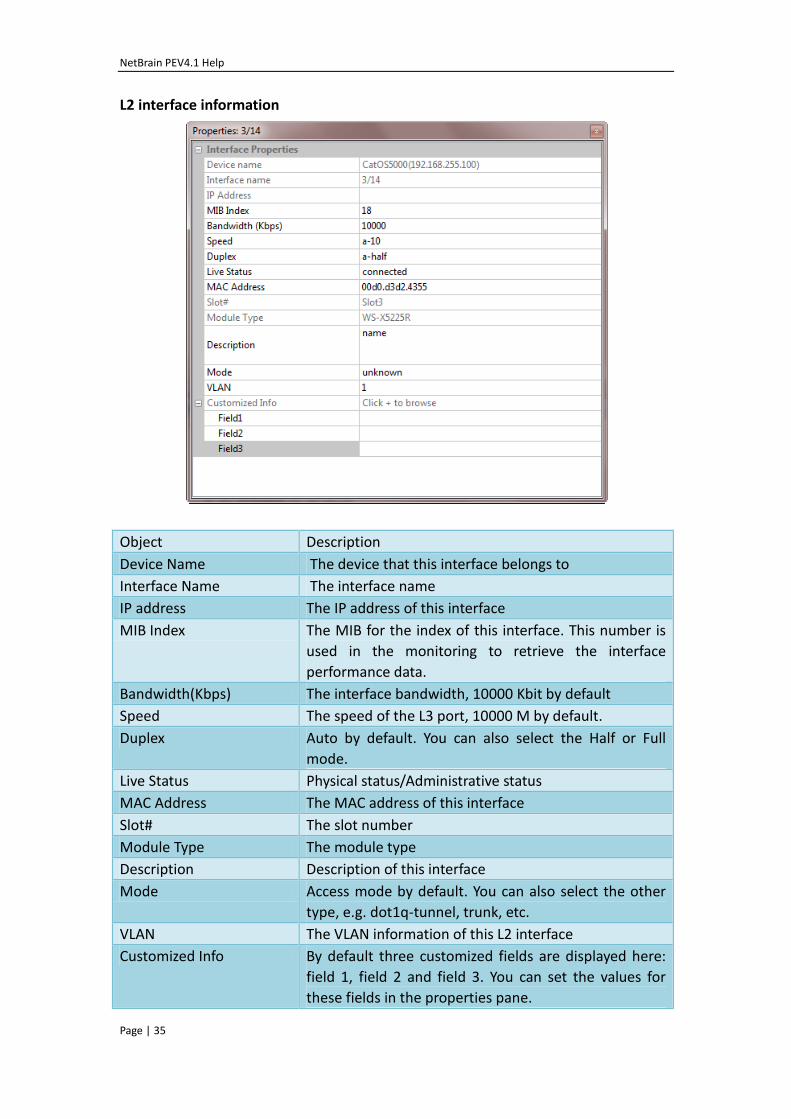
L2 interface information
Object Description
Device Name The device that this interface belongs to
Interface Name The interface name
IP address The IP address of this interface
MIB Index The MIB for the index of this interface. This number is
used in the monitoring to retrieve the interface
performance data.
Bandwidth(Kbps) The interface bandwidth, 10000 Kbit by default
Speed The speed of the L3 port, 10000 M by default.
Duplex Auto by default. You can also select the Half or Full
mode.
Live Status Physical status/Administrative status
MAC Address The MAC address of this interface
Slot# The slot number
Module Type The module type
Description Description of this interface
Mode Access mode by default. You can also select the other
type, e.g. dot1q-tunnel, trunk, etc.
VLAN The VLAN information of this L2 interface
Customized Info By default three customized fields are displayed here:
field 1, field 2 and field 3. You can set the values for
these fields in the properties pane.
NetBrain PEV4.1 Help
Page | 36
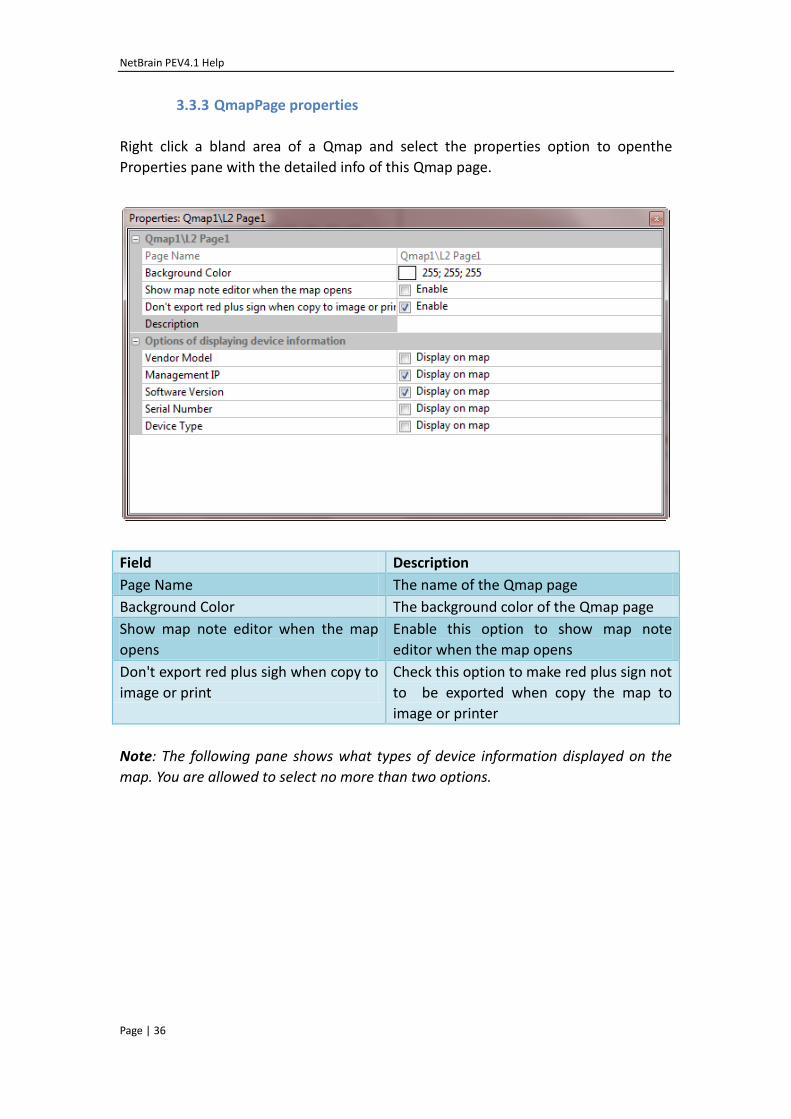
3.3.3 QmapPage properties
Right click a bland area of a Qmap and select the properties option to openthe
Properties pane with the detailed info of this Qmap page.
Field Description
Page Name The name of the Qmap page
Background Color The background color of the Qmap page
Show map note editor when the map
opens
Enable this option to show map note
editor when the map opens
Don't export red plus sigh when copy to
image or print
Check this option to make red plus sign not
to be exported when copy the map to
image or printer
Note: The following pane shows what types of device information displayed on the
map. You are allowed to select no more than two options.
NetBrain PEV4.1 Help
Page | 37
3.4 Manage data inside a Qmap
A NetBrain Qmap is a self-contained map. It not only contains network topology
information, but also the configurations of all devices in a Qmap. The user can
designate a Qmap Datafolder to include all live network data. Notes can be added to
a Qmap. Therefore, a network engineer can include an entire design in a single Qmap
file and share his/her work with other engineers via sending them the Qmap.
A Qmap can contain the following types of data which the user can view and manage
via the Map Attachment window:
Map notes
Map DataFolders
External documents
Device configuration files
3.4.1 Manage the map page
A Qmap can include more than one map page. This can be useful if a network task is
involved in more than one topology map, and all information will be saved in a single
file. You can then easily send the Qmap file to your colleagues for review.
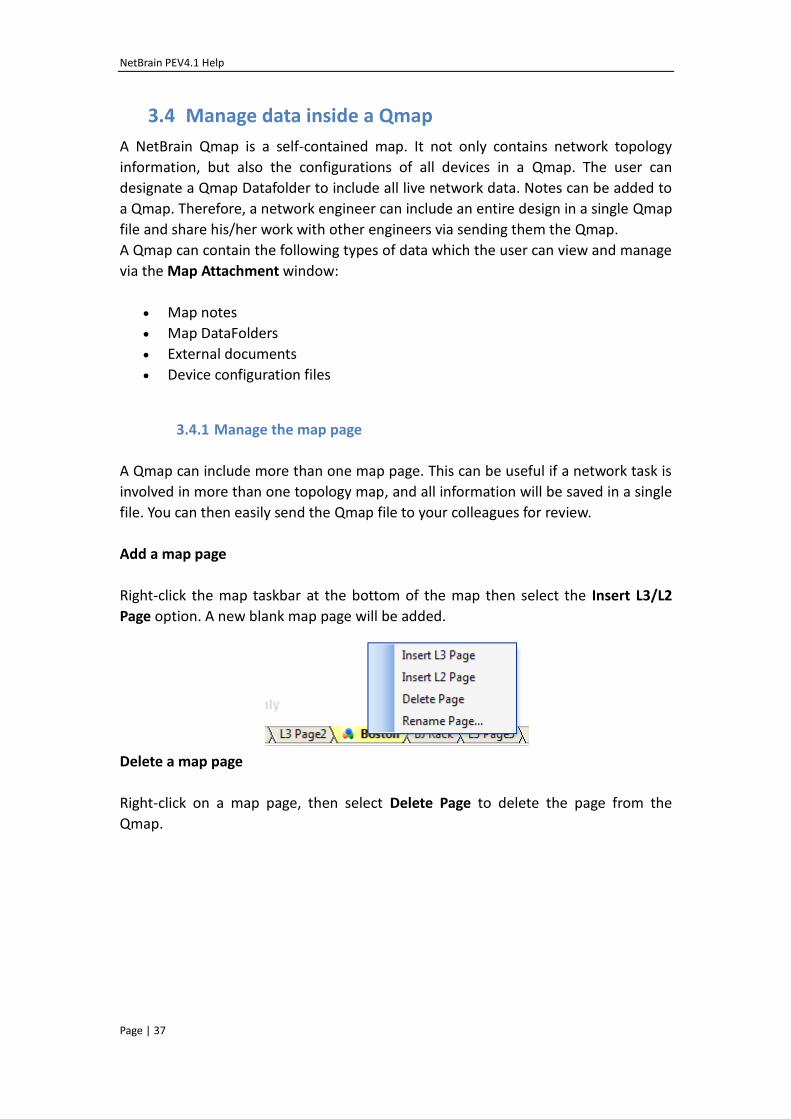
Add a map page
Right-click the map taskbar at the bottom of the map then select the Insert L3/L2
Page option. A new blank map page will be added.
Delete a map page
Right-click on a map page, then select Delete Page to delete the page from the
Qmap.
NetBrain PEV4.1 Help
Page | 38
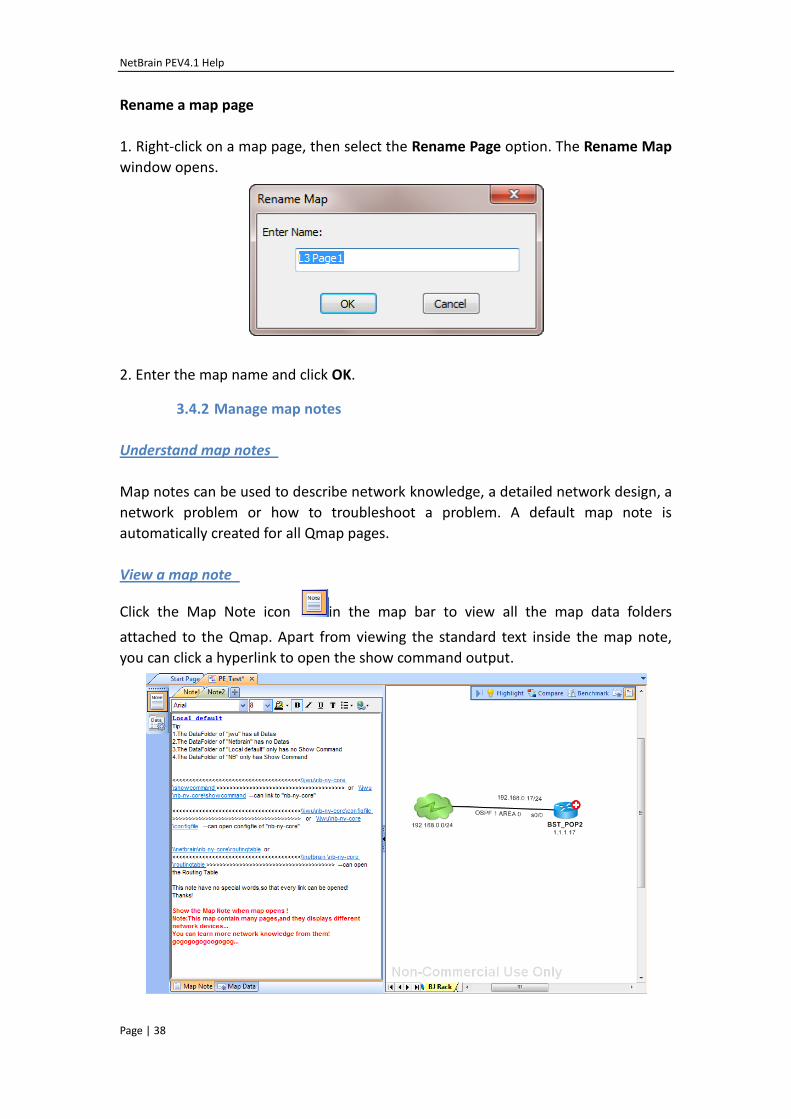
Rename a map page
1. Right-click on a map page, then select the Rename Page option. The Rename Map
window opens.
2. Enter the map name and click OK.
3.4.2 Manage map notes
Understand map notes
Map notes can be used to describe network knowledge, a detailed network design, a
network problem or how to troubleshoot a problem. A default map note is
automatically created for all Qmap pages.
View a map note
Click the Map Note icon in the map bar to view all the map data folders
attached to the Qmap. Apart from viewing the standard text inside the map note,
you can click a hyperlink to open the show command output.
NetBrain PEV4.1 Help
Page | 39
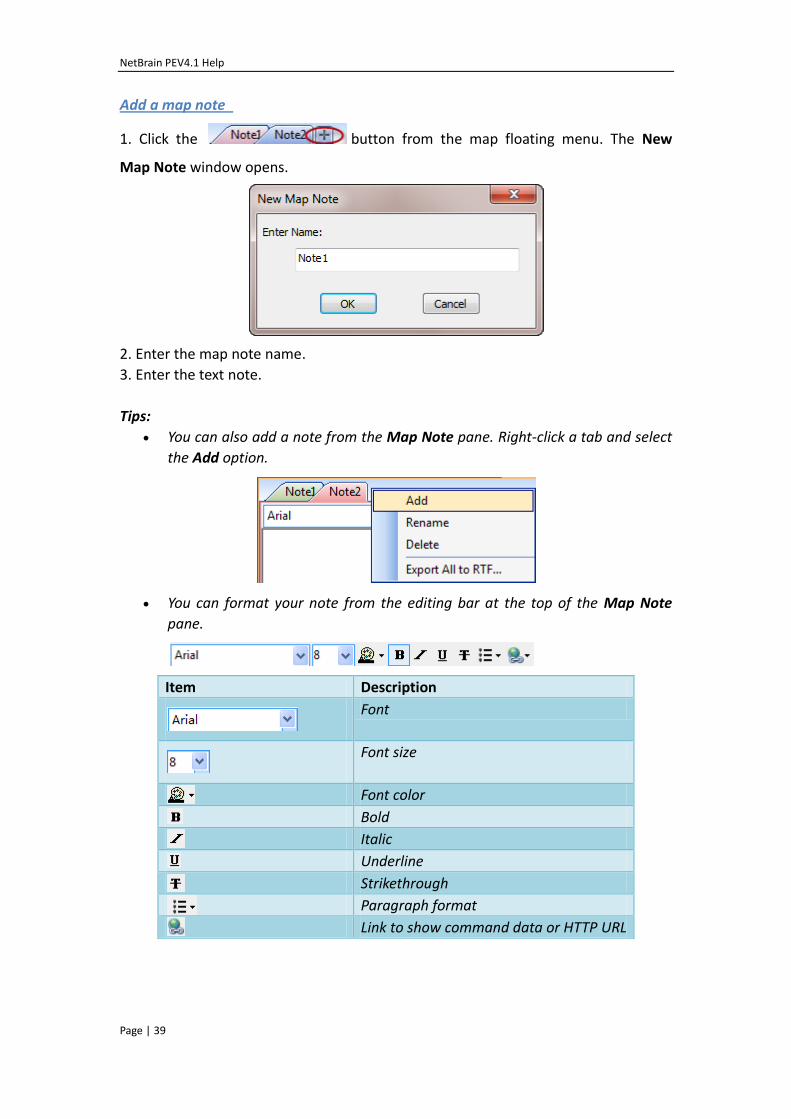
Add a map note
1. Click the button from the map floating menu. The New
Map Note window opens.
2. Enter the map note name.
3. Enter the text note.
Tips:
You can also add a note from the Map Note pane. Right-click a tab and select
the Add option.
You can format your note from the editing bar at the top of the Map Note
pane.
Item Description
Font
Font size
Font color
Bold
Italic
Underline
Strikethrough
Paragraph format
Link to show command data or HTTP URL
NetBrain PEV4.1 Help
Page | 40
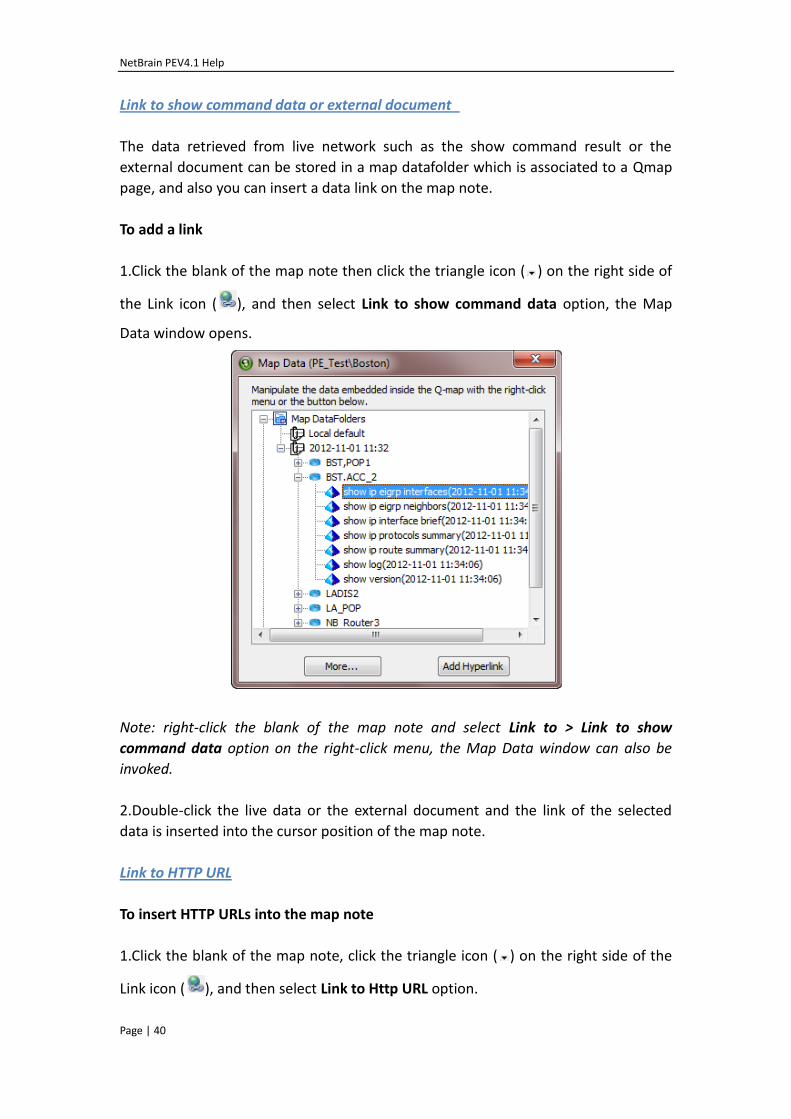
Link to show command data or external document
The data retrieved from live network such as the show command result or the
external document can be stored in a map datafolder which is associated to a Qmap
page, and also you can insert a data link on the map note.
To add a link
1.Click the blank of the map note then click the triangle icon ( ) on the right side of
the Link icon ( ), and then select Link to show command data option, the Map
Data window opens.
Note: right-click the blank of the map note and select Link to > Link to show
command data option on the right-click menu, the Map Data window can also be
invoked.
2.Double-click the live data or the external document and the link of the selected
data is inserted into the cursor position of the map note.
Link to HTTP URL
To insert HTTP URLs into the map note
1.Click the blank of the map note, click the triangle icon ( ) on the right side of the
Link icon ( ), and then select Link to Http URL option.
NetBrain PEV4.1 Help
Page | 41
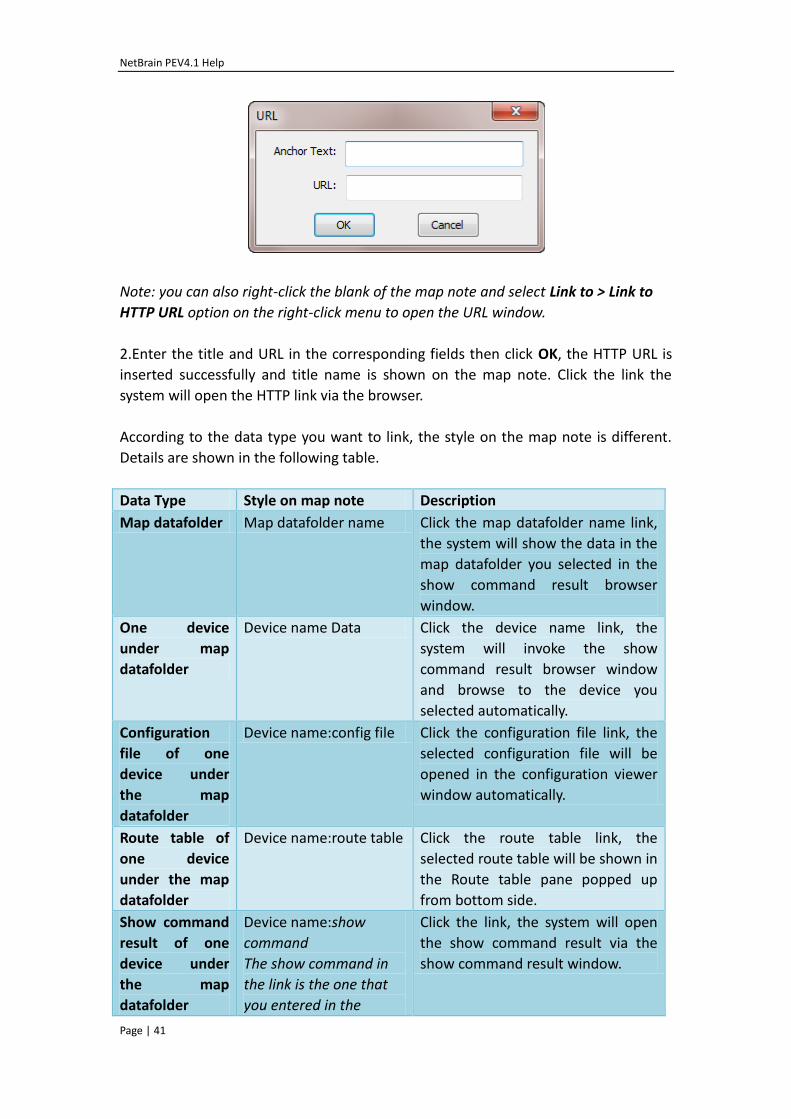
Note: you can also right-click the blank of the map note and select Link to > Link to
HTTP URL option on the right-click menu to open the URL window.
2.Enter the title and URL in the corresponding fields then click OK, the HTTP URL is
inserted successfully and title name is shown on the map note. Click the link the
system will open the HTTP link via the browser.
According to the data type you want to link, the style on the map note is different.
Details are shown in the following table.
Data Type Style on map note Description
Map datafolder Map datafolder name Click the map datafolder name link,
the system will show the data in the
map datafolder you selected in the
show command result browser
window.
One device
under map
datafolder
Device name Data Click the device name link, the
system will invoke the show
command result browser window
and browse to the device you
selected automatically.
Configuration
file of one
device under
the map
datafolder
Device name:config file Click the configuration file link, the
selected configuration file will be
opened in the configuration viewer
window automatically.
Route table of
one device
under the map
datafolder
Device name:route table Click the route table link, the
selected route table will be shown in
the Route table pane popped up
from bottom side.
Show command
result of one
device under
the map
datafolder
Device name:show
command
The show command in
the link is the one that
you entered in the
Click the link, the system will open
the show command result via the
show command result window.
NetBrain PEV4.1 Help
Page | 42
Execute show command
window.
External
document
External document
name
Click the external document link, the
system will open the linked
document via the corresponding
program.
HTTP URL Title Name Click the Title name of the HTTP URL
link, the system will open the URL
via the corresponding web browser.
Modify a map note
Open the Map Note pane and select a map note. You can freely edit the content of a
map note, or rename the note by right-clicking the note tab and selecting the
Rename option.
Tip: You can format your note from the editing bar at the top of Map Note pane.
Delete a map note
Right-click the map note tab and select the Delete option.
Export map notes to RTF
To export all map notes to an RTF file, right-click the map note title and select the
Export to RTF option. The Save As window opens. Select a directory and enter a file
name. The map notes will be saved in RTF format.
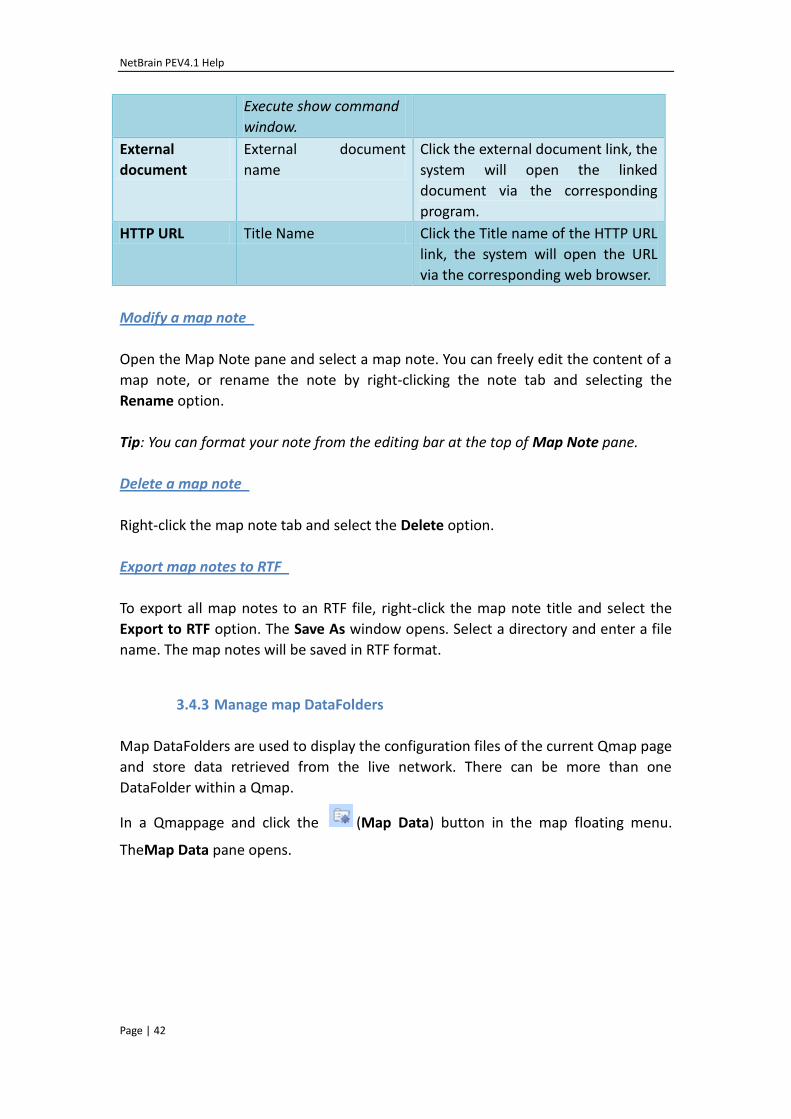
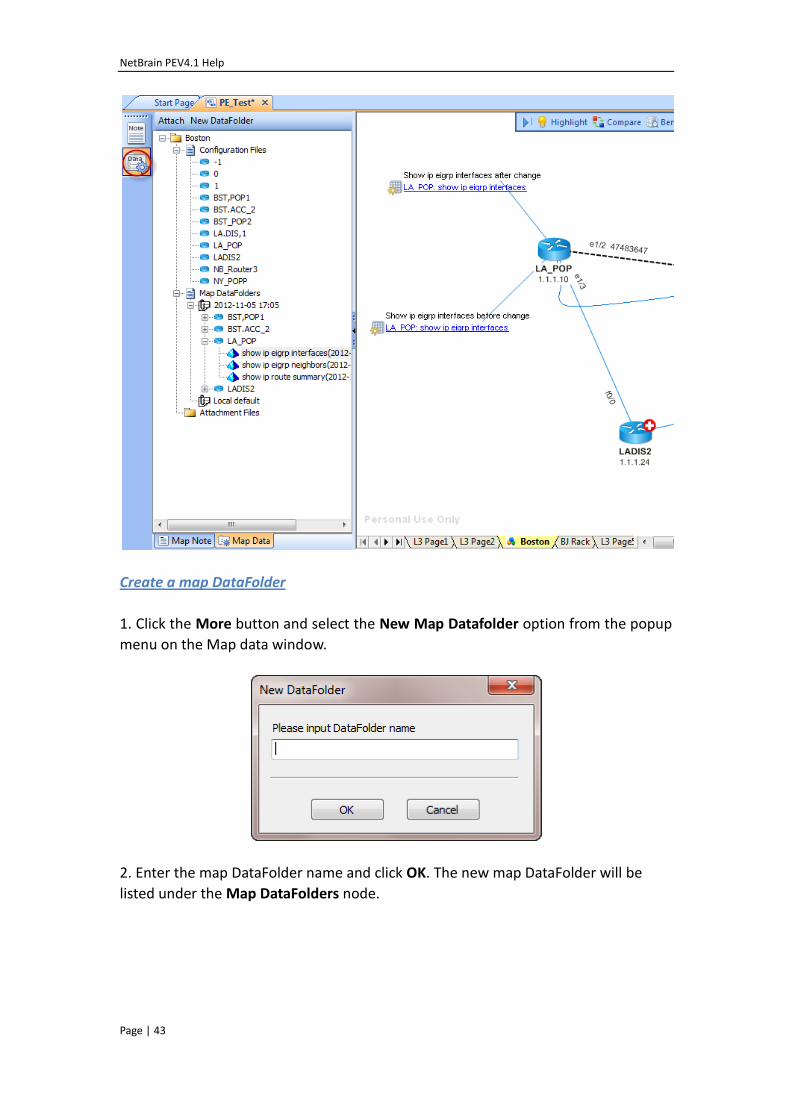
3.4.3 Manage map DataFolders
Map DataFolders are used to display the configuration files of the current Qmap page
and store data retrieved from the live network. There can be more than one
DataFolder within a Qmap.
In a Qmappage and click the (Map Data) button in the map floating menu.
TheMap Data pane opens.
NetBrain PEV4.1 Help
Page | 43
Create a map DataFolder
1. Click the More button and select the New Map Datafolder option from the popup
menu on the Map data window.
2. Enter the map DataFolder name and click OK. The new map DataFolder will be
listed under the Map DataFolders node.
NetBrain PEV4.1 Help
Page | 44
Import a map DataFolder
With NetBrain Workstation you can import a map DataFolder from an existing
DataFolder.
1. Right-click an existing DataFolder icon in the DataFolder node of the Map
Attachments window. The Select DataFolder window opens. Choose a DataFolder
you want to import and then click the OK button.
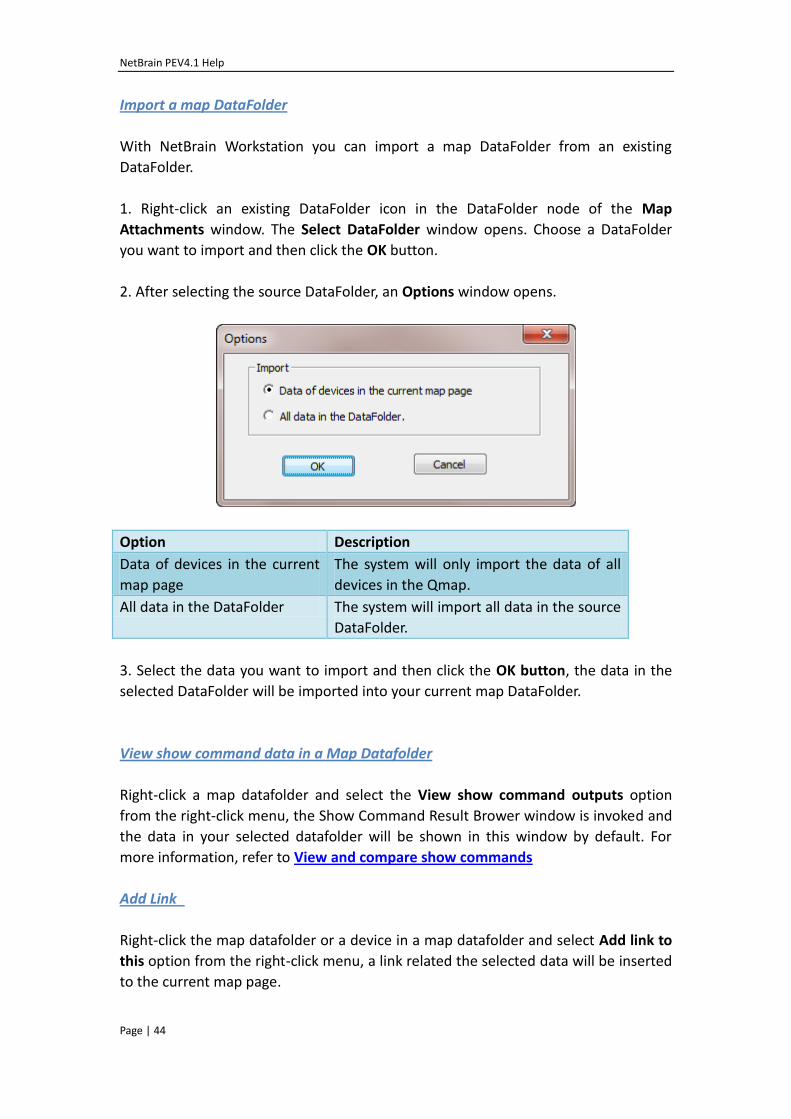
2. After selecting the source DataFolder, an Options window opens.
Option Description
Data of devices in the current
map page
The system will only import the data of all
devices in the Qmap.
All data in the DataFolder The system will import all data in the source
DataFolder.
3. Select the data you want to import and then click the OK button, the data in the
selected DataFolder will be imported into your current map DataFolder.
View show command data in a Map Datafolder
Right-click a map datafolder and select the View show command outputs option
from the right-click menu, the Show Command Result Brower window is invoked and
the data in your selected datafolder will be shown in this window by default. For
more information, refer to View and compare show commands
Add Link
Right-click the map datafolder or a device in a map datafolder and select Add link to
this option from the right-click menu, a link related the selected data will be inserted
to the current map page.
NetBrain PEV4.1 Help
Page | 45
Export the data of a map DataFolder
With NetBrain Workstation you can export a map DataFolder to an existing
DataFolder.
1. Right-click an existing DataFolder icon in the DataFolder node of the Map Data
window, and select the Export to option.
2. Select the DataFolder you want to export to, and then click the OK button. The
data in Local Default DataFolder will be exported to your selected map DataFolder.
Delete a map DataFolder
Right-click the map DataFolder you wish to remove and select the Delete option.
3.4.4 Manage Attachment Files
Any type of file can be imported to a Qmap via the AttachmentsFileswindow, such as
a Word document, Visio map or Excel document.
Create an external document
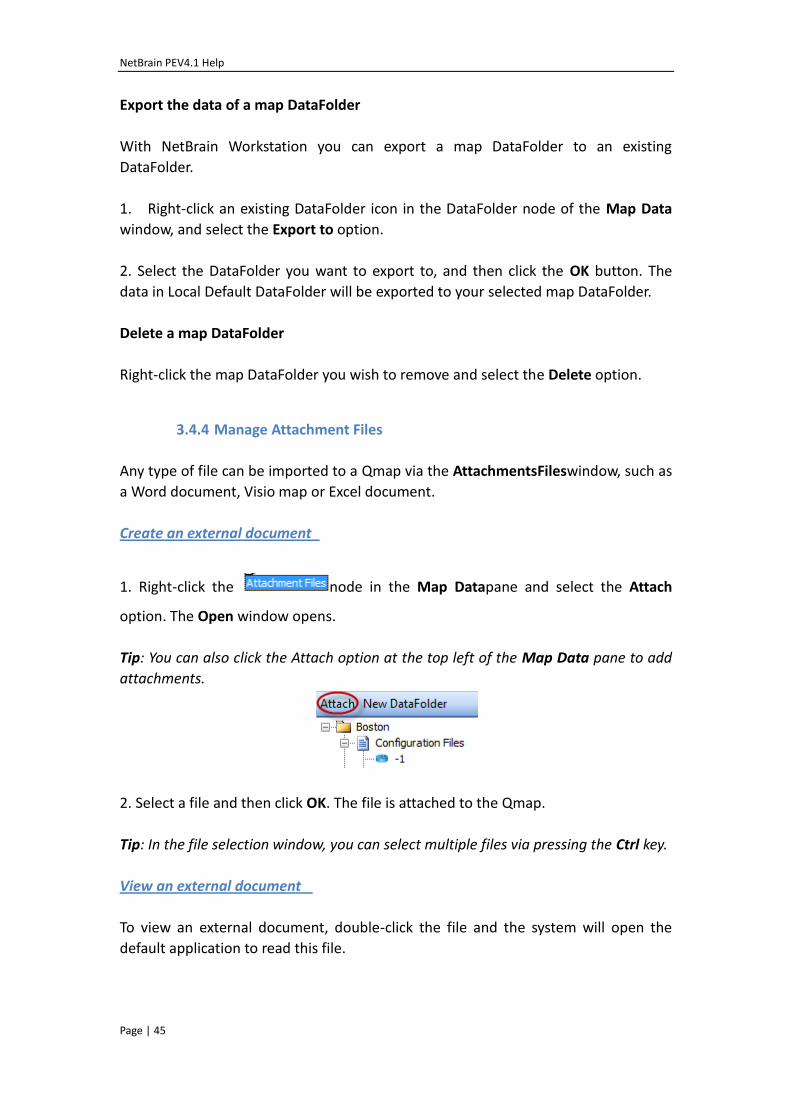
1. Right-click the node in the Map Datapane and select the Attach
option. The Open window opens.
Tip: You can also click the Attach option at the top left of the Map Data pane to add
attachments.
2. Select a file and then click OK. The file is attached to the Qmap.
Tip: In the file selection window, you can select multiple files via pressing the Ctrl key.
View an external document
To view an external document, double-click the file and the system will open the
default application to read this file.
NetBrain PEV4.1 Help
Page | 46
3.5 Edit Maps
With NetBrain PE Workstation, you can edit a Qmap with copy and paste, auto-layout,
text and sharp annotations. You can also draw a Qmap manually.
3.5.1 Basic editing operations
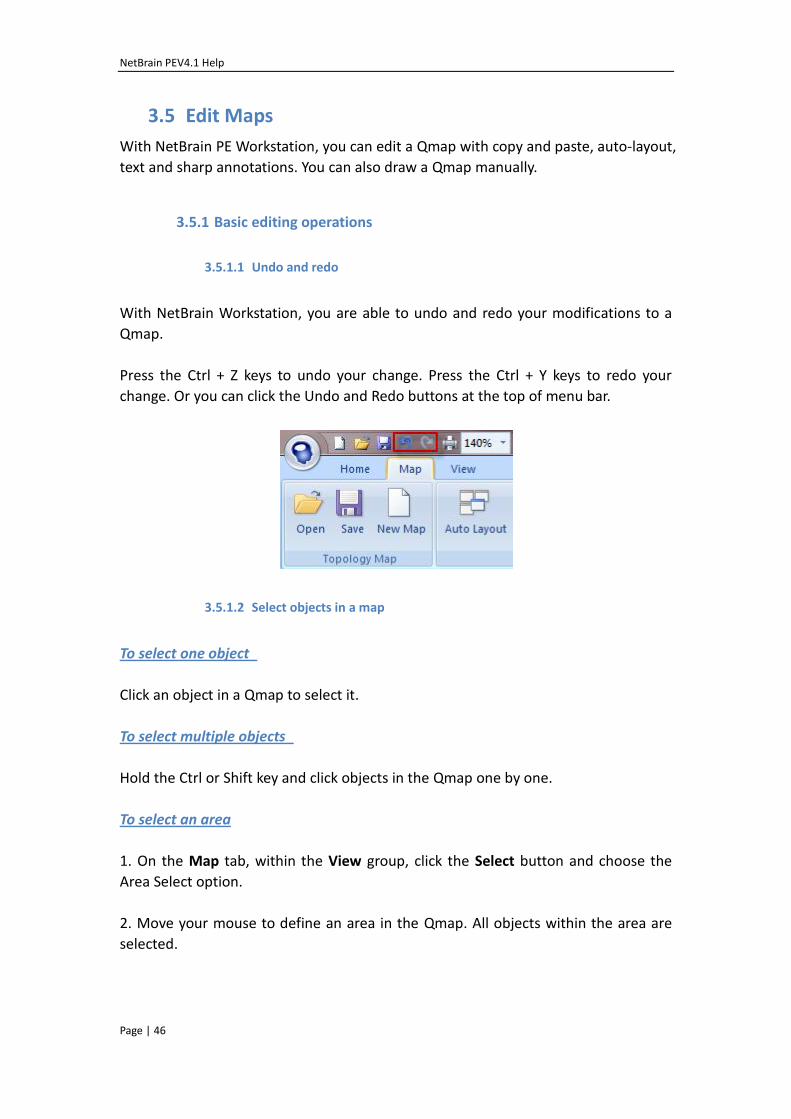
3.5.1.1 Undo and redo
With NetBrain Workstation, you are able to undo and redo your modifications to a
Qmap.
Press the Ctrl + Z keys to undo your change. Press the Ctrl + Y keys to redo your
change. Or you can click the Undo and Redo buttons at the top of menu bar.
3.5.1.2 Select objects in a map
To select one object
Click an object in a Qmap to select it.
To select multiple objects
Hold the Ctrl or Shift key and click objects in the Qmap one by one.
To select an area
1. On the Map tab, within the View group, click the Select button and choose the
Area Select option.
2. Move your mouse to define an area in the Qmap. All objects within the area are
selected.
NetBrain PEV4.1 Help
Page | 47
3.5.2 Change the map scale
3.5.2.1 Crop to real size
NetBrain Workstation provides the ability to crop your Qmap to real size. For
example, if your Qmap has excess blank and unused space, cropping the Qmap to
real size can cut down these areas to make the Qmap easier to read.
To crop the map to real size
On the Map tab, within the Topology Map group, click the Crop Size button.
3.5.2.2 Zooming and view function
The NetBrain Qmap is an interactive map. You can zoom in or out of a Qmap to show
different layers of data. Rolling the mouse wheel forward/backward will zoom in or
out of a Qmap at a default percentage of 20% per one step. The zoom field ,
located at the top of the Workstation window, shows the magnification percentage
of the current Qmap. You can manually select a magnification level from the
drop-down menu, enter a value by hand.
Network data is presented in hierarchy on Qmaps. Different data layers can be
presented at different magnifications. By default, a newly created Qmap is presented
at a magnification level of 100%. In this case, you can view device names. The
following information can be displayed in a Qmap:
Device Name
Interface Name
Interface IP address
LAN/WAN Name
Routing protocol
Multicasting Mode
Inbound ACL
Outbound ACL
MPLS VRF
Description
NetBrain PEV4.1 Help
Page | 48
You can customize the data you want to show on each Qmap and at which
magnification level the data layers start to become visible:
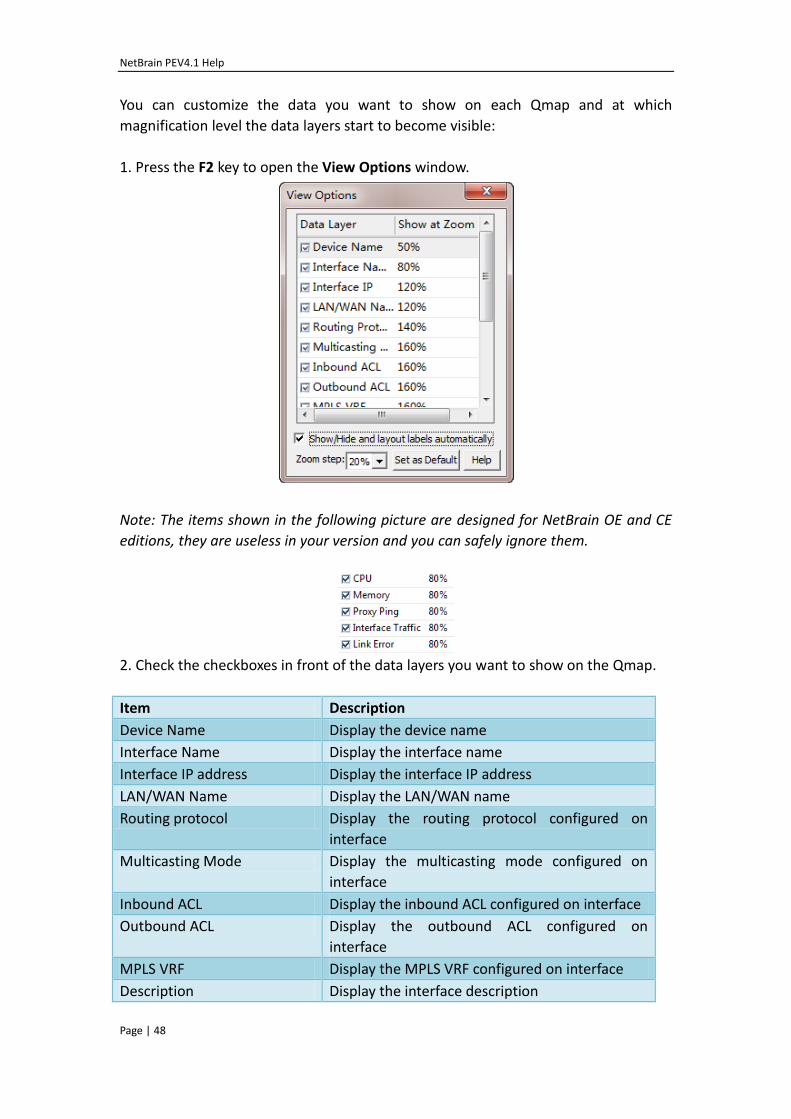
1. Press the F2 key to open the View Options window.
Note: The items shown in the following picture are designed for NetBrain OE and CE
editions, they are useless in your version and you can safely ignore them.
2. Check the checkboxes in front of the data layers you want to show on the Qmap.
Item Description
Device Name Display the device name
Interface Name Display the interface name
Interface IP address Display the interface IP address
LAN/WAN Name Display the LAN/WAN name
Routing protocol Display the routing protocol configured on
interface
Multicasting Mode Display the multicasting mode configured on
interface
Inbound ACL Display the inbound ACL configured on interface
Outbound ACL Display the outbound ACL configured on
interface
MPLS VRF Display the MPLS VRF configured on interface
Description Display the interface description
NetBrain PEV4.1 Help
Page | 49
3. Select a data layer entry and then click the Show at Zoom column field for that
entry to edit it. You can select a magnification level from the drop-down menu or
enter the desired value manually.
Option Description
Show/Hide and layout
labels automatically
To automatically layout Qmap labels to a legible
position.
Zoom step To set the zoom rate when rolling the mouse wheel for
one step.
Set as default To save the current data layer settings as your default
Qmap settings for future Qmaps.
4. Close the window.
3.5.3 Auto layout
The auto layout feature helps you layout all devices in the Qmap to an optimal
position automatically. Please be aware that the auto layout function will undo any
manual adjustments made to the Qmap.
To auto layout the map
On the Map tab, within the Topology Map group, click the Auto Layout button.
Tip: If you are not satisfied with this layout, you can repeat the Auto Layout
operation.
3.5.4 Draw shapes
NetBrain Workstation provides the drawing function to help you to annotate your
Qmaps. You can draw rectangles, eclipses, lines, curves, closed regions, and define a
path.
Here we will show how to draw an ellipse;the same applies to all other shapes, like
rectangle, line, curve, etc.
NetBrain PEV4.1 Help
Page | 50
To draw an ellipse
1. On the Map tab, within the View group, click the Draw icon and then select the
Ellipse option.
2. Move your mouse to draw an ellipse on the map. Right-click menu of an ellipse:
Option Description
Double-click To enter text for the for the ellipse
Edit Copy, paste, or cut this shape to other Qmaps or to other
positions on the Qmap
Order Change the display order of this shape from other objects
Font Change the text font of the text in the shape
Text Color Change the text color of the text in this shape
Background Color Change the background color of the shape
Transparent Background Make the background of the ellipse transparent
Tips:
1. All shapes can be edited from the Map tab > Format group.
2. Select the shape and drag it to move positions.
3.5.5 Draw a device and a link manually
With NetBrain Workstation you can draw a device or a link manually to modify
network topology. This may be necessary when you do not have the required
configuration files or the type of configuration is not supported by NetBrain.
NetBrain PEV4.1 Help
Page | 51
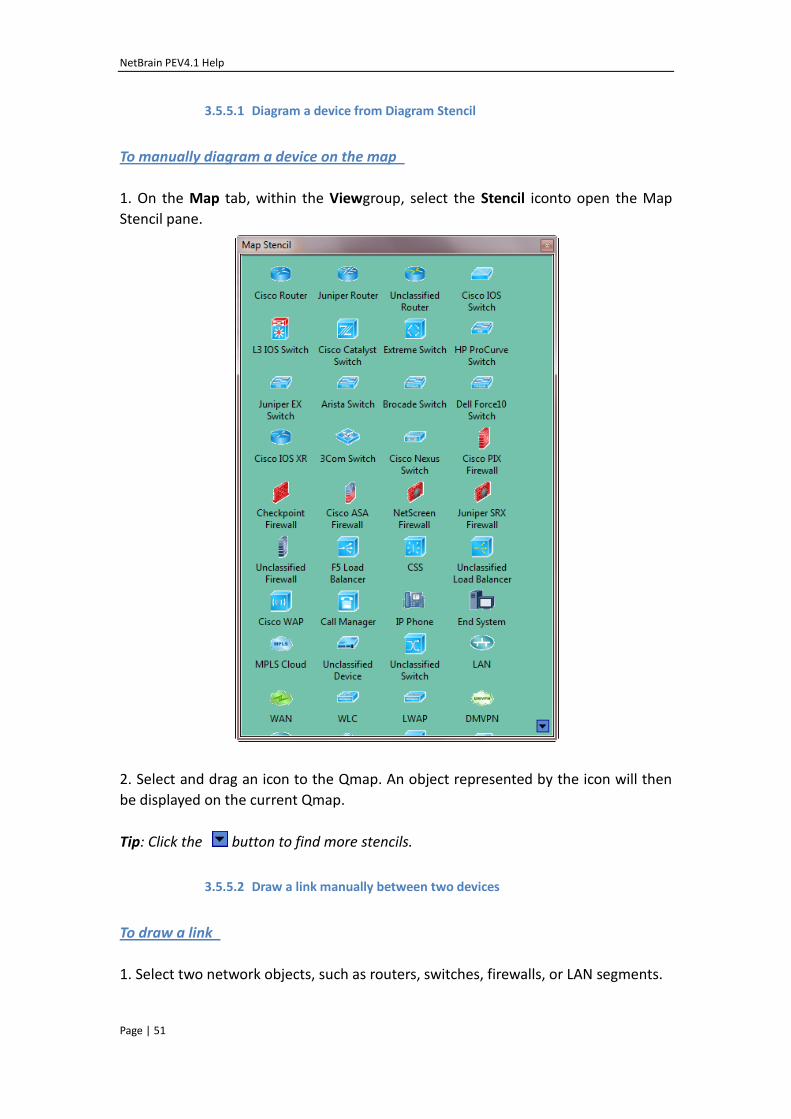
3.5.5.1 Diagram a device from Diagram Stencil
To manually diagram a device on the map
1. On the Map tab, within the Viewgroup, select the Stencil iconto open the Map
Stencil pane.
2. Select and drag an icon to the Qmap. An object represented by the icon will then
be displayed on the current Qmap.
Tip: Click the button to find more stencils.
3.5.5.2 Draw a link manually between two devices
To draw a link
1. Select two network objects, such as routers, switches, firewalls, or LAN segments.
NetBrain PEV4.1 Help
Page | 52
Tip: Hold the Ctrl or Shift key to select two objects.
2. Right-click one of the two objects you just selected and select the Manual Link
option. The two objects are then linked.
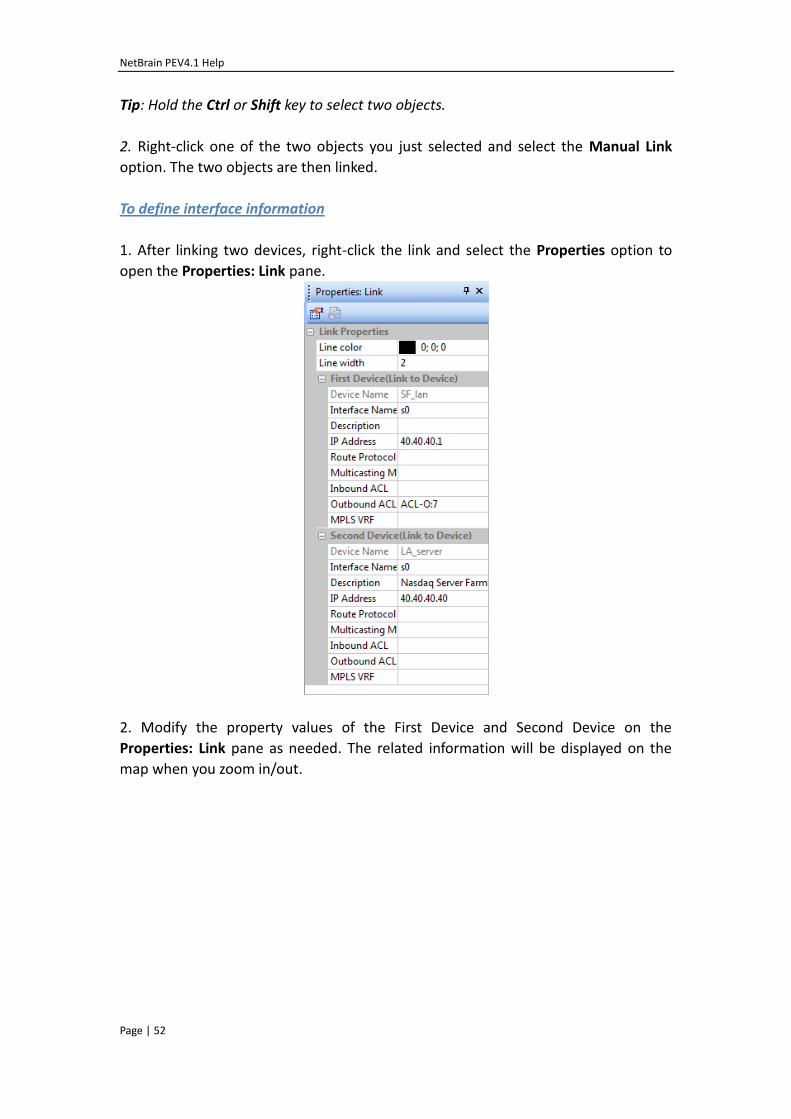
To define interface information
1. After linking two devices, right-click the link and select the Properties option to
open the Properties: Link pane.
2. Modify the property values of the First Device and Second Device on the
Properties: Link pane as needed. The related information will be displayed on the
map when you zoom in/out.
NetBrain PEV4.1 Help
Page | 53
3.6 Copy a map
Save as
To save a Qmap as another copy
1. Select the > Save As option. The Save As window opens.
2. Select a target folder and click the Save button, the current Qmap will be saved as
a copy. After this operation, the current copy will be closed and the other copy will
be opened.
Email a map
NetBrain Workstation offers you the ability to use a defined email application, for
instance, Microsoft Outlook, to email Qmaps to others.
To email a map
1. Right-click a Qmap and then select the Copy Map to > Email option. If the current
Qmap has not been saved, you are prompted to save the Qmap.
2. Click the OK button. The Qmap file is automatically attached to an email.
3. Enter the e-mail address and edit the subject and content.
4. Send the email.
Print a map
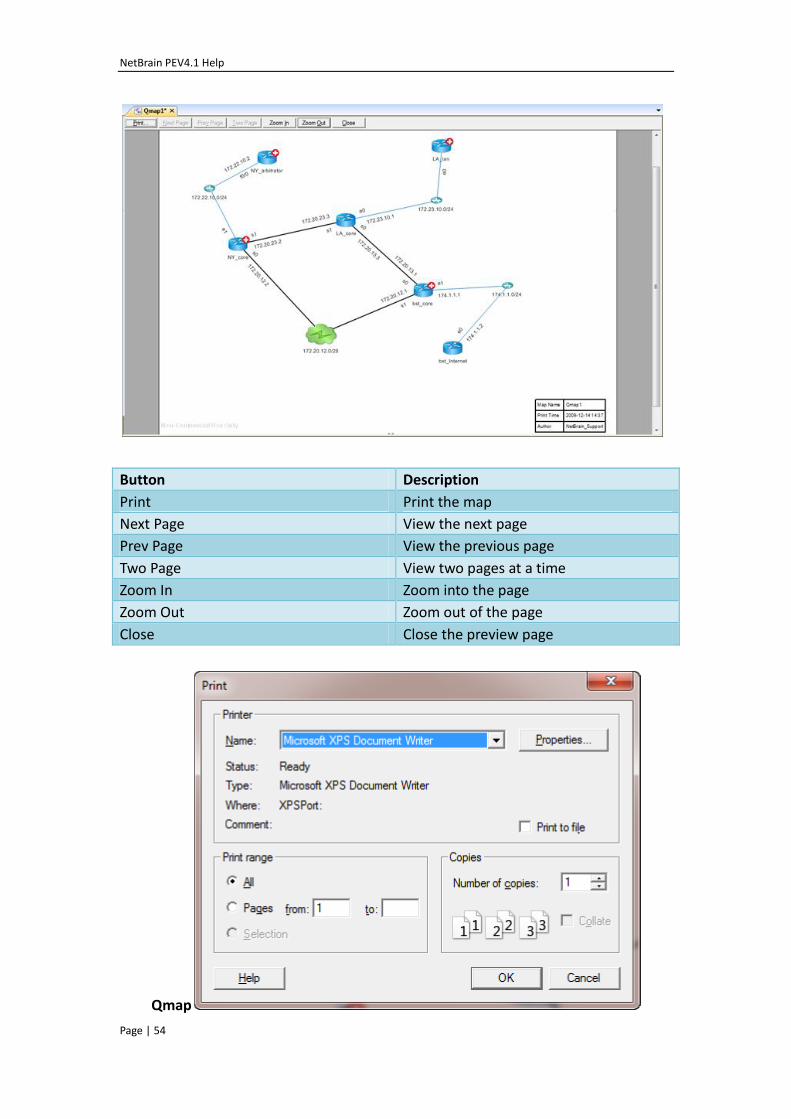
To preview a Qmap
1. Open or create a Qmap and click > Print > Print Preview. The preview page
opens.
NetBrain PEV4.1 Help
Page | 54
Button Description
Print Print the map
Next Page View the next page
Prev Page View the previous page
Two Page View two pages at a time
Zoom In Zoom into the page
Zoom Out Zoom out of the page
Close Close the preview page
Qmap
NetBrain PEV4.1 Help
Page | 55
2. Select a printer and print range.
3. Click the OK button.
Tips:
1. You can also click Copy Map to > Printer from the map right-click menu to open the
Print window.
2. To print a large map, you can zoom into the map as desired and then print the
map.
Export a map to an image file
With NetBrain Workstation you can save a map as a GIF file.
To convert a Qmap to an image file
1. Right-click a blank area of the Qmap and select the Copy Map to > Image option.
2. Select a directory, enter the file name and click the OK button. The map is saved as
a GIF file.
NetBrain PEV4.1 Help
Page | 56
4 Use Maps to Understand Your Network
4.1 Tip window
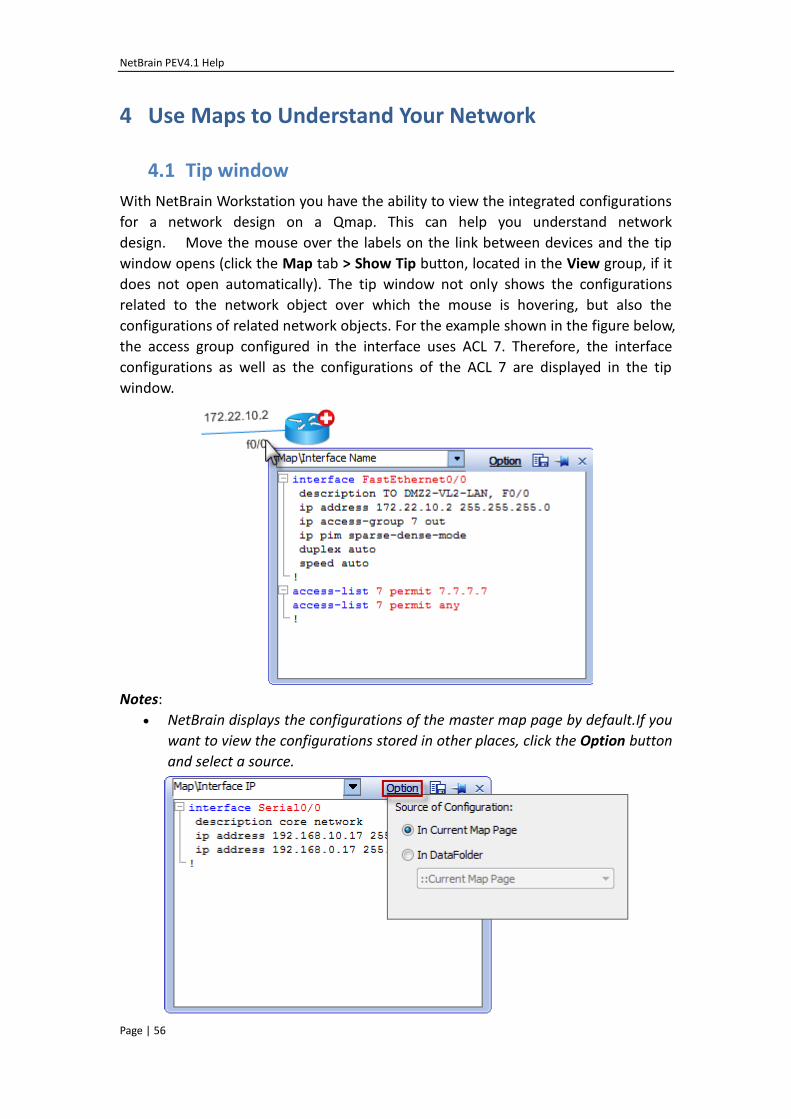
With NetBrain Workstation you have the ability to view the integrated configurations
for a network design on a Qmap. This can help you understand network
design. Move the mouse over the labels on the link between devices and the tip
window opens (click the Map tab > Show Tip button, located in the View group, if it
does not open automatically). The tip window not only shows the configurations
related to the network object over which the mouse is hovering, but also the
configurations of related network objects. For the example shown in the figure below,
the access group configured in the interface uses ACL 7. Therefore, the interface
configurations as well as the configurations of the ACL 7 are displayed in the tip
window.
Notes:
NetBrain displays the configurations of the master map page by default.If you
want to view the configurations stored in other places, click the Option button
and select a source.
NetBrain PEV4.1 Help
Page | 57
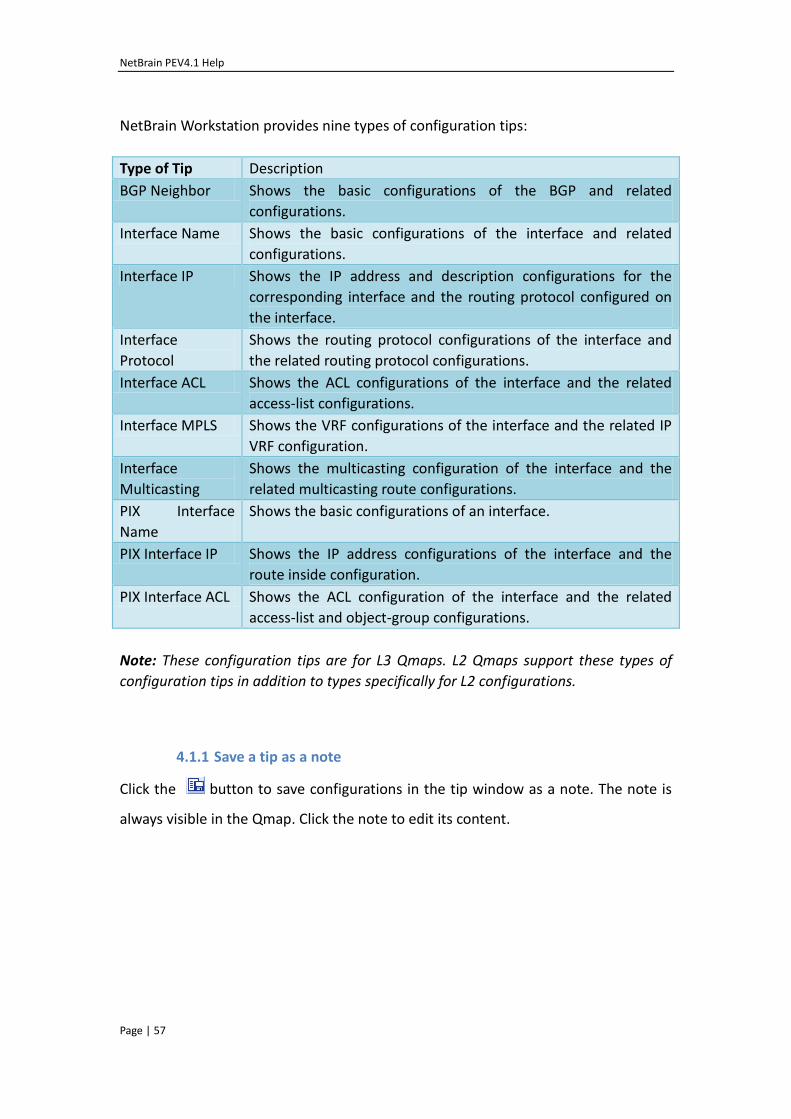
NetBrain Workstation provides nine types of configuration tips:
Type of Tip Description
BGP Neighbor Shows the basic configurations of the BGP and related
configurations.
Interface Name Shows the basic configurations of the interface and related
configurations.
Interface IP Shows the IP address and description configurations for the
corresponding interface and the routing protocol configured on
the interface.
Interface
Protocol
Shows the routing protocol configurations of the interface and
the related routing protocol configurations.
Interface ACL Shows the ACL configurations of the interface and the related
access-list configurations.
Interface MPLS Shows the VRF configurations of the interface and the related IP
VRF configuration.
Interface
Multicasting
Shows the multicasting configuration of the interface and the
related multicasting route configurations.
PIX Interface
Name
Shows the basic configurations of an interface.
PIX Interface IP Shows the IP address configurations of the interface and the
route inside configuration.
PIX Interface ACL Shows the ACL configuration of the interface and the related
access-list and object-group configurations.
Note: These configuration tips are for L3 Qmaps. L2 Qmaps support these types of
configuration tips in addition to types specifically for L2 configurations.
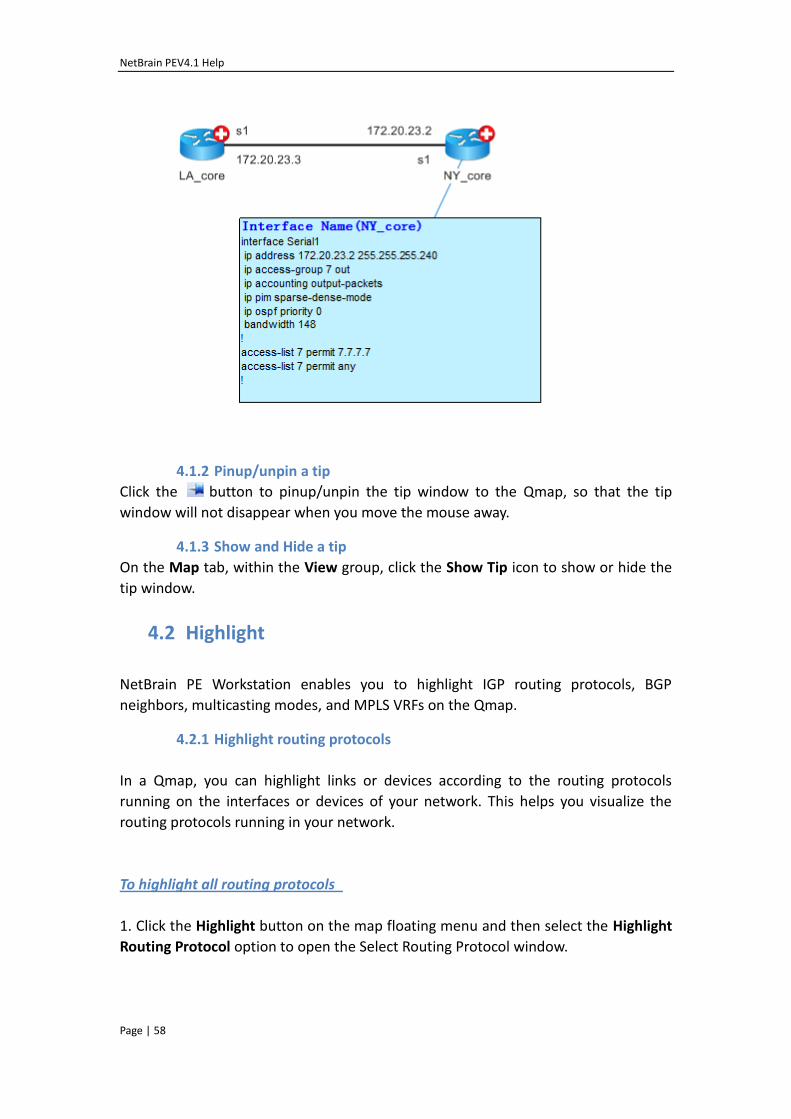
4.1.1 Save a tip as a note
Click the button to save configurations in the tip window as a note. The note is
always visible in the Qmap. Click the note to edit its content.
NetBrain PEV4.1 Help
Page | 58
4.1.2 Pinup/unpin a tip
Click the button to pinup/unpin the tip window to the Qmap, so that the tip
window will not disappear when you move the mouse away.
4.1.3 Show and Hide a tip
On the Map tab, within the View group, click the Show Tip icon to show or hide the
tip window.
4.2 Highlight
NetBrain PE Workstation enables you to highlight IGP routing protocols, BGP
neighbors, multicasting modes, and MPLS VRFs on the Qmap.
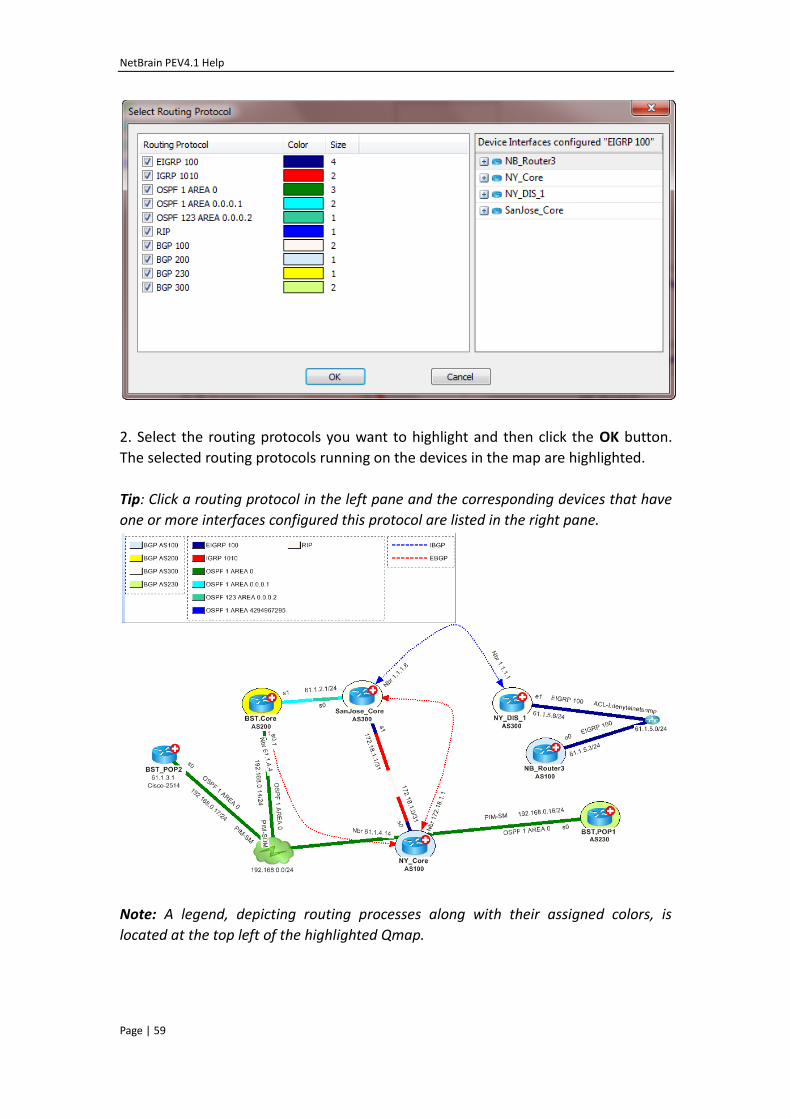
4.2.1 Highlight routing protocols
In a Qmap, you can highlight links or devices according to the routing protocols
running on the interfaces or devices of your network. This helps you visualize the
routing protocols running in your network.
To highlight all routing protocols
1. Click the Highlight button on the map floating menu and then select the Highlight
Routing Protocol option to open the Select Routing Protocol window.
NetBrain PEV4.1 Help
Page | 59
2. Select the routing protocols you want to highlight and then click the OK button.
The selected routing protocols running on the devices in the map are highlighted.
Tip: Click a routing protocol in the left pane and the corresponding devices that have
one or more interfaces configured this protocol are listed in the right pane.
Note: A legend, depicting routing processes along with their assigned colors, is
located at the top left of the highlighted Qmap.
NetBrain PEV4.1 Help
Page | 60
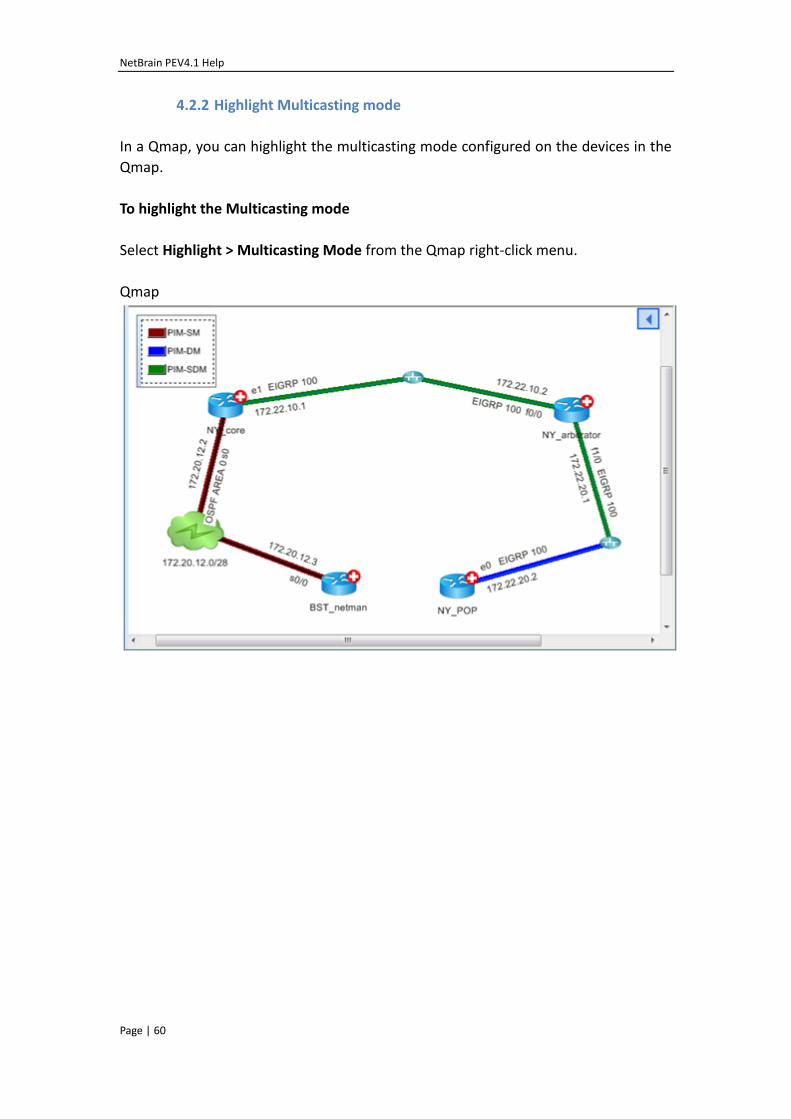
4.2.2 Highlight Multicasting mode
In a Qmap, you can highlight the multicasting mode configured on the devices in the
Qmap.
To highlight the Multicasting mode
Select Highlight > Multicasting Mode from the Qmap right-click menu.
Qmap
NetBrain PEV4.1 Help
Page | 61
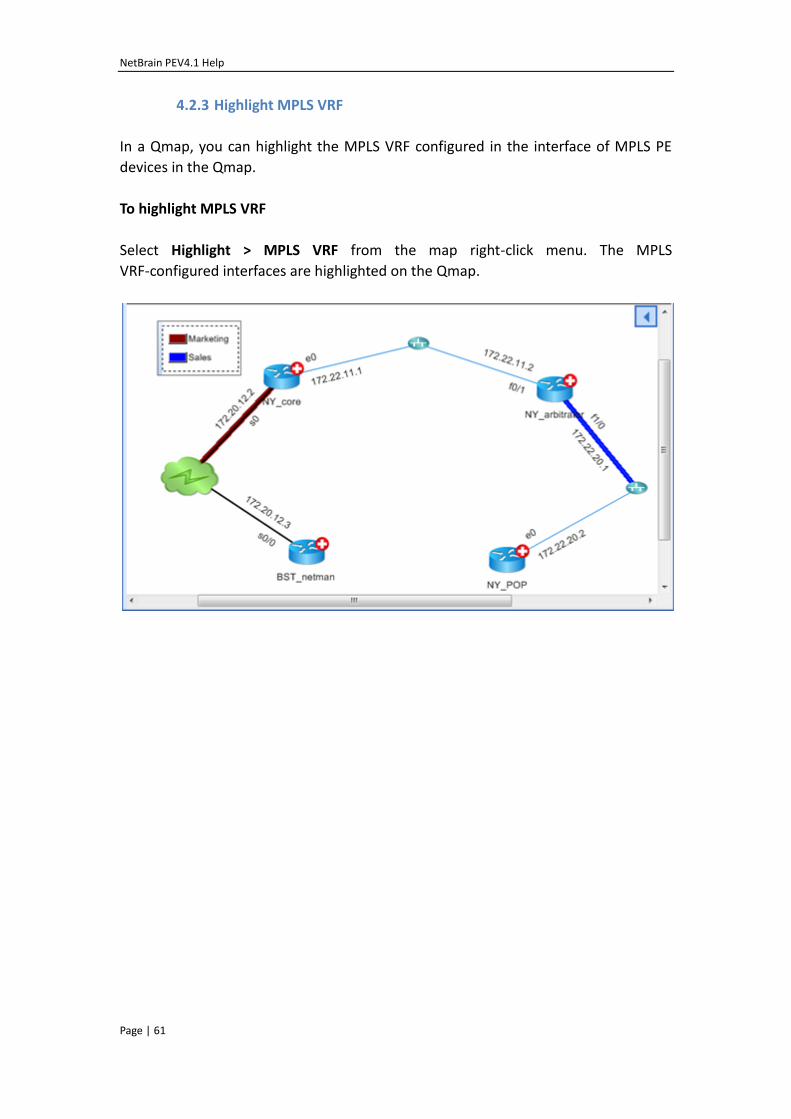
4.2.3 Highlight MPLS VRF
In a Qmap, you can highlight the MPLS VRF configured in the interface of MPLS PE
devices in the Qmap.
To highlight MPLS VRF
Select Highlight > MPLS VRF from the map right-click menu. The MPLS
VRF-configured interfaces are highlighted on the Qmap.
NetBrain PEV4.1 Help
Page | 62
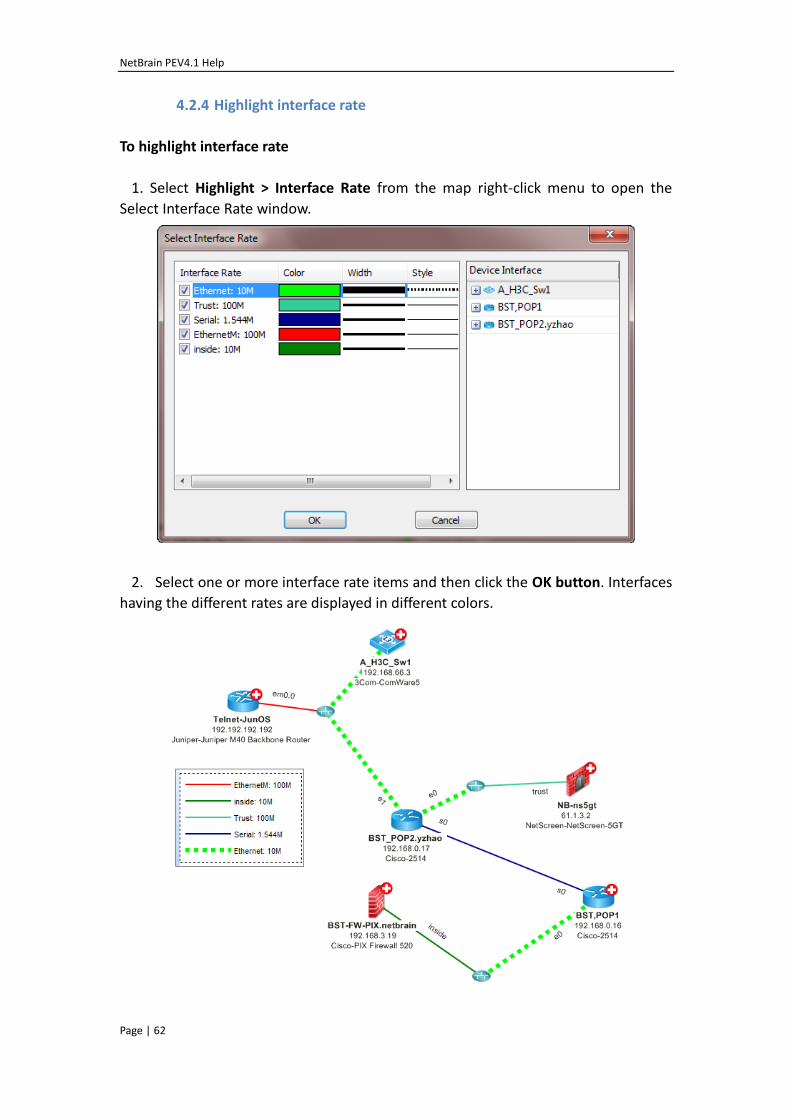
4.2.4 Highlight interface rate
To highlight interface rate
1. Select Highlight > Interface Rate from the map right-click menu to open the
Select Interface Rate window.
2. Select one or more interface rate items and then click the OK button. Interfaces
having the different rates are displayed in different colors.
NetBrain PEV4.1 Help
Page | 63
5 Network Access
5.1 Device Settings
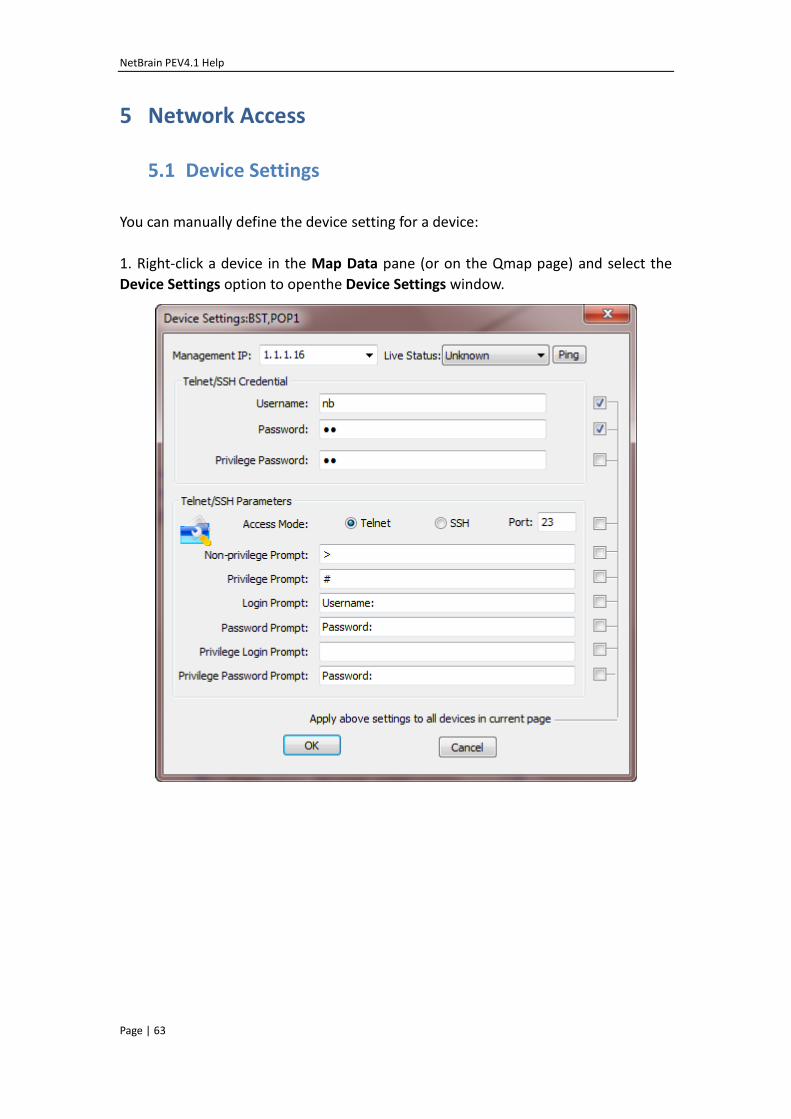
You can manually define the device setting for a device:
1. Right-click a device in the Map Data pane (or on the Qmap page) and select the
Device Settings option to openthe Device Settings window.
NetBrain PEV4.1 Help
Page | 64
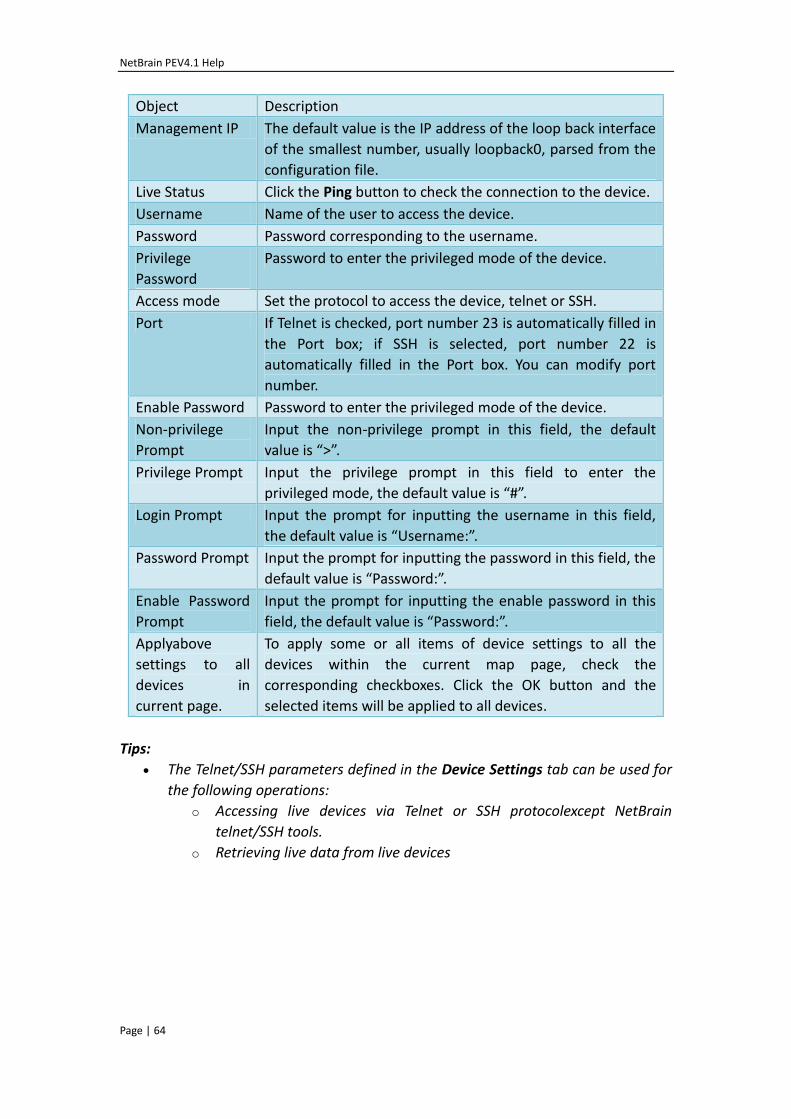
Object Description
Management IP The default value is the IP address of the loop back interface
of the smallest number, usually loopback0, parsed from the
configuration file.
Live Status Click the Ping button to check the connection to the device.
Username Name of the user to access the device.
Password Password corresponding to the username.
Privilege
Password
Password to enter the privileged mode of the device.
Access mode Set the protocol to access the device, telnet or SSH.
Port If Telnet is checked, port number 23 is automatically filled in
the Port box; if SSH is selected, port number 22 is
automatically filled in the Port box. You can modify port
number.
Enable Password Password to enter the privileged mode of the device.
Non-privilege
Prompt
Input the non-privilege prompt in this field, the default
value is “>”.
Privilege Prompt Input the privilege prompt in this field to enter the
privileged mode, the default value is “#”.
Login Prompt Input the prompt for inputting the username in this field,
the default value is “Username:”.
Password Prompt Input the prompt for inputting the password in this field, the
default value is “Password:”.
Enable Password
Prompt
Input the prompt for inputting the enable password in this
field, the default value is “Password:”.
Applyabove
settings to all
devices in
current page.
To apply some or all items of device settings to all the
devices within the current map page, check the
corresponding checkboxes. Click the OK button and the
selected items will be applied to all devices.
Tips:
The Telnet/SSH parameters defined in the Device Settings tab can be used for
the following operations:
o Accessing live devices via Telnet or SSH protocolexcept NetBrain
telnet/SSH tools.
o Retrieving live data from live devices
NetBrain PEV4.1 Help
Page | 65
5.2 Access a live network device
5.2.1 Ping
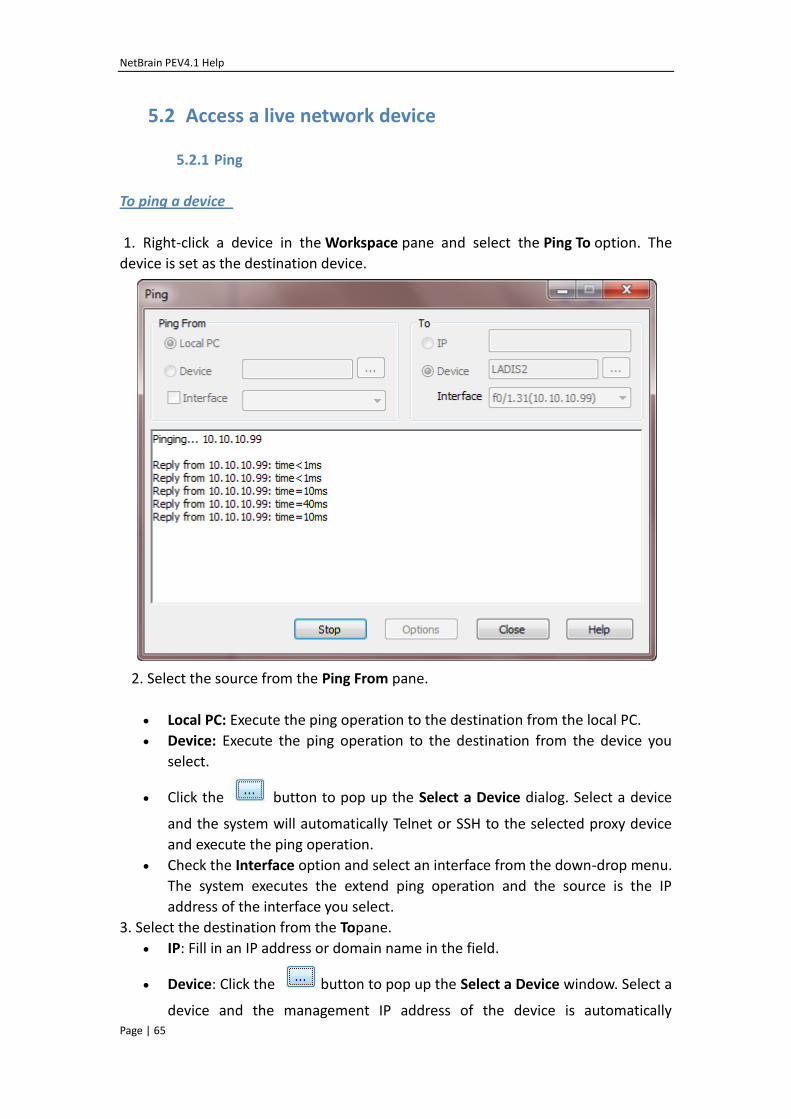
To ping a device
1. Right-click a device in the Workspace pane and select the Ping To option. The
device is set as the destination device.
2. Select the source from the Ping From pane.
Local PC: Execute the ping operation to the destination from the local PC.
Device: Execute the ping operation to the destination from the device you
select.
Click the button to pop up the Select a Device dialog. Select a device
and the system will automatically Telnet or SSH to the selected proxy device
and execute the ping operation.
Check the Interface option and select an interface from the down-drop menu.
The system executes the extend ping operation and the source is the IP
address of the interface you select.
3. Select the destination from the Topane.
IP: Fill in an IP address or domain name in the field.
Device: Click the button to pop up the Select a Device window. Select a
device and the management IP address of the device is automatically
NetBrain PEV4.1 Help
Page | 66
selected as the destination. You can also select the other IP address from the
Interface drop-down menu.
5.2.2 Traceroute
With the NetBrain traceroute tool you can discover the path that packets actually
travel from a source to a destination, then use the traceroute result to create a Qmap
page.
5.2.2.1 Use Traceroute to discover a path
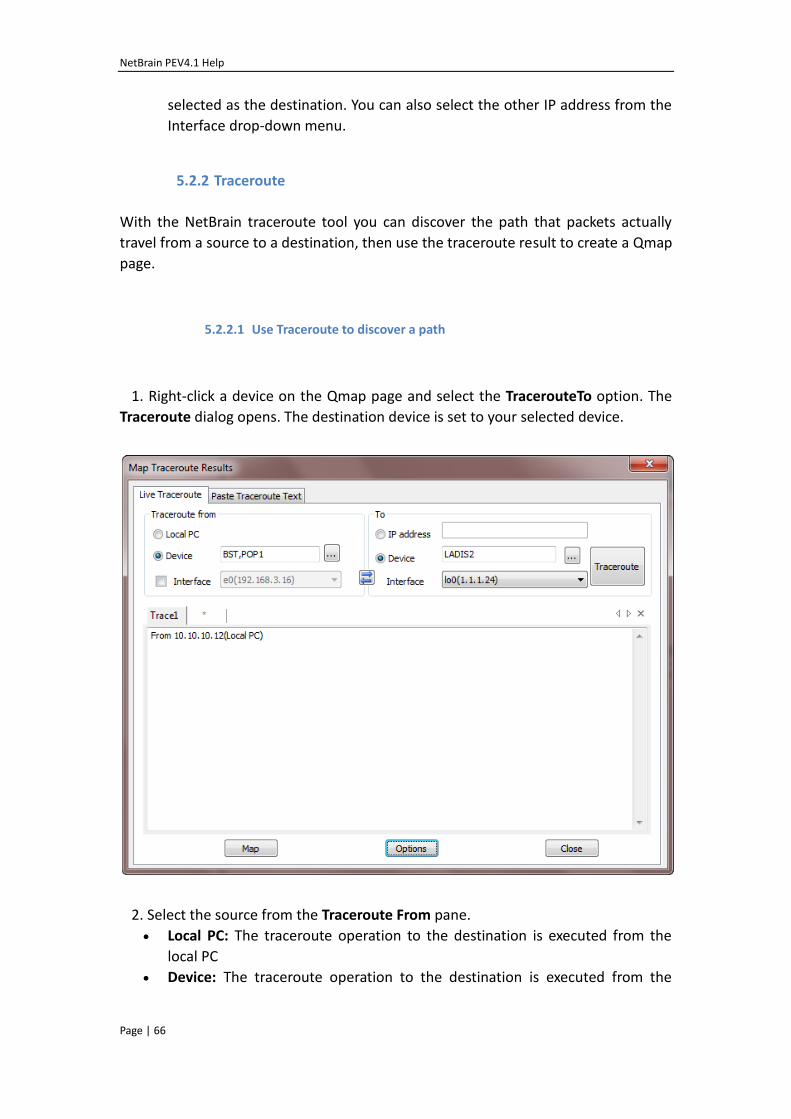
1. Right-click a device on the Qmap page and select the TracerouteTo option. The
Traceroute dialog opens. The destination device is set to your selected device.
2. Select the source from the Traceroute From pane.
Local PC: The traceroute operation to the destination is executed from the
local PC
Device: The traceroute operation to the destination is executed from the
NetBrain PEV4.1 Help
Page | 67
selected device. To select a device as the source, click the button to
pop up the Select a Devicedialog. Select a device and the system will
automatically Telnet or SSH to the selected device and execute the traceroute
operation to the destination.
Check the Interface option and select an interface from the down-drop menu,
the system executes the extend traceroute operation and the source is the IP
address of this interface.
3. Select the destination from the Topane.
IP address: Fill in an IP address or domain name in the field as the
destination.
Device: Click the button to pop up the Select a Device window. Select a
device and the management IP address of the device is automatically
selected as the destination. You can also select another other IP address from
the Interface drop-down menu as the destination.
4. Click the Traceroute button. The traceroute command is executed and the results
are displayed.
5. Click the Map button to map the trace route results. The map trace results are
diagrammed as a path.
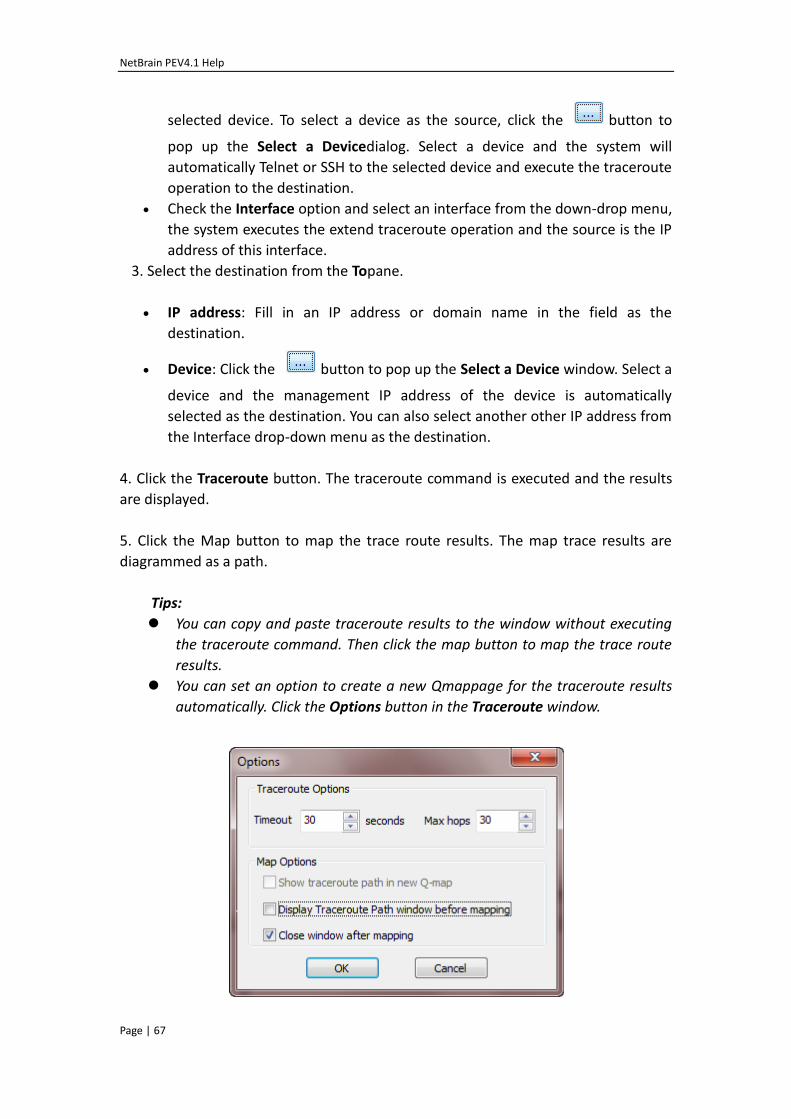
Tips:
You can copy and paste traceroute results to the window without executing
the traceroute command. Then click the map button to map the trace route
results.
You can set an option to create a new Qmappage for the traceroute results
automatically. Click the Options button in the Traceroute window.
NetBrain PEV4.1 Help
Page | 68
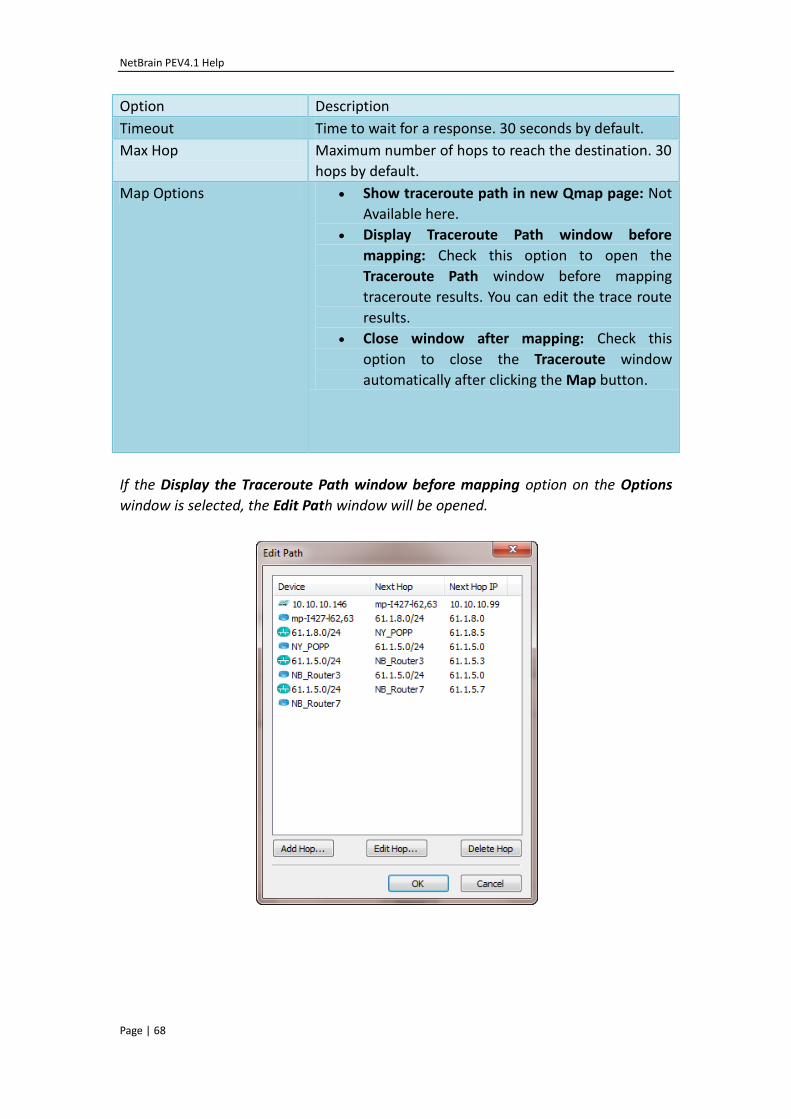
Option Description
Timeout Time to wait for a response. 30 seconds by default.
Max Hop Maximum number of hops to reach the destination. 30
hops by default.
Map Options Show traceroute path in new Qmap page: Not
Available here.
Display Traceroute Path window before
mapping: Check this option to open the
Traceroute Path window before mapping
traceroute results. You can edit the trace route
results.
Close window after mapping: Check this
option to close the Traceroute window
automatically after clicking the Map button.
If the Display the Traceroute Path window before mapping option on the Options
window is selected, the Edit Path window will be opened.
NetBrain PEV4.1 Help
Page | 69
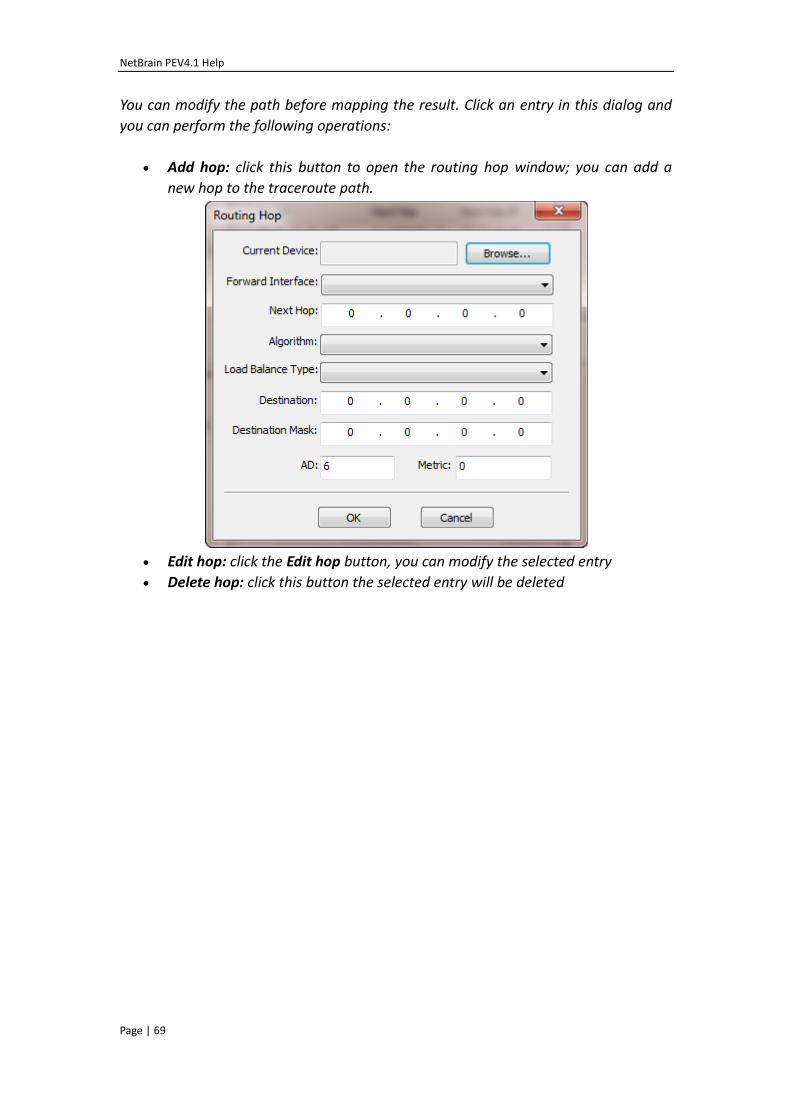
You can modify the path before mapping the result. Click an entry in this dialog and
you can perform the following operations:
Add hop: click this button to open the routing hop window; you can add a
new hop to the traceroute path.
Edit hop: click the Edit hop button, you can modify the selected entry
Delete hop: click this button the selected entry will be deleted
NetBrain PEV4.1 Help
Page | 70
5.2.2.2 Map Traceroute Results
You can copy and paste the trace route results into the PE Workstation to create a
map page.
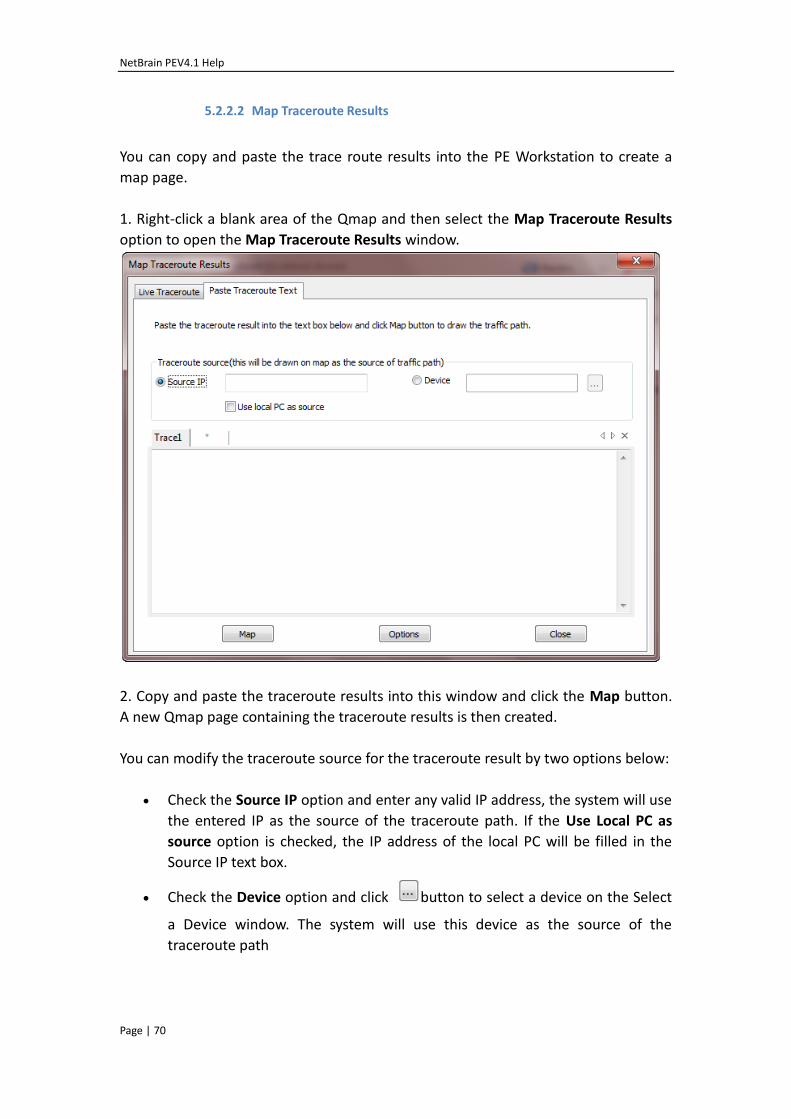
1. Right-click a blank area of the Qmap and then select the Map Traceroute Results
option to open the Map Traceroute Results window.
2. Copy and paste the traceroute results into this window and click the Map button.
A new Qmap page containing the traceroute results is then created.
You can modify the traceroute source for the traceroute result by two options below:
Check the Source IP option and enter any valid IP address, the system will use
the entered IP as the source of the traceroute path. If the Use Local PC as
source option is checked, the IP address of the local PC will be filled in the
Source IP text box.
Check the Device option and click button to select a device on the Select
a Device window. The system will use this device as the source of the
traceroute path
NetBrain PEV4.1 Help
Page | 71
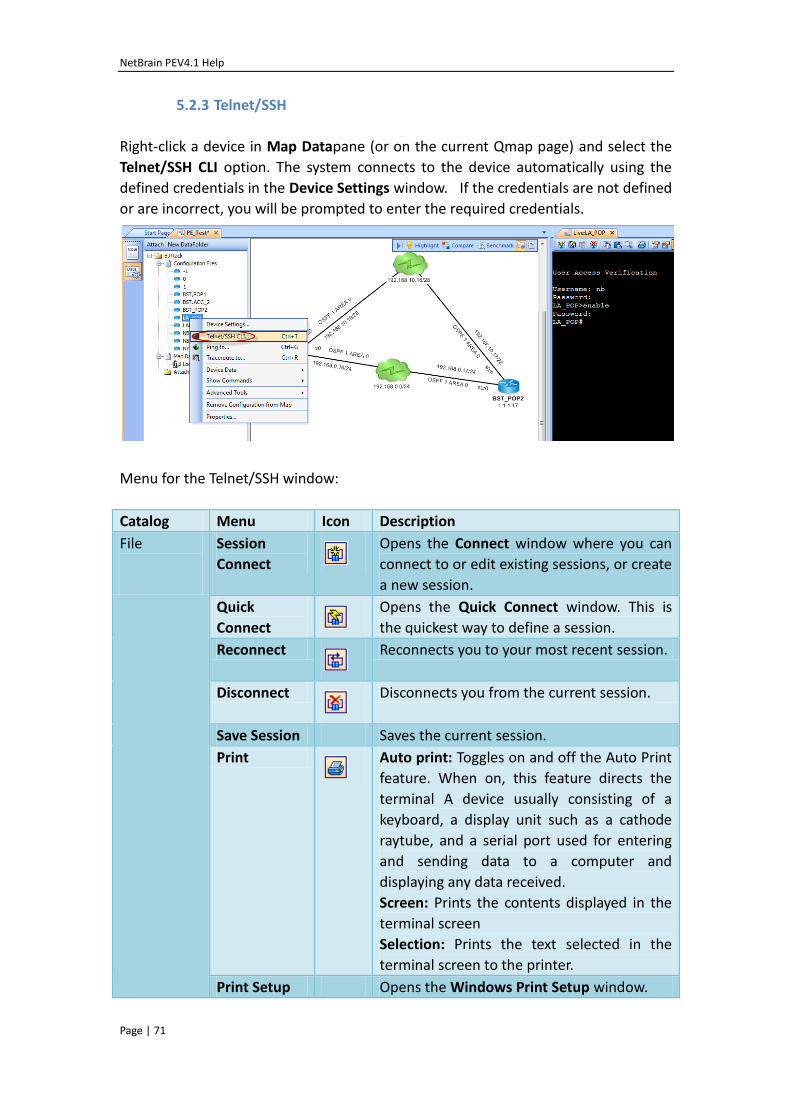
5.2.3 Telnet/SSH
Right-click a device in Map Datapane (or on the current Qmap page) and select the
Telnet/SSH CLI option. The system connects to the device automatically using the
defined credentials in the Device Settings window. If the credentials are not defined
or are incorrect, you will be prompted to enter the required credentials.
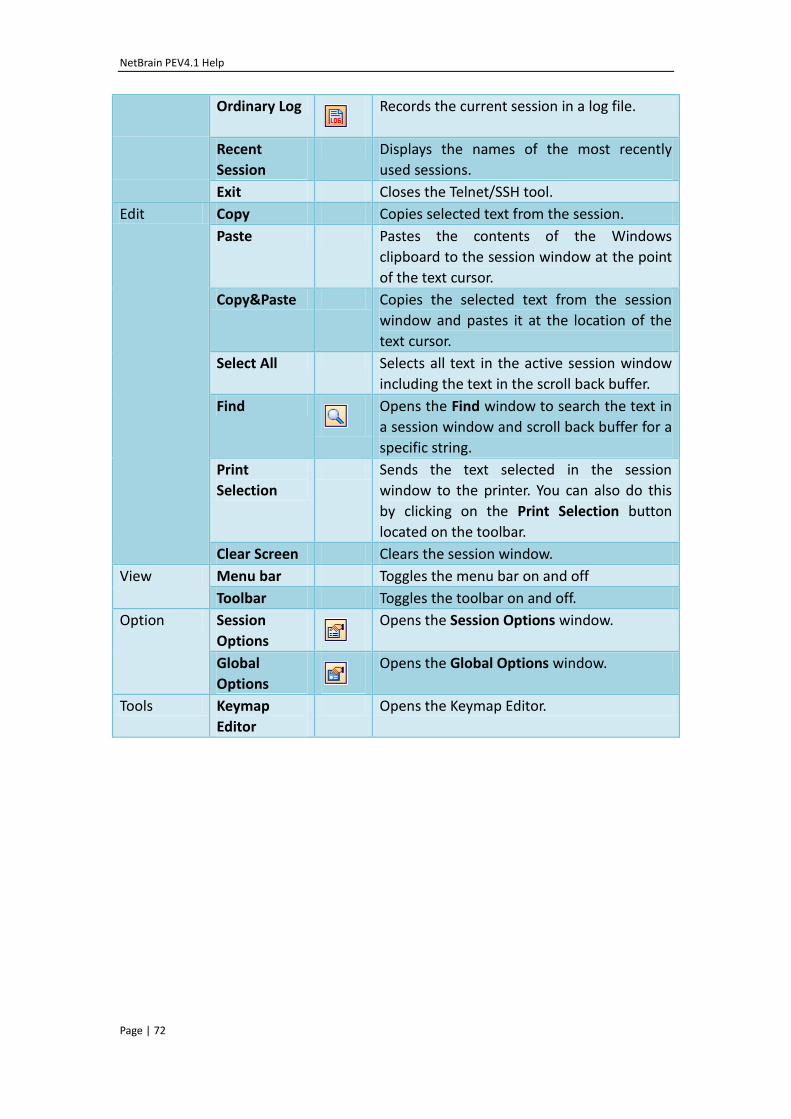
Menu for the Telnet/SSH window:
Catalog Menu Icon Description
File
Session
Connect
Opens the Connect window where you can
connect to or edit existing sessions, or create
a new session.
Quick
Connect
Opens the Quick Connect window. This is
the quickest way to define a session.
Reconnect
Reconnects you to your most recent session.
Disconnect
Disconnects you from the current session.
Save Session Saves the current session.
Auto print: Toggles on and off the Auto Print
feature. When on, this feature directs the
terminal A device usually consisting of a
keyboard, a display unit such as a cathode
raytube, and a serial port used for entering
and sending data to a computer and
displaying any data received.
Screen: Prints the contents displayed in the
terminal screen
Selection: Prints the text selected in the
terminal screen to the printer.
Print Setup Opens the Windows Print Setup window.
NetBrain PEV4.1 Help
Page | 72
Ordinary Log
Records the current session in a log file.
Recent
Session
Displays the names of the most recently
used sessions.
Exit Closes the Telnet/SSH tool.
Edit Copy Copies selected text from the session.
Paste Pastes the contents of the Windows
clipboard to the session window at the point
of the text cursor.
Copy&Paste Copies the selected text from the session
window and pastes it at the location of the
text cursor.
Select All Selects all text in the active session window
including the text in the scroll back buffer.
Find
Opens the Find window to search the text in
a session window and scroll back buffer for a
specific string.
Selection
Sends the text selected in the session
window to the printer. You can also do this
by clicking on the Print Selection button
located on the toolbar.
Clear Screen Clears the session window.
View Menu bar Toggles the menu bar on and off
Toolbar Toggles the toolbar on and off.
Option Session
Options
Opens the Session Options window.
Global
Options
Opens the Global Options window.
Tools Keymap
Editor
Opens the Keymap Editor.
NetBrain PEV4.1 Help
Page | 73
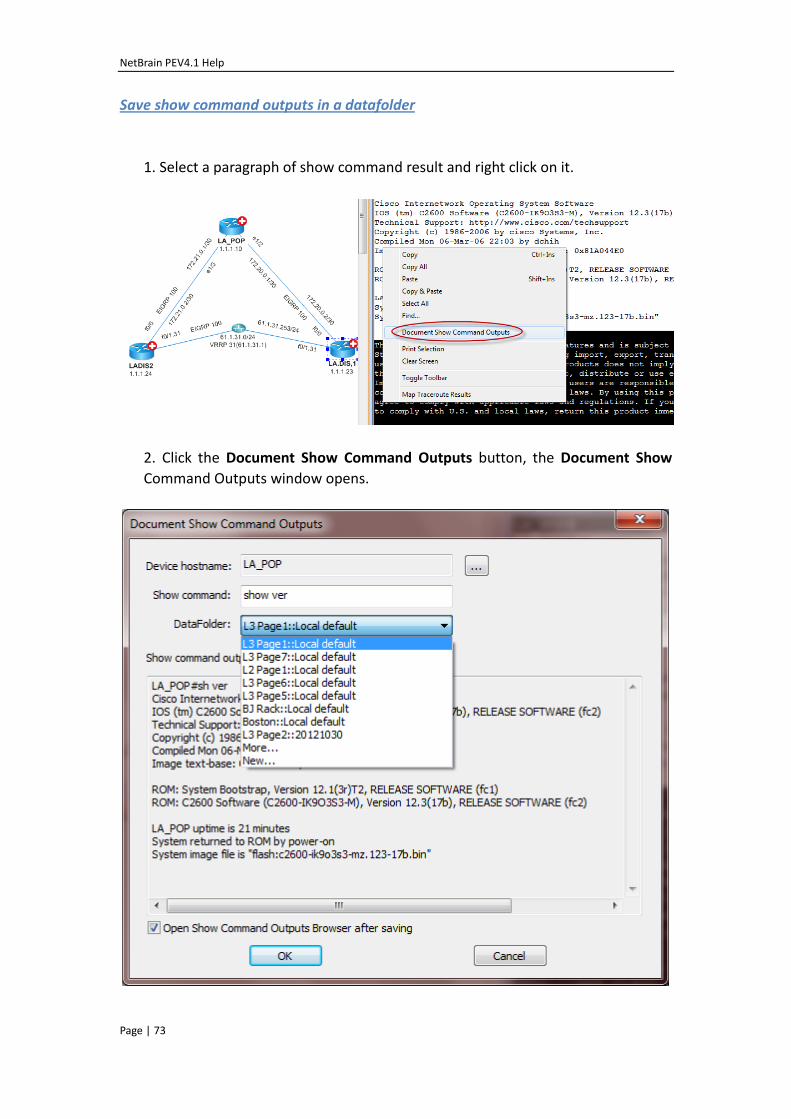
Save show command outputs in a datafolder
1. Select a paragraph of show command result and right click on it.
2. Click the Document Show Command Outputs button, the Document Show
Command Outputs window opens.
NetBrain PEV4.1 Help
Page | 74
3. Change the device hostname and modify the default Show Command field if
necessary, select an existing data folder or create a new one by clicking New...,
then click the OK button.
Note: The content of the show command outputs cannot be modified.
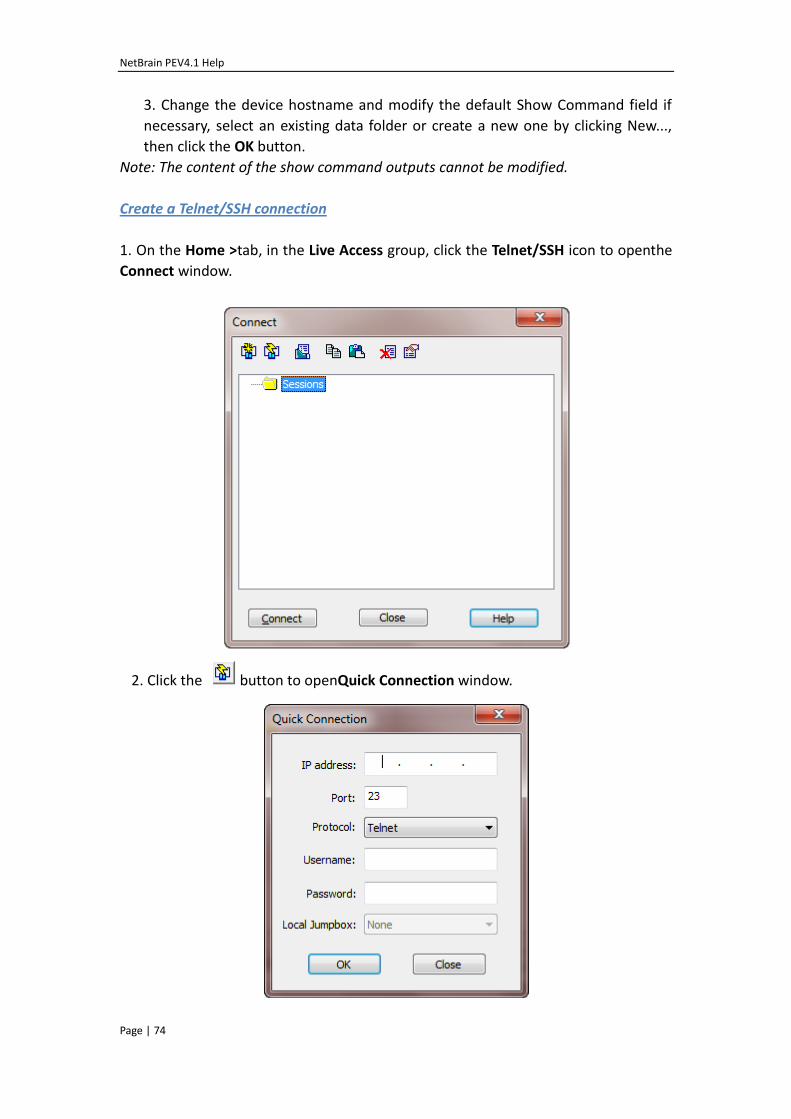
Create a Telnet/SSH connection
1. On the Home >tab, in the Live Access group, click the Telnet/SSH icon to openthe
Connect window.
2. Click the button to openQuick Connection window.
NetBrain PEV4.1 Help
Page | 75
3. Set the properties for the quick connection.
Object Description
IP address IP address of the remote host or device.
Port Port number of a service on a remote machine. For
Telnet, the default port is 23; for SSH, the default port
is 22.
Request Timeout Time to wait for a response, in milliseconds. The
default request timeout value is set at 2000
milliseconds.
Protocol Connection protocol. Currently Telnet and SSH are
supported.
Username Login username.
Password Login password.
Jumpbox Not available here.
4. Click the OK button to connect to the specified device.
Create a new session
In the Connect dialog, click the New Session button, the Session Properties>
Connection. In this dialog, you can define properties for this section, including
connection, terminal and appearance properties.
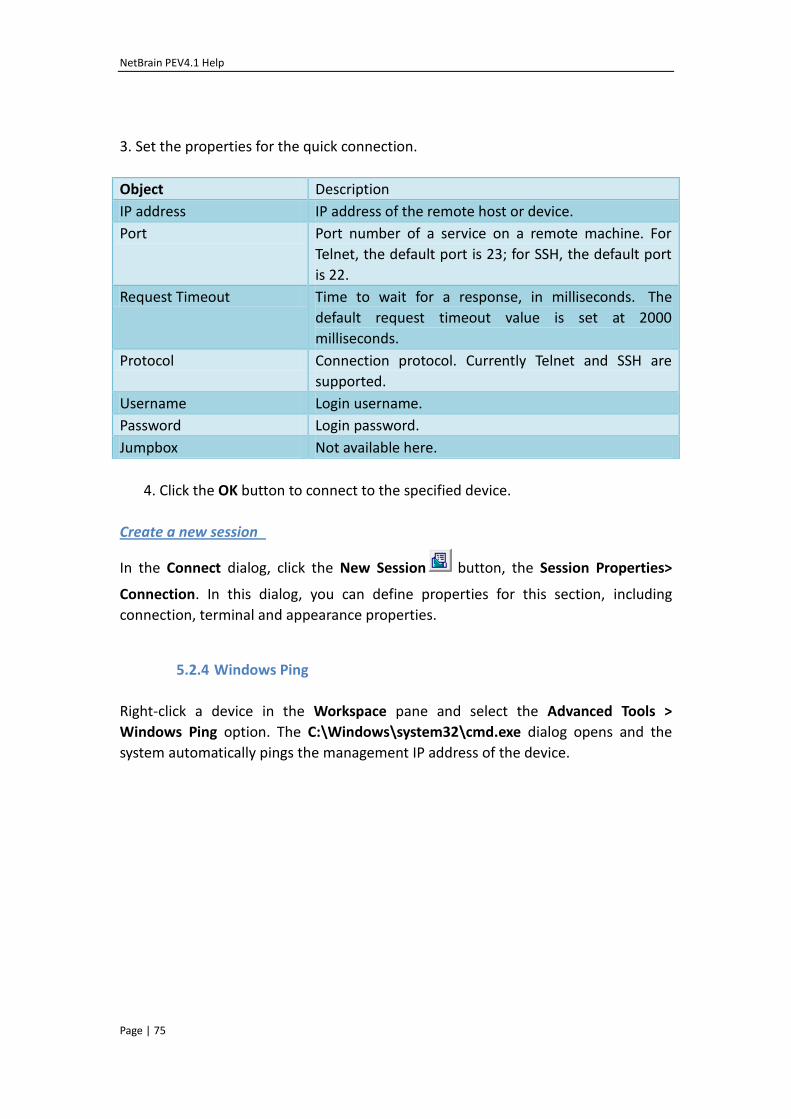
5.2.4 Windows Ping
Right-click a device in the Workspace pane and select the Advanced Tools >
Windows Ping option. The C:\Windows\system32\cmd.exe dialog opens and the
system automatically pings the management IP address of the device.
NetBrain PEV4.1 Help
Page | 76
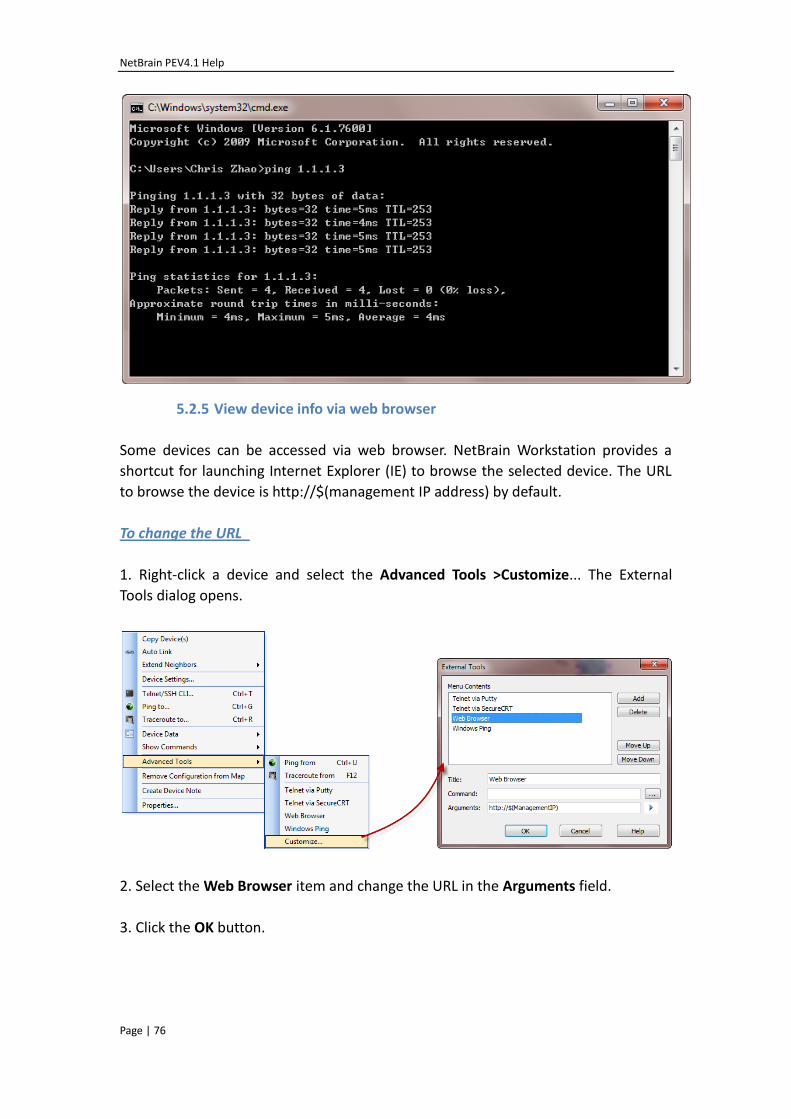
5.2.5 View device info via web browser
Some devices can be accessed via web browser. NetBrain Workstation provides a
shortcut for launching Internet Explorer (IE) to browse the selected device. The URL
to browse the device is http://$(management IP address) by default.
To change the URL
1. Right-click a device and select the Advanced Tools >Customize... The External
Tools dialog opens.
2. Select the Web Browser item and change the URL in the Arguments field.
3. Click the OK button.
NetBrain PEV4.1 Help
Page | 77
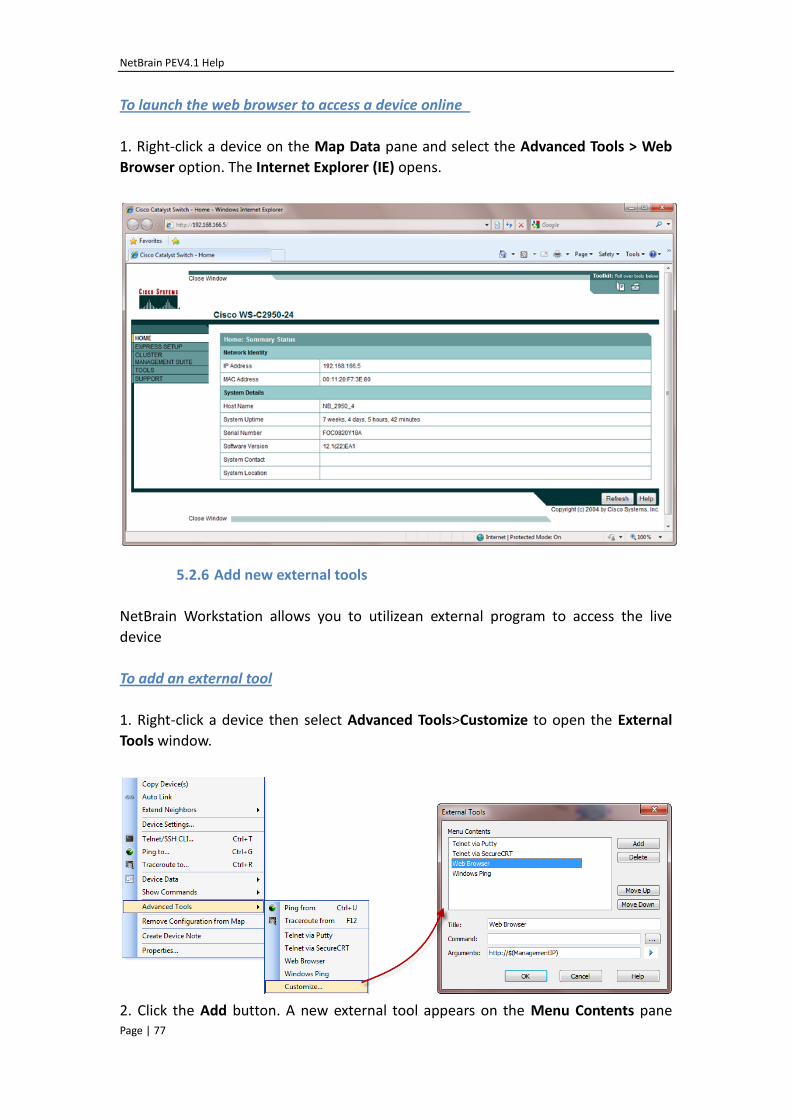
To launch the web browser to access a device online
1. Right-click a device on the Map Data pane and select the Advanced Tools > Web
Browser option. The Internet Explorer (IE) opens.
5.2.6 Add new external tools
NetBrain Workstation allows you to utilizean external program to access the live
device
To add an external tool
1. Right-click a device then select Advanced Tools>Customize to open the External
Tools window.
2. Click the Add button. A new external tool appears on the Menu Contents pane
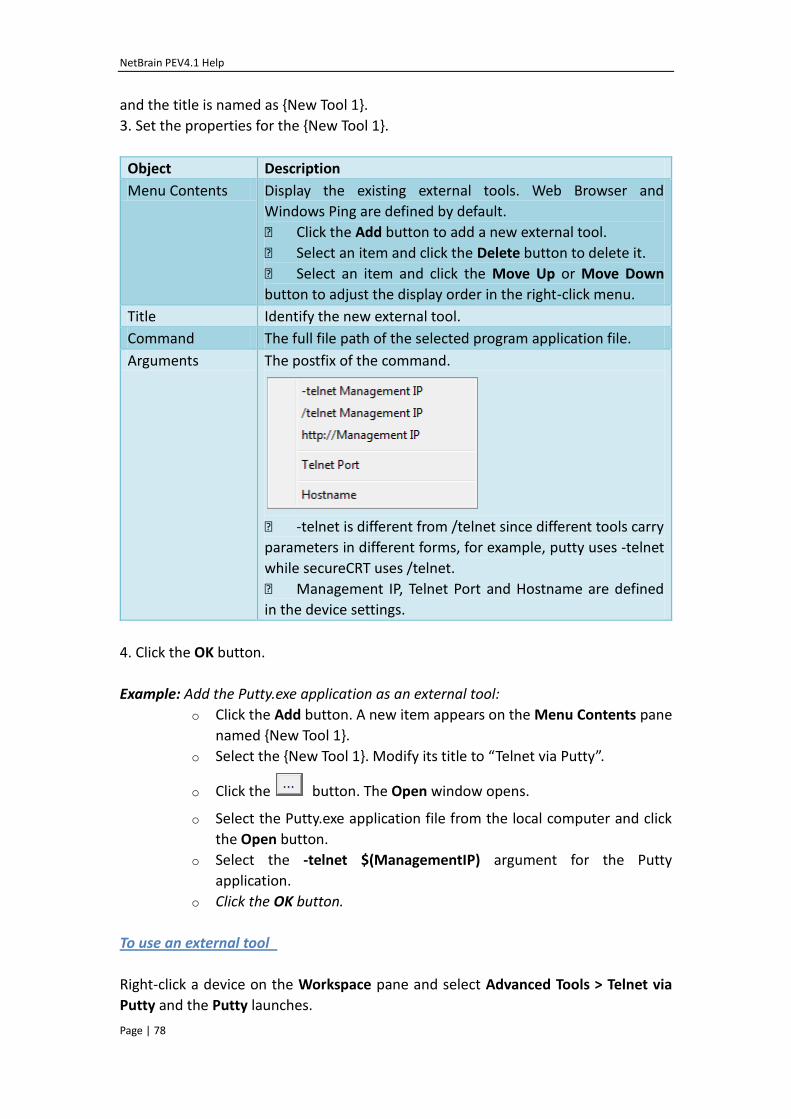
NetBrain PEV4.1 Help
Page | 78
and the title is named as {New Tool 1}.
3. Set the properties for the {New Tool 1}.
Object Description
Menu Contents Display the existing external tools. Web Browser and
Windows Ping are defined by default.
Click the Add button to add a new external tool.
Select an item and click the Delete button to delete it.
Select an item and click the Move Up or Move Down
button to adjust the display order in the right-click menu.
Title Identify the new external tool.
Command The full file path of the selected program application file.
Arguments The postfix of the command.
-telnet is different from /telnet since different tools carry
parameters in different forms, for example, putty uses -telnet
while secureCRT uses /telnet.
Management IP, Telnet Port and Hostname are defined
in the device settings.
4. Click the OK button.
Example: Add the Putty.exe application as an external tool:
o Click the Add button. A new item appears on the Menu Contents pane
named {New Tool 1}.
o Select the {New Tool 1}. Modify its title to “Telnet via Putty”.
o Click the button. The Open window opens.
o Select the Putty.exe application file from the local computer and click
the Open button.
o Select the -telnet $(ManagementIP) argument for the Putty
application.
o Click the OK button.
To use an external tool
Right-click a device on the Workspace pane and select Advanced Tools > Telnet via
Putty and the Putty launches.
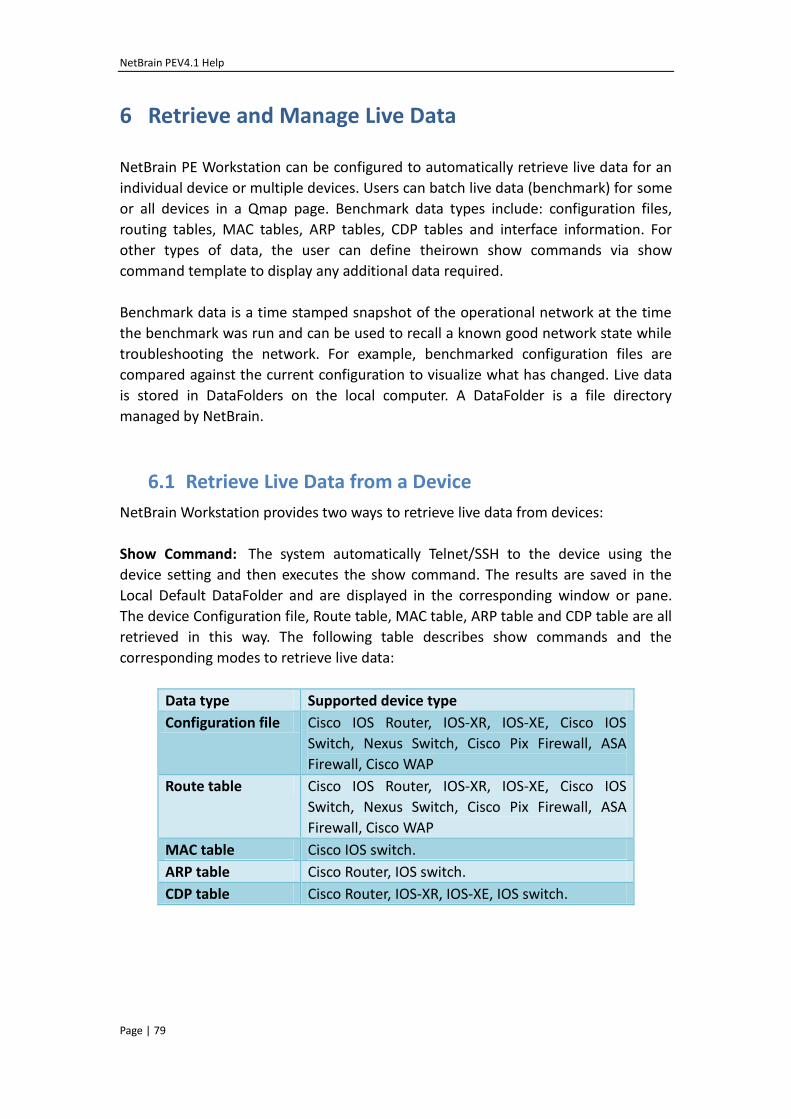
NetBrain PEV4.1 Help
Page | 79
6 Retrieve and Manage Live Data
NetBrain PE Workstation can be configured to automatically retrieve live data for an
individual device or multiple devices. Users can batch live data (benchmark) for some
or all devices in a Qmap page. Benchmark data types include: configuration files,
routing tables, MAC tables, ARP tables, CDP tables and interface information. For
other types of data, the user can define theirown show commands via show
command template to display any additional data required.
Benchmark data is a time stamped snapshot of the operational network at the time
the benchmark was run and can be used to recall a known good network state while
troubleshooting the network. For example, benchmarked configuration files are
compared against the current configuration to visualize what has changed. Live data
is stored in DataFolders on the local computer. A DataFolder is a file directory
managed by NetBrain.
6.1 Retrieve Live Data from a Device
NetBrain Workstation provides two ways to retrieve live data from devices:
Show Command: The system automatically Telnet/SSH to the device using the
device setting and then executes the show command. The results are saved in the
Local Default DataFolder and are displayed in the corresponding window or pane.
The device Configuration file, Route table, MAC table, ARP table and CDP table are all
retrieved in this way. The following table describes show commands and the
corresponding modes to retrieve live data:
Data type Supported device type
Configuration file Cisco IOS Router, IOS-XR, IOS-XE, Cisco IOS
Switch, Nexus Switch, Cisco Pix Firewall, ASA
Firewall, Cisco WAP
Route table Cisco IOS Router, IOS-XR, IOS-XE, Cisco IOS
Switch, Nexus Switch, Cisco Pix Firewall, ASA
Firewall, Cisco WAP
MAC table Cisco IOS switch.
ARP table Cisco Router, IOS switch.
CDP table Cisco Router, IOS-XR, IOS-XE, IOS switch.
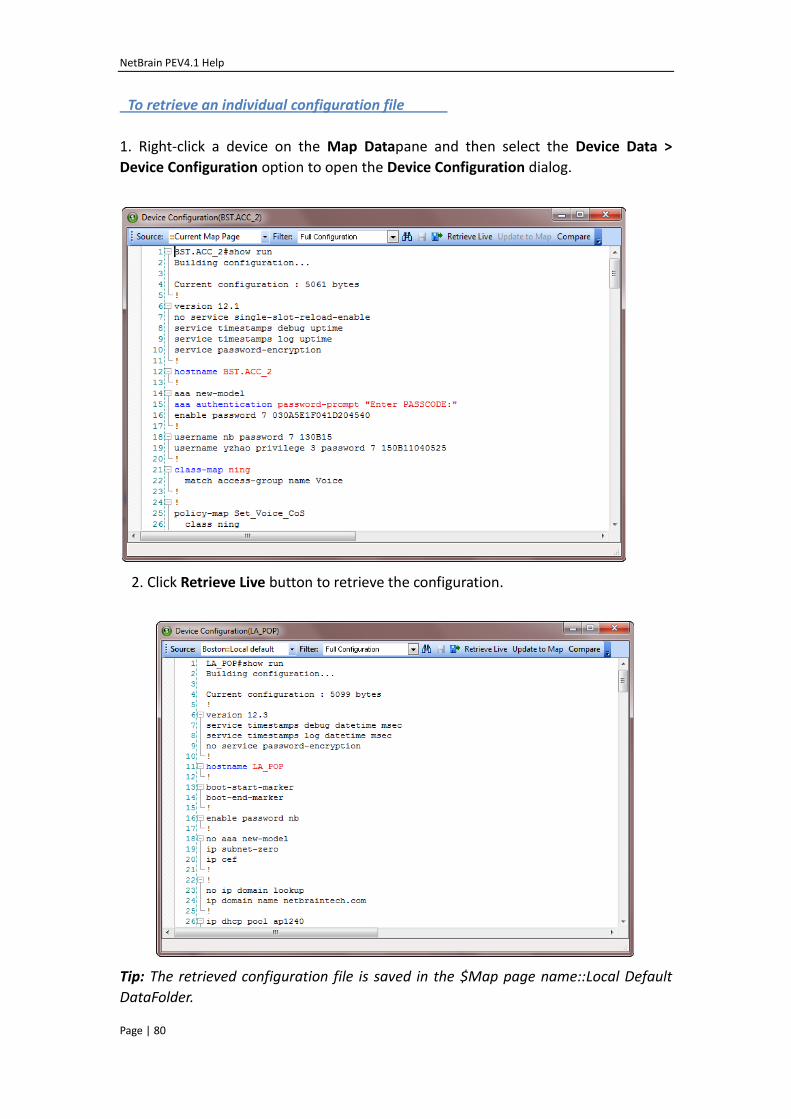
NetBrain PEV4.1 Help
Page | 80
To retrieve an individual configuration file
1. Right-click a device on the Map Datapane and then select the Device Data >
Device Configuration option to open the Device Configuration dialog.
2. Click Retrieve Live button to retrieve the configuration.
Tip: The retrieved configuration file is saved in the $Map page name::Local Default
DataFolder.
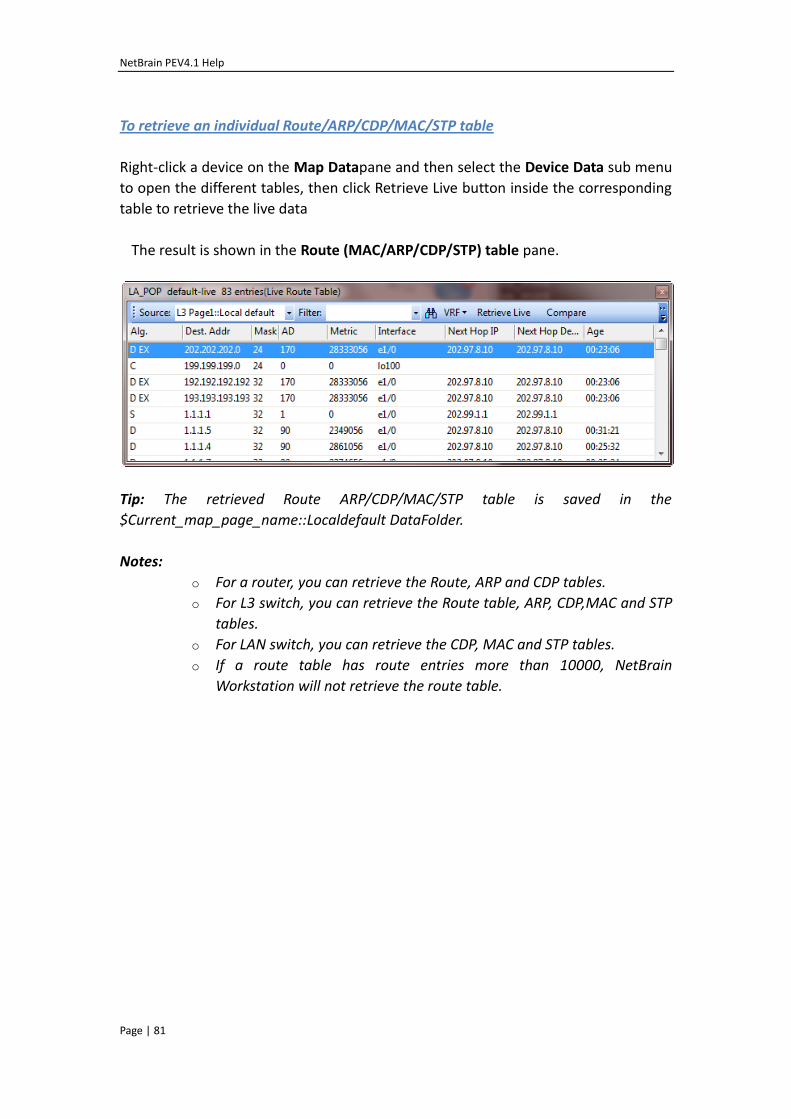
NetBrain PEV4.1 Help
Page | 81
To retrieve an individual Route/ARP/CDP/MAC/STP table
Right-click a device on the Map Datapane and then select the Device Data sub menu
to open the different tables, then click Retrieve Live button inside the corresponding
table to retrieve the live data
The result is shown in the Route (MAC/ARP/CDP/STP) table pane.
Tip: The retrieved Route ARP/CDP/MAC/STP table is saved in the
$Current_map_page_name::Localdefault DataFolder.
Notes:
o For a router, you can retrieve the Route, ARP and CDP tables.
o For L3 switch, you can retrieve the Route table, ARP, CDP,MAC and STP
tables.
o For LAN switch, you can retrieve the CDP, MAC and STP tables.
o If a route table has route entries more than 10000, NetBrain
Workstation will not retrieve the route table.
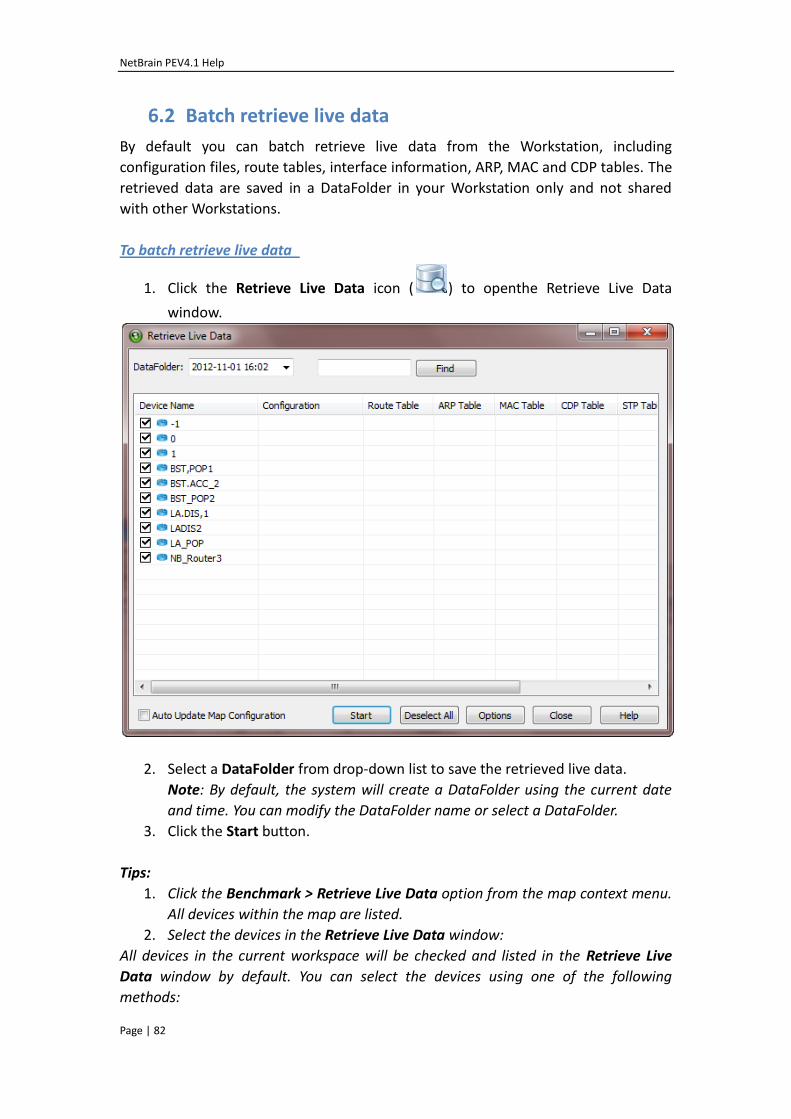
NetBrain PEV4.1 Help
Page | 82
6.2 Batch retrieve live data
By default you can batch retrieve live data from the Workstation, including
configuration files, route tables, interface information, ARP, MAC and CDP tables. The
retrieved data are saved in a DataFolder in your Workstation only and not shared
with other Workstations.
To batch retrieve live data
1. Click the Retrieve Live Data icon ( ) to openthe Retrieve Live Data
window.
2. Select a DataFolder from drop-down list to save the retrieved live data.
Note: By default, the system will create a DataFolder using the current date
and time. You can modify the DataFolder name or select a DataFolder.
3. Click the Start button.
Tips:
1. Click the Benchmark > Retrieve Live Data option from the map context menu.
All devices within the map are listed.
2. Select the devices in the Retrieve Live Data window:
All devices in the current workspace will be checked and listed in the Retrieve Live
Data window by default. You can select the devices using one of the following
methods:
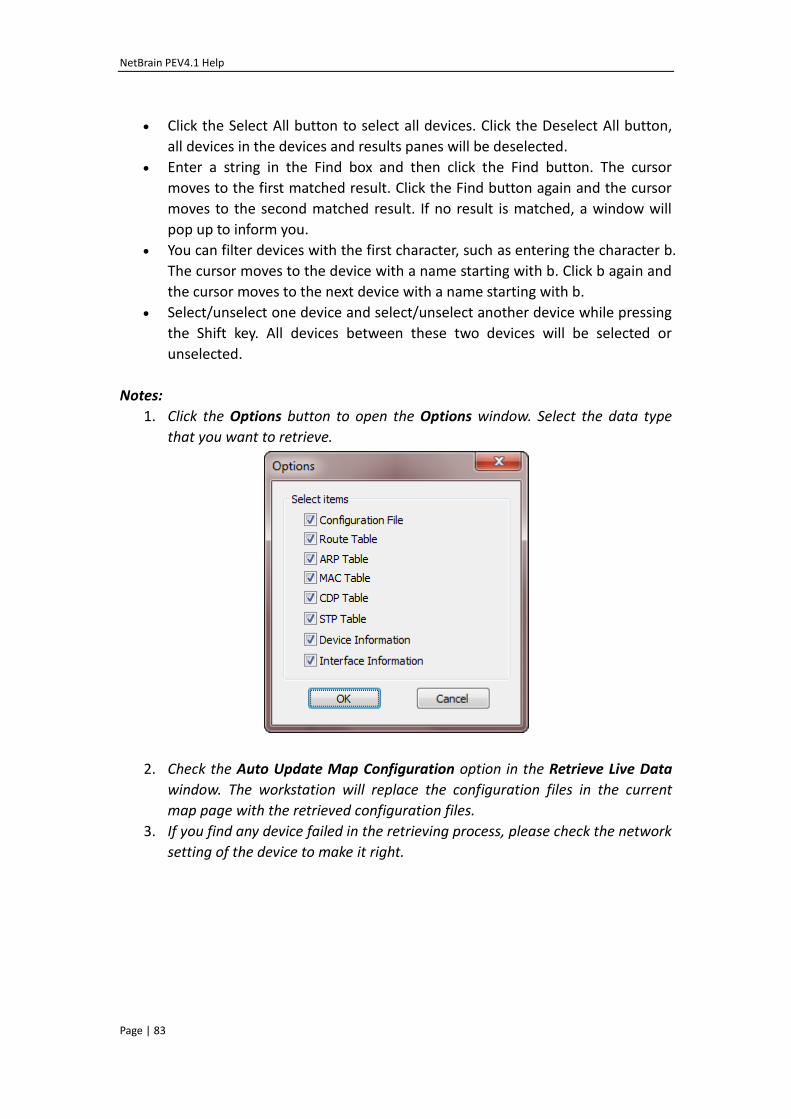
NetBrain PEV4.1 Help
Page | 83
Click the Select All button to select all devices. Click the Deselect All button,
all devices in the devices and results panes will be deselected.
Enter a string in the Find box and then click the Find button. The cursor
moves to the first matched result. Click the Find button again and the cursor
moves to the second matched result. If no result is matched, a window will
pop up to inform you.
You can filter devices with the first character, such as entering the character b.
The cursor moves to the device with a name starting with b. Click b again and
the cursor moves to the next device with a name starting with b.
Select/unselect one device and select/unselect another device while pressing
the Shift key. All devices between these two devices will be selected or
unselected.
Notes:
1. Click the Options button to open the Options window. Select the data type
that you want to retrieve.
2. Check the Auto Update Map Configuration option in the Retrieve Live Data
window. The workstation will replace the configuration files in the current
map page with the retrieved configuration files.
3. If you find any device failed in the retrieving process, please check the network
setting of the device to make it right.
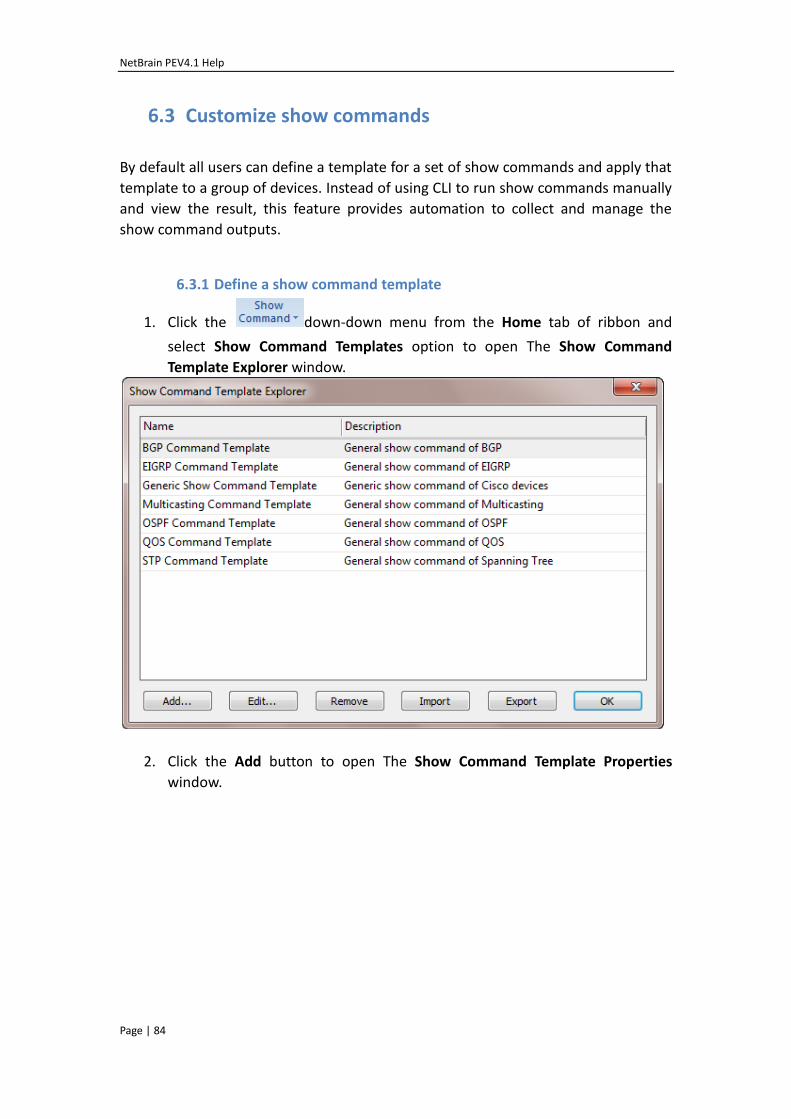
NetBrain PEV4.1 Help
Page | 84
6.3 Customize show commands
By default all users can define a template for a set of show commands and apply that
template to a group of devices. Instead of using CLI to run show commands manually
and view the result, this feature provides automation to collect and manage the
show command outputs.
6.3.1 Define a show command template
1. Click the down-down menu from the Home tab of ribbon and
select Show Command Templates option to open The Show Command
Template Explorer window.
2. Click the Add button to open The Show Command Template Properties
window.
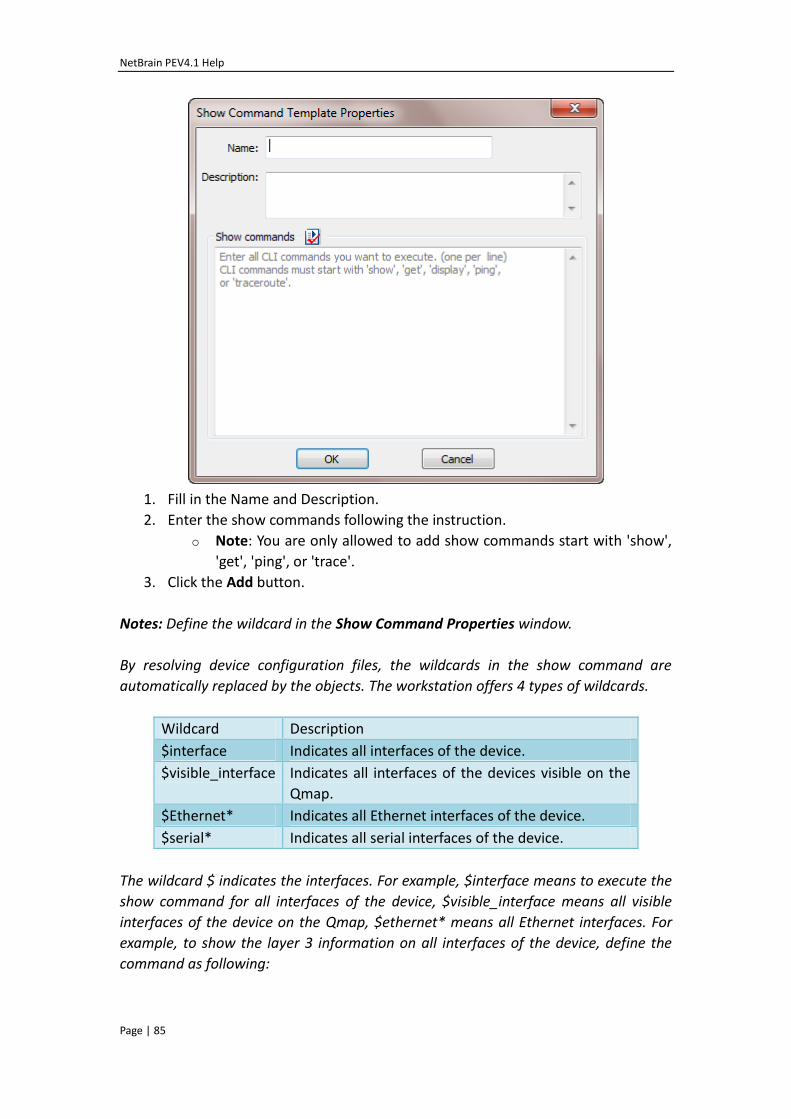
NetBrain PEV4.1 Help
Page | 85
1. Fill in the Name and Description.
2. Enter the show commands following the instruction.
o Note: You are only allowed to add show commands start with 'show',
'get', 'ping', or 'trace'.
3. Click the Add button.
Notes: Define the wildcard in the Show Command Properties window.
By resolving device configuration files, the wildcards in the show command are
automatically replaced by the objects. The workstation offers 4 types of wildcards.
Wildcard Description
$interface Indicates all interfaces of the device.
$visible_interface Indicates all interfaces of the devices visible on the
Qmap.
$Ethernet* Indicates all Ethernet interfaces of the device.
$serial* Indicates all serial interfaces of the device.
The wildcard $ indicates the interfaces. For example, $interface means to execute the
show command for all interfaces of the device, $visible_interface means all visible
interfaces of the device on the Qmap, $ethernet* means all Ethernet interfaces. For
example, to show the layer 3 information on all interfaces of the device, define the
command as following:
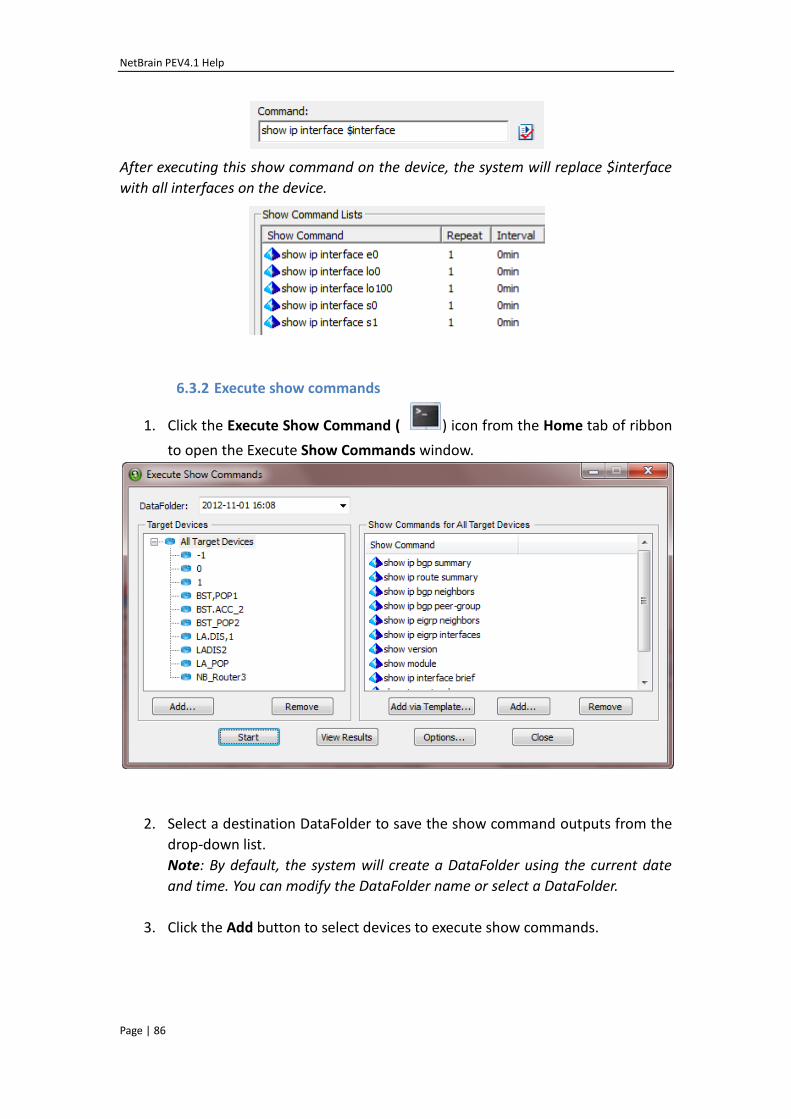
NetBrain PEV4.1 Help
Page | 86
After executing this show command on the device, the system will replace $interface
with all interfaces on the device.
6.3.2 Execute show commands
1. Click the Execute Show Command ( ) icon from the Home tab of ribbon
to open the Execute Show Commands window.
2. Select a destination DataFolder to save the show command outputs from the
drop-down list.
Note: By default, the system will create a DataFolder using the current date
and time. You can modify the DataFolder name or select a DataFolder.
3. Click the Add button to select devices to execute show commands.
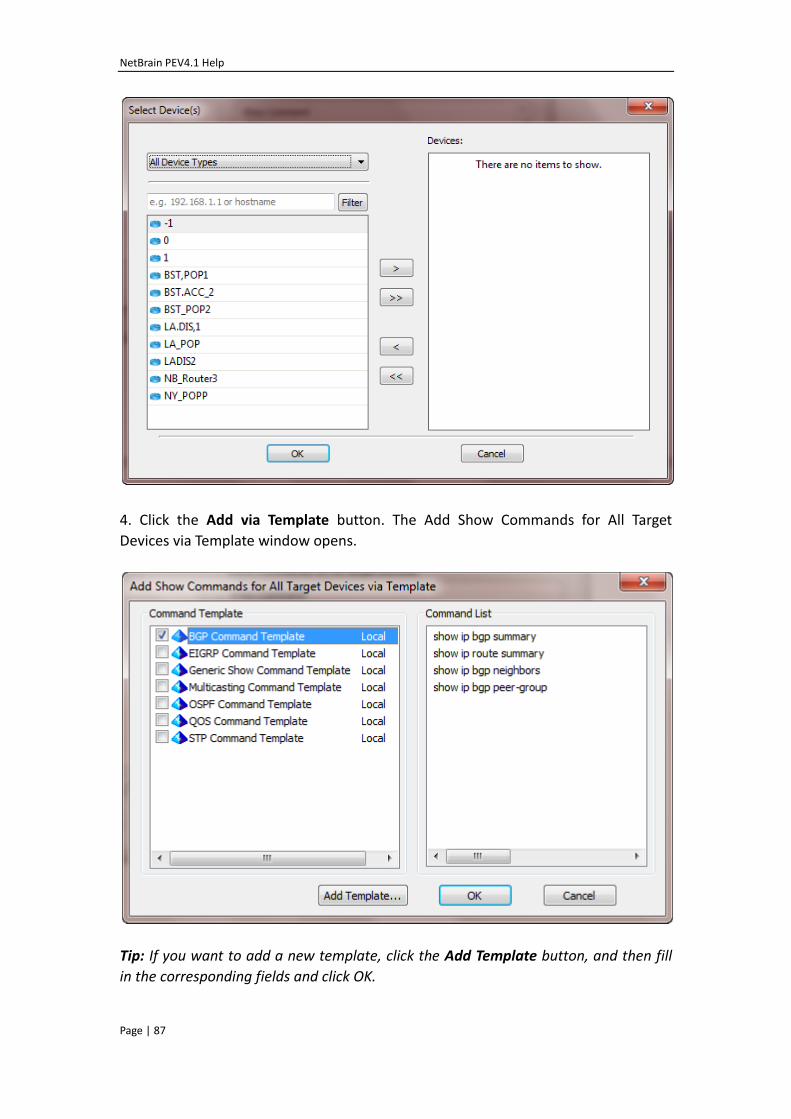
NetBrain PEV4.1 Help
Page | 87
4. Click the Add via Template button. The Add Show Commands for All Target
Devices via Template window opens.
Tip: If you want to add a new template, click the Add Template button, and then fill
in the corresponding fields and click OK.
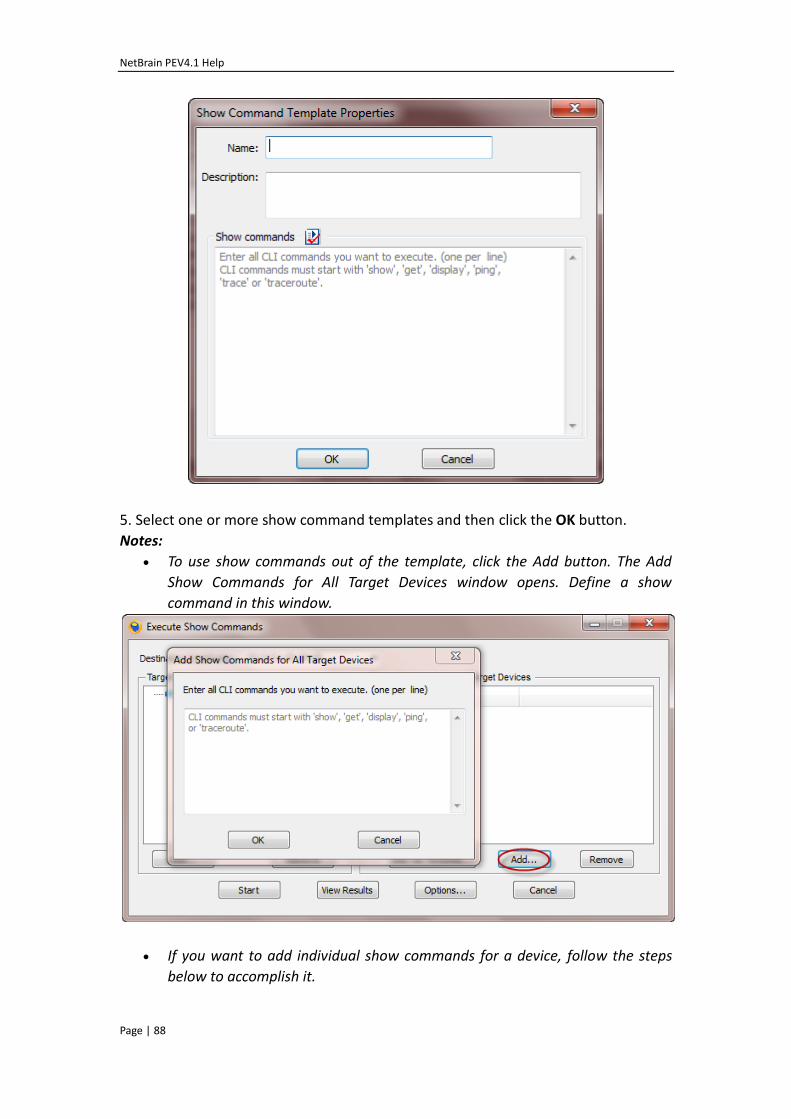
NetBrain PEV4.1 Help
Page | 88
5. Select one or more show command templates and then click the OK button.
Notes:
To use show commands out of the template, click the Add button. The Add
Show Commands for All Target Devices window opens. Define a show
command in this window.
If you want to add individual show commands for a device, follow the steps
below to accomplish it.
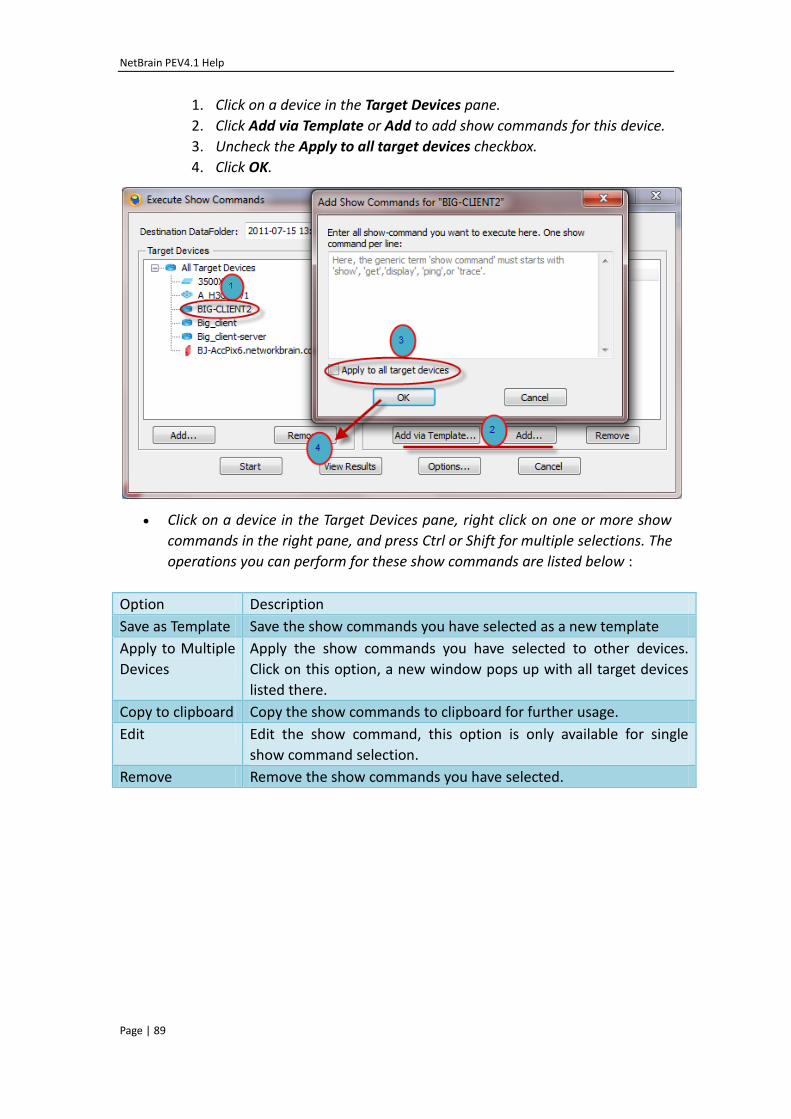
NetBrain PEV4.1 Help
Page | 89
1. Click on a device in the Target Devices pane.
2. Click Add via Template or Add to add show commands for this device.
3. Uncheck the Apply to all target devices checkbox.
4. Click OK.
Click on a device in the Target Devices pane, right click on one or more show
commands in the right pane, and press Ctrl or Shift for multiple selections. The
operations you can perform for these show commands are listed below :
Option Description
Save as Template Save the show commands you have selected as a new template
Apply to Multiple
Devices
Apply the show commands you have selected to other devices.
Click on this option, a new window pops up with all target devices
listed there.
Copy to clipboard Copy the show commands to clipboard for further usage.
Edit Edit the show command, this option is only available for single
show command selection.
Remove Remove the show commands you have selected.
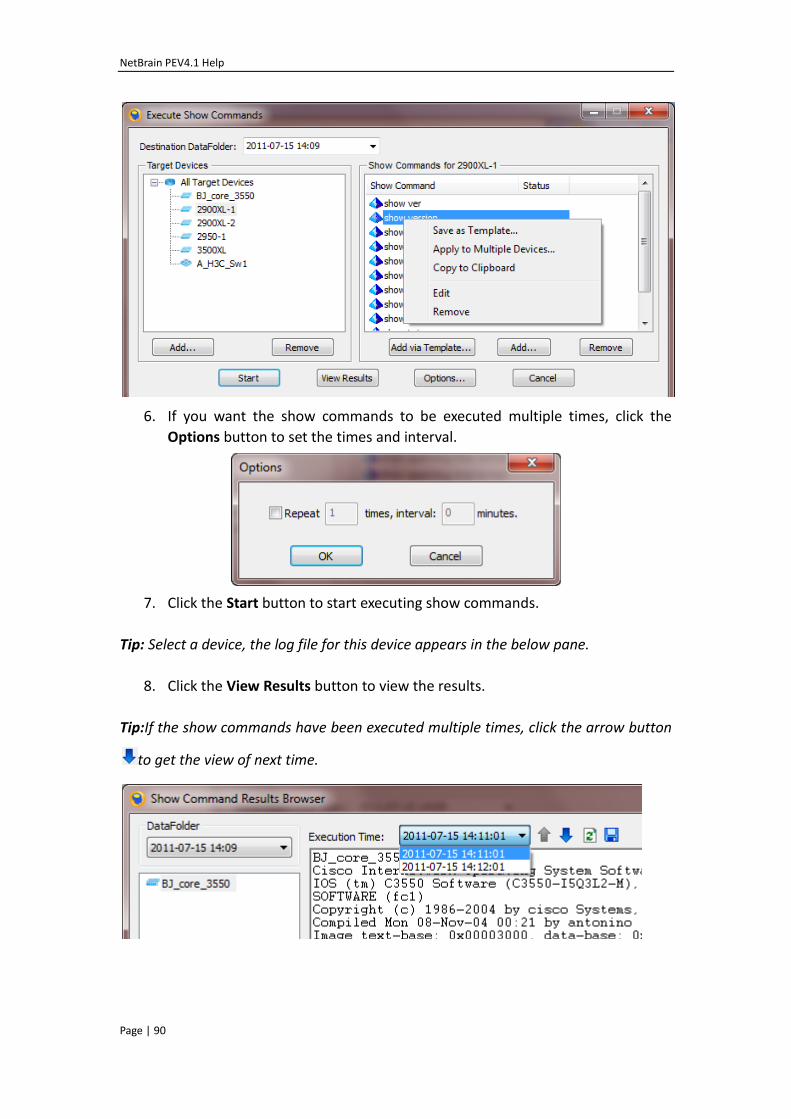
NetBrain PEV4.1 Help
Page | 90
6. If you want the show commands to be executed multiple times, click the
Options button to set the times and interval.
7. Click the Start button to start executing show commands.
Tip: Select a device, the log file for this device appears in the below pane.
8. Click the View Results button to view the results.
Tip:If the show commands have been executed multiple times, click the arrow button
to get the view of next time.
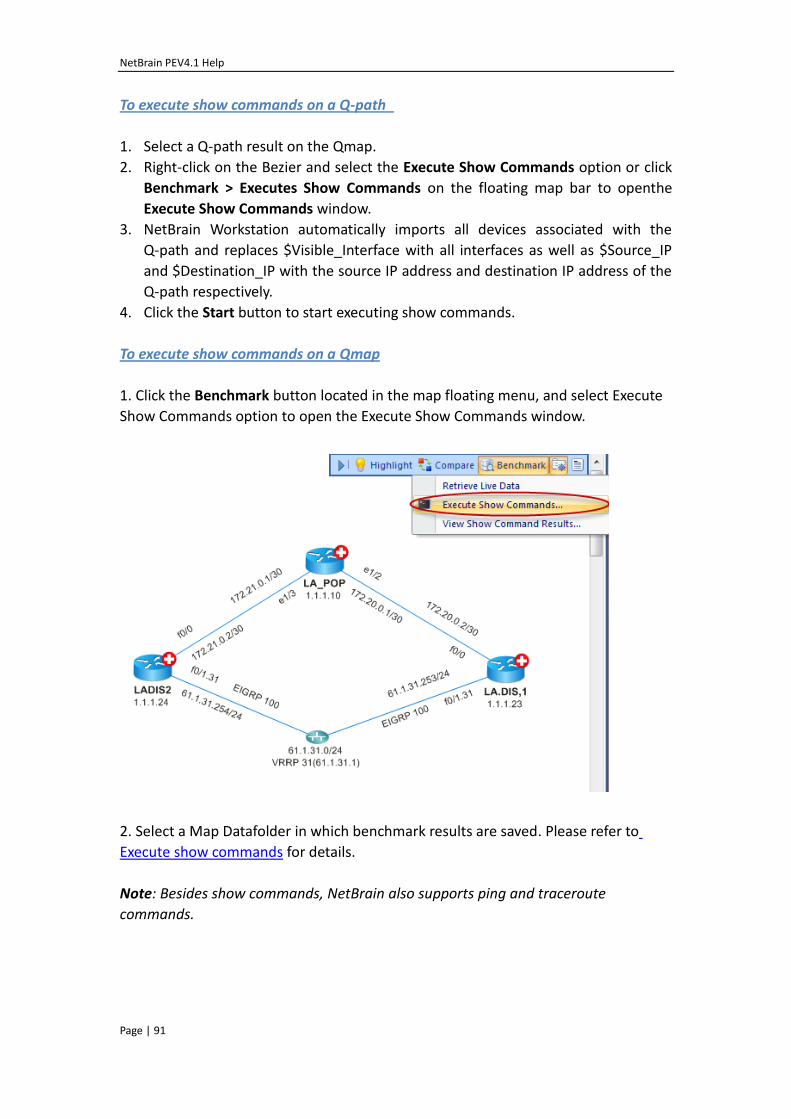
NetBrain PEV4.1 Help
Page | 91
To execute show commands on a Q-path
1. Select a Q-path result on the Qmap.
2. Right-click on the Bezier and select the Execute Show Commands option or click
Benchmark > Executes Show Commands on the floating map bar to openthe
Execute Show Commands window.
3. NetBrain Workstation automatically imports all devices associated with the
Q-path and replaces $Visible_Interface with all interfaces as well as $Source_IP
and $Destination_IP with the source IP address and destination IP address of the
Q-path respectively.
4. Click the Start button to start executing show commands.
To execute show commands on a Qmap
1. Click the Benchmark button located in the map floating menu, and select Execute
Show Commands option to open the Execute Show Commands window.
2. Select a Map Datafolder in which benchmark results are saved. Please refer to
Execute show commands for details.
Note: Besides show commands, NetBrain also supports ping and traceroute
commands.
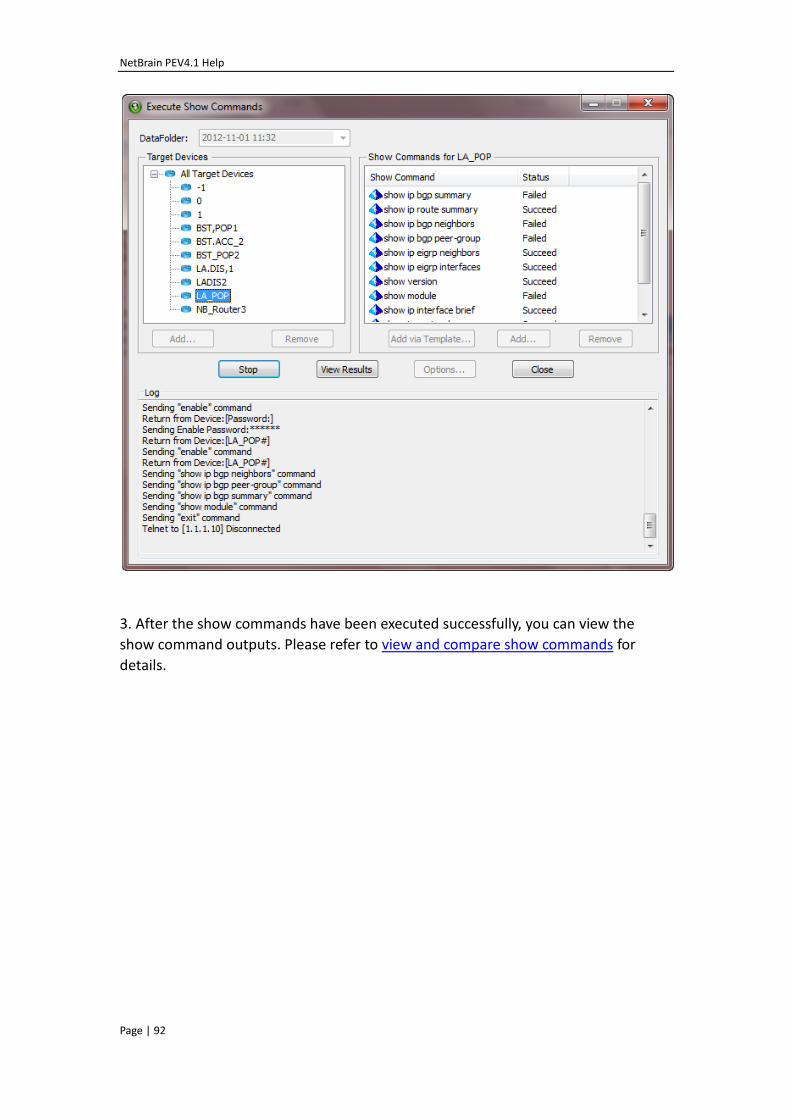
NetBrain PEV4.1 Help
Page | 92
3. After the show commands have been executed successfully, you can view the
show command outputs. Please refer to view and compare show commands for
details.
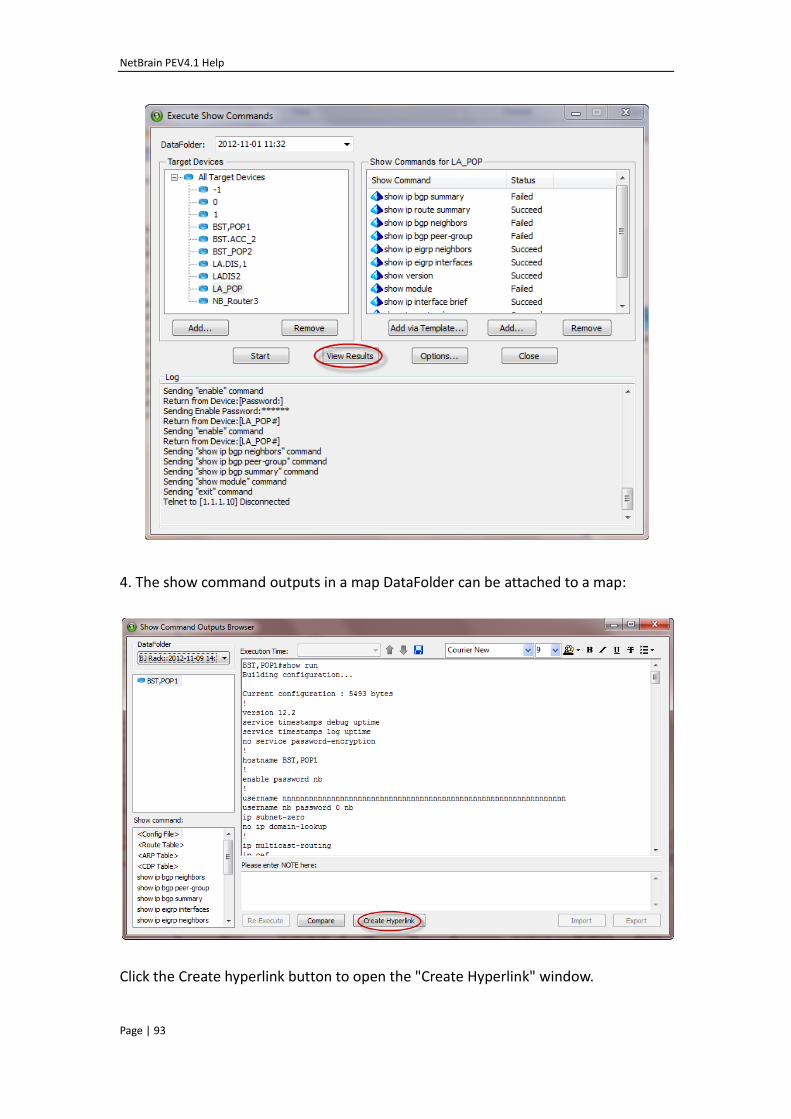
NetBrain PEV4.1 Help
Page | 93
4. The show command outputs in a map DataFolder can be attached to a map:
Click the Create hyperlink button to open the "Create Hyperlink" window.
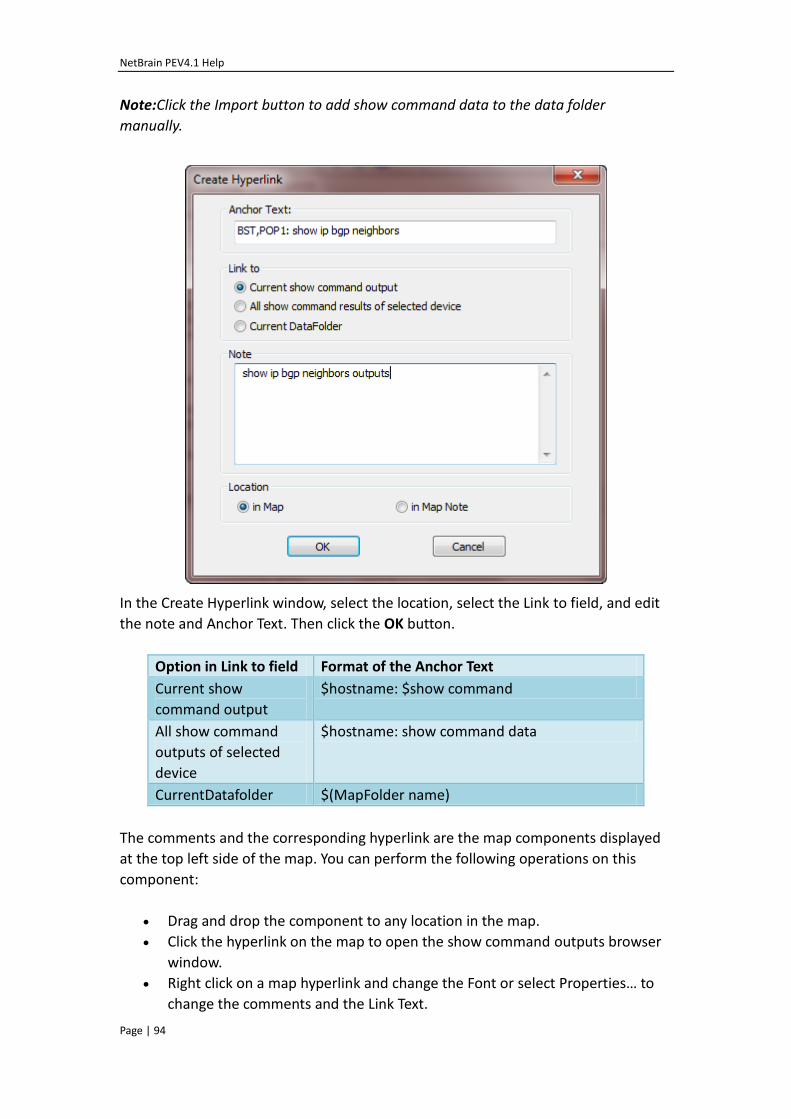
NetBrain PEV4.1 Help
Page | 94
Note:Click the Import button to add show command data to the data folder
manually.
In the Create Hyperlink window, select the location, select the Link to field, and edit
the note and Anchor Text. Then click the OK button.
Option in Link to field Format of the Anchor Text
Current show
command output
$hostname: $show command
All show command
outputs of selected
device
$hostname: show command data
CurrentDatafolder $(MapFolder name)
The comments and the corresponding hyperlink are the map components displayed
at the top left side of the map. You can perform the following operations on this
component:
Drag and drop the component to any location in the map.
Click the hyperlink on the map to open the show command outputs browser
window.
Right click on a map hyperlink and change the Font or select Properties… to
change the comments and the Link Text.
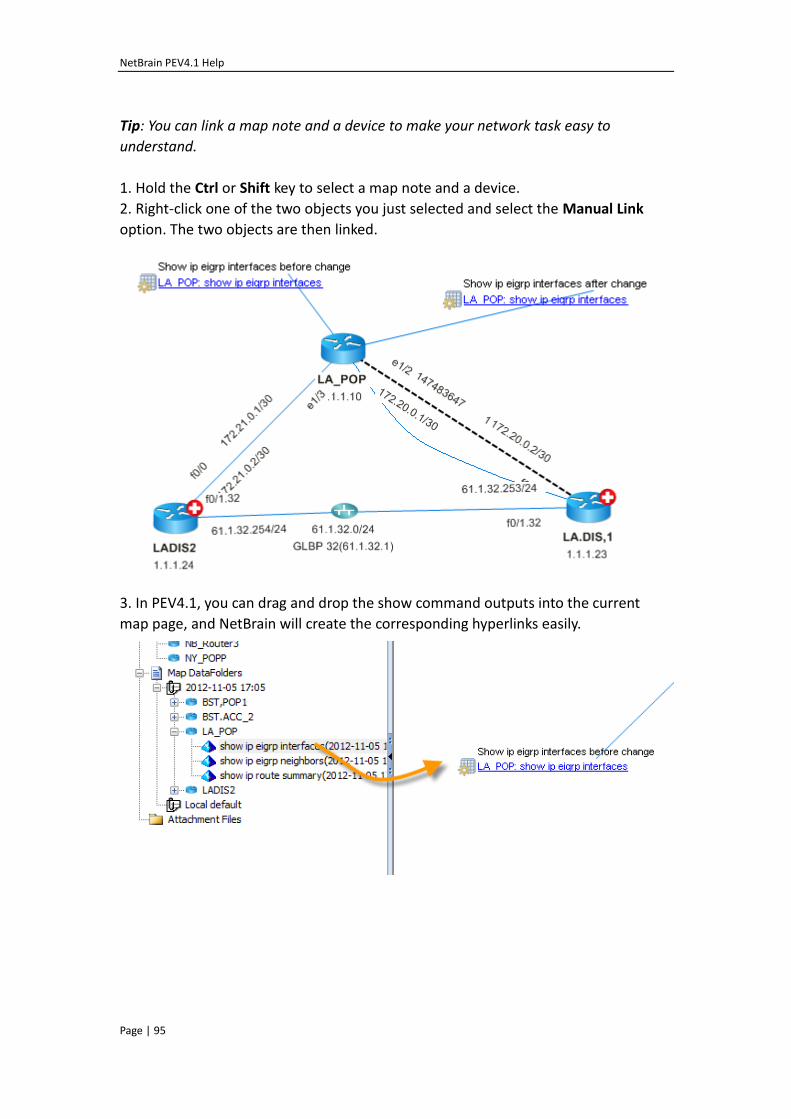
NetBrain PEV4.1 Help
Page | 95
Tip: You can link a map note and a device to make your network task easy to
understand.
1. Hold the Ctrl or Shift key to select a map note and a device.
2. Right-click one of the two objects you just selected and select the Manual Link
option. The two objects are then linked.
3. In PEV4.1, you can drag and drop the show command outputs into the current
map page, and NetBrain will create the corresponding hyperlinks easily.
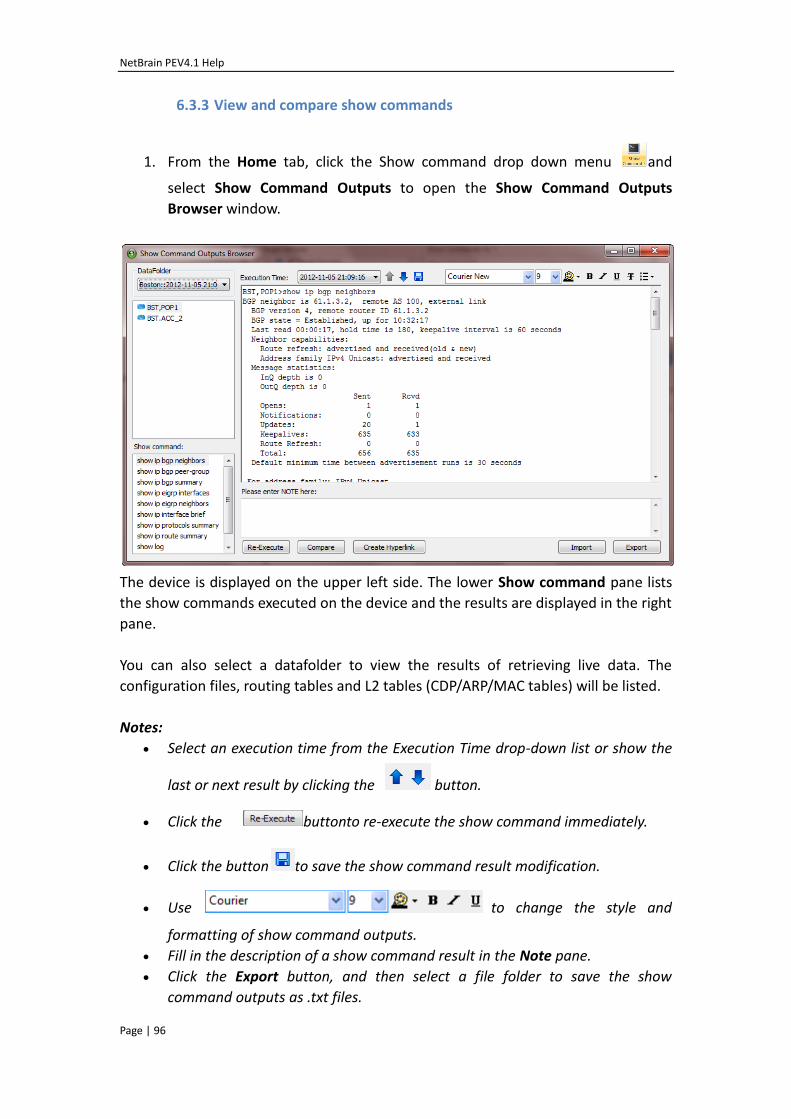
NetBrain PEV4.1 Help
Page | 96
6.3.3 View and compare show commands
1. From the Home tab, click the Show command drop down menu and
select Show Command Outputs to open the Show Command Outputs
Browser window.
The device is displayed on the upper left side. The lower Show command pane lists
the show commands executed on the device and the results are displayed in the right
pane.
You can also select a datafolder to view the results of retrieving live data. The
configuration files, routing tables and L2 tables (CDP/ARP/MAC tables) will be listed.
Notes:
Select an execution time from the Execution Time drop-down list or show the
last or next result by clicking the button.
Click the buttonto re-execute the show command immediately.
Click the button to save the show command result modification.
Use to change the style and
formatting of show command outputs.
Fill in the description of a show command result in the Note pane.
Click the Export button, and then select a file folder to save the show
command outputs as .txt files.
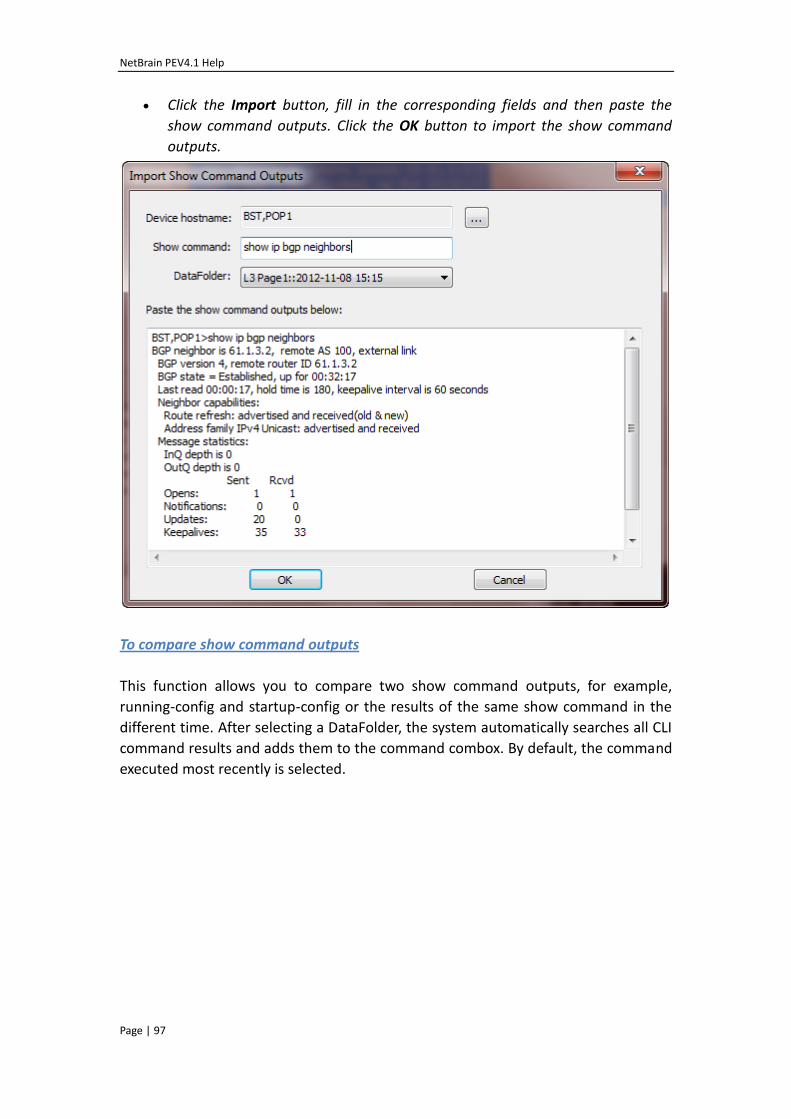
NetBrain PEV4.1 Help
Page | 97
Click the Import button, fill in the corresponding fields and then paste the
show command outputs. Click the OK button to import the show command
outputs.
To compare show command outputs
This function allows you to compare two show command outputs, for example,
running-config and startup-config or the results of the same show command in the
different time. After selecting a DataFolder, the system automatically searches all CLI
command results and adds them to the command combox. By default, the command
executed most recently is selected.
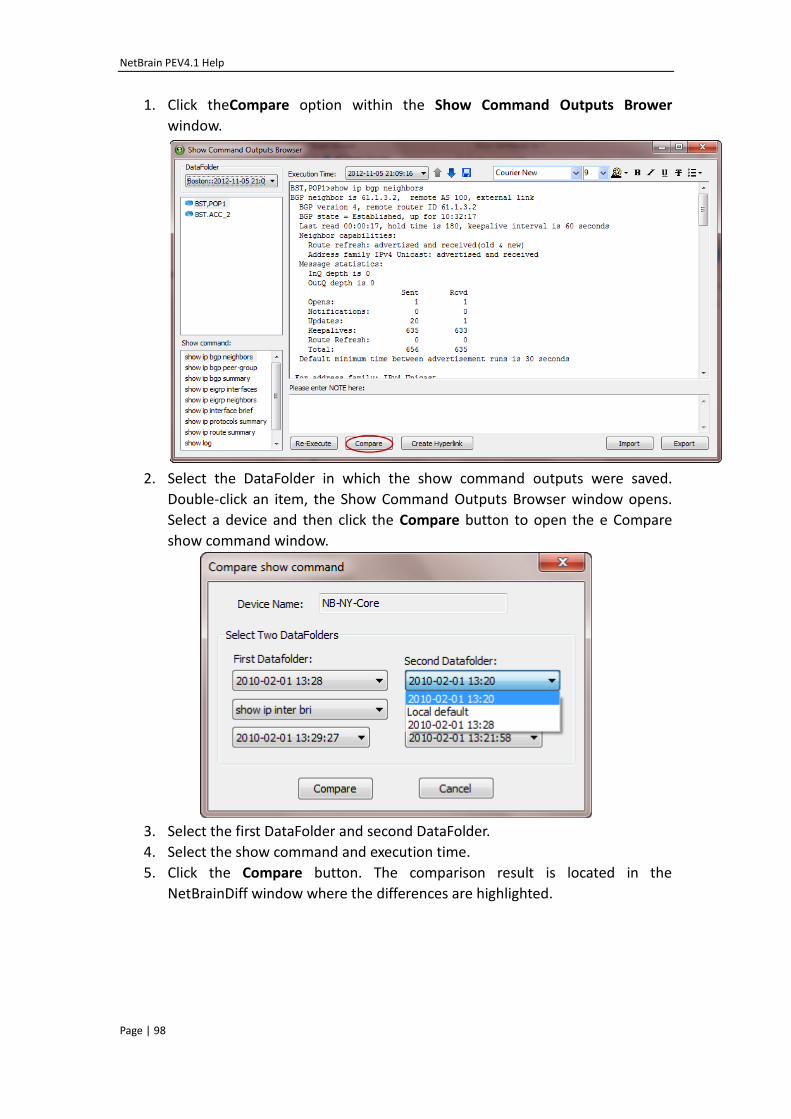
NetBrain PEV4.1 Help
Page | 98
1. Click theCompare option within the Show Command Outputs Brower
window.
2. Select the DataFolder in which the show command outputs were saved.
Double-click an item, the Show Command Outputs Browser window opens.
Select a device and then click the Compare button to open the e Compare
show command window.
3. Select the first DataFolder and second DataFolder.
4. Select the show command and execution time.
5. Click the Compare button. The comparison result is located in the
NetBrainDiff window where the differences are highlighted.
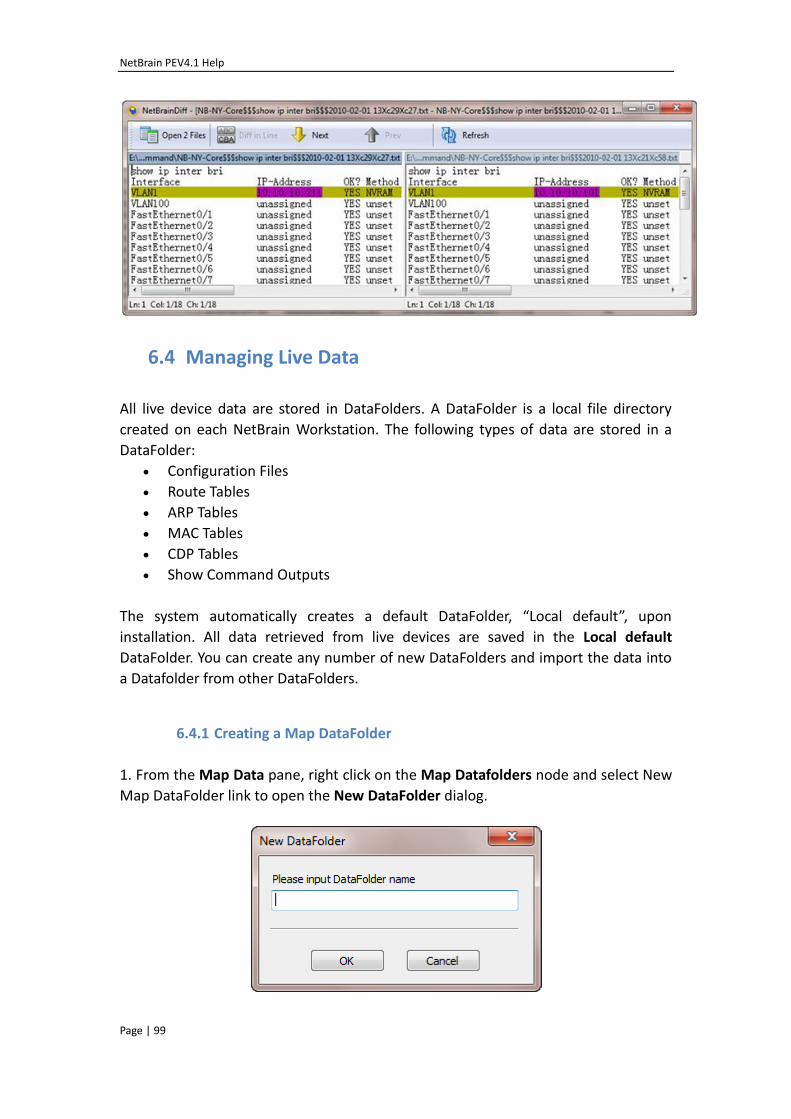
NetBrain PEV4.1 Help
Page | 99
6.4 Managing Live Data
All live device data are stored in DataFolders. A DataFolder is a local file directory
created on each NetBrain Workstation. The following types of data are stored in a
DataFolder:
Configuration Files
Route Tables
ARP Tables
MAC Tables
CDP Tables
Show Command Outputs
The system automatically creates a default DataFolder, “Local default”, upon
installation. All data retrieved from live devices are saved in the Local default
DataFolder. You can create any number of new DataFolders and import the data into
a Datafolder from other DataFolders.
6.4.1 Creating a Map DataFolder
1. From the Map Data pane, right click on the Map Datafolders node and select New
Map DataFolder link to open the New DataFolder dialog.
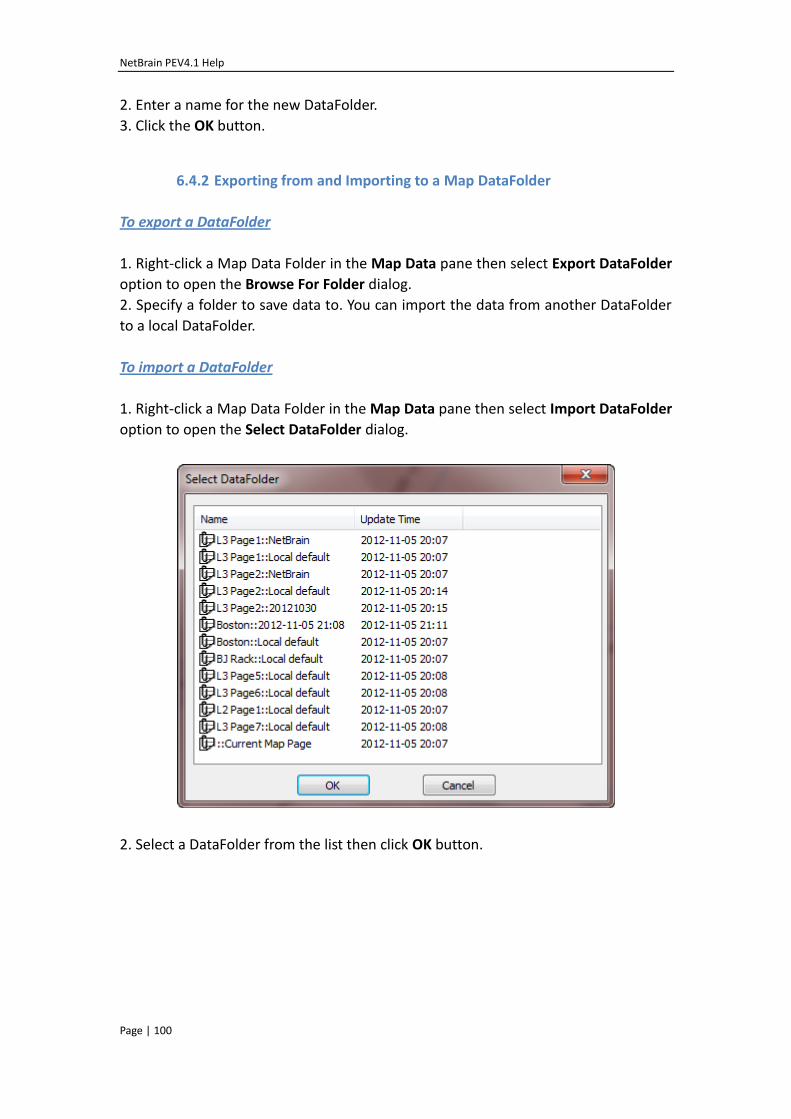
NetBrain PEV4.1 Help
Page | 100
2. Enter a name for the new DataFolder.
3. Click the OK button.
6.4.2 Exporting from and Importing to a Map DataFolder
To export a DataFolder
1. Right-click a Map Data Folder in the Map Data pane then select Export DataFolder
option to open the Browse For Folder dialog.
2. Specify a folder to save data to. You can import the data from another DataFolder
to a local DataFolder.
To import a DataFolder
1. Right-click a Map Data Folder in the Map Data pane then select Import DataFolder
option to open the Select DataFolder dialog.
2. Select a DataFolder from the list then click OK button.
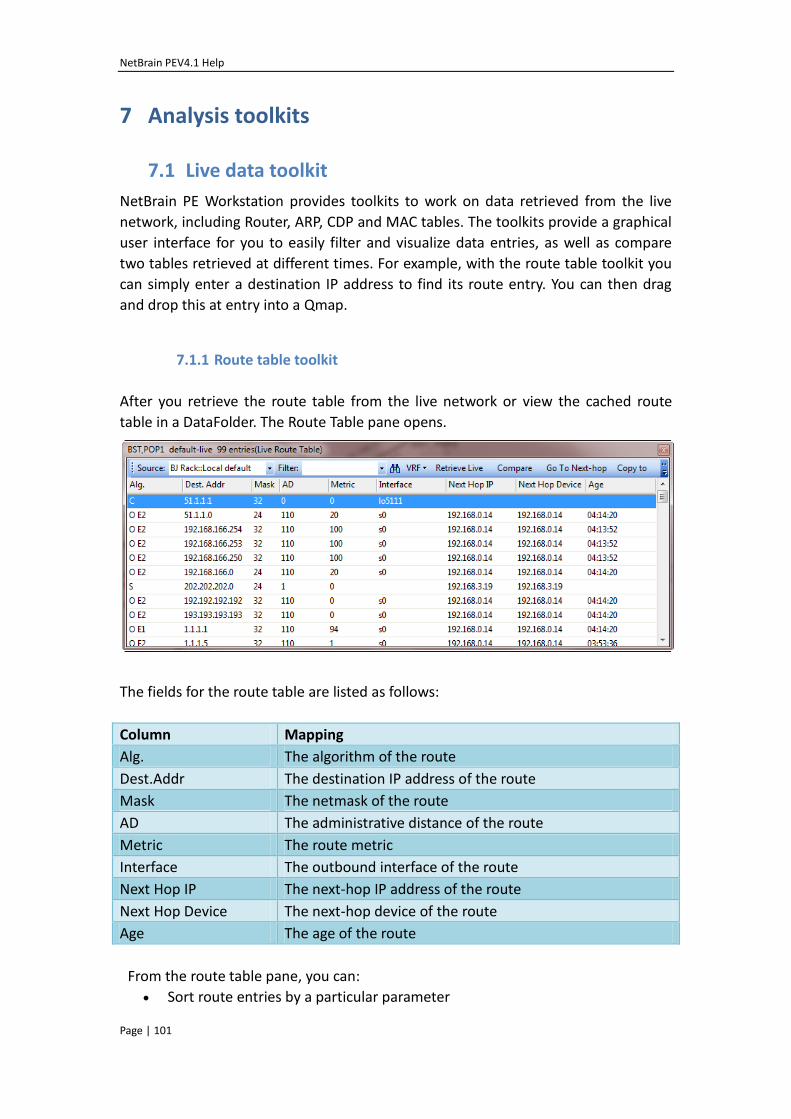
NetBrain PEV4.1 Help
Page | 101
7 Analysis toolkits
7.1 Live data toolkit
NetBrain PE Workstation provides toolkits to work on data retrieved from the live
network, including Router, ARP, CDP and MAC tables. The toolkits provide a graphical
user interface for you to easily filter and visualize data entries, as well as compare
two tables retrieved at different times. For example, with the route table toolkit you
can simply enter a destination IP address to find its route entry. You can then drag
and drop this at entry into a Qmap.
7.1.1 Route table toolkit
After you retrieve the route table from the live network or view the cached route
table in a DataFolder. The Route Table pane opens.
The fields for the route table are listed as follows:
Column Mapping
Alg. The algorithm of the route
Dest.Addr The destination IP address of the route
Mask The netmask of the route
AD The administrative distance of the route
Metric The route metric
Interface The outbound interface of the route
Next Hop IP The next-hop IP address of the route
Next Hop Device The next-hop device of the route
Age The age of the route
From the route table pane, you can:
Sort route entries by a particular parameter
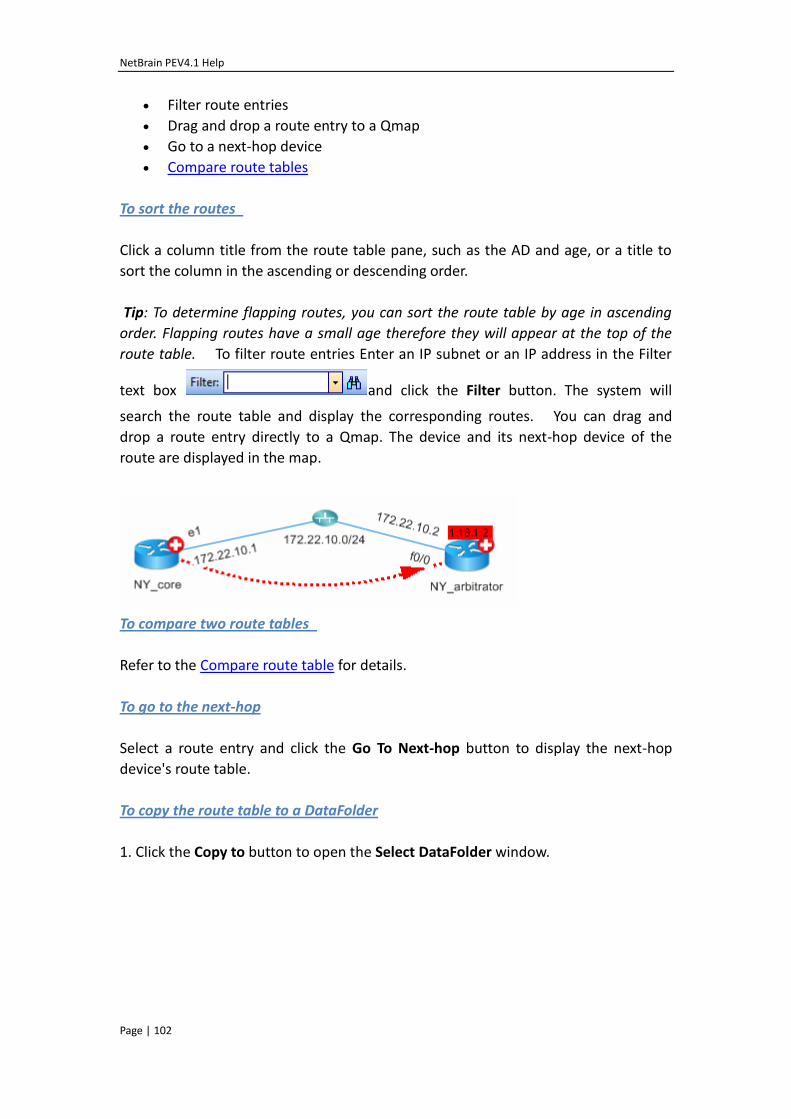
NetBrain PEV4.1 Help
Page | 102
Filter route entries
Drag and drop a route entry to a Qmap
Go to a next-hop device
Compare route tables
To sort the routes
Click a column title from the route table pane, such as the AD and age, or a title to
sort the column in the ascending or descending order.
Tip: To determine flapping routes, you can sort the route table by age in ascending
order. Flapping routes have a small age therefore they will appear at the top of the
route table. To filter route entries Enter an IP subnet or an IP address in the Filter
text box and click the Filter button. The system will
search the route table and display the corresponding routes. You can drag and
drop a route entry directly to a Qmap. The device and its next-hop device of the
route are displayed in the map.
To compare two route tables
Refer to the Compare route table for details.
To go to the next-hop
Select a route entry and click the Go To Next-hop button to display the next-hop
device's route table.
To copy the route table to a DataFolder
1. Click the Copy to button to open the Select DataFolder window.
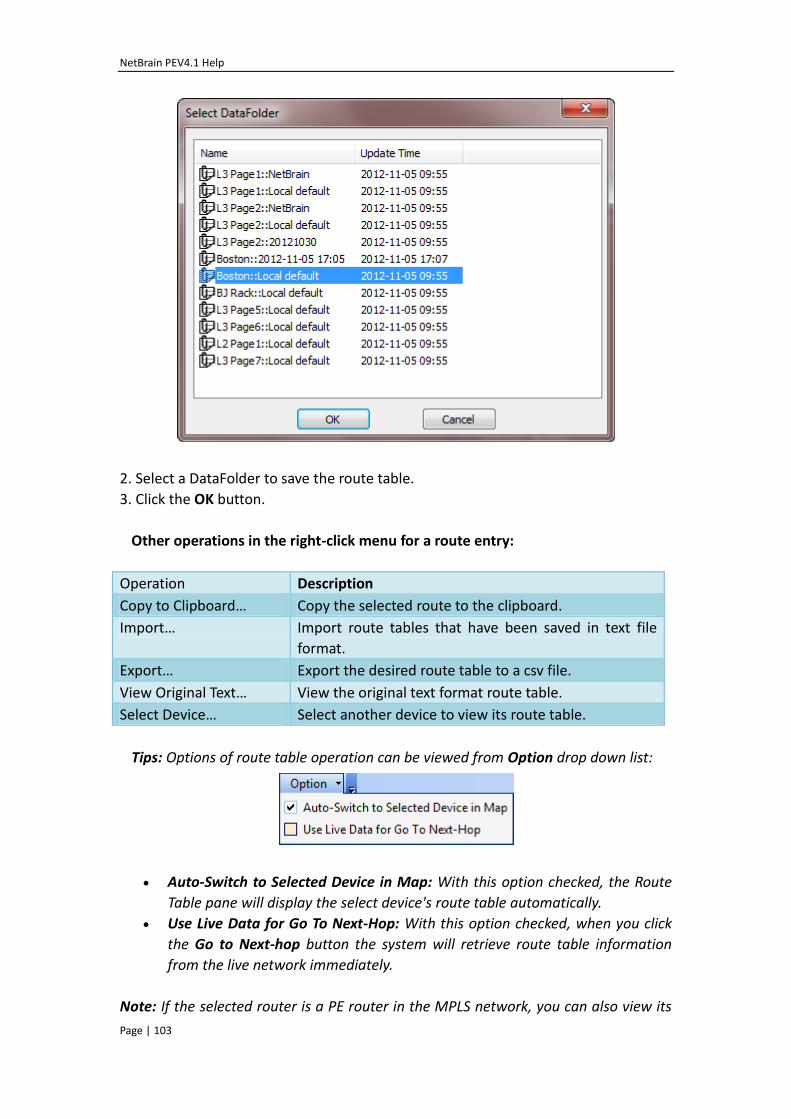
NetBrain PEV4.1 Help
Page | 103
2. Select a DataFolder to save the route table.
3. Click the OK button.
Other operations in the right-click menu for a route entry:
Operation Description
Copy to Clipboard… Copy the selected route to the clipboard.
Import… Import route tables that have been saved in text file
format.
Export… Export the desired route table to a csv file.
View Original Text… View the original text format route table.
Select Device… Select another device to view its route table.
Tips: Options of route table operation can be viewed from Option drop down list:
Auto-Switch to Selected Device in Map: With this option checked, the Route
Table pane will display the select device's route table automatically.
Use Live Data for Go To Next-Hop: With this option checked, when you click
the Go to Next-hop button the system will retrieve route table information
from the live network immediately.
Note: If the selected router is a PE router in the MPLS network, you can also view its
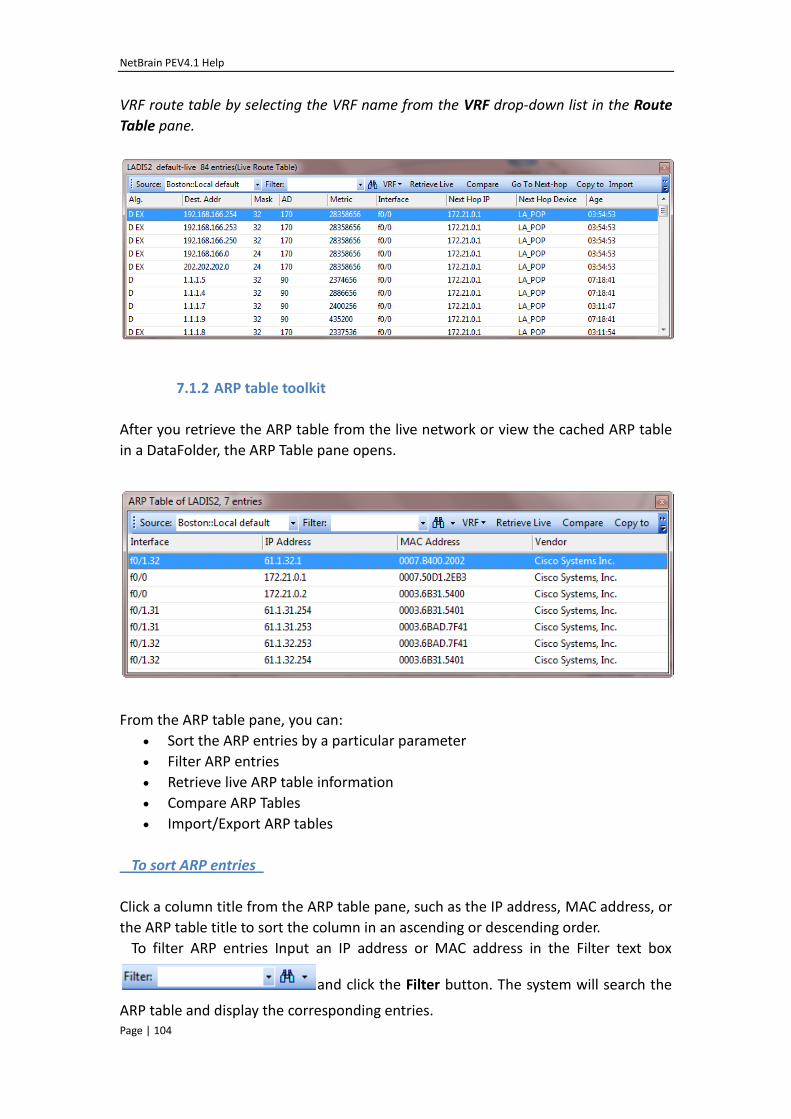
NetBrain PEV4.1 Help
Page | 104
VRF route table by selecting the VRF name from the VRF drop-down list in the Route
Table pane.
7.1.2 ARP table toolkit
After you retrieve the ARP table from the live network or view the cached ARP table
in a DataFolder, the ARP Table pane opens.
From the ARP table pane, you can:
Sort the ARP entries by a particular parameter
Filter ARP entries
Retrieve live ARP table information
Compare ARP Tables
Import/Export ARP tables
To sort ARP entries
Click a column title from the ARP table pane, such as the IP address, MAC address, or
the ARP table title to sort the column in an ascending or descending order.
To filter ARP entries Input an IP address or MAC address in the Filter text box
and click the Filter button. The system will search the
ARP table and display the corresponding entries.
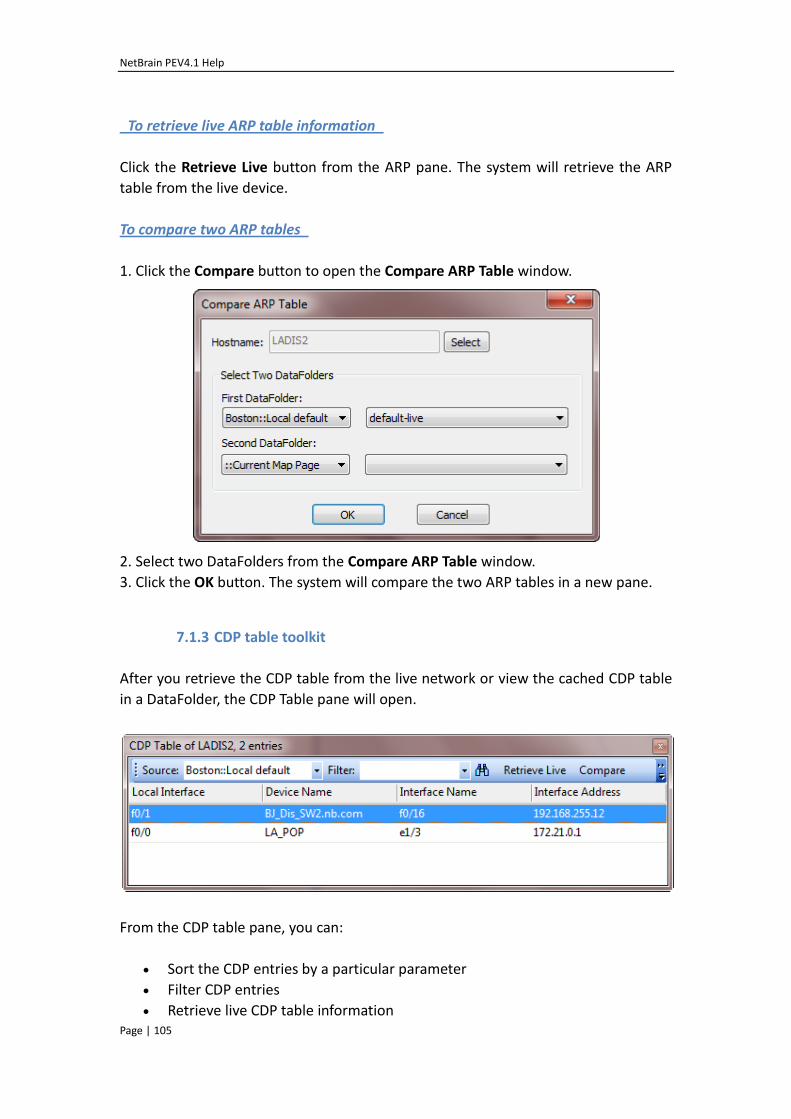
NetBrain PEV4.1 Help
Page | 105
To retrieve live ARP table information
Click the Retrieve Live button from the ARP pane. The system will retrieve the ARP
table from the live device.
To compare two ARP tables
1. Click the Compare button to open the Compare ARP Table window.
2. Select two DataFolders from the Compare ARP Table window.
3. Click the OK button. The system will compare the two ARP tables in a new pane.
7.1.3 CDP table toolkit
After you retrieve the CDP table from the live network or view the cached CDP table
in a DataFolder, the CDP Table pane will open.
From the CDP table pane, you can:
Sort the CDP entries by a particular parameter
Filter CDP entries
Retrieve live CDP table information
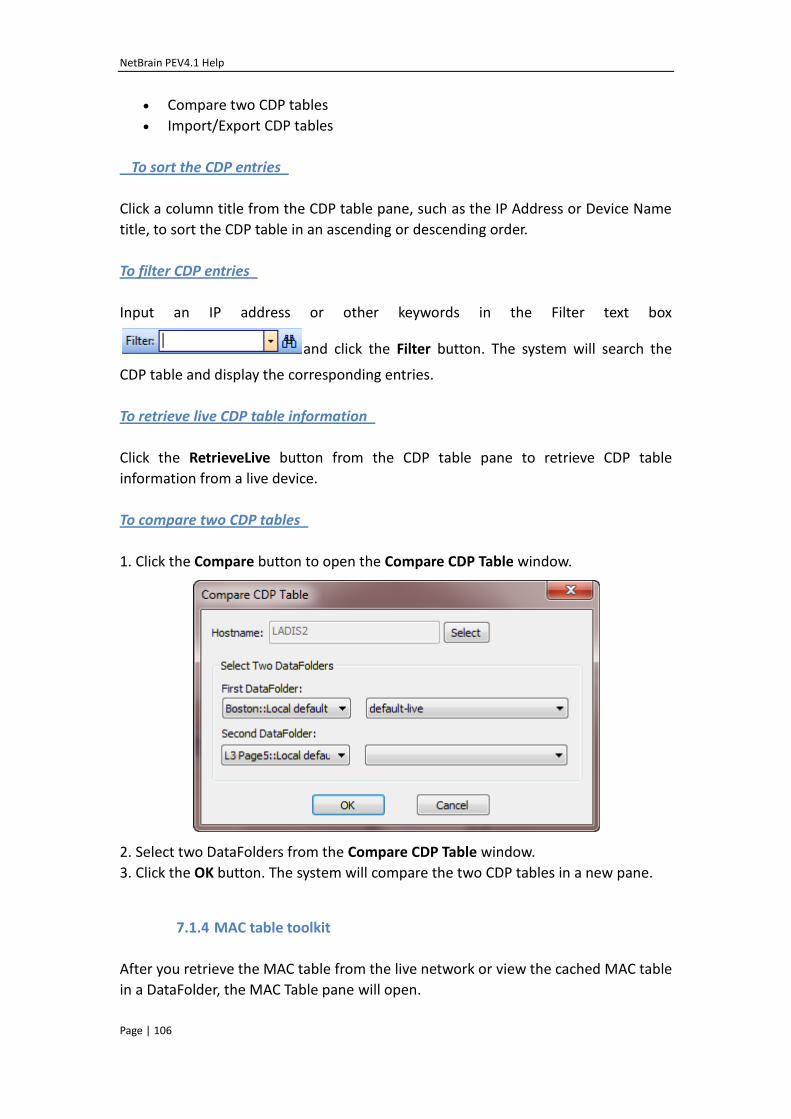
NetBrain PEV4.1 Help
Page | 106
Compare two CDP tables
Import/Export CDP tables
To sort the CDP entries
Click a column title from the CDP table pane, such as the IP Address or Device Name
title, to sort the CDP table in an ascending or descending order.
To filter CDP entries
Input an IP address or other keywords in the Filter text box
and click the Filter button. The system will search the
CDP table and display the corresponding entries.
To retrieve live CDP table information
Click the RetrieveLive button from the CDP table pane to retrieve CDP table
information from a live device.
To compare two CDP tables
1. Click the Compare button to open the Compare CDP Table window.
2. Select two DataFolders from the Compare CDP Table window.
3. Click the OK button. The system will compare the two CDP tables in a new pane.
7.1.4 MAC table toolkit
After you retrieve the MAC table from the live network or view the cached MAC table
in a DataFolder, the MAC Table pane will open.
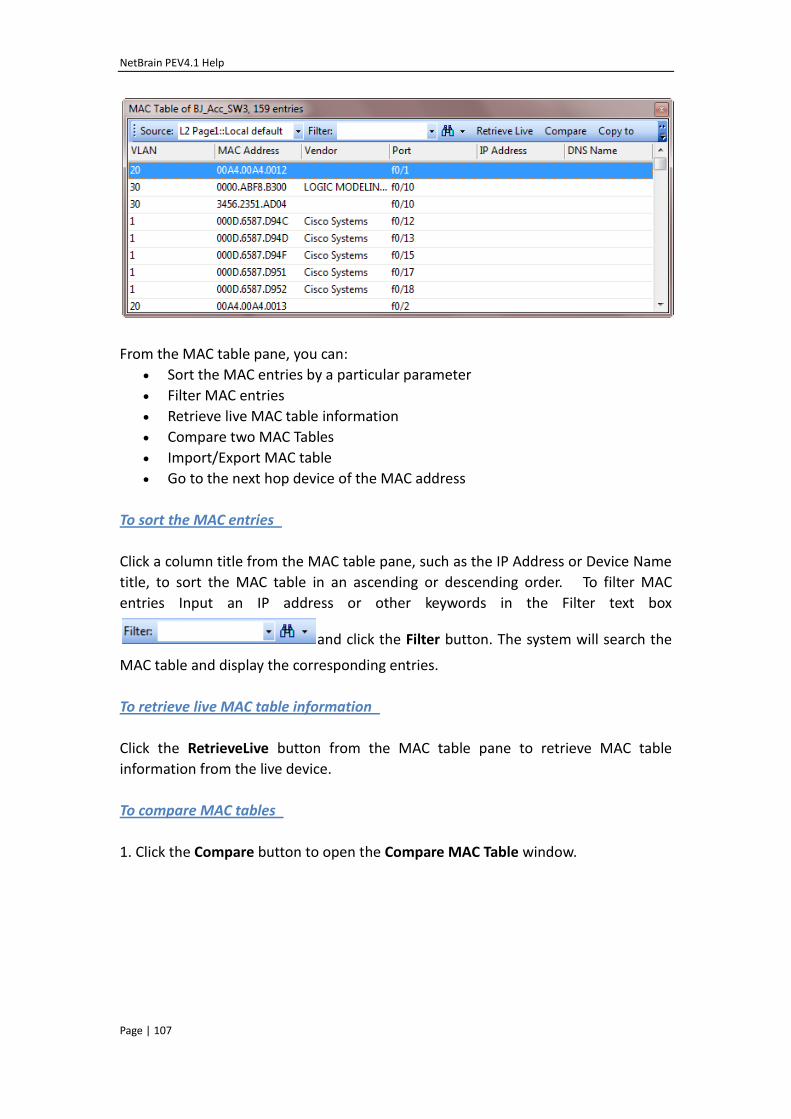
NetBrain PEV4.1 Help
Page | 107
From the MAC table pane, you can:
Sort the MAC entries by a particular parameter
Filter MAC entries
Retrieve live MAC table information
Compare two MAC Tables
Import/Export MAC table
Go to the next hop device of the MAC address
To sort the MAC entries
Click a column title from the MAC table pane, such as the IP Address or Device Name
title, to sort the MAC table in an ascending or descending order. To filter MAC
entries Input an IP address or other keywords in the Filter text box
and click the Filter button. The system will search the
MAC table and display the corresponding entries.
To retrieve live MAC table information
Click the RetrieveLive button from the MAC table pane to retrieve MAC table
information from the live device.
To compare MAC tables
1. Click the Compare button to open the Compare MAC Table window.
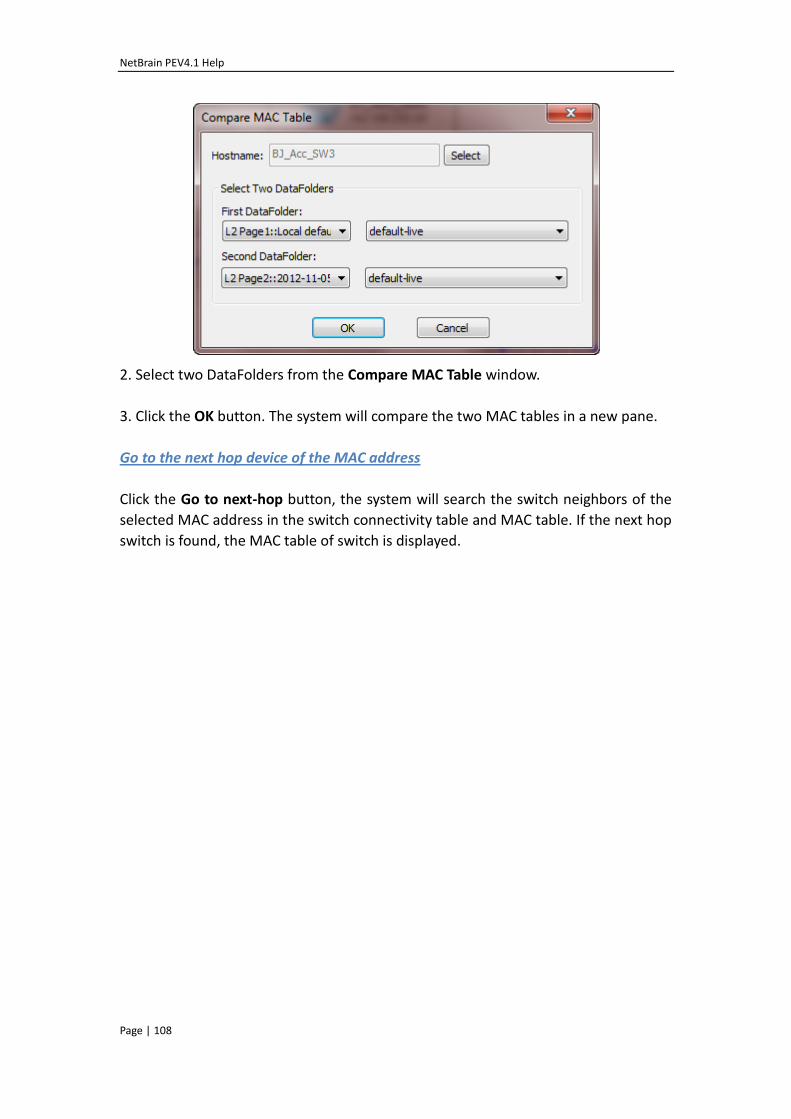
NetBrain PEV4.1 Help
Page | 108
2. Select two DataFolders from the Compare MAC Table window.
3. Click the OK button. The system will compare the two MAC tables in a new pane.
Go to the next hop device of the MAC address
Click the Go to next-hop button, the system will search the switch neighbors of the
selected MAC address in the switch connectivity table and MAC table. If the next hop
switch is found, the MAC table of switch is displayed.
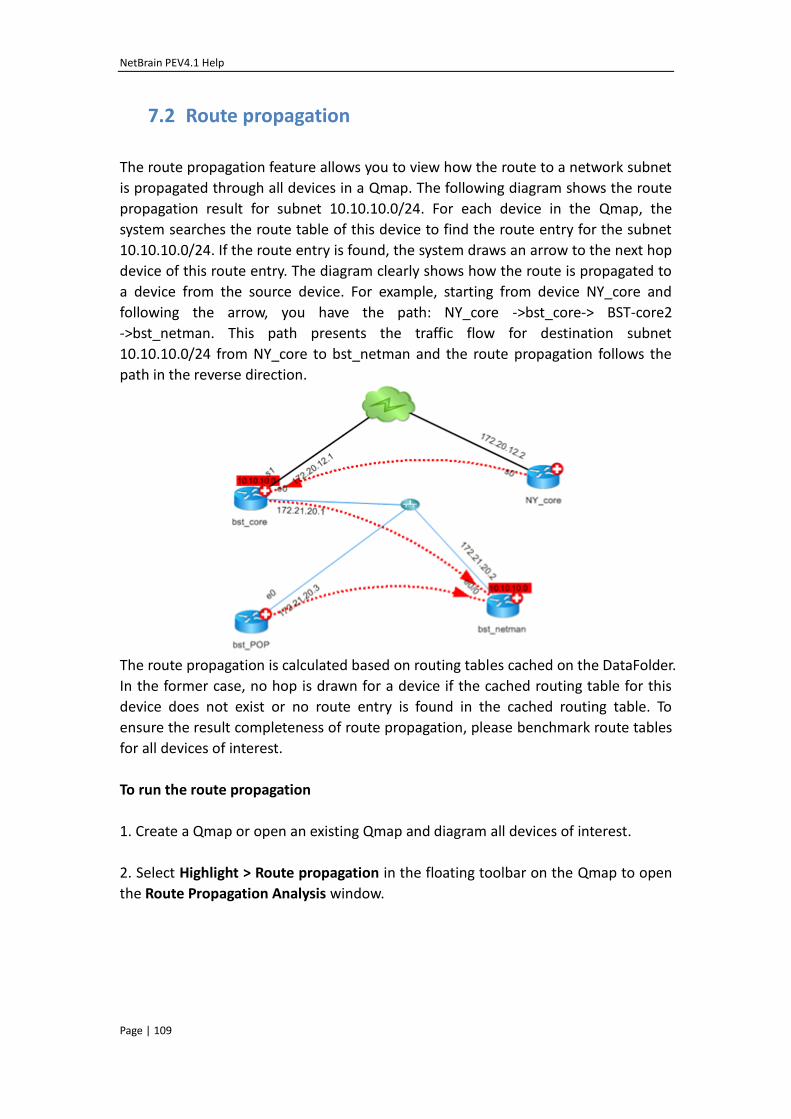
NetBrain PEV4.1 Help
Page | 109
7.2 Route propagation
The route propagation feature allows you to view how the route to a network subnet
is propagated through all devices in a Qmap. The following diagram shows the route
propagation result for subnet 10.10.10.0/24. For each device in the Qmap, the
system searches the route table of this device to find the route entry for the subnet
10.10.10.0/24. If the route entry is found, the system draws an arrow to the next hop
device of this route entry. The diagram clearly shows how the route is propagated to
a device from the source device. For example, starting from device NY_core and
following the arrow, you have the path: NY_core ->bst_core-> BST-core2
->bst_netman. This path presents the traffic flow for destination subnet
10.10.10.0/24 from NY_core to bst_netman and the route propagation follows the
path in the reverse direction.
The route propagation is calculated based on routing tables cached on the DataFolder.
In the former case, no hop is drawn for a device if the cached routing table for this
device does not exist or no route entry is found in the cached routing table. To
ensure the result completeness of route propagation, please benchmark route tables
for all devices of interest.
To run the route propagation
1. Create a Qmap or open an existing Qmap and diagram all devices of interest.
2. Select Highlight > Route propagation in the floating toolbar on the Qmap to open
the Route Propagation Analysis window.
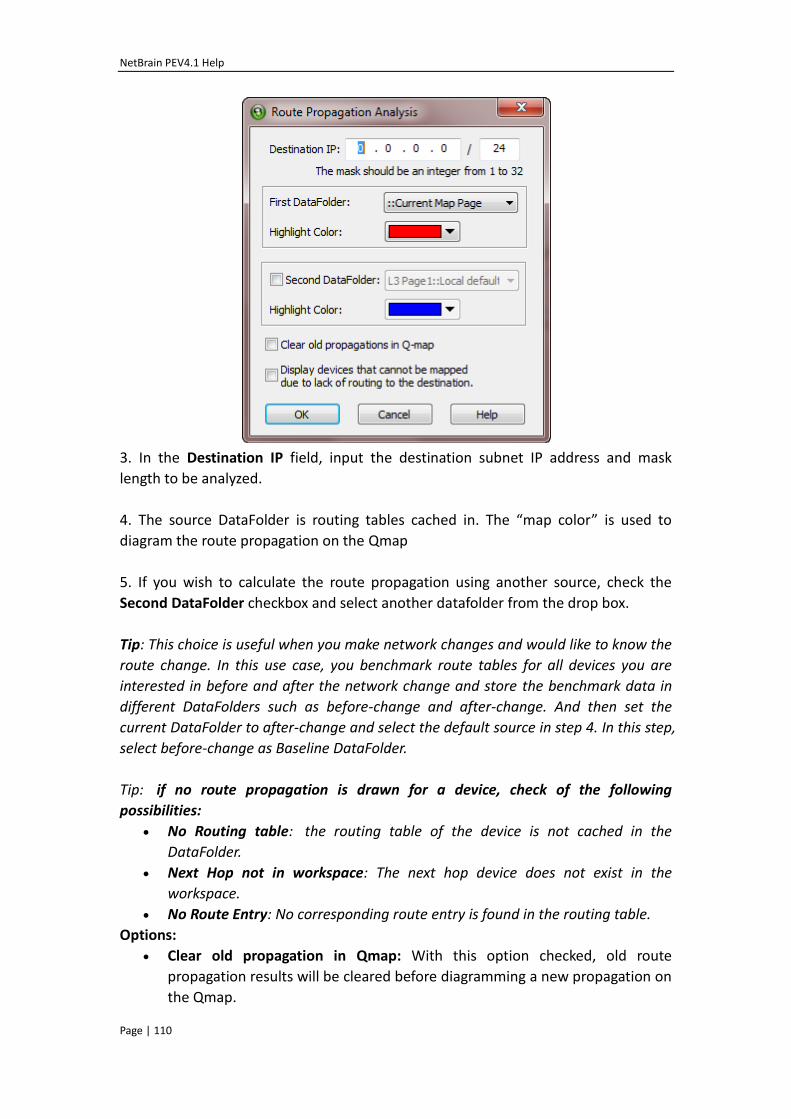
NetBrain PEV4.1 Help
Page | 110
3. In the Destination IP field, input the destination subnet IP address and mask
length to be analyzed.
4. The source DataFolder is routing tables cached in. The “map color” is used to
diagram the route propagation on the Qmap
5. If you wish to calculate the route propagation using another source, check the
Second DataFolder checkbox and select another datafolder from the drop box.
Tip: This choice is useful when you make network changes and would like to know the
route change. In this use case, you benchmark route tables for all devices you are
interested in before and after the network change and store the benchmark data in
different DataFolders such as before-change and after-change. And then set the
current DataFolder to after-change and select the default source in step 4. In this step,
select before-change as Baseline DataFolder.
Tip: if no route propagation is drawn for a device, check of the following
possibilities:
No Routing table: the routing table of the device is not cached in the
DataFolder.
Next Hop not in workspace: The next hop device does not exist in the
workspace.
No Route Entry: No corresponding route entry is found in the routing table.
Options:
Clear old propagation in Qmap: With this option checked, old route
propagation results will be cleared before diagramming a new propagation on
the Qmap.
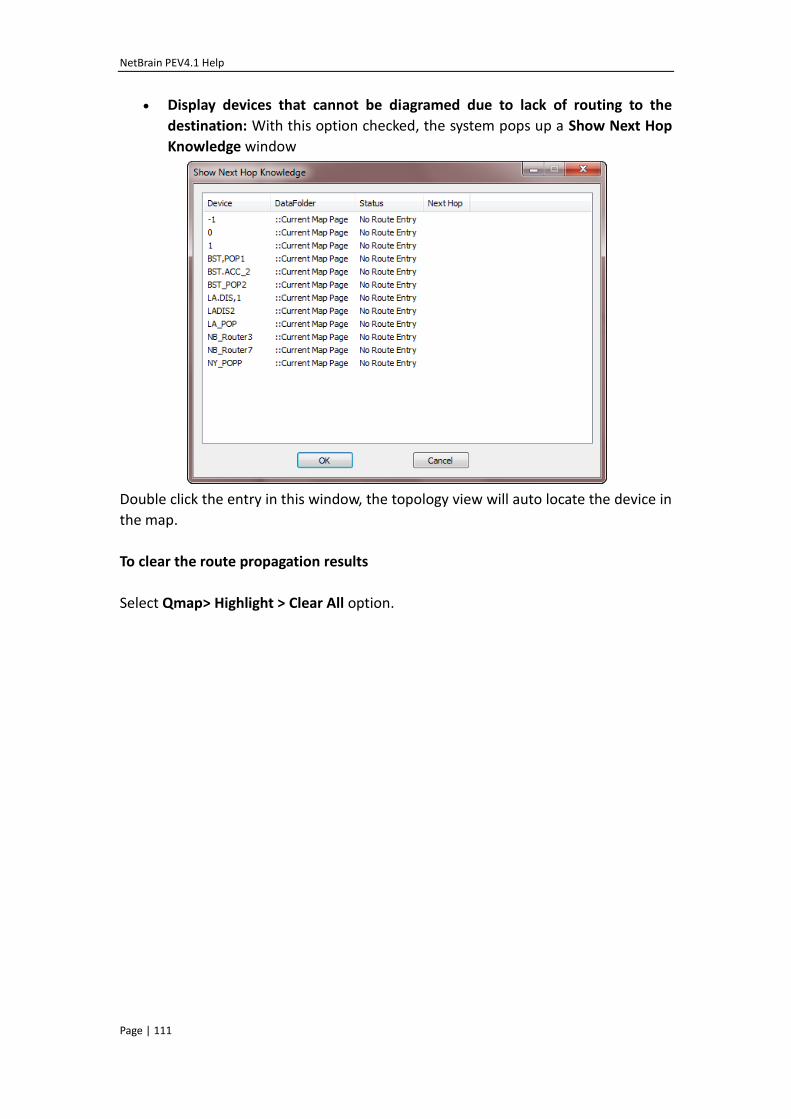
NetBrain PEV4.1 Help
Page | 111
Display devices that cannot be diagramed due to lack of routing to the
destination: With this option checked, the system pops up a Show Next Hop
Knowledge window
Double click the entry in this window, the topology view will auto locate the device in
the map.
To clear the route propagation results
Select Qmap> Highlight > Clear All option.
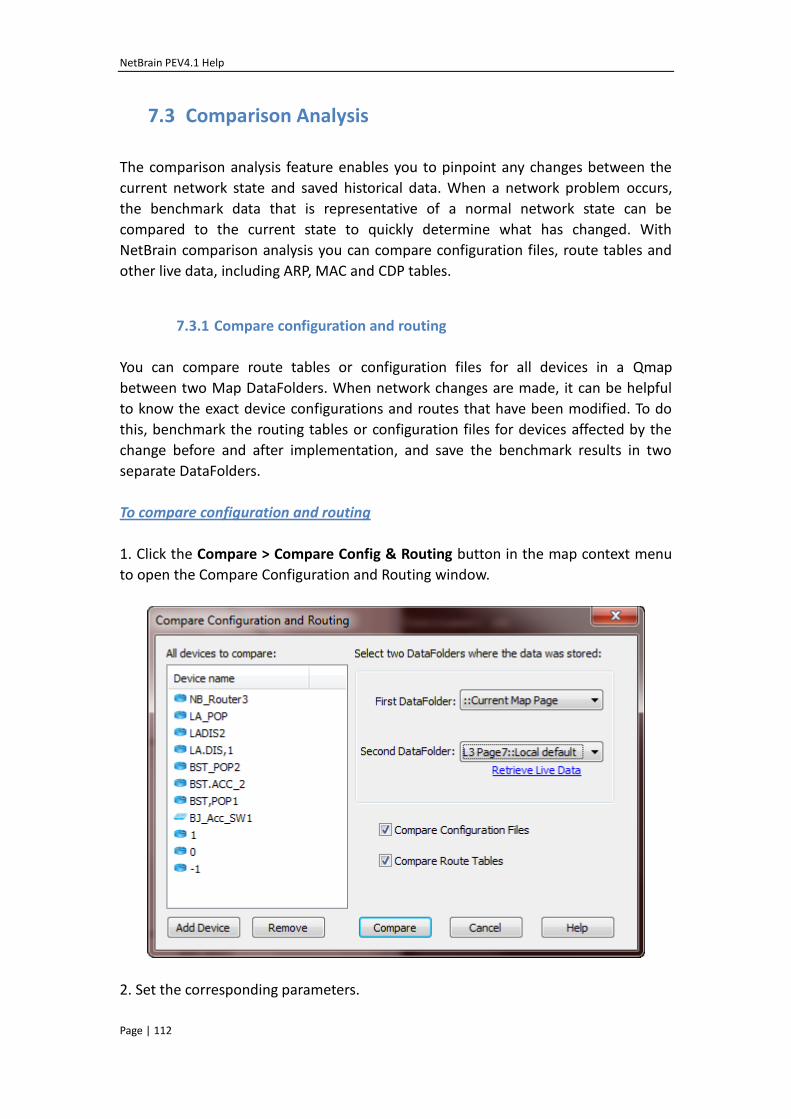
NetBrain PEV4.1 Help
Page | 112
7.3 Comparison Analysis
The comparison analysis feature enables you to pinpoint any changes between the
current network state and saved historical data. When a network problem occurs,
the benchmark data that is representative of a normal network state can be
compared to the current state to quickly determine what has changed. With
NetBrain comparison analysis you can compare configuration files, route tables and
other live data, including ARP, MAC and CDP tables.
7.3.1 Compare configuration and routing
You can compare route tables or configuration files for all devices in a Qmap
between two Map DataFolders. When network changes are made, it can be helpful
to know the exact device configurations and routes that have been modified. To do
this, benchmark the routing tables or configuration files for devices affected by the
change before and after implementation, and save the benchmark results in two
separate DataFolders.
To compare configuration and routing
1. Click the Compare > Compare Config & Routing button in the map context menu
to open the Compare Configuration and Routing window.
2. Set the corresponding parameters.
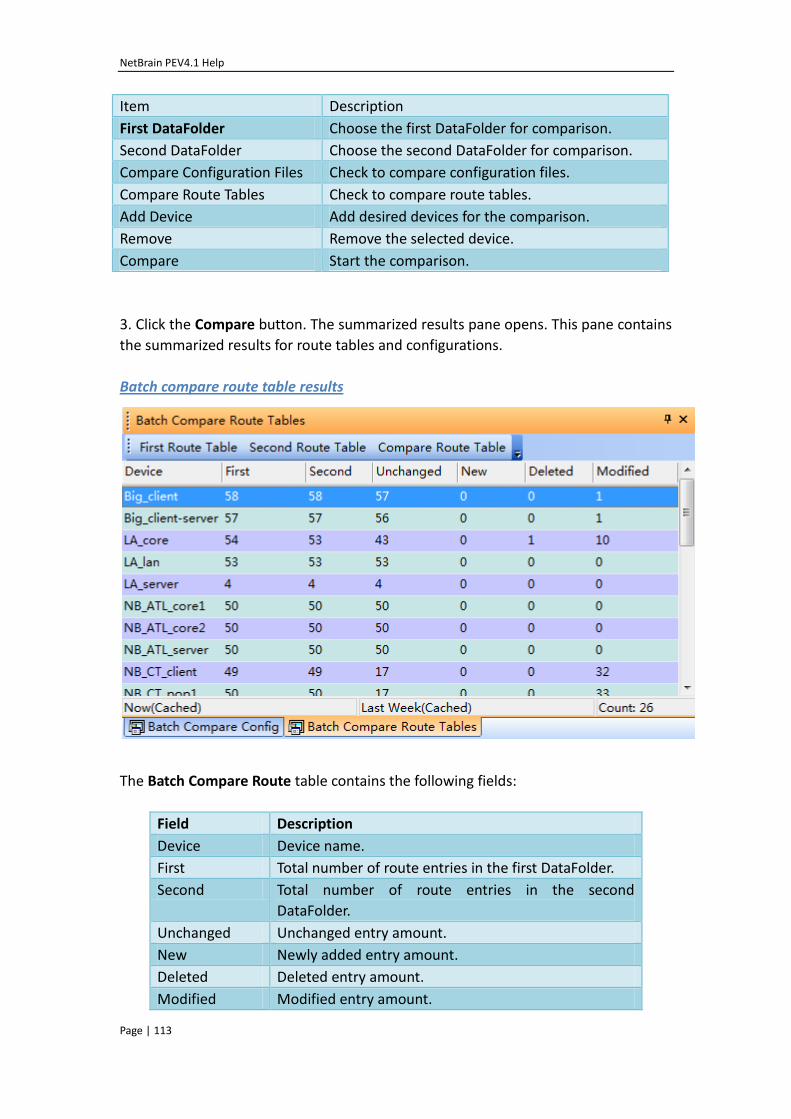
NetBrain PEV4.1 Help
Page | 113
Item Description
First DataFolder Choose the first DataFolder for comparison.
Second DataFolder Choose the second DataFolder for comparison.
Compare Configuration Files Check to compare configuration files.
Compare Route Tables Check to compare route tables.
Add Device Add desired devices for the comparison.
Remove Remove the selected device.
Compare Start the comparison.
3. Click the Compare button. The summarized results pane opens. This pane contains
the summarized results for route tables and configurations.
Batch compare route table results
The Batch Compare Route table contains the following fields:
Field Description
Device Device name.
First Total number of route entries in the first DataFolder.
Second Total number of route entries in the second
DataFolder.
Unchanged Unchanged entry amount.
New Newly added entry amount.
Deleted Deleted entry amount.
Modified Modified entry amount.
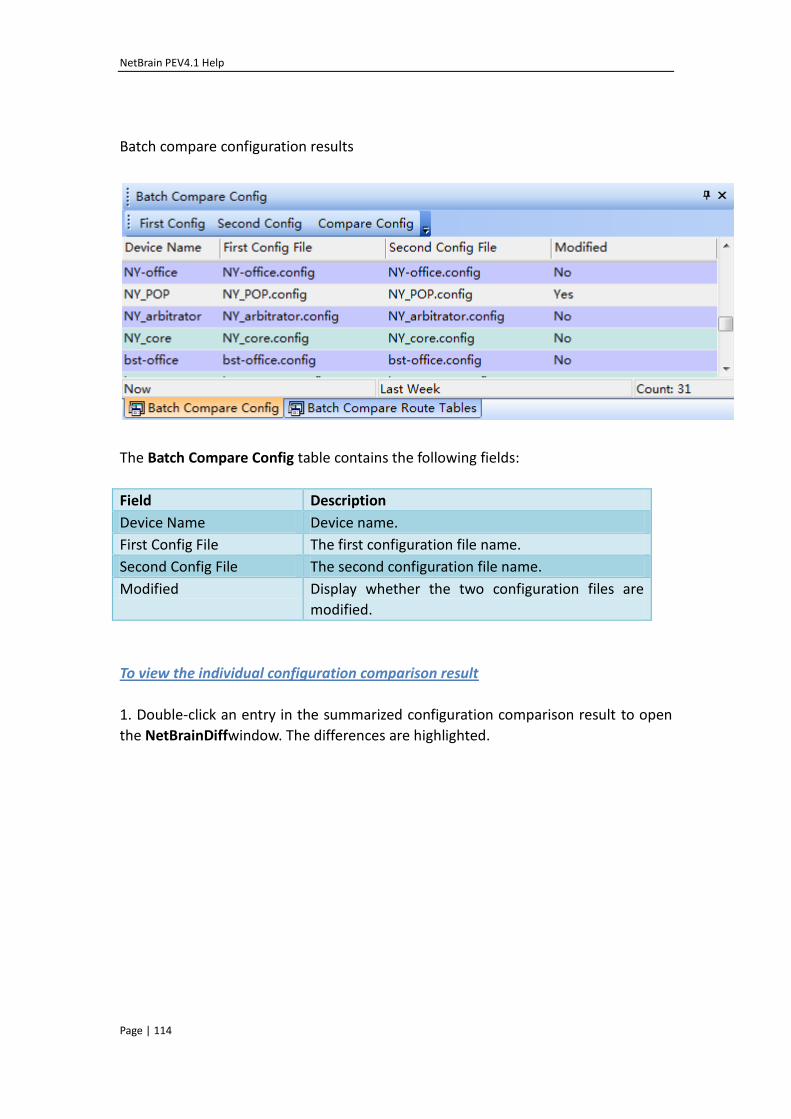
NetBrain PEV4.1 Help
Page | 114
Batch compare configuration results
The Batch Compare Config table contains the following fields:
Field Description
Device Name Device name.
First Config File The first configuration file name.
Second Config File The second configuration file name.
Modified Display whether the two configuration files are
modified.
To view the individual configuration comparison result
1. Double-click an entry in the summarized configuration comparison result to open
the NetBrainDiffwindow. The differences are highlighted.
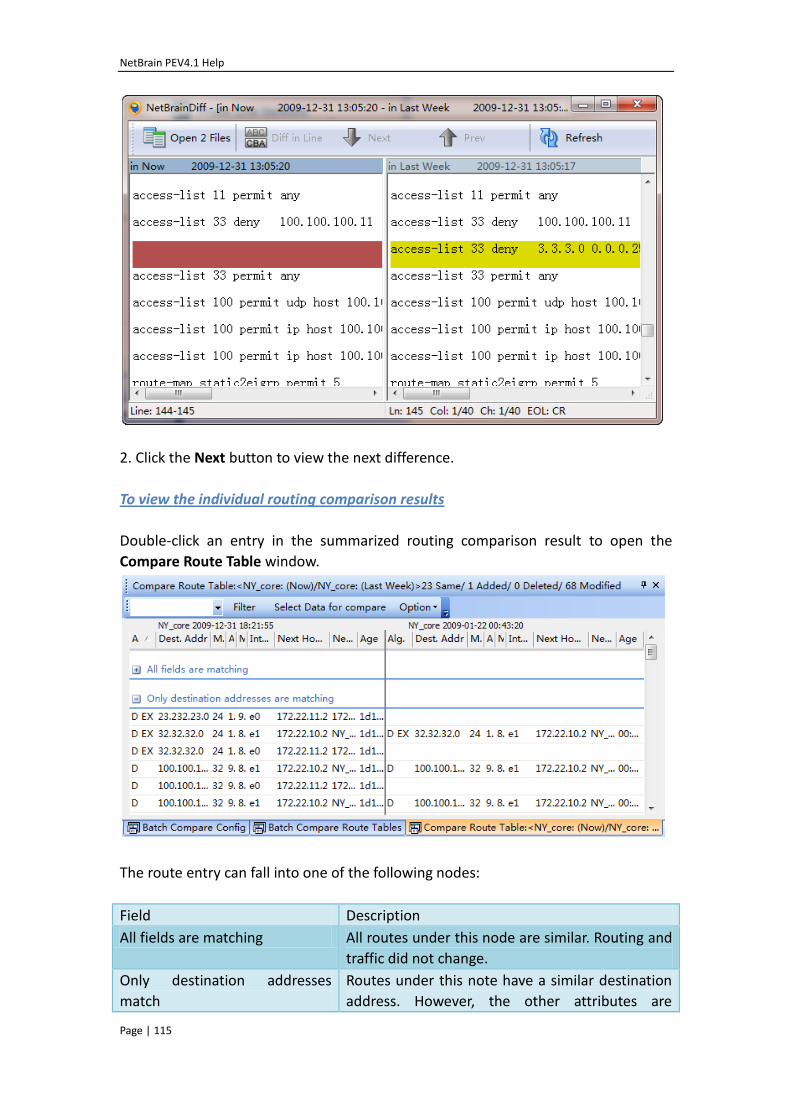
NetBrain PEV4.1 Help
Page | 115
2. Click the Next button to view the next difference.
To view the individual routing comparison results
Double-click an entry in the summarized routing comparison result to open the
Compare Route Table window.
The route entry can fall into one of the following nodes:
Field Description
All fields are matching All routes under this node are similar. Routing and
traffic did not change.
Only destination addresses
match
Routes under this note have a similar destination
address. However, the other attributes are
NetBrain PEV4.1 Help
Page | 116
different, such as the algorithm, netmask, AD, or
next-hop device.
Routes exist only in right route
table
The routes are no longer in the left DataFolder.
Routes have been deleted from the first
DataFolder.
Routes exist only in the left
route table
The routes are no longer in the right route table.
Routes have been deleted from the second
DataFolder.
7.3.2 Compare other live data
With NetBrain Workstation, in addition to device configurations and routing tables,
you can also compare other types of live data.
Compare ARP table
Compare CDP table
Compare MAC table
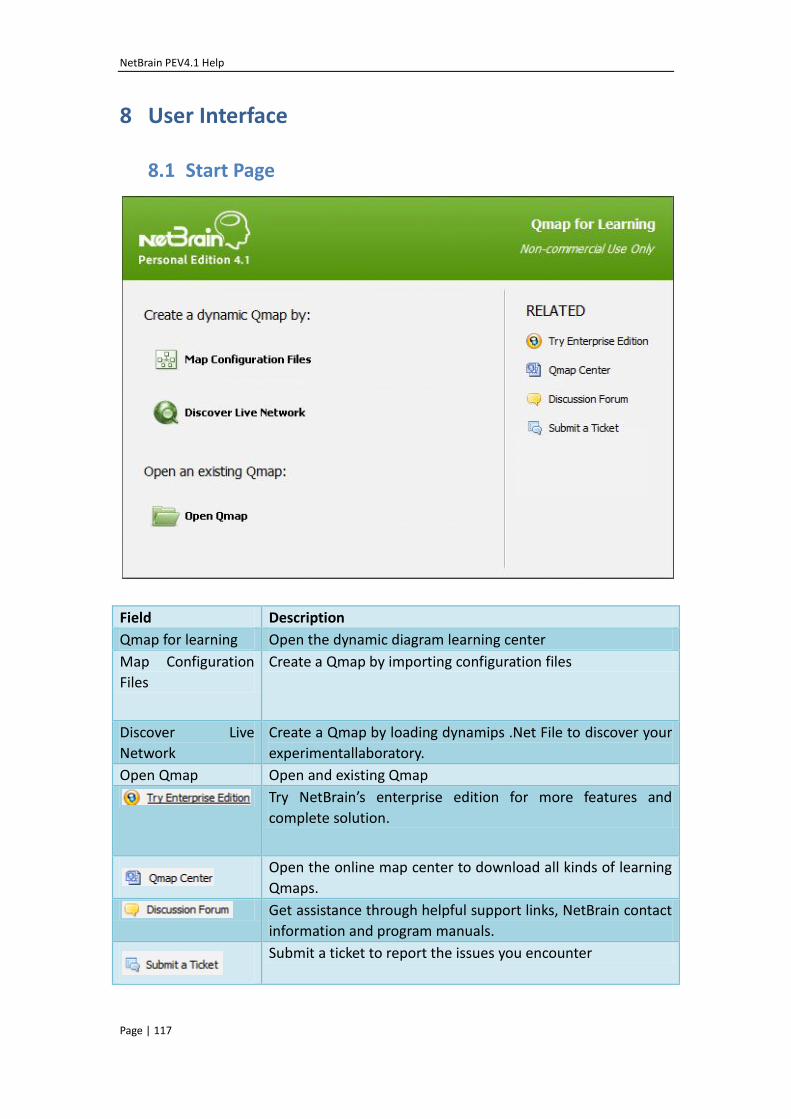
NetBrain PEV4.1 Help
Page | 117
8 User Interface
8.1 Start Page
Field Description
Qmap for learning Open the dynamic diagram learning center
Map Configuration
Files
Create a Qmap by importing configuration files
Discover Live
Network
Create a Qmap by loading dynamips .Net File to discover your
experimentallaboratory.
Open Qmap Open and existing Qmap
Try NetBrain’s enterprise edition for more features and
complete solution.
Open the online map center to download all kinds of learning
Qmaps.
Get assistance through helpful support links, NetBrain contact
information and program manuals.
Submit a ticket to report the issues you encounter
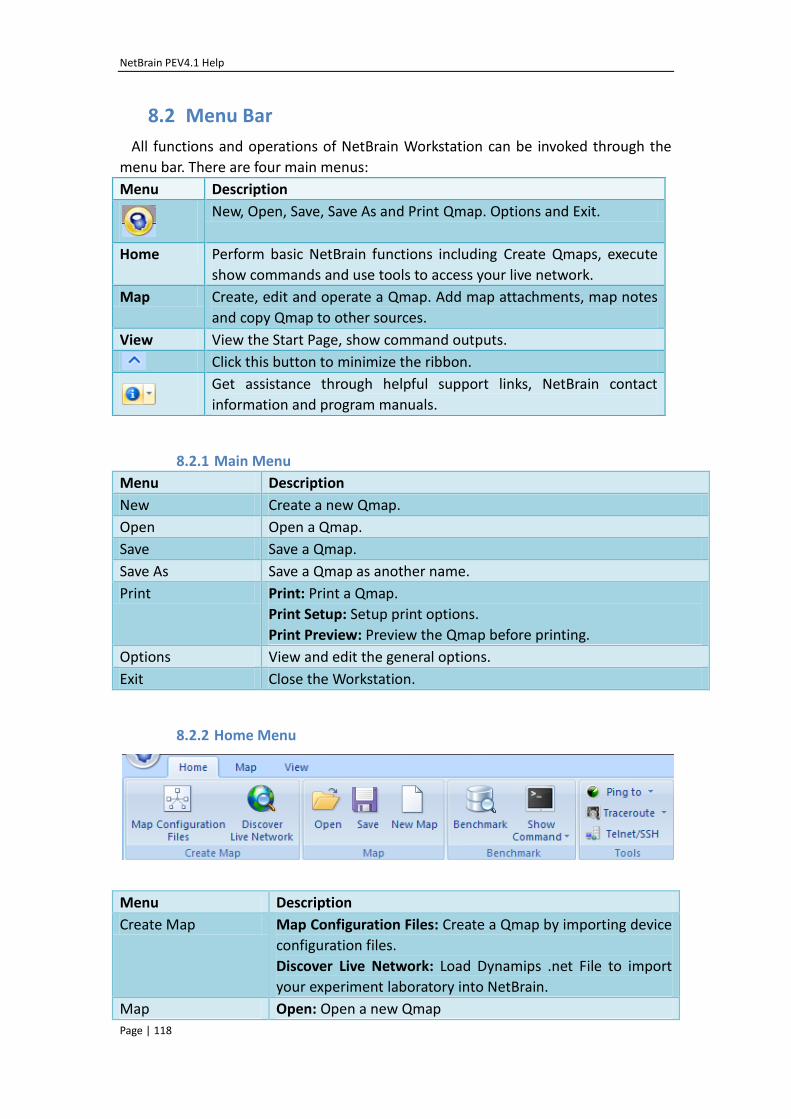
NetBrain PEV4.1 Help
Page | 118
8.2 Menu Bar
All functions and operations of NetBrain Workstation can be invoked through the
menu bar. There are four main menus:
Menu Description
New, Open, Save, Save As and Print Qmap. Options and Exit.
Home Perform basic NetBrain functions including Create Qmaps, execute
show commands and use tools to access your live network.
Map Create, edit and operate a Qmap. Add map attachments, map notes
and copy Qmap to other sources.
View View the Start Page, show command outputs.
Click this button to minimize the ribbon.
Get assistance through helpful support links, NetBrain contact
information and program manuals.
8.2.1 Main Menu
Menu Description
New Create a new Qmap.
Open Open a Qmap.
Save Save a Qmap.
Save As Save a Qmap as another name.
Print Print: Print a Qmap.
Print Setup: Setup print options.
Print Preview: Preview the Qmap before printing.
Options View and edit the general options.
Exit Close the Workstation.
8.2.2 Home Menu
Menu Description
Create Map Map Configuration Files: Create a Qmap by importing device
configuration files.
Discover Live Network: Load Dynamips .net File to import
your experiment laboratory into NetBrain.
Map Open: Open a new Qmap
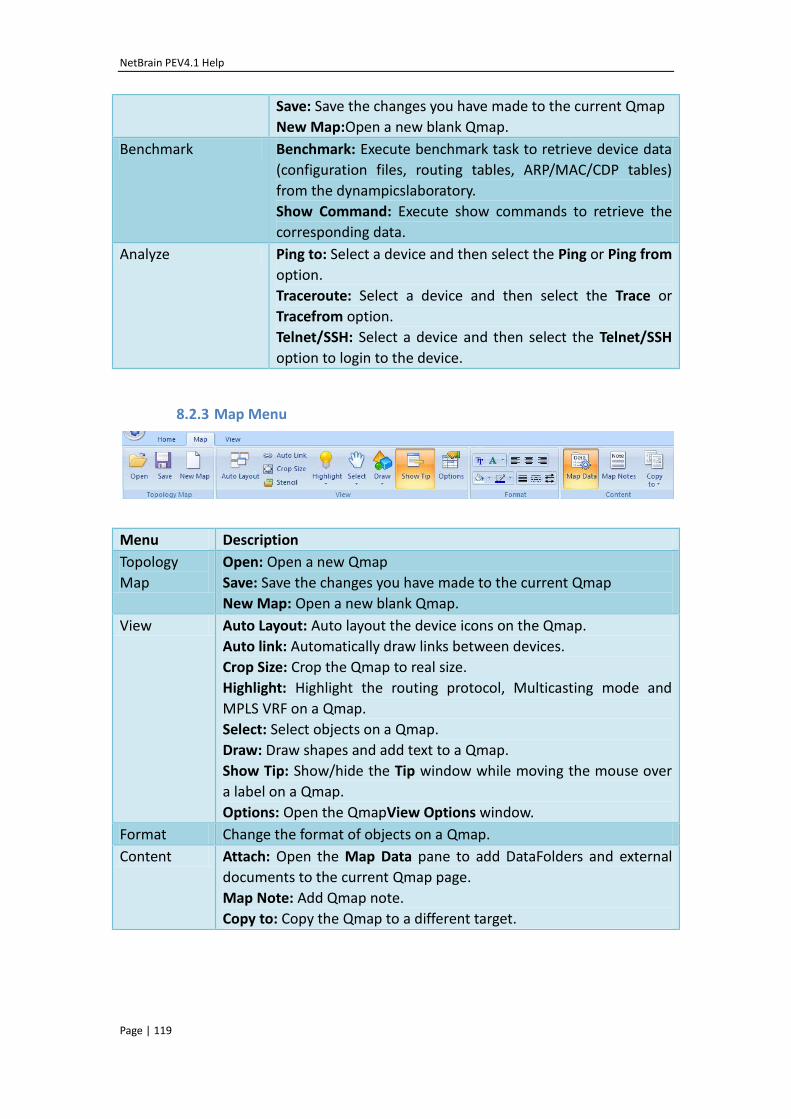
NetBrain PEV4.1 Help
Page | 119
Save: Save the changes you have made to the current Qmap
New Map:Open a new blank Qmap.
Benchmark Benchmark: Execute benchmark task to retrieve device data
(configuration files, routing tables, ARP/MAC/CDP tables)
from the dynampicslaboratory.
Show Command: Execute show commands to retrieve the
corresponding data.
Analyze Ping to: Select a device and then select the Ping or Ping from
option.
Traceroute: Select a device and then select the Trace or
Tracefrom option.
Telnet/SSH: Select a device and then select the Telnet/SSH
option to login to the device.
8.2.3 Map Menu
Menu Description
Topology
Map
Open: Open a new Qmap
Save: Save the changes you have made to the current Qmap
New Map: Open a new blank Qmap.
View Auto Layout: Auto layout the device icons on the Qmap.
Auto link: Automatically draw links between devices.
Crop Size: Crop the Qmap to real size.
Highlight: Highlight the routing protocol, Multicasting mode and
MPLS VRF on a Qmap.
Select: Select objects on a Qmap.
Draw: Draw shapes and add text to a Qmap.
Show Tip: Show/hide the Tip window while moving the mouse over
a label on a Qmap.
Options: Open the QmapView Options window.
Format Change the format of objects on a Qmap.
Content Attach: Open the Map Data pane to add DataFolders and external
documents to the current Qmap page.
Map Note: Add Qmap note.
Copy to: Copy the Qmap to a different target.
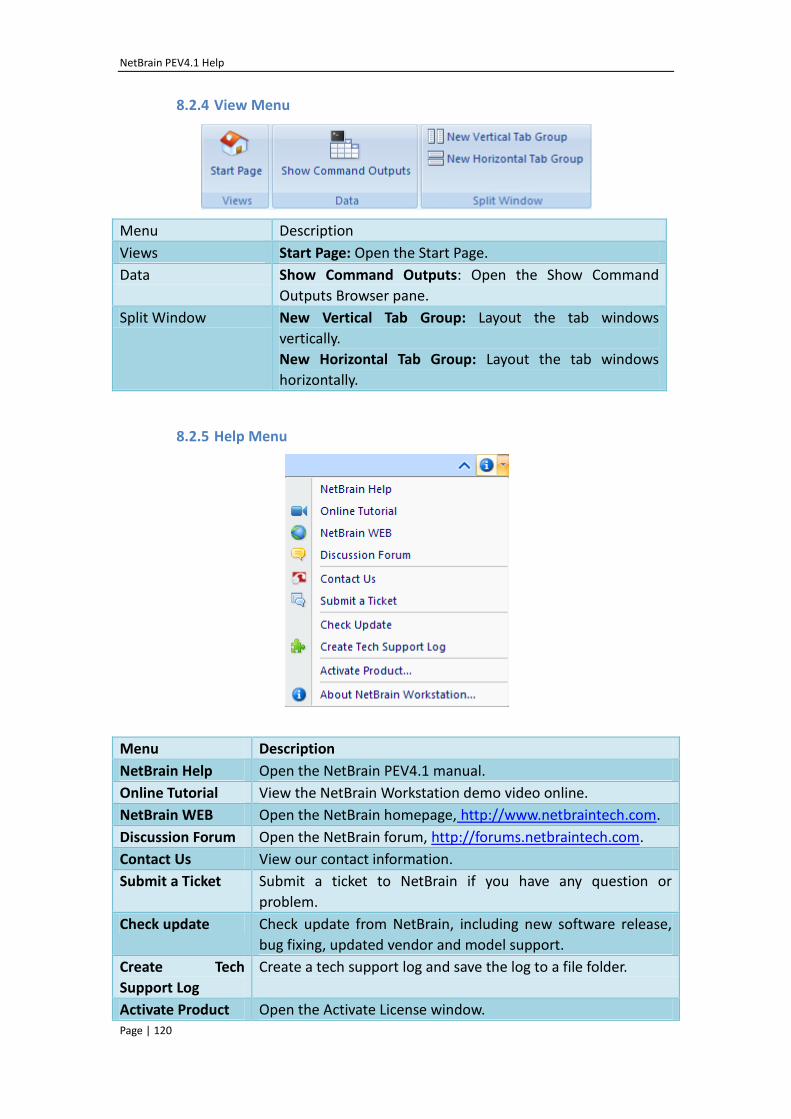
NetBrain PEV4.1 Help
Page | 120
8.2.4 View Menu
Menu Description
Views Start Page: Open the Start Page.
Data Show Command Outputs: Open the Show Command
Outputs Browser pane.
Split Window New Vertical Tab Group: Layout the tab windows
vertically.
New Horizontal Tab Group: Layout the tab windows
horizontally.
8.2.5 Help Menu
Menu Description
NetBrain Help Open the NetBrain PEV4.1 manual.
Online Tutorial View the NetBrain Workstation demo video online.
NetBrain WEB Open the NetBrain homepage, http://www.netbraintech.com.
Discussion Forum Open the NetBrain forum, http://forums.netbraintech.com.
Contact Us View our contact information.
Submit a Ticket Submit a ticket to NetBrain if you have any question or
problem.
Check update Check update from NetBrain, including new software release,
bug fixing, updated vendor and model support.
Create Tech
Support Log
Create a tech support log and save the log to a file folder.
Activate Product Open the Activate License window.
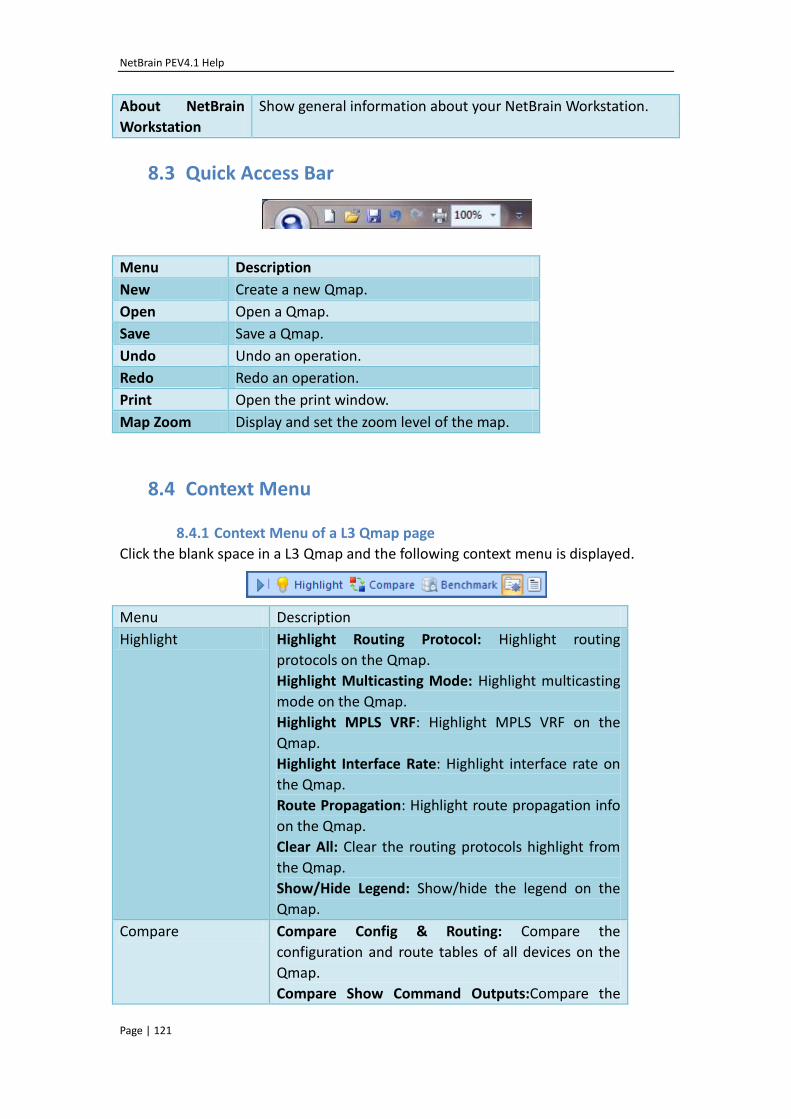
NetBrain PEV4.1 Help
Page | 121
About NetBrain
Workstation
Show general information about your NetBrain Workstation.
8.3 Quick Access Bar
Menu Description
New Create a new Qmap.
Open Open a Qmap.
Save Save a Qmap.
Undo Undo an operation.
Redo Redo an operation.
Print Open the print window.
Map Zoom Display and set the zoom level of the map.
8.4 Context Menu
8.4.1 Context Menu of a L3 Qmap page
Click the blank space in a L3 Qmap and the following context menu is displayed.
Menu Description
Highlight Highlight Routing Protocol: Highlight routing
protocols on the Qmap.
Highlight Multicasting Mode: Highlight multicasting
mode on the Qmap.
Highlight MPLS VRF: Highlight MPLS VRF on the
Qmap.
Highlight Interface Rate: Highlight interface rate on
the Qmap.
Route Propagation: Highlight route propagation info
on the Qmap.
Clear All: Clear the routing protocols highlight from
the Qmap.
Show/Hide Legend: Show/hide the legend on the
Qmap.
Compare Compare Config & Routing: Compare the
configuration and route tables of all devices on the
Qmap.
Compare Show Command Outputs:Compare the
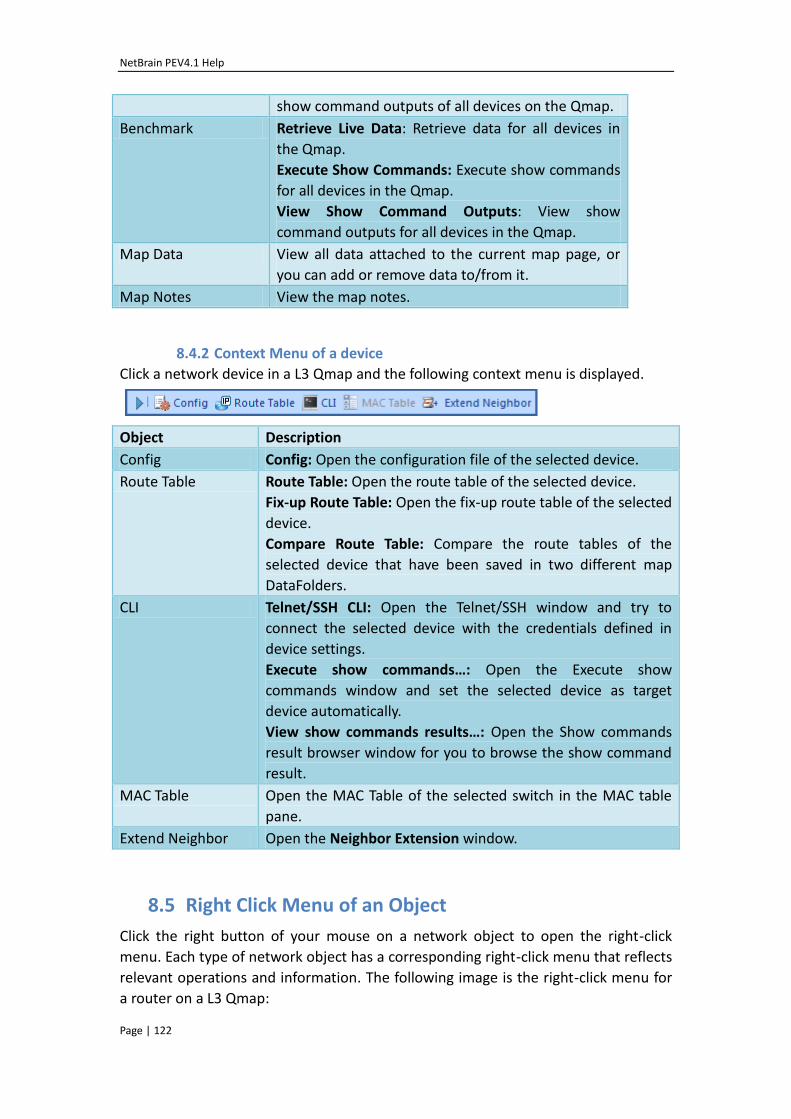
NetBrain PEV4.1 Help
Page | 122
show command outputs of all devices on the Qmap.
Benchmark Retrieve Live Data: Retrieve data for all devices in
the Qmap.
Execute Show Commands: Execute show commands
for all devices in the Qmap.
View Show Command Outputs: View show
command outputs for all devices in the Qmap.
Map Data View all data attached to the current map page, or
you can add or remove data to/from it.
Map Notes View the map notes.
8.4.2 Context Menu of a device
Click a network device in a L3 Qmap and the following context menu is displayed.
Object Description
Config Config: Open the configuration file of the selected device.
Route Table Route Table: Open the route table of the selected device.
Fix-up Route Table: Open the fix-up route table of the selected
device.
Compare Route Table: Compare the route tables of the
selected device that have been saved in two different map
DataFolders.
CLI Telnet/SSH CLI: Open the Telnet/SSH window and try to
connect the selected device with the credentials defined in
device settings.
Execute show commands…: Open the Execute show
commands window and set the selected device as target
device automatically.
View show commands results…: Open the Show commands
result browser window for you to browse the show command
result.
MAC Table Open the MAC Table of the selected switch in the MAC table
pane.
Extend Neighbor Open the Neighbor Extension window.
8.5 Right Click Menu of an Object
Click the right button of your mouse on a network object to open the right-click
menu. Each type of network object has a corresponding right-click menu that reflects
relevant operations and information. The following image is the right-click menu for
a router on a L3 Qmap:
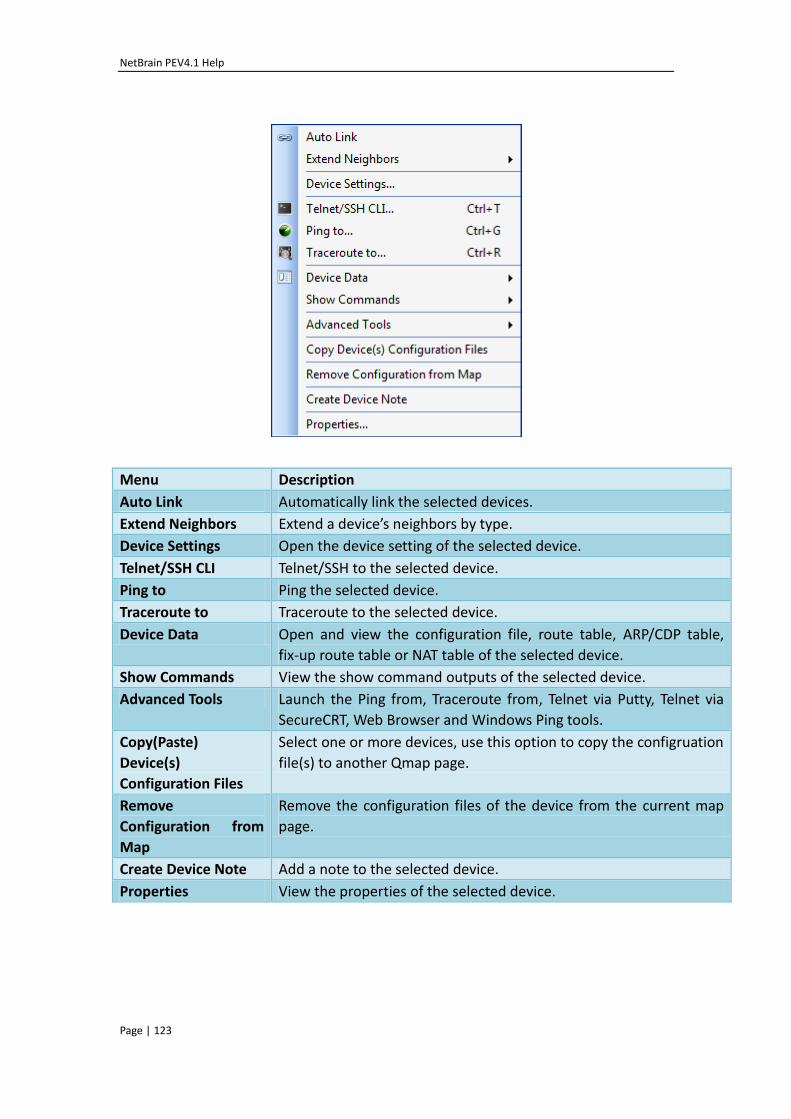
NetBrain PEV4.1 Help
Page | 123
Menu Description
Auto Link Automatically link the selected devices.
Extend Neighbors Extend a device’s neighbors by type.
Device Settings Open the device setting of the selected device.
Telnet/SSH CLI Telnet/SSH to the selected device.
Ping to Ping the selected device.
Traceroute to Traceroute to the selected device.
Device Data Open and view the configuration file, route table, ARP/CDP table,
fix-up route table or NAT table of the selected device.
Show Commands View the show command outputs of the selected device.
Advanced Tools Launch the Ping from, Traceroute from, Telnet via Putty, Telnet via
SecureCRT, Web Browser and Windows Ping tools.
Copy(Paste)
Device(s)
Configuration Files
Select one or more devices, use this option to copy the configruation
file(s) to another Qmap page.
Remove
Configuration from
Map
Remove the configuration files of the device from the current map
page.
Create Device Note Add a note to the selected device.
Properties View the properties of the selected device.
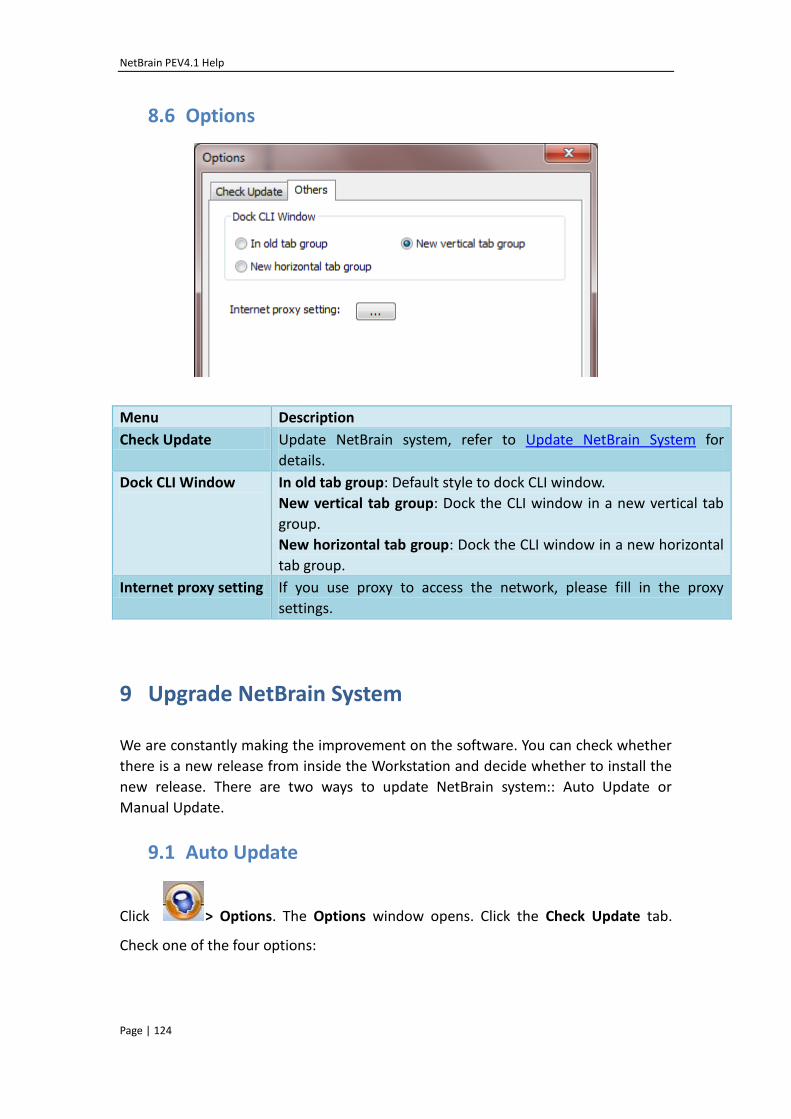
NetBrain PEV4.1 Help
Page | 124
8.6 Options
Menu Description
Check Update Update NetBrain system, refer to Update NetBrain System for
details.
Dock CLI Window
In old tab group: Default style to dock CLI window.
New vertical tab group: Dock the CLI window in a new vertical tab
group.
New horizontal tab group: Dock the CLI window in a new horizontal
tab group.
Internet proxy setting If you use proxy to access the network, please fill in the proxy
settings.
9 Upgrade NetBrain System
We are constantly making the improvement on the software. You can check whether
there is a new release from inside the Workstation and decide whether to install the
new release. There are two ways to update NetBrain system:: Auto Update or
Manual Update.
9.1 Auto Update
Click > Options. The Options window opens. Click the Check Update tab.
Check one of the four options:
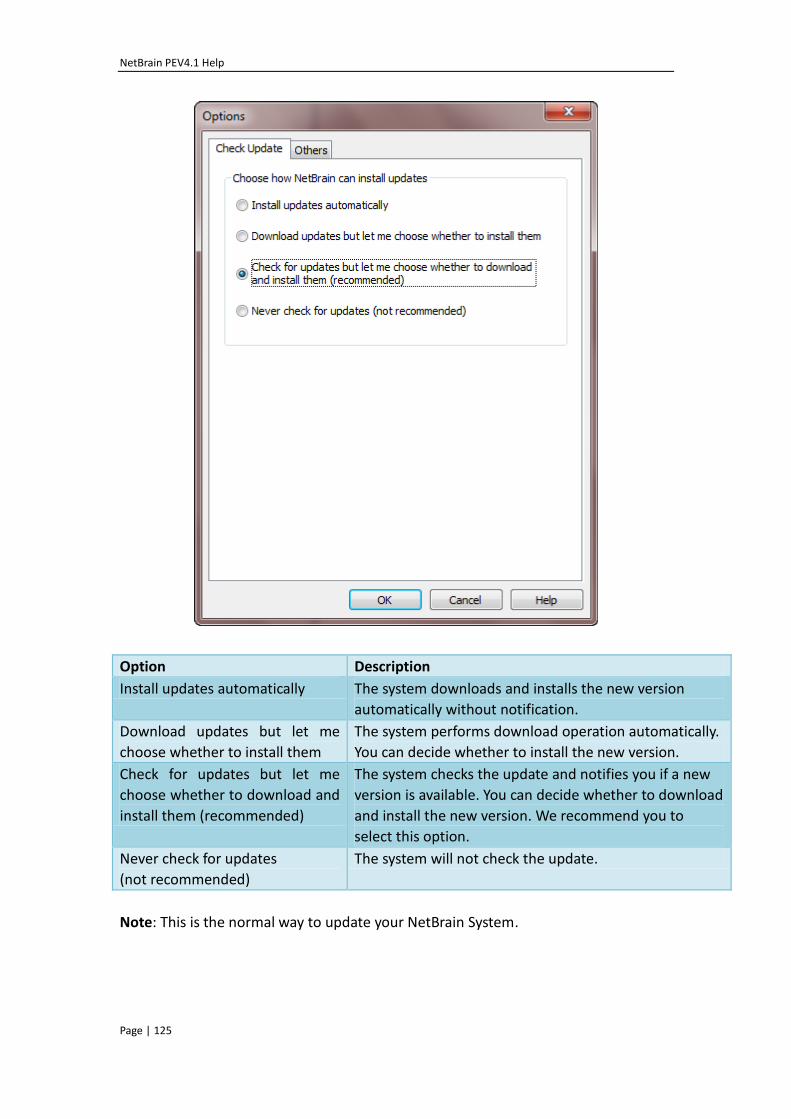
NetBrain PEV4.1 Help
Page | 125
Option Description
Install updates automatically The system downloads and installs the new version
automatically without notification.
Download updates but let me
choose whether to install them
The system performs download operation automatically.
You can decide whether to install the new version.
Check for updates but let me
choose whether to download and
install them (recommended)
The system checks the update and notifies you if a new
version is available. You can decide whether to download
and install the new version. We recommend you to
select this option.
Never check for updates
(not recommended)
The system will not check the update.
Note: This is the normal way to update your NetBrain System.
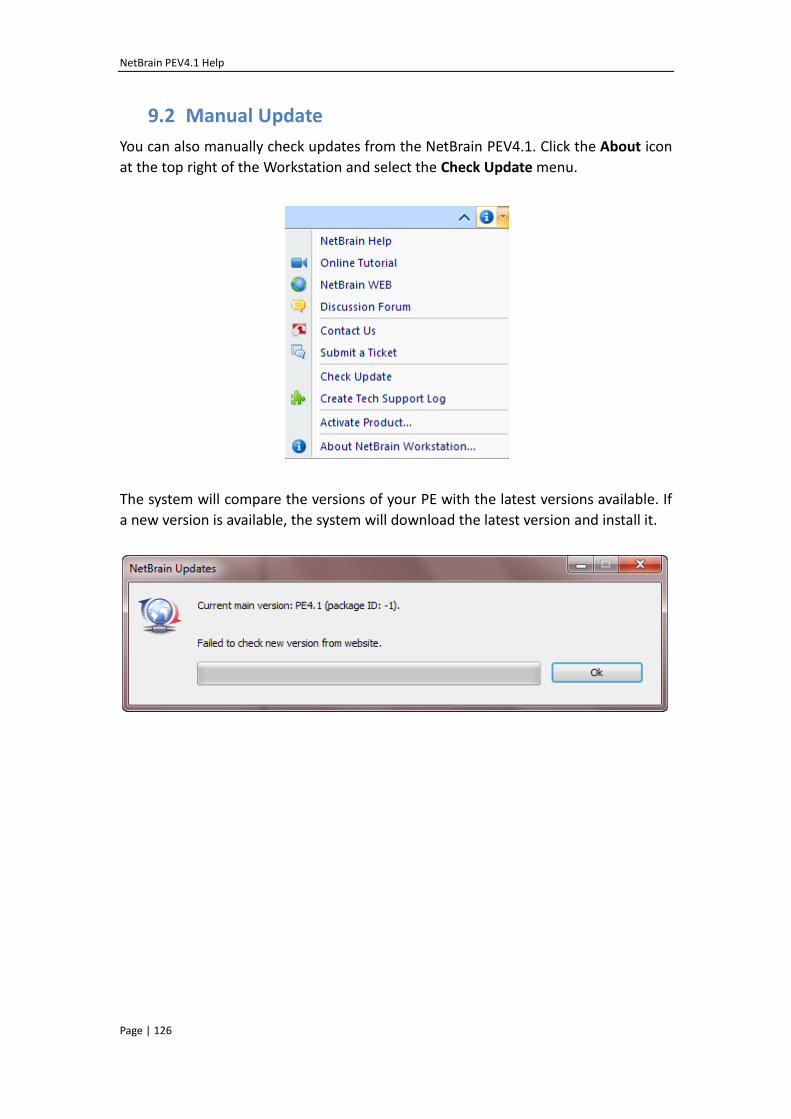
NetBrain PEV4.1 Help
Page | 126
9.2 Manual Update
You can also manually check updates from the NetBrain PEV4.1. Click the About icon
at the top right of the Workstation and select the Check Update menu.
The system will compare the versions of your PE with the latest versions available. If
a new version is available, the system will download the latest version and install it.