Embed Size (px)
Citation preview
Version 6.1 | Last Updated 02.25.2016 Copyright ©2016 NetBrain Technologies, Inc. All rights reserved.
NetBrain® Enterprise Edition 6.1
FEATURE HANDBOOK
Feature Handbook NetBrain® Enterprise Edition 6.1 | 2
Table of Contents
Main Features Content Page
1. Automate Network Mapping and Documentation 3
1.0 Overview: Dynamic Mapping Create data-driven maps on-demand 3
1.1 Visual Search of Network Data Instantly access and map network data 4
1.2 Methods of On-Demand Mapping Simple input, visual output 6
1.3 Deep Network Discovery Intelligence mining from the live network 9
1.4 Instantly Export Diagrams & Documents Automate documentation with ‘Data-Driven DCU’ 10
1.5 Dynamic Maps for Collaboration Collaborate for design reviews, troubleshooting, and more 13
2. Automate Troubleshooting 15
2.0 Overview: Visual Troubleshooting Map and analyze your network automatically to reduce MTTR 15
2.1 Traffic Path Analysis Analyze the traffic flow from a source to a destination 15
2.2 Qapp™ - Next Generation Network Automation
Customize built-in ‘map-driven’ capabilities with Qapps 18
2.3 Types of Qapp™ Functions Qapps for various network functions 19
2.4 Building a Qapp™ Create custom Qapps with built-in templates 26
2.5 Qapp™ Exchange Over 100 built-in Qapps 35
3. Automate Change Management and Verification 36
3.0 Overview: Change Management Manage network changes with dynamic maps 36
3.1 Define Changes on the Map Use dynamic maps to document complex design 36
3.2 Automatically Deploy Changes Push configuration changes with one-click 37
3.3 Automatically Verify Changes Analyze the total impact of changes instantly 38
3.4 Automatically Document Changes Document change process with one-click 38
4. Thin Client Interface (via Web Browser) 39
4.1 Thin Client Overview Introduction to the lightweight client 39
4.2 Administrator Login Management Vs. Client Mode 39
4.3 Overview Map Search the network, from anywhere 40
4.4 Search View shared maps, from anywhere 40
4.5 Dynamic Mapping View/Create Dynamic Maps (L3/L2, A/B Path) 41
4.6 Inventory Report View inventory reports, from anywhere 42
5. Performance, Scalability & Multi-Vendor Support 43
6. Integration with Existing NMS Systems 46
7. Miscellaneous 47
3 | Feature Handbook NetBrain® Enterprise Edition 6.1
Section 1: Automate Network Mapping and Documentation
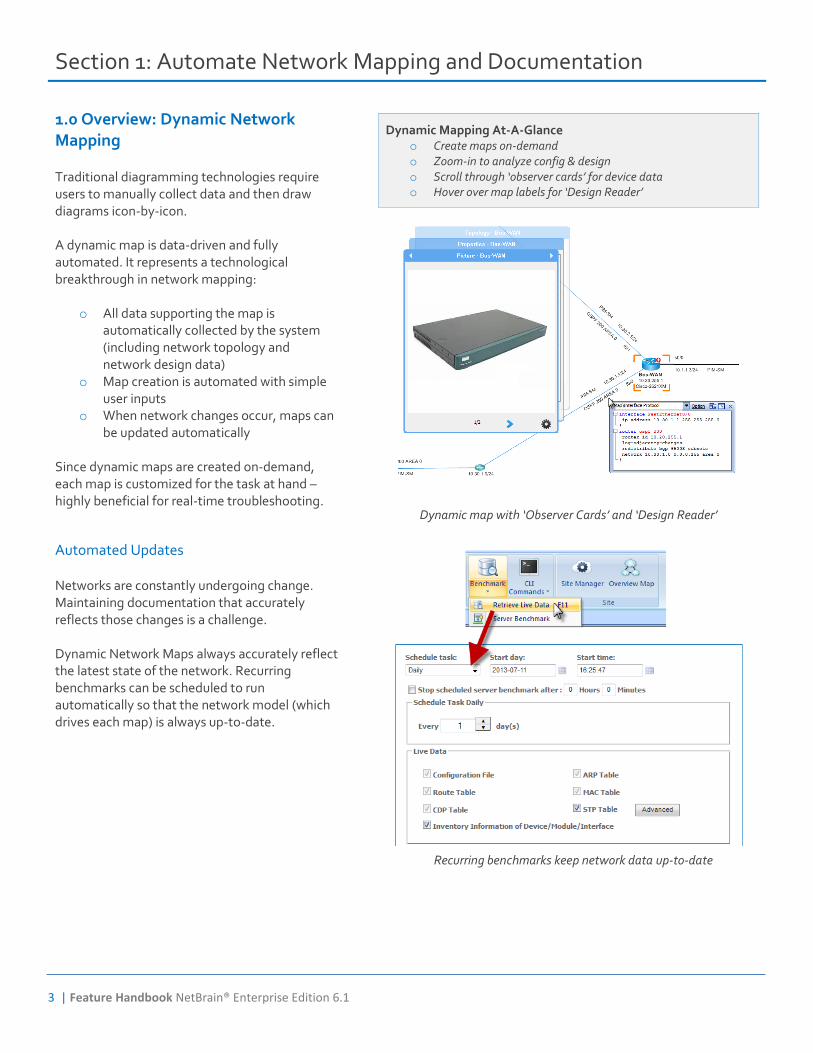
1.0 Overview: Dynamic Network Mapping Traditional diagramming technologies require users to manually collect data and then draw diagrams icon-by-icon. A dynamic map is data-driven and fully automated. It represents a technological breakthrough in network mapping:
o All data supporting the map is automatically collected by the system (including network topology and network design data)
o Map creation is automated with simple user inputs
o When network changes occur, maps can be updated automatically
Since dynamic maps are created on-demand, each map is customized for the task at hand – highly beneficial for real-time troubleshooting.
Dynamic Mapping At-A-Glance o Create maps on-demand o Zoom-in to analyze config & design o Scroll through ‘observer cards’ for device data o Hover over map labels for ‘Design Reader’
Dynamic map with ‘Observer Cards’ and ‘Design Reader’
Automated Updates Networks are constantly undergoing change. Maintaining documentation that accurately reflects those changes is a challenge. Dynamic Network Maps always accurately reflect the latest state of the network. Recurring benchmarks can be scheduled to run automatically so that the network model (which drives each map) is always up-to-date.
Recurring benchmarks keep network data up-to-date
Feature Handbook NetBrain® Enterprise Edition 6.1 | 4
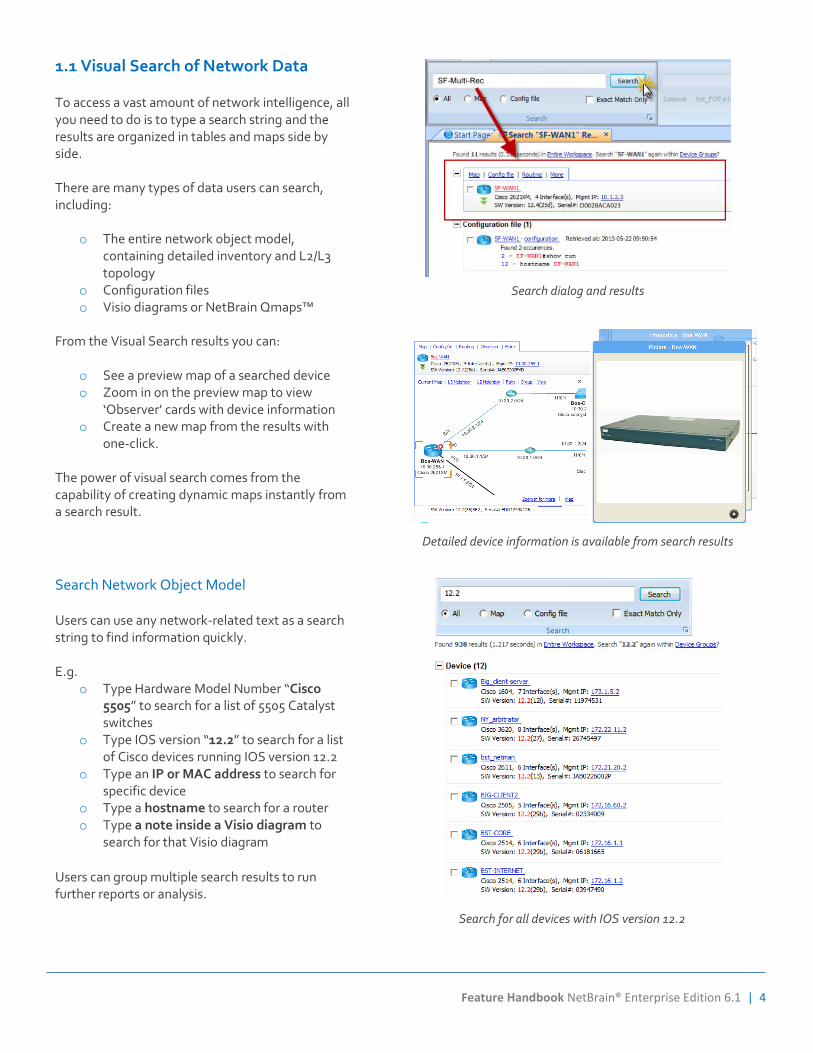
1.1 Visual Search of Network Data To access a vast amount of network intelligence, all you need to do is to type a search string and the results are organized in tables and maps side by side. There are many types of data users can search, including:
o The entire network object model, containing detailed inventory and L2/L3 topology
o Configuration files o Visio diagrams or NetBrain Qmaps™
From the Visual Search results you can:
o See a preview map of a searched device o Zoom in on the preview map to view
‘Observer’ cards with device information o Create a new map from the results with
one-click. The power of visual search comes from the capability of creating dynamic maps instantly from a search result.
Search dialog and results
Detailed device information is available from search results
Search Network Object Model Users can use any network-related text as a search string to find information quickly. E.g.
o Type Hardware Model Number “Cisco 5505” to search for a list of 5505 Catalyst switches
o Type IOS version “12.2” to search for a list of Cisco devices running IOS version 12.2
o Type an IP or MAC address to search for specific device
o Type a hostname to search for a router o Type a note inside a Visio diagram to
search for that Visio diagram
Users can group multiple search results to run further reports or analysis.
Search for all devices with IOS version 12.2
5 | Feature Handbook NetBrain® Enterprise Edition 6.1
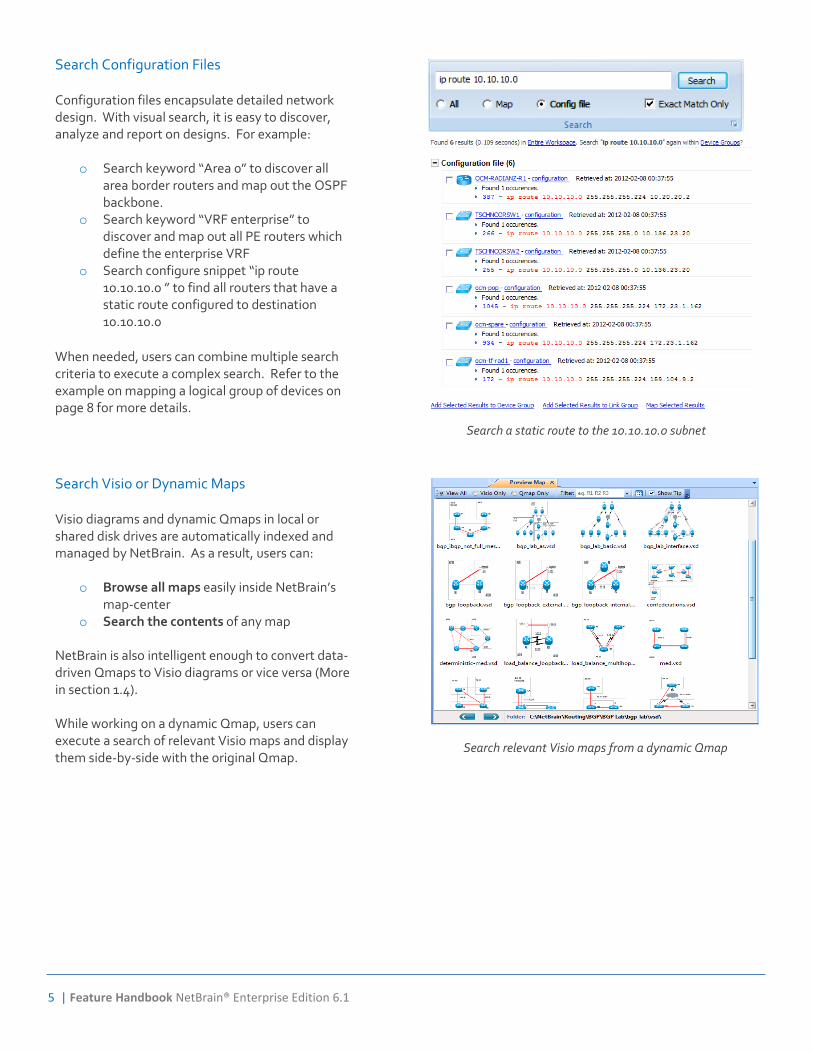
Search Configuration Files Configuration files encapsulate detailed network design. With visual search, it is easy to discover, analyze and report on designs. For example:
o Search keyword “Area 0” to discover all area border routers and map out the OSPF backbone.
o Search keyword “VRF enterprise” to discover and map out all PE routers which define the enterprise VRF
o Search configure snippet “ip route 10.10.10.0 ” to find all routers that have a static route configured to destination 10.10.10.0
When needed, users can combine multiple search criteria to execute a complex search. Refer to the example on mapping a logical group of devices on page 8 for more details.
Search a static route to the 10.10.10.0 subnet
Search Visio or Dynamic Maps Visio diagrams and dynamic Qmaps in local or shared disk drives are automatically indexed and managed by NetBrain. As a result, users can:
o Browse all maps easily inside NetBrain’s map-center
o Search the contents of any map
NetBrain is also intelligent enough to convert data-driven Qmaps to Visio diagrams or vice versa (More in section 1.4). While working on a dynamic Qmap, users can execute a search of relevant Visio maps and display them side-by-side with the original Qmap.
Search relevant Visio maps from a dynamic Qmap
Feature Handbook NetBrain® Enterprise Edition 6.1 | 6
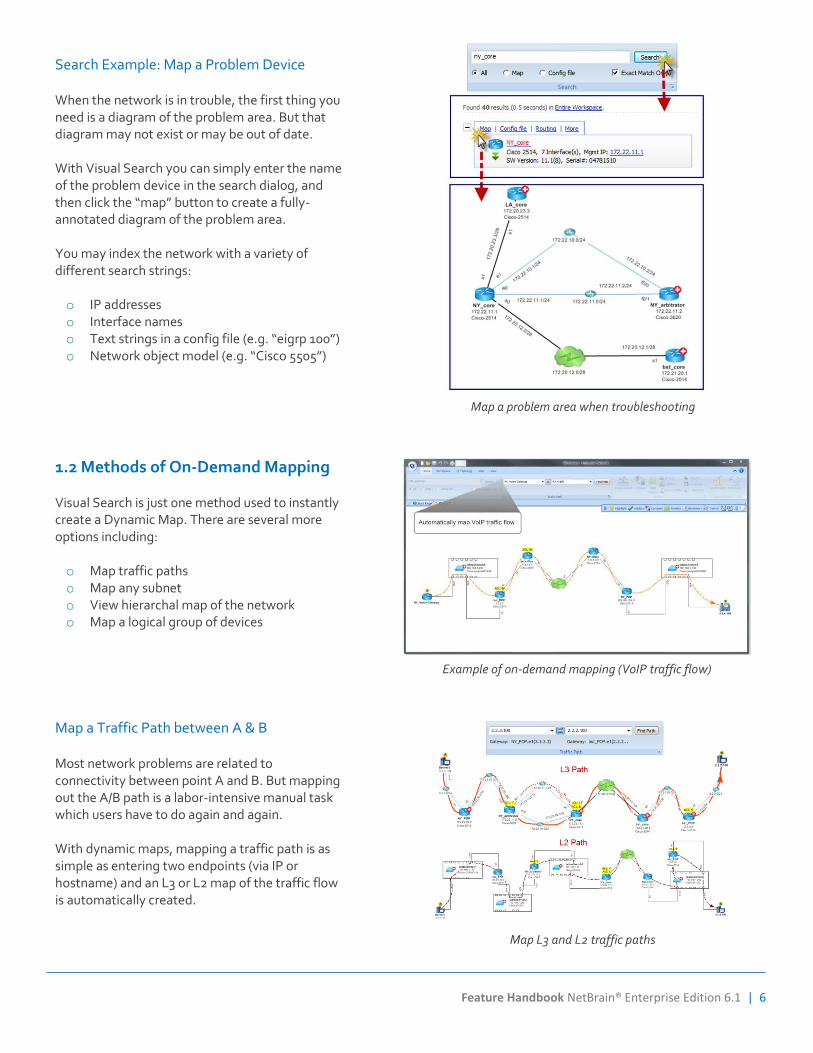
Search Example: Map a Problem Device When the network is in trouble, the first thing you need is a diagram of the problem area. But that diagram may not exist or may be out of date. With Visual Search you can simply enter the name of the problem device in the search dialog, and then click the “map” button to create a fully-annotated diagram of the problem area. You may index the network with a variety of different search strings: o IP addresses o Interface names o Text strings in a config file (e.g. “eigrp 100”) o Network object model (e.g. “Cisco 5505”)
Map a problem area when troubleshooting
1.2 Methods of On-Demand Mapping Visual Search is just one method used to instantly create a Dynamic Map. There are several more options including: o Map traffic paths o Map any subnet o View hierarchal map of the network o Map a logical group of devices
Example of on-demand mapping (VoIP traffic flow)
Map a Traffic Path between A & B Most network problems are related to connectivity between point A and B. But mapping out the A/B path is a labor-intensive manual task which users have to do again and again. With dynamic maps, mapping a traffic path is as simple as entering two endpoints (via IP or hostname) and an L3 or L2 map of the traffic flow is automatically created.
Map L3 and L2 traffic paths
7 | Feature Handbook NetBrain® Enterprise Edition 6.1
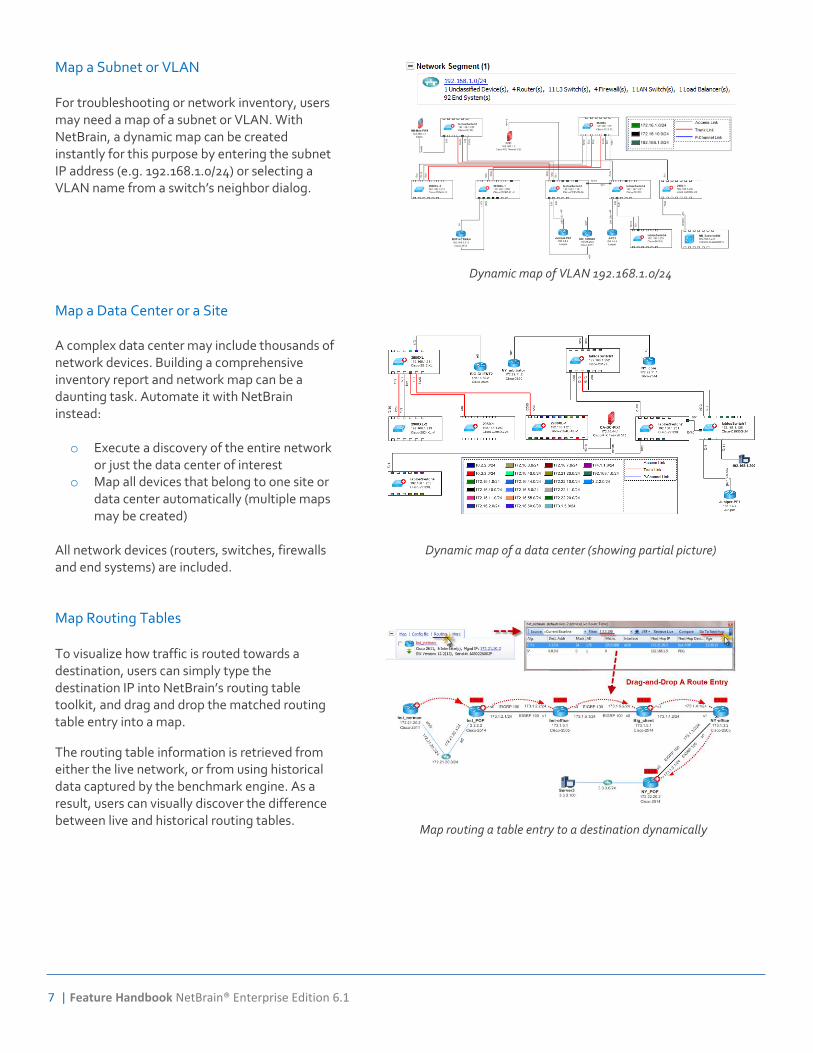
Map a Subnet or VLAN For troubleshooting or network inventory, users may need a map of a subnet or VLAN. With NetBrain, a dynamic map can be created instantly for this purpose by entering the subnet IP address (e.g. 192.168.1.0/24) or selecting a VLAN name from a switch’s neighbor dialog.
Dynamic map of VLAN 192.168.1.0/24
Map a Data Center or a Site A complex data center may include thousands of network devices. Building a comprehensive inventory report and network map can be a daunting task. Automate it with NetBrain instead: o Execute a discovery of the entire network
or just the data center of interest o Map all devices that belong to one site or
data center automatically (multiple maps may be created)
All network devices (routers, switches, firewalls and end systems) are included.
Dynamic map of a data center (showing partial picture)
Map Routing Tables To visualize how traffic is routed towards a destination, users can simply type the destination IP into NetBrain’s routing table toolkit, and drag and drop the matched routing table entry into a map.
The routing table information is retrieved from either the live network, or from using historical data captured by the benchmark engine. As a result, users can visually discover the difference between live and historical routing tables.
Map routing a table entry to a destination dynamically
Feature Handbook NetBrain® Enterprise Edition 6.1 | 8
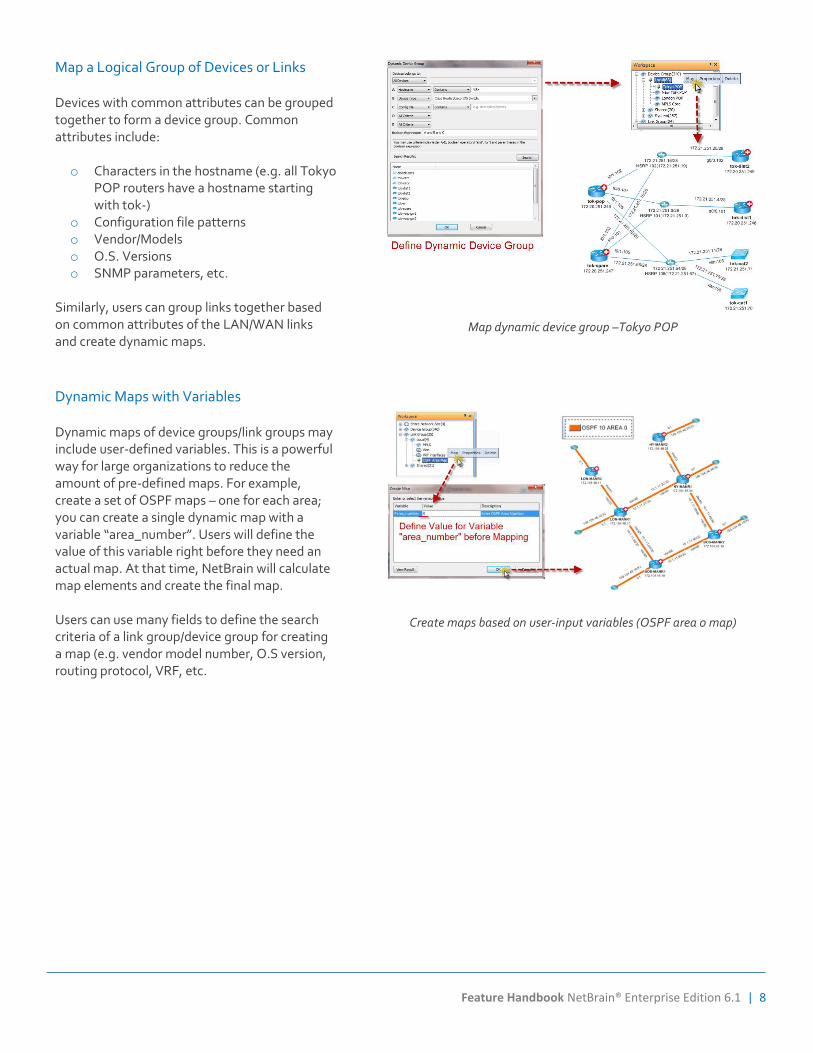
Map a Logical Group of Devices or Links Devices with common attributes can be grouped together to form a device group. Common attributes include: o Characters in the hostname (e.g. all Tokyo
POP routers have a hostname starting with tok-)
o Configuration file patterns o Vendor/Models o O.S. Versions o SNMP parameters, etc.
Similarly, users can group links together based on common attributes of the LAN/WAN links and create dynamic maps.
Map dynamic device group –Tokyo POP
Dynamic Maps with Variables Dynamic maps of device groups/link groups may include user-defined variables. This is a powerful way for large organizations to reduce the amount of pre-defined maps. For example, create a set of OSPF maps – one for each area; you can create a single dynamic map with a variable “area_number”. Users will define the value of this variable right before they need an actual map. At that time, NetBrain will calculate map elements and create the final map. Users can use many fields to define the search criteria of a link group/device group for creating a map (e.g. vendor model number, O.S version, routing protocol, VRF, etc.
Create maps based on user-input variables (OSPF area 0 map)
9 | Feature Handbook NetBrain® Enterprise Edition 6.1
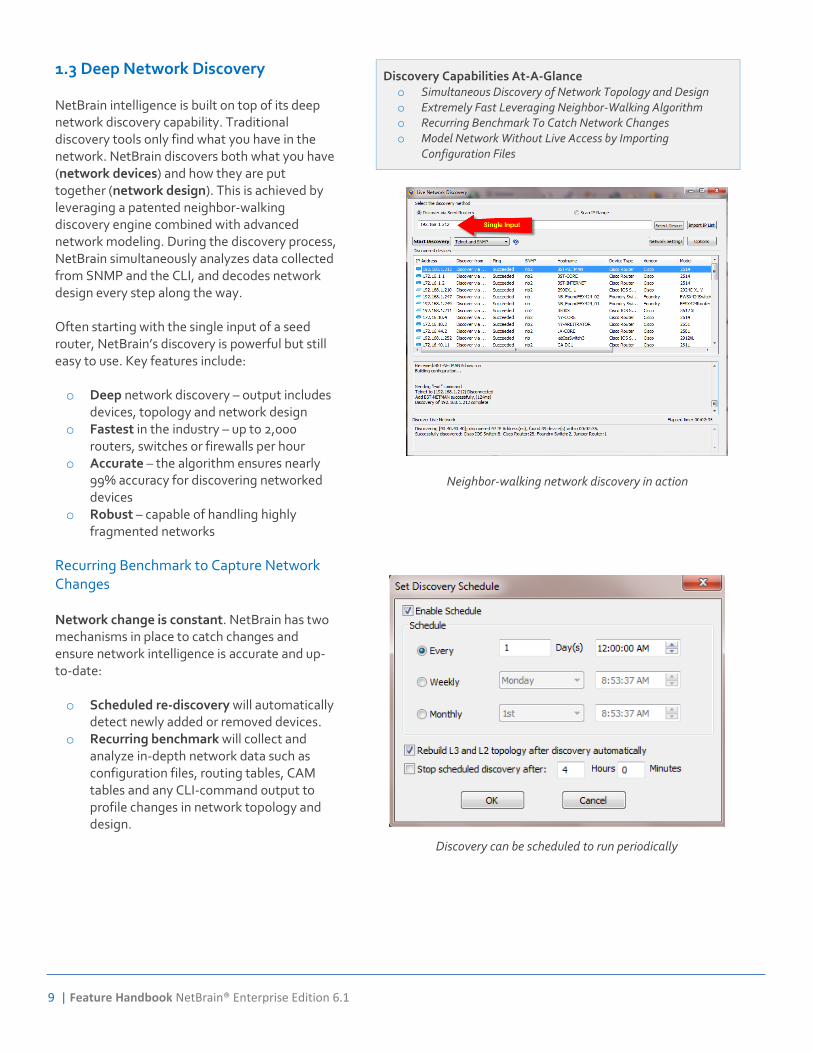
1.3 Deep Network Discovery NetBrain intelligence is built on top of its deep network discovery capability. Traditional discovery tools only find what you have in the network. NetBrain discovers both what you have (network devices) and how they are put together (network design). This is achieved by leveraging a patented neighbor-walking discovery engine combined with advanced network modeling. During the discovery process, NetBrain simultaneously analyzes data collected from SNMP and the CLI, and decodes network design every step along the way. Often starting with the single input of a seed router, NetBrain’s discovery is powerful but still easy to use. Key features include: o Deep network discovery – output includes
devices, topology and network design o Fastest in the industry – up to 2,000
routers, switches or firewalls per hour o Accurate – the algorithm ensures nearly
99% accuracy for discovering networked devices
o Robust – capable of handling highly fragmented networks
Discovery Capabilities At-A-Glance o Simultaneous Discovery of Network Topology and Design o Extremely Fast Leveraging Neighbor-Walking Algorithm o Recurring Benchmark To Catch Network Changes o Model Network Without Live Access by Importing
Configuration Files
Neighbor-walking network discovery in action
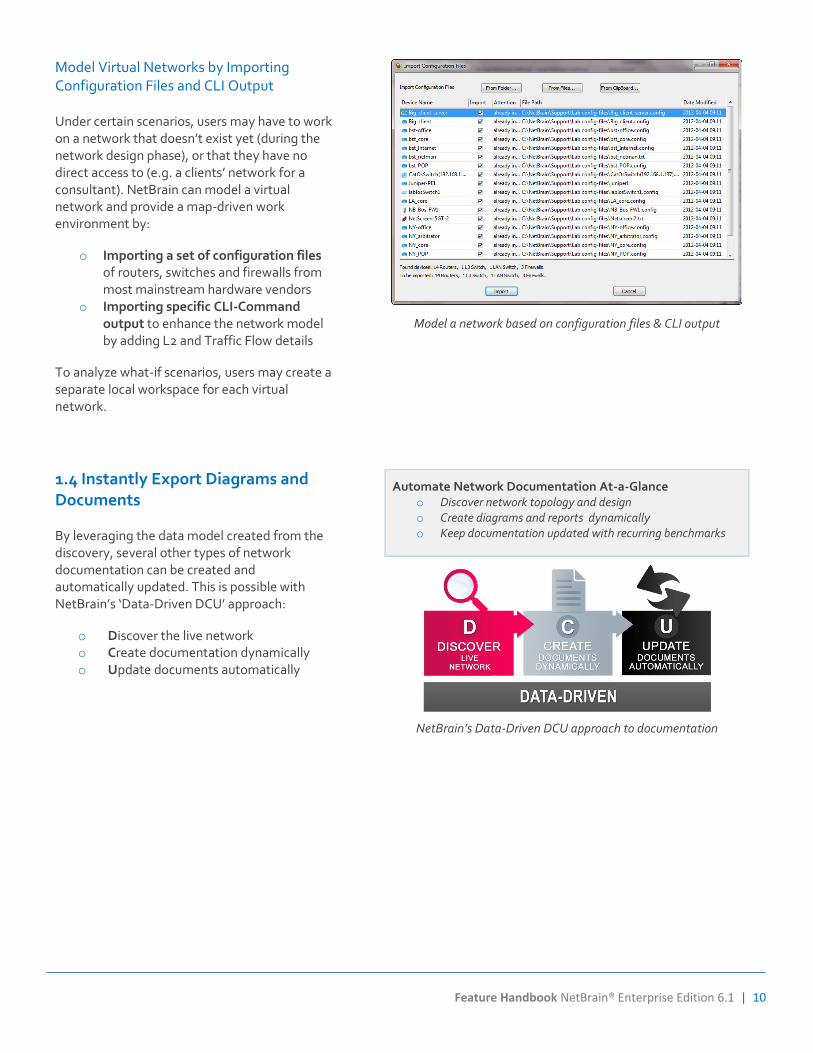
Recurring Benchmark to Capture Network Changes Network change is constant. NetBrain has two mechanisms in place to catch changes and ensure network intelligence is accurate and up-to-date: o Scheduled re-discovery will automatically
detect newly added or removed devices. o Recurring benchmark will collect and
analyze in-depth network data such as configuration files, routing tables, CAM tables and any CLI-command output to profile changes in network topology and design.
Discovery can be scheduled to run periodically
Feature Handbook NetBrain® Enterprise Edition 6.1 | 10
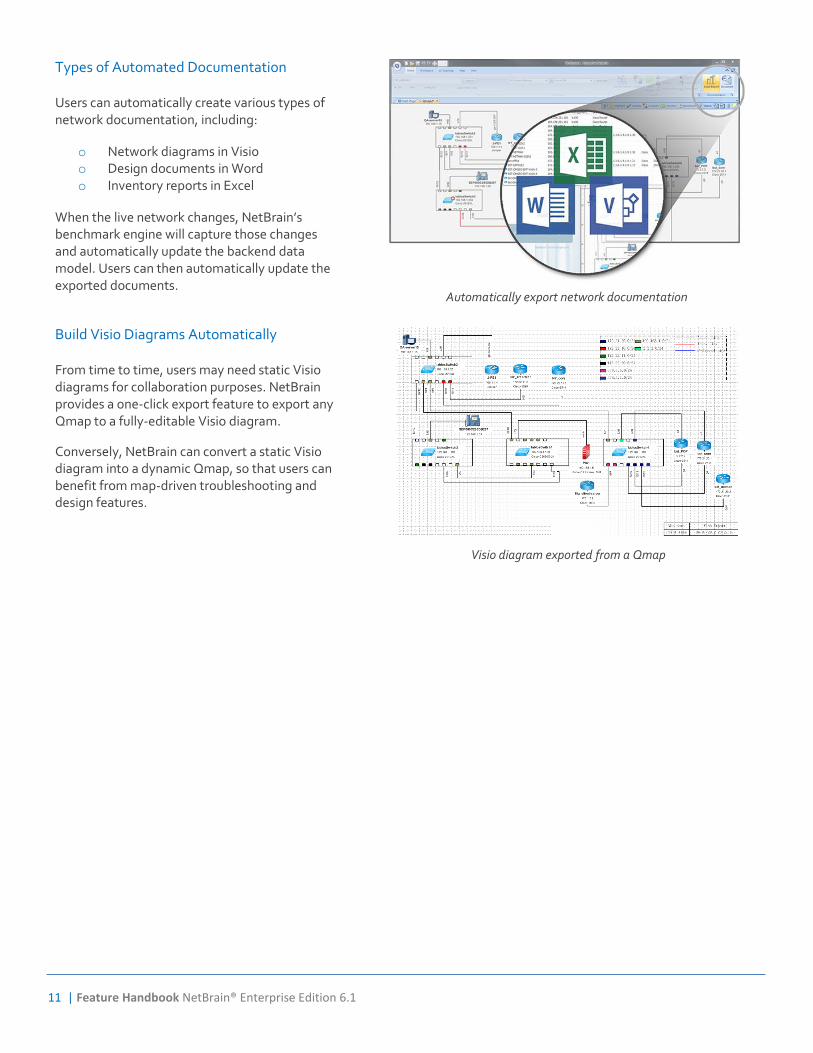
Model Virtual Networks by Importing Configuration Files and CLI Output Under certain scenarios, users may have to work on a network that doesn’t exist yet (during the network design phase), or that they have no direct access to (e.g. a clients’ network for a consultant). NetBrain can model a virtual network and provide a map-driven work environment by:
o Importing a set of configuration files of routers, switches and firewalls from most mainstream hardware vendors
o Importing specific CLI-Command output to enhance the network model by adding L2 and Traffic Flow details
To analyze what-if scenarios, users may create a separate local workspace for each virtual network.
Model a network based on configuration files & CLI output
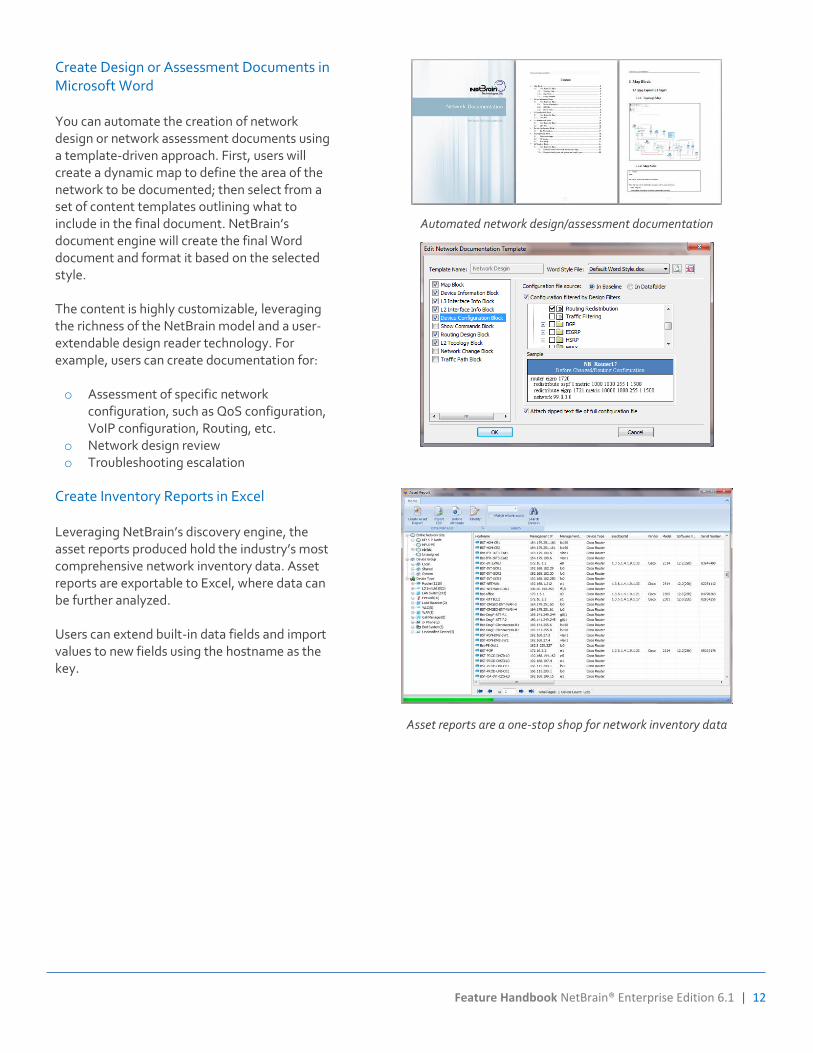
1.4 Instantly Export Diagrams and Documents By leveraging the data model created from the discovery, several other types of network documentation can be created and automatically updated. This is possible with NetBrain’s ‘Data-Driven DCU’ approach:
o Discover the live network o Create documentation dynamically o Update documents automatically
Automate Network Documentation At-a-Glance o Discover network topology and design o Create diagrams and reports dynamically o Keep documentation updated with recurring benchmarks
NetBrain’s Data-Driven DCU approach to documentation
11 | Feature Handbook NetBrain® Enterprise Edition 6.1
Types of Automated Documentation Users can automatically create various types of network documentation, including:
o Network diagrams in Visio o Design documents in Word o Inventory reports in Excel
When the live network changes, NetBrain’s benchmark engine will capture those changes and automatically update the backend data model. Users can then automatically update the exported documents.
Automatically export network documentation
Build Visio Diagrams Automatically From time to time, users may need static Visio diagrams for collaboration purposes. NetBrain provides a one-click export feature to export any Qmap to a fully-editable Visio diagram.
Conversely, NetBrain can convert a static Visio diagram into a dynamic Qmap, so that users can benefit from map-driven troubleshooting and design features.
Visio diagram exported from a Qmap
Feature Handbook NetBrain® Enterprise Edition 6.1 | 12
Create Design or Assessment Documents in Microsoft Word You can automate the creation of network design or network assessment documents using a template-driven approach. First, users will create a dynamic map to define the area of the network to be documented; then select from a set of content templates outlining what to include in the final document. NetBrain’s document engine will create the final Word document and format it based on the selected style. The content is highly customizable, leveraging the richness of the NetBrain model and a user-extendable design reader technology. For example, users can create documentation for: o Assessment of specific network
configuration, such as QoS configuration, VoIP configuration, Routing, etc.
o Network design review o Troubleshooting escalation
Automated network design/assessment documentation
Create Inventory Reports in Excel Leveraging NetBrain’s discovery engine, the asset reports produced hold the industry’s most comprehensive network inventory data. Asset reports are exportable to Excel, where data can be further analyzed. Users can extend built-in data fields and import values to new fields using the hostname as the key.
Asset reports are a one-stop shop for network inventory data
13 | Feature Handbook NetBrain® Enterprise Edition 6.1
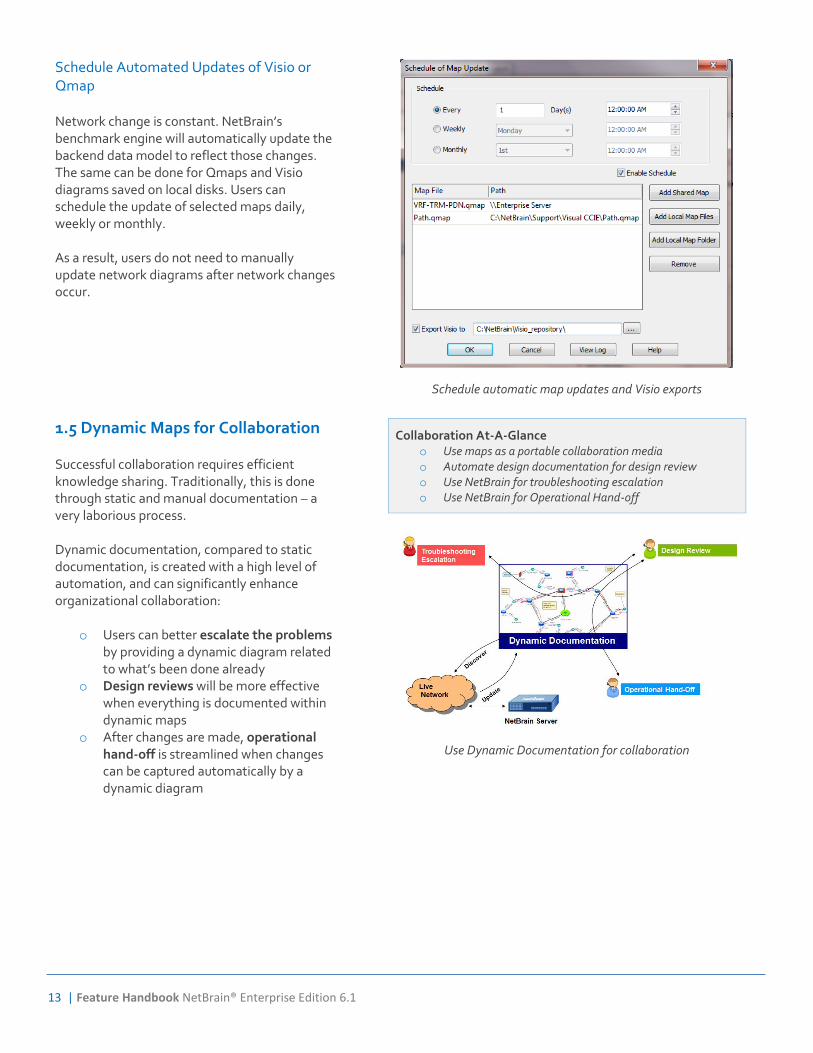
Schedule Automated Updates of Visio or Qmap Network change is constant. NetBrain’s benchmark engine will automatically update the backend data model to reflect those changes. The same can be done for Qmaps and Visio diagrams saved on local disks. Users can schedule the update of selected maps daily, weekly or monthly. As a result, users do not need to manually update network diagrams after network changes occur.
Schedule automatic map updates and Visio exports
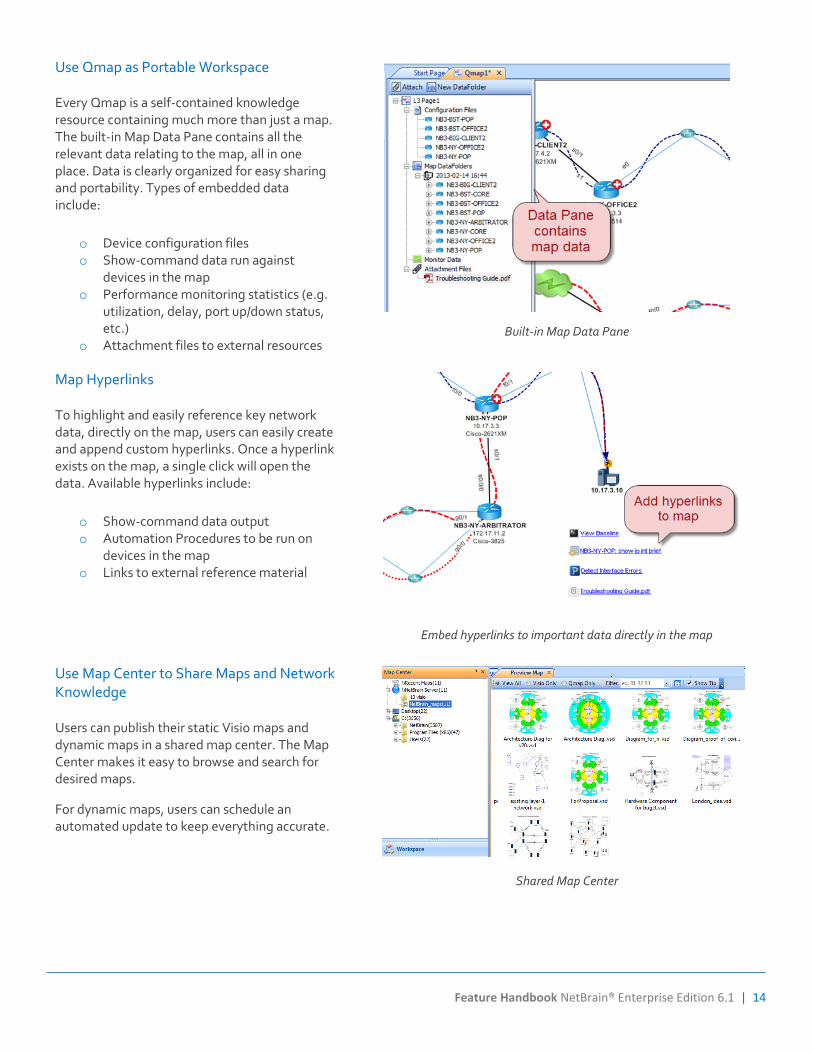
1.5 Dynamic Maps for Collaboration Successful collaboration requires efficient knowledge sharing. Traditionally, this is done through static and manual documentation – a very laborious process. Dynamic documentation, compared to static documentation, is created with a high level of automation, and can significantly enhance organizational collaboration:
o Users can better escalate the problems by providing a dynamic diagram related to what’s been done already
o Design reviews will be more effective when everything is documented within dynamic maps
o After changes are made, operational hand-off is streamlined when changes can be captured automatically by a dynamic diagram
Collaboration At-A-Glance o Use maps as a portable collaboration media o Automate design documentation for design review o Use NetBrain for troubleshooting escalation o Use NetBrain for Operational Hand-off
Use Dynamic Documentation for collaboration
Feature Handbook NetBrain® Enterprise Edition 6.1 | 14
Use Qmap as Portable Workspace Every Qmap is a self-contained knowledge resource containing much more than just a map. The built-in Map Data Pane contains all the relevant data relating to the map, all in one place. Data is clearly organized for easy sharing and portability. Types of embedded data include:
o Device configuration files o Show-command data run against
devices in the map o Performance monitoring statistics (e.g.
utilization, delay, port up/down status, etc.)
o Attachment files to external resources
Built-in Map Data Pane
Map Hyperlinks To highlight and easily reference key network data, directly on the map, users can easily create and append custom hyperlinks. Once a hyperlink exists on the map, a single click will open the data. Available hyperlinks include:
o Show-command data output o Automation Procedures to be run on
devices in the map o Links to external reference material
Embed hyperlinks to important data directly in the map
Use Map Center to Share Maps and Network Knowledge Users can publish their static Visio maps and dynamic maps in a shared map center. The Map Center makes it easy to browse and search for desired maps.
For dynamic maps, users can schedule an automated update to keep everything accurate.
Shared Map Center
15 | Feature Handbook NetBrain® Enterprise Edition 6.1
Section 2: Automate Troubleshooting
2.0 Overview: Visual Troubleshooting Network monitoring tools help to detect network outages but the steps to diagnose a detected alarm involves a lot of data collection and are almost always manual. NetBrain’s dynamic maps provide deep visibility into the network’s configuration, live performance, and even recent changes to the network. This level of map-driven analysis and diagnosis eliminates the need to collect data from the CLI during troubleshooting, making critical information visibly accessible.
NetBrain makes network troubleshooting even faster with a unique network ‘app’ technology called Qapp™. Users can write their own NetBrain apps through a vendor-independent Visual Programming Environment.
Troubleshooting At-A-Glance with a Dynamic Map 1. Use dynamic maps to visualize problem areas 2. Run ‘Apps’ to diagnose the network:
o Analyze configuration and design from the map o Run live performance analysis from the map o Execute Historical analysis from the map
Map-Driven Analysis and Live Performance Monitoring
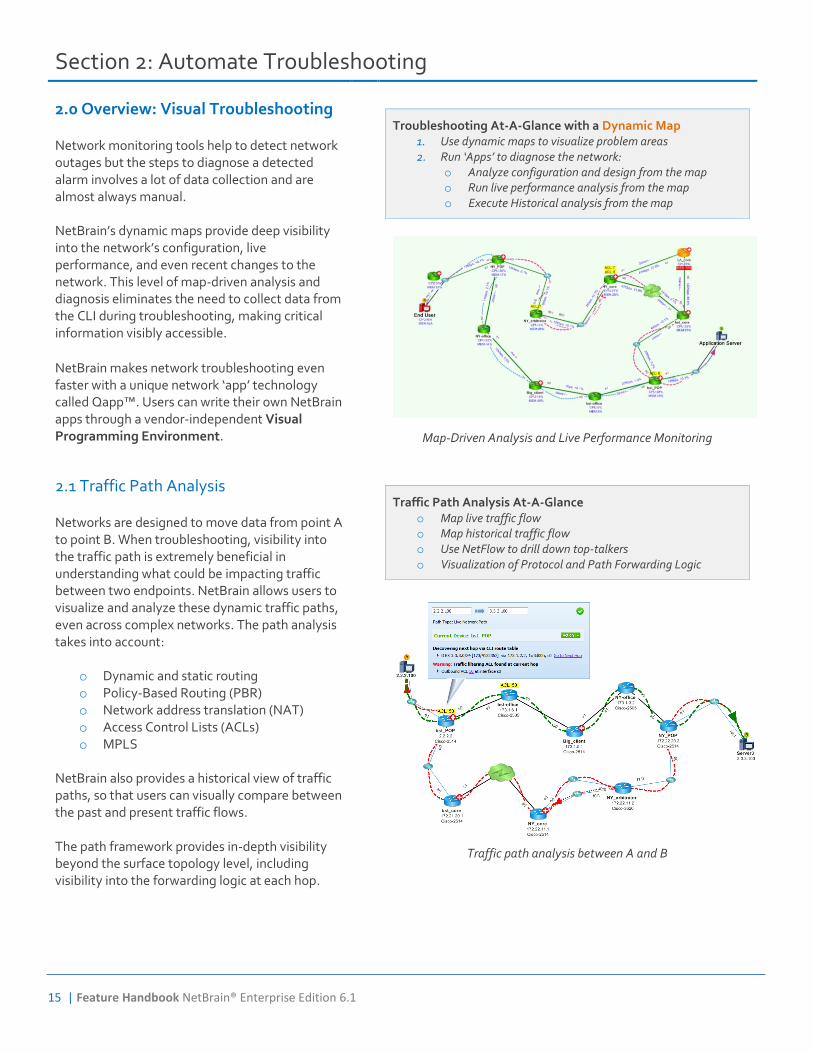
2.1 Traffic Path Analysis Networks are designed to move data from point A to point B. When troubleshooting, visibility into the traffic path is extremely beneficial in understanding what could be impacting traffic between two endpoints. NetBrain allows users to visualize and analyze these dynamic traffic paths, even across complex networks. The path analysis takes into account:
o Dynamic and static routing o Policy-Based Routing (PBR) o Network address translation (NAT) o Access Control Lists (ACLs) o MPLS
NetBrain also provides a historical view of traffic paths, so that users can visually compare between the past and present traffic flows. The path framework provides in-depth visibility beyond the surface topology level, including visibility into the forwarding logic at each hop.
Traffic Path Analysis At-A-Glance o Map live traffic flow o Map historical traffic flow o Use NetFlow to drill down top-talkers o Visualization of Protocol and Path Forwarding Logic
Traffic path analysis between A and B
Feature Handbook NetBrain® Enterprise Edition 6.1 | 16
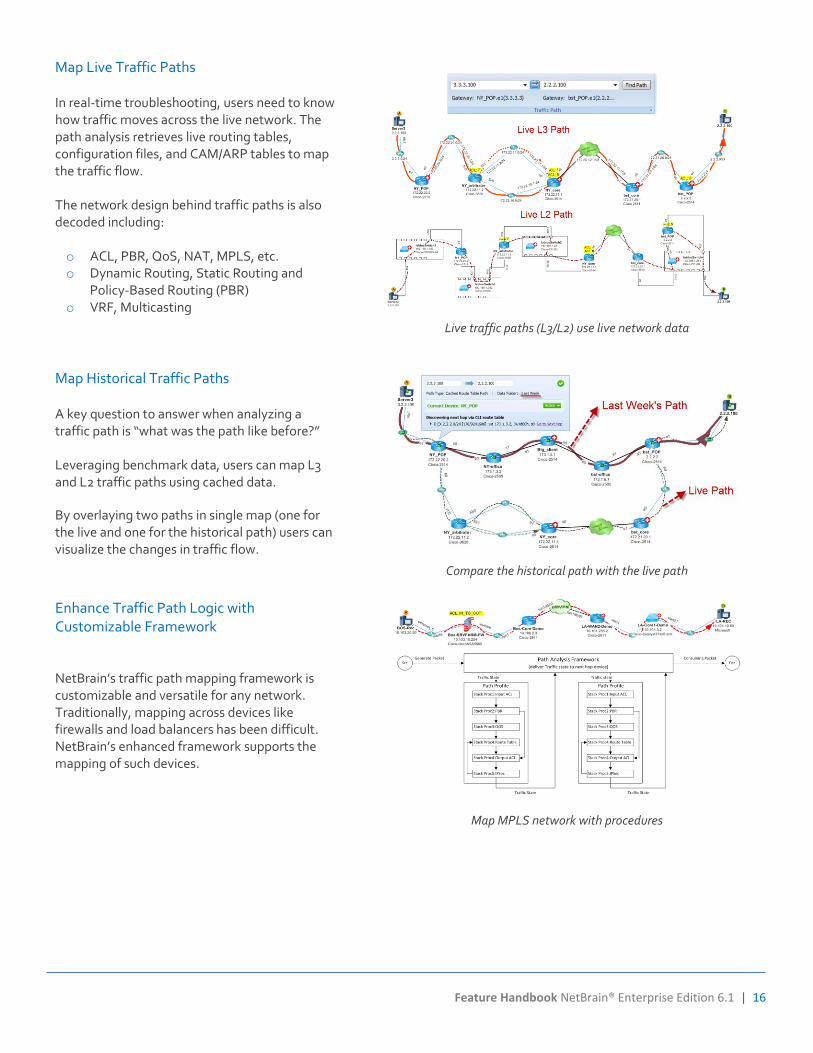
Map Live Traffic Paths In real-time troubleshooting, users need to know how traffic moves across the live network. The path analysis retrieves live routing tables, configuration files, and CAM/ARP tables to map the traffic flow. The network design behind traffic paths is also decoded including: o ACL, PBR, QoS, NAT, MPLS, etc. o Dynamic Routing, Static Routing and
Policy-Based Routing (PBR) o VRF, Multicasting
Live traffic paths (L3/L2) use live network data
Map Historical Traffic Paths A key question to answer when analyzing a traffic path is “what was the path like before?” Leveraging benchmark data, users can map L3 and L2 traffic paths using cached data.
By overlaying two paths in single map (one for the live and one for the historical path) users can visualize the changes in traffic flow.
Compare the historical path with the live path
Enhance Traffic Path Logic with Customizable Framework
NetBrain’s traffic path mapping framework is customizable and versatile for any network. Traditionally, mapping across devices like firewalls and load balancers has been difficult. NetBrain’s enhanced framework supports the mapping of such devices.
Map MPLS network with procedures
17 | Feature Handbook NetBrain® Enterprise Edition 6.1
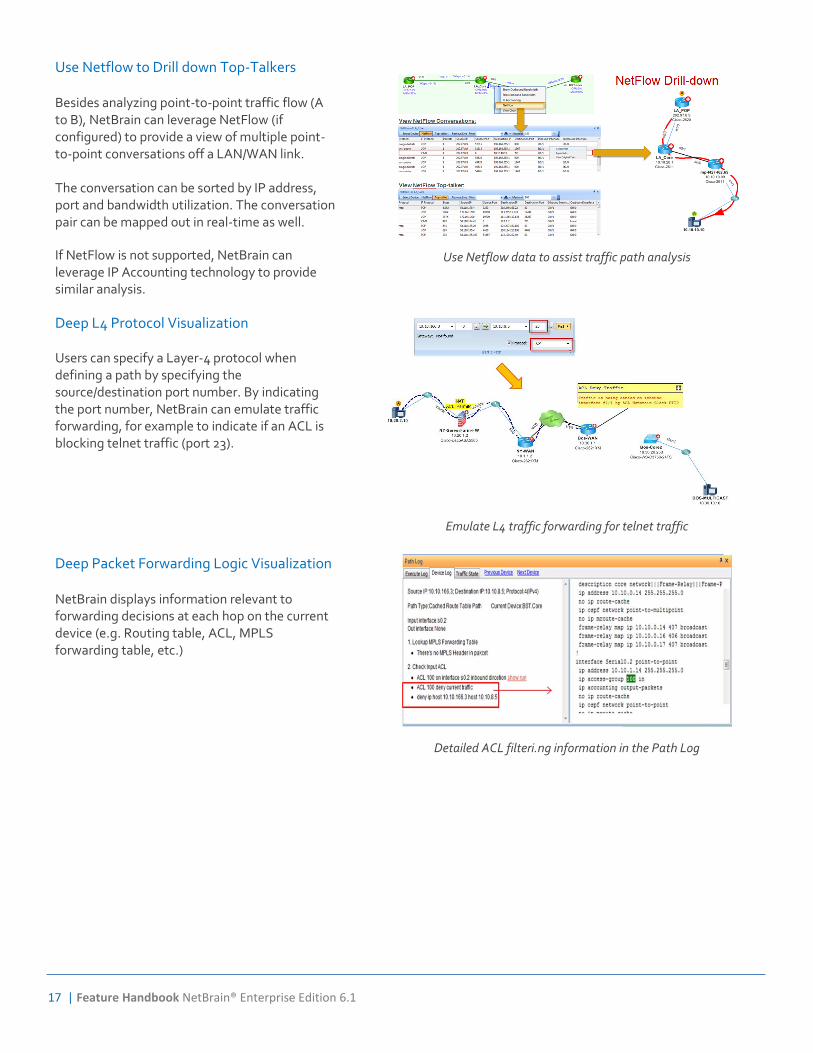
Use Netflow to Drill down Top-Talkers Besides analyzing point-to-point traffic flow (A to B), NetBrain can leverage NetFlow (if configured) to provide a view of multiple point-to-point conversations off a LAN/WAN link. The conversation can be sorted by IP address, port and bandwidth utilization. The conversation pair can be mapped out in real-time as well.
If NetFlow is not supported, NetBrain can leverage IP Accounting technology to provide similar analysis.
Use Netflow data to assist traffic path analysis
Deep L4 Protocol Visualization Users can specify a Layer-4 protocol when defining a path by specifying the source/destination port number. By indicating the port number, NetBrain can emulate traffic forwarding, for example to indicate if an ACL is blocking telnet traffic (port 23).
Emulate L4 traffic forwarding for telnet traffic
Deep Packet Forwarding Logic Visualization NetBrain displays information relevant to forwarding decisions at each hop on the current device (e.g. Routing table, ACL, MPLS forwarding table, etc.)
Detailed ACL filteri.ng information in the Path Log
Feature Handbook NetBrain® Enterprise Edition 6.1 | 18
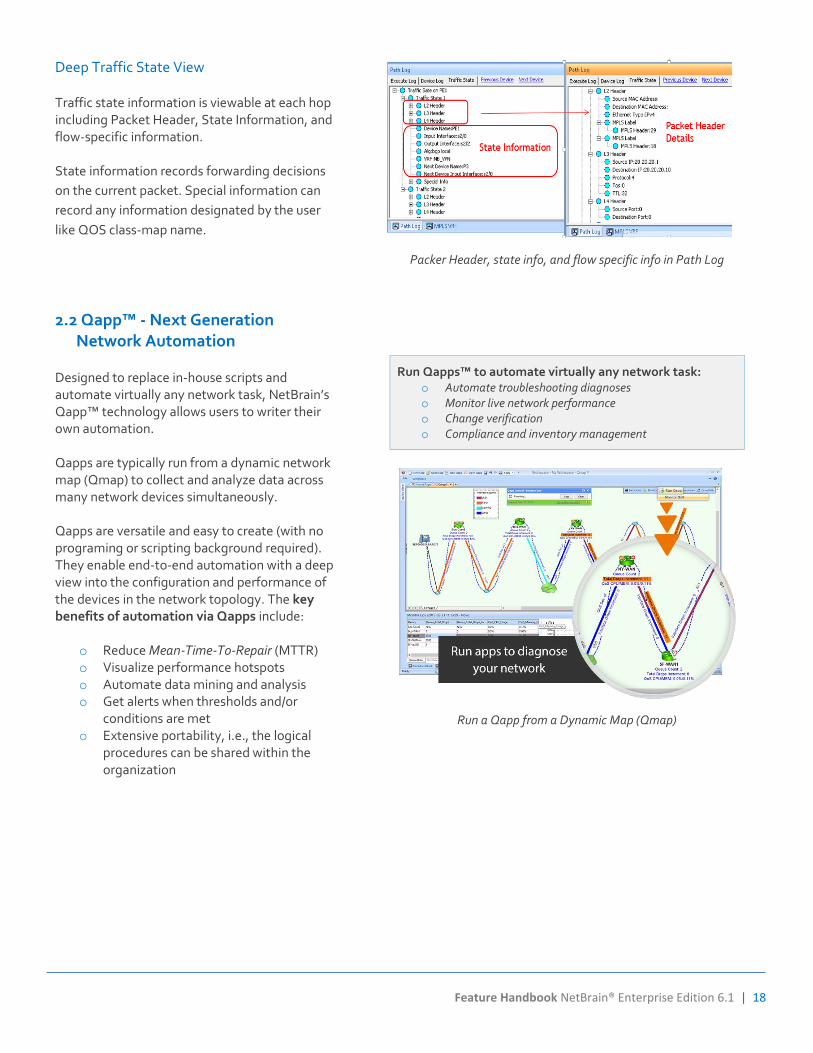
Deep Traffic State View Traffic state information is viewable at each hop including Packet Header, State Information, and flow-specific information. State information records forwarding decisions
on the current packet. Special information can
record any information designated by the user
like QOS class-map name.
Packer Header, state info, and flow specific info in Path Log
2.2 Qapp™ - Next Generation Network Automation
Designed to replace in-house scripts and automate virtually any network task, NetBrain’s Qapp™ technology allows users to writer their own automation. Qapps are typically run from a dynamic network map (Qmap) to collect and analyze data across many network devices simultaneously. Qapps are versatile and easy to create (with no programing or scripting background required). They enable end-to-end automation with a deep view into the configuration and performance of the devices in the network topology. The key benefits of automation via Qapps include:
o Reduce Mean-Time-To-Repair (MTTR) o Visualize performance hotspots o Automate data mining and analysis o Get alerts when thresholds and/or
conditions are met o Extensive portability, i.e., the logical
procedures can be shared within the organization
Run Qapps™ to automate virtually any network task: o Automate troubleshooting diagnoses o Monitor live network performance o Change verification o Compliance and inventory management
Run a Qapp from a Dynamic Map (Qmap)
19 | Feature Handbook NetBrain® Enterprise Edition 6.1
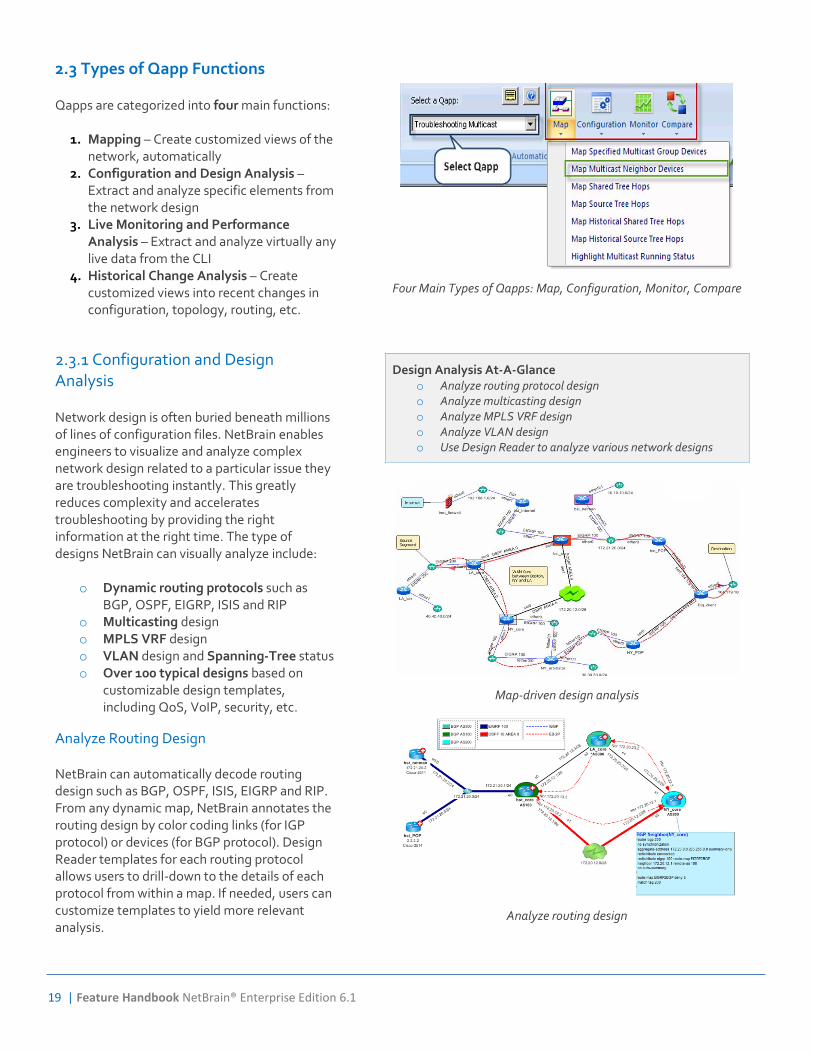
2.3 Types of Qapp Functions Qapps are categorized into four main functions:
1. Mapping – Create customized views of the network, automatically
2. Configuration and Design Analysis –Extract and analyze specific elements from the network design
3. Live Monitoring and Performance Analysis – Extract and analyze virtually any live data from the CLI
4. Historical Change Analysis – Create customized views into recent changes in configuration, topology, routing, etc.
Four Main Types of Qapps: Map, Configuration, Monitor, Compare
2.3.1 Configuration and Design Analysis Network design is often buried beneath millions of lines of configuration files. NetBrain enables engineers to visualize and analyze complex network design related to a particular issue they are troubleshooting instantly. This greatly reduces complexity and accelerates troubleshooting by providing the right information at the right time. The type of designs NetBrain can visually analyze include:
o Dynamic routing protocols such as BGP, OSPF, EIGRP, ISIS and RIP
o Multicasting design o MPLS VRF design o VLAN design and Spanning-Tree status o Over 100 typical designs based on
customizable design templates, including QoS, VoIP, security, etc.
Design Analysis At-A-Glance o Analyze routing protocol design o Analyze multicasting design o Analyze MPLS VRF design o Analyze VLAN design o Use Design Reader to analyze various network designs
Map-driven design analysis
Analyze Routing Design NetBrain can automatically decode routing design such as BGP, OSPF, ISIS, EIGRP and RIP. From any dynamic map, NetBrain annotates the routing design by color coding links (for IGP protocol) or devices (for BGP protocol). Design Reader templates for each routing protocol allows users to drill-down to the details of each protocol from within a map. If needed, users can customize templates to yield more relevant analysis.
Analyze routing design
Feature Handbook NetBrain® Enterprise Edition 6.1 | 20
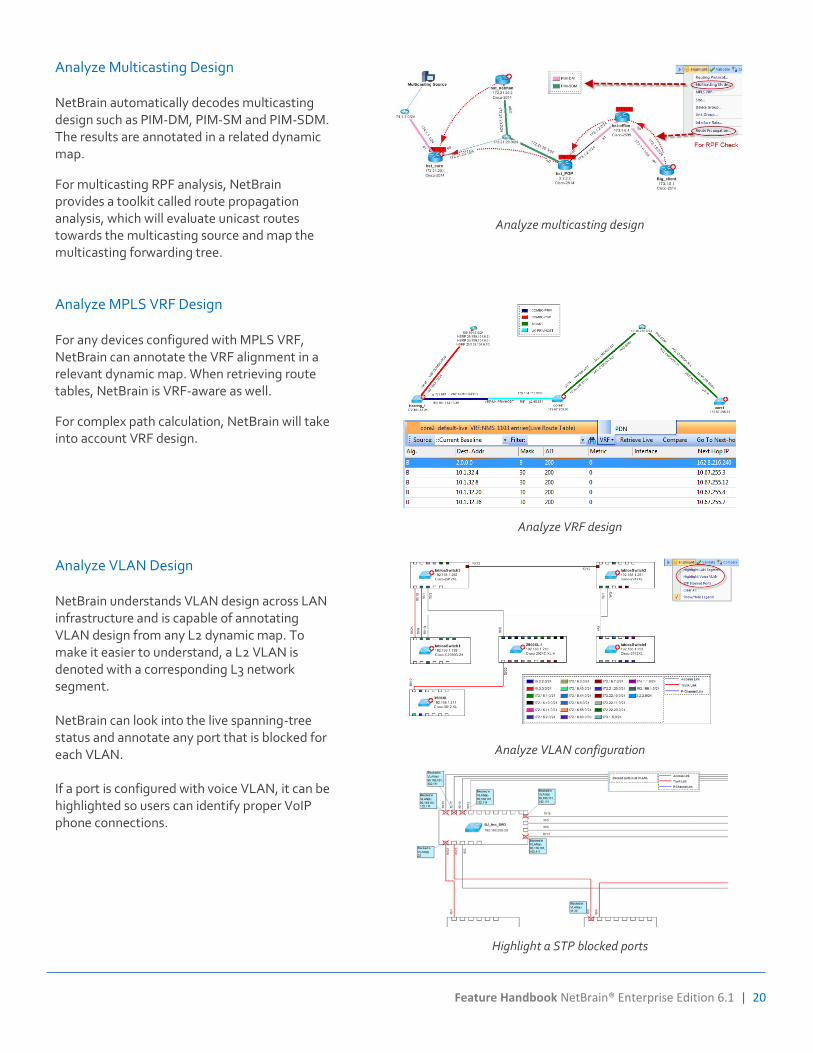
Analyze Multicasting Design NetBrain automatically decodes multicasting design such as PIM-DM, PIM-SM and PIM-SDM. The results are annotated in a related dynamic map.
For multicasting RPF analysis, NetBrain provides a toolkit called route propagation analysis, which will evaluate unicast routes towards the multicasting source and map the multicasting forwarding tree.
Analyze multicasting design
Analyze MPLS VRF Design For any devices configured with MPLS VRF, NetBrain can annotate the VRF alignment in a relevant dynamic map. When retrieving route tables, NetBrain is VRF-aware as well.
For complex path calculation, NetBrain will take into account VRF design.
Analyze VRF design
Analyze VLAN Design NetBrain understands VLAN design across LAN infrastructure and is capable of annotating VLAN design from any L2 dynamic map. To make it easier to understand, a L2 VLAN is denoted with a corresponding L3 network segment. NetBrain can look into the live spanning-tree status and annotate any port that is blocked for each VLAN. If a port is configured with voice VLAN, it can be highlighted so users can identify proper VoIP phone connections.
Analyze VLAN configuration
Highlight a STP blocked ports
21 | Feature Handbook NetBrain® Enterprise Edition 6.1
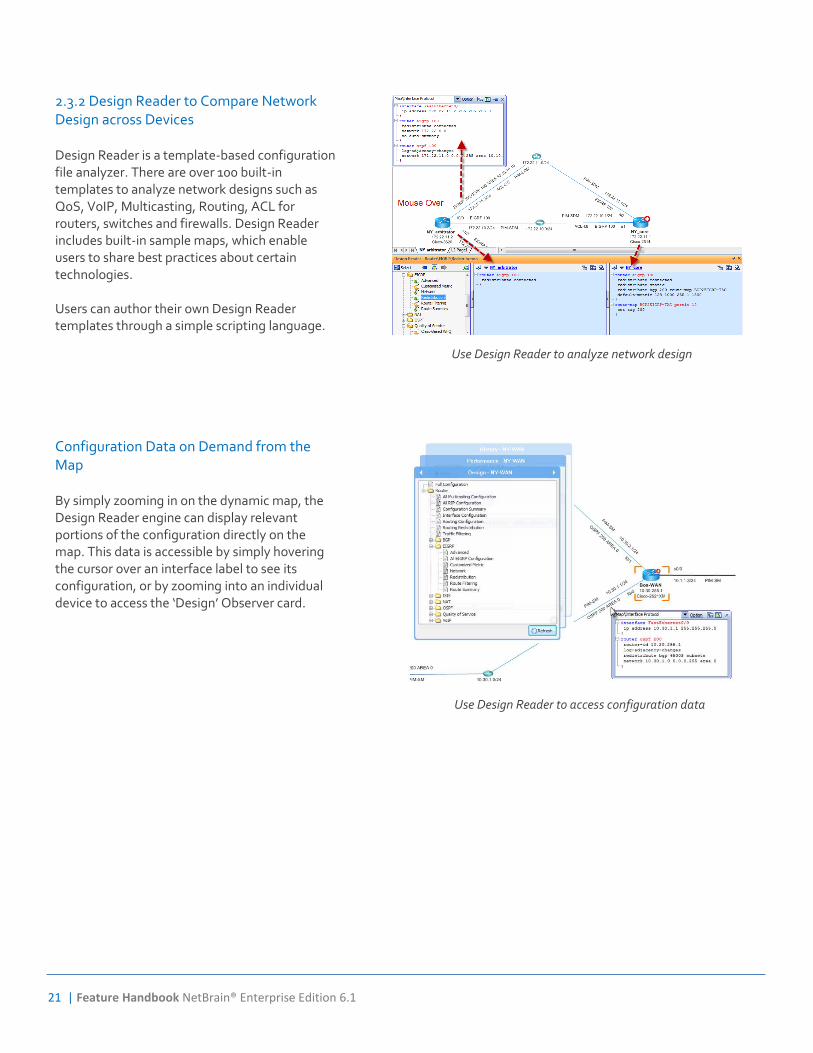
2.3.2 Design Reader to Compare Network Design across Devices Design Reader is a template-based configuration file analyzer. There are over 100 built-in templates to analyze network designs such as QoS, VoIP, Multicasting, Routing, ACL for routers, switches and firewalls. Design Reader includes built-in sample maps, which enable users to share best practices about certain technologies. Users can author their own Design Reader templates through a simple scripting language.
Use Design Reader to analyze network design
Configuration Data on Demand from the Map By simply zooming in on the dynamic map, the Design Reader engine can display relevant portions of the configuration directly on the map. This data is accessible by simply hovering the cursor over an interface label to see its configuration, or by zooming into an individual device to access the ‘Design’ Observer card.
Use Design Reader to access configuration data
Feature Handbook NetBrain® Enterprise Edition 6.1 | 22
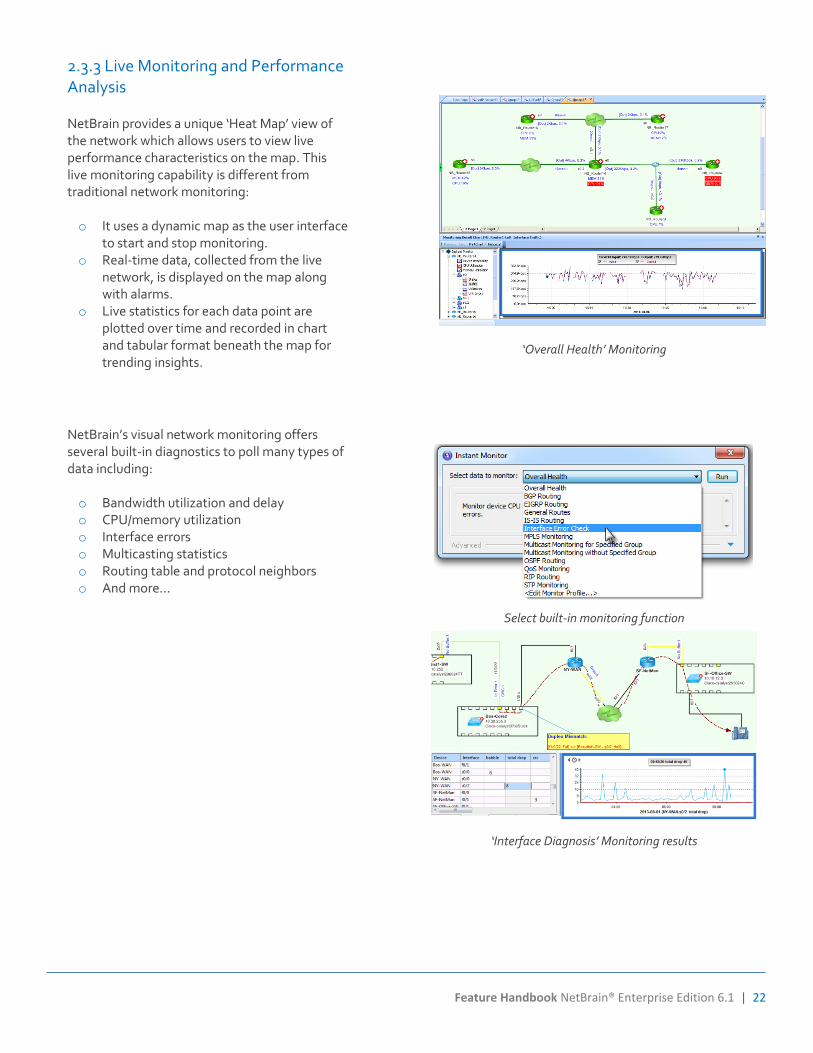
2.3.3 Live Monitoring and Performance Analysis NetBrain provides a unique ‘Heat Map’ view of the network which allows users to view live performance characteristics on the map. This live monitoring capability is different from traditional network monitoring: o It uses a dynamic map as the user interface
to start and stop monitoring. o Real-time data, collected from the live
network, is displayed on the map along with alarms.
o Live statistics for each data point are plotted over time and recorded in chart and tabular format beneath the map for trending insights.
‘Overall Health’ Monitoring
NetBrain’s visual network monitoring offers several built-in diagnostics to poll many types of data including: o Bandwidth utilization and delay o CPU/memory utilization o Interface errors o Multicasting statistics o Routing table and protocol neighbors o And more…
Select built-in monitoring function
‘Interface Diagnosis’ Monitoring results
23 | Feature Handbook NetBrain® Enterprise Edition 6.1
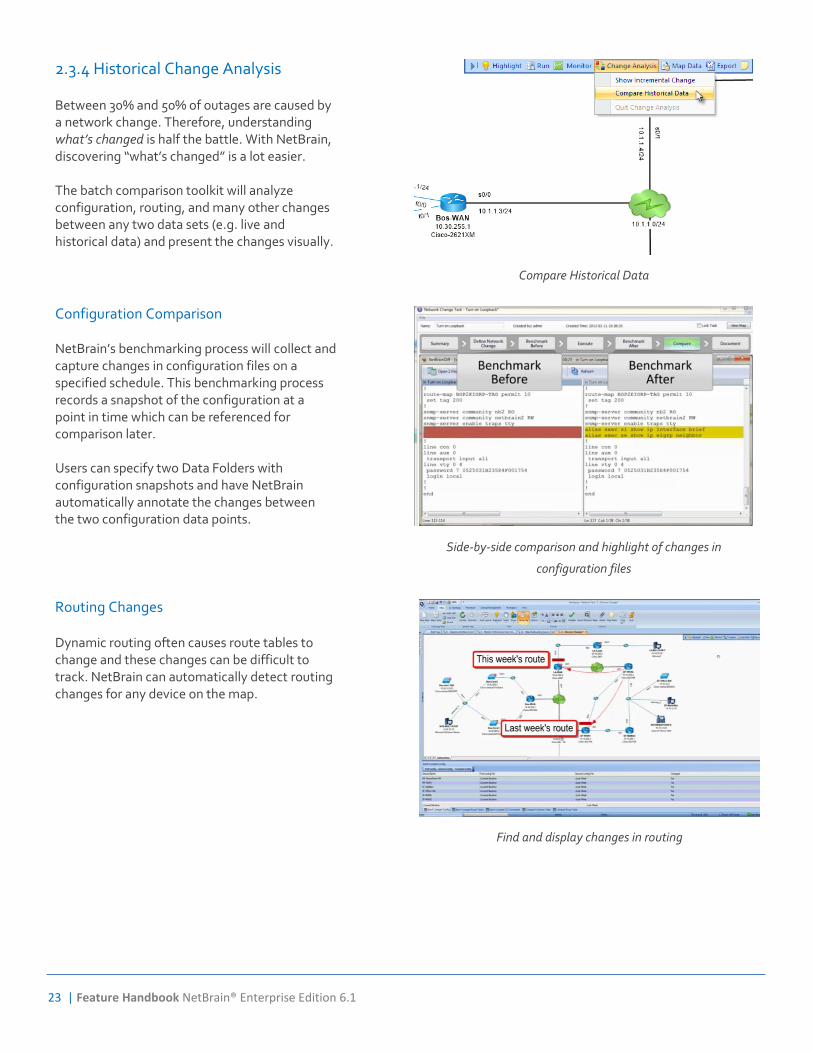
2.3.4 Historical Change Analysis Between 30% and 50% of outages are caused by a network change. Therefore, understanding what’s changed is half the battle. With NetBrain, discovering “what’s changed” is a lot easier. The batch comparison toolkit will analyze configuration, routing, and many other changes between any two data sets (e.g. live and historical data) and present the changes visually.
Compare Historical Data
Configuration Comparison NetBrain’s benchmarking process will collect and capture changes in configuration files on a specified schedule. This benchmarking process records a snapshot of the configuration at a point in time which can be referenced for comparison later. Users can specify two Data Folders with configuration snapshots and have NetBrain automatically annotate the changes between the two configuration data points.
Side-by-side comparison and highlight of changes in
configuration files
Routing Changes Dynamic routing often causes route tables to change and these changes can be difficult to track. NetBrain can automatically detect routing changes for any device on the map.
Find and display changes in routing
Feature Handbook NetBrain® Enterprise Edition 6.1 | 24
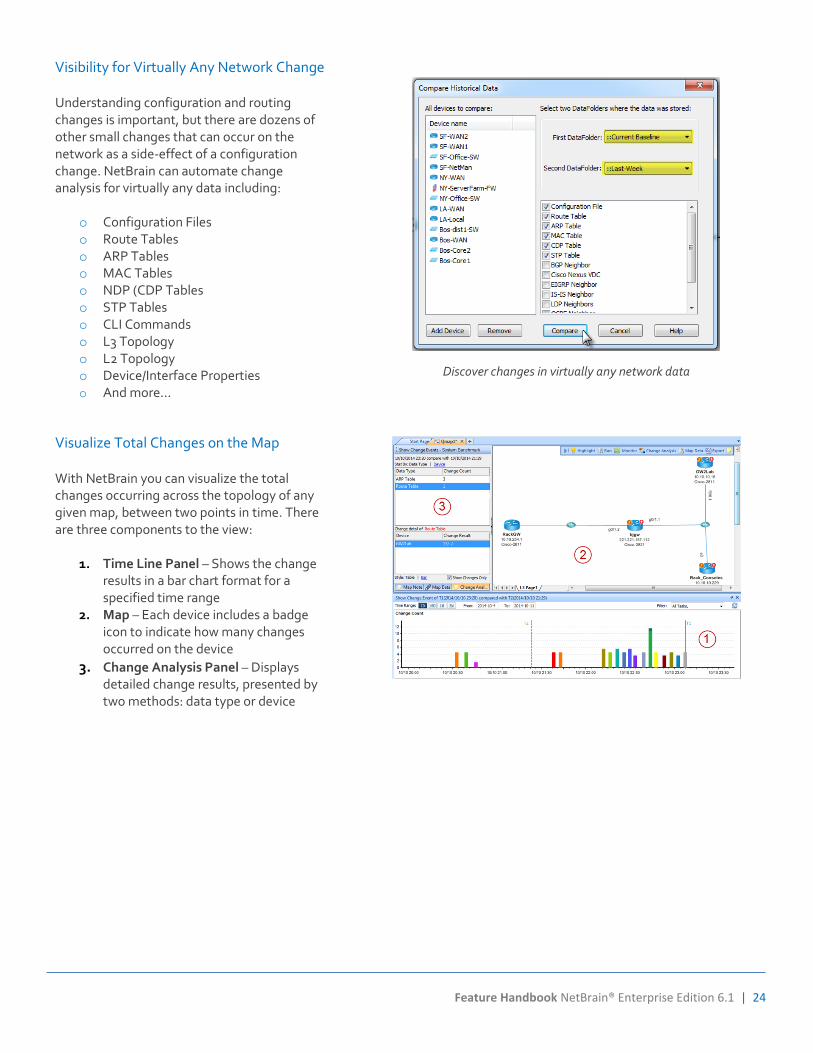
Visibility for Virtually Any Network Change Understanding configuration and routing changes is important, but there are dozens of other small changes that can occur on the network as a side-effect of a configuration change. NetBrain can automate change analysis for virtually any data including:
o Configuration Files o Route Tables o ARP Tables o MAC Tables o NDP (CDP Tables o STP Tables o CLI Commands o L3 Topology o L2 Topology o Device/Interface Properties o And more…
Discover changes in virtually any network data
Visualize Total Changes on the Map With NetBrain you can visualize the total changes occurring across the topology of any given map, between two points in time. There are three components to the view:
1. Time Line Panel – Shows the change results in a bar chart format for a specified time range
2. Map – Each device includes a badge icon to indicate how many changes occurred on the device
3. Change Analysis Panel – Displays detailed change results, presented by two methods: data type or device
25 | Feature Handbook NetBrain® Enterprise Edition 6.1
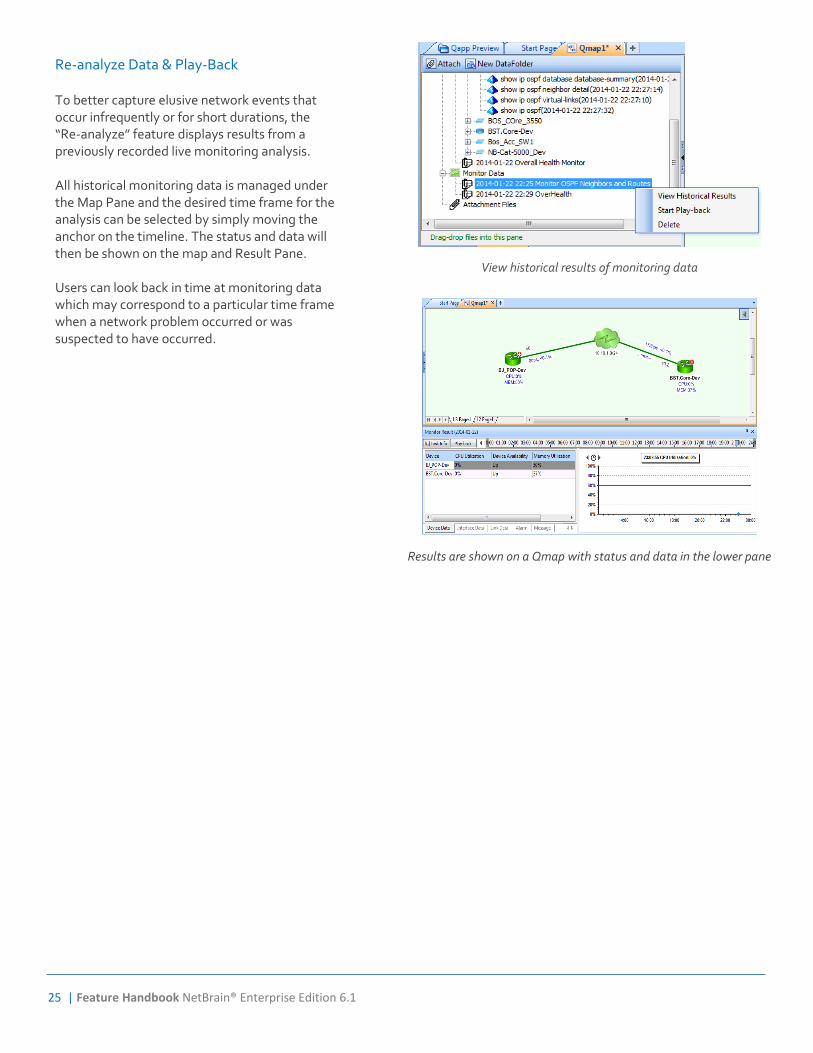
Re-analyze Data & Play-Back To better capture elusive network events that occur infrequently or for short durations, the “Re-analyze” feature displays results from a previously recorded live monitoring analysis. All historical monitoring data is managed under the Map Pane and the desired time frame for the analysis can be selected by simply moving the anchor on the timeline. The status and data will then be shown on the map and Result Pane. Users can look back in time at monitoring data which may correspond to a particular time frame when a network problem occurred or was suspected to have occurred.
View historical results of monitoring data
Results are shown on a Qmap with status and data in the lower pane
Feature Handbook NetBrain® Enterprise Edition 6.1 | 26
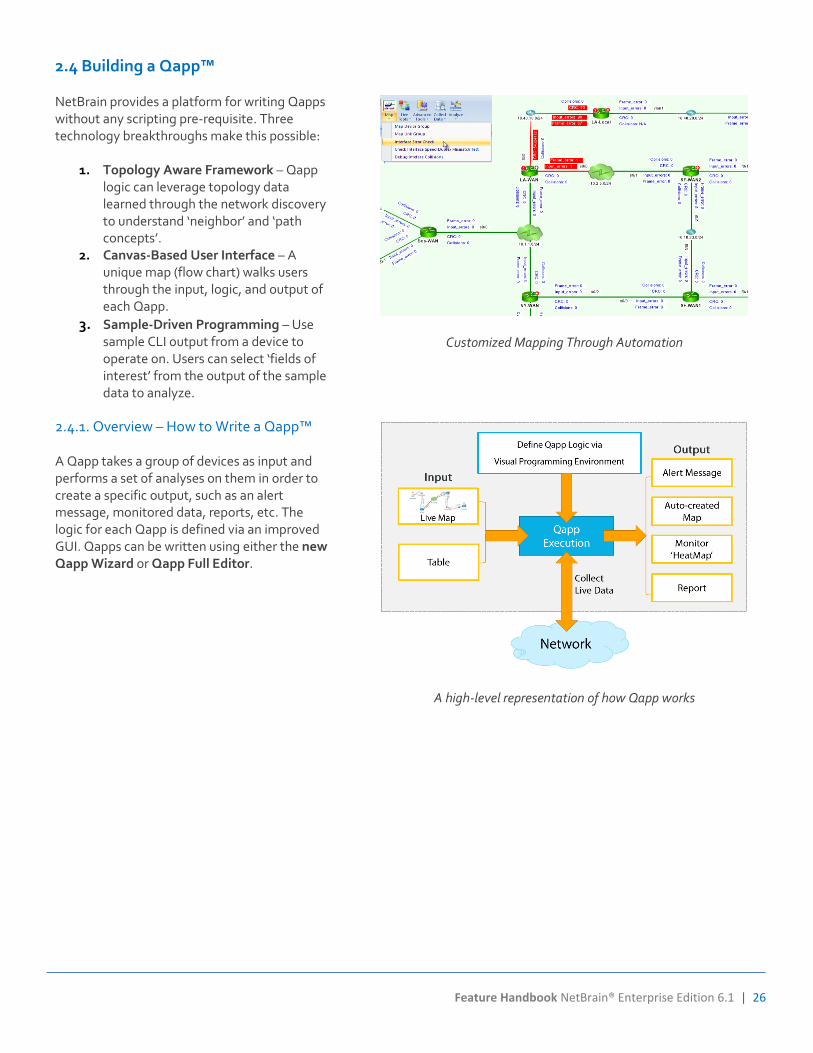
2.4 Building a Qapp™ NetBrain provides a platform for writing Qapps without any scripting pre-requisite. Three technology breakthroughs make this possible:
1. Topology Aware Framework – Qapp logic can leverage topology data learned through the network discovery to understand ‘neighbor’ and ‘path concepts’.
2. Canvas-Based User Interface – A unique map (flow chart) walks users through the input, logic, and output of each Qapp.
3. Sample-Driven Programming – Use sample CLI output from a device to operate on. Users can select ‘fields of interest’ from the output of the sample data to analyze.
Customized Mapping Through Automation
2.4.1. Overview – How to Write a Qapp™ A Qapp takes a group of devices as input and performs a set of analyses on them in order to create a specific output, such as an alert message, monitored data, reports, etc. The logic for each Qapp is defined via an improved GUI. Qapps can be written using either the new Qapp Wizard or Qapp Full Editor.
A high-level representation of how Qapp works
27 | Feature Handbook NetBrain® Enterprise Edition 6.1
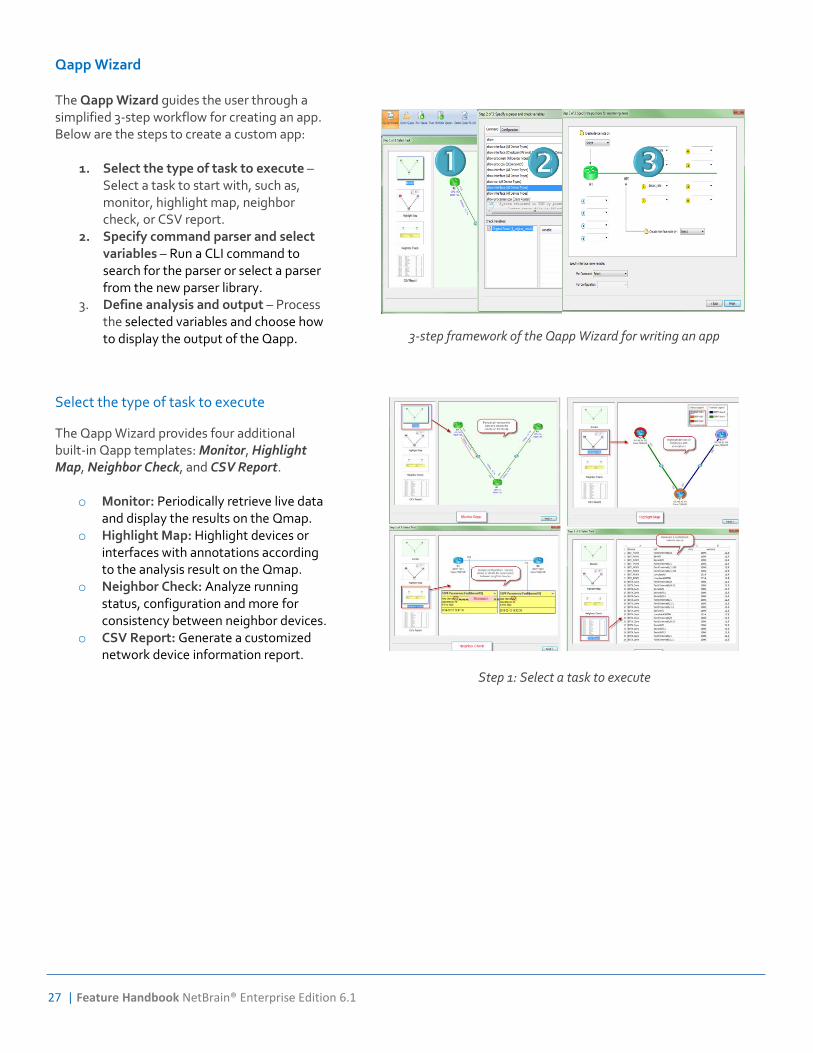
Qapp Wizard The Qapp Wizard guides the user through a simplified 3-step workflow for creating an app. Below are the steps to create a custom app:
1. Select the type of task to execute – Select a task to start with, such as, monitor, highlight map, neighbor check, or CSV report.
2. Specify command parser and select variables – Run a CLI command to search for the parser or select a parser from the new parser library.
3. Define analysis and output – Process the selected variables and choose how to display the output of the Qapp.
3-step framework of the Qapp Wizard for writing an app
Select the type of task to execute
The Qapp Wizard provides four additional built-in Qapp templates: Monitor, Highlight Map, Neighbor Check, and CSV Report.
o Monitor: Periodically retrieve live data and display the results on the Qmap.
o Highlight Map: Highlight devices or interfaces with annotations according to the analysis result on the Qmap.
o Neighbor Check: Analyze running status, configuration and more for consistency between neighbor devices.
o CSV Report: Generate a customized network device information report.
Step 1: Select a task to execute
Feature Handbook NetBrain® Enterprise Edition 6.1 | 28
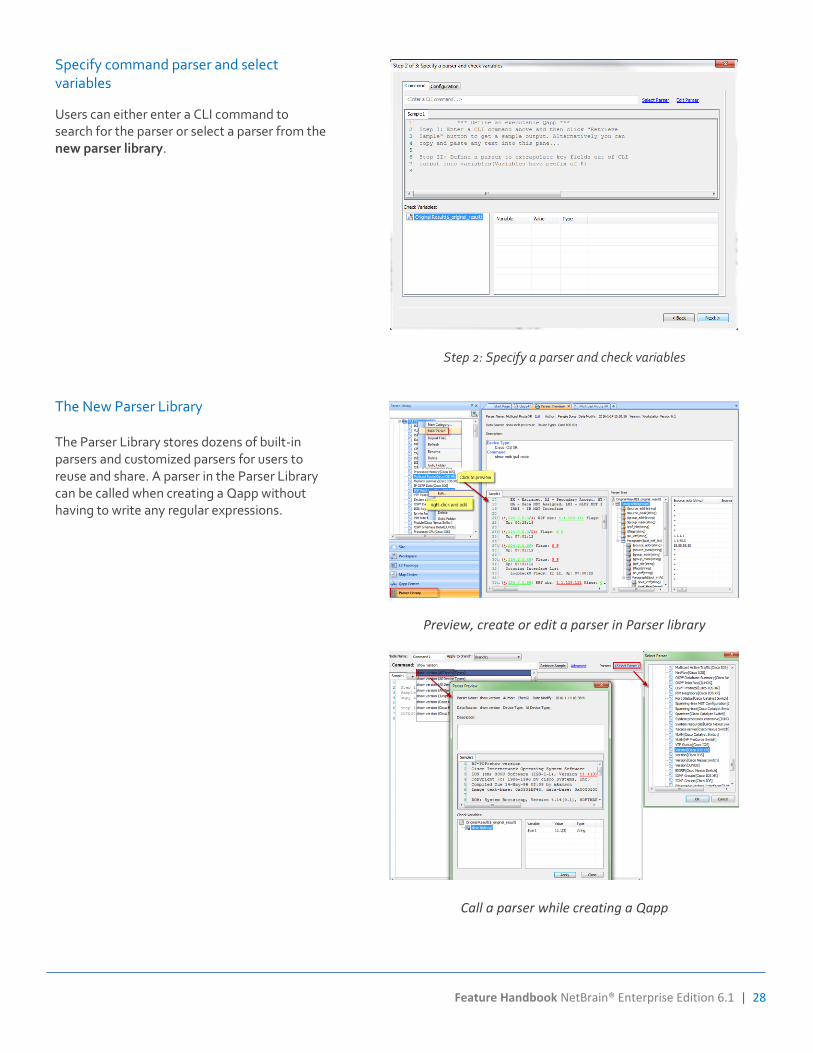
Specify command parser and select variables
Users can either enter a CLI command to search for the parser or select a parser from the new parser library.
Step 2: Specify a parser and check variables
The New Parser Library The Parser Library stores dozens of built-in parsers and customized parsers for users to reuse and share. A parser in the Parser Library can be called when creating a Qapp without having to write any regular expressions.
Preview, create or edit a parser in Parser library
Call a parser while creating a Qapp
29 | Feature Handbook NetBrain® Enterprise Edition 6.1
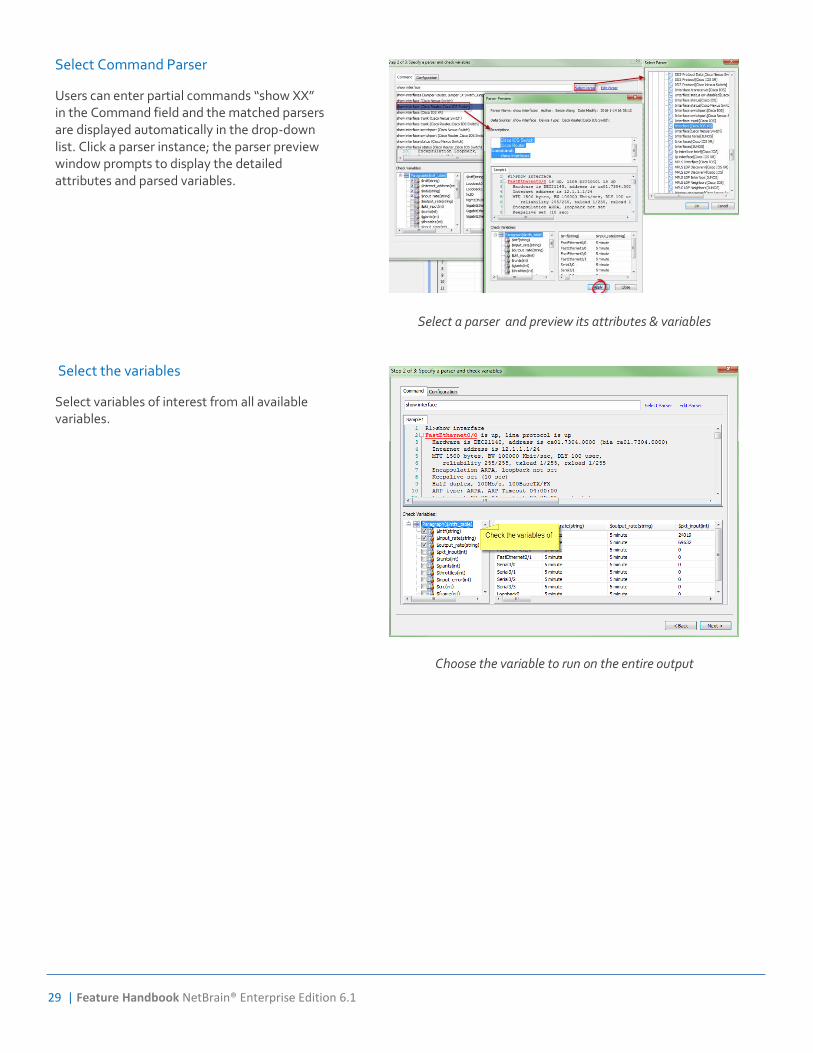
Select Command Parser
Users can enter partial commands “show XX” in the Command field and the matched parsers are displayed automatically in the drop-down list. Click a parser instance; the parser preview window prompts to display the detailed attributes and parsed variables.
Select a parser and preview its attributes & variables
Select the variables
Select variables of interest from all available variables.
Choose the variable to run on the entire output
Feature Handbook NetBrain® Enterprise Edition 6.1 | 30
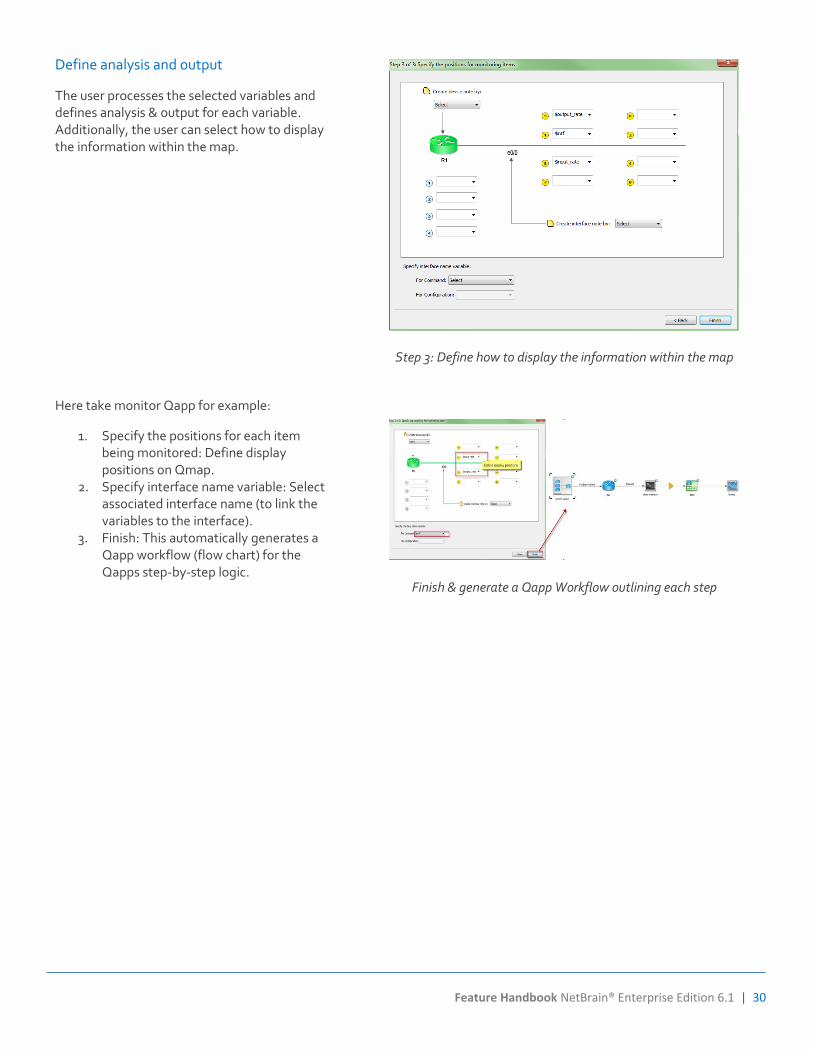
Define analysis and output
The user processes the selected variables and defines analysis & output for each variable. Additionally, the user can select how to display the information within the map.
Step 3: Define how to display the information within the map
Here take monitor Qapp for example:
1. Specify the positions for each item being monitored: Define display positions on Qmap.
2. Specify interface name variable: Select associated interface name (to link the variables to the interface).
3. Finish: This automatically generates a Qapp workflow (flow chart) for the Qapps step-by-step logic.
Finish & generate a Qapp Workflow outlining each step
31 | Feature Handbook NetBrain® Enterprise Edition 6.1
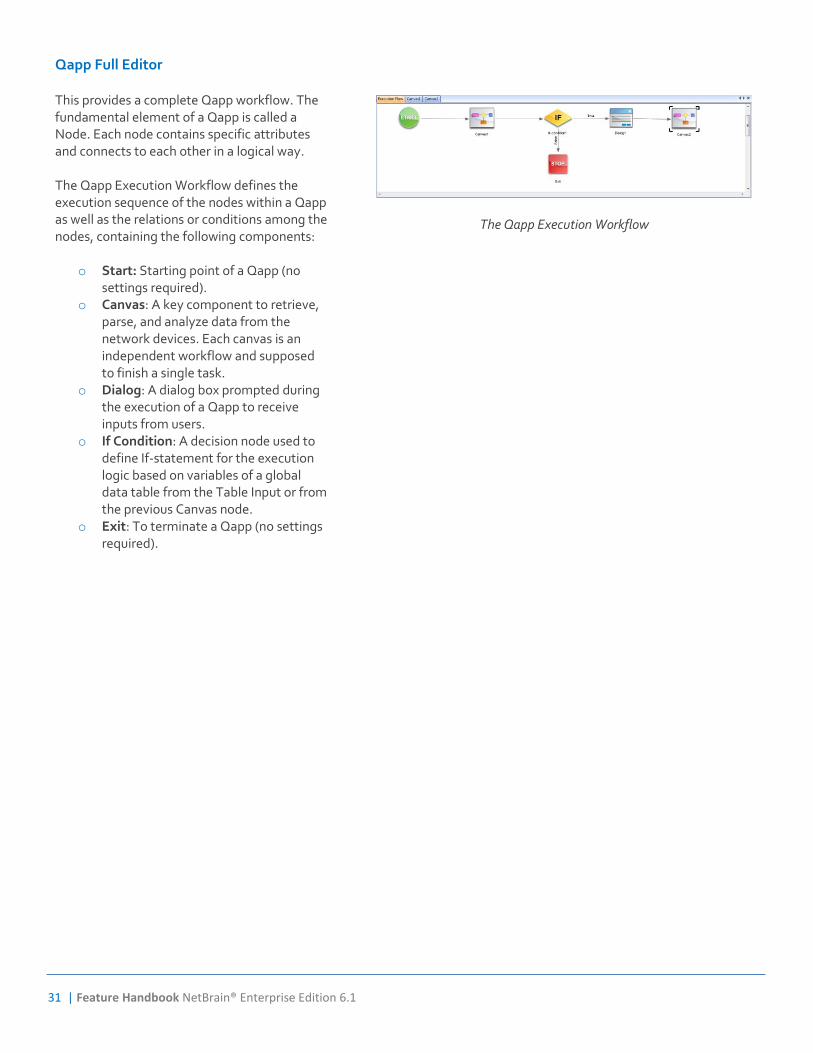
Qapp Full Editor This provides a complete Qapp workflow. The fundamental element of a Qapp is called a Node. Each node contains specific attributes and connects to each other in a logical way. The Qapp Execution Workflow defines the execution sequence of the nodes within a Qapp as well as the relations or conditions among the nodes, containing the following components:
o Start: Starting point of a Qapp (no settings required).
o Canvas: A key component to retrieve, parse, and analyze data from the network devices. Each canvas is an independent workflow and supposed to finish a single task.
o Dialog: A dialog box prompted during the execution of a Qapp to receive inputs from users.
o If Condition: A decision node used to define If-statement for the execution logic based on variables of a global data table from the Table Input or from the previous Canvas node.
o Exit: To terminate a Qapp (no settings required).
The Qapp Execution Workflow
Feature Handbook NetBrain® Enterprise Edition 6.1 | 32
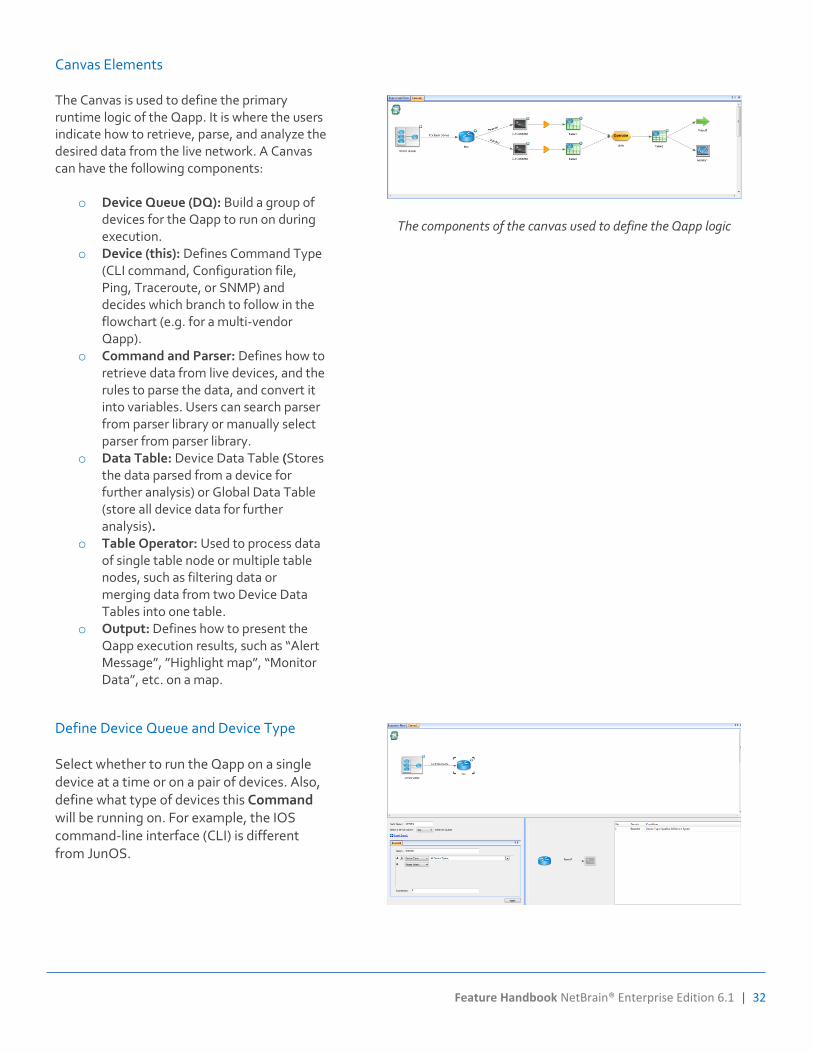
Canvas Elements The Canvas is used to define the primary runtime logic of the Qapp. It is where the users indicate how to retrieve, parse, and analyze the desired data from the live network. A Canvas can have the following components:
o Device Queue (DQ): Build a group of devices for the Qapp to run on during execution.
o Device (this): Defines Command Type (CLI command, Configuration file, Ping, Traceroute, or SNMP) and decides which branch to follow in the flowchart (e.g. for a multi-vendor Qapp).
o Command and Parser: Defines how to retrieve data from live devices, and the rules to parse the data, and convert it into variables. Users can search parser from parser library or manually select parser from parser library.
o Data Table: Device Data Table (Stores the data parsed from a device for further analysis) or Global Data Table (store all device data for further analysis).
o Table Operator: Used to process data of single table node or multiple table nodes, such as filtering data or merging data from two Device Data Tables into one table.
o Output: Defines how to present the Qapp execution results, such as “Alert Message”, ”Highlight map”, “Monitor Data”, etc. on a map.
The components of the canvas used to define the Qapp logic
Define Device Queue and Device Type Select whether to run the Qapp on a single device at a time or on a pair of devices. Also, define what type of devices this Command will be running on. For example, the IOS command-line interface (CLI) is different from JunOS.
33 | Feature Handbook NetBrain® Enterprise Edition 6.1
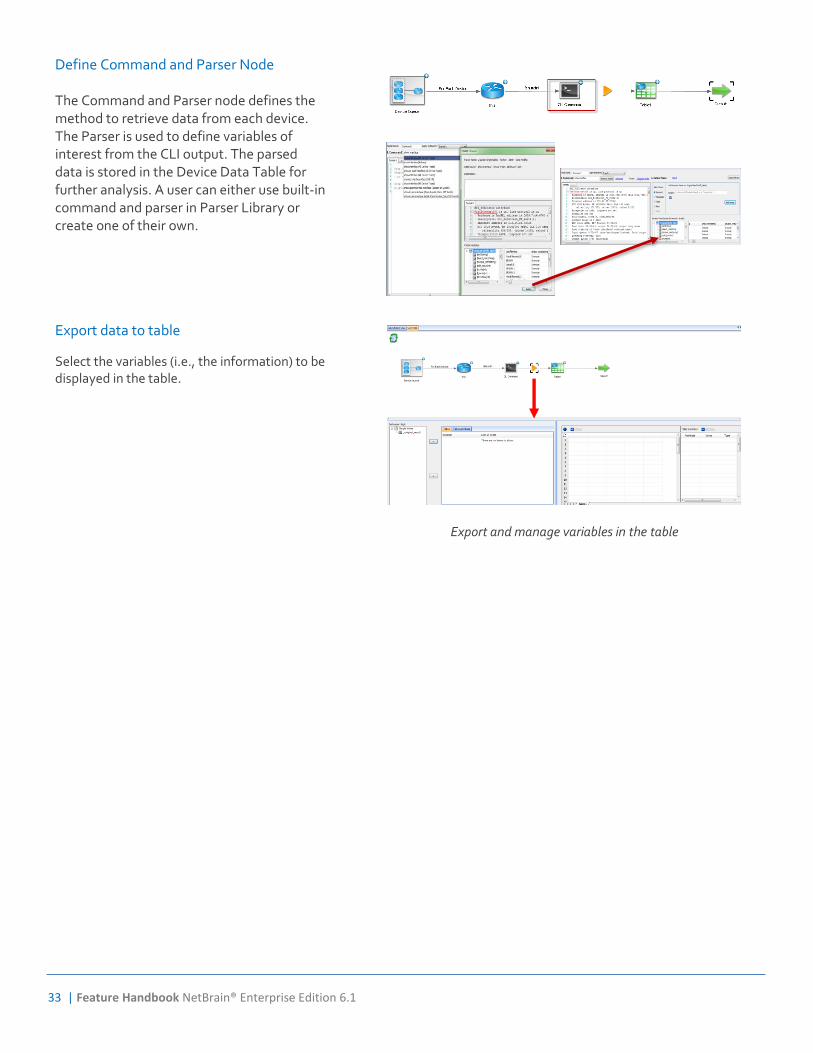
Define Command and Parser Node The Command and Parser node defines the method to retrieve data from each device. The Parser is used to define variables of interest from the CLI output. The parsed data is stored in the Device Data Table for further analysis. A user can either use built-in command and parser in Parser Library or create one of their own.
Export data to table
Select the variables (i.e., the information) to be displayed in the table.
Export and manage variables in the table
Feature Handbook NetBrain® Enterprise Edition 6.1 | 34
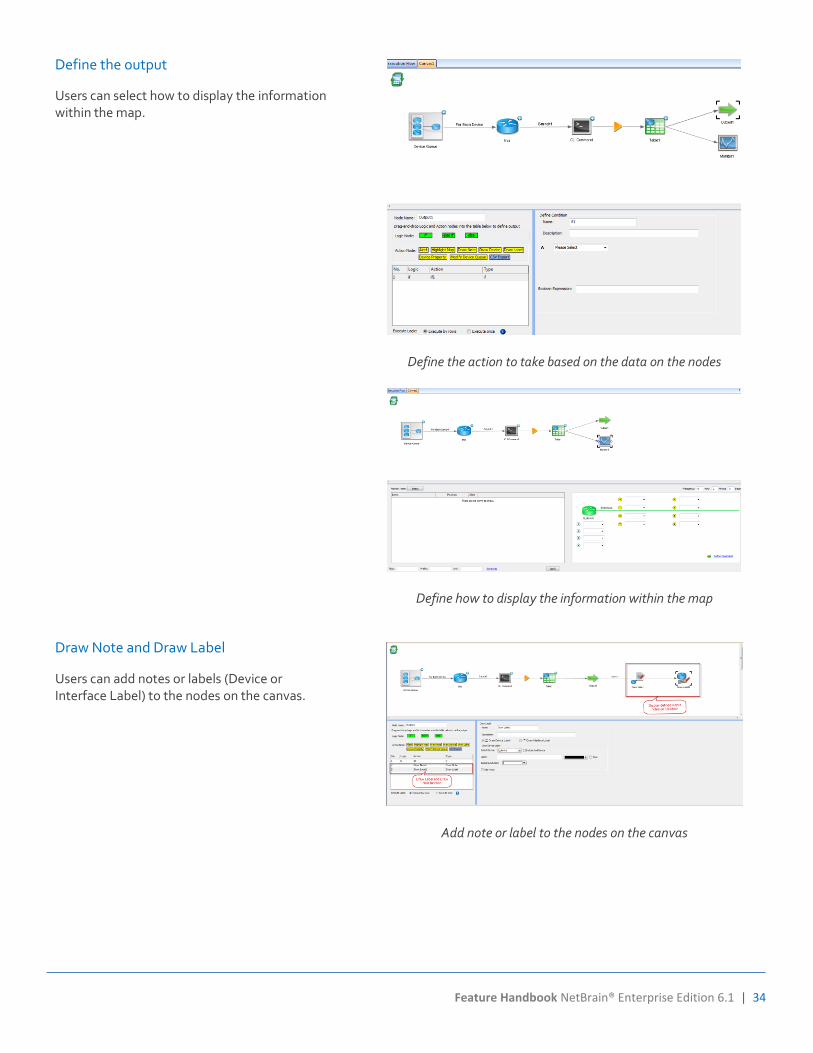
Define the output
Users can select how to display the information within the map.
Define the action to take based on the data on the nodes
Define how to display the information within the map
Draw Note and Draw Label
Users can add notes or labels (Device or Interface Label) to the nodes on the canvas.
Add note or label to the nodes on the canvas
35 | Feature Handbook NetBrain® Enterprise Edition 6.1
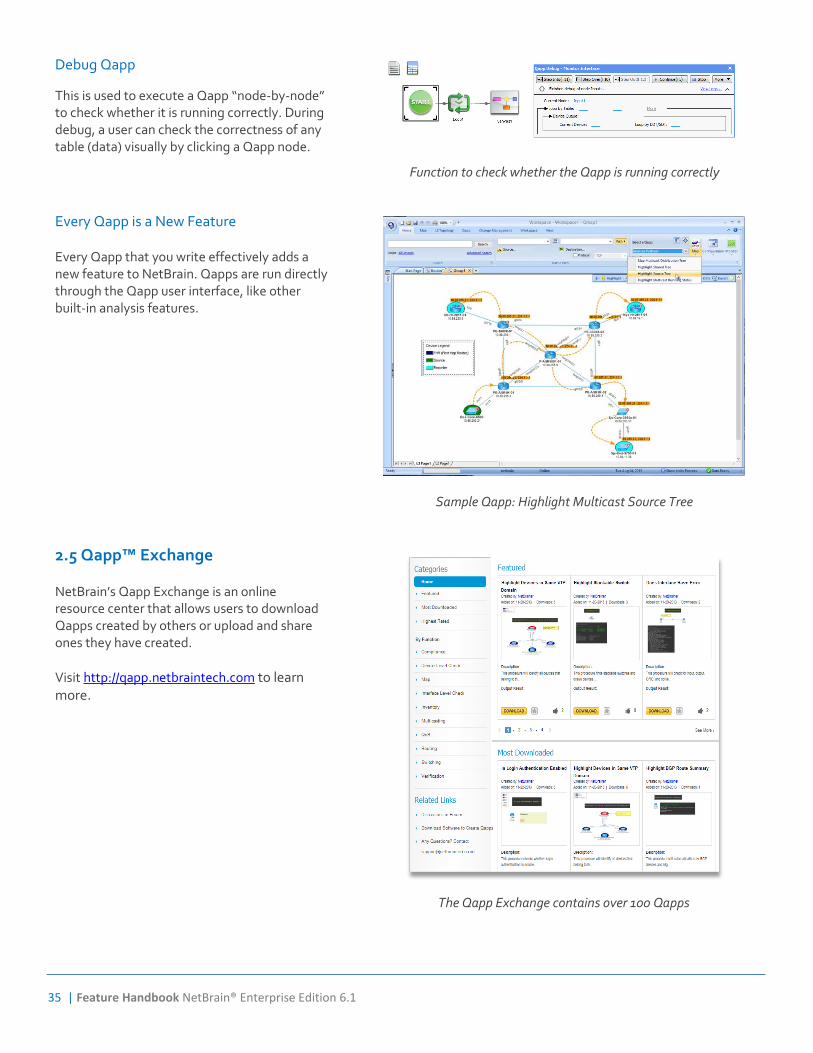
Debug Qapp
This is used to execute a Qapp “node-by-node” to check whether it is running correctly. During debug, a user can check the correctness of any table (data) visually by clicking a Qapp node.
Function to check whether the Qapp is running correctly
Every Qapp is a New Feature Every Qapp that you write effectively adds a new feature to NetBrain. Qapps are run directly through the Qapp user interface, like other built-in analysis features.
Sample Qapp: Highlight Multicast Source Tree
2.5 Qapp™ Exchange NetBrain’s Qapp Exchange is an online resource center that allows users to download Qapps created by others or upload and share ones they have created.
Visit http://qapp.netbraintech.com to learn more.
The Qapp Exchange contains over 100 Qapps
Feature Handbook NetBrain® Enterprise Edition 6.1 | 36
Section 3: Automate Change Management and Verification
3.0 Overview: Map Driven Change Management Typically, 3 out of 4 network outages are caused by network change. Engineers can prevent human-error induced outages by leveraging NetBrain’s unique Change Management Workflow to automate network changes and instantly analyze their impact. This is achieved by:
o Using dynamic maps to document network changes visually
o Benchmarking the network before and after changes
o Automatically pushing config changes to multiple devices simultaneously
o Analyzing the total impact of network changes through before/after comparison
Without NetBrain, engineers rely on manual methods to selectively analyze the impact of network changes. Any oversight could result in network outages after the change window.
Change Management Workflow At-a-Glance: o Automatically push config changes o Analyze changes in routing, configuration, traffic flow, etc. o Automatically document the results
Change management workflow with ‘Map-Driven CAD’
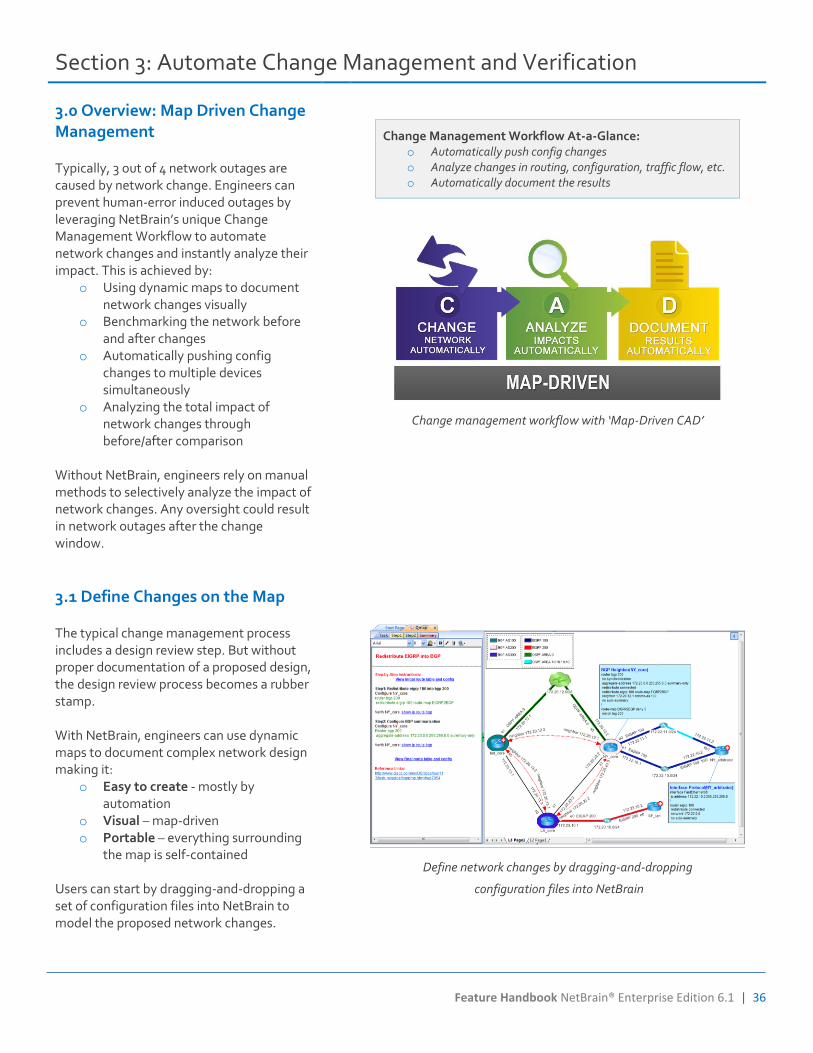
3.1 Define Changes on the Map The typical change management process includes a design review step. But without proper documentation of a proposed design, the design review process becomes a rubber stamp. With NetBrain, engineers can use dynamic maps to document complex network design making it:
o Easy to create - mostly by automation
o Visual – map-driven o Portable – everything surrounding
the map is self-contained Users can start by dragging-and-dropping a set of configuration files into NetBrain to model the proposed network changes.
Define network changes by dragging-and-dropping
configuration files into NetBrain
37 | Feature Handbook NetBrain® Enterprise Edition 6.1
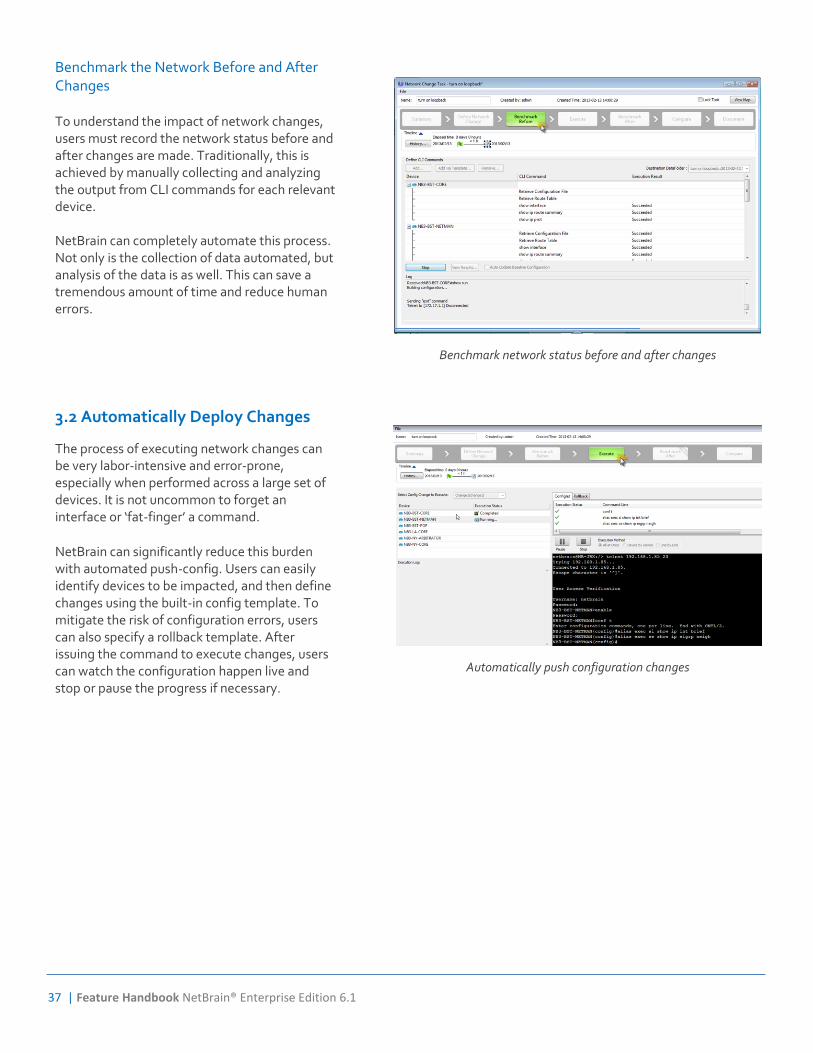
Benchmark the Network Before and After Changes To understand the impact of network changes, users must record the network status before and after changes are made. Traditionally, this is achieved by manually collecting and analyzing the output from CLI commands for each relevant device. NetBrain can completely automate this process. Not only is the collection of data automated, but analysis of the data is as well. This can save a tremendous amount of time and reduce human errors.
Benchmark network status before and after changes
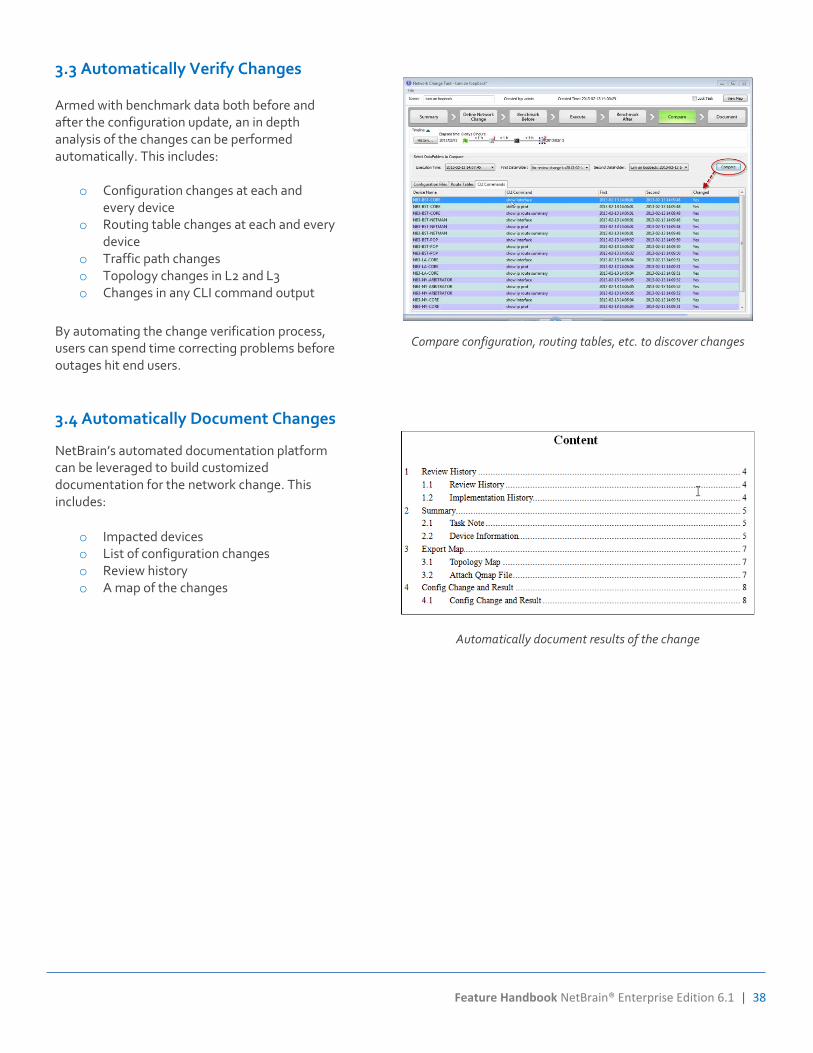
3.2 Automatically Deploy Changes
The process of executing network changes can be very labor-intensive and error-prone, especially when performed across a large set of devices. It is not uncommon to forget an interface or ‘fat-finger’ a command.
NetBrain can significantly reduce this burden with automated push-config. Users can easily identify devices to be impacted, and then define changes using the built-in config template. To mitigate the risk of configuration errors, users can also specify a rollback template. After issuing the command to execute changes, users can watch the configuration happen live and stop or pause the progress if necessary.
Automatically push configuration changes
Feature Handbook NetBrain® Enterprise Edition 6.1 | 38
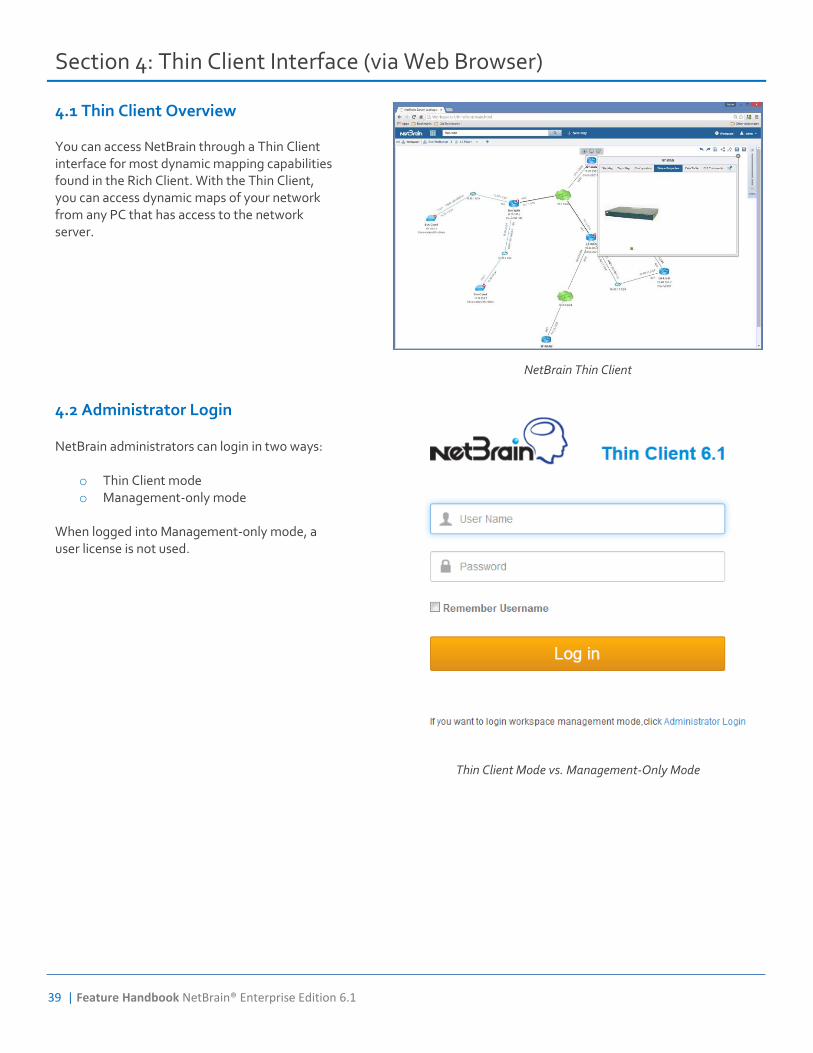
3.3 Automatically Verify Changes Armed with benchmark data both before and after the configuration update, an in depth analysis of the changes can be performed automatically. This includes:
o Configuration changes at each and every device
o Routing table changes at each and every device
o Traffic path changes o Topology changes in L2 and L3 o Changes in any CLI command output
By automating the change verification process, users can spend time correcting problems before outages hit end users.
Compare configuration, routing tables, etc. to discover changes
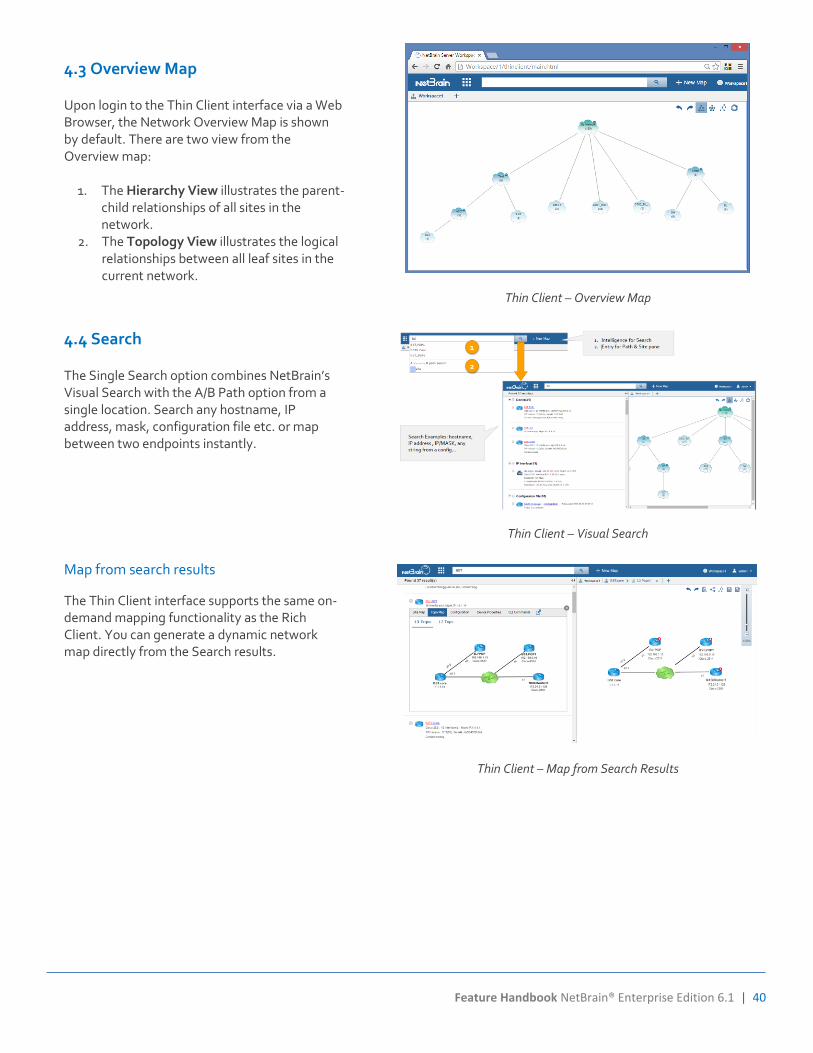
3.4 Automatically Document Changes
NetBrain’s automated documentation platform can be leveraged to build customized documentation for the network change. This includes:
o Impacted devices o List of configuration changes o Review history o A map of the changes
Automatically document results of the change
39 | Feature Handbook NetBrain® Enterprise Edition 6.1
Section 4: Thin Client Interface (via Web Browser)
4.1 Thin Client Overview You can access NetBrain through a Thin Client interface for most dynamic mapping capabilities found in the Rich Client. With the Thin Client, you can access dynamic maps of your network from any PC that has access to the network server.
NetBrain Thin Client
4.2 Administrator Login NetBrain administrators can login in two ways:
o Thin Client mode o Management-only mode
When logged into Management-only mode, a user license is not used.
Thin Client Mode vs. Management-Only Mode
Feature Handbook NetBrain® Enterprise Edition 6.1 | 40
4.3 Overview Map Upon login to the Thin Client interface via a Web Browser, the Network Overview Map is shown by default. There are two view from the Overview map:
1. The Hierarchy View illustrates the parent-child relationships of all sites in the network.
2. The Topology View illustrates the logical relationships between all leaf sites in the current network.
Thin Client – Overview Map
4.4 Search The Single Search option combines NetBrain’s Visual Search with the A/B Path option from a single location. Search any hostname, IP address, mask, configuration file etc. or map between two endpoints instantly.
Thin Client – Visual Search
Map from search results
The Thin Client interface supports the same on-demand mapping functionality as the Rich Client. You can generate a dynamic network map directly from the Search results.
Thin Client – Map from Search Results
41 | Feature Handbook NetBrain® Enterprise Edition 6.1
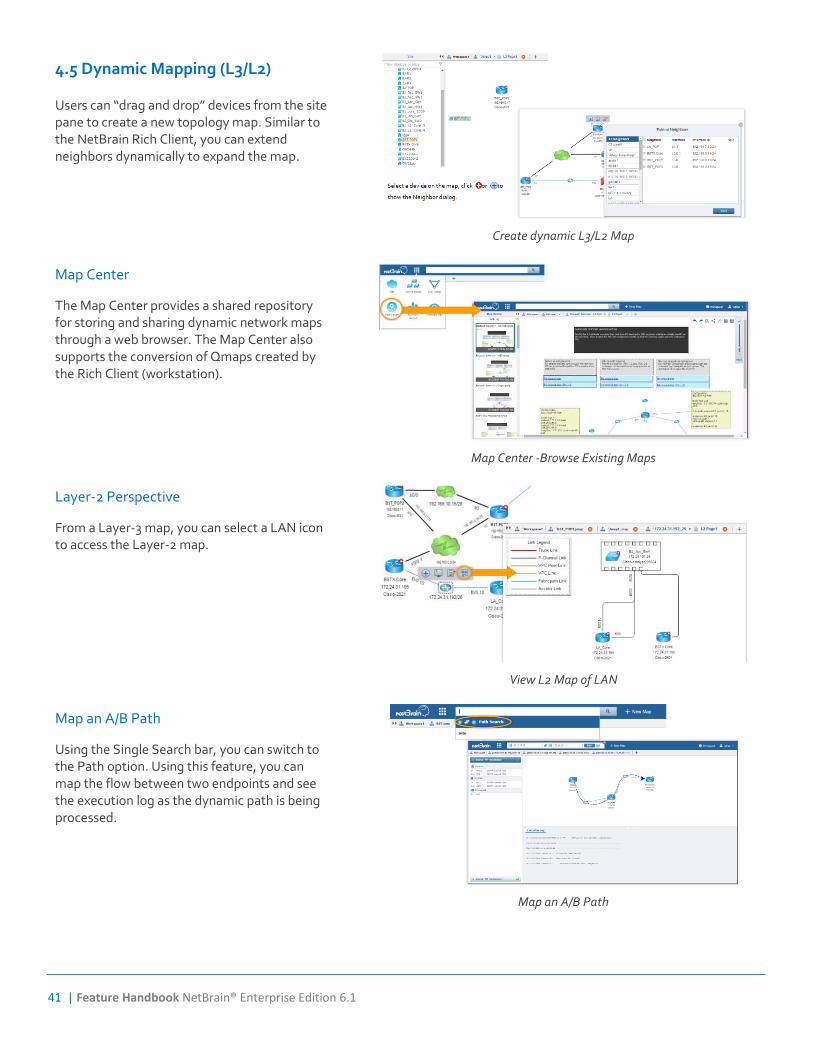
4.5 Dynamic Mapping (L3/L2) Users can “drag and drop” devices from the site pane to create a new topology map. Similar to the NetBrain Rich Client, you can extend neighbors dynamically to expand the map.
Create dynamic L3/L2 Map
Map Center
The Map Center provides a shared repository for storing and sharing dynamic network maps through a web browser. The Map Center also supports the conversion of Qmaps created by the Rich Client (workstation).
Map Center -Browse Existing Maps
Layer-2 Perspective
From a Layer-3 map, you can select a LAN icon to access the Layer-2 map.
View L2 Map of LAN
Map an A/B Path
Using the Single Search bar, you can switch to the Path option. Using this feature, you can map the flow between two endpoints and see the execution log as the dynamic path is being processed.
Map an A/B Path
Feature Handbook NetBrain® Enterprise Edition 6.1 | 42
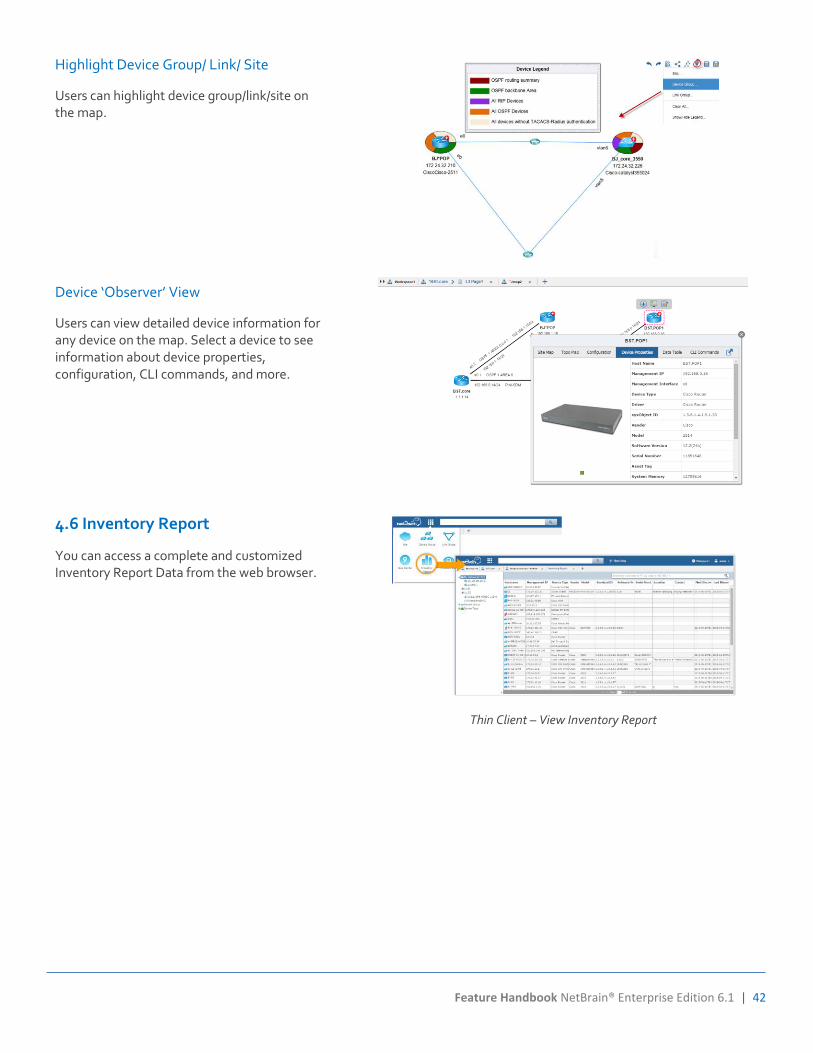
Highlight Device Group/ Link/ Site
Users can highlight device group/link/site on the map.
Device ‘Observer’ View
Users can view detailed device information for any device on the map. Select a device to see information about device properties, configuration, CLI commands, and more.
4.6 Inventory Report
You can access a complete and customized Inventory Report Data from the web browser.
Thin Client – View Inventory Report
43 | Feature Handbook NetBrain® Enterprise Edition 6.1
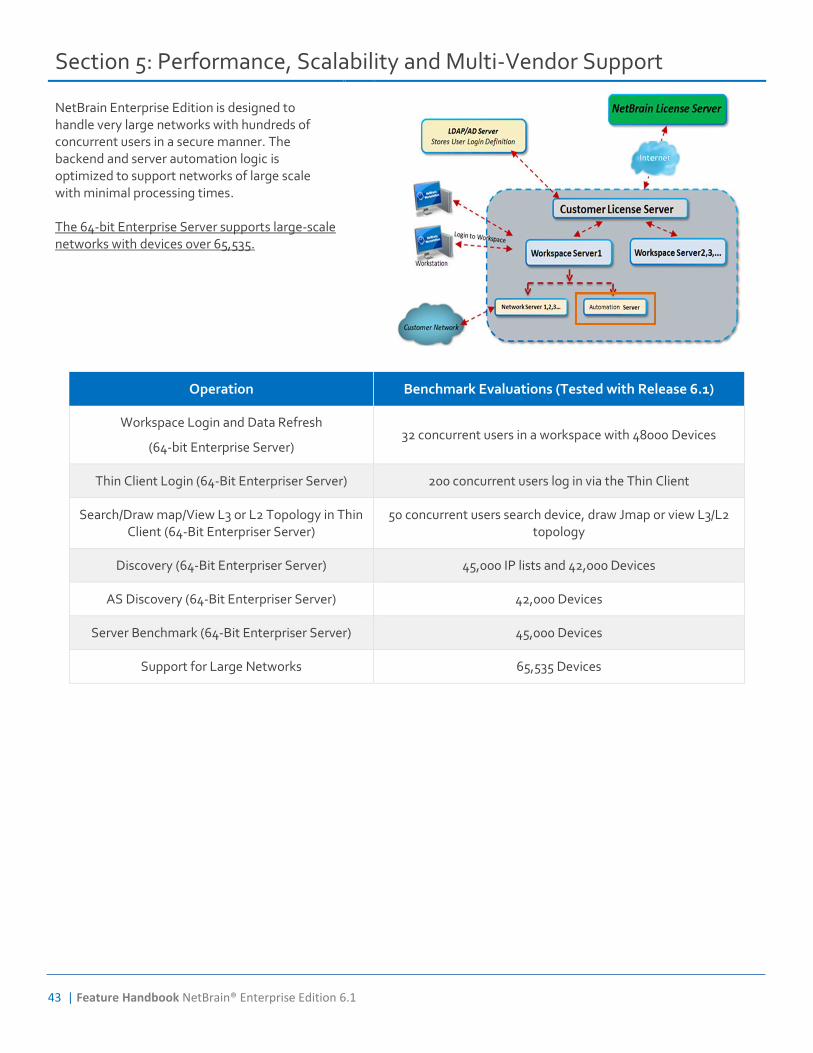
Section 5: Performance, Scalability and Multi-Vendor Support
NetBrain Enterprise Edition is designed to handle very large networks with hundreds of concurrent users in a secure manner. The backend and server automation logic is optimized to support networks of large scale with minimal processing times. The 64-bit Enterprise Server supports large-scale networks with devices over 65,535.
Operation Benchmark Evaluations (Tested with Release 6.1)
Workspace Login and Data Refresh
(64-bit Enterprise Server) 32 concurrent users in a workspace with 48000 Devices
Thin Client Login (64-Bit Enterpriser Server) 200 concurrent users log in via the Thin Client
Search/Draw map/View L3 or L2 Topology in Thin Client (64-Bit Enterpriser Server)
50 concurrent users search device, draw Jmap or view L3/L2 topology
Discovery (64-Bit Enterpriser Server) 45,000 IP lists and 42,000 Devices
AS Discovery (64-Bit Enterpriser Server) 42,000 Devices
Server Benchmark (64-Bit Enterpriser Server) 45,000 Devices
Support for Large Networks 65,535 Devices
Feature Handbook NetBrain® Enterprise Edition 6.1 | 44
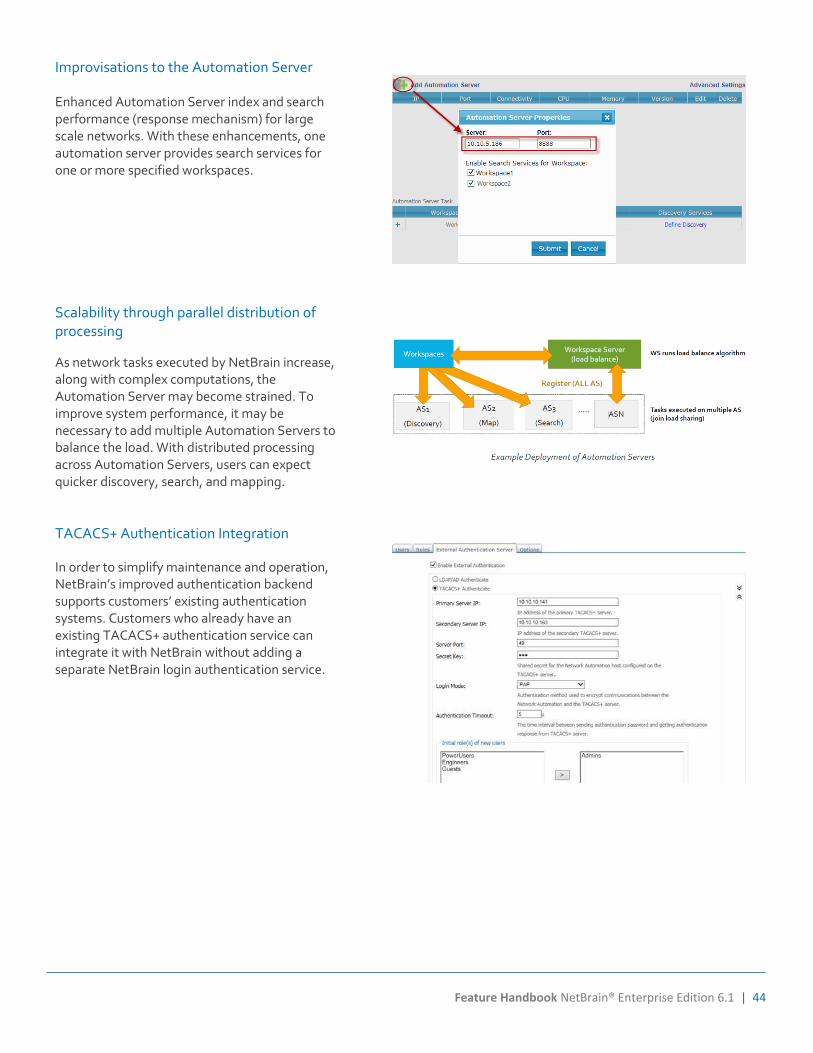
Improvisations to the Automation Server Enhanced Automation Server index and search performance (response mechanism) for large scale networks. With these enhancements, one automation server provides search services for one or more specified workspaces.
Scalability through parallel distribution of processing
As network tasks executed by NetBrain increase, along with complex computations, the Automation Server may become strained. To improve system performance, it may be necessary to add multiple Automation Servers to balance the load. With distributed processing across Automation Servers, users can expect quicker discovery, search, and mapping.
TACACS+ Authentication Integration
In order to simplify maintenance and operation, NetBrain’s improved authentication backend supports customers’ existing authentication systems. Customers who already have an existing TACACS+ authentication service can integrate it with NetBrain without adding a separate NetBrain login authentication service.
45 | Feature Handbook NetBrain® Enterprise Edition 6.1
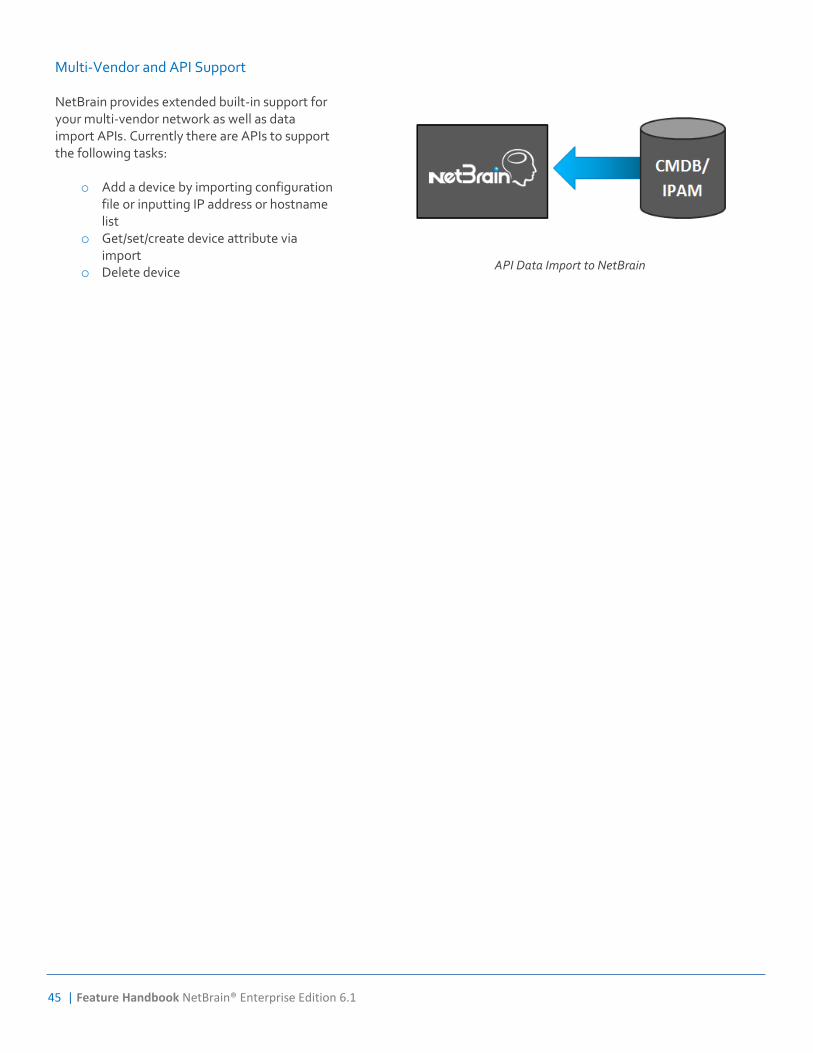
Multi-Vendor and API Support NetBrain provides extended built-in support for your multi-vendor network as well as data import APIs. Currently there are APIs to support the following tasks:
o Add a device by importing configuration file or inputting IP address or hostname list
o Get/set/create device attribute via import
o Delete device
API Data Import to NetBrain
Feature Handbook NetBrain® Enterprise Edition 6.1 | 46
Section 6: Integration with Existing NMS Systems
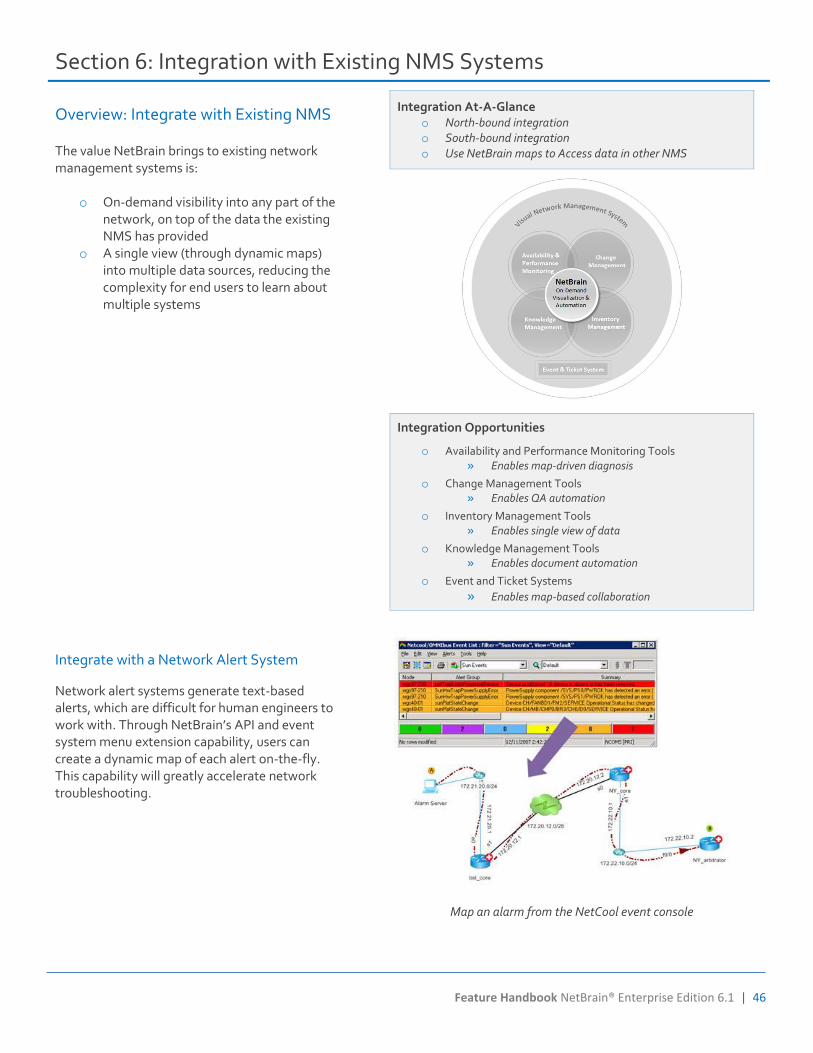
Overview: Integrate with Existing NMS The value NetBrain brings to existing network management systems is:
o On-demand visibility into any part of the network, on top of the data the existing NMS has provided
o A single view (through dynamic maps) into multiple data sources, reducing the complexity for end users to learn about multiple systems
Integration At-A-Glance
o North-bound integration o South-bound integration o Use NetBrain maps to Access data in other NMS
Integration Opportunities
o Availability and Performance Monitoring Tools » Enables map-driven diagnosis
o Change Management Tools » Enables QA automation
o Inventory Management Tools » Enables single view of data
o Knowledge Management Tools » Enables document automation
o Event and Ticket Systems
» Enables map-based collaboration
Integrate with a Network Alert System
Network alert systems generate text-based alerts, which are difficult for human engineers to work with. Through NetBrain’s API and event system menu extension capability, users can create a dynamic map of each alert on-the-fly. This capability will greatly accelerate network troubleshooting.
Map an alarm from the NetCool event console
47 | Feature Handbook NetBrain® Enterprise Edition 6.1
Section 7: Miscellaneous
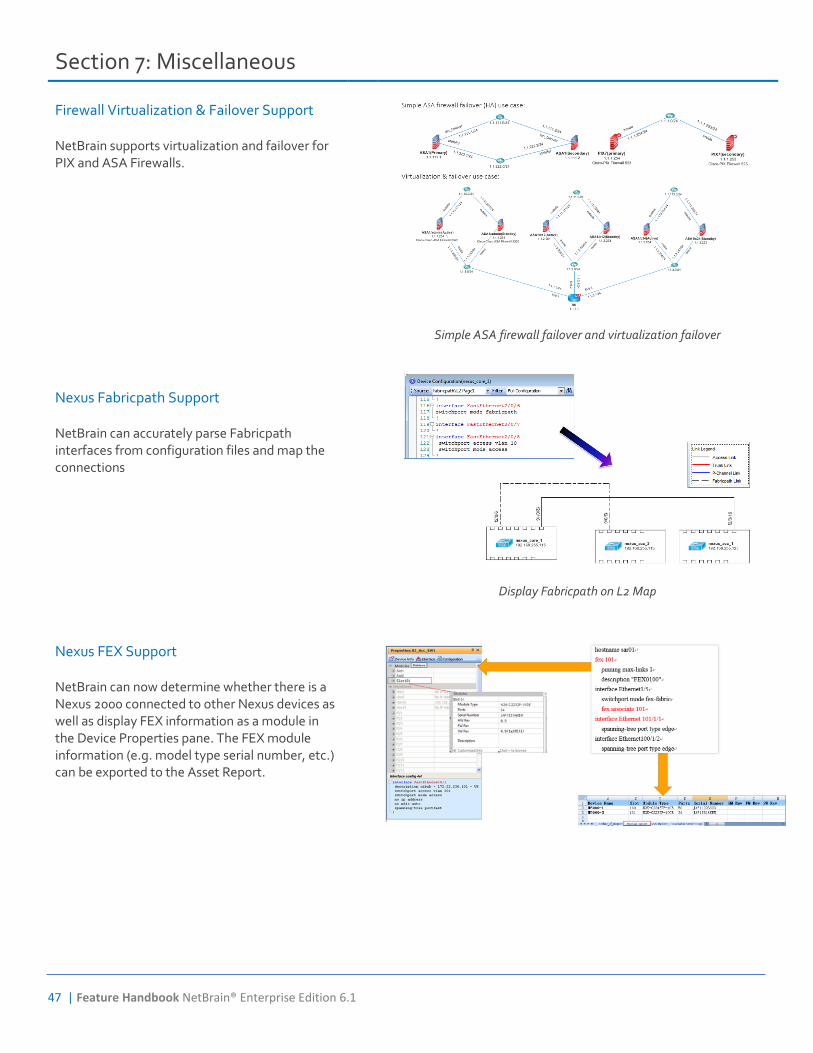
Firewall Virtualization & Failover Support NetBrain supports virtualization and failover for PIX and ASA Firewalls.
Simple ASA firewall failover and virtualization failover
Nexus Fabricpath Support NetBrain can accurately parse Fabricpath interfaces from configuration files and map the connections
Display Fabricpath on L2 Map
Nexus FEX Support NetBrain can now determine whether there is a Nexus 2000 connected to other Nexus devices as well as display FEX information as a module in the Device Properties pane. The FEX module information (e.g. model type serial number, etc.) can be exported to the Asset Report.
Feature Handbook NetBrain® Enterprise Edition 6.1 | 48
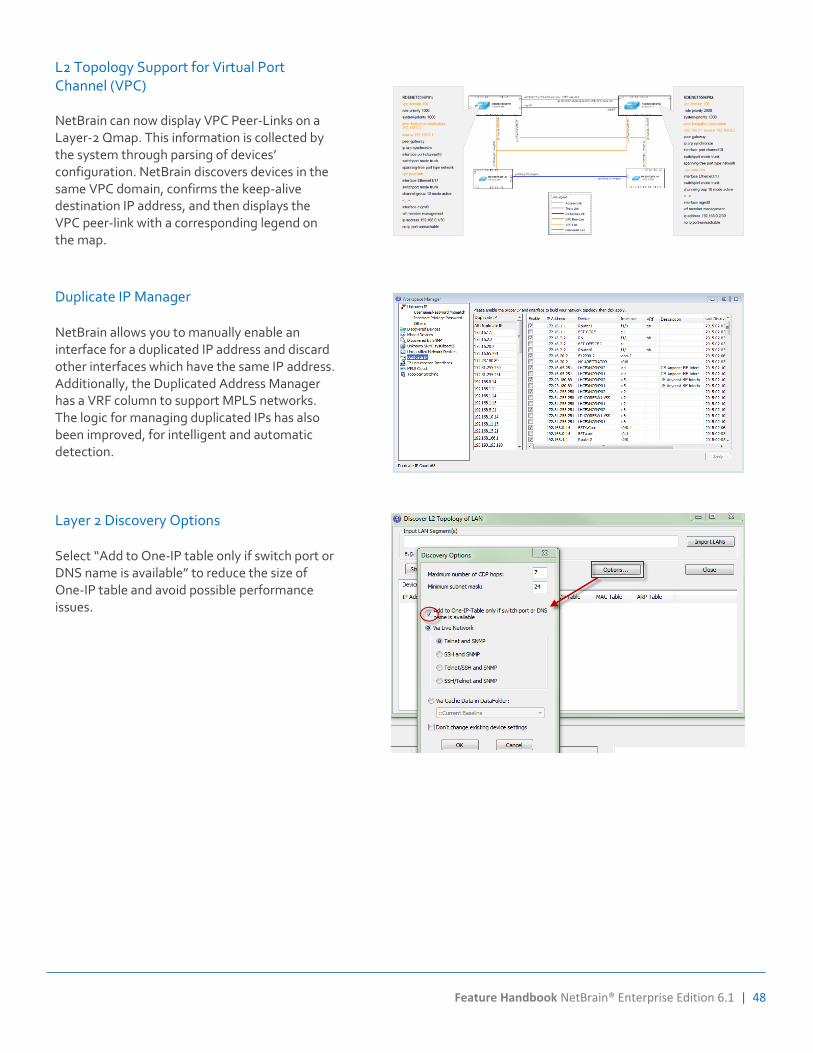
L2 Topology Support for Virtual Port Channel (VPC) NetBrain can now display VPC Peer-Links on a Layer-2 Qmap. This information is collected by the system through parsing of devices’ configuration. NetBrain discovers devices in the same VPC domain, confirms the keep-alive destination IP address, and then displays the VPC peer-link with a corresponding legend on the map.
Duplicate IP Manager NetBrain allows you to manually enable an interface for a duplicated IP address and discard other interfaces which have the same IP address. Additionally, the Duplicated Address Manager has a VRF column to support MPLS networks. The logic for managing duplicated IPs has also been improved, for intelligent and automatic detection.
Layer 2 Discovery Options Select “Add to One-IP table only if switch port or DNS name is available” to reduce the size of One-IP table and avoid possible performance issues.