Embed Size (px)
Citation preview
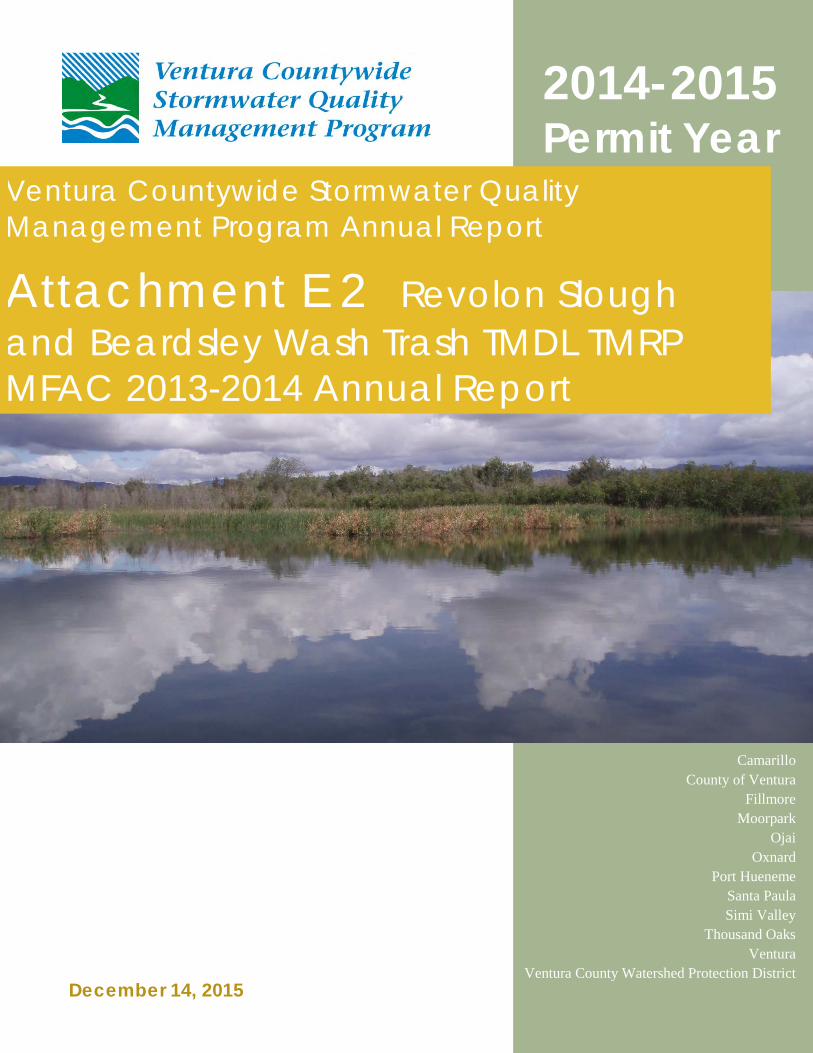
December 14, 2015
2014-2015 Permit Year
Camarillo County of Ventura
Fillmore Moorpark
Ojai Oxnard
Port Hueneme Santa Paula Simi Valley
Thousand Oaks Ventura
Ventura County Watershed Protection District
Ventura Countywide Stormwater Quality Management Program Annual Report
Attachment E 2 Revolon Slough and Beardsley Wash Trash TMDL TMRP MFAC 2013-2014 Annual Report
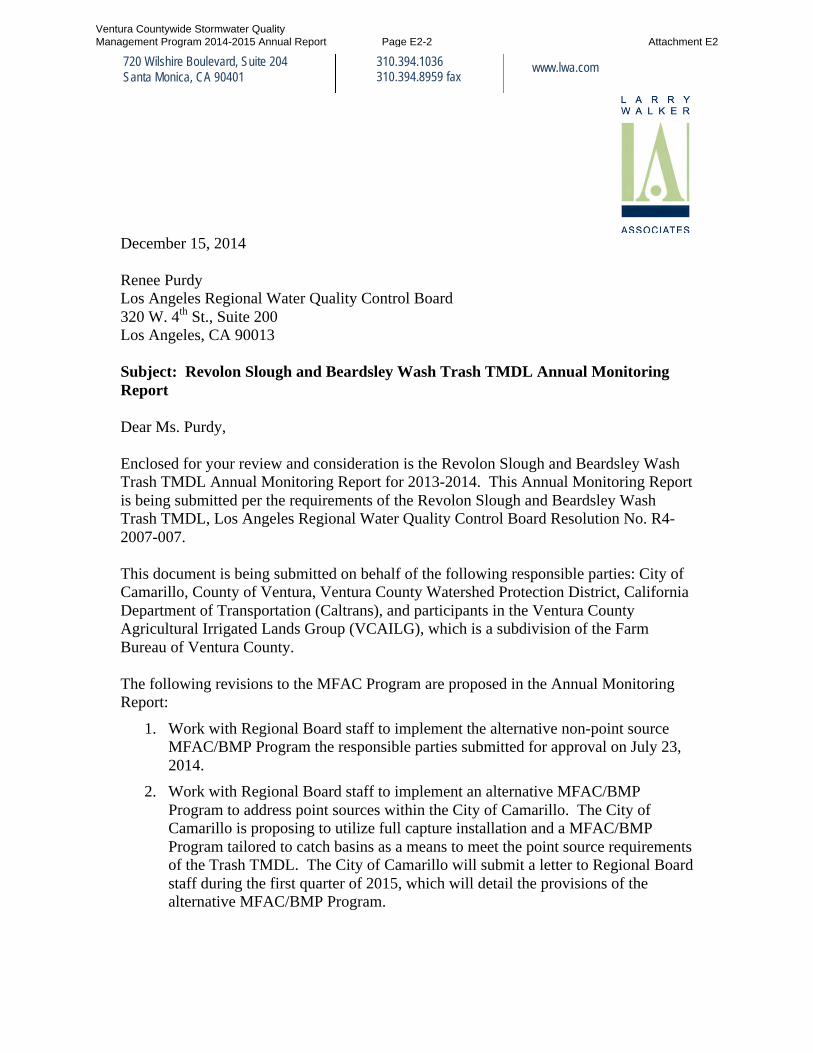
December 15, 2014 Renee Purdy Los Angeles Regional Water Quality Control Board 320 W. 4th St., Suite 200 Los Angeles, CA 90013 Subject: Revolon Slough and Beardsley Wash Trash TMDL Annual Monitoring Report Dear Ms. Purdy, Enclosed for your review and consideration is the Revolon Slough and Beardsley Wash Trash TMDL Annual Monitoring Report for 2013-2014. This Annual Monitoring Report is being submitted per the requirements of the Revolon Slough and Beardsley Wash Trash TMDL, Los Angeles Regional Water Quality Control Board Resolution No. R4-2007-007. This document is being submitted on behalf of the following responsible parties: City of Camarillo, County of Ventura, Ventura County Watershed Protection District, California Department of Transportation (Caltrans), and participants in the Ventura County Agricultural Irrigated Lands Group (VCAILG), which is a subdivision of the Farm Bureau of Ventura County. The following revisions to the MFAC Program are proposed in the Annual Monitoring Report:
1. Work with Regional Board staff to implement the alternative non-point source MFAC/BMP Program the responsible parties submitted for approval on July 23, 2014.
2. Work with Regional Board staff to implement an alternative MFAC/BMP Program to address point sources within the City of Camarillo. The City of Camarillo is proposing to utilize full capture installation and a MFAC/BMP Program tailored to catch basins as a means to meet the point source requirements of the Trash TMDL. The City of Camarillo will submit a letter to Regional Board staff during the first quarter of 2015, which will detail the provisions of the alternative MFAC/BMP Program.
720 Wilshire Boulevard, Suite 204 Santa Monica, CA 90401
310.394.1036 310.394.8959 fax
www.lwa.com
Ventura Countywide Stormwater Quality Management Program 2014-2015 Annual Report Page E2-2 Attachment E2
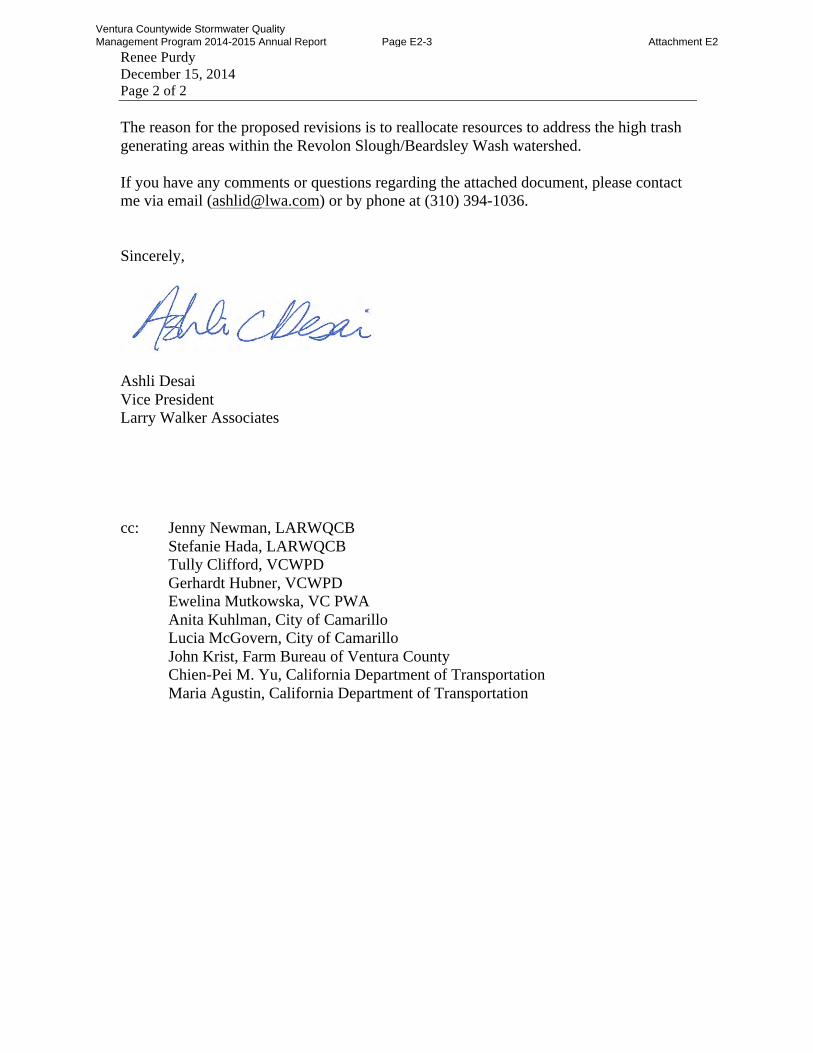
Renee Purdy December 15, 2014 Page 2 of 2 The reason for the proposed revisions is to reallocate resources to address the high trash generating areas within the Revolon Slough/Beardsley Wash watershed. If you have any comments or questions regarding the attached document, please contact me via email ([email protected]) or by phone at (310) 394-1036. Sincerely,
Ashli Desai Vice President Larry Walker Associates cc: Jenny Newman, LARWQCB
Stefanie Hada, LARWQCB Tully Clifford, VCWPD Gerhardt Hubner, VCWPD Ewelina Mutkowska, VC PWA Anita Kuhlman, City of Camarillo
Lucia McGovern, City of Camarillo John Krist, Farm Bureau of Ventura County Chien-Pei M. Yu, California Department of Transportation Maria Agustin, California Department of Transportation
Ventura Countywide Stormwater Quality Management Program 2014-2015 Annual Report Page E2-3 Attachment E2
TMRP Annual R
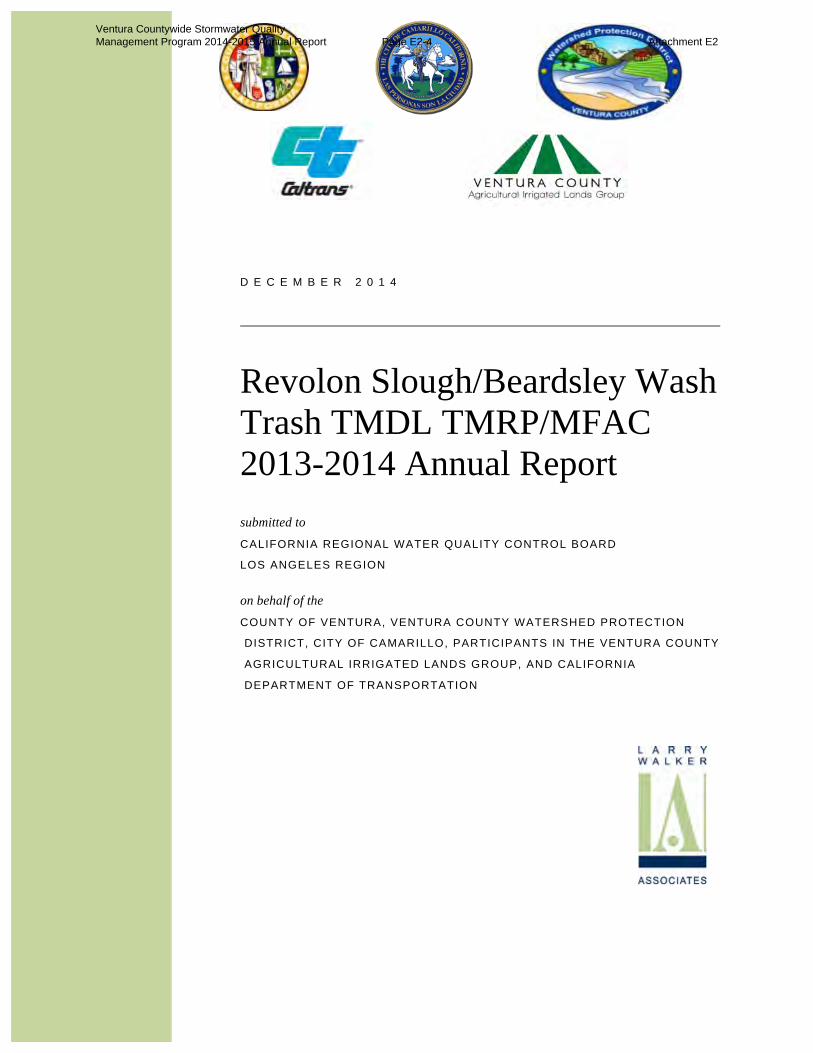
D E C E M B E R 2 0 1 4
Revolon Slough/Beardsley Wash Trash TMDL TMRP/MFAC 2013-2014 Annual Report
submitted to CALIFORNIA REGIONAL WATER QUALITY CONTROL BOARD
LOS ANGELES REGION
on behalf of the COUNTY OF VENTURA, VENTURA COUNTY WATERSHED PROTECTION
DISTRICT, CITY OF CAMARILLO, PARTICIPANTS IN THE VENTURA COUNTY
AGRICULTURAL IRRIGATED LANDS GROUP, AND CALIFORNIA
DEPARTMENT OF TRANSPORTATION
Ventura Countywide Stormwater Quality Management Program 2014-2015 Annual Report Page E2-4 Attachment E2
This page intentionally left blank
Ventura Countywide Stormwater Quality Management Program 2014-2015 Annual Report Page E2-5 Attachment E2
i
Table of Contents
List of Tables .................................................................................................................................... ii
List of Figures ................................................................................................................................... ii List of Appendices ............................................................................................................................ ii
Executive Summary ......................................................................................................................... iii 1 Overview ...................................................................................................................................... 1
2 Assessment Site Locations ........................................................................................................... 2 2.1 Site Locations ................................................................................................................... 2
3 Completed Monitoring Events ..................................................................................................... 4 4 Data Summary and Analysis ......................................................................................................... 5
4.1 Trash Weight .................................................................................................................... 5 4.2 Trash Pieces ...................................................................................................................... 8
5 Data Evaluation ........................................................................................................................... 10 5.1 MFAC/BMP Program Effectiveness .............................................................................. 10
5.2 High Trash Generating Areas ......................................................................................... 11 6 Compliance Strategy ................................................................................................................... 11
6.1 Current Best Management Practices .............................................................................. 12 6.1.1 City of Camarillo Litter Management Program ............................................................. 12
6.1.2 County of Ventura and VCWPD Litter Management Program ..................................... 14 6.1.3 VCAILG Litter Management Program .......................................................................... 16
6.1.4 Caltrans Litter Management Program ............................................................................ 16 6.2 Future Potential Best Management Practices ................................................................. 17
6.2.1 City of Camarillo Litter Management Program ............................................................. 17 6.2.2 County of Ventura and VCWPD Litter Management Program ..................................... 17
6.2.3 VCAILG Litter Management Program .......................................................................... 18 6.2.4 Caltrans Litter Management Program ............................................................................ 18
6.3 Best Management Practices Implementation Schedule .................................................. 18 7 MFAC Revisions ........................................................................................................................ 19
Ventura Countywide Stormwater Quality Management Program 2014-2015 Annual Report Page E2-6 Attachment E2
ii
List of Tables
Table 1. Responsible Parties Participating in this TMRP and MFAC/BMP Program .................... 1
Table 2. TMRP Fifth-Year Monitoring Event Frequency ............................................................... 4 Table 3. Completed Monitoring Events (October 2013 – September 2014) ................................... 4
Table 4. Total Weight of Trash Collected per Site and per Month (October 2013 – September 2014) ........................................................................................................................................ 5
Table 5. Total Weight of Trash Collected per Site and per Month (October 2012 – September 2013) ........................................................................................................................................ 6
Table 6. Total Pieces of Trash Collected per Site and per Month (October 2013 – September 2014) ........................................................................................................................................ 8
Table 7. Trash Pieces Collected 2009-20141 ................................................................................. 10
List of Figures
Figure 1. TMRP/MFAC Program Sites ........................................................................................... 3 Figure 2. Total Weight of Trash Collected per Site and per Month (October 2013 – September
2014) ........................................................................................................................................ 7 Figure 3. Total Trash Collected Per Month (October 2013 – September 2014) ............................. 9
Figure 4. Total Trash Collected Per Site (October 2013 – September 2014) .................................. 9
List of Appendices
Appendix 1. Assessment Site Descriptions
Appendix 2. MFAC Event Photos Appendix 3. Special Clean-Up Photos
Ventura Countywide Stormwater Quality Management Program 2014-2015 Annual Report Page E2-7 Attachment E2
iii
Executive Summary
The purpose of this report is to present the results of the fifth-year (2013-2014) monitoring efforts conducted in accordance with the Revolon Slough and Beardsley Wash Trash TMDL (Trash TMDL), which is effective as of March 6, 2008, and the Trash Monitoring and Reporting Plan (TMRP) Minimum Frequency of Assessment and Collection/Best Management Practice (MFAC/BMP) Program. The responsible parties are complying with the non-point source requirements of the Trash TMDL through the implementation of a MFAC/BMP Program and complying with the point source requirements through the installation of certified trash full capture devices on all responsible parties’ conveyances discharging to Revolon Slough and Beardsley Wash.
There are conflicting results in the trends of trash reduction when you consider the number of pieces of trash and the weight of the trash collected over the past several monitoring years. As expected, evaluation of the results indicates that changes in the trash quantities present in Revolon Slough and Beardsley Wash cannot be accurately assessed based on either the pieces of trash collected or the weight of the trash collected. Regardless of efforts taken by the responsible parties including monthly clean-up events in addition to MFAC events, flat terrain in the close vicinity of the channels prone to random deposits of air borne trash and illegal dumping despite regulations, local laws, and other factors, contribute to confusing monitoring results and data trends. However, the MFAC/BMP Program resulted in zero trash in-stream immediately after all monitoring events indicating compliance for non-point source-responsible parties.
Non-point source-responsible parties will continue to conduct all required MFAC events and implement BMPs at high trash generating areas as well as watershed-wide to reduce the discharge of trash from their jurisdictions to minimize the impact of trash in the watershed. Based on the inability to assess changes in trash quantities via weight or pieces of trash, the Responsible Parties submitted a request to the Los Angeles Regional Water Quality Control Board (Regional Board) staff to consider implementation of more effective monitoring and reporting strategy. The proposal is based on a visual assessment program recently approved for Ventura River Estuary Trash TMDL to focus resources on removing trash instead of counting or weighing the trash. The Responsible Parties believe this new method will provide for a more efficient MFAC/BMP Program and have the effect of reducing trash found in Revolon Slough and Beardsley Wash and will continue to work with Regional Board staff to implement the changes.
To address point sources, the Responsible Parties, where feasible, will install full capture devices on conveyances discharging to Revolon Slough and Beardsley Wash and/or install full capture devices in high trash generating areas and employ a point source-specific MFAC/BMP Program in other areas of their jurisdictions. The goal is to meet the required phased percent reductions as listed in Table 7-24.2a of the Trash TMDL by March 2016. The City of Camarillo is proposing to use a point source-specific MFAC/BMP Program focused on catch basins in combination with installing full capture devices in high trash generating areas to achieve compliance with the point source requirements of the Trash TMDL. The City of Camarillo will submit a letter to Regional Board staff providing the details of the point source-specific MFAC/BMP Program by the first quarter of 2015.
Ventura Countywide Stormwater Quality Management Program 2014-2015 Annual Report Page E2-8 Attachment E2
iv
This page intentionally left blank
Ventura Countywide Stormwater Quality Management Program 2014-2015 Annual Report Page E2-9 Attachment E2
RSBW TMRP Annual Report 1 December 2014
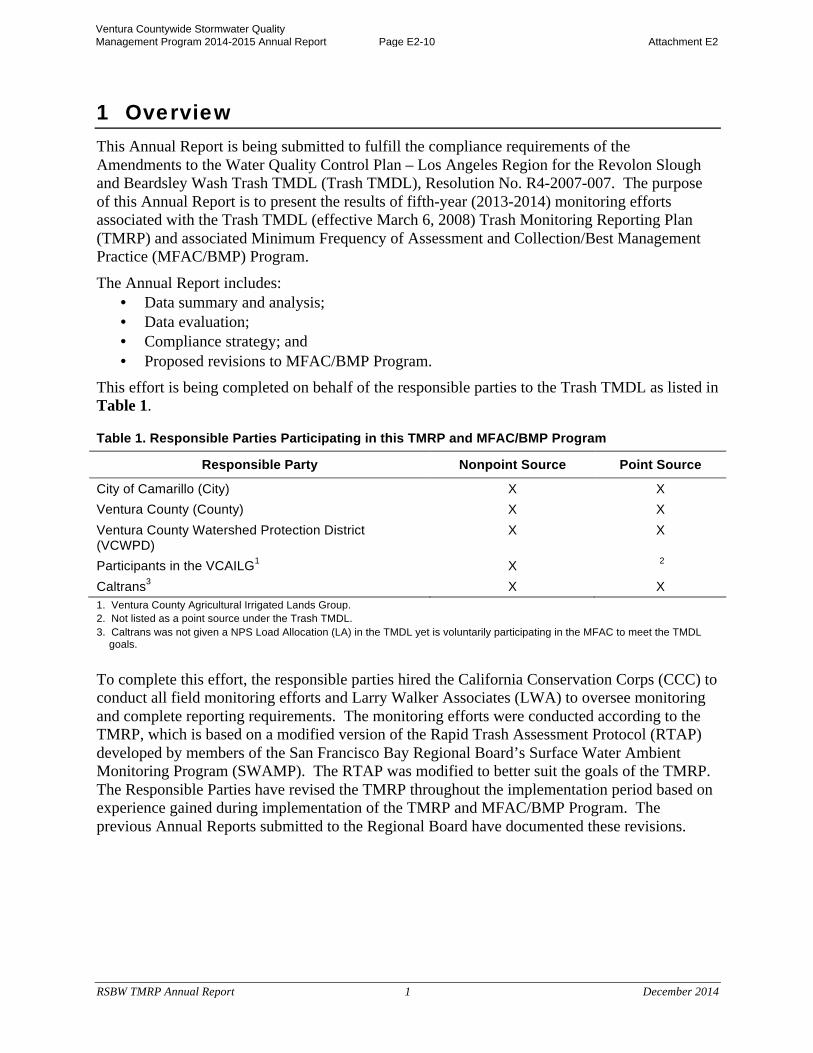
1 Overview
This Annual Report is being submitted to fulfill the compliance requirements of the Amendments to the Water Quality Control Plan – Los Angeles Region for the Revolon Slough and Beardsley Wash Trash TMDL (Trash TMDL), Resolution No. R4-2007-007. The purpose of this Annual Report is to present the results of fifth-year (2013-2014) monitoring efforts associated with the Trash TMDL (effective March 6, 2008) Trash Monitoring Reporting Plan (TMRP) and associated Minimum Frequency of Assessment and Collection/Best Management Practice (MFAC/BMP) Program.
The Annual Report includes: • Data summary and analysis; • Data evaluation; • Compliance strategy; and • Proposed revisions to MFAC/BMP Program.
This effort is being completed on behalf of the responsible parties to the Trash TMDL as listed in Table 1.
Table 1. Responsible Parties Participating in this TMRP and MFAC/BMP Program
Responsible Party Nonpoint Source Point Source
City of Camarillo (City) X X Ventura County (County) X X Ventura County Watershed Protection District (VCWPD)
X X
Participants in the VCAILG1 X 2 Caltrans3 X X 1. Ventura County Agricultural Irrigated Lands Group. 2. Not listed as a point source under the Trash TMDL. 3. Caltrans was not given a NPS Load Allocation (LA) in the TMDL yet is voluntarily participating in the MFAC to meet the TMDL
goals.
To complete this effort, the responsible parties hired the California Conservation Corps (CCC) to conduct all field monitoring efforts and Larry Walker Associates (LWA) to oversee monitoring and complete reporting requirements. The monitoring efforts were conducted according to the TMRP, which is based on a modified version of the Rapid Trash Assessment Protocol (RTAP) developed by members of the San Francisco Bay Regional Board’s Surface Water Ambient Monitoring Program (SWAMP). The RTAP was modified to better suit the goals of the TMRP. The Responsible Parties have revised the TMRP throughout the implementation period based on experience gained during implementation of the TMRP and MFAC/BMP Program. The previous Annual Reports submitted to the Regional Board have documented these revisions.
Ventura Countywide Stormwater Quality Management Program 2014-2015 Annual Report Page E2-10 Attachment E2
RSBW TMRP Annual Report 2 December 2014
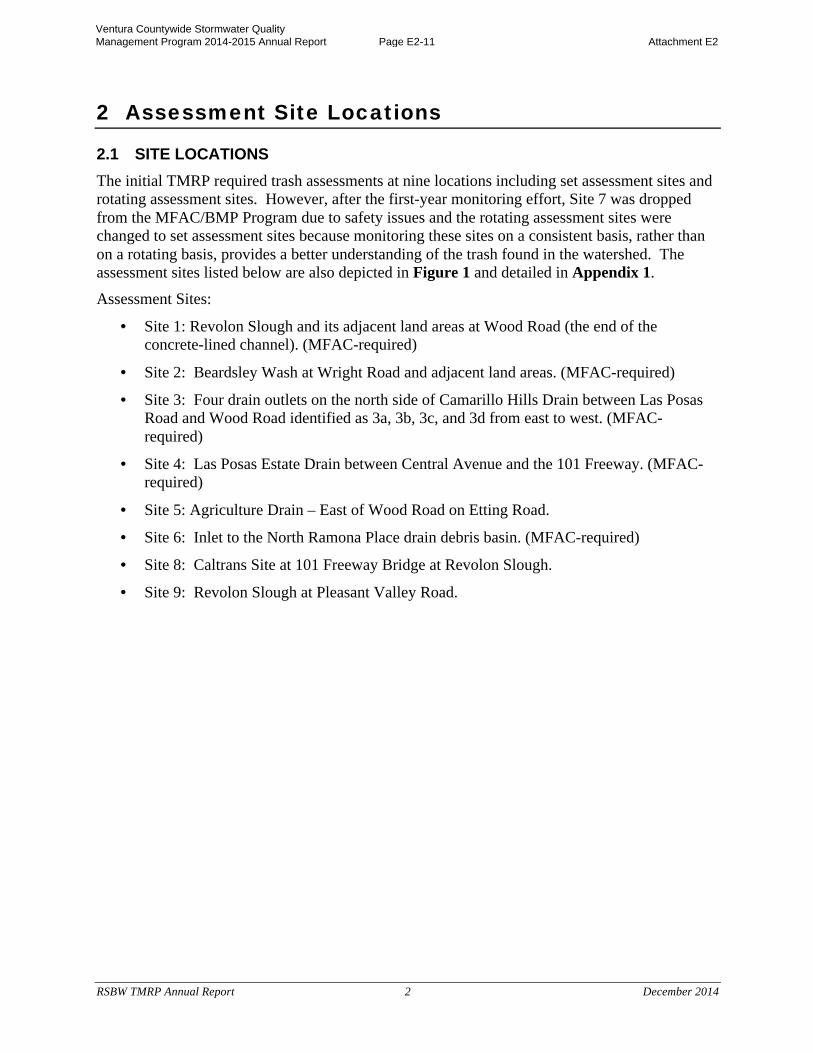
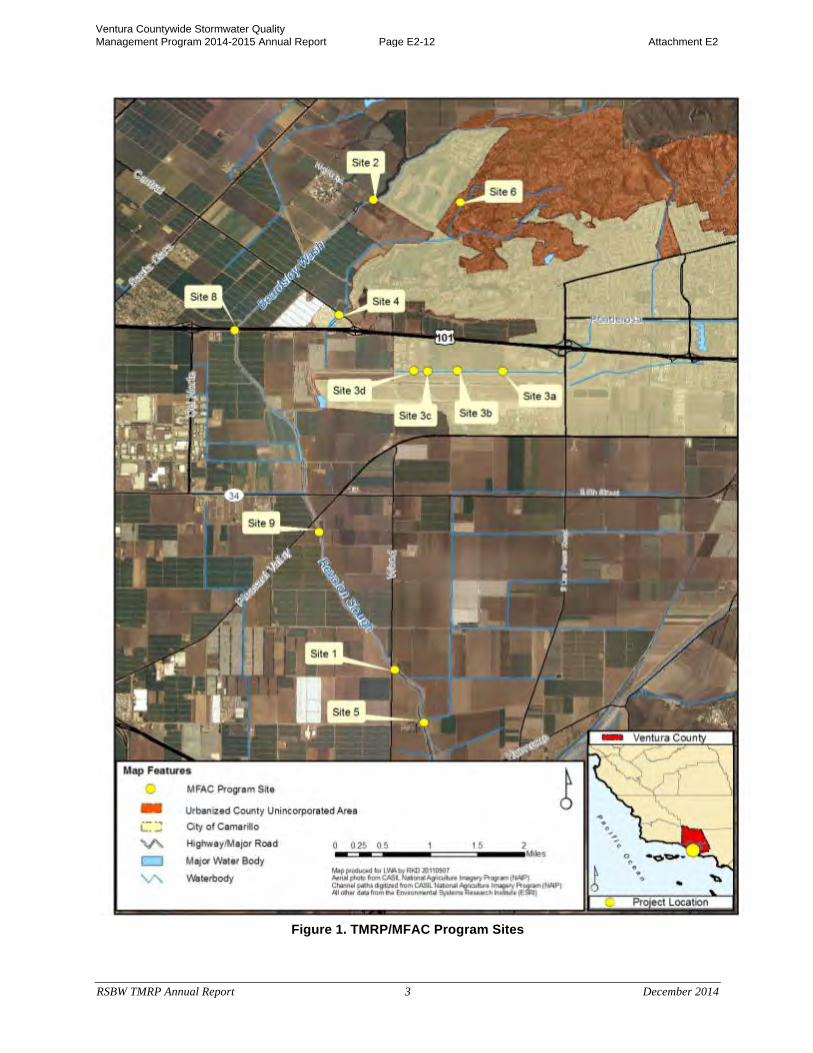
2 Assessment Site Locations
2.1 SITE LOCATIONS The initial TMRP required trash assessments at nine locations including set assessment sites and rotating assessment sites. However, after the first-year monitoring effort, Site 7 was dropped from the MFAC/BMP Program due to safety issues and the rotating assessment sites were changed to set assessment sites because monitoring these sites on a consistent basis, rather than on a rotating basis, provides a better understanding of the trash found in the watershed. The assessment sites listed below are also depicted in Figure 1 and detailed in Appendix 1.
Assessment Sites:
• Site 1: Revolon Slough and its adjacent land areas at Wood Road (the end of the concrete-lined channel). (MFAC-required)
• Site 2: Beardsley Wash at Wright Road and adjacent land areas. (MFAC-required)
• Site 3: Four drain outlets on the north side of Camarillo Hills Drain between Las Posas Road and Wood Road identified as 3a, 3b, 3c, and 3d from east to west. (MFAC-required)
• Site 4: Las Posas Estate Drain between Central Avenue and the 101 Freeway. (MFAC-required)
• Site 5: Agriculture Drain – East of Wood Road on Etting Road.
• Site 6: Inlet to the North Ramona Place drain debris basin. (MFAC-required)
• Site 8: Caltrans Site at 101 Freeway Bridge at Revolon Slough.
• Site 9: Revolon Slough at Pleasant Valley Road.
Ventura Countywide Stormwater Quality Management Program 2014-2015 Annual Report Page E2-11 Attachment E2
RSBW TMRP Annual Report 3 December 2014
Figure 1. TMRP/MFAC Program Sites
Ventura Countywide Stormwater Quality Management Program 2014-2015 Annual Report Page E2-12 Attachment E2
RSBW TMRP Annual Report 4 December 2014
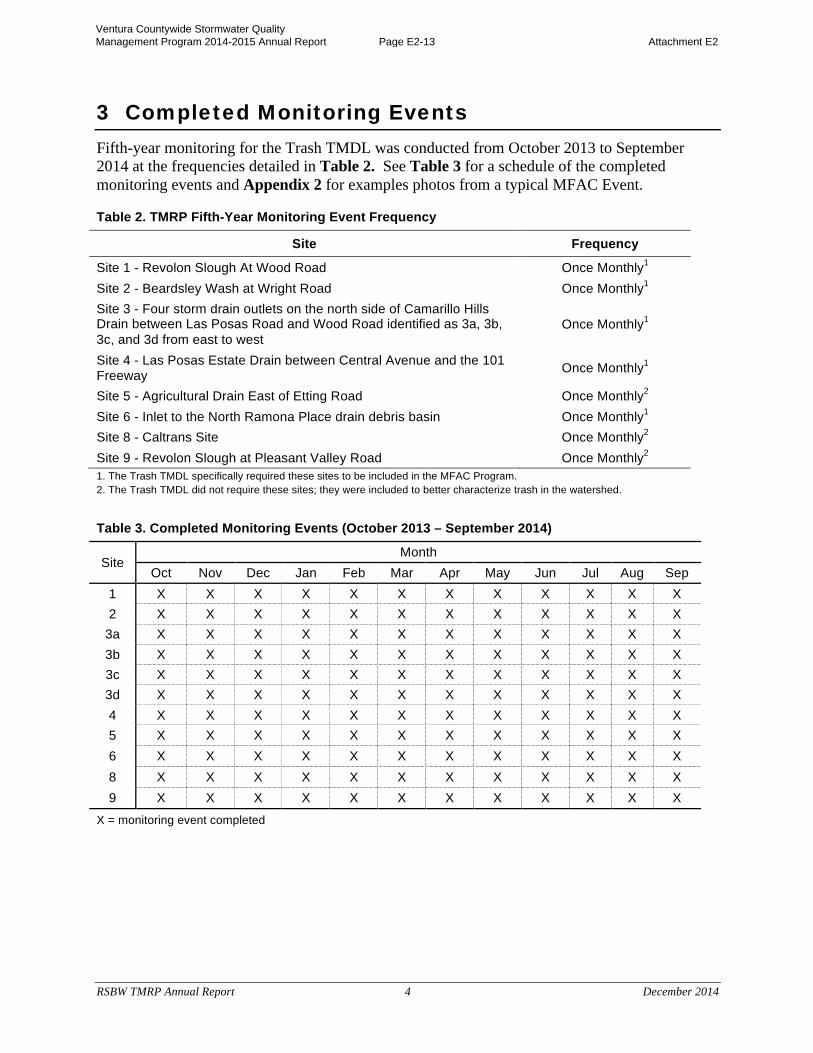
3 Completed Monitoring Events
Fifth-year monitoring for the Trash TMDL was conducted from October 2013 to September 2014 at the frequencies detailed in Table 2. See Table 3 for a schedule of the completed monitoring events and Appendix 2 for examples photos from a typical MFAC Event.
Table 2. TMRP Fifth-Year Monitoring Event Frequency
Site Frequency
Site 1 - Revolon Slough At Wood Road Once Monthly1 Site 2 - Beardsley Wash at Wright Road Once Monthly1 Site 3 - Four storm drain outlets on the north side of Camarillo Hills Drain between Las Posas Road and Wood Road identified as 3a, 3b, 3c, and 3d from east to west
Once Monthly1
Site 4 - Las Posas Estate Drain between Central Avenue and the 101 Freeway Once Monthly1
Site 5 - Agricultural Drain East of Etting Road Once Monthly2
Site 6 - Inlet to the North Ramona Place drain debris basin Once Monthly1 Site 8 - Caltrans Site Once Monthly2 Site 9 - Revolon Slough at Pleasant Valley Road Once Monthly2 1. The Trash TMDL specifically required these sites to be included in the MFAC Program. 2. The Trash TMDL did not require these sites; they were included to better characterize trash in the watershed.
Table 3. Completed Monitoring Events (October 2013 – September 2014)
Site Month
Oct Nov Dec Jan Feb Mar Apr May Jun Jul Aug Sep 1 X X X X X X X X X X X X 2 X X X X X X X X X X X X
3a X X X X X X X X X X X X 3b X X X X X X X X X X X X 3c X X X X X X X X X X X X 3d X X X X X X X X X X X X 4 X X X X X X X X X X X X 5 X X X X X X X X X X X X 6 X X X X X X X X X X X X 8 X X X X X X X X X X X X 9 X X X X X X X X X X X X
X = monitoring event completed
Ventura Countywide Stormwater Quality Management Program 2014-2015 Annual Report Page E2-13 Attachment E2
RSBW TMRP Annual Report 5 December 2014
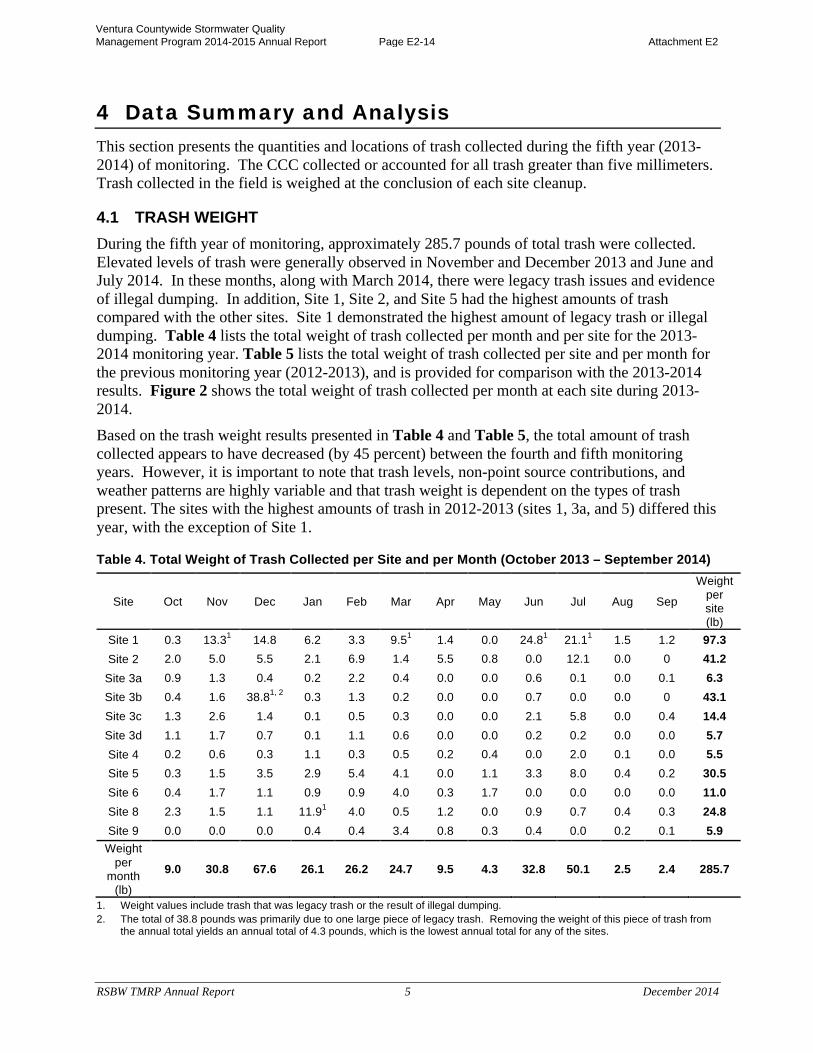
4 Data Summary and Analysis
This section presents the quantities and locations of trash collected during the fifth year (2013-2014) of monitoring. The CCC collected or accounted for all trash greater than five millimeters. Trash collected in the field is weighed at the conclusion of each site cleanup.
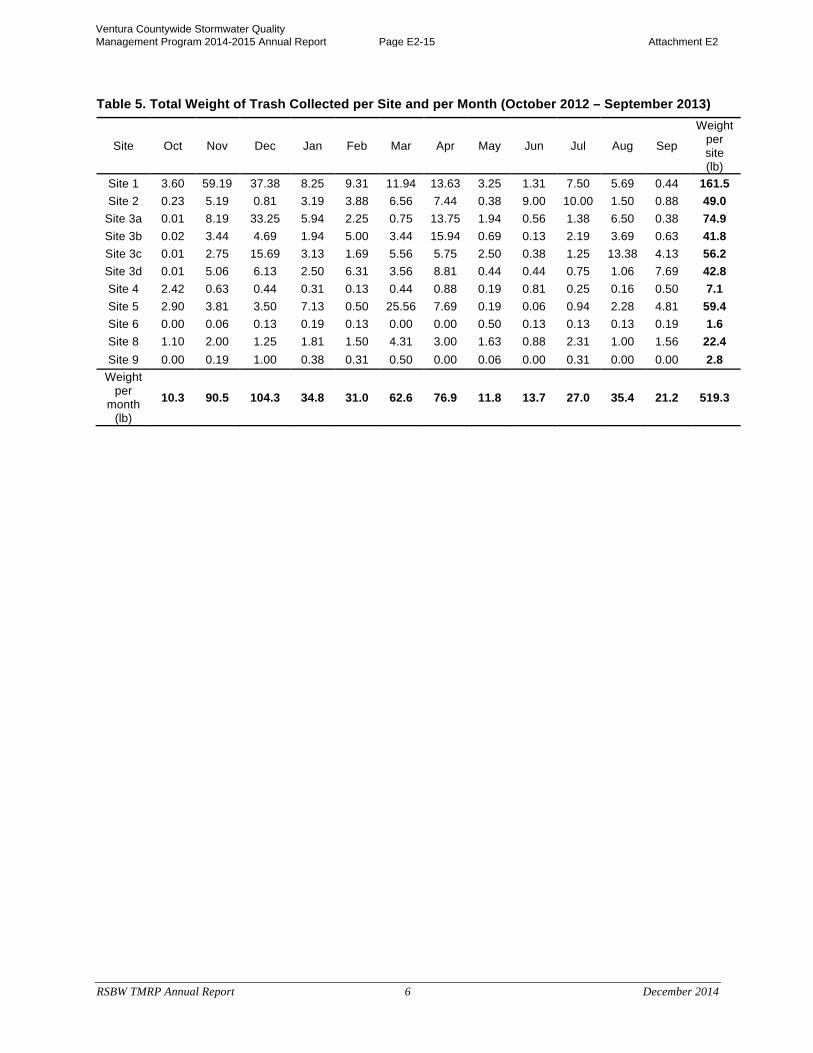
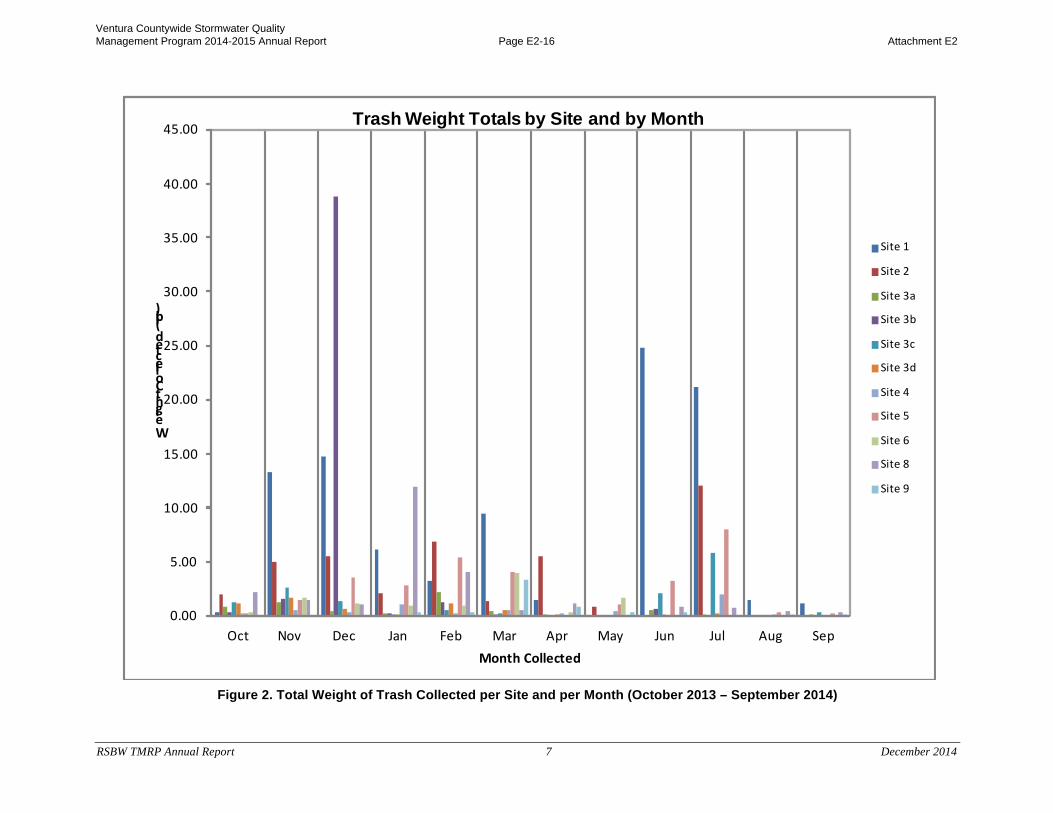
4.1 TRASH WEIGHT During the fifth year of monitoring, approximately 285.7 pounds of total trash were collected. Elevated levels of trash were generally observed in November and December 2013 and June and July 2014. In these months, along with March 2014, there were legacy trash issues and evidence of illegal dumping. In addition, Site 1, Site 2, and Site 5 had the highest amounts of trash compared with the other sites. Site 1 demonstrated the highest amount of legacy trash or illegal dumping. Table 4 lists the total weight of trash collected per month and per site for the 2013-2014 monitoring year. Table 5 lists the total weight of trash collected per site and per month for the previous monitoring year (2012-2013), and is provided for comparison with the 2013-2014 results. Figure 2 shows the total weight of trash collected per month at each site during 2013-2014. Based on the trash weight results presented in Table 4 and Table 5, the total amount of trash collected appears to have decreased (by 45 percent) between the fourth and fifth monitoring years. However, it is important to note that trash levels, non-point source contributions, and weather patterns are highly variable and that trash weight is dependent on the types of trash present. The sites with the highest amounts of trash in 2012-2013 (sites 1, 3a, and 5) differed this year, with the exception of Site 1.
Table 4. Total Weight of Trash Collected per Site and per Month (October 2013 – September 2014)
Site Oct Nov Dec Jan Feb Mar Apr May Jun Jul Aug Sep
Weight per site (lb)
Site 1 0.3 13.31 14.8 6.2 3.3 9.51 1.4 0.0 24.81 21.11 1.5 1.2 97.3 Site 2 2.0 5.0 5.5 2.1 6.9 1.4 5.5 0.8 0.0 12.1 0.0 0 41.2
Site 3a 0.9 1.3 0.4 0.2 2.2 0.4 0.0 0.0 0.6 0.1 0.0 0.1 6.3 Site 3b 0.4 1.6 38.81, 2 0.3 1.3 0.2 0.0 0.0 0.7 0.0 0.0 0 43.1 Site 3c 1.3 2.6 1.4 0.1 0.5 0.3 0.0 0.0 2.1 5.8 0.0 0.4 14.4 Site 3d 1.1 1.7 0.7 0.1 1.1 0.6 0.0 0.0 0.2 0.2 0.0 0.0 5.7 Site 4 0.2 0.6 0.3 1.1 0.3 0.5 0.2 0.4 0.0 2.0 0.1 0.0 5.5 Site 5 0.3 1.5 3.5 2.9 5.4 4.1 0.0 1.1 3.3 8.0 0.4 0.2 30.5 Site 6 0.4 1.7 1.1 0.9 0.9 4.0 0.3 1.7 0.0 0.0 0.0 0.0 11.0 Site 8 2.3 1.5 1.1 11.91 4.0 0.5 1.2 0.0 0.9 0.7 0.4 0.3 24.8 Site 9 0.0 0.0 0.0 0.4 0.4 3.4 0.8 0.3 0.4 0.0 0.2 0.1 5.9
Weight per
month (lb)
9.0 30.8 67.6 26.1 26.2 24.7 9.5 4.3 32.8 50.1 2.5 2.4 285.7
1. Weight values include trash that was legacy trash or the result of illegal dumping. 2. The total of 38.8 pounds was primarily due to one large piece of legacy trash. Removing the weight of this piece of trash from
the annual total yields an annual total of 4.3 pounds, which is the lowest annual total for any of the sites.
Ventura Countywide Stormwater Quality Management Program 2014-2015 Annual Report Page E2-14 Attachment E2
RSBW TMRP Annual Report 6 December 2014
Table 5. Total Weight of Trash Collected per Site and per Month (October 2012 – September 2013)
Site Oct Nov Dec Jan Feb Mar Apr May Jun Jul Aug Sep
Weight per site (lb)
Site 1 3.60 59.19 37.38 8.25 9.31 11.94 13.63 3.25 1.31 7.50 5.69 0.44 161.5 Site 2 0.23 5.19 0.81 3.19 3.88 6.56 7.44 0.38 9.00 10.00 1.50 0.88 49.0
Site 3a 0.01 8.19 33.25 5.94 2.25 0.75 13.75 1.94 0.56 1.38 6.50 0.38 74.9 Site 3b 0.02 3.44 4.69 1.94 5.00 3.44 15.94 0.69 0.13 2.19 3.69 0.63 41.8 Site 3c 0.01 2.75 15.69 3.13 1.69 5.56 5.75 2.50 0.38 1.25 13.38 4.13 56.2 Site 3d 0.01 5.06 6.13 2.50 6.31 3.56 8.81 0.44 0.44 0.75 1.06 7.69 42.8 Site 4 2.42 0.63 0.44 0.31 0.13 0.44 0.88 0.19 0.81 0.25 0.16 0.50 7.1 Site 5 2.90 3.81 3.50 7.13 0.50 25.56 7.69 0.19 0.06 0.94 2.28 4.81 59.4 Site 6 0.00 0.06 0.13 0.19 0.13 0.00 0.00 0.50 0.13 0.13 0.13 0.19 1.6 Site 8 1.10 2.00 1.25 1.81 1.50 4.31 3.00 1.63 0.88 2.31 1.00 1.56 22.4 Site 9 0.00 0.19 1.00 0.38 0.31 0.50 0.00 0.06 0.00 0.31 0.00 0.00 2.8
Weight per
month (lb)
10.3 90.5 104.3 34.8 31.0 62.6 76.9 11.8 13.7 27.0 35.4 21.2 519.3
Ventura Countywide Stormwater Quality Management Program 2014-2015 Annual Report Page E2-15 Attachment E2
RSBW TMRP Annual Report 7 December 2014
Figure 2. Total Weight of Trash Collected per Site and per Month (October 2013 – September 2014)
0.00
5.00
10.00
15.00
20.00
25.00
30.00
35.00
40.00
45.00
Oct Nov Dec Jan Feb Mar Apr May Jun Jul Aug Sep
Weight Collected (lb)
Month Collected
Trash Weight Totals by Site and by Month
Site 1
Site 2
Site 3a
Site 3b
Site 3c
Site 3d
Site 4
Site 5
Site 6
Site 8
Site 9
Ventura Countywide Stormwater Quality Management Program 2014-2015 Annual Report Page E2-16 Attachment E2
RSBW TMRP Annual Report 8 December 2014
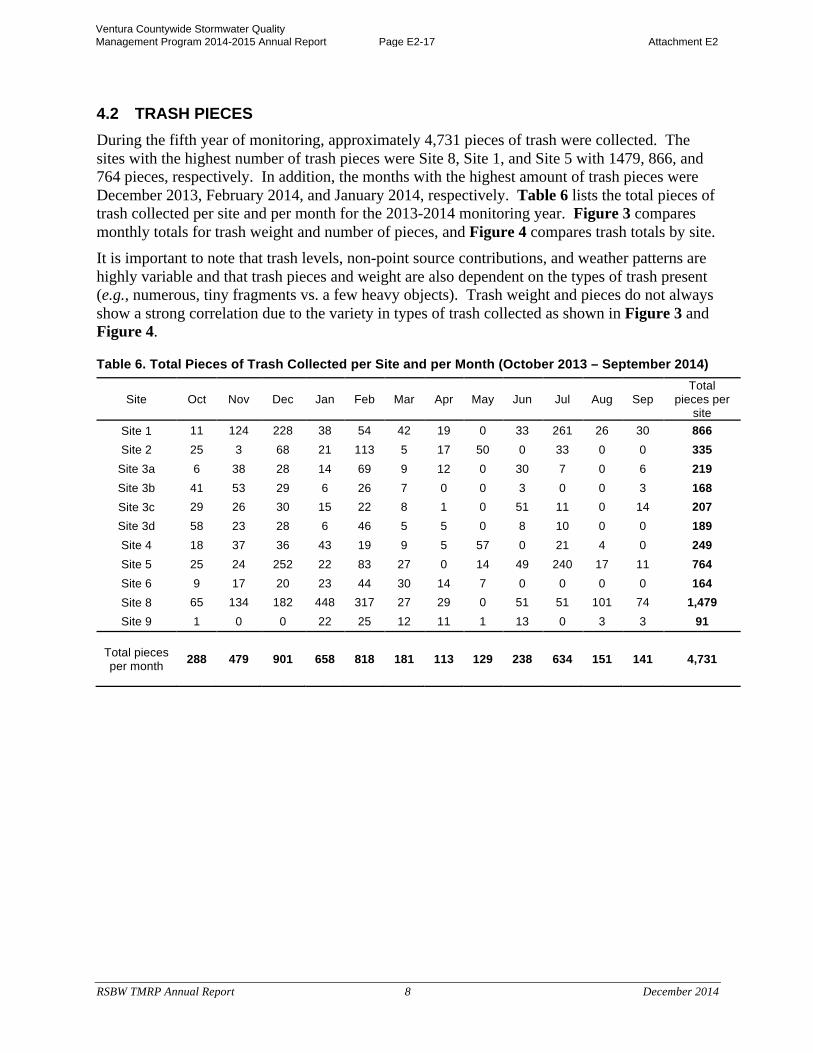
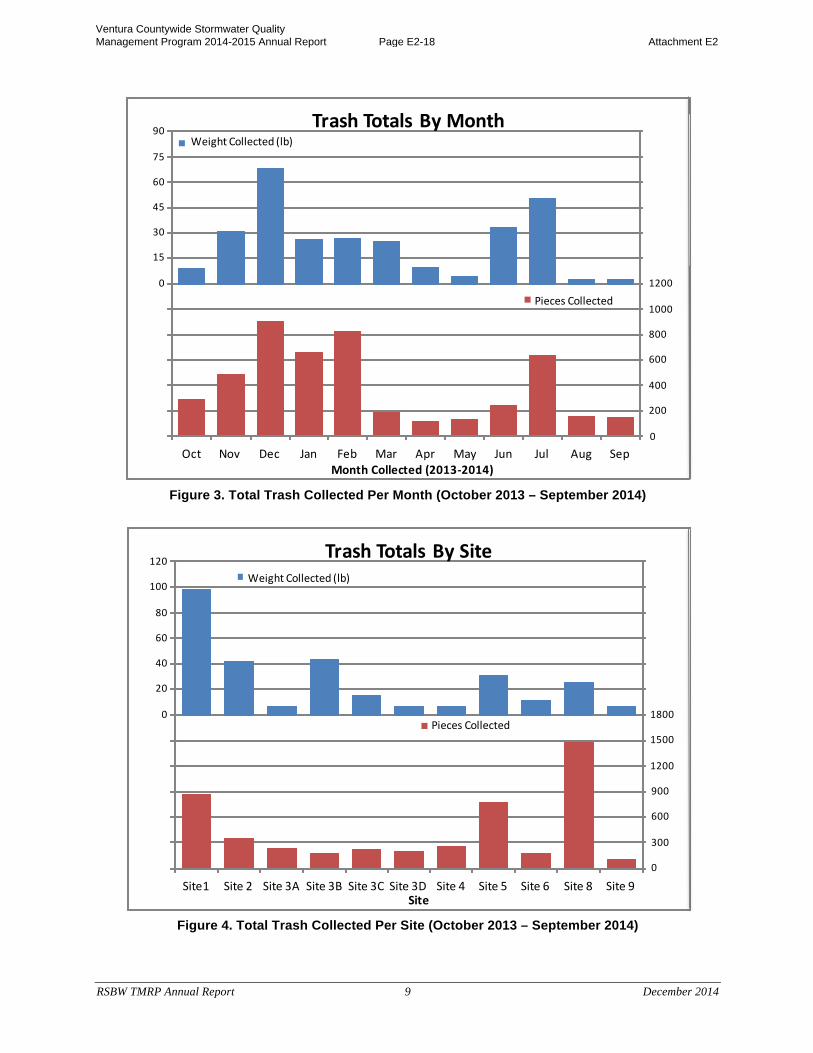
4.2 TRASH PIECES During the fifth year of monitoring, approximately 4,731 pieces of trash were collected. The sites with the highest number of trash pieces were Site 8, Site 1, and Site 5 with 1479, 866, and 764 pieces, respectively. In addition, the months with the highest amount of trash pieces were December 2013, February 2014, and January 2014, respectively. Table 6 lists the total pieces of trash collected per site and per month for the 2013-2014 monitoring year. Figure 3 compares monthly totals for trash weight and number of pieces, and Figure 4 compares trash totals by site. It is important to note that trash levels, non-point source contributions, and weather patterns are highly variable and that trash pieces and weight are also dependent on the types of trash present (e.g., numerous, tiny fragments vs. a few heavy objects). Trash weight and pieces do not always show a strong correlation due to the variety in types of trash collected as shown in Figure 3 and Figure 4.
Table 6. Total Pieces of Trash Collected per Site and per Month (October 2013 – September 2014)
Site Oct Nov Dec Jan Feb Mar Apr May Jun Jul Aug Sep Total
pieces per site
Site 1 11 124 228 38 54 42 19 0 33 261 26 30 866 Site 2 25 3 68 21 113 5 17 50 0 33 0 0 335
Site 3a 6 38 28 14 69 9 12 0 30 7 0 6 219 Site 3b 41 53 29 6 26 7 0 0 3 0 0 3 168 Site 3c 29 26 30 15 22 8 1 0 51 11 0 14 207 Site 3d 58 23 28 6 46 5 5 0 8 10 0 0 189 Site 4 18 37 36 43 19 9 5 57 0 21 4 0 249 Site 5 25 24 252 22 83 27 0 14 49 240 17 11 764 Site 6 9 17 20 23 44 30 14 7 0 0 0 0 164 Site 8 65 134 182 448 317 27 29 0 51 51 101 74 1,479 Site 9 1 0 0 22 25 12 11 1 13 0 3 3 91
Total pieces per month 288 479 901 658 818 181 113 129 238 634 151 141 4,731
Ventura Countywide Stormwater Quality Management Program 2014-2015 Annual Report Page E2-17 Attachment E2
RSBW TMRP Annual Report 9 December 2014
Figure 3. Total Trash Collected Per Month (October 2013 – September 2014)
Figure 4. Total Trash Collected Per Site (October 2013 – September 2014)
Pieces Collected
Weight Collected (lb)
0
200
400
600
800
1000
1200
1400
1600
1800
2000
2200
2400
0
200
400
600
800
1000
1200
1400
1600
1800
2000
2200
2400
Oct Nov Dec Jan Feb Mar Apr May Jun Jul Aug SepMonth Collected (2013-‐2014)
Trash Totals By Month90
75
60
45
30
15
0
0
300
600
900
1200
1500
1800
2100
2400
2700
3000
3300
3600
0
300
600
900
1200
1500
1800
2100
2400
2700
3000
3300
3600
Site1 Site 2 Site 3A Site 3B Site 3C Site 3D Site 4 Site 5 Site 6 Site 8 Site 9Site
Trash Totals By SiteWeight Collected (lb)
Pieces Collected
120
100
80
60
40
20
0
Ventura Countywide Stormwater Quality Management Program 2014-2015 Annual Report Page E2-18 Attachment E2
RSBW TMRP Annual Report 10 December 2014
5 Data Evaluation
Trash data collected from the fifth year of monitoring were evaluated to determine MFAC/BMP Program effectiveness and were also evaluated to identify high trash generating areas where implementation actions may be focused. The following sections provide information on MFAC/BMP Program effectiveness and high trash generating areas.
5.1 MFAC/BMP PROGRAM EFFECTIVENESS As outlined in the TMRP, a further assessment of MFAC/BMP Program effectiveness is to be conducted after each year of monitoring. The following steps were used to assess MFAC/BMP Program effectiveness:
1. A review of BMP implementation, including identification of BMPs, location of BMPs, and time frame (e.g., when an activity was implemented or installed); and
2. A comparison of monitoring results between monitoring locations and between events before and after BMP implementation.
Given the broad nature of most of the BMPs implemented to date (e.g., education programs, ordinances, street sweeping), the highly variable amounts of trash collected over the four years, and the relatively short time frame that full capture devices have been installed, trends were not identified in the monitoring data that could be used to determine effectiveness of individual BMPs. In addition, trash monitoring from the past five years indicates that trash levels are highly variable. During the second monitoring year, implementation of the MFAC/BMP Program appeared to result in significant trash reductions. However, during the third year, the trash levels increased at the same time that additional BMPs were being implemented and full capture devices were being installed. During the fourth monitoring year, trash levels decreased slightly and increased slightly, based on trash weight and trash pieces, respectively, despite additional BMPs that were implemented. During the fifth year of monitoring, trash weight and pieces decreased compared to trash collected during the third and fourth years of monitoring. Fifth-year trash pieces are similar to those collected during the second year of monitoring. Table 7 lists the trash pieces collected per monitoring year from 2009-2014. As such, the implementation of the MFAC/BMP Program is not clearly reflected in the trash monitoring results and program implementation continues to be evaluated to consider these results. Despite legacy trash issues, the MFAC Program resulted in zero trash in-stream immediately after all monitoring events as required by the Trash TMDL for non-point sources. The MFAC/BMP Program is therefore effective for meeting the non-point source requirements.
Table 7. Trash Pieces Collected 2009-20141
Monitoring Year Pieces of Trash Collected
2009-2010 8,679 2010-2011 4,613 2011-2012 6,238 2012-2013 6,313 2013-2014 4,731
1. Trash pieces data are provides as trash weight data have not been collected during the entire time frame. 2. During the 209-2010 monitoring year, MFAC Events at Sites 3a-3d were performed on a rotating basis (one site per month).
Ventura Countywide Stormwater Quality Management Program 2014-2015 Annual Report Page E2-19 Attachment E2
RSBW TMRP Annual Report 11 December 2014
5.2 HIGH TRASH GENERATING AREAS Site 1, Site 2, and Site 5 had the highest trash weight totals during the monitoring period, respectively. Site 8, Site 1, and Site 5 had the highest trash pieces totals, respectively. Table 4 lists the trash weight totals and Table 6 lists the trash pieces totals for all of the assessment sites. High trash generating areas will continue to be addressed through prioritized BMP implementation to minimize the impacts of trash in these areas as identified by data collected during the MFAC events.
6 Compliance Strategy
The Trash TMDL requires all annual reports to include proposals to enhance BMPs, revise the MFAC (if needed), and prioritize the installation of full capture devices or other compliance measures, including structural BMPs or trash collection events for high trash generating areas. Additionally, the Trash TMDL requires point source-responsible parties to achieve a 100 percent reduction from the baseline WLA by 2016. This section describes the proposed compliance strategies to be utilized to meet the non-point source and point source Trash TMDL requirements and to further reduce trash discharges into Revolon Slough and Beardsley Wash. Non-point source-responsible parties will continue complying with the Trash TMDL through an MFAC/BMP Program that includes a combination of MFAC events and BMPs including structural and non-structural BMPs. The information gathered from the MFAC/BMP Program will guide BMP implementation and selection to ensure efficient and effective compliance with the Trash TMDL. The responsible parties will also utilize adaptive management to allow for flexibility in determining the correct BMPs to implement and the correct locations to implement the BMPs. The proposed adaptive management compliance strategy is as follows:
1. Continue implementation of the current approved MFAC Program using total weight and total pieces as the metric.
2. Continue to implement the current suite of BMPs identified in the TMRP with the additions described in the Current Best Management Practices Section;
3. Implement BMPs in the future based on information generated from the MFAC/BMP Program focusing on the high trash generating areas as discussed in the Future Potential Best Management Practices Section; and
4. Evaluate the effectiveness and needs for additional BMPs and/or MFAC revisions semi-annually based on the results of the MFAC/BMP Program. The evaluation will consider the amount of trash, on a site-by-site and watershed basis, to prioritize the areas where additional BMP implementation may be most effective in reducing trash levels. Proposed revisions to the MFAC/BMP Program and full capture device or other measure installation/implementation prioritization will be included in each annual report.
To address point sources, the Responsible Parties, where feasible, will install full capture devices on conveyances discharging to Revolon Slough and Beardsley Wash and/or install full capture devices in high trash generating areas and employ a point source-specific MFAC/BMP Program in other areas of their jurisdictions. The goal is to meet the required phased percent reductions as listed in Table 7-24.2a of the Trash TMDL by March 2016.
Ventura Countywide Stormwater Quality Management Program 2014-2015 Annual Report Page E2-20 Attachment E2
RSBW TMRP Annual Report 12 December 2014
The following sections outline the jurisdictional BMPs currently being implemented, the additional BMPs to be implemented in prioritized areas, other BMPs being considered for implementation throughout the watershed, and a BMP implementation schedule.
6.1 CURRENT BEST MANAGEMENT PRACTICES The TMRP listed a suite of BMPs that each responsible party was implementing in their respective jurisdictions. The BMPs listed in the TMRP are still relevant, but there have been several revisions and/or additions to the suite of BMPs listed in the TMRP to update the MFAC/BMP Program in response to the monitoring results.
One of the primary modifications to the MFAC/BMP Program in response to the monitoring results was to add additional trash cleanups at the high trash generating sites identified during the monitoring. To accomplish this, the City of Camarillo, County of Ventura and the VCWPD contracted with the CCC to conduct monthly, trash cleanups near Sites 1, 3a-d, and 5. During 2013-2014, approximately 617 pounds (or 92 55-gallon or 40-gallon bags) of trash were removed from 247,612 square feet of channel at Sites 1, 3a-d, and 5, compared to 1,460 pounds removed in 2012-2013. Example photos taken during these special cleanups are presented in Appendix 3. In addition to the trash cleanups, the responsible parties implemented the following BMPs to address trash:
6.1.1 City of Camarillo Litter Management Program TMRP BMP list for the City:
1. Catch basin cleaning - all City catch basins are inspected at least once per year and those in high-trash generating areas are inspected four times per year and all are cleaned when filled with trash to 25 percent or more of the catch basin’s capacity.
2. Open channel maintenance - all City-maintained channels are inspected and cleaned at least once per year before the wet season and at least once per year after the wet season.
3. Trash Management at Public Events - All special use permits for events in the public right of way require proper management of trash and litter.
The following are enhancements/revisions made to the non-point source BMPs listed in the TMRP for the City:
1. Trash removal is performed along City fence lines near city stormwater system structures the watershed. During 2013-2014, approximately 1,300 pounds of trash were removed.
2. The City performs annual debris and trash removal from city-maintained ditches/channels and detention basins. Approximately 114,000 pounds of materials were removed from the structures.
3. City arterial streets are swept weekly and residential streets are swept monthly in an attempt to reduce trash accumulating in deleterious amounts on streets within the City.
4. The City requires conditions pertaining to trash to be met for all new development and redevelopment projects within the watershed, including:
Ventura Countywide Stormwater Quality Management Program 2014-2015 Annual Report Page E2-21 Attachment E2
RSBW TMRP Annual Report 13 December 2014
A. Trash full capture devices and post-construction treatment devices for other pollutants of concern must be installed in drain inlets;
B. Trash enclosures and/or recycling areas must be properly installed (e.g., covered and including structures to direct stormwater away from entering the enclosures/areas);
C. All property areas must be maintained free of litter/debris;
D. Onsite storm drains must be cleaned at least twice per year, including once before the beginning of the wet season; and
E. Private roads and parking lots must be swept at a minimum of once per month, with two sweepings occurring in October before the beginning of the wet season.
5. The City requires private owners to provide proof of maintenance of their post construction treatment devices annually.
6. The City hosts household hazardous waste collection events two days per month to provide residents a place to properly dispose of their materials. This reduces the amount of illegal dumping. In addition, Camarillo successfully diverted four lbs/person of solid waste in 2013 which is equivalent to a 74 percent division rate.
7. The City adopted Stormwater Ordinance No. 1032 in December 2012 which includes trash specific prohibitions and fines and penalties for violations of the prohibitions.
8. The City imposed additional measures to its Water Conservation Ordinance in 2014 limiting lawn watering to three days per week, no washing of hard surfaces (i.e., driveways, sidewalks), and imposing penalties for runoff. These measures will reduce dry weather flows to the storm drain system thereby reducing trash transport.
9. The City engages in several outreach and education campaigns including:
A. The City includes a litter prevention message, at least annually, in its quarterly Cityscene Newsletter, which is distributed to all residents.
B. The City includes an insert with all utility bills soliciting volunteers to remove trash in the City on Coastal Cleanup Day and which also educates residents on pollution prevention.
C. The City conducts commercial, industrial, and construction facility/site inspections to ensure proper pollutant prevention BMPs are being applied and to educate the employees on the importance of pollution prevention. The City inspected 253 facilities during 2013-2014.
D. The City sends out letters to all commercial, industrial, and high-density residential property managers requesting assistance in controlling trash on their property.
E. The City inspects all construction sites to ensure application of proper pollution prevention BMPs. The City inspected 92 sites in 2013-2014.
Ventura Countywide Stormwater Quality Management Program 2014-2015 Annual Report Page E2-22 Attachment E2
RSBW TMRP Annual Report 14 December 2014
F. The City mails construction site BMP brochures to contractors and developers annually, during fall, to ensure proper pollutant prevention BMPs are being applied especially before the wet season.
G. The City participates in the Countywide Stormwater Public Outreach Program that includes litter outreach, which can be reviewed at www.cleanwatershed.org. In 2013-2014, over 13 million impressions were made via this program with 15 percent of those in Spanish.
The following are enhancements/revisions made to the point source BMPs listed in the TMRP for the City:
1. The City has installed 34 trash full capture devices in City storm drain catch basins in high trash generating areas throughout the City including 25 devices within the Revolon Slough and Beardsley Wash watershed. For the 2013-2014 monitoring year, the devices removed greater than 4,870 pounds of debris, of which, trash comprised only approximately 646 pounds; the remaining debris was primarily landscape material. The installation of the 25 devices resulted in approximately eight percent of City conveyances discharging to Revolon Slough and Beardsley Wash being addressed through full capture.
6.1.2 County of Ventura and VCWPD Litter Management Program 1. Catch basin cleaning - Catch basins are inspected at least once a year and cleaned when
filled to 25 percent or more of the catch basin’s capacity. During storm season, all drainage facilities are inspected and cleaned as necessary.
2. Open channel storm drain maintenance - All VCWPD-owned and -maintained channels are cleared, inspected, and cleaned as required at least once per year. During the annual 2013-2014 channel sediment cleaning of Revolon Slough and Beardsley Wash, a total of 2,739 tons of combined sediment, plant material and trash were removed. Trash accounted for approximately 700 pounds of the removed material.
3. Trash Management at Public Events - A proper Management of Trash and Litter Plan is required when obtaining a permit for staging public events. This Plan requires adequate facilities for trash collection and disposal.
4. Public areas - Trash receptacles have been placed within high trash generation areas. These devices are cleaned and maintained regularly to prevent trash overflow.
5. The Stormwater Quality Management Ordinance for Unincorporated Areas (Ventura County Ordinance No. 4450) includes litter and trash specific prohibitions for the discharge or deposition of trash that may enter the County storm drain system or receiving waters (Section 6942). The ordinance also includes civil penalties for violations and provisions for issuing administrative fines, recovery of costs and misdemeanor violations.
6. County catch basins are labeled, “Don’t pollute, Flows to Waterways”.
7. New watershed awareness signs have been installed at key locations at major roadway crossings of Revolon Slough and Beardsley Wash, stating “Calleguas Creek Watershed, Keep It Clean!”.
Ventura Countywide Stormwater Quality Management Program 2014-2015 Annual Report Page E2-23 Attachment E2
RSBW TMRP Annual Report 15 December 2014
8. In October 2013, an anti-littering billboard space was leased from ClearChannel with a message posted for a month along Highway 101 (near the Del Norte overcrossing) stating “Our Oceans are Drowning in Plastic”, encouraging proper disposal of waste and recyclable materials. This location was seen by 97,000 people per day (estimated at 64,000 Ventura County residents and 33,000 others travelling through the area) for the entire month of October.
9. On July 31, 2012 the County of Ventura Board of Supervisors received and filed a draft model Single-Use Bag Ordinance referred to the County by the Beach Erosion Authority for Clean Oceans and Nourishment (BEACON). The County endorsed the use of up to $8,000 as the County’s pro-rata share of a regional Environmental Impact Report (EIR) to be prepared by BEACON, which is required to be completed under the California Environmental Quality Act (CEQA) before the model single-use bag ban can be adopted. This was the first step for the County to move forward with the consideration of adoption of a single-use plastic bag ban.
10. On June 24, 2014 the County of Ventura Board of Supervisors approved a motion directing the County of Ventura Executive Officer to have staff prepare a Single-Use Bag Ordinance modeled on the BEACON Ordinance.
11. The County and VCWPD continue to participate in the Countywide Stormwater Program to provide outreach and education retaining the services of “The Agency”, a professional advertisement group that designs and conducts Countywide, bilingual outreach programs advocating proper trash disposal. The most recent addition to the outreach program is trash prevention and protection of stormwater quality education using Facebook®. This program has had made over 13,077,228 countywide media impressions (TV, radio, internet, transit shelters) in Fall 2013 and Spring 2014.
12. The County conducts commercial, industrial, and construction facility/site inspections to ensure proper pollutant prevention BMPs are being applied and to educate the employees on the importance of pollution prevention. The County inspects the 362 businesses at least twice during the Ventura County MS4 Permit Term.
The following are enhancements/revisions made to the point source BMPs listed in the TMRP for the County:
1. The County issued a contract for the installation of full capture devices on storm drains discharging to the trash-impaired waters of Revolon Slough and Beardsley Wash. To date, eight StormTek® connector pipe screen full capture devices have been installed. This construction contract is complete and the final inspection of the eight full capture devices was completed in October 2014. Installation of these devices meets the 100 percent full capture requirement within the County Unincorporated urban areas addressed by the County’s storm drain system. Currently, the County is evaluating additional efforts needed to provide full capture on the remaining County infrastructure. The effort to ensure 100 percent full trash capture for County’s point source discharges in the Revolon Slough and Beardsley Wash watershed will be completed by March 2016.
Ventura Countywide Stormwater Quality Management Program 2014-2015 Annual Report Page E2-24 Attachment E2
RSBW TMRP Annual Report 16 December 2014
6.1.3 VCAILG Litter Management Program During the 2013-2014 monitoring year, VCAILG provided 28.5 hours of education and outreach at nine independent workshops to a diverse group of owners and growers throughout Ventura County. One of the workshops included education about trash BMPs for agricultural areas and information regarding the Trash TMDL. On October 7, 2010 the Los Angeles Regional Water Quality Control Board (Regional Board) adopted a new Conditional Waiver of Waste Discharge Requirements for Discharges from Irrigated Lands within the Los Angeles Region (“Conditional Waiver”, Order No. R4-2010-0186).
As specified in the Conditional Waiver, if an applicable water quality benchmark has not been met, then a Water Quality Management Plan (WQMP), which includes BMPs to address constituents of concern, must be developed. The third-year VCAILG Annual Monitoring Report (AMR) will be submitted on December 15, 2014. Based on the monitoring results reported in the AMR, VCAILG will submit a WQMP in May 2015. Previous WQMPs have included two survey questions related to trash; 1) The property is kept clean and free of trash and 2) The property has an adequate number of trash containers that are covered and emptied regularly. Results for these survey questions were provided in the previous WQMP and updates will be included in the upcoming WQMP.
Both Community Recycling & Resource Recovery, Inc. (Community Recycling) and E.J. Harrison & Sons, Inc. provide recycling services to local farmers. Recycling efforts are focused on drip tape and agricultural plastic used to cover strawberry beds and used in some vegetable fields during growing. Community Recycling estimates they collect approximately 70 percent of the agricultural plastic in Ventura County. The used plastic is cleaned, processed, and turned into pellets to be used in new products. Researchers are testing the use of recycled plastic in the fields and determining the percent recycled material that will still stretch and maintain the necessary strength. Collection and recycling of the plastic is an effective method for reducing plastic trash from entering Revolon Slough and Beardsley Wash.
6.1.4 Caltrans Litter Management Program Caltrans implements a variety of BMPs in the watershed along the freeways and highways. These BMPs are a suite of programs done to reduce trash as follows.
1. Street Sweeping 2. Trash Collection
3. Adopt-a-Highway Program Caltrans (District 7, serving Los Angeles and Ventura Counties) uses a variety of methods to educate the public about the importance of managing stormwater. This consists of a variety of written materials, bulletins, and websites. A few venues the District uses to accomplish this are public schools and community sponsored clean up events, Bring Your Child to Work Day, and Earth Day. The written material is designed to appeal to the public while providing technical information on selected Caltrans projects and activities. Caltrans continues to install stenciled warnings prohibiting discharges to drain inlets at park and ride lots, rest areas, vista points and other areas with pedestrian traffic. Additionally, Caltrans installed four new Biofiltration Swales and one Detention Basin at locations on or adjacent to the Rice Avenue on-ramp and off-ramp to Highway 101.
Ventura Countywide Stormwater Quality Management Program 2014-2015 Annual Report Page E2-25 Attachment E2
RSBW TMRP Annual Report 17 December 2014
6.2 FUTURE POTENTIAL BEST MANAGEMENT PRACTICES Future potential BMPs specific to each responsible agency are detailed below.
6.2.1 City of Camarillo Litter Management Program To address non-point sources, the City will focus BMP efforts at the high trash generating areas identified through the MFAC Program and continue watershed-wide BMP activities as a means to further reduce the discharge of trash to Revolon Slough and Beardsley Wash.
For point sources, the City has been installing full capture systems on conveyances, which it has jurisdiction over, that discharge into Revolon Slough and Beardsley Wash. In addition, the City conducted an analysis in 2013-2014 to determine the most appropriate and effective manner of installing the full capture systems to ensure compliance with the 100 percent installation requirement by 2016. The results of the analysis indicated addressing all conveyances through the installation of full capture devices would not be an efficient and effective means of eliminating trash discharging to Revolon Slough and Beardsley Wash. This is due to many areas within the City’s jurisdiction rarely generating trash, yet the Trash TMDL requires these areas to be addressed by full capture devices. For example, installing a full capture device in a catch basin, which in the last five years has not been cleaned per the Storm Drain Operation and Management requirements of the Ventura County Municipal Separate Storm Sewer System (MS4) Permit (Order No. R4-2010-0108), would be a waste of resources and contradictory to the MS4 Permit. The City feels the most effective and efficient manner for eliminating trash discharging to Revolon Slough and Beardsley Wash from the City is to install and maintain full capture devices at all high priority catch basins (i.e., those in areas with high trash generation rates) and address all other areas of the City’s jurisdiction through a MFAC/BMP Program tailored to catch basins. The City’s MFAC/BMP Program for point sources is detailed below in the MFAC Revisions Section.
6.2.2 County of Ventura and VCWPD Litter Management Program The County of Ventura and/or VCWPD will continue to install and implement structural and non-structural BMPs to address non-point source trash to minimize the discharge of trash from their jurisdictions as part of the MFAC/BMP Program. BMPs will include monthly trash cleanups at high trash generating areas. Additionally, the County will install anti-dumping and anti-littering signage at key locations including high trash generating areas as well as at known illegal dumping locations, and will conduct targeted outreach to schools within the area covered by the Trash TMDL to educate the students, staff, and faculty on the importance of pollution prevention specifically regarding trash. The scale of BMP installation will depend on the trash data collected during the 2014-2015 monitoring year. The County of Ventura and/or VCWPD will also install full capture devices in conveyances they are responsible for with the intention of meeting the 2016 requirement of 100 percent of the conveyances addressed by full capture devices.
6.2.3 VCAILG Litter Management Program As part of the current Conditional Waiver, VCAILG will provide educational classes focused on improving water quality, including identifying trash as an impairment of water quality. Furthermore, based on 2014-2015 monitoring results, VCAILG will assist its members with the implementation of additional BMPs as necessary by following the adaptive process identified in
Ventura Countywide Stormwater Quality Management Program 2014-2015 Annual Report Page E2-26 Attachment E2
RSBW TMRP Annual Report 18 December 2014
the WQMP. In addition, VCAILG members will continue to be billed separately for Trash TMDLs to further reinforce the idea, through a fiscal measure, that there are trash problems in the watershed. VCAILG developed a web-based BMP survey that includes questions on trash BMPs. Additionally, VCAILG will be tracking the implementation of installed and planned trash BMPs.
6.2.4 Caltrans Litter Management Program Caltrans will continue to implement its current suite of BMPs as outlined in the TMRP as well as study the maintenance impact for installing a full capture device, and when it is possible, implement future potential full trash capture devices, subject to funding availability and TMDL Reach Prioritization as completed under the new Caltrans MS4 Permit. The continued implementation of current BMPs and the implementation of future potential BMPs will be directed by results obtained from future monitoring events as part of the adaptive management compliance approach. Caltrans anticipates installing one Infiltration Basin, three Media Filters, and 15 Gross Solid Removal Devices by 2016 or following years subject to funding availability and the TMDL Reach Prioritization.
6.3 BEST MANAGEMENT PRACTICES IMPLEMENTATION SCHEDULE Non-point source-responsible parties intend to continue complying with the Trash TMDL through the MFAC/BMP Program, which may include the installation or implementation of structural or non-structural BMPs. The initial MFAC/BMP Program, included in the TMRP and enhanced in this report, will continue to be implemented. Additional BMP implementation will be scheduled as appropriate to address the identified high trash generating areas.
Point source-responsible parties will install full capture devices on conveyances discharging to Revolon Slough and Beardsley Wash and/or install full capture devices in high trash generating areas and employ a point source-specific MFAC/BMP Program in other areas of their jurisdictions. The goal is to meet the required phased percent reductions as listed in Table 7-24.2a of the Trash TMDL.
Ventura Countywide Stormwater Quality Management Program 2014-2015 Annual Report Page E2-27 Attachment E2
RSBW TMRP Annual Report 19 December 2014
7 MFAC Revisions
For non-point sources, in consideration of the conflicting results of the pieces-based and weight-based trash measurements collected over the past five monitoring years and the challenge in accurately assessing changes in trash quantities based on such metrics, the Responsible Parties provided a letter presenting an alternate monitoring and reporting strategy (TMRP) to Regional Board staff for consideration on July 23, 2014. The alternate method is similar to the revised approach currently utilized for the Ventura River Estuary Trash TMDL in that specific sites are cleaned at a specified frequency, and visual assessments are conducted to determine effectiveness of the clean-ups and used to modify clean-up frequencies, if necessary. This method will allow the Responsible Parties to focus resources on removing trash from Revolon Slough and Beardsley Wash and is expected to facilitate more comparable trash assessments. The Responsible Parties believe this new method will provide for a more efficient and effective MFAC/BMP Program, which will have the effect of reducing trash found in Revolon Slough and Beardsley Wash. However, Regional Board staff have not yet made any decisions on the proposed approach. The Responsible Parties feel the alternate monitoring and reporting strategy for non-point sources should be employed and will continue working with Regional Board staff to implement the alternate strategy. In addition to the MFAC program revisions proposed above for the non-point sources, the City of Camarillo is proposing to utilize full capture installation and a MFAC/BMP Program tailored to catch basins as a means to meet the point source requirements of the Trash TMDL. Under this scenario, the City of Camarillo will address all catch basins within high trash generating areas (generally, Priority A and B catch basins as identified in the MS4 Permit) via full capture devices and all catch basins in areas with low trash generating rates (generally, Priority C catch basins as identified in the MS4 Permit) by a MFAC/BMP Program. A summary of the full capture installation and MFAC/BMP Program the City of Camarillo will employ is provided below and a detailed explanation and justification will be provided in a separate letter to Regional Board staff.
The City of Camarillo has 625 catch basins within the Revolon Slough and Beardsley Wash watershed. This total number of catch basins will be considered the baseline number from which the City of Camarillo will assess compliance. All catch basins with full capture devices properly installed and maintained will be considered in compliance and will not be part of the MFAC/BMP Program. In addition, all catch basins upstream of a catch basin addressed by a full capture device, where all of the runoff captured by the upstream catch basins is also addressed by the full capture device, will be considered in compliance and will not be part of the MFAC/BMP Program.
For the rest of the catch basins, a MFAC/BMP Program will be implemented with the goal of ensuring that no trash is discharged from the MS4 system to the receiving waters. The MFAC/BMP Program will consist of inspecting catch basins for trash and natural litter/debris and cleaning all catch basins. The catch basins will be inspected on the following schedule:
• Inspect Priority A catch basins per the requirements of the Ventura County MS4 Permit of a minimum of three times during the wet season and once during the dry season;
• Inspect Priority B catch basins per the requirements of the Ventura County MS4 Permit of a minimum of once during the wet season and once during the dry season; and
Ventura Countywide Stormwater Quality Management Program 2014-2015 Annual Report Page E2-28 Attachment E2
RSBW TMRP Annual Report 20 December 2014
• Inspect Priority C catch basins once during the wet season and once during the dry season (only a once annual inspection is required by the Ventura County MS4 Permit).
Catch basin cleaning will be based on the Ventura County MS4 Permit requirement that all catch basins filled 25 percent or greater must be cleaned. The City of Camarillo may perform cleaning that is not based on the 25 percent threshold; this will depend on site specific conditions of the catch basin.
Based on this inspection and cleaning schedule, catch basins that have been cleaned, as required by the Ventura County MS4 Permit, one or fewer times over a rolling three-year period will be considered equivalent to catch basins with full capture devices installed and will also be considered compliant. This determination is based on the fact that trash is not accumulating in the catch basins and therefore not being discharged to the receiving waters. The goal of the combined full capture device and MFAC/BMP Program is to have 100 percent of the catch basins either addressed by a full capture device or within the one or fewer cleanings category by 2016. If any catch basin does not maintain its one or fewer cleaning status, the catch basin will be addressed via structural/non-structural BMPs to return the catch basin to the one or fewer cleaning category or be addressed via a full capture device.
Ventura Countywide Stormwater Quality Management Program 2014-2015 Annual Report Page E2-29 Attachment E2
RSBW TMRP Annual Report 1 December 15, 2014 Appendix 1
Appendix 1. Assessment Site Descriptions
Site 1 – Revolon Slough at Wood Road This site consists of Revolon Slough and its adjacent land areas. It begins at the end of a concrete channel and includes the 100 foot downstream portion of Revolon Slough and the banks on both sides of the water body. GPS Coordinates: Lat: 34.169771 Lon: -119.095591
Site 2 – Beardsley Wash at Wright Road This site is located in Beardsley Wash and includes the Wash itself as well as the banks on both sides. GPS Coordinates: Lat: 34.241681 Lon: -119.099658
Site 3a – Camarillo Hills Drain Outlet This site begins at the upstream end of a drain outlet and includes the in-stream portions of the Camarillo Hills Drain and the banks on either side of the drain. GPS Coordinates: Lat: 34.215486 Lon: -119.076388
Ventura Countywide Stormwater Quality Management Program 2014-2015 Annual Report Page E2-30 Attachment E2
RSBW TMRP Annual Report 2 December 15, 2014 Appendix 1
Site 3b – Camarillo Hills Drain Outlet This site is located approximately 0.6 miles downstream of Site 3a and has similar characteristics. This site begins at the downstream end of a drain outlet and includes in-stream and bank areas. GPS Coordinates: Lat: 34.215491 Lon: -119.079224
Site 3c – Camarillo Hills Drain Outlet This site is located in close proximity downstream of Site 3b and begins at the end of a drain outlet and includes in-stream and bank areas. GPS Coordinates: Lat: 34.215593 Lon: -119.090810
Site 3d - Camarillo Hills Drain Outlet This site is the most downstream location of Sites 3a-d and begins at the upstream end of a drain outlet and includes in-stream and banks areas. GPS Coordinates: Lat: 34.215596 Lon: -119.092864
Ventura Countywide Stormwater Quality Management Program 2014-2015 Annual Report Page E2-31 Attachment E2
RSBW TMRP Annual Report 3 December 15, 2014 Appendix 1
Site 4 – Las Posas Estates Drain This site is located within the Las Posas Estates Drain between Central Avenue and U.S. 101 Freeway. The site consists of the in-stream portion of the drain south of Central Avenue as well as the land area above the drain on the northwest side. GPS Coordinates: Lat: 34.224121 Lon: -119.104421
Site 5 – Revolon Slough at Etting Road This site begins at the downstream end of an agricultural drain that discharges into Revolon Slough and includes the in-stream portions of Revolon Slough as well as the land areas within the slough and the banks. GPS Coordinates: Lat: 34.161731 Lon: -119.091460
Site 6 – North Ramona Place Drain Debris Basin This site is within a debris basin at the end of North Ramona Place. The site consists of a flat vegetated area in the middle of the debris basin. GPS Coordinates: Lat: 34.241553 Lon: -119.085723
Ventura Countywide Stormwater Quality Management Program 2014-2015 Annual Report Page E2-32 Attachment E2
RSBW TMRP Annual Report 4 December 15, 2014 Appendix 1
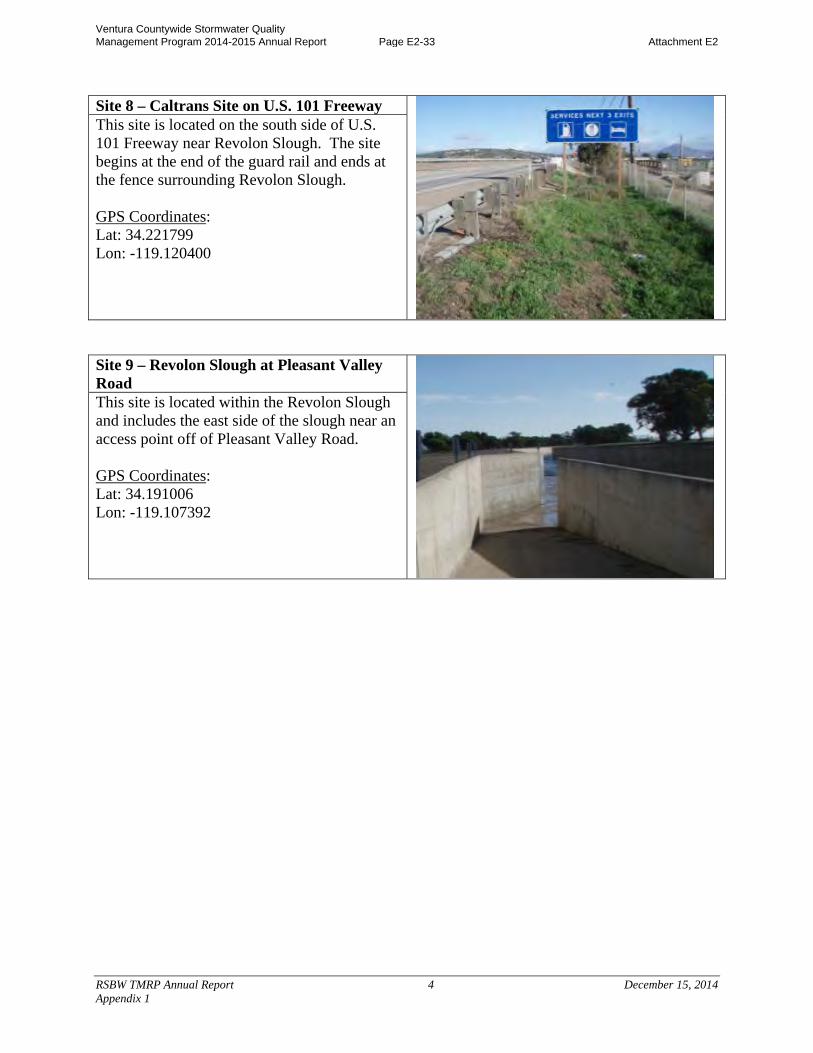
Site 8 – Caltrans Site on U.S. 101 FreewayThis site is located on the south side of U.S. 101 Freeway near Revolon Slough. The site begins at the end of the guard rail and ends at the fence surrounding Revolon Slough. GPS Coordinates: Lat: 34.221799 Lon: -119.120400
Site 9 – Revolon Slough at Pleasant Valley Road This site is located within the Revolon Slough and includes the east side of the slough near an access point off of Pleasant Valley Road. GPS Coordinates: Lat: 34.191006 Lon: -119.107392
Ventura Countywide Stormwater Quality Management Program 2014-2015 Annual Report Page E2-33 Attachment E2
RSBW TMRP Annual Report 1 December 15, 2014 Appendix 2
Appendix 2. MFAC Photos
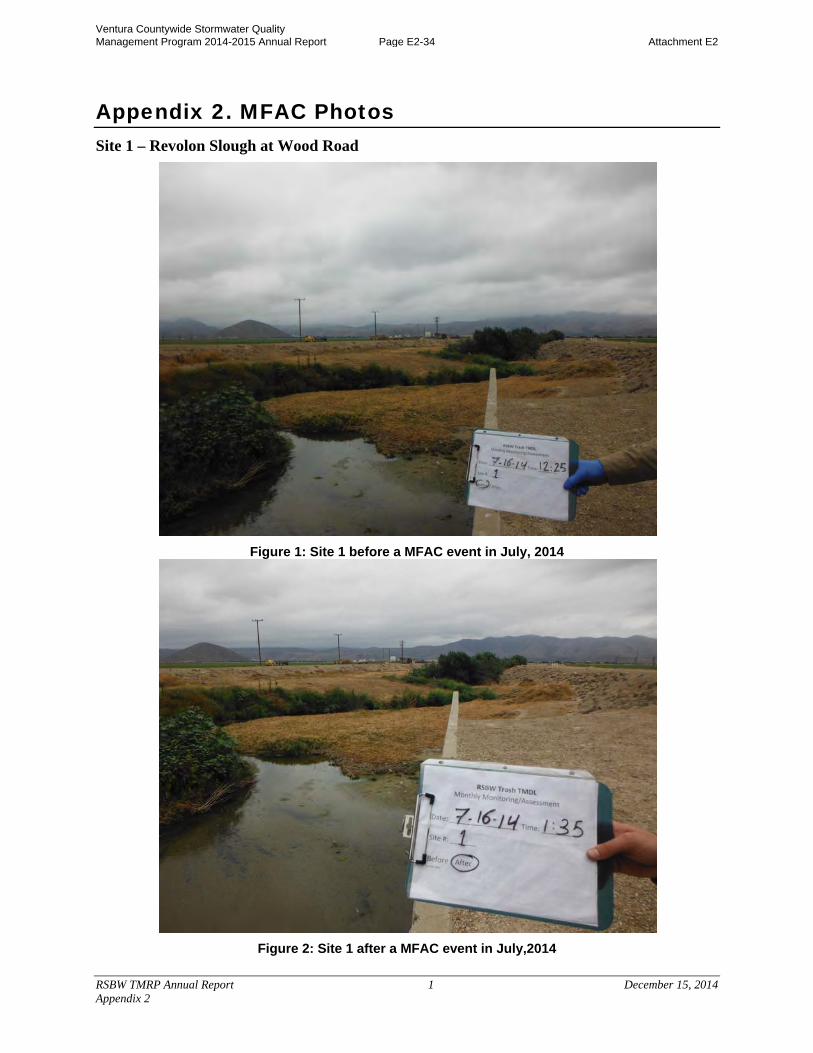
Site 1 – Revolon Slough at Wood Road
Figure 1: Site 1 before a MFAC event in July, 2014
Figure 2: Site 1 after a MFAC event in July,2014
Ventura Countywide Stormwater Quality Management Program 2014-2015 Annual Report Page E2-34 Attachment E2
RSBW TMRP Annual Report 2 December 15, 2014 Appendix 2
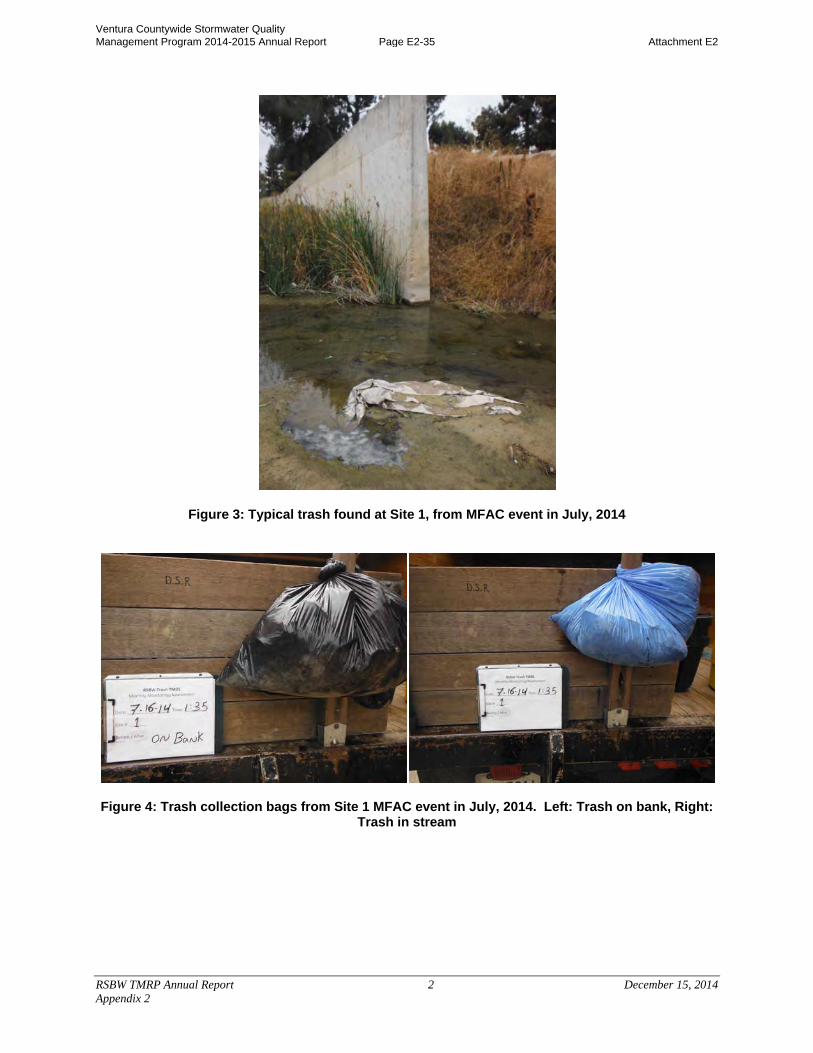
Figure 3: Typical trash found at Site 1, from MFAC event in July, 2014
Figure 4: Trash collection bags from Site 1 MFAC event in July, 2014. Left: Trash on bank, Right: Trash in stream
Ventura Countywide Stormwater Quality Management Program 2014-2015 Annual Report Page E2-35 Attachment E2
RSBW TMRP Annual Report 3 December 15, 2014 Appendix 2
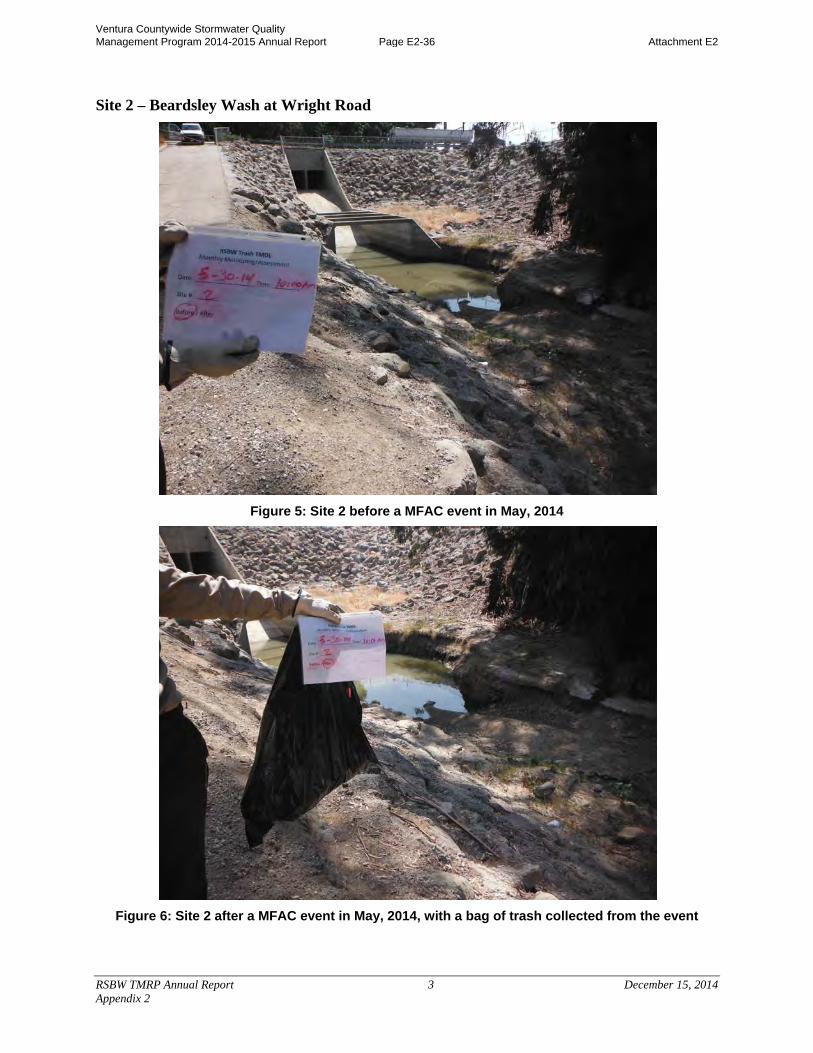
Site 2 – Beardsley Wash at Wright Road
Figure 5: Site 2 before a MFAC event in May, 2014
Figure 6: Site 2 after a MFAC event in May, 2014, with a bag of trash collected from the event
Ventura Countywide Stormwater Quality Management Program 2014-2015 Annual Report Page E2-36 Attachment E2
RSBW TMRP Annual Report 4 December 15, 2014 Appendix 2
Site 3a – Camarillo Hills Drain Outlet
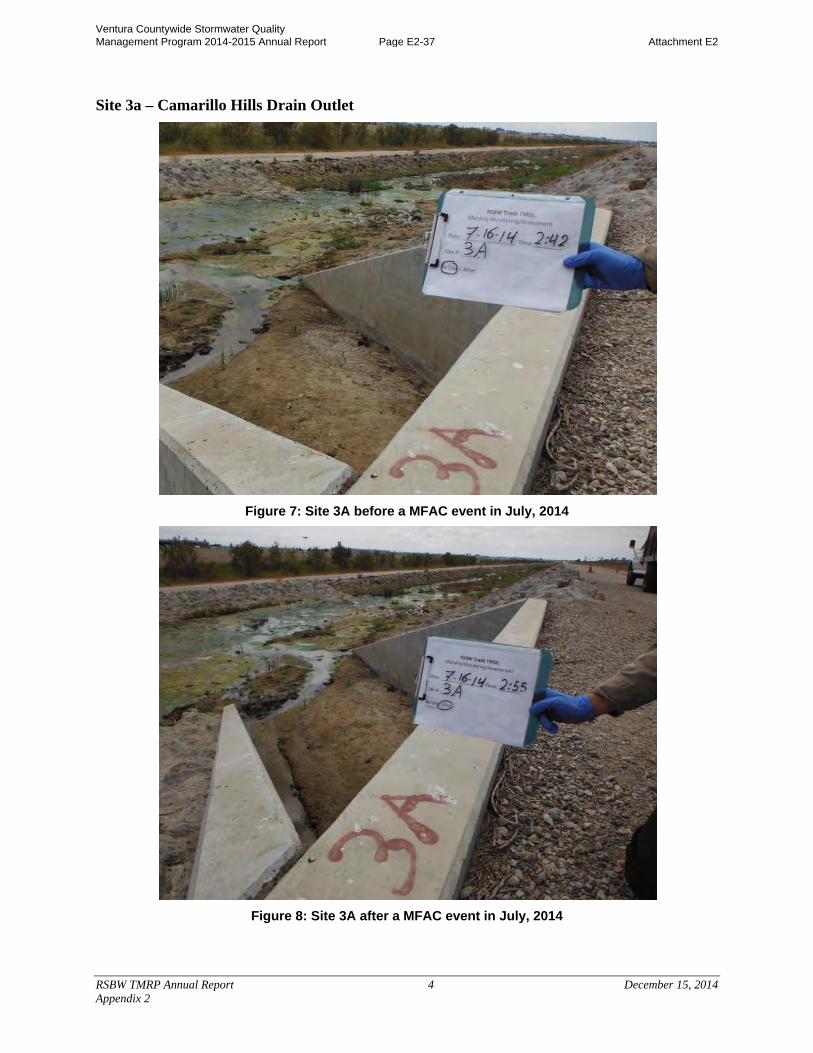
Figure 7: Site 3A before a MFAC event in July, 2014
Figure 8: Site 3A after a MFAC event in July, 2014
Ventura Countywide Stormwater Quality Management Program 2014-2015 Annual Report Page E2-37 Attachment E2
RSBW TMRP Annual Report 5 December 15, 2014 Appendix 2
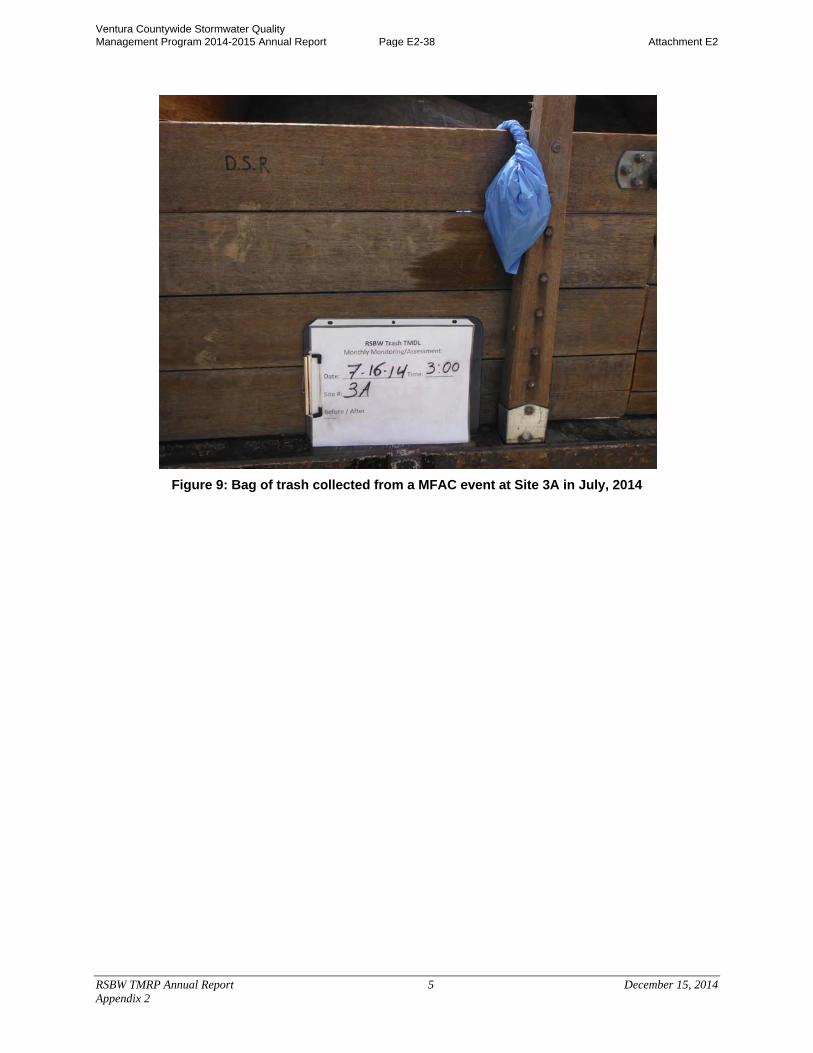
Figure 9: Bag of trash collected from a MFAC event at Site 3A in July, 2014
Ventura Countywide Stormwater Quality Management Program 2014-2015 Annual Report Page E2-38 Attachment E2
RSBW TMRP Annual Report 6 December 15, 2014 Appendix 2
Site 3b – Camarillo Hills Drain Outlet
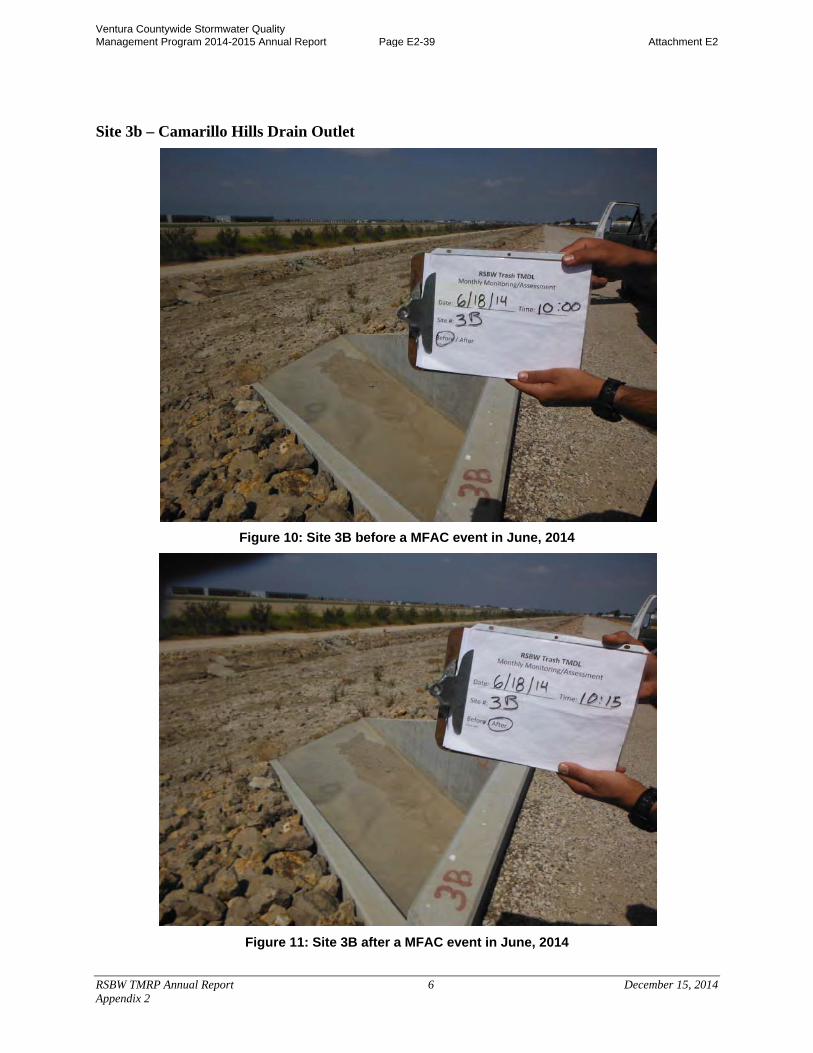
Figure 10: Site 3B before a MFAC event in June, 2014
Figure 11: Site 3B after a MFAC event in June, 2014
Ventura Countywide Stormwater Quality Management Program 2014-2015 Annual Report Page E2-39 Attachment E2
RSBW TMRP Annual Report 7 December 15, 2014 Appendix 2
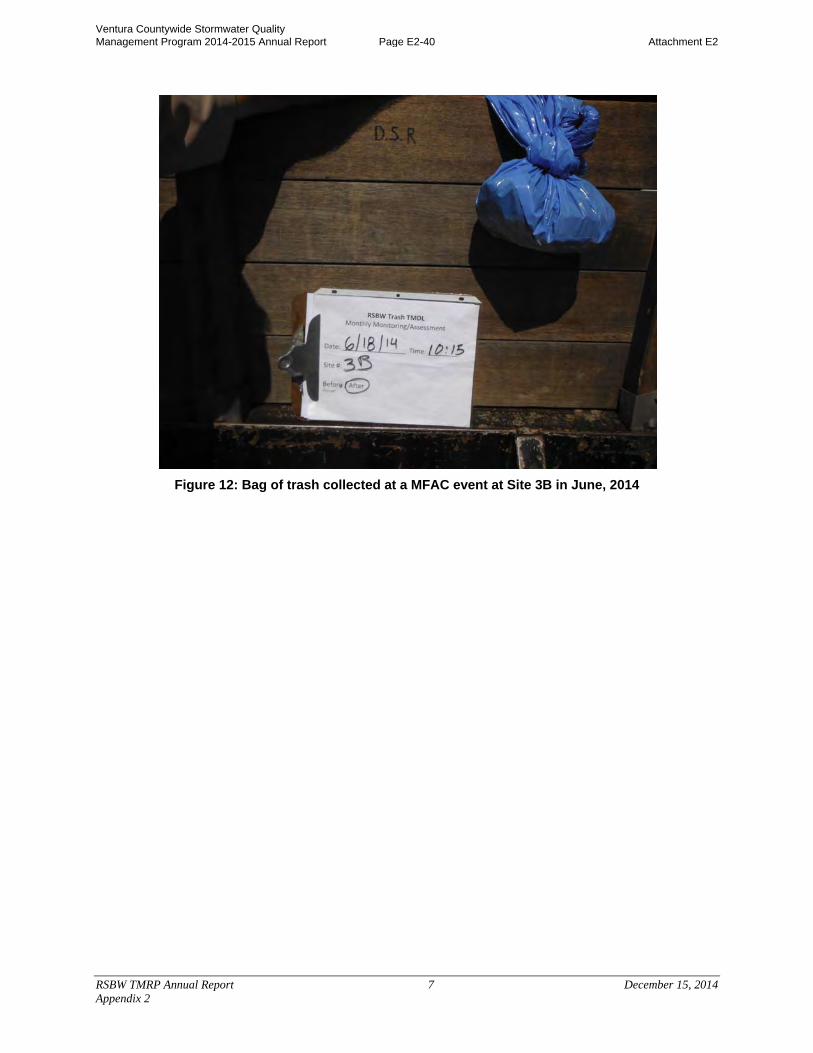
Figure 12: Bag of trash collected at a MFAC event at Site 3B in June, 2014
Ventura Countywide Stormwater Quality Management Program 2014-2015 Annual Report Page E2-40 Attachment E2
RSBW TMRP Annual Report 8 December 15, 2014 Appendix 2
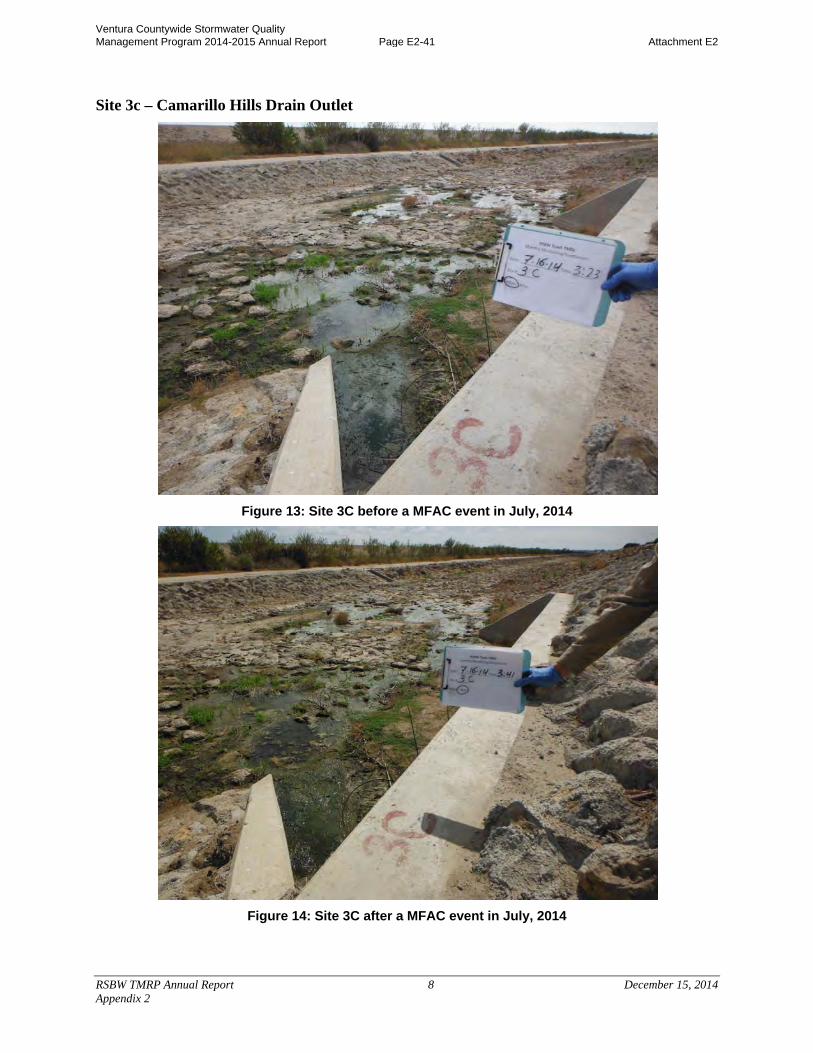
Site 3c – Camarillo Hills Drain Outlet
Figure 13: Site 3C before a MFAC event in July, 2014
Figure 14: Site 3C after a MFAC event in July, 2014
Ventura Countywide Stormwater Quality Management Program 2014-2015 Annual Report Page E2-41 Attachment E2
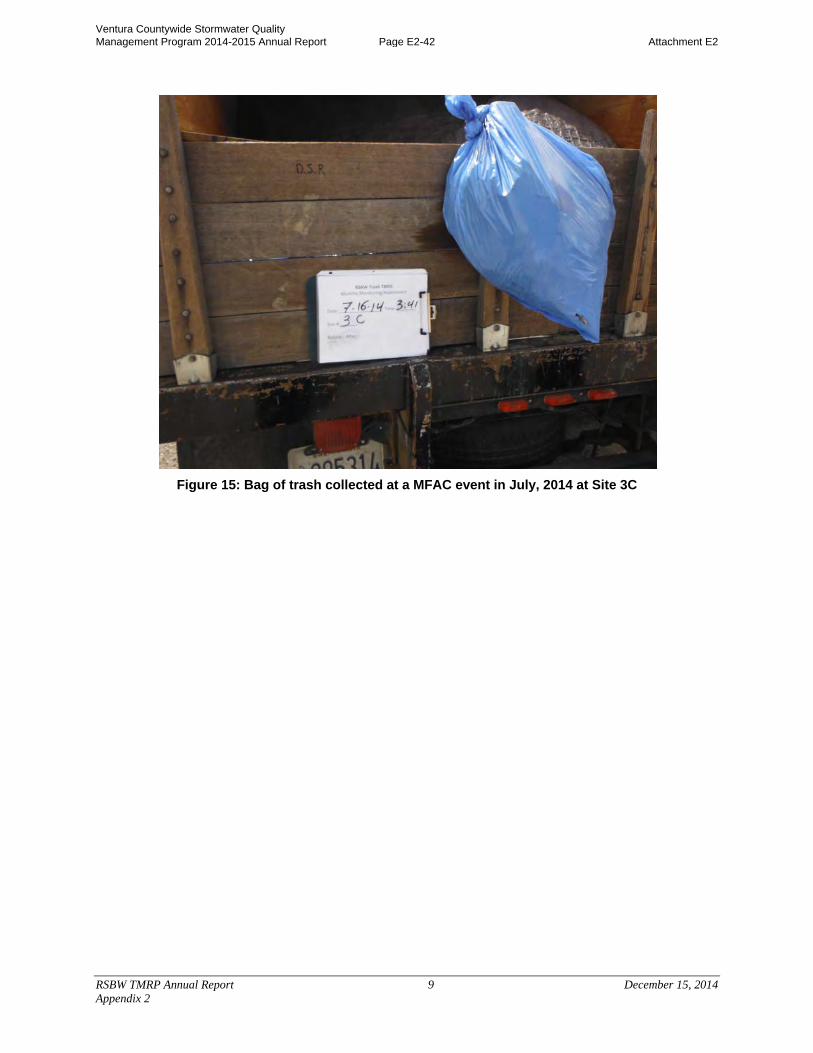
RSBW TMRP Annual Report 9 December 15, 2014 Appendix 2
Figure 15: Bag of trash collected at a MFAC event in July, 2014 at Site 3C
Ventura Countywide Stormwater Quality Management Program 2014-2015 Annual Report Page E2-42 Attachment E2
RSBW TMRP Annual Report 10 December 15, 2014 Appendix 2
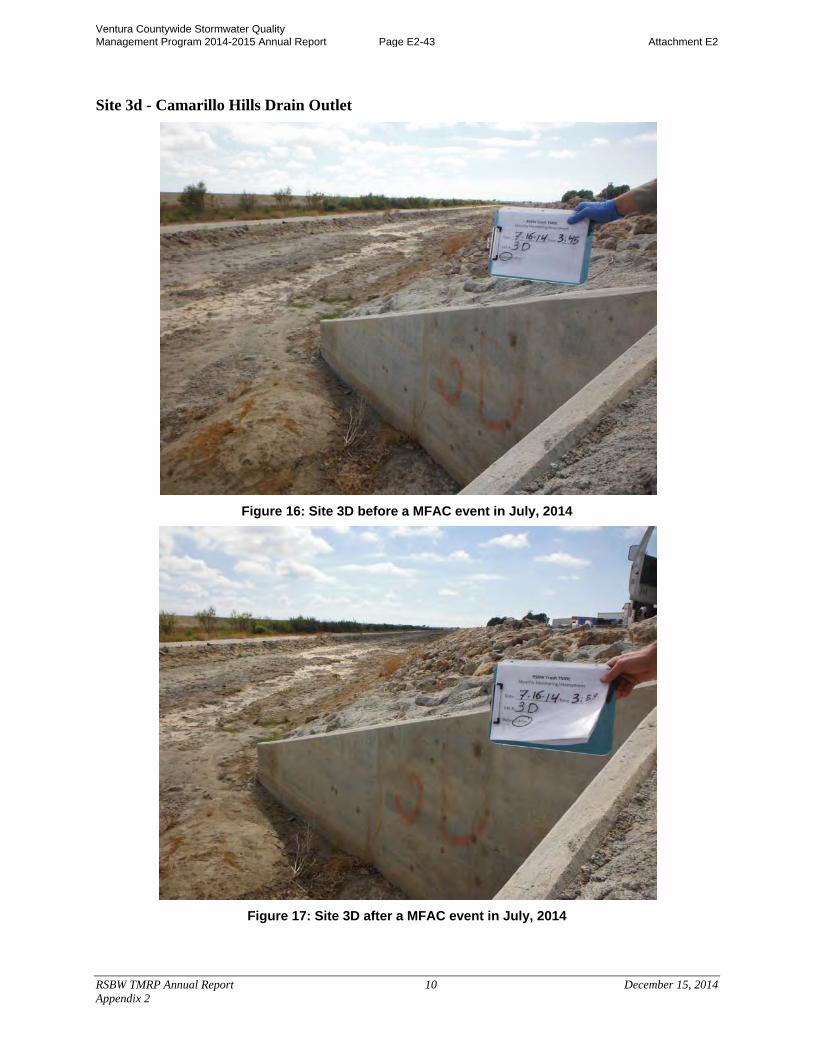
Site 3d - Camarillo Hills Drain Outlet
Figure 16: Site 3D before a MFAC event in July, 2014
Figure 17: Site 3D after a MFAC event in July, 2014
Ventura Countywide Stormwater Quality Management Program 2014-2015 Annual Report Page E2-43 Attachment E2
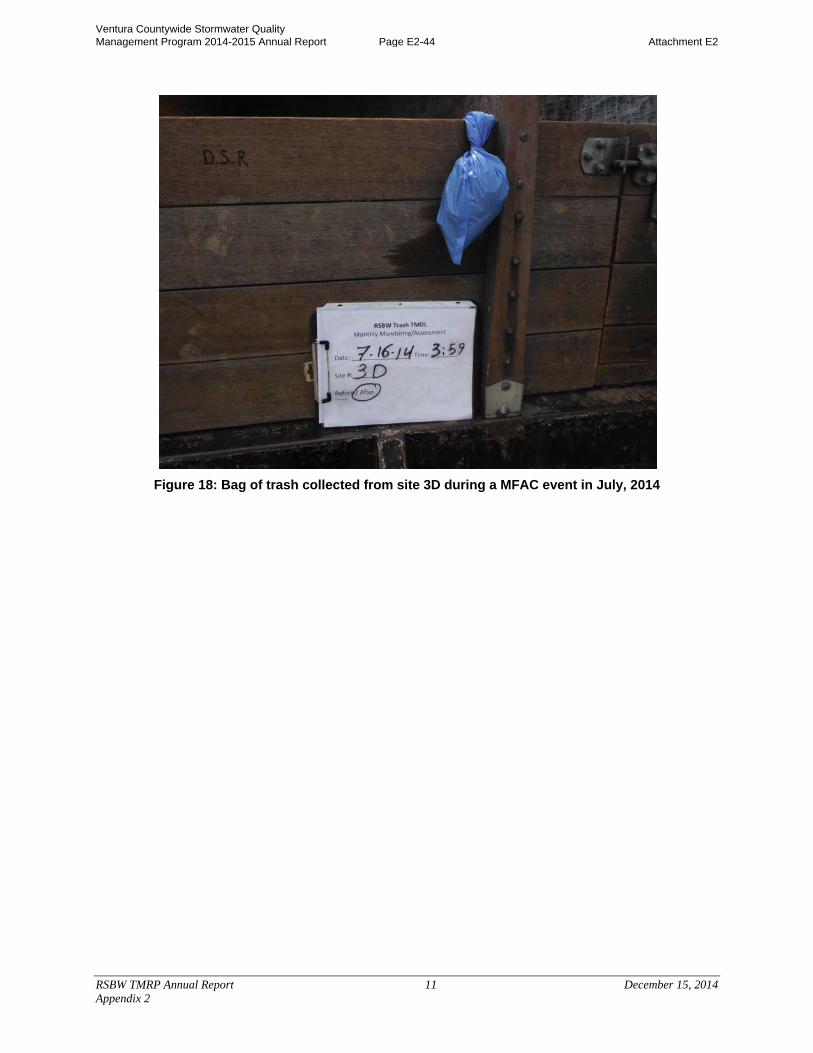
RSBW TMRP Annual Report 11 December 15, 2014 Appendix 2
Figure 18: Bag of trash collected from site 3D during a MFAC event in July, 2014
Ventura Countywide Stormwater Quality Management Program 2014-2015 Annual Report Page E2-44 Attachment E2
RSBW TMRP Annual Report 12 December 15, 2014 Appendix 2
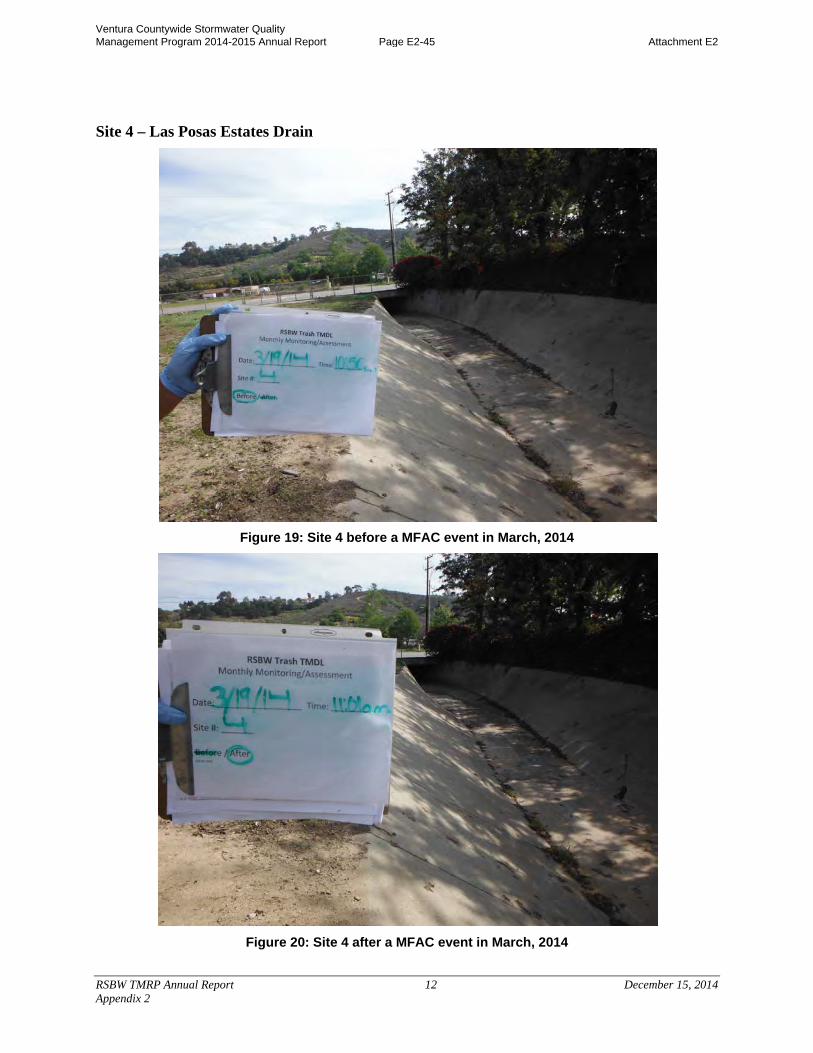
Site 4 – Las Posas Estates Drain
Figure 19: Site 4 before a MFAC event in March, 2014
Figure 20: Site 4 after a MFAC event in March, 2014
Ventura Countywide Stormwater Quality Management Program 2014-2015 Annual Report Page E2-45 Attachment E2
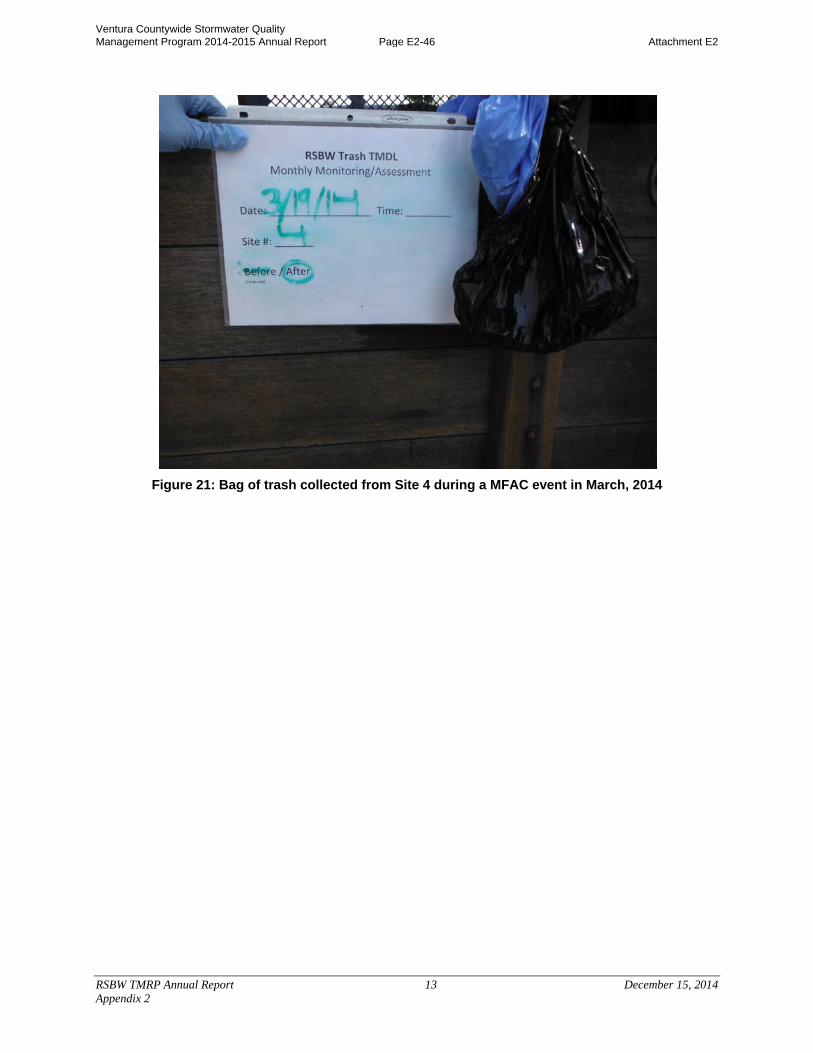
RSBW TMRP Annual Report 13 December 15, 2014 Appendix 2
Figure 21: Bag of trash collected from Site 4 during a MFAC event in March, 2014
Ventura Countywide Stormwater Quality Management Program 2014-2015 Annual Report Page E2-46 Attachment E2
RSBW TMRP Annual Report 14 December 15, 2014 Appendix 2
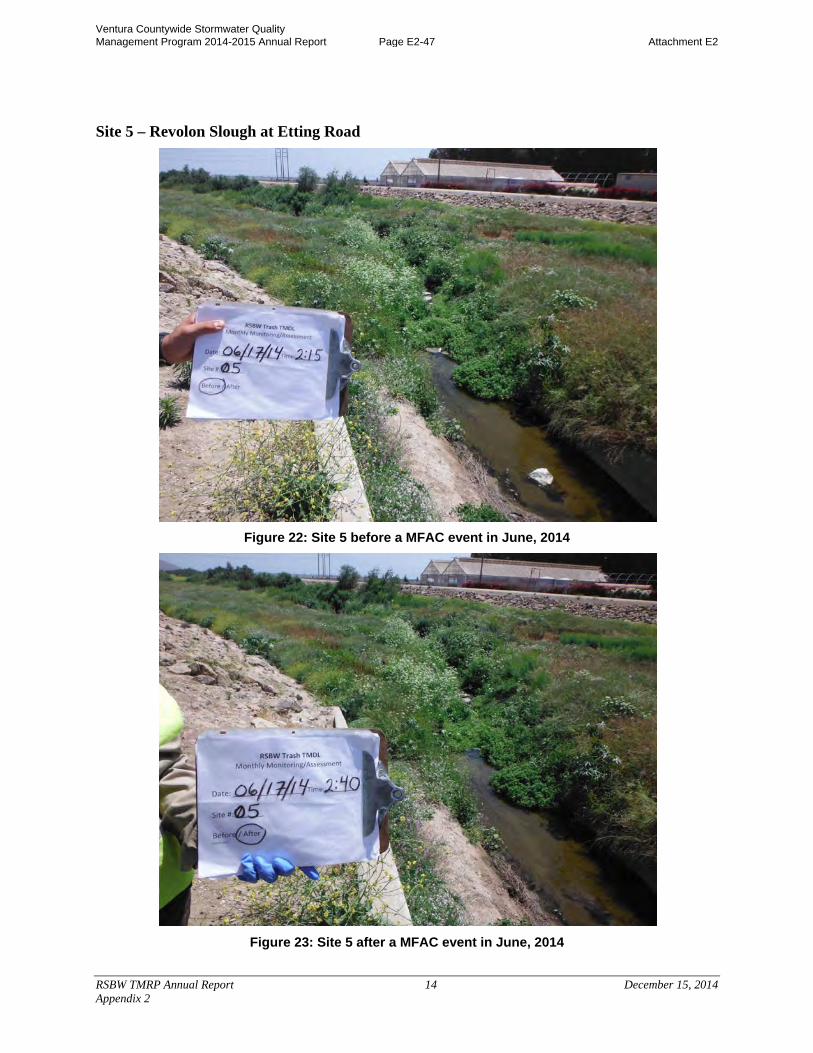
Site 5 – Revolon Slough at Etting Road
Figure 22: Site 5 before a MFAC event in June, 2014
Figure 23: Site 5 after a MFAC event in June, 2014
Ventura Countywide Stormwater Quality Management Program 2014-2015 Annual Report Page E2-47 Attachment E2
RSBW TMRP Annual Report 15 December 15, 2014 Appendix 2
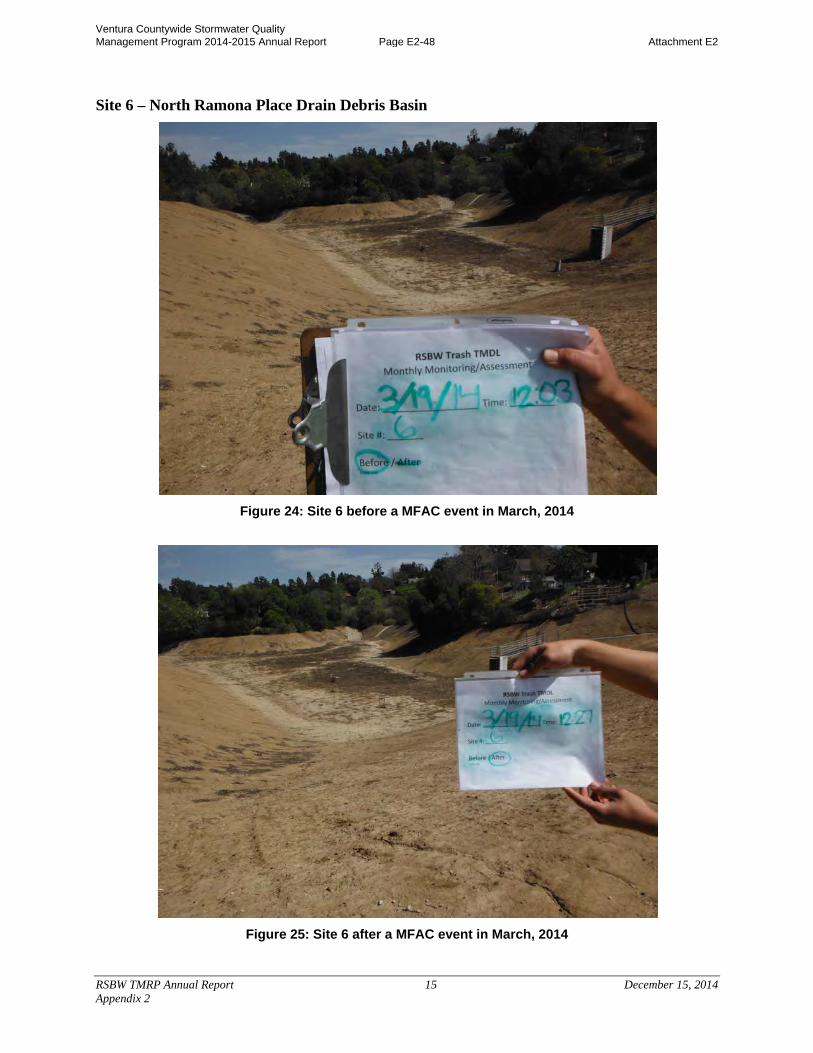
Site 6 – North Ramona Place Drain Debris Basin
Figure 24: Site 6 before a MFAC event in March, 2014
Figure 25: Site 6 after a MFAC event in March, 2014
Ventura Countywide Stormwater Quality Management Program 2014-2015 Annual Report Page E2-48 Attachment E2
RSBW TMRP Annual Report 16 December 15, 2014 Appendix 2
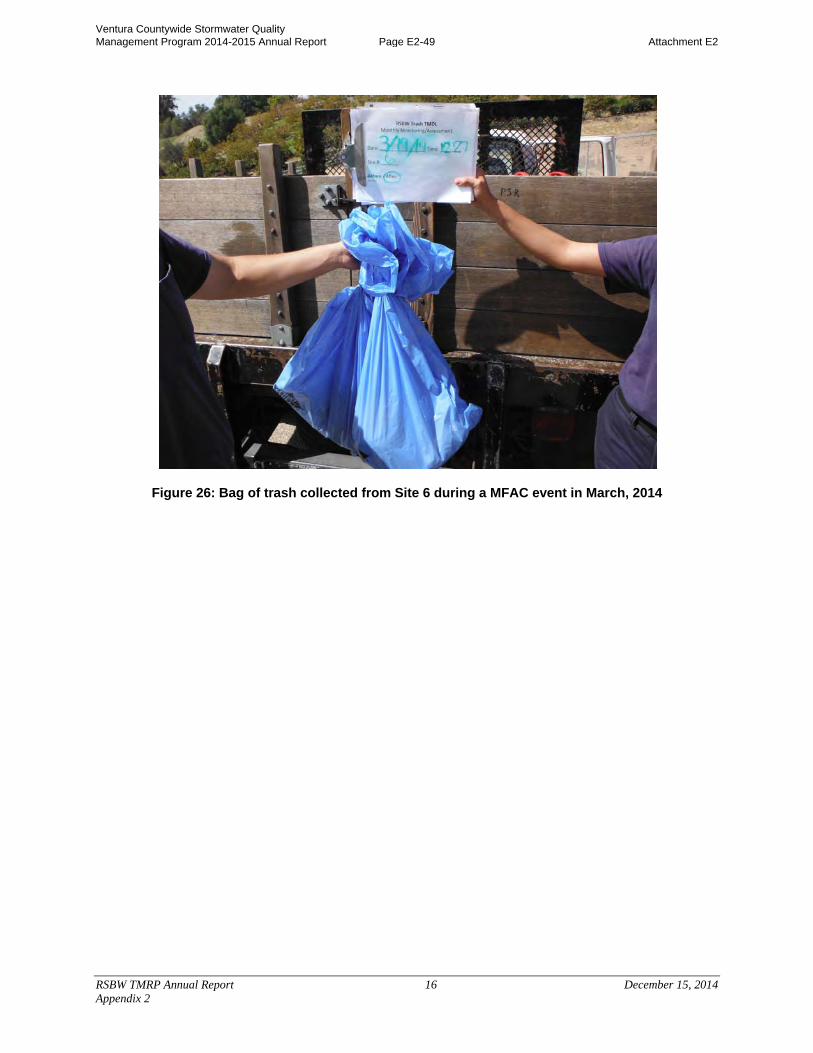
Figure 26: Bag of trash collected from Site 6 during a MFAC event in March, 2014
Ventura Countywide Stormwater Quality Management Program 2014-2015 Annual Report Page E2-49 Attachment E2
RSBW TMRP Annual Report 17 December 15, 2014 Appendix 2
Site 8 – Caltrans Site on U.S. 101 Freeway
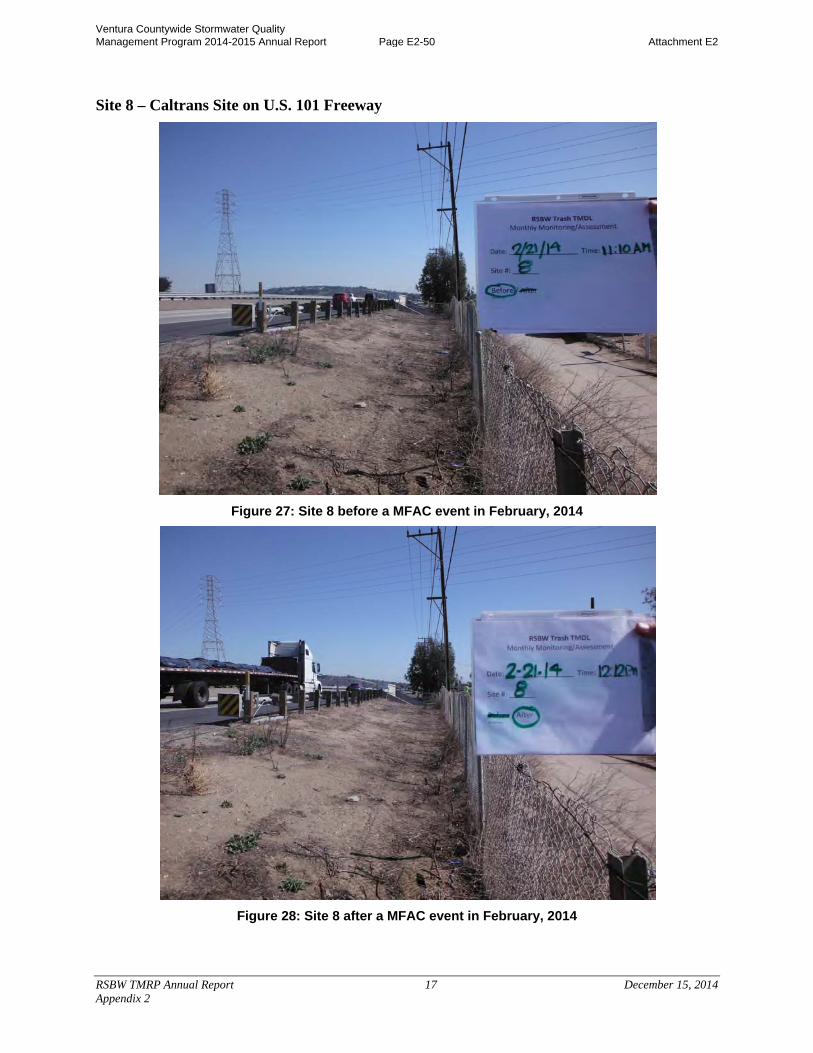
Figure 27: Site 8 before a MFAC event in February, 2014
Figure 28: Site 8 after a MFAC event in February, 2014
Ventura Countywide Stormwater Quality Management Program 2014-2015 Annual Report Page E2-50 Attachment E2
RSBW TMRP Annual Report 18 December 15, 2014 Appendix 2
Site 9 – Revolon Slough at Pleasant Valley Road
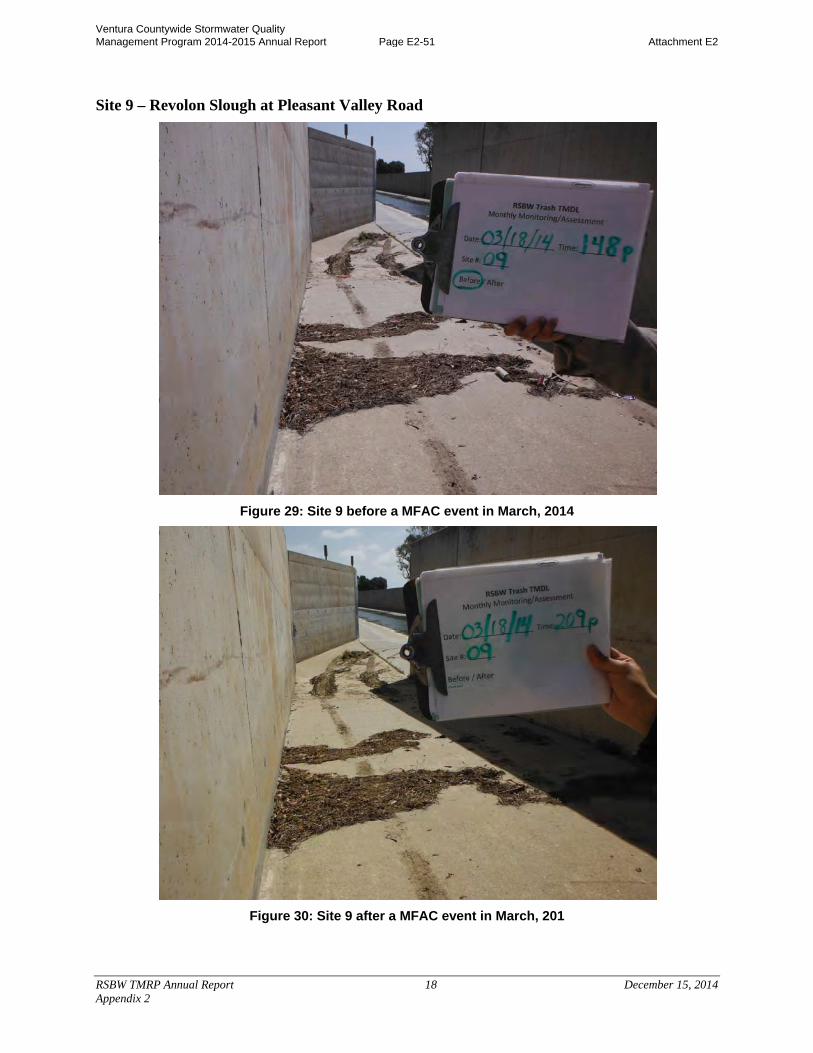
Figure 29: Site 9 before a MFAC event in March, 2014
Figure 30: Site 9 after a MFAC event in March, 201
Ventura Countywide Stormwater Quality Management Program 2014-2015 Annual Report Page E2-51 Attachment E2
RSBW TMRP Annual Report 1 December 15, 2014 Appendix 3
Appendix 3. Special Clean-Up Photos
Site 1 – Revolon Slough at Wood Road
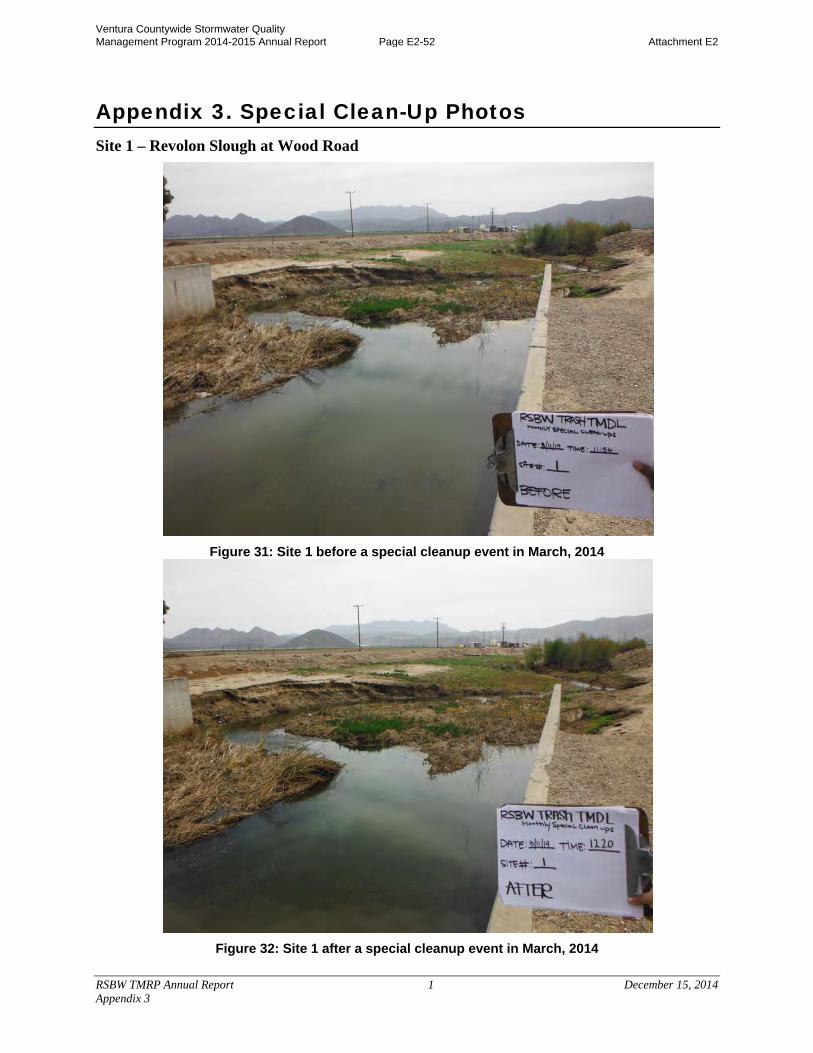
Figure 31: Site 1 before a special cleanup event in March, 2014
Figure 32: Site 1 after a special cleanup event in March, 2014
Ventura Countywide Stormwater Quality Management Program 2014-2015 Annual Report Page E2-52 Attachment E2
RSBW TMRP Annual Report 2 December 15, 2014 Appendix 3
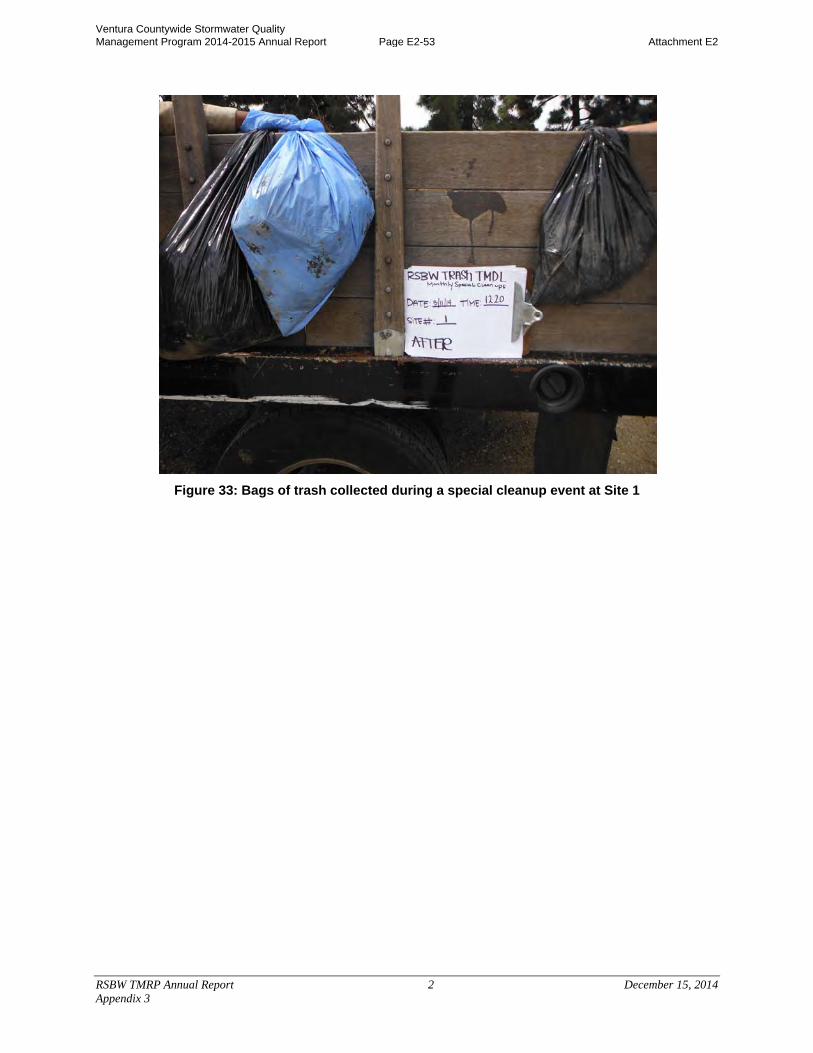
Figure 33: Bags of trash collected during a special cleanup event at Site 1
Ventura Countywide Stormwater Quality Management Program 2014-2015 Annual Report Page E2-53 Attachment E2
RSBW TMRP Annual Report 3 December 15, 2014 Appendix 3
Site 3a-Camarillo Hills Drain Outlet
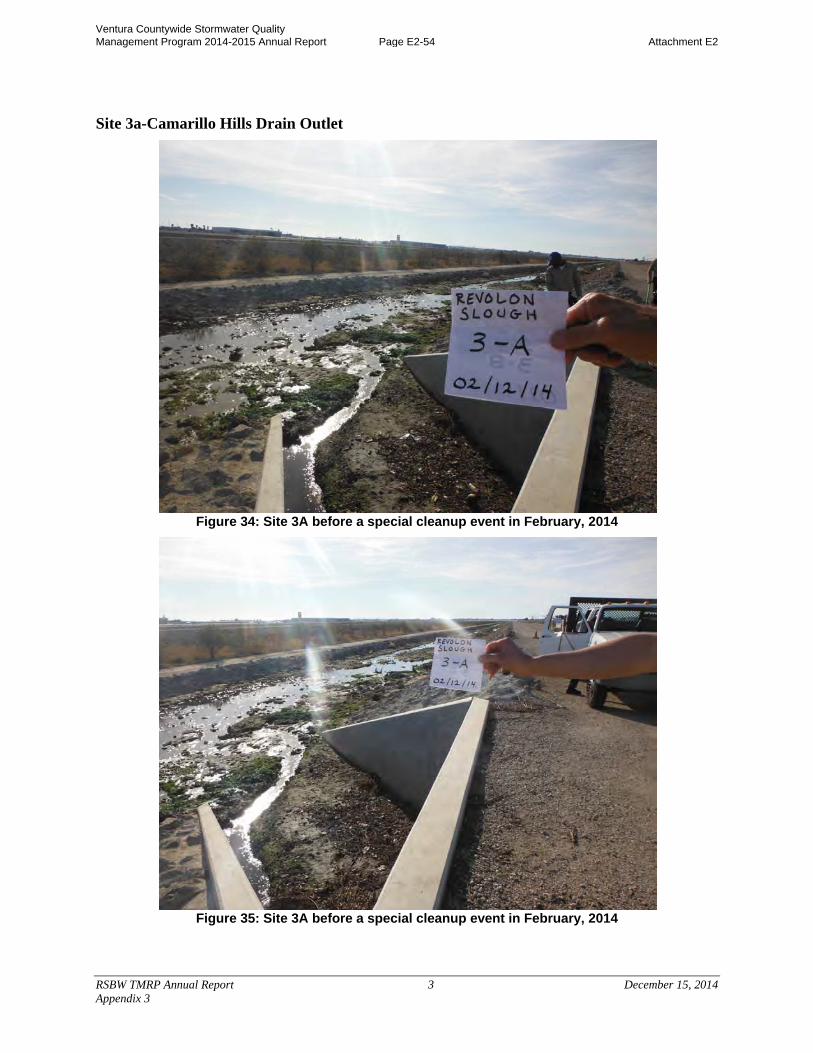
Figure 34: Site 3A before a special cleanup event in February, 2014
Figure 35: Site 3A before a special cleanup event in February, 2014
Ventura Countywide Stormwater Quality Management Program 2014-2015 Annual Report Page E2-54 Attachment E2
RSBW TMRP Annual Report 4 December 15, 2014 Appendix 3
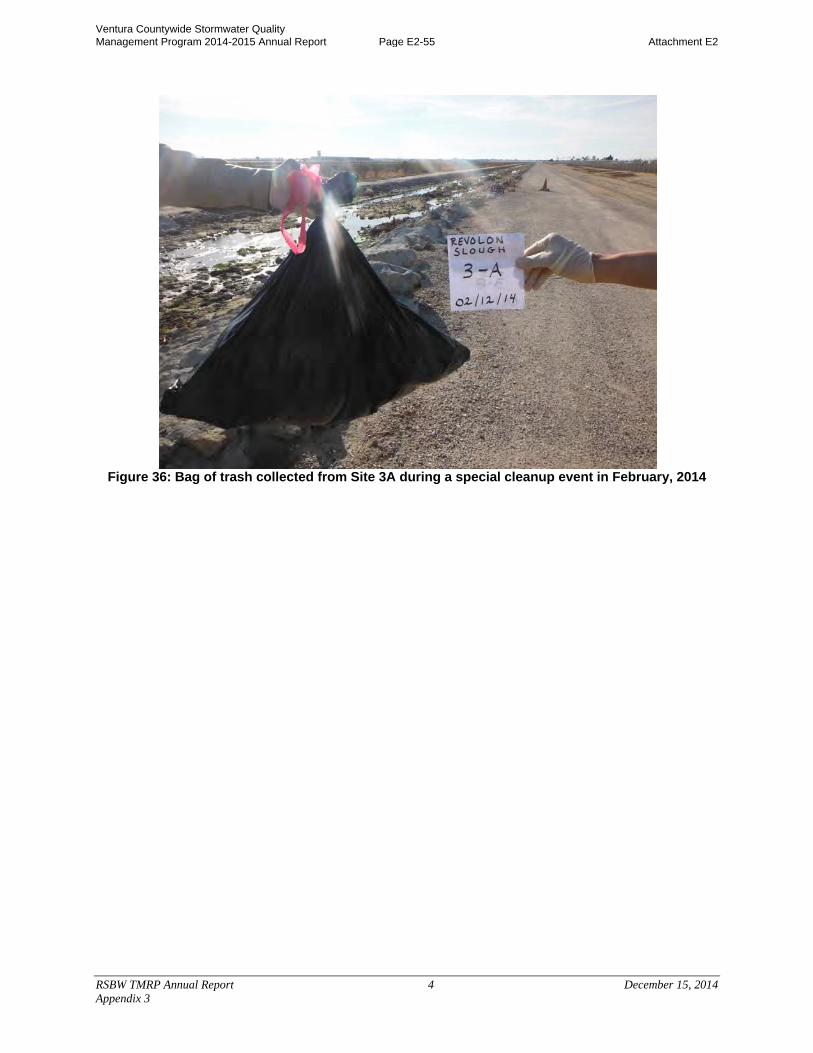
Figure 36: Bag of trash collected from Site 3A during a special cleanup event in February, 2014
Ventura Countywide Stormwater Quality Management Program 2014-2015 Annual Report Page E2-55 Attachment E2
RSBW TMRP Annual Report 5 December 15, 2014 Appendix 3
Site 3b – Camarillo Hills Drain Outlet
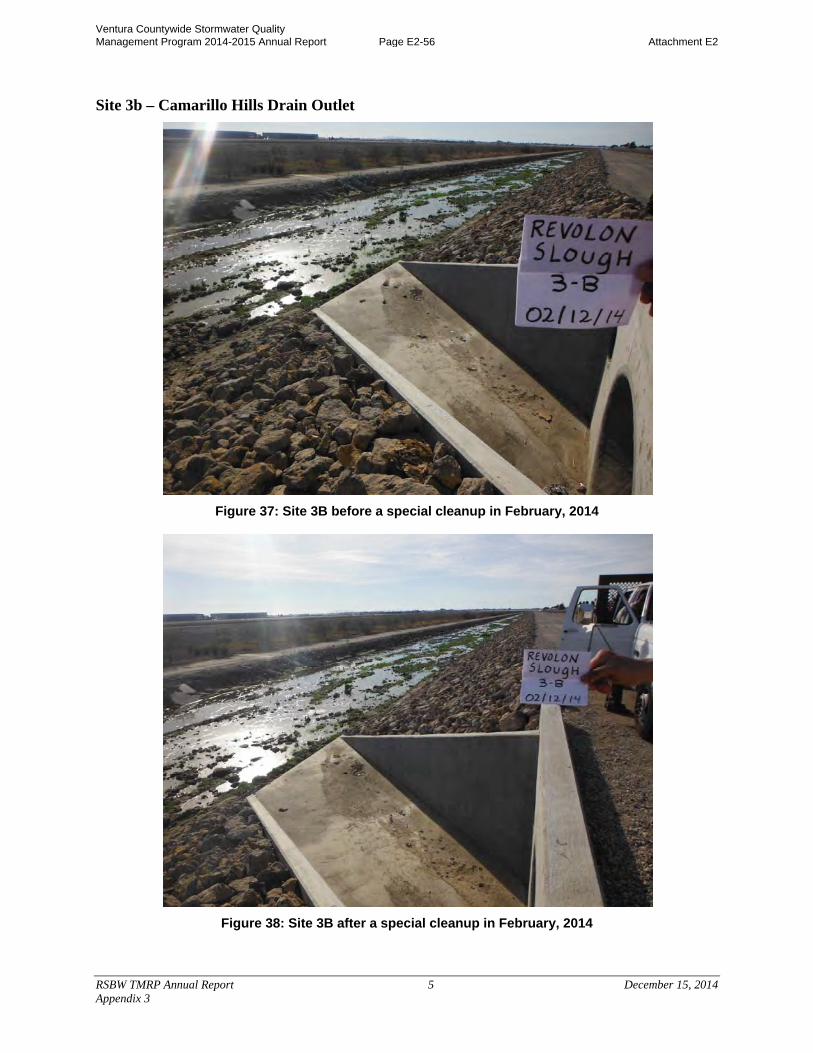
Figure 37: Site 3B before a special cleanup in February, 2014
Figure 38: Site 3B after a special cleanup in February, 2014
Ventura Countywide Stormwater Quality Management Program 2014-2015 Annual Report Page E2-56 Attachment E2
RSBW TMRP Annual Report 6 December 15, 2014 Appendix 3
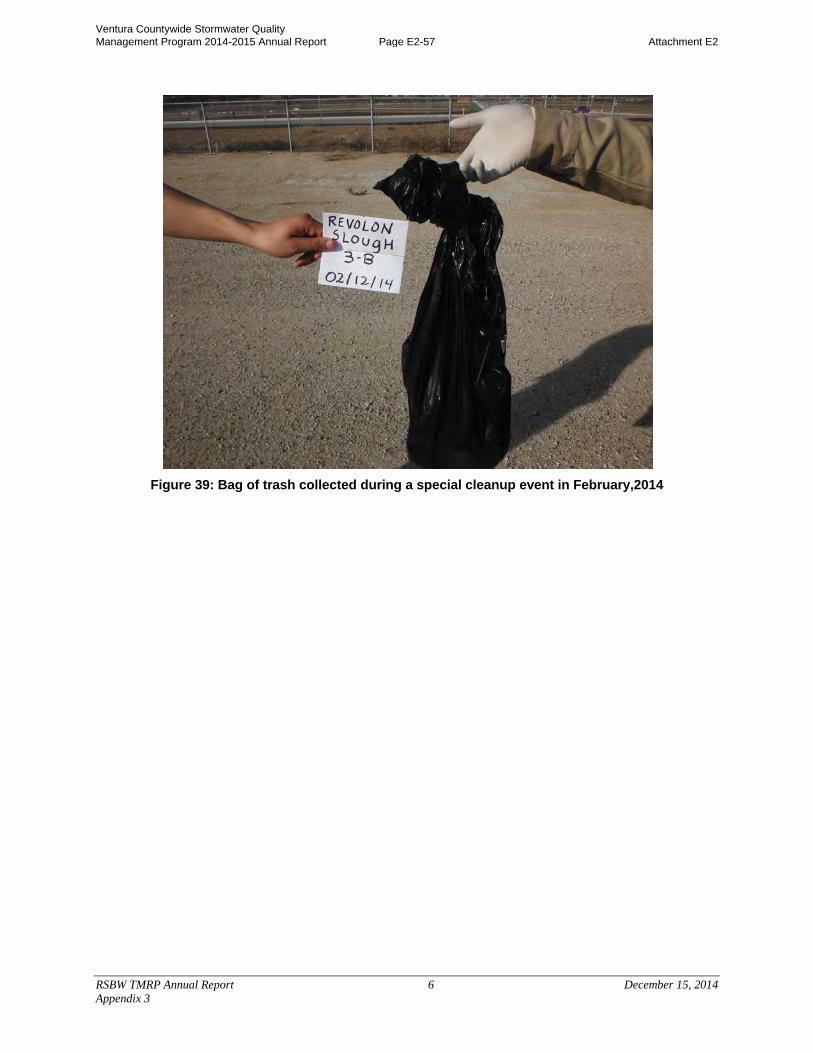
Figure 39: Bag of trash collected during a special cleanup event in February,2014
Ventura Countywide Stormwater Quality Management Program 2014-2015 Annual Report Page E2-57 Attachment E2
RSBW TMRP Annual Report 7 December 15, 2014 Appendix 3
Site 3c – Camarillo Hills Drain Outlet
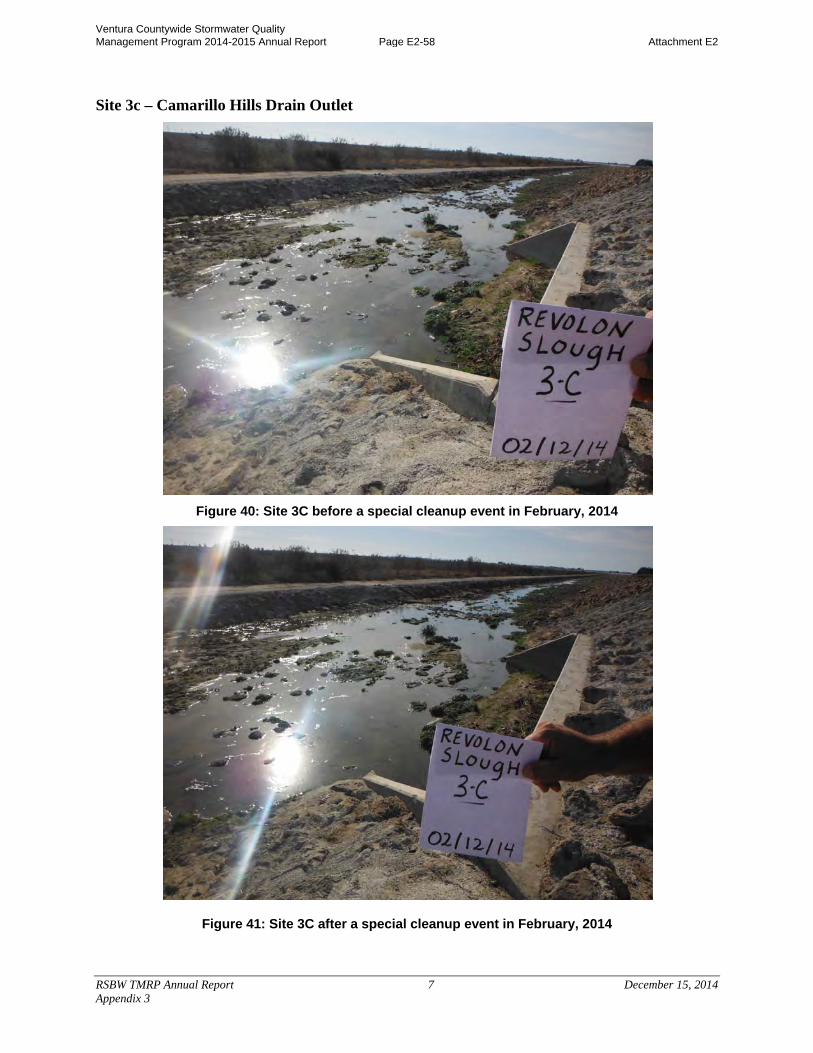
Figure 40: Site 3C before a special cleanup event in February, 2014
Figure 41: Site 3C after a special cleanup event in February, 2014
Ventura Countywide Stormwater Quality Management Program 2014-2015 Annual Report Page E2-58 Attachment E2
RSBW TMRP Annual Report 8 December 15, 2014 Appendix 3
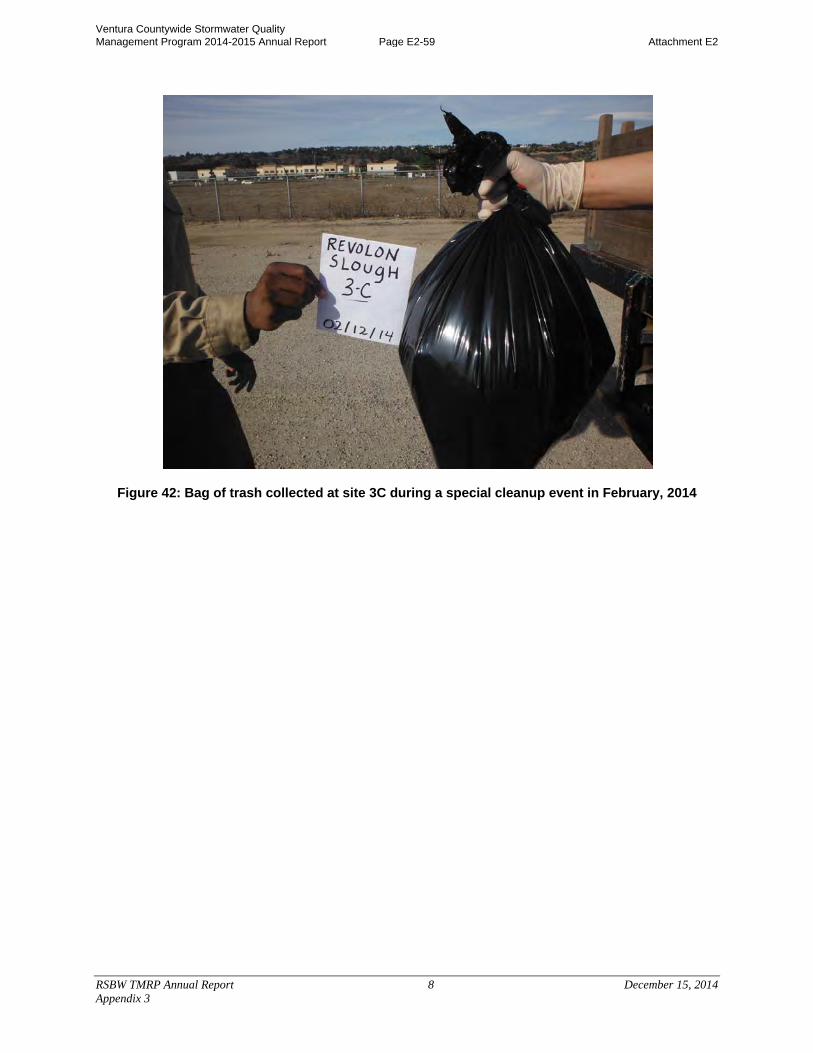
Figure 42: Bag of trash collected at site 3C during a special cleanup event in February, 2014
Ventura Countywide Stormwater Quality Management Program 2014-2015 Annual Report Page E2-59 Attachment E2
RSBW TMRP Annual Report 9 December 15, 2014 Appendix 3
Site 3d - Camarillo Hills Drain Outlet
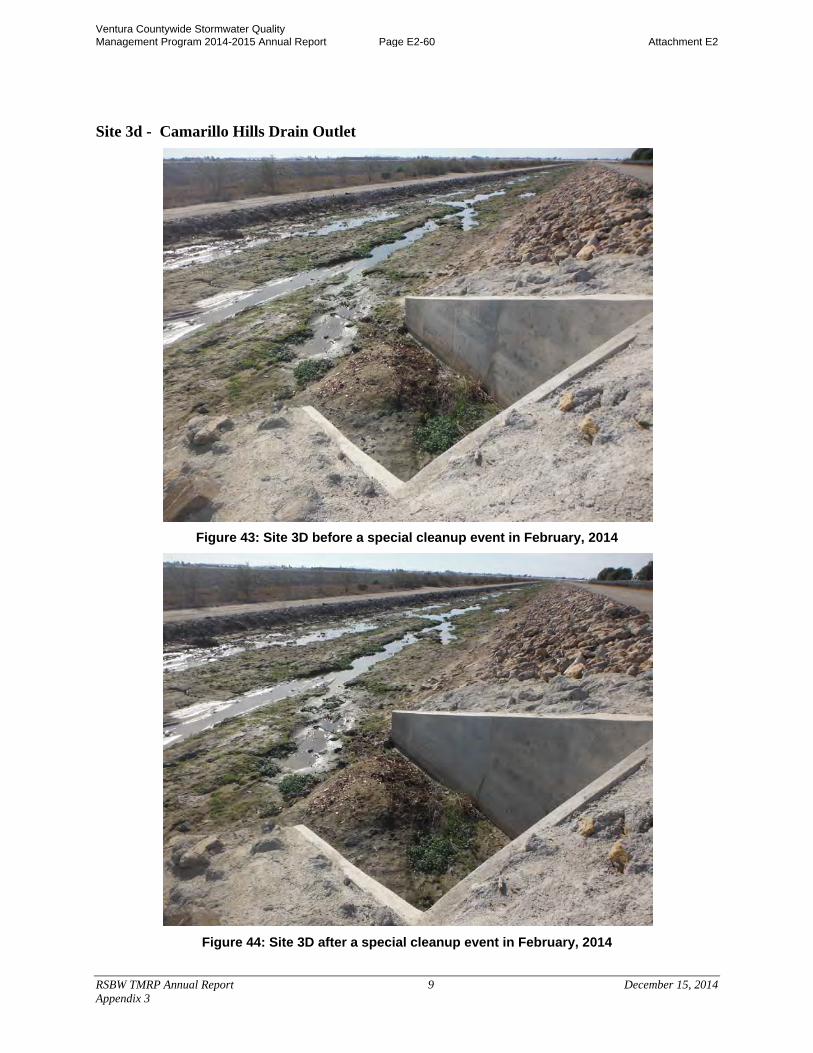
Figure 43: Site 3D before a special cleanup event in February, 2014
Figure 44: Site 3D after a special cleanup event in February, 2014
Ventura Countywide Stormwater Quality Management Program 2014-2015 Annual Report Page E2-60 Attachment E2
RSBW TMRP Annual Report 10 December 15, 2014 Appendix 3
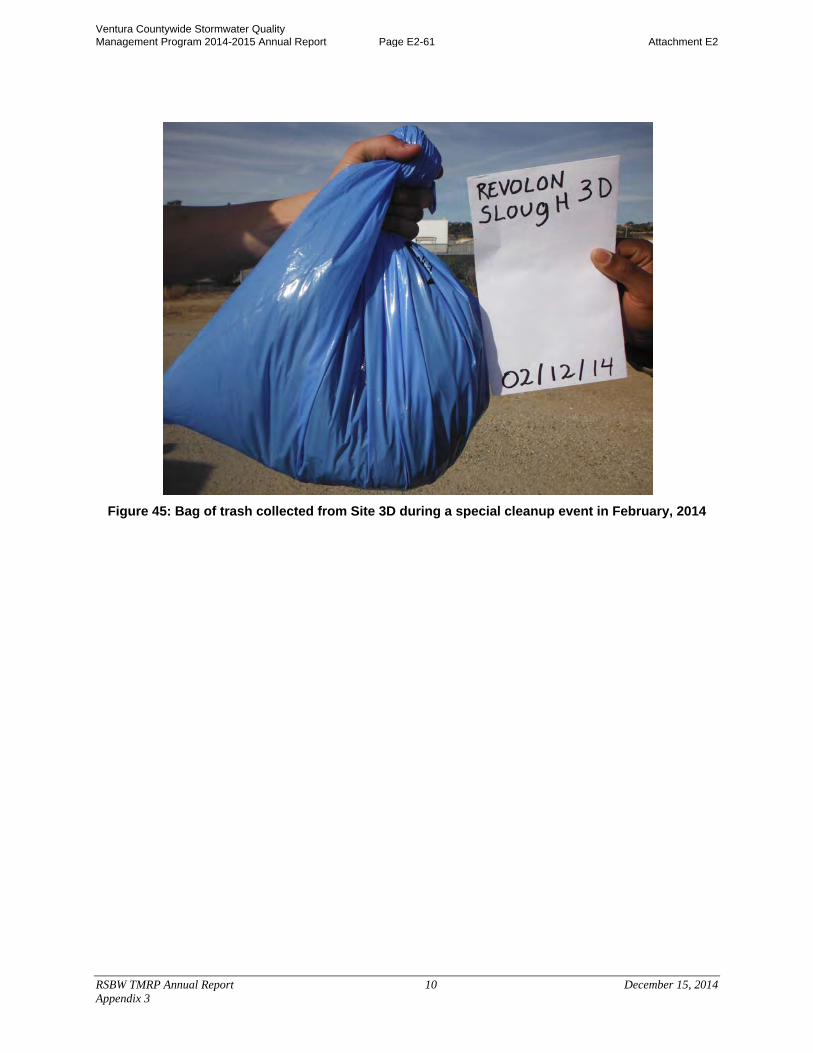
Figure 45: Bag of trash collected from Site 3D during a special cleanup event in February, 2014
Ventura Countywide Stormwater Quality Management Program 2014-2015 Annual Report Page E2-61 Attachment E2
RSBW TMRP Annual Report 11 December 15, 2014 Appendix 3
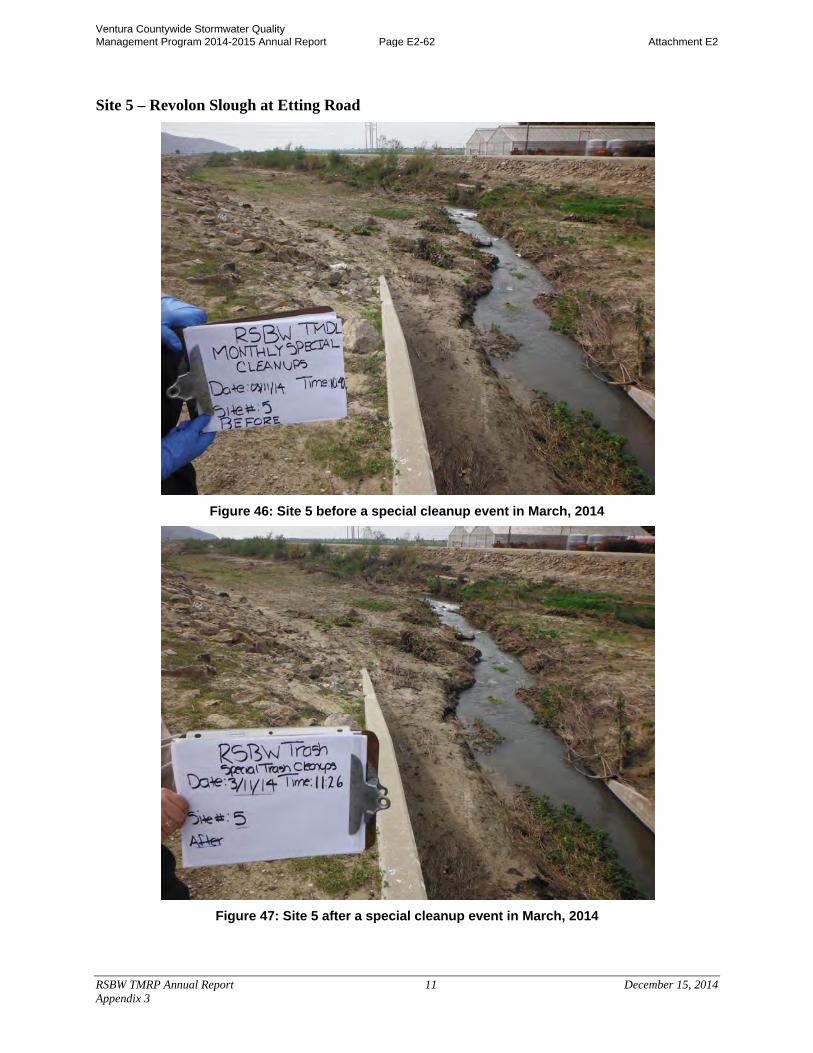
Site 5 – Revolon Slough at Etting Road
Figure 46: Site 5 before a special cleanup event in March, 2014
Figure 47: Site 5 after a special cleanup event in March, 2014
Ventura Countywide Stormwater Quality Management Program 2014-2015 Annual Report Page E2-62 Attachment E2