Embed Size (px)
Citation preview
Children’s use of mobile phones
A special report 2014
Published in 2015 by the GSMA and the Mobile Society Research Institute within NTT DOCOMO, Inc. Japan.
With special thanks to Net Children Go Mobile and Dr. Giovanna Mascheroni, Università Cattolica del Sacro Cuore, Italy for providing the European data for this comparative report.
CHILDREN’S USE OF MOBILE PHONES – A SPECIAL REPORT 2014
The GSMA represents the interests of mobile operators worldwide, uniting nearly 800 operators with more than 250 companies in the broader mobile ecosystem, including handset and device makers, software companies, equipment providers and Internet companies, as well as organisations in adjacent industry sectors. The GSMA also produces industry-leading events such as Mobile World Congress, Mobile World Congress Shanghai and the Mobile 360 Series conferences.
For more information, please visit the GSMA corporate website at www.gsma.com
Follow the GSMA on Twitter: @GSMA
NTT DOCOMO is Japan’s premier provider of leading-edge mobile voice, data and multimedia services. With more than 68 million customers in Japan, the company is one of the world’s largest mobile communications operators. Since 2004, NTT DOCOMO’s Mobile Society Research Institute (MSRI) within NTT DOCOMO has been studying the social impact of mobile phone use. The research institute, which operates independently from NTT DOCOMO, conducts research studies into both present and future influences of mobile communications. Its findings are widely disclosed to the public through reports, publications and symposia.
For more information, please visit www.nttdocomo.co.jp/corporate/disclosure/moba-ken/
CHILDREN’S USE OF MOBILE PHONES – A SPECIAL REPORT 2014
Contents1. Introduction 04
2. Summary of key findings 05
3. Children and mobile phones: An overview 07
4. Children’s use of mobile phones and the internet 12
5. Apps, location and social networking services 15
6. Mobile phones and children’s wellbeing 23
7. Digital literacy, skills and parental controls 28
4
CHILDREN’S USE OF MOBILE PHONES – A SPECIAL REPORT 2014
INTRODUCTIONChildren’s use of mobile phones: A special report 2014 provides a detailed comparison ofchildren’s mobile phone and internet usage in seven European countries - Belgium, Denmark, Ireland, Italy, Portugal, Romania and the United Kingdom - with that of children in Japan. This special report builds upon work previously conducted in other parts of the world and focuses on children in European countries for the first time.
The report is part of a collaboration between the GSMA, DOCOMO and Net Children Go Mobile. The European data was collected as part of the Net Children Go Mobile project, which is co-funded by the European Commission’s Safer Internet Programme (now Better Internet for Kids)1. The surveys in Denmark, Italy, Romania and the UK were directly funded by the Safer Internet Programme and the surveys in Belgium, Ireland and Portugal were self-funded.
The European surveys were conducted face-to-face in UK, Denmark, Italy, Romania and Ireland from May to November 2013, and in Portugal and Belgium from February to March 2014. The surveys were conducted by Ipsos and involved a random stratified sample of around 500 children per country, consisting of 9 to 16-year-olds who are internet users. Further information on the European surveys and the final Net Children Go Mobile report2 can be found at www.netchildrengomobile.eu/reports
The Japanese surveys were conducted online in January 2014. A thousand children aged 9 to 16 years old were surveyed with the sampling of age and gender consistent with demographics of Japan’s overall population. A research firm, MyVoice Communications, Inc., was used to maintain quality and ensure a representative sample of Japanese children.
1.1 Methodology
1. European Commission Grant Agreement: SI-2012-KEP-411201.2. Mascheroni, G. and Ólafsson, K. (2014). Net Children Go Mobile: risks and opportunities. Second edition. Milano: Educatt.
5
CHILDREN’S USE OF MOBILE PHONES – A SPECIAL REPORT 2014
Chapter 3: Children and mobile phones – an overview
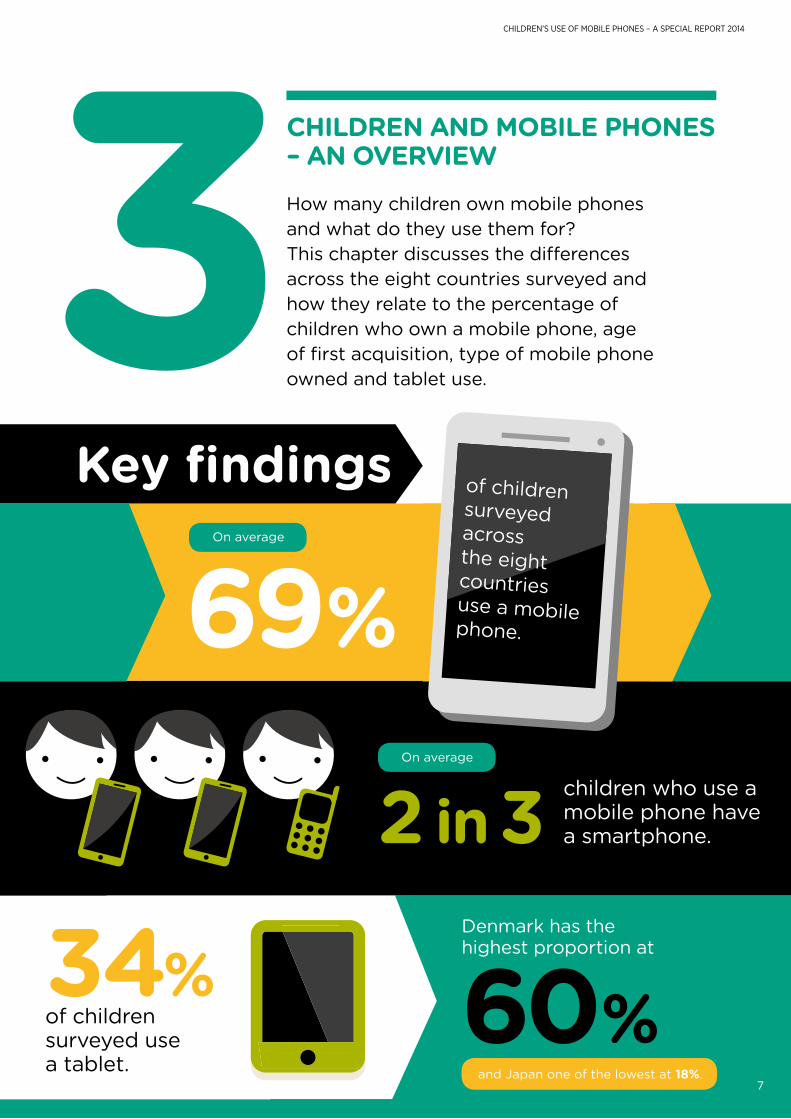
• On average, 69 per cent of children surveyed across the eight countries use a mobile phone.
• Among 15 and 16-year-olds surveyed, 10 and 12 years were the most common ages to first receive a mobile phone. Japanese children receive them at older ages (the majority at 15 years) compared to their European counterparts.
• On average, two in three children who use a mobile phone have a smartphone.
• 34 per cent of children surveyed use a tablet. Denmark has the highest proportion at 60 per cent and Japan one of the lowest at 18 per cent.
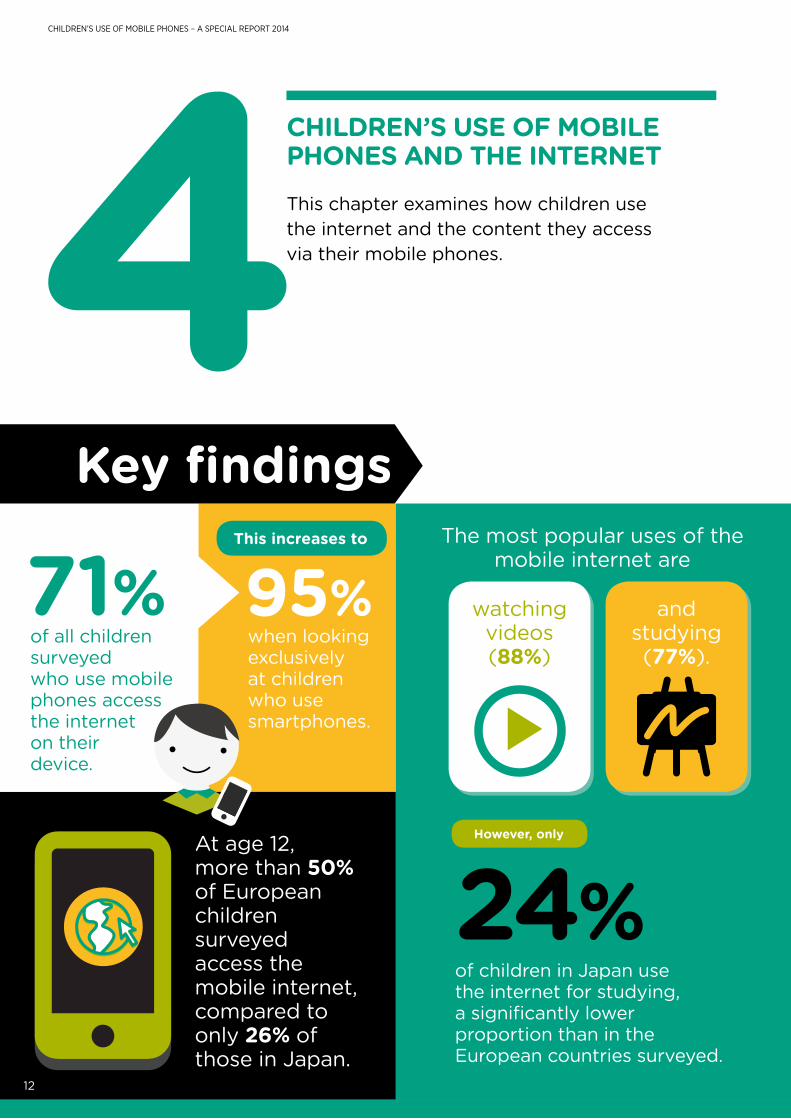
Chapter 4: Children’s use of mobile phones and the internet• 71 per cent of all children surveyed who use mobile
phones access the internet on their device. This increases to 95 per cent when looking exclusively at children who use smartphones.
• At age 12, more than 50 per cent of European children surveyed access the mobile internet, compared to only 26 per cent of those in Japan.
• The most popular uses of the mobile internet are watching videos (88 per cent) and studying (77 per cent). However, only 24 per cent of children in Japan use the internet for studying, a significantly lower proportion than in the European countries surveyed.
2.1 Key findings by chapter
SUMMARY OF KEY FINDINGS
6
CHILDREN’S USE OF MOBILE PHONES – A SPECIAL REPORT 2014
Chapter 6: Mobile phones and children’s wellbeing
Chapter 7: Digital literacy, skills and parental controls
• 10 per cent of children who use mobile phones have gone without eating or sleeping due to time spent on the internet. Japanese children do this at a much higher rate than the European children surveyed, at 29 per cent.
• 38 per cent of children who use smartphones felt anxious when they couldn’t use the internet, with children tending to feel this more as they grew older.
• 22 per cent of children who use mobile phones felt they spend less time with family, friends or
schoolwork due to the internet, and 20 per cent had tried, unsuccessfully, to reduce the time they spend on the internet.
• 40 per cent of children who use mobile phones exchange messages with their parents almost every day and 54 per cent speak to their parents on the phone nearly daily. Japanese children message and call their parents at significantly lower rates than European children, at 11 per cent and 7 per cent respectively.
• 80 per cent of children aged 13 or older who use mobile phones can block messages that they don’t want to receive, and nearly 70 per cent can erase their internet history. Japanese children had the lowest results in both categories among countries surveyed.
• In both Japan and Europe, children seek advice on their mobile phone or internet use from their parents first and then their friends. This changes with age, with older children (aged 15 and 16) turning to their friends before family.
• 63 per cent of European parents ask their teenage children about their internet use compared to 32 per cent of Japanese parents. Similarly 40 per cent of European parents have sat with their children when they use the internet, compared to 21 per cent of Japanese parents.
Chapter 5: Apps, location and social networking services
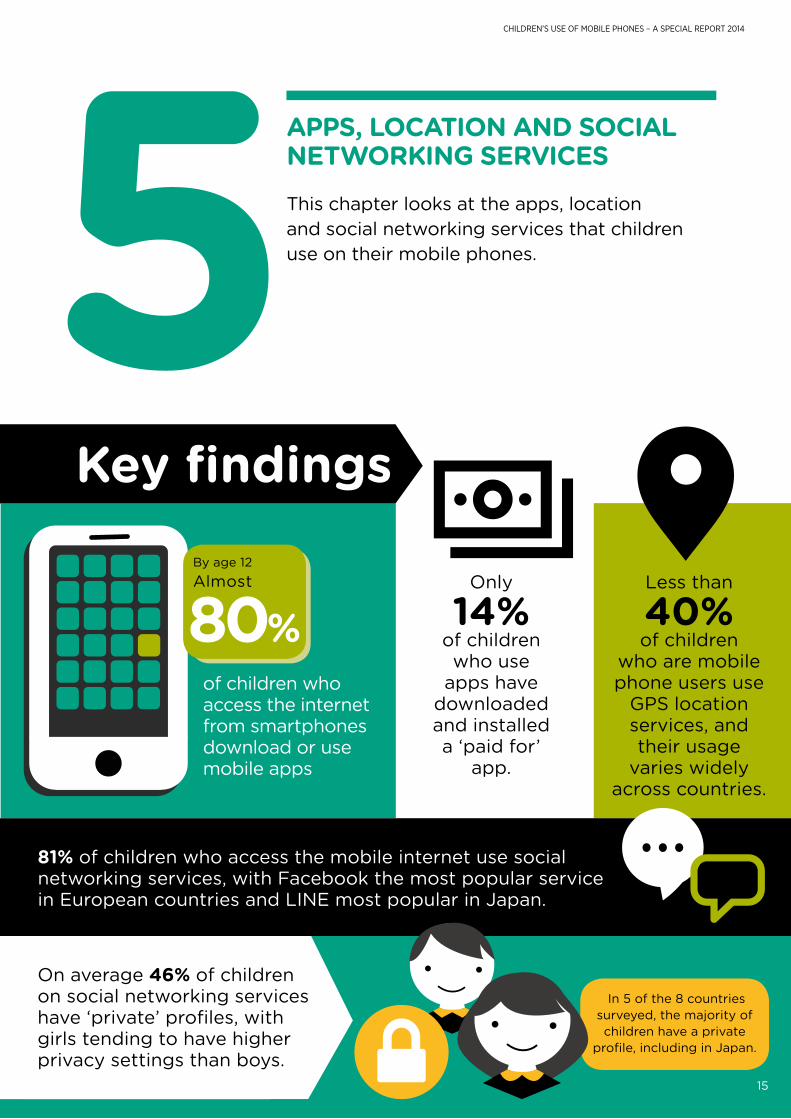
• By age 12, almost 80 per cent of children who access the internet from smartphones download or use mobile apps.
• Only 14 per cent of children who use apps have downloaded and installed a ‘paid for’ app.
• Less than 40 per cent of children who are mobile phone users use GPS location services, and their usage varies widely across countries.
• 81 per cent of children who access the mobile internet use social networking services, with Facebook the most popular service in European countries and LINE most popular in Japan.
• On average 46 per cent of children on social networking services have ‘private’ profiles, with girls tending to have higher privacy settings than boys. In 5 of the 8 countries surveyed, the majority of children have a private profile, including in Japan.
CHILDREN’S USE OF MOBILE PHONES – A SPECIAL REPORT 2014
CHILDREN AND MOBILE PHONES – AN OVERVIEW
How many children own mobile phones and what do they use them for? This chapter discusses the differences across the eight countries surveyed and how they relate to the percentage of children who own a mobile phone, age of first acquisition, type of mobile phone owned and tablet use.
Key findings
2 in 3 children who use a mobile phone have a smartphone.
On average
On average
of children surveyed use a tablet.
Denmark has the highest proportion at34% 60%
69%
of children surveyed across the eight countries use a mobile phone.
and Japan one of the lowest at 18%.7
8
CHILDREN’S USE OF MOBILE PHONES – A SPECIAL REPORT 2014
3.1 Mobile phone use and age of first ownership
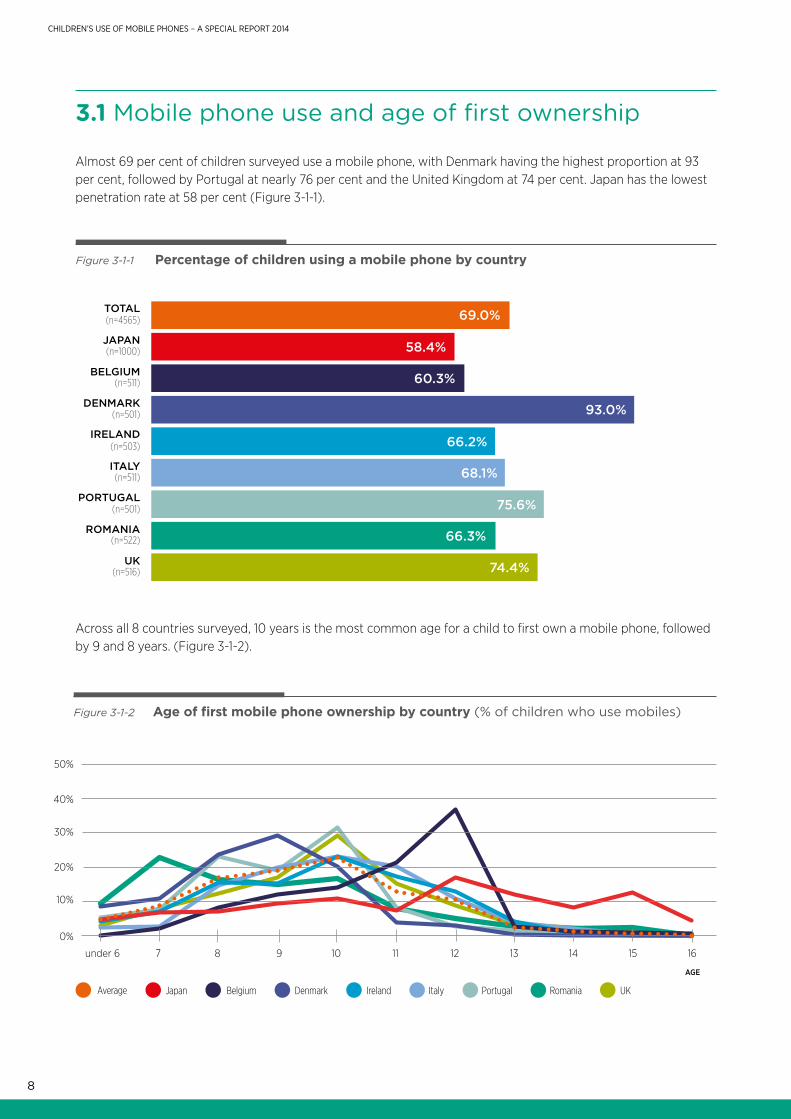
Almost 69 per cent of children surveyed use a mobile phone, with Denmark having the highest proportion at 93 per cent, followed by Portugal at nearly 76 per cent and the United Kingdom at 74 per cent. Japan has the lowest penetration rate at 58 per cent (Figure 3-1-1).
Across all 8 countries surveyed, 10 years is the most common age for a child to first own a mobile phone, followed by 9 and 8 years. (Figure 3-1-2).
Figure 3-1-1 Percentage of children using a mobile phone by country
Figure 3-1-2 Age of first mobile phone ownership by country (% of children who use mobiles)
69.0%
58.4%
93.0%
68.1%
66.3%
60.3%
66.2%
75.6%
74.4%
16
AGE
50%
40%
30%
20%
10%
0%
under 6 7 8 9 10 11 12 13 14 15
Average Japan Belgium Denmark Ireland Italy Portugal Romania UK
(n=4565)TOTAL
JAPAN(n=1000)
BELGIUM(n=511)
DENMARK(n=501)
IRELAND(n=503)
ITALY(n=511)
PORTUGAL(n=501)
ROMANIA(n=522)
UK(n=516)
9
CHILDREN’S USE OF MOBILE PHONES – A SPECIAL REPORT 2014
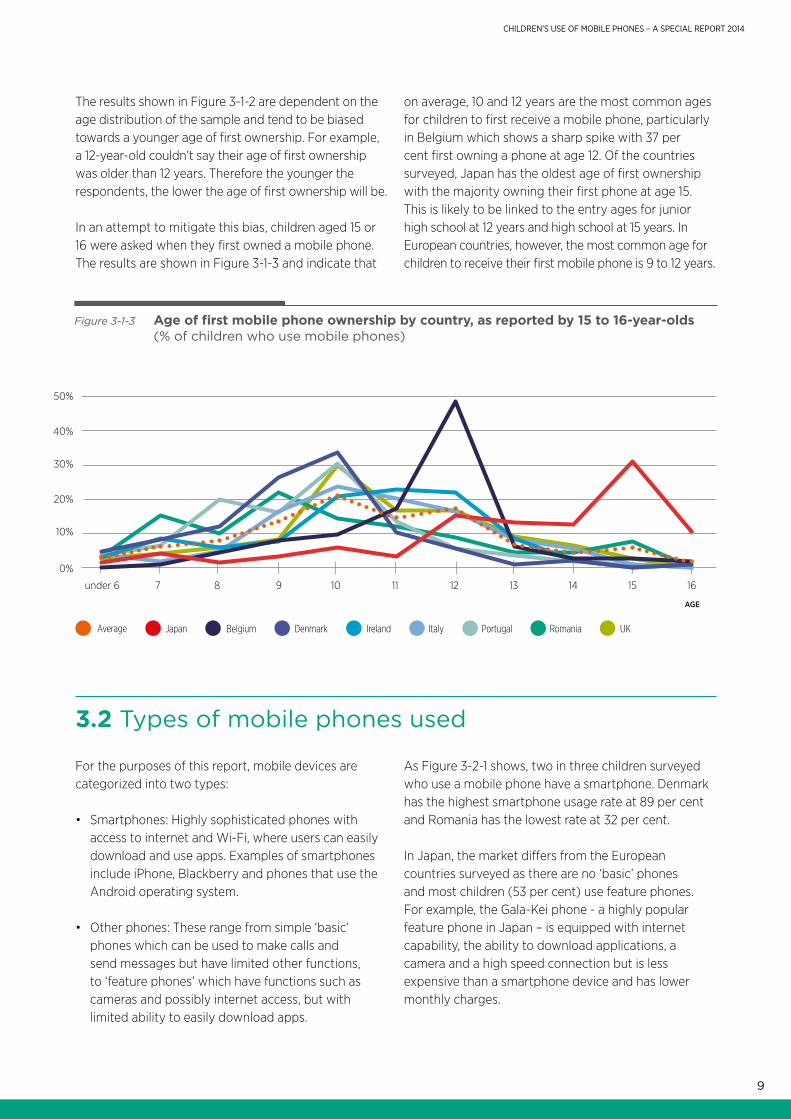
The results shown in Figure 3-1-2 are dependent on the age distribution of the sample and tend to be biased towards a younger age of first ownership. For example, a 12-year-old couldn’t say their age of first ownership was older than 12 years. Therefore the younger the respondents, the lower the age of first ownership will be.
In an attempt to mitigate this bias, children aged 15 or 16 were asked when they first owned a mobile phone. The results are shown in Figure 3-1-3 and indicate that
on average, 10 and 12 years are the most common ages for children to first receive a mobile phone, particularly in Belgium which shows a sharp spike with 37 per cent first owning a phone at age 12. Of the countries surveyed, Japan has the oldest age of first ownership with the majority owning their first phone at age 15. This is likely to be linked to the entry ages for junior high school at 12 years and high school at 15 years. InEuropean countries, however, the most common age for children to receive their first mobile phone is 9 to 12 years.
For the purposes of this report, mobile devices are categorized into two types:
• Smartphones: Highly sophisticated phones with access to internet and Wi-Fi, where users can easily download and use apps. Examples of smartphones include iPhone, Blackberry and phones that use the Android operating system.
• Other phones: These range from simple ‘basic’ phones which can be used to make calls and send messages but have limited other functions, to ‘feature phones’ which have functions such as cameras and possibly internet access, but with limited ability to easily download apps.
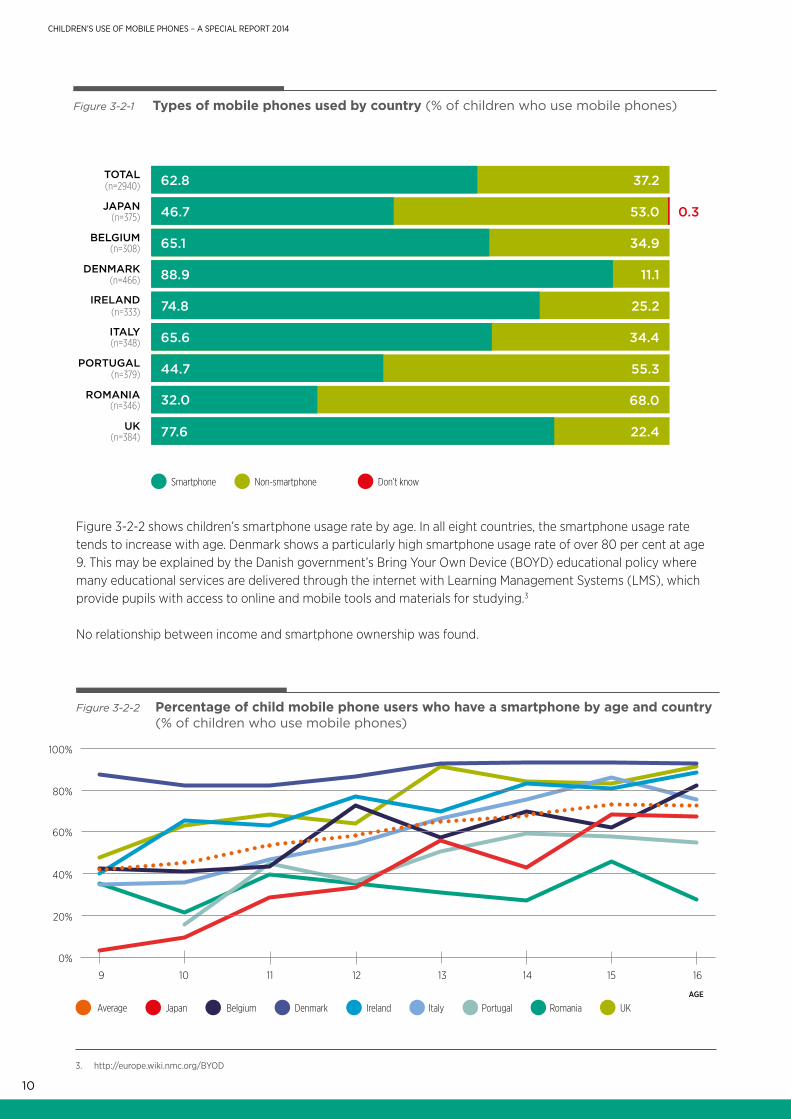
As Figure 3-2-1 shows, two in three children surveyed who use a mobile phone have a smartphone. Denmark has the highest smartphone usage rate at 89 per cent and Romania has the lowest rate at 32 per cent.
In Japan, the market differs from the European countries surveyed as there are no ‘basic’ phones and most children (53 per cent) use feature phones. For example, the Gala-Kei phone - a highly popular feature phone in Japan – is equipped with internet capability, the ability to download applications, a camera and a high speed connection but is less expensive than a smartphone device and has lower monthly charges.
Figure 3-1-3 Age of first mobile phone ownership by country, as reported by 15 to 16-year-olds (% of children who use mobile phones)
16
AGE
50%
40%
30%
20%
10%
0%
under 6 7 8 9 10 11 12 13 14 15
3.2 Types of mobile phones used
Average Japan Belgium Denmark Ireland Italy Portugal Romania UK
10
CHILDREN’S USE OF MOBILE PHONES – A SPECIAL REPORT 2014
Figure 3-2-1 Types of mobile phones used by country (% of children who use mobile phones)
Figure 3-2-2 Percentage of child mobile phone users who have a smartphone by age and country (% of children who use mobile phones)
62.8 37.2
53.0 0.346.7
34.965.1
11.188.9
25.274.8
34.465.6
55.344.7
68.032.0
22.477.6
Smartphone Non-smartphone Don’t know
Figure 3-2-2 shows children’s smartphone usage rate by age. In all eight countries, the smartphone usage rate tends to increase with age. Denmark shows a particularly high smartphone usage rate of over 80 per cent at age 9. This may be explained by the Danish government’s Bring Your Own Device (BOYD) educational policy where many educational services are delivered through the internet with Learning Management Systems (LMS), which provide pupils with access to online and mobile tools and materials for studying.3
No relationship between income and smartphone ownership was found.
3. http://europe.wiki.nmc.org/BYOD
16
AGE
100%
80%
60%
40%
20%
0%
9 10 11 12 13 14 15
Average Japan Belgium Denmark Ireland Italy Portugal Romania UK
(n=2940)TOTAL
JAPAN(n=375)
BELGIUM(n=308)
DENMARK(n=466)
IRELAND(n=333)
ITALY(n=348)
PORTUGAL(n=379)
ROMANIA(n=346)
UK(n=384)
11
CHILDREN’S USE OF MOBILE PHONES – A SPECIAL REPORT 2014
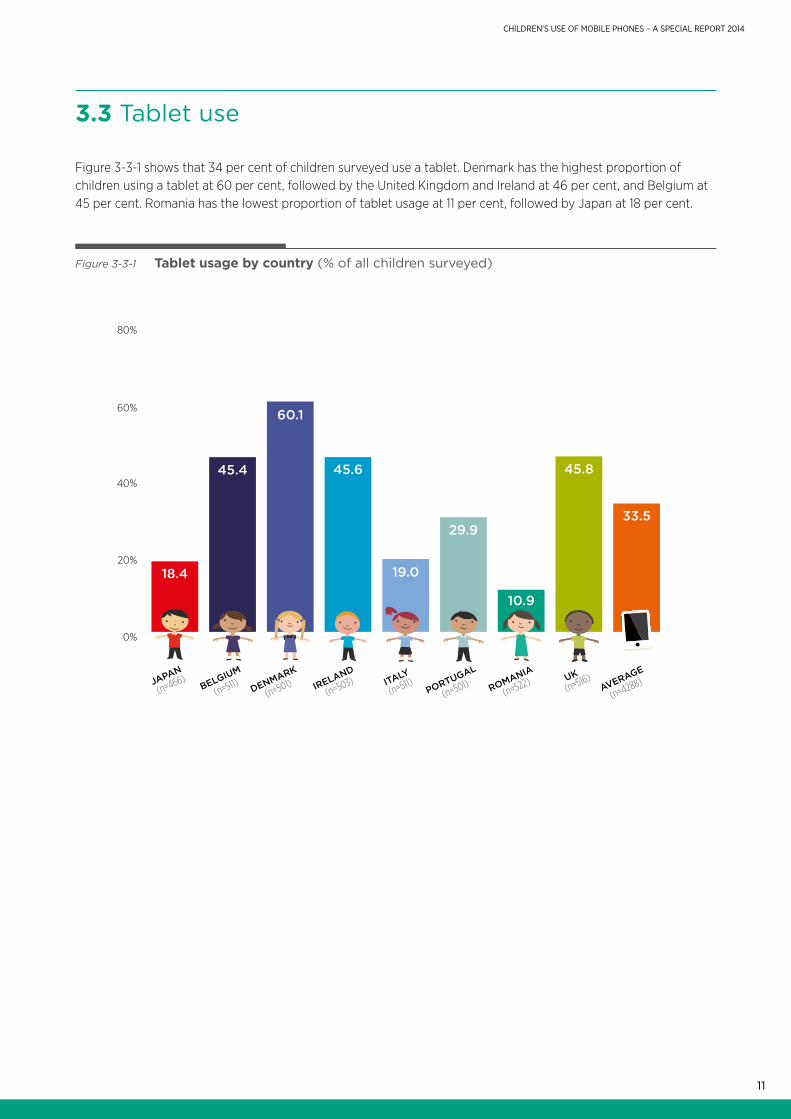
Figure 3-3-1 Tablet usage by country (% of all children surveyed)
Figure 3-3-1 shows that 34 per cent of children surveyed use a tablet. Denmark has the highest proportion of children using a tablet at 60 per cent, followed by the United Kingdom and Ireland at 46 per cent, and Belgium at 45 per cent. Romania has the lowest proportion of tablet usage at 11 per cent, followed by Japan at 18 per cent.
3.3 Tablet use
0%
20%
40%
60%
80%
18.4
45.4
60.1
45.6
29.9
10.9
45.8
33.5
19.0
JAPAN
BELGIUM
DENMARK
IRELANDITALY
PORTUGAL
ROMANIA UKAVERAGE
(n=466)(n=511)
(n=501)(n=503)
(n=511)(n=501)
(n=522)(n=516)
(n=4288)
CHILDREN’S USE OF MOBILE PHONES – A SPECIAL REPORT 2014
CHILDREN’S USE OF MOBILE PHONES AND THE INTERNET
This chapter examines how children use the internet and the content they access via their mobile phones.
Key findings
24% of children in Japan use the internet for studying, a significantly lower proportion than in the European countries surveyed.
At age 12, more than 50% of European children surveyed access the mobile internet, compared to only 26% of those in Japan.
95% when looking exclusively at children who use smartphones.
71%of all children surveyed who use mobile phones access the internet on their device.
This increases to
However, only
The most popular uses of the mobile internet are
and studying (77%).
watching videos (88%)
12
13
CHILDREN’S USE OF MOBILE PHONES – A SPECIAL REPORT 2014
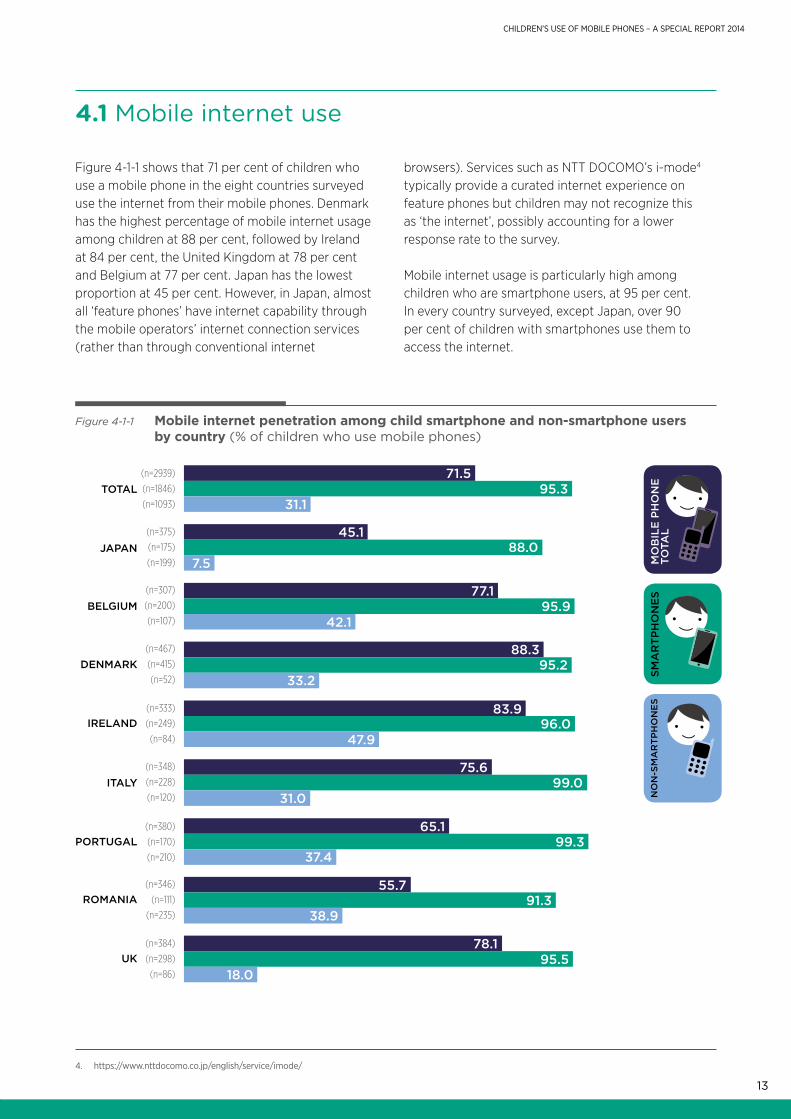
4.1 Mobile internet use
Figure 4-1-1 shows that 71 per cent of children who use a mobile phone in the eight countries surveyed use the internet from their mobile phones. Denmark has the highest percentage of mobile internet usage among children at 88 per cent, followed by Ireland at 84 per cent, the United Kingdom at 78 per cent and Belgium at 77 per cent. Japan has the lowest proportion at 45 per cent. However, in Japan, almost all ‘feature phones’ have internet capability through the mobile operators’ internet connection services(rather than through conventional internet
browsers). Services such as NTT DOCOMO’s i-mode4 typically provide a curated internet experience on feature phones but children may not recognize this as ‘the internet’, possibly accounting for a lower response rate to the survey.
Mobile internet usage is particularly high among children who are smartphone users, at 95 per cent. In every country surveyed, except Japan, over 90 per cent of children with smartphones use them to access the internet.
4. https://www.nttdocomo.co.jp/english/service/imode/
MO
BIL
E P
HO
NE
TO
TAL
SMA
RT
PH
ON
ES
NO
N-S
MA
RT
PH
ON
ES
71.595.3
31.1
45.188.0
7.5
77.195.9
42.1
88.395.2
33.2
83.996.0
47.9
75.699.0
31.0
65.199.3
37.4
55.791.3
38.9
78.195.5
18.0
Figure 4-1-1 Mobile internet penetration among child smartphone and non-smartphone users by country (% of children who use mobile phones)
(n=2939)
(n=375)
(n=307)
(n=467)
(n=333)
(n=348)
(n=380)
(n=346)
(n=384)
TOTAL
JAPAN
BELGIUM
DENMARK
IRELAND
ITALY
PORTUGAL
ROMANIA
UK
(n=1846)
(n=175)
(n=200)
(n=415)
(n=249)
(n=228)
(n=170)
(n=111)
(n=298)
(n=1093)
(n=199)
(n=107)
(n=52)
(n=84)
(n=120)
(n=210)
(n=235)
(n=86)
14
CHILDREN’S USE OF MOBILE PHONES – A SPECIAL REPORT 2014
Figure 4-1-2 Mobile internet penetration rate by country and age (% of children who use mobile phones)
16
AGE
100%
80%
60%
40%
20%
0%
9 10 11 12 13 14 15
Average Japan Belgium Denmark Ireland Italy Portugal Romania UK
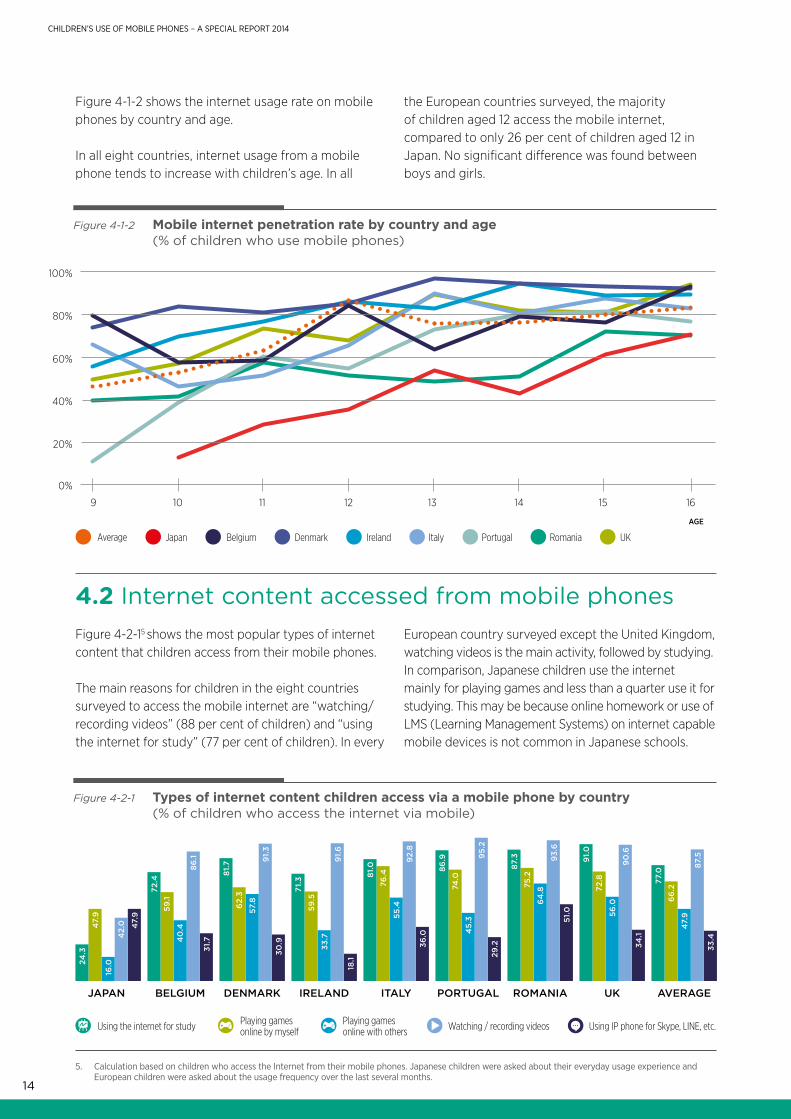
4.2 Internet content accessed from mobile phonesFigure 4-2-15 shows the most popular types of internet content that children access from their mobile phones.
The main reasons for children in the eight countries surveyed to access the mobile internet are “watching/recording videos” (88 per cent of children) and “using the internet for study” (77 per cent of children). In every
European country surveyed except the United Kingdom, watching videos is the main activity, followed by studying. In comparison, Japanese children use the internet mainly for playing games and less than a quarter use it for studying. This may be because online homework or use of LMS (Learning Management Systems) on internet capable mobile devices is not common in Japanese schools.
5. Calculation based on children who access the Internet from their mobile phones. Japanese children were asked about their everyday usage experience and European children were asked about the usage frequency over the last several months.
Figure 4-2-1 Types of internet content children access via a mobile phone by country (% of children who access the internet via mobile)
72.4
59.1
40
.4
86.1
31.7
BELGIUM
81.7
62.
3
57.8
91.
3
30.9
DENMARK
71.
3
59.5
33.7
91.
6
18.1
IRELAND
81.0
76.4
55.4
92.
8
36.0
ITALY
86.9
74.0
45.
3
95.
2
29.2
PORTUGAL
87.3
75.2
64
.8
93.
651
.0
ROMANIAJAPAN
24.3
16.0
42.
0 47.
9
47.
9
UK
91.
0
72.8
56.0
90
.6
34.1
AVERAGE
77.0
66
.2
47.
9
87.5
33.4
Watching / recording videosPlaying games online with others
Playing games online by myselfUsing the internet for study Using IP phone for Skype, LINE, etc.
Figure 4-1-2 shows the internet usage rate on mobile phones by country and age.
In all eight countries, internet usage from a mobile phone tends to increase with children’s age. In all
the European countries surveyed, the majority of children aged 12 access the mobile internet, compared to only 26 per cent of children aged 12 in Japan. No significant difference was found between boys and girls.
CHILDREN’S USE OF MOBILE PHONES – A SPECIAL REPORT 2014
APPS, LOCATION AND SOCIAL NETWORKING SERVICES
This chapter looks at the apps, location and social networking services that children use on their mobile phones.
Key findings
Only
14% of children who use
apps have downloaded and installed a ‘paid for’
app.
Less than
40% of children
who are mobile phone users use
GPS locationservices, and their usage
varies widely across countries.
81% of children who access the mobile internet use social networking services, with Facebook the most popular service in European countries and LINE most popular in Japan.
On average 46% of children on social networking services have ‘private’ profiles, with girls tending to have higher privacy settings than boys.
of children who access the internet from smartphones download or use mobile apps
In 5 of the 8 countries surveyed, the majority of children have a private
profile, including in Japan.
15
80%AlmostBy age 12
16
CHILDREN’S USE OF MOBILE PHONES – A SPECIAL REPORT 2014
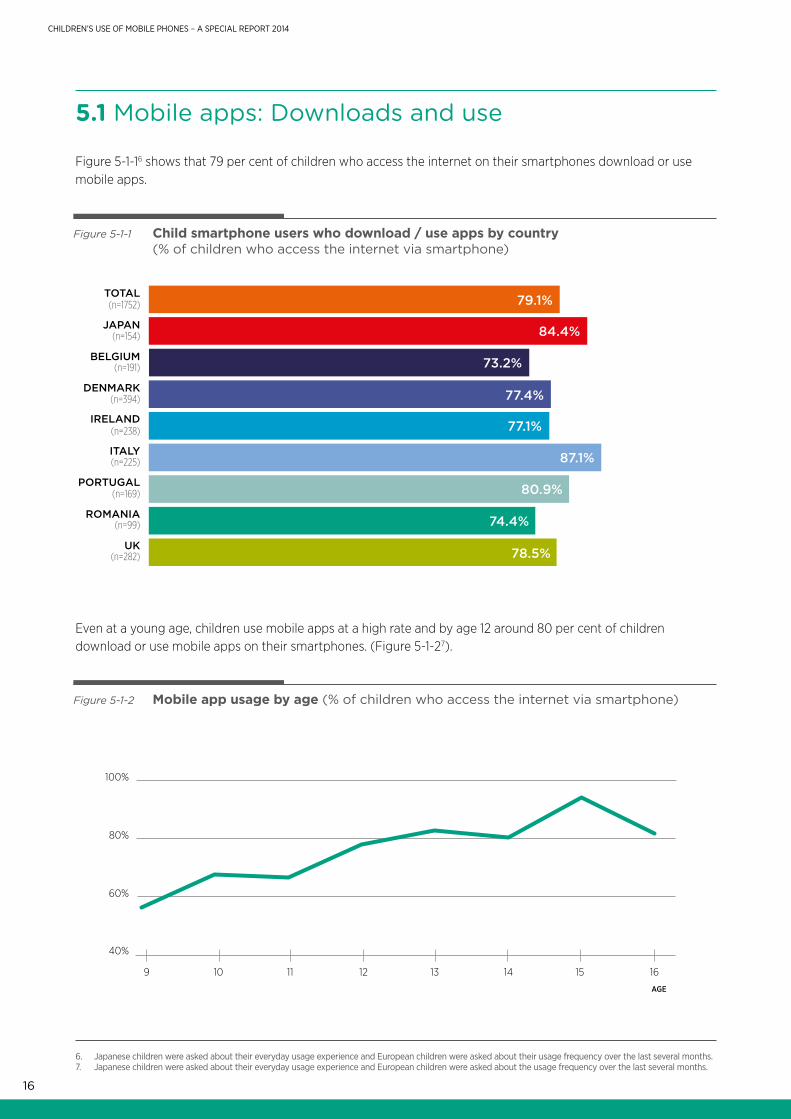
5.1 Mobile apps: Downloads and use
Figure 5-1-16 shows that 79 per cent of children who access the internet on their smartphones download or use mobile apps.
Even at a young age, children use mobile apps at a high rate and by age 12 around 80 per cent of children download or use mobile apps on their smartphones. (Figure 5-1-27).
6. Japanese children were asked about their everyday usage experience and European children were asked about their usage frequency over the last several months. 7. Japanese children were asked about their everyday usage experience and European children were asked about the usage frequency over the last several months.
Figure 5-1-1 Child smartphone users who download / use apps by country (% of children who access the internet via smartphone)
Figure 5-1-2 Mobile app usage by age (% of children who access the internet via smartphone)
79.1%
84.4%
73.2%
77.4%
77.1%
87.1%
80.9%
74.4%
78.5%
16
AGE
100%
80%
60%
40%
9 10 11 12 13 14 15
(n=1752)TOTAL
JAPAN(n=154)
BELGIUM(n=191)
DENMARK(n=394)
IRELAND(n=238)
ITALY(n=225)
PORTUGAL(n=169)
ROMANIA(n=99)
UK(n=282)
17
CHILDREN’S USE OF MOBILE PHONES – A SPECIAL REPORT 2014
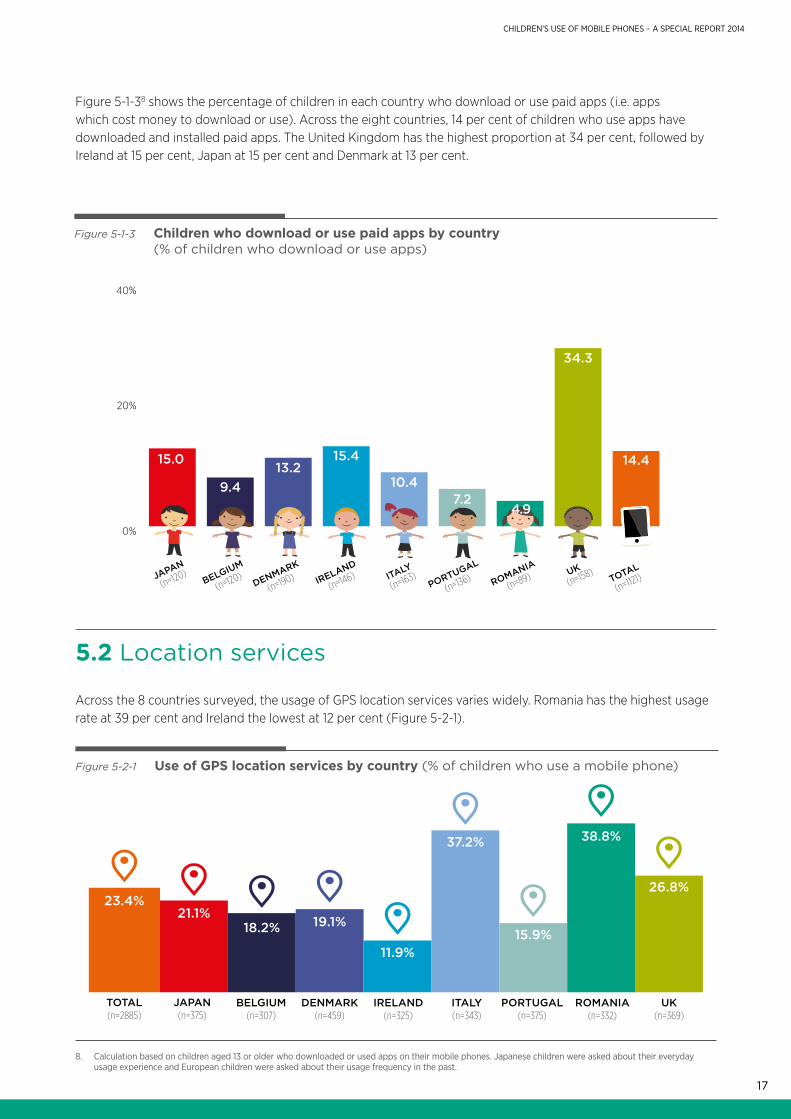
Figure 5-1-38 shows the percentage of children in each country who download or use paid apps (i.e. apps which cost money to download or use). Across the eight countries, 14 per cent of children who use apps have downloaded and installed paid apps. The United Kingdom has the highest proportion at 34 per cent, followed by Ireland at 15 per cent, Japan at 15 per cent and Denmark at 13 per cent.
Figure 5-1-3 Children who download or use paid apps by country (% of children who download or use apps)
8. Calculation based on children aged 13 or older who downloaded or used apps on their mobile phones. Japanese children were asked about their everyday usage experience and European children were asked about their usage frequency in the past.
5.2 Location services
Across the 8 countries surveyed, the usage of GPS location services varies widely. Romania has the highest usage rate at 39 per cent and Ireland the lowest at 12 per cent (Figure 5-2-1).
Figure 5-2-1 Use of GPS location services by country (% of children who use a mobile phone)
21.1%18.2% 19.1%
11.9%
37.2%
15.9%
38.8%
26.8%
0%
20%
40%
JAPAN
BELGIUM
DENMARK
IRELANDITALY
PORTUGAL
ROMANIA UKTOTAL
(n=120)(n=120)
(n=190)(n=146)
(n=163)(n=136)
(n=89) (n=158)
(n=1121)
15.0
9.413.2
15.4
10.47.2
4.9
34.3
14.4
JAPAN(n=375)
BELGIUM(n=307)
DENMARK(n=459)
IRELAND(n=325)
ITALY(n=343)
PORTUGAL(n=375)
ROMANIA(n=332)
UK(n=369)
23.4%
TOTAL(n=2885)

18
CHILDREN’S USE OF MOBILE PHONES – A SPECIAL REPORT 2014
5.3 Social networking services
Figure 5-3-19 shows the percentage of children using social networking services by mobile handset type and country. Almost 81 per cent of children who access the mobile internet use social networking services on their mobile phones, and this increases to 89 per cent when only considering smartphone users.
Table 5-3-2 shows the most popular social networking service platforms used by children in the eight countries surveyed. In all seven European countries Facebook was the most popular, and in Japan LINE is the most used.
9. Calculation based on mobile phone (smartphone) users. Japanese children were asked about their past experience using SNS. European children were asked about the usage frequency in the past of “Social networking profile”, “Chatrooms” or “Instant messaging”. Children who used any of them are counted as “users of SNS”.
Table 5-3-2 Social networking sites used by children by country (% of children who access social networking)
Figure 5-3-1 Use of social networking services on mobile phones by handset type and country (% of child mobile internet users)
JAPAN BELGIUM DENMARK IRELAND ITALY PORTUGAL ROMANIA UNITED KINGDOM AVERAGE
(N=) 189 299 368 271 317 375 397 307 2523
TWITTER 10.6 3.0 2.1 8.4 2.6 3.0 – 13.0 4.7
FACEBOOK 5.8 88.2 87.0 83.0 95.4 95.4 99.3 84.8 84.6
OTHER 4.7 8.8 10.9 8.5 2.1 1.6 0.7 2.2 4.8
LINE 78.8 – – – – – – – 5.9
45.1%
78.3%
JAPAN
(n=375)
(n=175)
77.4%
81.0%
IRELAND
(n=333)
(n=249)
86.9%
90.4%
BELGIUM
(n=308)
(n=200)
88.3%
89.7%
DENMARK
(n=466)
(n=415)
80.8%
88.7%
TOTAL
(n=1846)
(n=1093)
Mobile phone
Smartphones
89.6%
97.8%
ITALY
88.5%
93.9%
PORTUGAL
93.0%
96.7%
ROMANIA
77.8%
86.1%
UK
(n=348) (n=379) (n=346)
(n=228) (n=170) (n=111)
(n=384)
(n=298)
19
CHILDREN’S USE OF MOBILE PHONES – A SPECIAL REPORT 2014
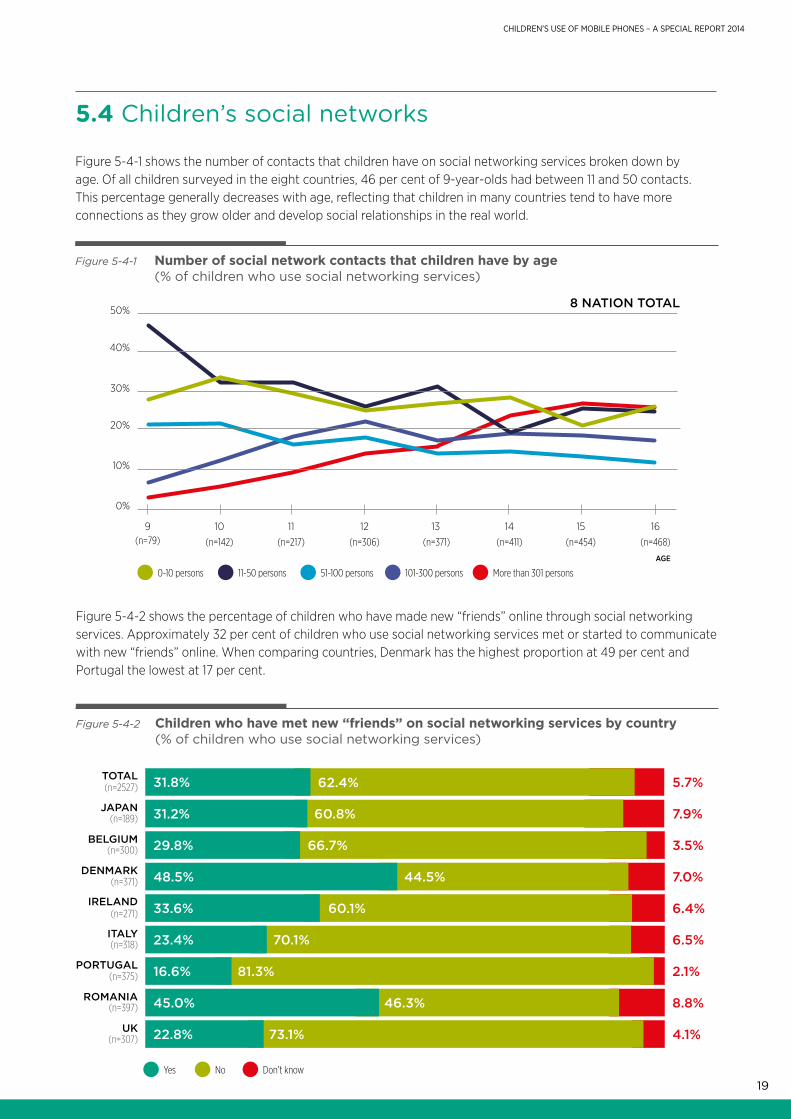
5.4 Children’s social networks
Figure 5-4-1 shows the number of contacts that children have on social networking services broken down by age. Of all children surveyed in the eight countries, 46 per cent of 9-year-olds had between 11 and 50 contacts. This percentage generally decreases with age, reflecting that children in many countries tend to have more connections as they grow older and develop social relationships in the real world.
Figure 5-4-1 Number of social network contacts that children have by age (% of children who use social networking services)
8 NATION TOTAL
0-10 persons 11-50 persons 51-100 persons 101-300 persons More than 301 persons
16
AGE
20%
0%
9 10 11 12 13 14 15
40%
(n=79) (n=142) (n=217) (n=306) (n=371) (n=411) (n=454) (n=468)
10%
30%
50%
Figure 5-4-2 Children who have met new “friends” on social networking services by country (% of children who use social networking services)
(n=2527)TOTAL 31.8% 62.4% 5.7%
7.9%60.8%31.2%
3.5%66.7%29.8%
7.0%44.5%48.5%
6.4%60.1%33.6%
6.5%70.1%23.4%
2.1%81.3%16.6%
8.8%46.3%45.0%
4.1%73.1%22.8%
JAPAN(n=189)
BELGIUM(n=300)
DENMARK(n=371)
IRELAND(n=271)
ITALY(n=318)
PORTUGAL(n=375)
ROMANIA(n=397)
UK(n=307)
Yes No Don’t know
Figure 5-4-2 shows the percentage of children who have made new “friends” online through social networking services. Approximately 32 per cent of children who use social networking services met or started to communicate with new “friends” online. When comparing countries, Denmark has the highest proportion at 49 per cent and Portugal the lowest at 17 per cent.
20
CHILDREN’S USE OF MOBILE PHONES – A SPECIAL REPORT 2014
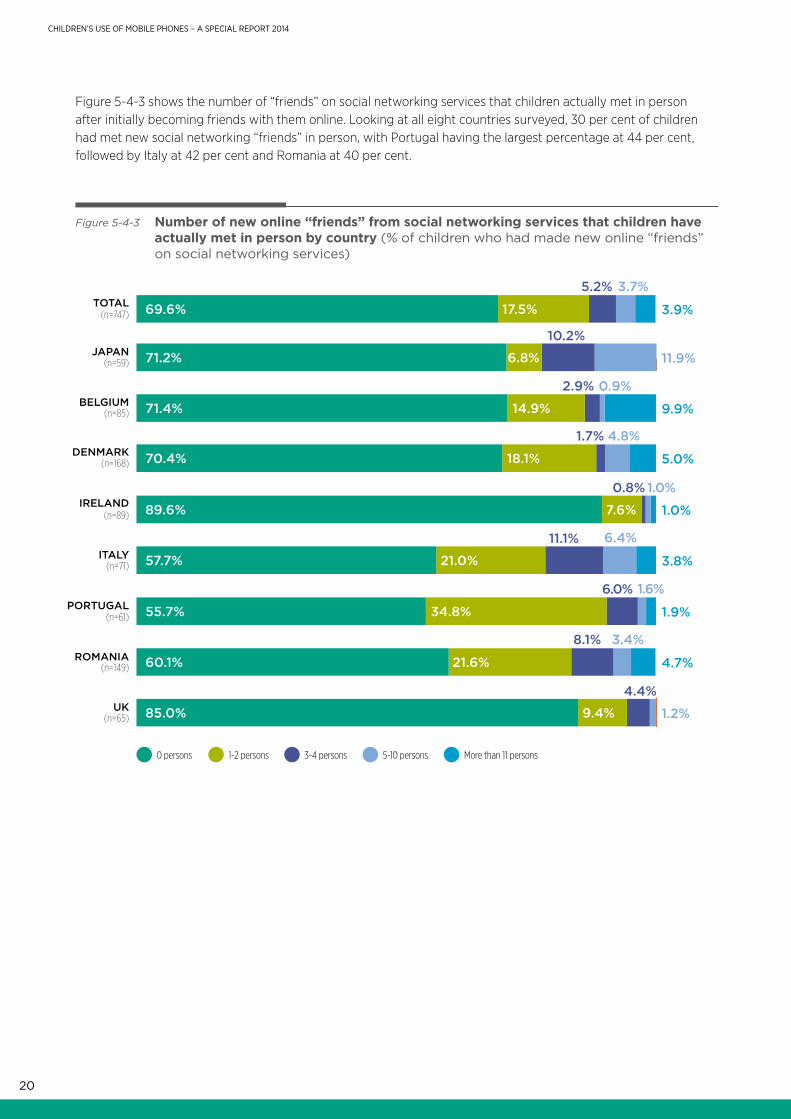
Figure 5-4-3 Number of new online “friends” from social networking services that children have actually met in person by country (% of children who had made new online “friends” on social networking services)
Figure 5-4-3 shows the number of “friends” on social networking services that children actually met in person after initially becoming friends with them online. Looking at all eight countries surveyed, 30 per cent of children had met new social networking “friends” in person, with Portugal having the largest percentage at 44 per cent, followed by Italy at 42 per cent and Romania at 40 per cent.
(n=747)TOTAL
JAPAN(n=59)
BELGIUM(n=85)
DENMARK(n=168)
IRELAND(n=89)
ITALY(n=71)
PORTUGAL(n=61)
ROMANIA(n=149)
UK(n=65)
0 persons 1-2 persons 3-4 persons 5-10 persons More than 11 persons
69.6% 17.5%
5.2% 3.7%
3.9%
6.8%
10.2%
11.9%71.2%
2.9% 0.9%
9.9%14.9%71.4%
1.7% 4.8%
5.0%18.1%70.4%
7.6%89.6%
0.8%
1.0%
1.0%
21.0%57.7% 3.8%
11.1% 6.4%
34.8%55.7%
6.0%
1.9%
1.6%
21.6%60.1%
8.1% 3.4%
4.7%
9.4%85.0%
4.4%
1.2%
21
CHILDREN’S USE OF MOBILE PHONES – A SPECIAL REPORT 2014
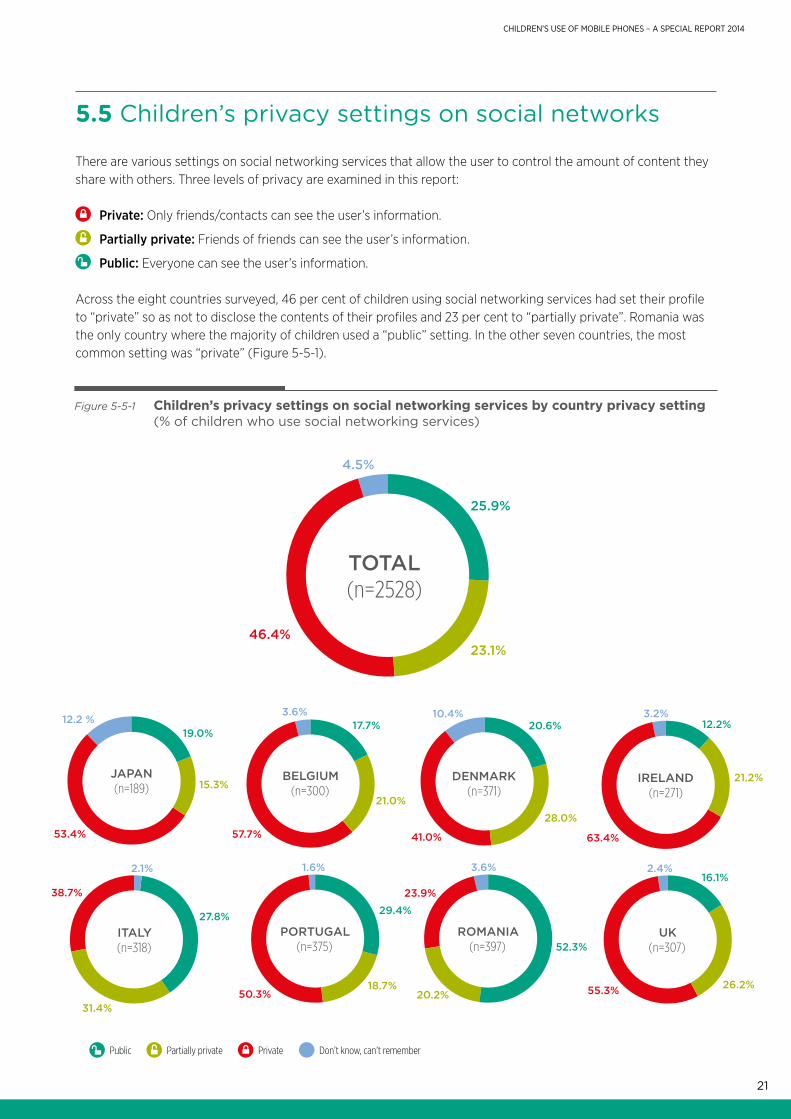
Figure 5-5-1 Children’s privacy settings on social networking services by country privacy setting (% of children who use social networking services)
5.5 Children’s privacy settings on social networks
There are various settings on social networking services that allow the user to control the amount of content they share with others. Three levels of privacy are examined in this report:
Private: Only friends/contacts can see the user’s information.
Partially private: Friends of friends can see the user’s information.
Public: Everyone can see the user’s information.
Across the eight countries surveyed, 46 per cent of children using social networking services had set their profile to “private” so as not to disclose the contents of their profiles and 23 per cent to “partially private”. Romania was the only country where the majority of children used a “public” setting. In the other seven countries, the most common setting was “private” (Figure 5-5-1).
12.2 %19.0%
15.3%
53.4%
JAPAN(n=189)
3.6%17.7%
21.0%
57.7%
BELGIUM(n=300)
DENMARK(n=371)
10.4%20.6%
28.0%
41.0%
IRELAND(n=271)
12.2%
21.2%
63.4%
3.2%
ITALY(n=318)
27.8%
38.7%
31.4%
2.1%
PORTUGAL(n=375)
29.4%
18.7%50.3%
1.6%
ROMANIA(n=397)
20.2%
23.9%
3.6%
52.3%UK
(n=307)
16.1%
26.2%55.3%
2.4%
Don’t know, can’t rememberPublic Partially private Private
4.5%
25.9%
46.4%23.1%
TOTAL(n=2528)
22
CHILDREN’S USE OF MOBILE PHONES – A SPECIAL REPORT 2014
25.9%
23.1%
46.4%
4.6%
TOTAL(N=2528)
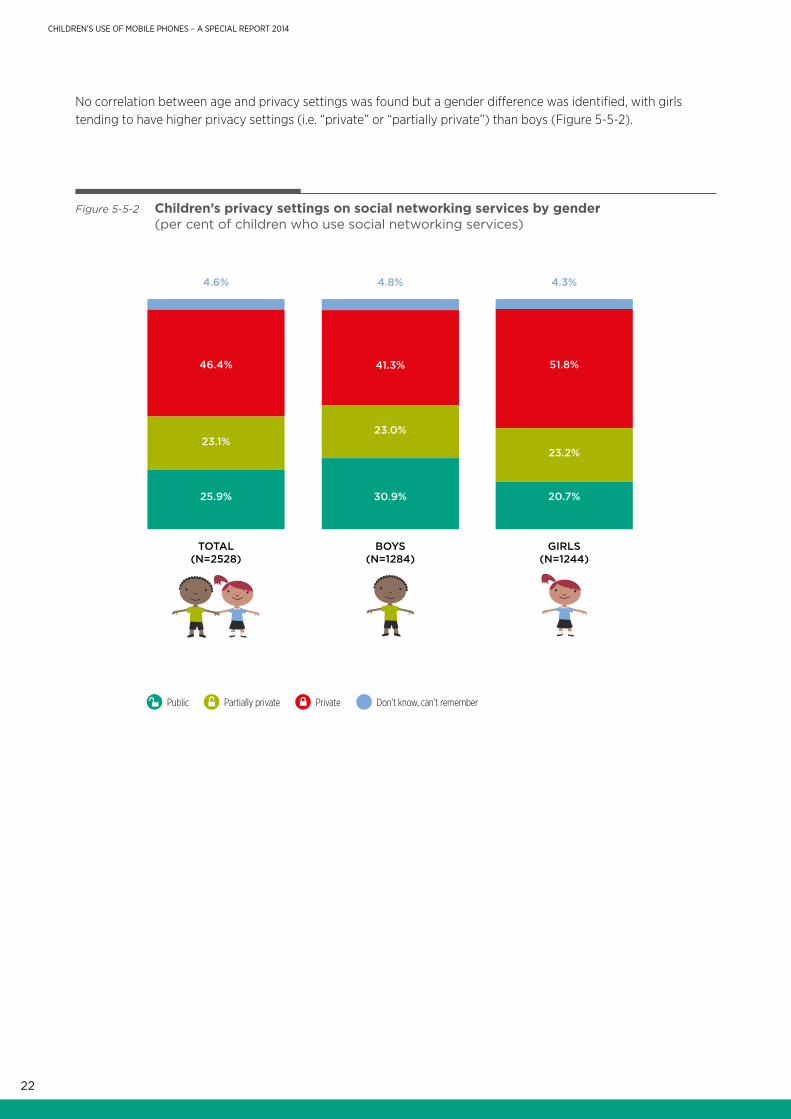
Figure 5-5-2 Children’s privacy settings on social networking services by gender (per cent of children who use social networking services)
30.9%
23.0%
41.3%
4.8%
BOYS(N=1284)
20.7%
23.2%
51.8%
4.3%
GIRLS(N=1244)
No correlation between age and privacy settings was found but a gender difference was identified, with girls tending to have higher privacy settings (i.e. “private” or “partially private”) than boys (Figure 5-5-2).
Don’t know, can’t rememberPublic Partially private Private
CHILDREN’S USE OF MOBILE PHONES – A SPECIAL REPORT 2014
23
MOBILE PHONES AND CHILDREN’S WELLBEING
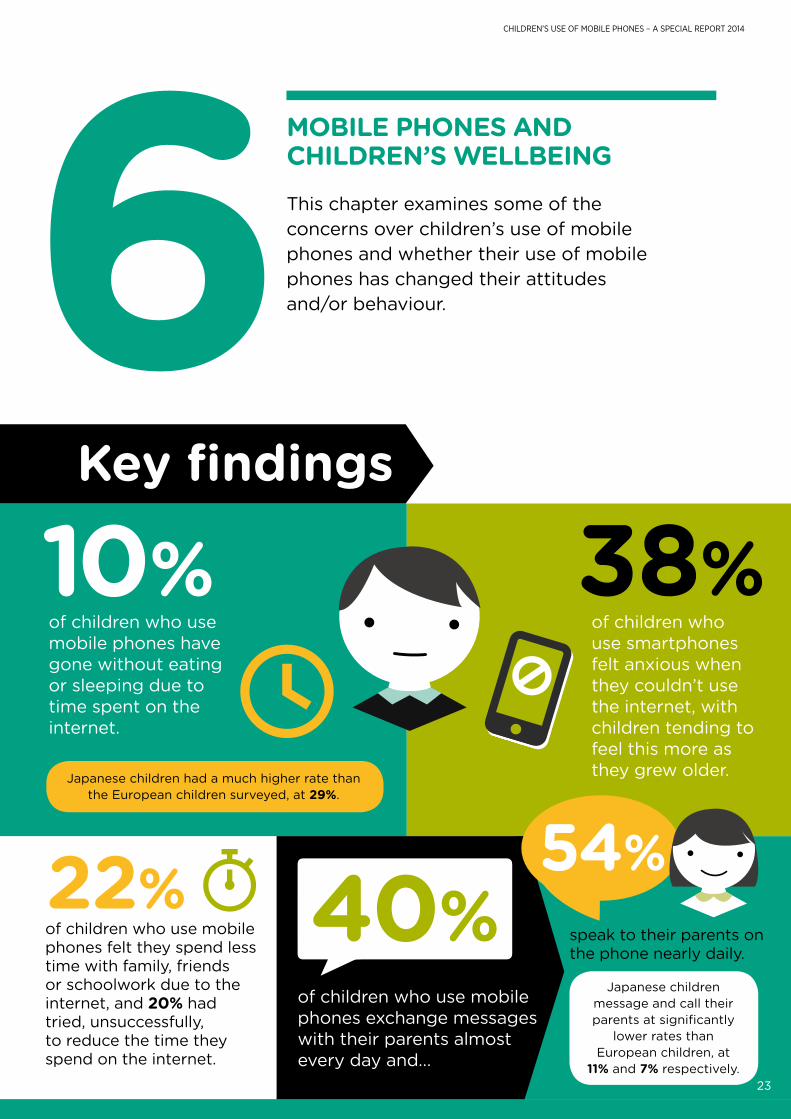
This chapter examines some of the concerns over children’s use of mobile phones and whether their use of mobile phones has changed their attitudes and/or behaviour.
10%
22%of children who use mobile phones exchange messages with their parents almost every day and…
speak to their parents on the phone nearly daily.
of children who use mobile phones have gone without eating or sleeping due to time spent on the internet.
of children who use mobile phones felt they spend less time with family, friends or schoolwork due to the internet, and 20% had tried, unsuccessfully,to reduce the time they spend on the internet.
38% of children who use smartphones felt anxious when they couldn’t use the internet, with children tending to feel this more as they grew older.
Key findings
Japanese children had a much higher rate than the European children surveyed, at 29%.
40%Japanese children
message and call their parents at significantly
lower rates than European children, at
11% and 7% respectively.
54%
24
CHILDREN’S USE OF MOBILE PHONES – A SPECIAL REPORT 2014
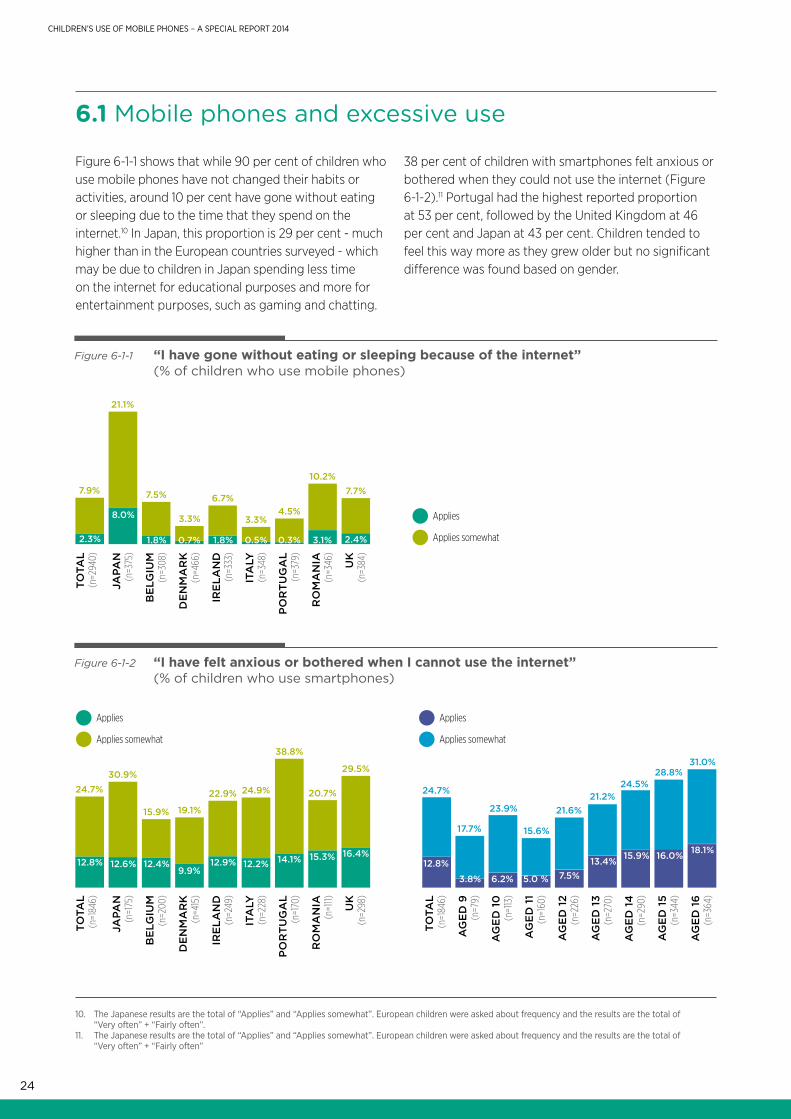
6.1 Mobile phones and excessive use
Figure 6-1-1 shows that while 90 per cent of children who use mobile phones have not changed their habits or activities, around 10 per cent have gone without eating or sleeping due to the time that they spend on the internet.10 In Japan, this proportion is 29 per cent - much higher than in the European countries surveyed - which may be due to children in Japan spending less time on the internet for educational purposes and more for entertainment purposes, such as gaming and chatting.
38 per cent of children with smartphones felt anxious or bothered when they could not use the internet (Figure 6-1-2).11 Portugal had the highest reported proportion at 53 per cent, followed by the United Kingdom at 46 per cent and Japan at 43 per cent. Children tended to feel this way more as they grew older but no significant difference was found based on gender.
10. The Japanese results are the total of “Applies” and “Applies somewhat”. European children were asked about frequency and the results are the total of “Very often” + “Fairly often”.
11. The Japanese results are the total of “Applies” and “Applies somewhat”. European children were asked about frequency and the results are the total of “Very often” + “Fairly often”
Figure 6-1-2 “I have felt anxious or bothered when I cannot use the internet” (% of children who use smartphones)
TOTA
L(n
=184
6)
TOTA
L(n
=184
6)
JAPA
N(n
=175
)
AG
ED
9(n
=79)
BE
LGIU
M(n
=200
)
AG
ED
10
(n=1
13)
DE
NM
AR
K(n
=415
)
AG
ED
11
(n=1
60)
IRE
LAN
D(n
=249
)
AG
ED
12
(n=2
26)
ITA
LY(n
=228
)
AG
ED
13
(n=2
70)
PO
RT
UG
AL
(n=1
70)
AG
ED
14
(n=2
90)
RO
MA
NIA
(n=1
11)
AG
ED
15
(n=3
44)
UK
(n=2
98)
AG
ED
16
(n=3
64)
Applies
Applies somewhat
Applies
Applies somewhat
12.8% 12.8%
3.8% 6.2% 5.0 % 7.5%13.4% 15.9% 16.0% 18.1%
12.6% 12.4%9.9%
12.9% 12.2% 14.1% 15.3% 16.4%
24.7% 24.7%
17.7%
23.9%
15.6%
21.6%21.2%
24.5%28.8%
31.0%30.9%
15.9% 19.1%
22.9% 24.9%
38.8%
20.7%
29.5%
Figure 6-1-1 “I have gone without eating or sleeping because of the internet” (% of children who use mobile phones)
TOTA
L(n
=294
0)
JAPA
N(n
=375
)
BE
LGIU
M(n
=308
)
DE
NM
AR
K(n
=466
)
IRE
LAN
D(n
=333
)
ITA
LY(n
=348
)
PO
RT
UG
AL
(n=3
79)
RO
MA
NIA
(n=3
46)
UK
(n=3
84)
Applies
Applies somewhat2.3%
8.0%
1.8% 0.7% 1.8% 3.1% 2.4%
7.9%
21.1%
7.5%
3.3%
6.7%
3.3%4.5%
10.2%7.7%
0.5% 0.3%
25
CHILDREN’S USE OF MOBILE PHONES – A SPECIAL REPORT 2014
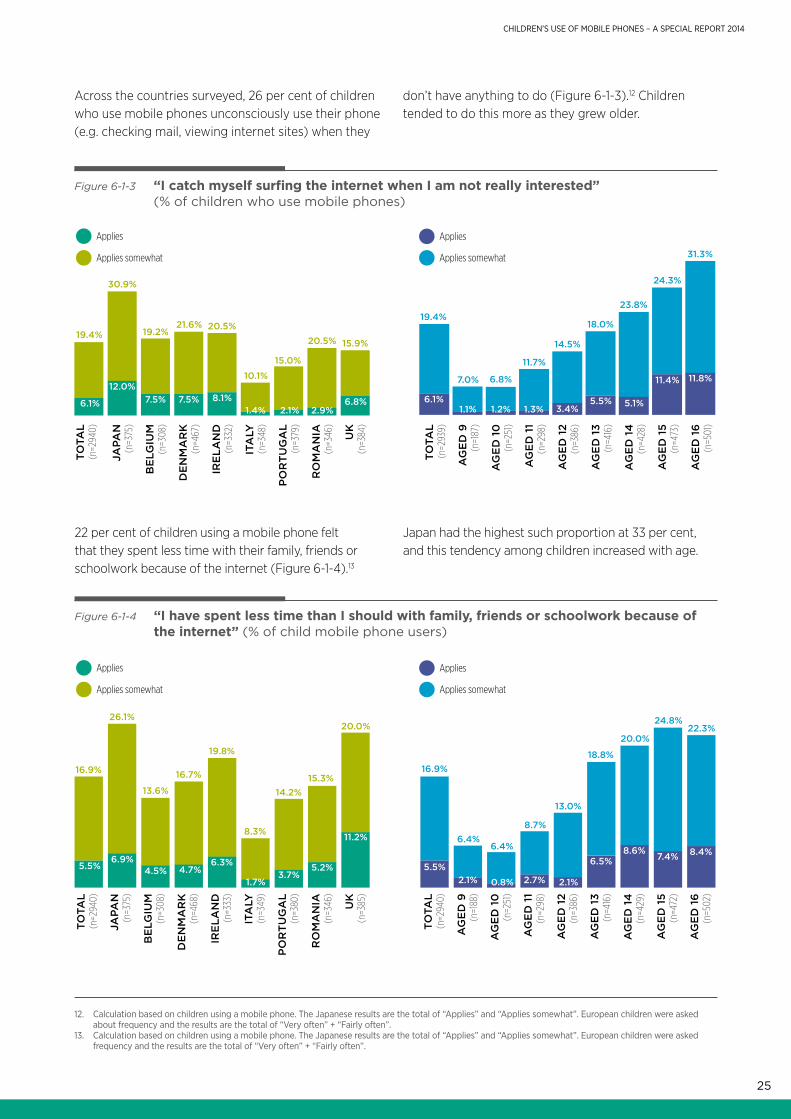
Across the countries surveyed, 26 per cent of children who use mobile phones unconsciously use their phone (e.g. checking mail, viewing internet sites) when they
don’t have anything to do (Figure 6-1-3).12 Children tended to do this more as they grew older.
Figure 6-1-3 “I catch myself surfing the internet when I am not really interested” (% of children who use mobile phones)
Applies
Applies somewhat
Applies
Applies somewhat
(n=2
98)
AG
ED
12
(n=3
86)
TOTA
L(n
=294
0)
JAPA
N(n
=375
)
BE
LGIU
M(n
=308
)
DE
NM
AR
K(n
=467
)
IRE
LAN
D(n
=332
)
ITA
LY(n
=348
)
PO
RT
UG
AL
(n=3
79)
RO
MA
NIA
(n=3
46)
UK
(n=3
84)
6.1%
12.0%7.5% 7.5% 8.1%
1.4% 2.1% 2.9%6.8%
19.4%
30.9%
19.2%21.6% 20.5%
10.1%
15.0%
20.5% 15.9%
TOTA
L(n
=293
9)
AG
ED
9(n
=187
)
AG
ED
10
(n=2
51)
AG
ED
11
AG
ED
13
(n=4
16)
AG
ED
14
(n=4
28)
AG
ED
15
(n=4
73)
AG
ED
16
(n=5
01)
6.1%1.1% 1.2% 1.3% 3.4%
5.5% 5.1%
11.4% 11.8%
19.4%
7.0% 6.8%
11.7%
14.5%
18.0%
23.8%
24.3%
31.3%
22 per cent of children using a mobile phone felt that they spent less time with their family, friends or schoolwork because of the internet (Figure 6-1-4).13
Japan had the highest such proportion at 33 per cent, and this tendency among children increased with age.
Figure 6-1-4 “I have spent less time than I should with family, friends or schoolwork because of the internet” (% of child mobile phone users)
TOTA
L(n
=294
0)
JAPA
N(n
=375
)
BE
LGIU
M(n
=308
)
DE
NM
AR
K(n
=468
)
IRE
LAN
D(n
=333
)
ITA
LY(n
=349
)
PO
RT
UG
AL
(n=3
80)
RO
MA
NIA
(n=3
46)
UK
(n=3
85)
5.5%6.9%
4.5% 4.7%6.3%
1.7%3.7%
5.2%
11.2%
16.9%
26.1%
13.6%
16.7%
19.8%
8.3%
14.2%15.3%
20.0%
TOTA
L(n
=294
0)
AG
ED
9(n
=188
)
AG
ED
10
(n=2
51)
AG
ED
11
(n=2
98)
AG
ED
12
(n=3
86)
AG
ED
13
(n=4
16)
AG
ED
14
(n=4
29)
AG
ED
15
(n=4
72)
AG
ED
16
(n=5
02)
5.5%2.1% 0.8% 2.7% 2.1%
6.5%8.6%
7.4% 8.4%
16.9%
6.4%6.4%
8.7%
13.0%
18.8%
20.0%
24.8%22.3%
Applies
Applies somewhat
Applies
Applies somewhat
12. Calculation based on children using a mobile phone. The Japanese results are the total of “Applies” and “Applies somewhat”. European children were asked about frequency and the results are the total of “Very often” + “Fairly often”.
13. Calculation based on children using a mobile phone. The Japanese results are the total of “Applies” and “Applies somewhat”. European children were asked frequency and the results are the total of “Very often” + “Fairly often”.
26
CHILDREN’S USE OF MOBILE PHONES – A SPECIAL REPORT 2014
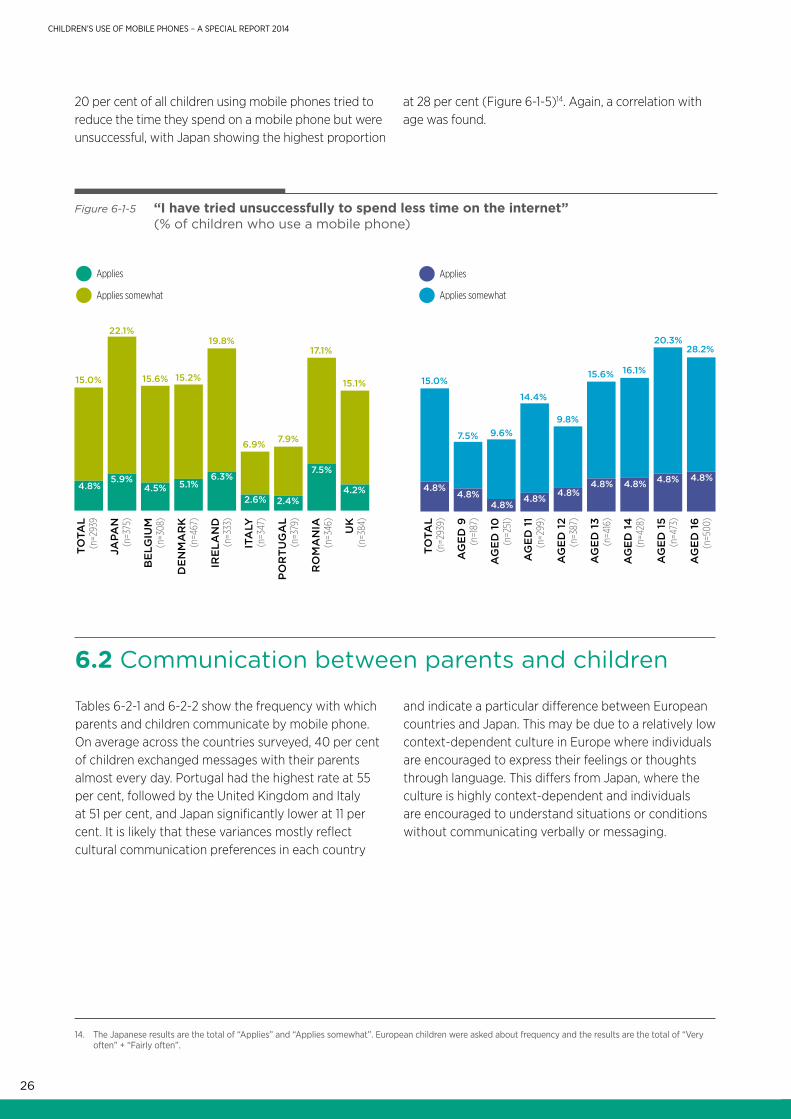
20 per cent of all children using mobile phones tried to reduce the time they spend on a mobile phone but were unsuccessful, with Japan showing the highest proportion
at 28 per cent (Figure 6-1-5)14. Again, a correlation with age was found.
14. The Japanese results are the total of “Applies” and “Applies somewhat”. European children were asked about frequency and the results are the total of “Very often” + “Fairly often”.
Figure 6-1-5 “I have tried unsuccessfully to spend less time on the internet” (% of children who use a mobile phone)
Applies
Applies somewhat
Applies
Applies somewhat
TOTA
L(n
=293
9
JAPA
N(n
=375
)
BE
LGIU
M(n
=308
)
DE
NM
AR
K(n
=467
)
IRE
LAN
D(n
=333
)
ITA
LY(n
=347
)
PO
RT
UG
AL
(n=3
79)
RO
MA
NIA
(n=3
46)
UK
(n=3
84)
4.8%5.9%
4.5% 5.1%6.3%
2.6% 2.4%
7.5%
4.2%
15.0%
22.1%
15.6% 15.2%
19.8%
6.9% 7.9%
17.1%
15.1%
TOTA
L(n
=293
9)
AG
ED
9(n
=187
)
AG
ED
10
(n=2
51)
AG
ED
11
(n=2
99)
AG
ED
12
(n=3
87)
AG
ED
13
(n=4
16)
AG
ED
14
(n=4
28)
AG
ED
15
(n=4
73)
AG
ED
16
(n=5
00)
4.8%4.8%
4.8%4.8%
4.8%4.8% 4.8% 4.8% 4.8%
15.0%
7.5% 9.6%
14.4%
9.8%
15.6% 16.1%
20.3%28.2%
6.2 Communication between parents and children
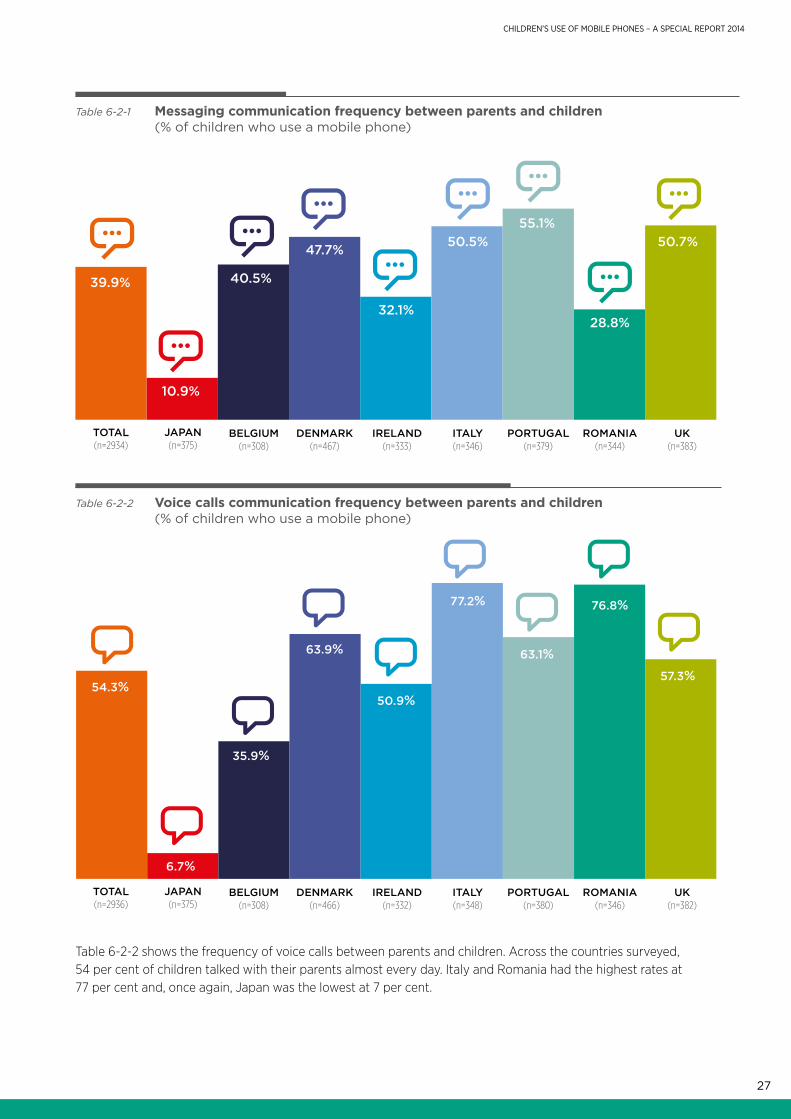
Tables 6-2-1 and 6-2-2 show the frequency with which parents and children communicate by mobile phone.On average across the countries surveyed, 40 per cent of children exchanged messages with their parents almost every day. Portugal had the highest rate at 55 per cent, followed by the United Kingdom and Italy at 51 per cent, and Japan significantly lower at 11 per cent. It is likely that these variances mostly reflect cultural communication preferences in each country
and indicate a particular difference between European countries and Japan. This may be due to a relatively low context-dependent culture in Europe where individuals are encouraged to express their feelings or thoughts through language. This differs from Japan, where the culture is highly context-dependent and individuals are encouraged to understand situations or conditions without communicating verbally or messaging.
27
CHILDREN’S USE OF MOBILE PHONES – A SPECIAL REPORT 2014
Table 6-2-1 Messaging communication frequency between parents and children (% of children who use a mobile phone)
Table 6-2-2 Voice calls communication frequency between parents and children (% of children who use a mobile phone)
Table 6-2-2 shows the frequency of voice calls between parents and children. Across the countries surveyed, 54 per cent of children talked with their parents almost every day. Italy and Romania had the highest rates at 77 per cent and, once again, Japan was the lowest at 7 per cent.
54.3%
6.7%
35.9%
63.9%
50.9%
77.2%
63.1%
76.8%
57.3%
39.9%
10.9%
40.5%
47.7%
32.1%
50.5%55.1%
28.8%
50.7%
JAPAN(n=375)
BELGIUM(n=308)
DENMARK(n=467)
IRELAND(n=333)
ITALY(n=346)
PORTUGAL(n=379)
ROMANIA(n=344)
UK(n=383)
TOTAL(n=2934)
JAPAN(n=375)
BELGIUM(n=308)
DENMARK(n=466)
IRELAND(n=332)
ITALY(n=348)
PORTUGAL(n=380)
ROMANIA(n=346)
UK(n=382)
TOTAL(n=2936)
28
CHILDREN’S USE OF MOBILE PHONES – A SPECIAL REPORT 2014
DIGITAL LITERACY, SKILLS AND PARENTAL CONTROLS
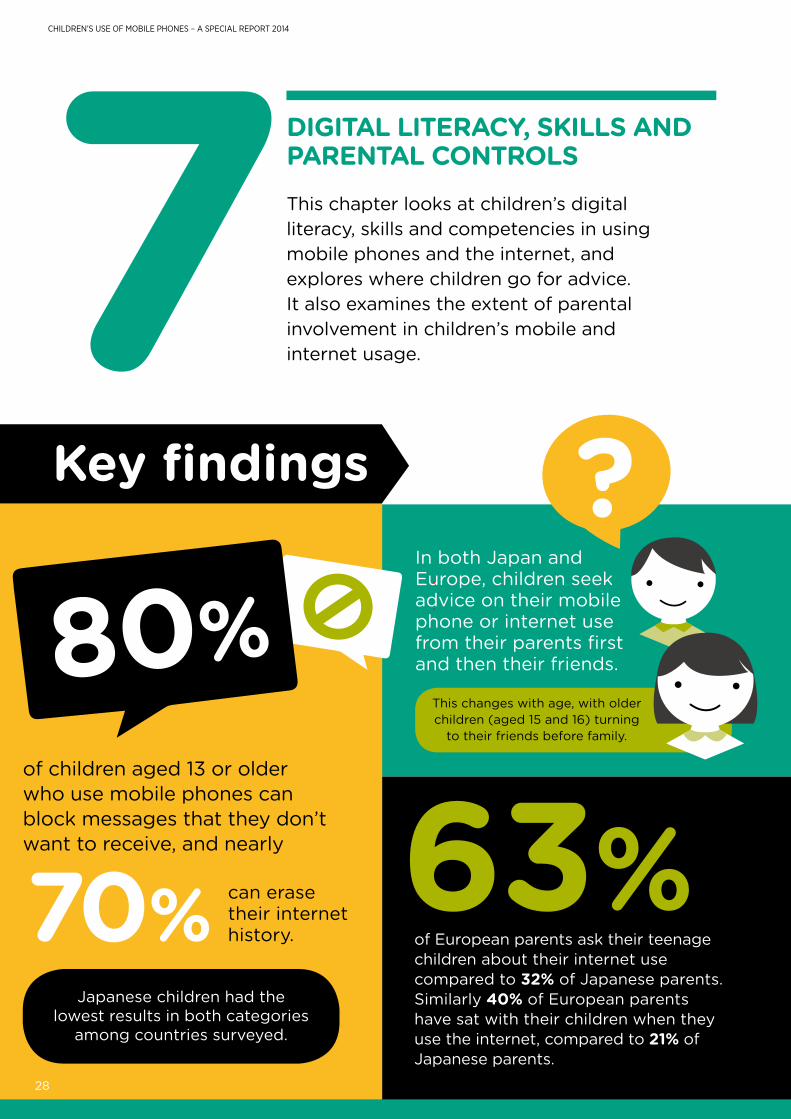
This chapter looks at children’s digital literacy, skills and competencies in using mobile phones and the internet, and explores where children go for advice. It also examines the extent of parental involvement in children’s mobile and internet usage.
Key findings
63%of European parents ask their teenage children about their internet use compared to 32% of Japanese parents. Similarly 40% of European parents have sat with their children when they use the internet, compared to 21% of Japanese parents.
In both Japan and Europe, children seek advice on their mobile phone or internet use from their parents first and then their friends.
of children aged 13 or older who use mobile phones can block messages that they don’t want to receive, and nearly
can erase their internet history.
80%
70%Japanese children had the
lowest results in both categories among countries surveyed.
This changes with age, with older children (aged 15 and 16) turning
to their friends before family.
28
29
CHILDREN’S USE OF MOBILE PHONES – A SPECIAL REPORT 2014
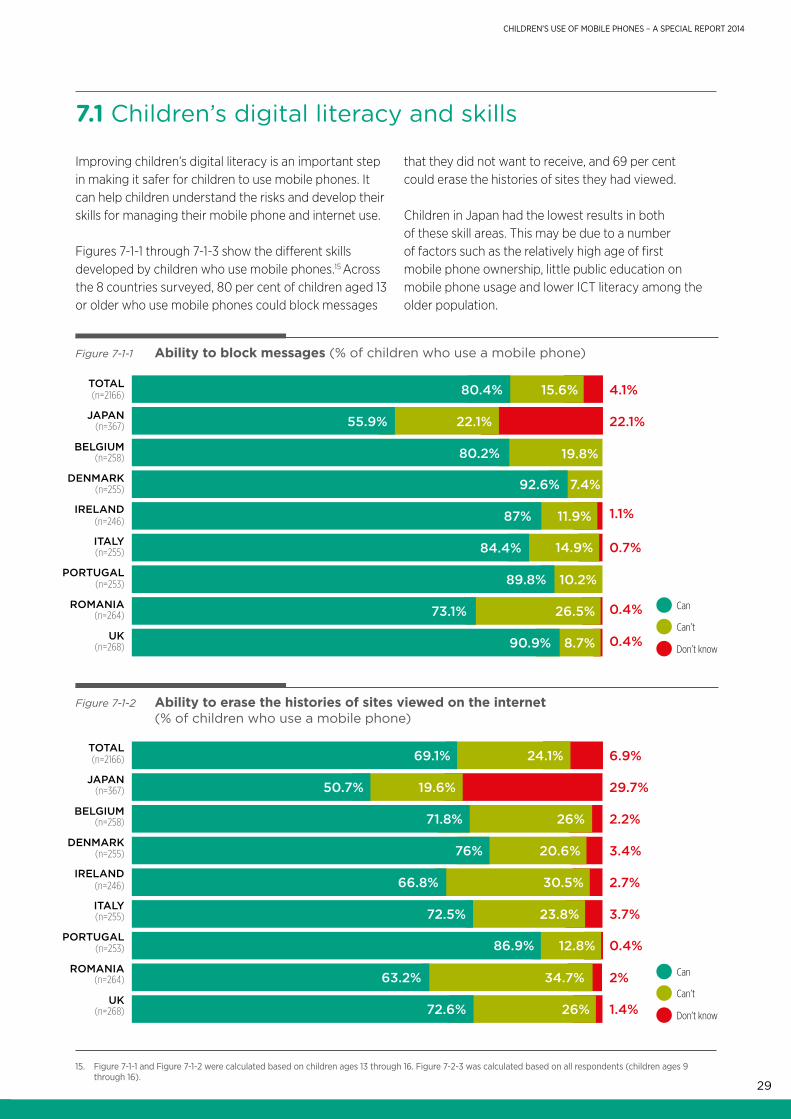
7.1 Children’s digital literacy and skills
Improving children’s digital literacy is an important step in making it safer for children to use mobile phones. It can help children understand the risks and develop their skills for managing their mobile phone and internet use.
Figures 7-1-1 through 7-1-3 show the different skills developed by children who use mobile phones.15 Across the 8 countries surveyed, 80 per cent of children aged 13 or older who use mobile phones could block messages
that they did not want to receive, and 69 per cent could erase the histories of sites they had viewed.
Children in Japan had the lowest results in both of these skill areas. This may be due to a number of factors such as the relatively high age of first mobile phone ownership, little public education on mobile phone usage and lower ICT literacy among the older population.
15. Figure 7-1-1 and Figure 7-1-2 were calculated based on children ages 13 through 16. Figure 7-2-3 was calculated based on all respondents (children ages 9 through 16).
Figure 7-1-1 Ability to block messages (% of children who use a mobile phone)
Figure 7-1-2 Ability to erase the histories of sites viewed on the internet (% of children who use a mobile phone)
80.4% 15.6% 4.1%
22.1%
1.1%
0.7%
0.4%
0.4%
22.1%
19.8%
7.4%
11.9%
14.9%
10.2%
26.5%
8.7%
55.9%
80.2%
92.6%
87%
84.4%
89.8%
73.1%
90.9%
(n=2166)TOTAL
JAPAN(n=367)
BELGIUM(n=258)
DENMARK(n=255)
IRELAND(n=246)
ITALY(n=255)
PORTUGAL(n=253)
ROMANIA(n=264)
UK(n=268)
6.9%
29.7%
2.2%
3.4%
2.7%
3.7%
0.4%
2%
1.4%
(n=2166)TOTAL
JAPAN(n=367)
BELGIUM(n=258)
DENMARK(n=255)
IRELAND(n=246)
ITALY(n=255)
PORTUGAL(n=253)
ROMANIA(n=264)
UK(n=268)
69.1% 24.1%
19.6%
26%
20.6%
30.5%
23.8%
12.8%
34.7%
26%
50.7%
71.8%
76%
66.8%
72.5%
86.9%
63.2%
72.6%
Can
Can’t
Don’t know
Can
Can’t
Don’t know
30
CHILDREN’S USE OF MOBILE PHONES – A SPECIAL REPORT 2014
7.2 Sources of advice for children
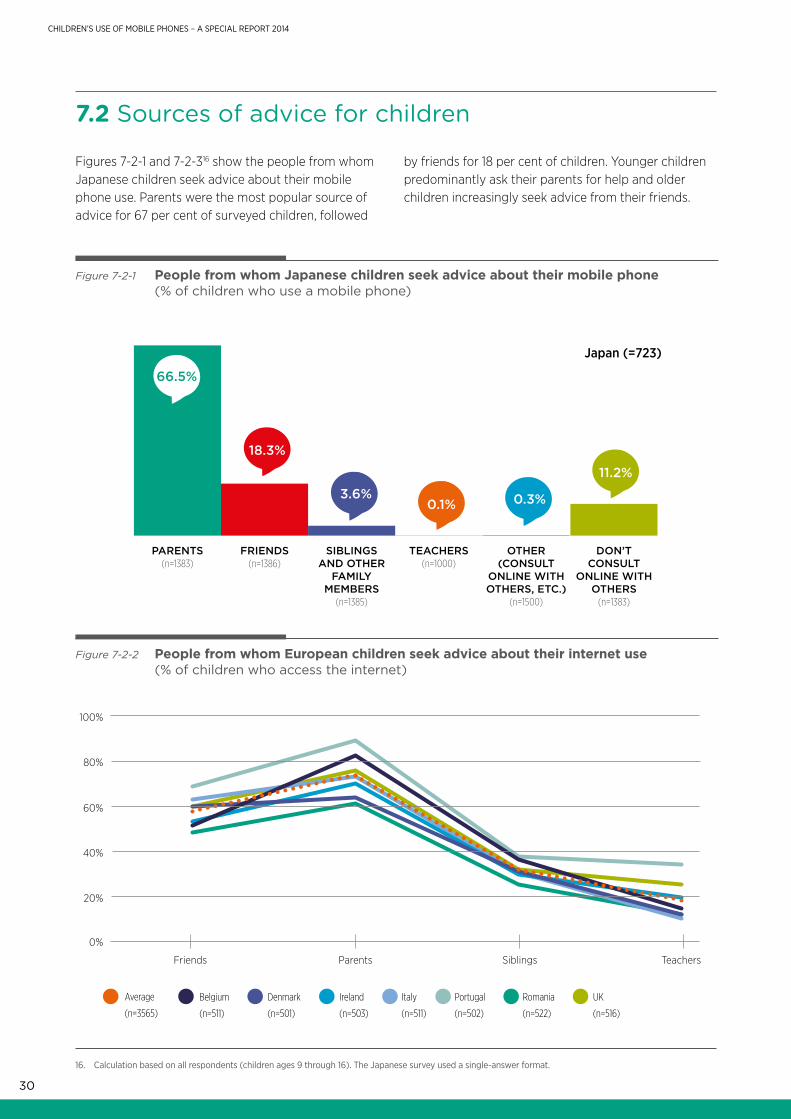
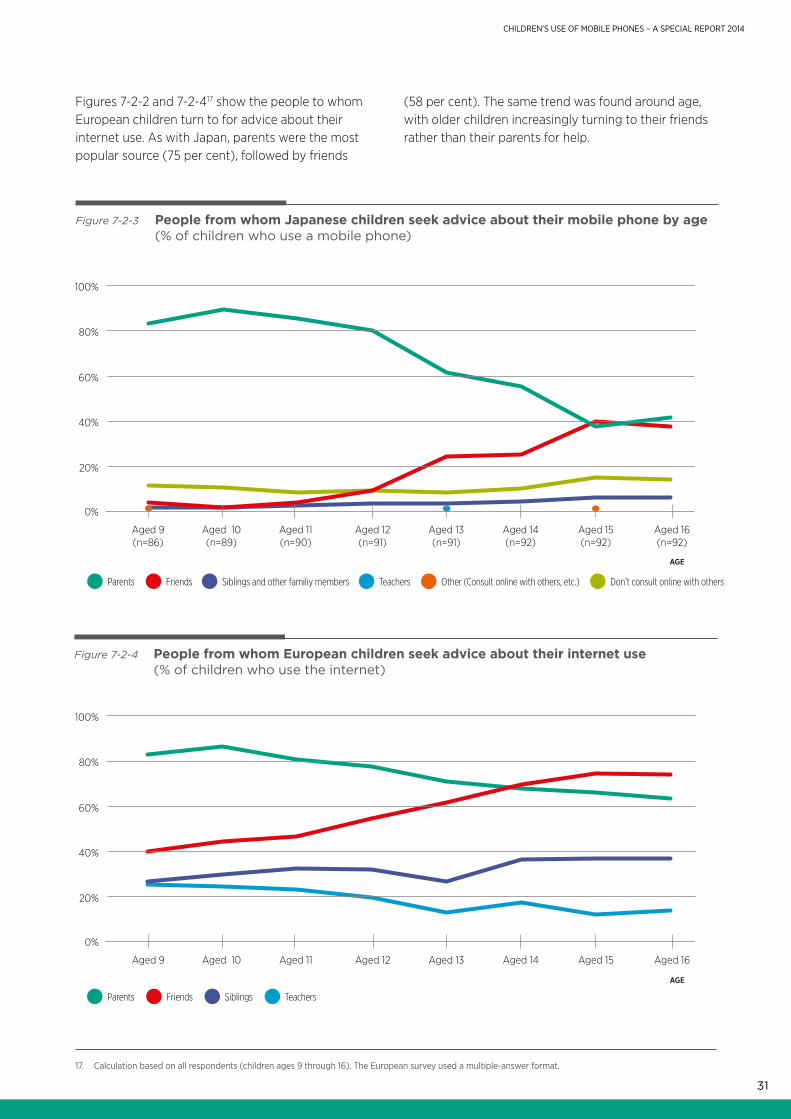
Figures 7-2-1 and 7-2-316 show the people from whom Japanese children seek advice about their mobile phone use. Parents were the most popular source of advice for 67 per cent of surveyed children, followed
by friends for 18 per cent of children. Younger children predominantly ask their parents for help and older children increasingly seek advice from their friends.
16. Calculation based on all respondents (children ages 9 through 16). The Japanese survey used a single-answer format.
Figure 7-2-1 People from whom Japanese children seek advice about their mobile phone (% of children who use a mobile phone)
PARENTS(n=1383)
FRIENDS(n=1386)
SIBLINGS AND OTHER
FAMILY MEMBERS
(n=1385)
OTHER (CONSULT
ONLINE WITH OTHERS, ETC.)
(n=1500)
DON’T CONSULT
ONLINE WITH OTHERS
(n=1383)
TEACHERS(n=1000)
Figure 7-2-2 People from whom European children seek advice about their internet use (% of children who access the internet)
Average
(n=3565)
Belgium
(n=511)
Denmark
(n=501)
Ireland
(n=503)
Italy
(n=511)
Portugal
(n=502)
Romania
(n=522)
UK
(n=516)
Teachers
100%
80%
60%
40%
20%
0%
Friends Parents Siblings
11.2%
0.3%0.1%3.6%
18.3%
66.5%
Japan (=723)
31
CHILDREN’S USE OF MOBILE PHONES – A SPECIAL REPORT 2014
Figures 7-2-2 and 7-2-417 show the people to whom European children turn to for advice about their internet use. As with Japan, parents were the most popular source (75 per cent), followed by friends
(58 per cent). The same trend was found around age, with older children increasingly turning to their friends rather than their parents for help.
Figure 7-2-4 People from whom European children seek advice about their internet use (% of children who use the internet)
17. Calculation based on all respondents (children ages 9 through 16). The European survey used a multiple-answer format.
Parents Friends Siblings Teachers
Figure 7-2-3 People from whom Japanese children seek advice about their mobile phone by age (% of children who use a mobile phone)
AGE
100%
80%
60%
40%
20%
0%
Aged 9(n=86)
Aged 16(n=92)
Aged 10(n=89)
Aged 11(n=90)
Aged 12(n=91)
Aged 13(n=91)
Aged 14(n=92)
Aged 15(n=92)
Parents Friends Siblings and other familiy members Teachers Don’t consult online with othersOther (Consult online with others, etc.)
Aged 16
AGE
100%
80%
60%
40%
20%
0%
Aged 9 Aged 10 Aged 11 Aged 12 Aged 13 Aged 14 Aged 15
32
CHILDREN’S USE OF MOBILE PHONES – A SPECIAL REPORT 2014
7.3 Children’s internet use and parental involvement
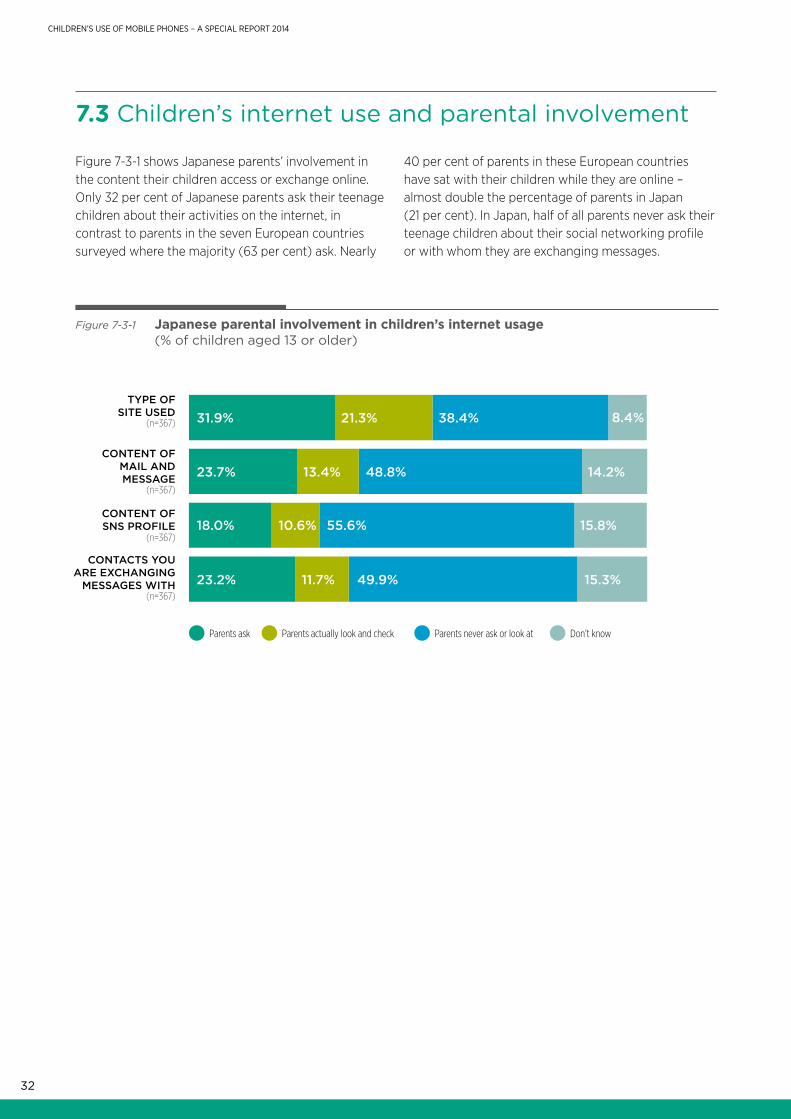
Figure 7-3-1 shows Japanese parents’ involvement in the content their children access or exchange online. Only 32 per cent of Japanese parents ask their teenage children about their activities on the internet, in contrast to parents in the seven European countries surveyed where the majority (63 per cent) ask. Nearly
40 per cent of parents in these European countries have sat with their children while they are online – almost double the percentage of parents in Japan (21 per cent). In Japan, half of all parents never ask their teenage children about their social networking profile or with whom they are exchanging messages.
Figure 7-3-1 Japanese parental involvement in children’s internet usage (% of children aged 13 or older)
31.9%
23.7%
18.0%
23.2% 11.7% 49.9% 15.3%
10.6% 55.6% 15.8%
13.4% 48.8% 14.2%
21.3% 38.4% 8.4%(n=367)
TYPE OF SITE USED
(n=367)
CONTENT OF MAIL AND MESSAGE
(n=367)
CONTACTS YOU ARE EXCHANGING
MESSAGES WITH
(n=367)
CONTENT OF SNS PROFILE
Parents ask Parents actually look and check Parents never ask or look at Don’t know
33
CHILDREN’S USE OF MOBILE PHONES – A SPECIAL REPORT 2014
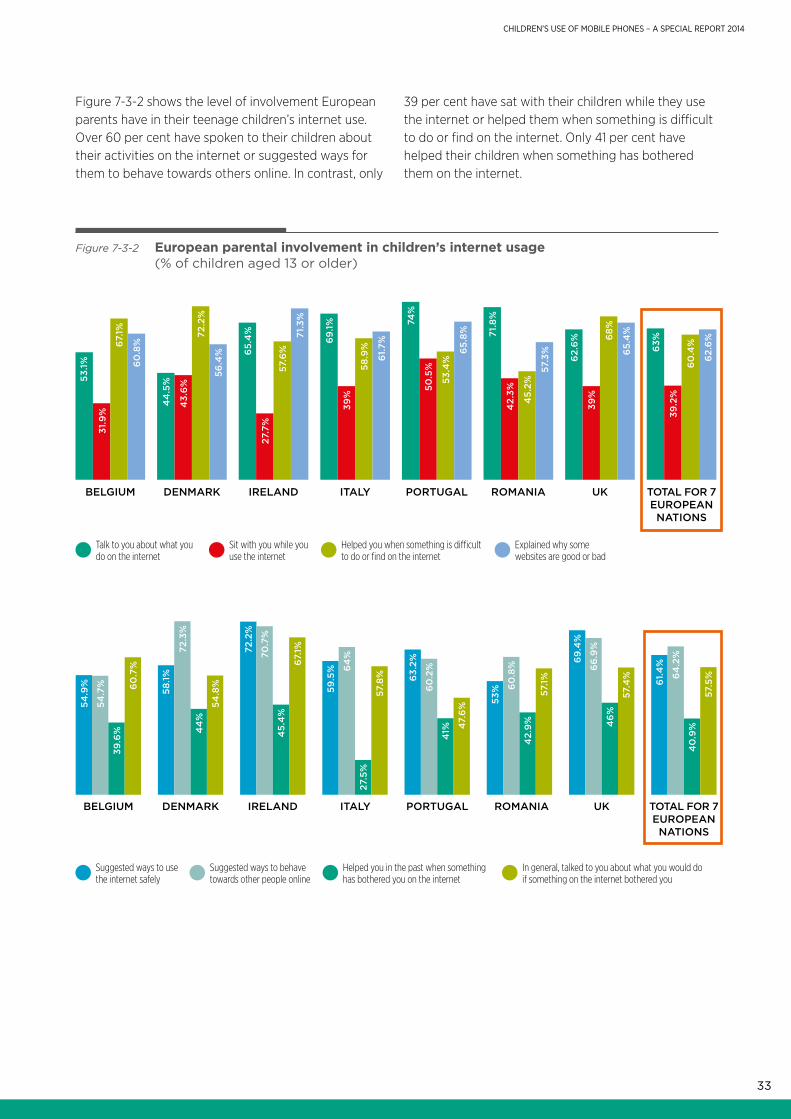
Figure 7-3-2 shows the level of involvement European parents have in their teenage children’s internet use. Over 60 per cent have spoken to their children about their activities on the internet or suggested ways for them to behave towards others online. In contrast, only
39 per cent have sat with their children while they use the internet or helped them when something is difficult to do or find on the internet. Only 41 per cent have helped their children when something has bothered them on the internet.
Figure 7-3-2 European parental involvement in children’s internet usage (% of children aged 13 or older)
Talk to you about what you do on the internet
Sit with you while you use the internet
Explained why some websites are good or bad
Helped you when something is difficult to do or find on the internet
BELGIUM DENMARK IRELAND ITALY PORTUGAL ROMANIA UK TOTAL FOR 7 EUROPEAN NATIONS
44
.5%
43.
6%
72.2
%
56.4
%
53.1%
31.9
%
67.1%
60
.8%
65.
4%
27.7
%
57.6
%
71.3
%
69
.1%
39%
58.9
%
61.
7%
74%
50.5
%
53.4
%
65.
8% 71.8
%
42.
3%
45.
2%
57.3
%
62.
6%
39%
68%
65.
4%
63%
39.2
%
60
.4%
62.
6%
Suggested ways to use the internet safely
Suggested ways to behave towards other people online
In general, talked to you about what you would do if something on the internet bothered you
Helped you in the past when something has bothered you on the internet
BELGIUM DENMARK IRELAND ITALY PORTUGAL ROMANIA UK TOTAL FOR 7 EUROPEAN NATIONS
54.9
%
54.7
%
39.6
%
60
.7%
58.1%
72.3
%
44
%
54.8
%
72.2
%
70.7
%
45.
4%
67.1%
59.5
% 64
%
27.5
%
57.8
% 63.
2%
60
.2%
41% 4
7.6
% 53% 6
0.8
%
42.
9%
57.1%
69
.4%
66
.9%
46
%
57.4
%
61.
4%
64
.2%
40
.9%
57.5
%

To download the PDF report please visit the GSMA website at www.gsma.com/myouth