Embed Size (px)
Citation preview
Children’s use of mobile phonesAn international comparison 2015
CHILDREN’S USE OF MOBILE PHONES – AN INTERNATIONAL COMPARISON 2015
Published in 2016 by the GSMA and the Mobile Society Research Institute within NTT DOCOMO, Inc. Japan.
With special thanks to Tigo, TRA Bahrain and Smart for providing the data for this report.
The GSMA represents the interests of mobile operators worldwide, uniting nearly 800 operators with almost 300 companies in the broader mobile ecosystem, including handset and device makers, software companies, equipment providers and Internet companies, as well as organisations in adjacent industry sectors. The GSMA also produces industry-leading events such as Mobile World Congress, Mobile World Congress Shanghai and the Mobile 360 Series conferences.
For more information, please visit the GSMA corporate website at www.gsma.com
Follow the GSMA on Twitter: @GSMA
NTT DOCOMO, Japan’s largest telecommunications company, provides innovative, convenient and secure mobile services that enable customers to realize smarter lives. The company serves over 68 million customers in Japan via advanced wireless networks, including a nationwide LTE network and one of the world’s most progressive LTE-Advanced networks. The Mobile Society Research Institute (MSRI) within NTT DOCOMO was established in 2004. The MSRI studies both positive and negative impacts of mobile ICT services on our society to realize smarter lives. Its activities and findings are disclosed to Japanese society through the Internet and the publications.
For more information, please visit www.moba-ken.jp
1
Contents1 INTRODUCTION 2
2 SUMMARY OF KEY FINDINGS 3
3 CHILDREN AND MOBILE PHONES: AN OVERVIEW 6
4 CHILDREN’S USE OF MOBILE PHONES AND THE INTERNET 11
5 MOBILE APPS 15
6 SOCIAL NETWORKING SERVICES (SNS) 21
7 PRIVACY 28
8 DIGITAL LITERACY, PARENTAL CONTROLS AND CHILDREN’S WELLBEING 32
CHILDREN’S USE OF MOBILE PHONES – AN INTERNATIONAL COMPARISON 2015
2
CHILDREN’S USE OF MOBILE PHONES – AN INTERNATIONAL COMPARISON 2015
1 INTRODUCTION
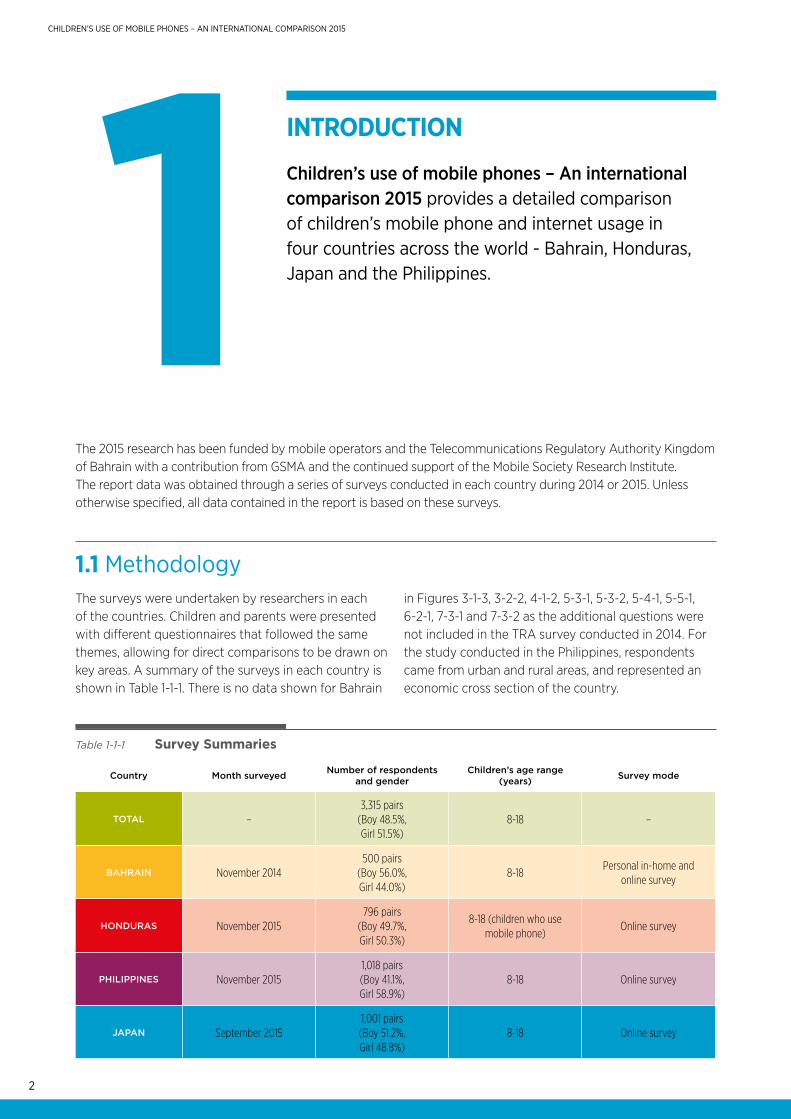
Children’s use of mobile phones – An international comparison 2015 provides a detailed comparison of children’s mobile phone and internet usage in four countries across the world - Bahrain, Honduras, Japan and the Philippines.
The 2015 research has been funded by mobile operators and the Telecommunications Regulatory Authority Kingdom of Bahrain with a contribution from GSMA and the continued support of the Mobile Society Research Institute. The report data was obtained through a series of surveys conducted in each country during 2014 or 2015. Unless otherwise specified, all data contained in the report is based on these surveys.
The surveys were undertaken by researchers in each of the countries. Children and parents were presented with different questionnaires that followed the same themes, allowing for direct comparisons to be drawn on key areas. A summary of the surveys in each country is shown in Table 1-1-1. There is no data shown for Bahrain
in Figures 3-1-3, 3-2-2, 4-1-2, 5-3-1, 5-3-2, 5-4-1, 5-5-1, 6-2-1, 7-3-1 and 7-3-2 as the additional questions were not included in the TRA survey conducted in 2014. For the study conducted in the Philippines, respondents came from urban and rural areas, and represented an economic cross section of the country.
1.1 Methodology
2Country Month surveyed Number of respondents
and genderChildren’s age range
(years) Survey mode
TOTAL –3,315 pairs
(Boy 48.5%, Girl 51.5%)
8-18 –
BAHRAIN November 2014500 pairs
(Boy 56.0%, Girl 44.0%)
8-18Personal in-home and
online survey
HONDURAS November 2015796 pairs
(Boy 49.7%, Girl 50.3%)
8-18 (children who use mobile phone)
Online survey
PHILIPPINES November 20151,018 pairs (Boy 41.1%, Girl 58.9%)
8-18 Online survey
JAPAN September 20151,001 pairs (Boy 51.2%, Girl 48.8%)
8-18 Online survey
Table 1-1-1 Survey Summaries
3
CHILDREN’S USE OF MOBILE PHONES – AN INTERNATIONAL COMPARISON 2015
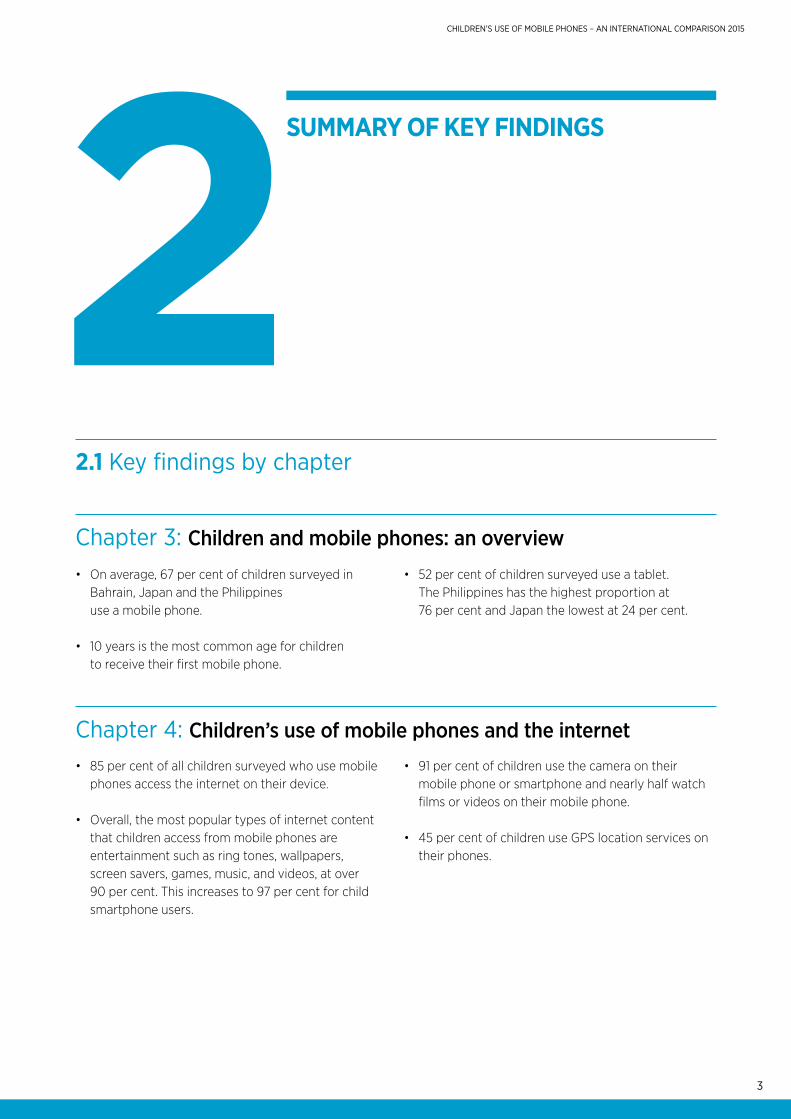
Chapter 3: Children and mobile phones: an overview
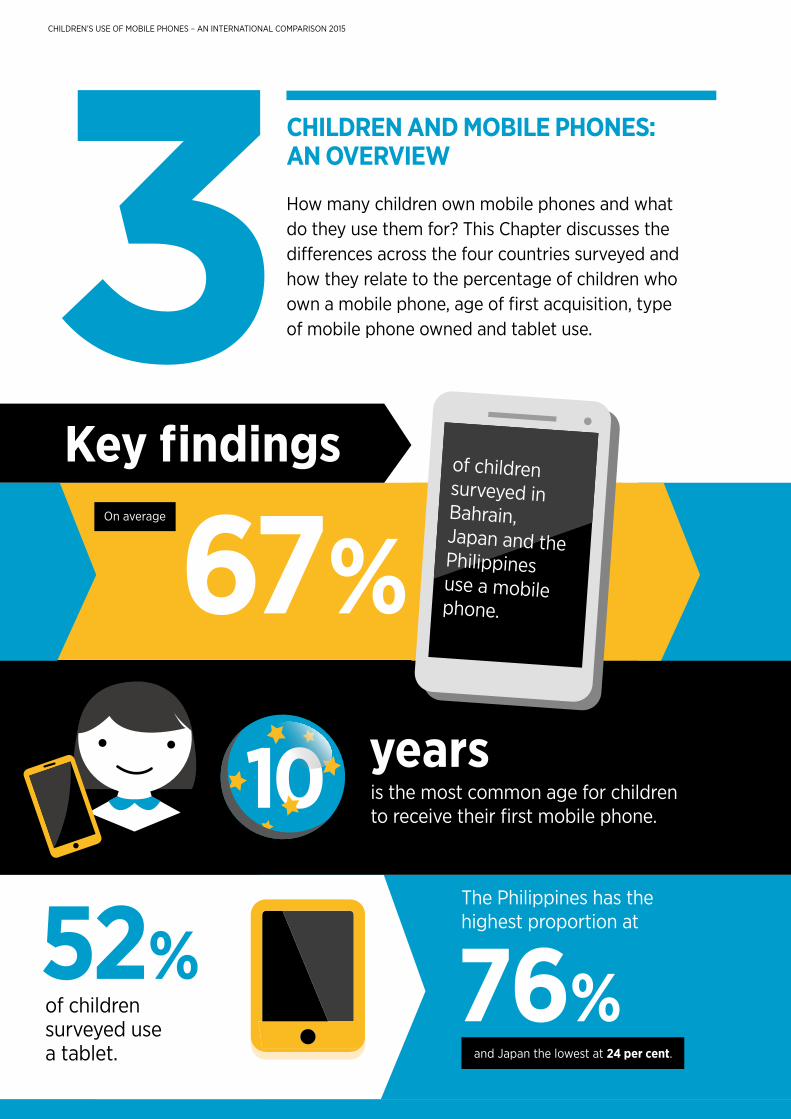
• On average, 67 per cent of children surveyed in Bahrain, Japan and the Philippines use a mobile phone.
• 10 years is the most common age for children to receive their first mobile phone.
• 52 per cent of children surveyed use a tablet. The Philippines has the highest proportion at 76 per cent and Japan the lowest at 24 per cent.
Chapter 4: Children’s use of mobile phones and the internet• 85 per cent of all children surveyed who use mobile
phones access the internet on their device.
• Overall, the most popular types of internet content that children access from mobile phones are entertainment such as ring tones, wallpapers, screen savers, games, music, and videos, at over 90 per cent. This increases to 97 per cent for child smartphone users.
• 91 per cent of children use the camera on their mobile phone or smartphone and nearly half watch films or videos on their mobile phone.
• 45 per cent of children use GPS location services on their phones.
2.1 Key findings by chapter
2SUMMARY OF KEY FINDINGS
4
CHILDREN’S USE OF MOBILE PHONES – AN INTERNATIONAL COMPARISON 2015
Chapter 5: Mobile apps: download and use
• 93 per cent of children that use smartphones have downloaded apps including 100 per cent of children in Bahrain.
• In Japan, children aged 8 to 11 download apps but at a relatively low rate compared to other countries,
• The most popular apps used by children are entertainment apps (78 per cent) followed by communication apps, such as social networking or instant messaging apps (68 per cent).
• The majority of children say they read the terms and conditions/permissions when downloading apps and 39 per cent say they understand them.
• 20 per cent of children in Honduras, Japan and the Philippines have downloaded or used paid apps.
Chapter 6: Social networking services (SNS)
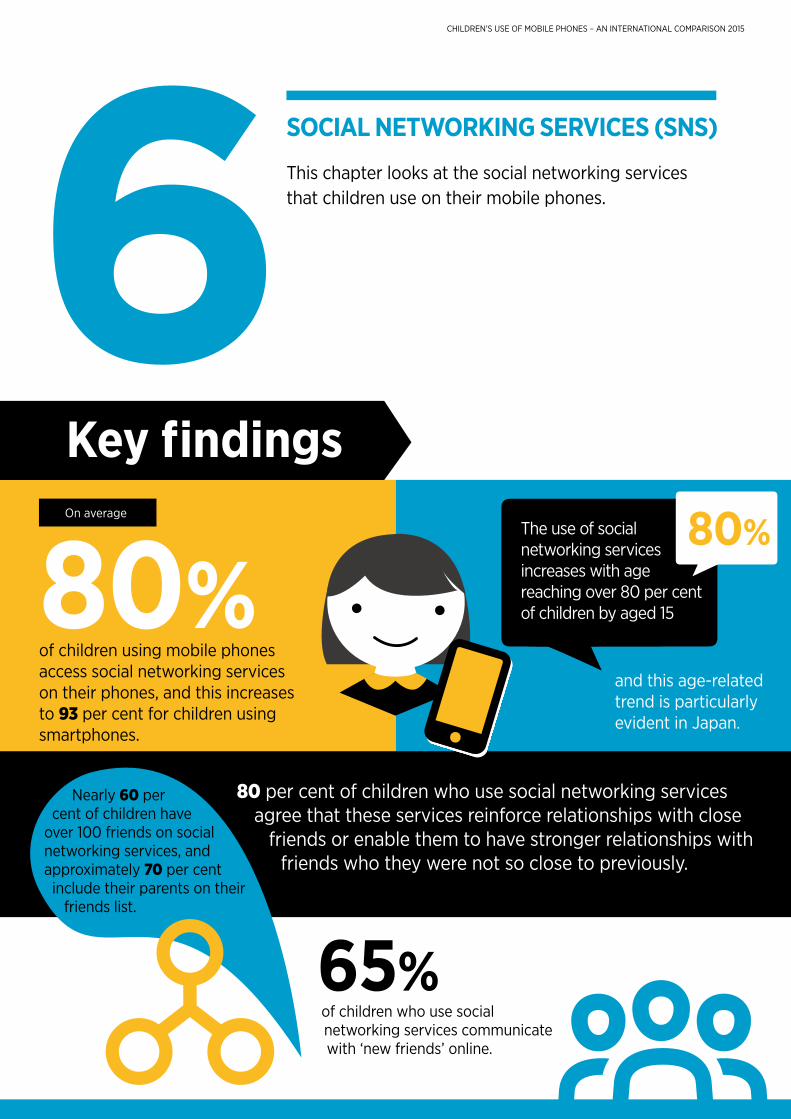
• On average over 80 per cent of children using mobile phones access social networking services on their phones, and this increases to 93 per cent for children using smartphones.
• The use of social networking services increases with age reaching over 80 per cent of children by age 15 and this age-related trend is particularly evident in Japan.
• Nearly 60 per cent of children have over 100 friends on social networking services, and approximately 70 per cent include their parents on their friends list. 65 per cent of children who use social networking services communicate with ‘new friends’ online.
• 75 per cent of children who use social networking services agree that these services reinforce relationships with close friends or enable them to have stronger relationships with friends who they were not so close to previously.
5
CHILDREN’S USE OF MOBILE PHONES – AN INTERNATIONAL COMPARISON 2015
Chapter 7: Privacy
Chapter 8: Digital literacy, parental controls and children’s wellbeing
• Half of children who use social network services responded that their profile was private.
• 55 per cent of children responded that their photo has been uploaded by someone else, with advanced permission requested from them in half of these cases.
• 90 per cent of children who use social networking services say they can change the privacy settings on those services by themselves.
• Over 65 per cent of children who use a mobile phone protect their privacy by using a password or pin number on their phone.
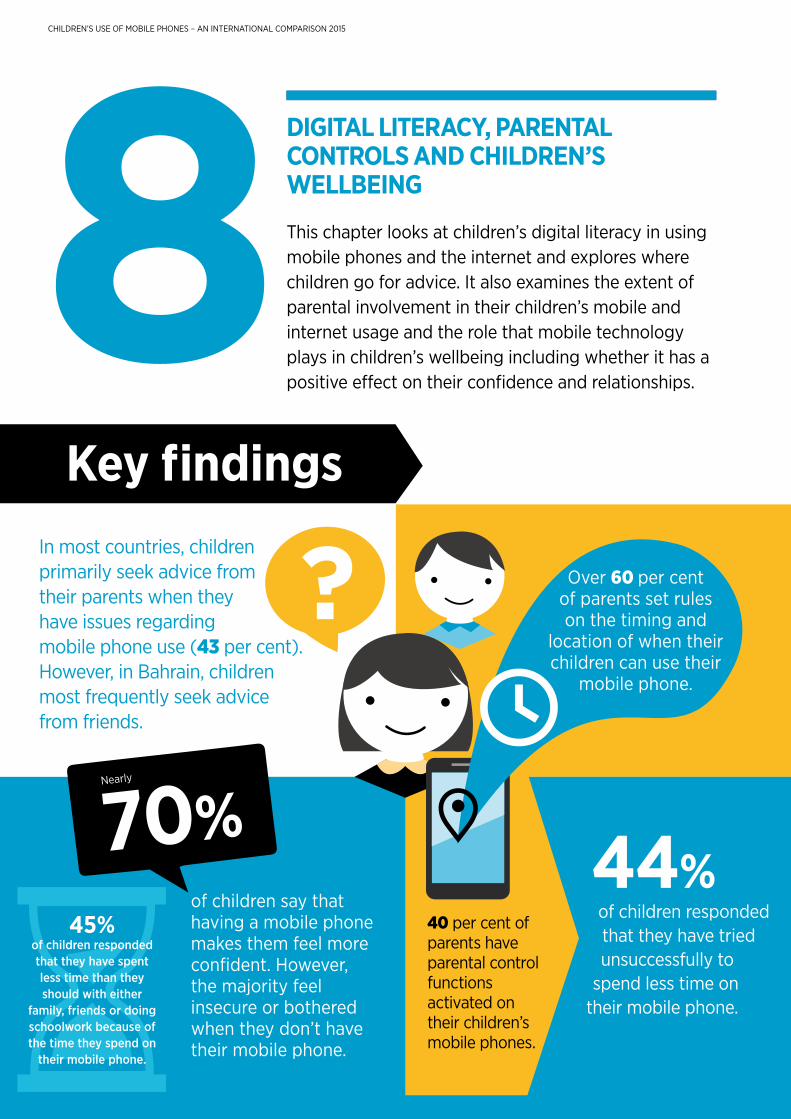
• In most countries, children primarily seek advice from their parents when they have issues regarding mobile phone use. However, in Bahrain, children most frequently seek advice from friends.
• Nearly 70 per cent of children say that having a mobile phone makes them feel more confident. However, the majority feel insecure or bothered when they don’t have their mobile phones.
• 45 per cent of children responded that they have spent less time than they should with either family, friends or doing schoolwork because of the time they spend on their mobile phone.
• 45 per cent of children responded that they have tried unsuccessfully to spend less time on their mobile phone.
• Nearly 70 per cent of parents set rules on the timing and location of when their children can use their mobile phones.
• 40 per cent of parents have parental control functions activated on their children’s mobile phones with content filtering the most commonly used function.
CHILDREN’S USE OF MOBILE PHONES – AN INTERNATIONAL COMPARISON 2015
CHILDREN AND MOBILE PHONES: AN OVERVIEW
How many children own mobile phones and what do they use them for? This Chapter discusses the differences across the four countries surveyed and how they relate to the percentage of children who own a mobile phone, age of first acquisition, type of mobile phone owned and tablet use.
Key findings
is the most common age for children to receive their first mobile phone.
On average
of children surveyed use a tablet.
The Philippines has the highest proportion at52% 76%
67%of children surveyed in Bahrain, Japan and thePhilippines use a mobile phone.
and Japan the lowest at 24 per cent.
3years10
7
CHILDREN’S USE OF MOBILE PHONES – AN INTERNATIONAL COMPARISON 2015
3.1 Mobile phone use and age of first ownership
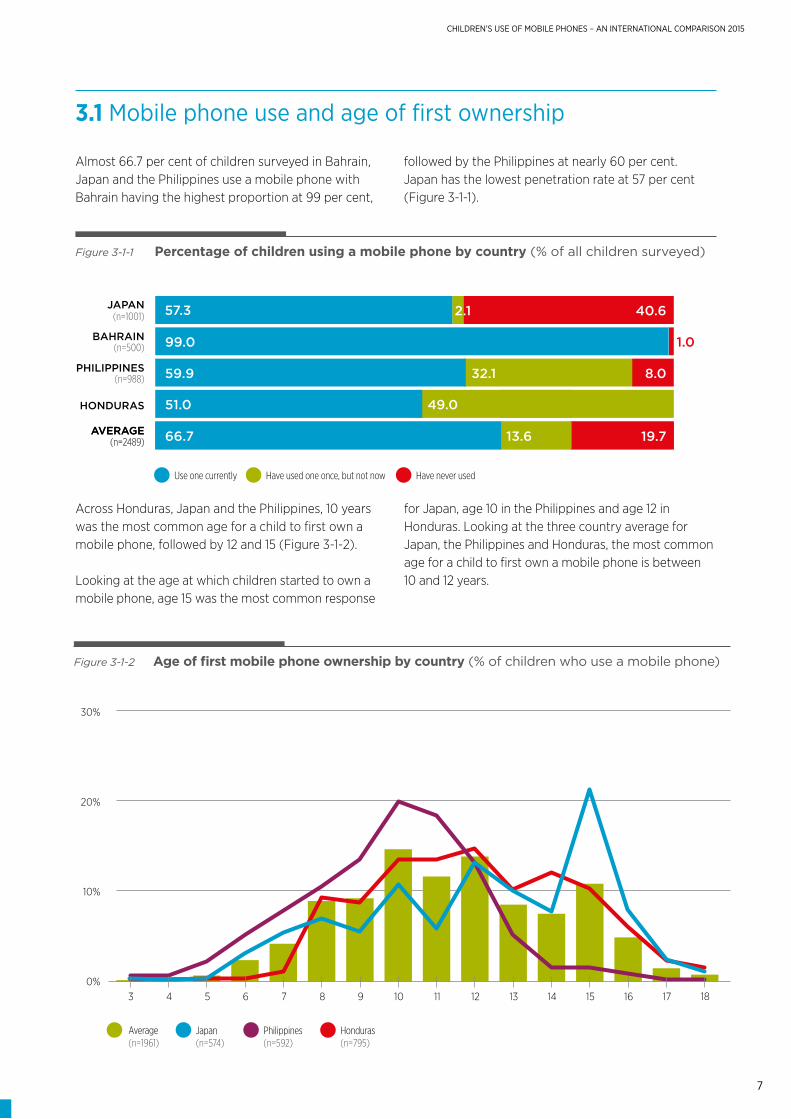
Almost 66.7 per cent of children surveyed in Bahrain, Japan and the Philippines use a mobile phone with Bahrain having the highest proportion at 99 per cent,
followed by the Philippines at nearly 60 per cent. Japan has the lowest penetration rate at 57 per cent (Figure 3-1-1).
Across Honduras, Japan and the Philippines, 10 years was the most common age for a child to first own a mobile phone, followed by 12 and 15 (Figure 3-1-2).
Looking at the age at which children started to own a mobile phone, age 15 was the most common response
for Japan, age 10 in the Philippines and age 12 in Honduras. Looking at the three country average for Japan, the Philippines and Honduras, the most common age for a child to first own a mobile phone is between 10 and 12 years.
Figure 3-1-1 Percentage of children using a mobile phone by country (% of all children surveyed)
(n=1001)JAPAN
BAHRAIN(n=500)
PHILIPPINES(n=988)
57.3 2.1
32.1
13.6
99.0
59.9
66.7
40.6
1.0
8.0
Figure 3-1-2 Age of first mobile phone ownership by country (% of children who use a mobile phone)
Average(n=1961)
Japan(n=574)
Philippines(n=592)
Honduras(n=795)
3 4 5 6 7 8 9 10 11 12 13 14 15 16 17 180%
10%
20%
30%
Use one currently Have used one once, but not now Have never used
49.051.0
AVERAGE(n=2489) 13.666.7 19.7AVERAGE(n=2489) 13.666.7 19.7
HONDURAS
8
CHILDREN’S USE OF MOBILE PHONES – AN INTERNATIONAL COMPARISON 2015
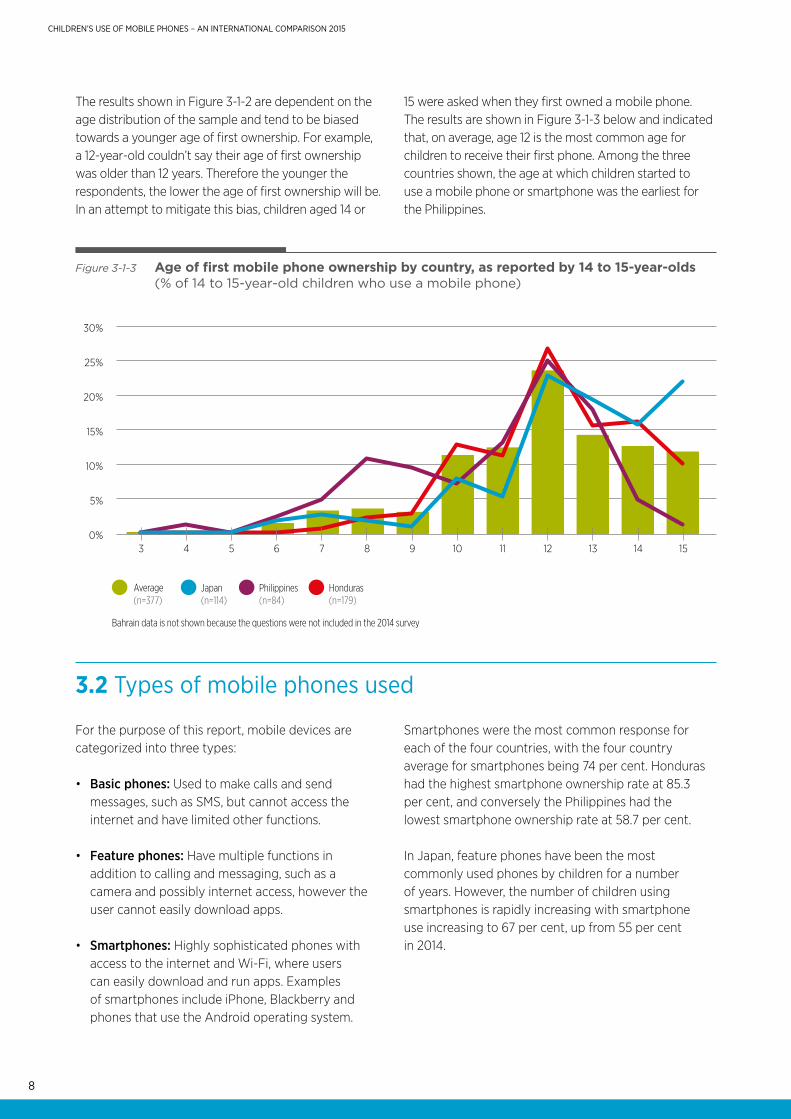
The results shown in Figure 3-1-2 are dependent on the age distribution of the sample and tend to be biased towards a younger age of first ownership. For example, a 12-year-old couldn’t say their age of first ownership was older than 12 years. Therefore the younger the respondents, the lower the age of first ownership will be. In an attempt to mitigate this bias, children aged 14 or
15 were asked when they first owned a mobile phone. The results are shown in Figure 3-1-3 below and indicated that, on average, age 12 is the most common age for children to receive their first phone. Among the three countries shown, the age at which children started to use a mobile phone or smartphone was the earliest for the Philippines.
For the purpose of this report, mobile devices are categorized into three types:
• Basic phones: Used to make calls and send messages, such as SMS, but cannot access the internet and have limited other functions.
• Feature phones: Have multiple functions in addition to calling and messaging, such as a camera and possibly internet access, however the user cannot easily download apps.
• Smartphones: Highly sophisticated phones with access to the internet and Wi-Fi, where users can easily download and run apps. Examples of smartphones include iPhone, Blackberry and phones that use the Android operating system.
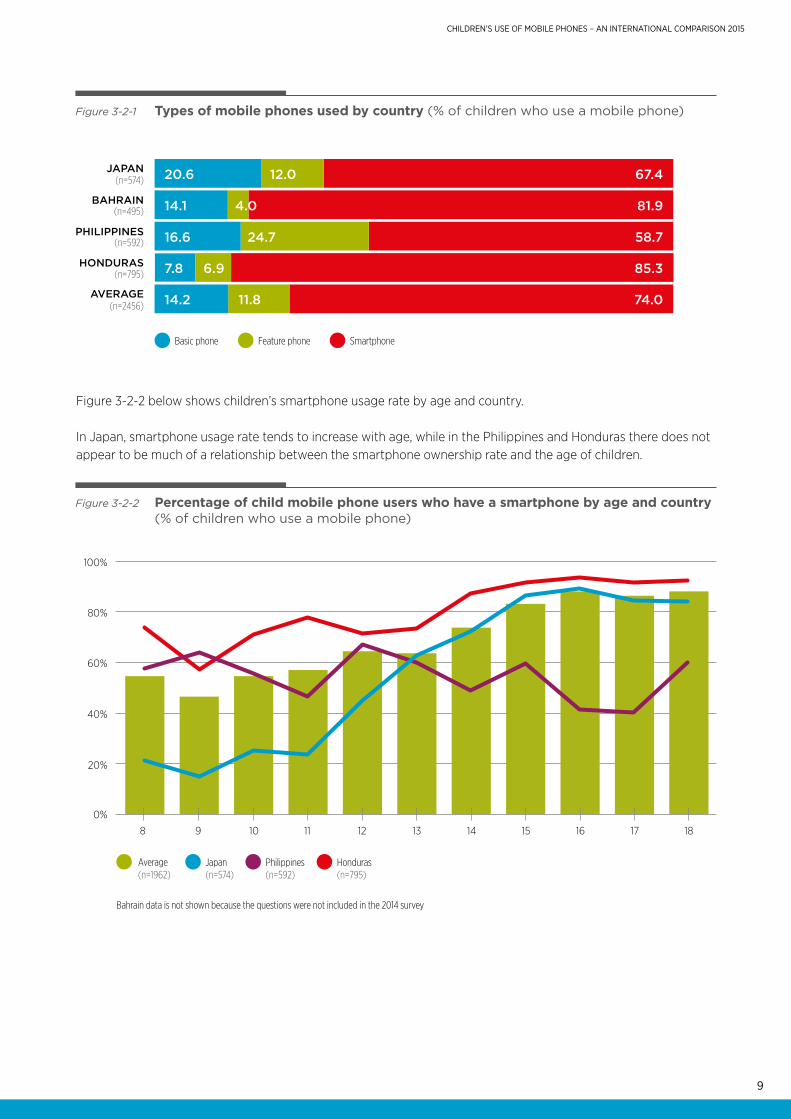
Smartphones were the most common response for each of the four countries, with the four country average for smartphones being 74 per cent. Honduras had the highest smartphone ownership rate at 85.3 per cent, and conversely the Philippines had the lowest smartphone ownership rate at 58.7 per cent.
In Japan, feature phones have been the most commonly used phones by children for a number of years. However, the number of children using smartphones is rapidly increasing with smartphone use increasing to 67 per cent, up from 55 per cent in 2014.
3.2 Types of mobile phones used
Figure 3-1-3 Age of first mobile phone ownership by country, as reported by 14 to 15-year-olds (% of 14 to 15-year-old children who use a mobile phone)
Average(n=377)
Japan(n=114)
Philippines(n=84)
Honduras(n=179)
0%
5%
10%
15%
20%
25%
30%
3 4 5 6 7 8 9 10 11 12 13 14 15
Bahrain data is not shown because the questions were not included in the 2014 survey
9
CHILDREN’S USE OF MOBILE PHONES – AN INTERNATIONAL COMPARISON 2015
Figure 3-2-2 below shows children’s smartphone usage rate by age and country.
In Japan, smartphone usage rate tends to increase with age, while in the Philippines and Honduras there does not appear to be much of a relationship between the smartphone ownership rate and the age of children.
Figure 3-2-1 Types of mobile phones used by country (% of children who use a mobile phone)
Basic phone Feature phone Smartphone
(n=574)JAPAN
BAHRAIN(n=495)
PHILIPPINES(n=592)
HONDURAS(n=795)
AVERAGE(n=2456)
20.6 12.0
4.0
24.7
6.9
11.8
14.1
16.6
7.8
14.2
67.4
81.9
58.7
85.3
74.0
Figure 3-2-2 Percentage of child mobile phone users who have a smartphone by age and country (% of children who use a mobile phone)
Average(n=1962)
Japan(n=574)
Philippines(n=592)
Honduras(n=795)
0%
20%
40%
60%
80%
100%
8 9 10 11 12 13 14 15 16 17 18
Bahrain data is not shown because the questions were not included in the 2014 survey
10
CHILDREN’S USE OF MOBILE PHONES – AN INTERNATIONAL COMPARISON 2015
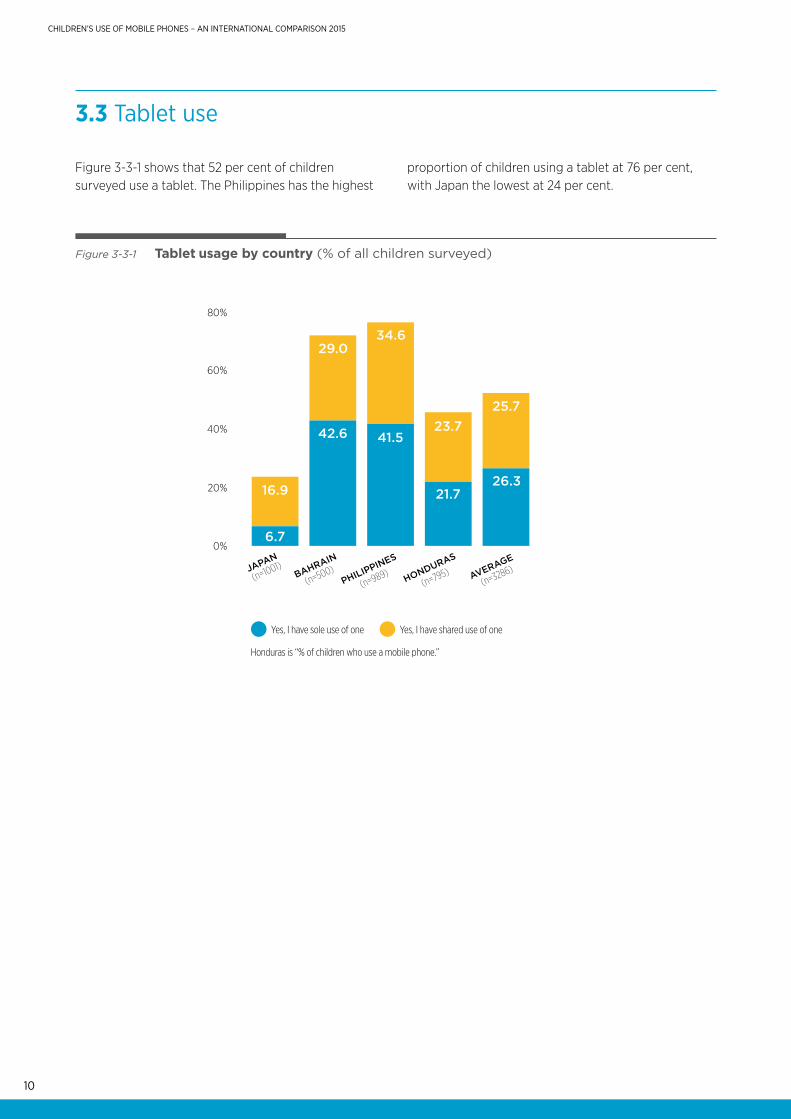
Figure 3-3-1 shows that 52 per cent of children surveyed use a tablet. The Philippines has the highest
proportion of children using a tablet at 76 per cent, with Japan the lowest at 24 per cent.
3.3 Tablet use
Figure 3-3-1 Tablet usage by country (% of all children surveyed)
Yes, I have sole use of one Yes, I have shared use of one
JAPAN
(n=1001)BAHRAIN
(n=500)PHILIPPINES
(n=989) HONDURAS
(n=795) AVERAGE
(n=3286)
0%
20%
40%
60%
80%
25.723.7
34.629.0
16.9
6.7
42.6 41.5
21.726.3
Honduras is “% of children who use a mobile phone.”
4
11
CHILDREN’S USE OF MOBILE PHONES – AN INTERNATIONAL COMPARISON 2015
CHILDREN’S USE OF MOBILE PHONES AND THE INTERNET
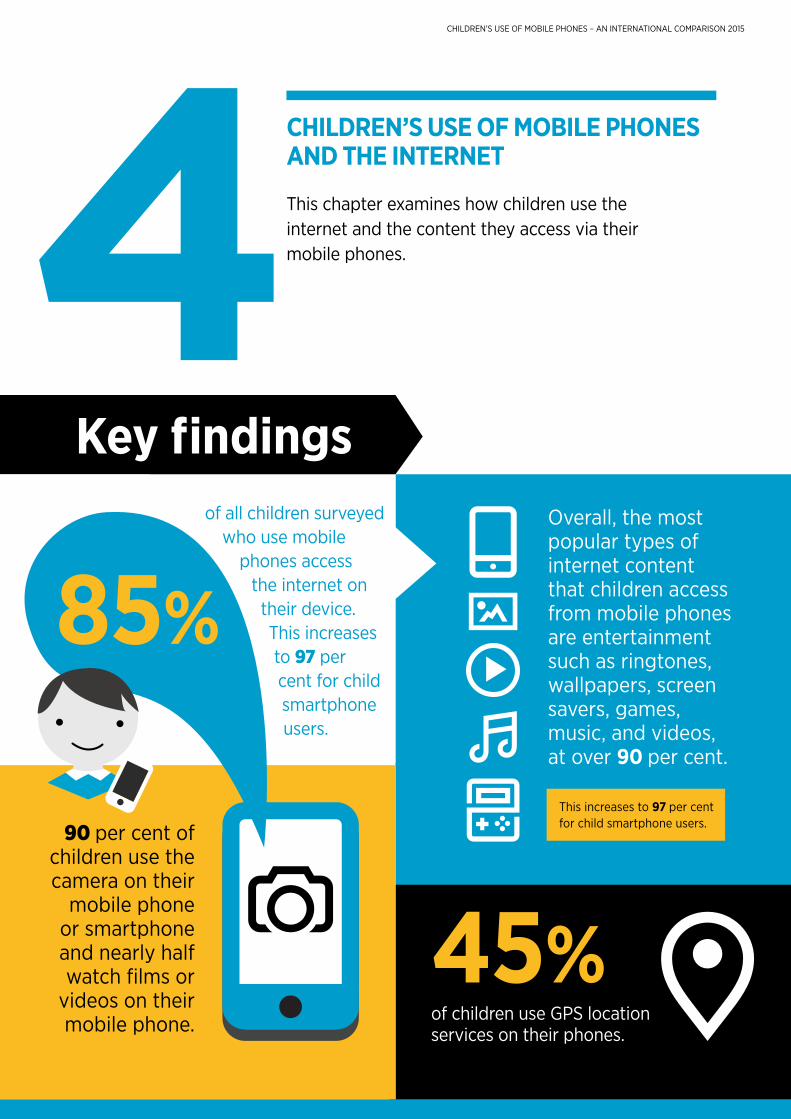
This chapter examines how children use the internet and the content they access via their mobile phones.4
Key findingsof all children surveyed
who use mobile phones access
the internet on their device. This increases to 97 per cent for child smartphone users.
90 per cent of children use the camera on their
mobile phone or smartphone and nearly half watch films or
videos on their mobile phone.
85%
Overall, the most popular types of internet content that children access from mobile phones are entertainment such as ringtones, wallpapers, screen savers, games, music, and videos, at over 90 per cent.
This increases to 97 per cent for child smartphone users.
45% of children use GPS location services on their phones.
12
CHILDREN’S USE OF MOBILE PHONES – AN INTERNATIONAL COMPARISON 2015
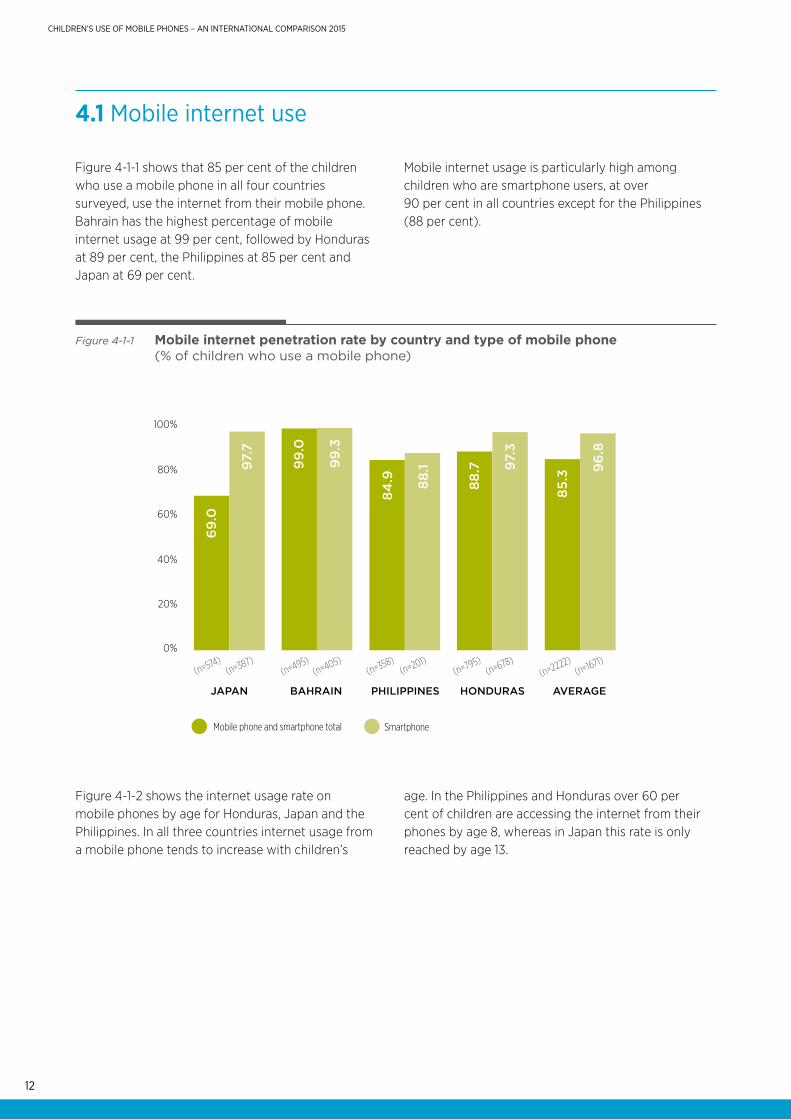
4.1 Mobile internet use
Figure 4-1-1 shows that 85 per cent of the children who use a mobile phone in all four countries surveyed, use the internet from their mobile phone. Bahrain has the highest percentage of mobile internet usage at 99 per cent, followed by Honduras at 89 per cent, the Philippines at 85 per cent and Japan at 69 per cent.
Mobile internet usage is particularly high among children who are smartphone users, at over 90 per cent in all countries except for the Philippines (88 per cent).
Figure 4-1-1 Mobile internet penetration rate by country and type of mobile phone (% of children who use a mobile phone)
Mobile phone and smartphone total Smartphone
JAPAN BAHRAIN PHILIPPINES HONDURAS AVERAGE
0%
20%
40%
60%
80%
100%
(n=574)(n=495)
(n=358)(n=795)
(n=2222)(n=387)
(n=405)(n=201)
(n=678)(n=1671)
69
.0
99
.0
99
.3
84.9 88
.1
88.7 97
.3
85.3
96
.8
97.7
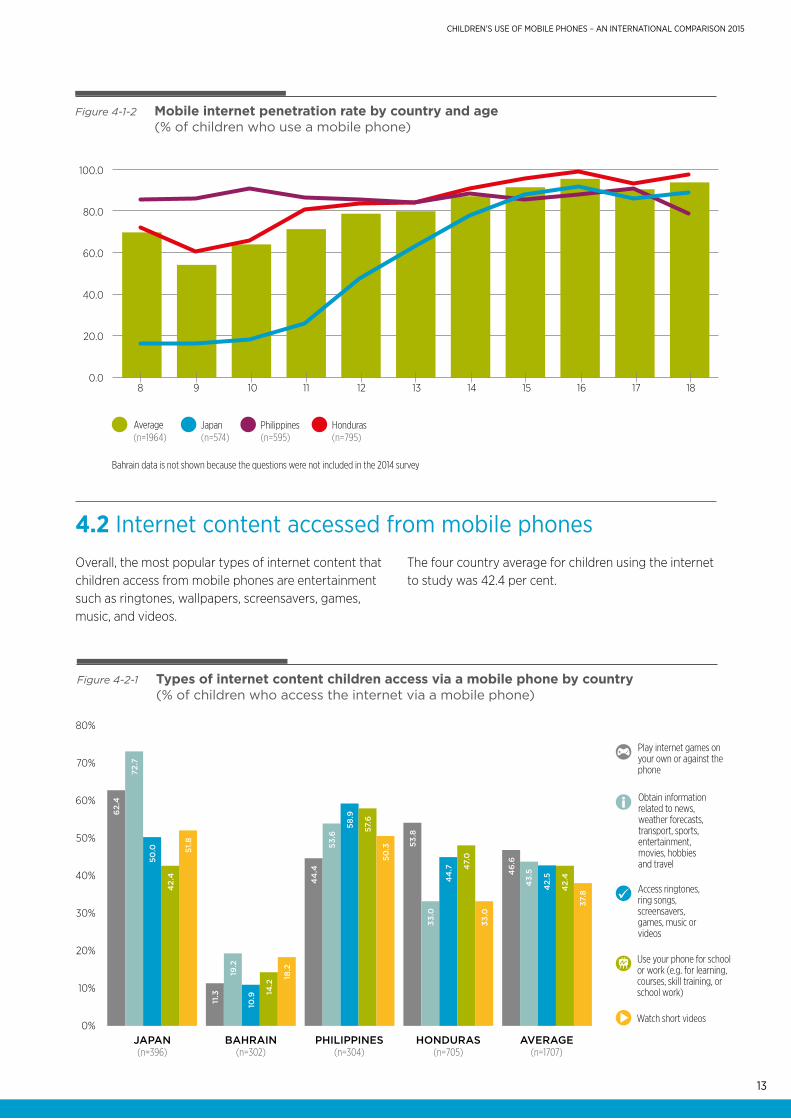
Figure 4-1-2 shows the internet usage rate on mobile phones by age for Honduras, Japan and the Philippines. In all three countries internet usage from a mobile phone tends to increase with children’s
age. In the Philippines and Honduras over 60 per cent of children are accessing the internet from their phones by age 8, whereas in Japan this rate is only reached by age 13.
13
CHILDREN’S USE OF MOBILE PHONES – AN INTERNATIONAL COMPARISON 2015
4.2 Internet content accessed from mobile phonesOverall, the most popular types of internet content that children access from mobile phones are entertainment such as ringtones, wallpapers, screensavers, games, music, and videos.
The four country average for children using the internet to study was 42.4 per cent.
Figure 4-1-2 Mobile internet penetration rate by country and age (% of children who use a mobile phone)
Average(n=1964)
Japan(n=574)
Philippines(n=595)
Honduras(n=795)
8 9 10 11 12 13 14 15 16 17 180.0
20.0
40.0
60.0
80.0
100.0
0%
10%
20%
30%
40%
50%
60%
80%
70%
JAPAN(n=396)
62.
4
72.7
50.0
42.
4
51.8
BAHRAIN(n=302)
11.3
19.2
10.9 14
.2
18.2
PHILIPPINES(n=304)
44
.4
53.6
58.9
57.6
50.3
HONDURAS(n=705)
53.8
33.0
44
.7 47.
0
33.0
AVERAGE(n=1707)
46
.6
43.
5
42.
5
42.
4
37.8
Figure 4-2-1 Types of internet content children access via a mobile phone by country (% of children who access the internet via a mobile phone)
Watch short videos
Play internet games on your own or against the phone
Access ringtones, ring songs, screensavers, games, music or videos
Use your phone for school or work (e.g. for learning, courses, skill training, or school work)
Obtain information related to news, weather forecasts, transport, sports, entertainment, movies, hobbies and travel
Bahrain data is not shown because the questions were not included in the 2014 survey
14
CHILDREN’S USE OF MOBILE PHONES – AN INTERNATIONAL COMPARISON 2015
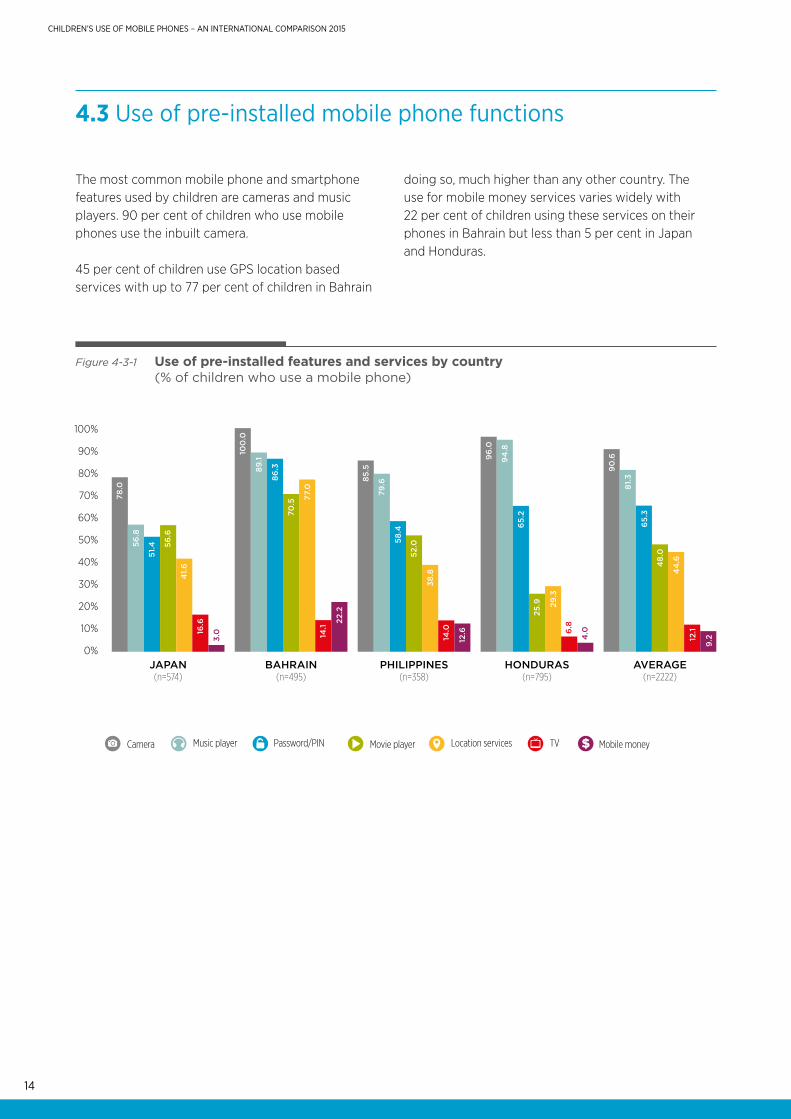
5The most common mobile phone and smartphone features used by children are cameras and music players. 90 per cent of children who use mobile phones use the inbuilt camera.
45 per cent of children use GPS location based services with up to 77 per cent of children in Bahrain
doing so, much higher than any other country. The use for mobile money services varies widely with 22 per cent of children using these services on their phones in Bahrain but less than 5 per cent in Japan and Honduras.
4.3 Use of pre-installed mobile phone functions
Figure 4-3-1 Use of pre-installed features and services by country (% of children who use a mobile phone)
0%
20%
10%
30%
40%
50%
60%
70%
80%
90%
100%
JAPAN(n=574)
BAHRAIN(n=495)
PHILIPPINES(n=358)
HONDURAS(n=795)
AVERAGE(n=2222)
100
.0
89.1
86.3
70.5
77.0
14.1
22.2
78.0
56.8
51.4 56
.6
41.
6
16.6
3.0
85.5
79.6
58.4
52.0
38.8
14.0
12.6
96
.0
94
.8
65.
2
25.9 29
.3
6.8
4.0
90
.6
81.3
65.
3
48.
0
44
.6
12.1
9.2
Movie playerCamera Music player Location services TV Mobile moneyPassword/PIN
15
CHILDREN’S USE OF MOBILE PHONES – AN INTERNATIONAL COMPARISON 2015
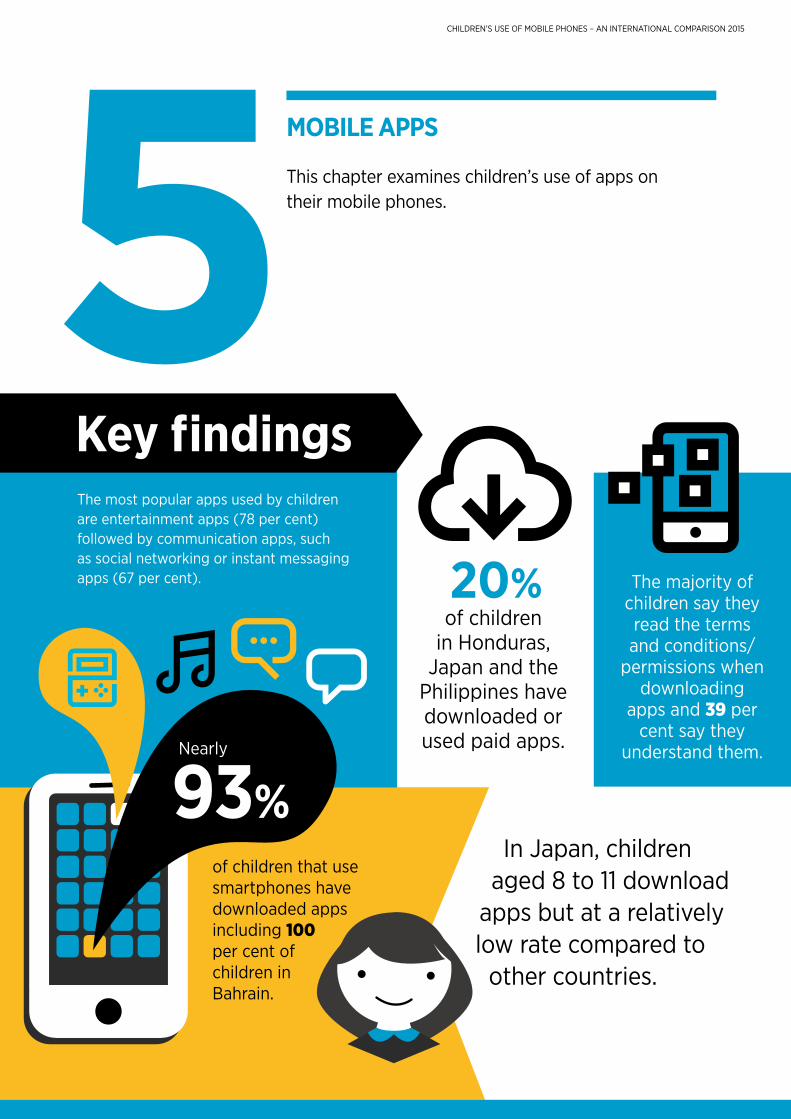
MOBILE APPS
This chapter examines children’s use of apps on their mobile phones.
Key findings
20% of children
in Honduras, Japan and the
Philippines have downloaded or used paid apps.
The majority of children say they read the terms and conditions/
permissions when downloading
apps and 39 per cent say they
understand them.
of children that use smartphones have downloaded apps including 100 per cent of children in Bahrain.
593%Nearly
The most popular apps used by children are entertainment apps (78 per cent) followed by communication apps, such as social networking or instant messaging apps (67 per cent).
In Japan, children aged 8 to 11 download
apps but at a relatively low rate compared to
other countries.
16
CHILDREN’S USE OF MOBILE PHONES – AN INTERNATIONAL COMPARISON 2015
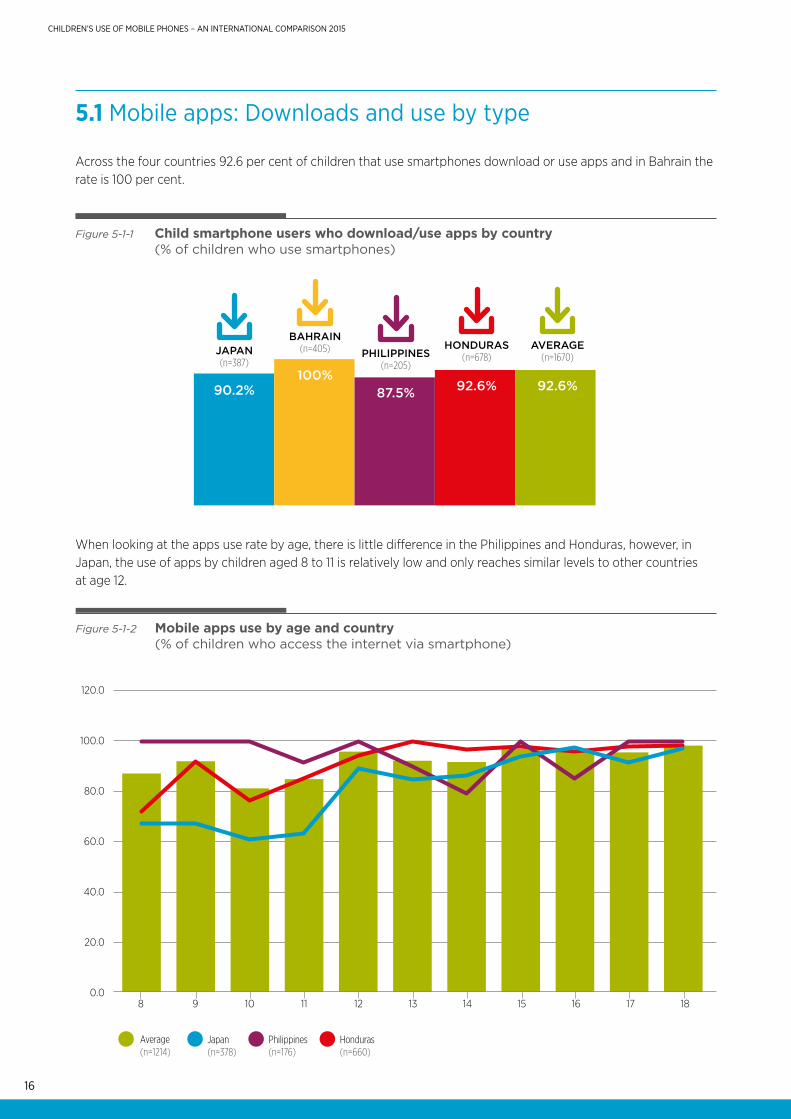
5.1 Mobile apps: Downloads and use by type
Across the four countries 92.6 per cent of children that use smartphones download or use apps and in Bahrain the rate is 100 per cent.
When looking at the apps use rate by age, there is little difference in the Philippines and Honduras, however, in Japan, the use of apps by children aged 8 to 11 is relatively low and only reaches similar levels to other countries at age 12.
Figure 5-1-1 Child smartphone users who download/use apps by country (% of children who use smartphones)
90.2%
JAPAN(n=387)
100%
BAHRAIN(n=405)
92.6%
HONDURAS(n=678)
92.6%
AVERAGE(n=1670)
87.5%
PHILIPPINES(n=205)
Figure 5-1-2 Mobile apps use by age and country (% of children who access the internet via smartphone)
Average(n=1214)
Japan(n=378)
Philippines(n=176)
Honduras(n=660)
8 9 10 11 12 13 14 15 16 17 180.0
20.0
40.0
60.0
80.0
100.0
120.0
17
CHILDREN’S USE OF MOBILE PHONES – AN INTERNATIONAL COMPARISON 2015
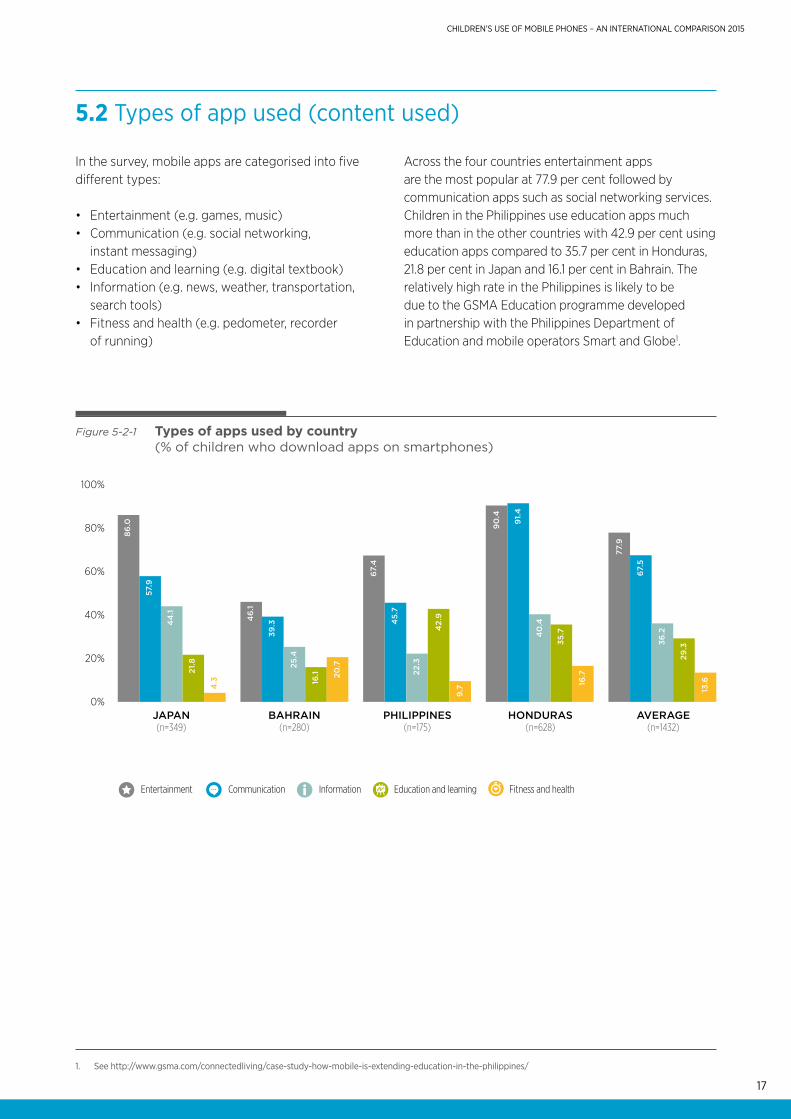
In the survey, mobile apps are categorised into five different types:
• Entertainment (e.g. games, music)• Communication (e.g. social networking,
instant messaging)• Education and learning (e.g. digital textbook)• Information (e.g. news, weather, transportation,
search tools)• Fitness and health (e.g. pedometer, recorder
of running)
Across the four countries entertainment apps are the most popular at 77.9 per cent followed by communication apps such as social networking services. Children in the Philippines use education apps much more than in the other countries with 42.9 per cent using education apps compared to 35.7 per cent in Honduras, 21.8 per cent in Japan and 16.1 per cent in Bahrain. The relatively high rate in the Philippines is likely to be due to the GSMA Education programme developed in partnership with the Philippines Department of Education and mobile operators Smart and Globe1.
1. See http://www.gsma.com/connectedliving/case-study-how-mobile-is-extending-education-in-the-philippines/
5.2 Types of app used (content used)
Figure 5-2-1 Types of apps used by country (% of children who download apps on smartphones)
0%
20%
40%
60%
80%
100%
JAPAN(n=349)
BAHRAIN(n=280)
PHILIPPINES(n=175)
HONDURAS(n=628)
AVERAGE(n=1432)
46
.1
39.3
25.4
16.1 20
.7
77.9
67.5
36.2
29.3
13.6
90
.4
91.
4
40
.4
35.7
16.7
67.4
45.
7
22.3
42.
9
9.7
86.0
57.9
44
.1
21.8
4.3
Fitness and healthEducation and learningInformationCommunicationEntertainment
18
CHILDREN’S USE OF MOBILE PHONES – AN INTERNATIONAL COMPARISON 2015
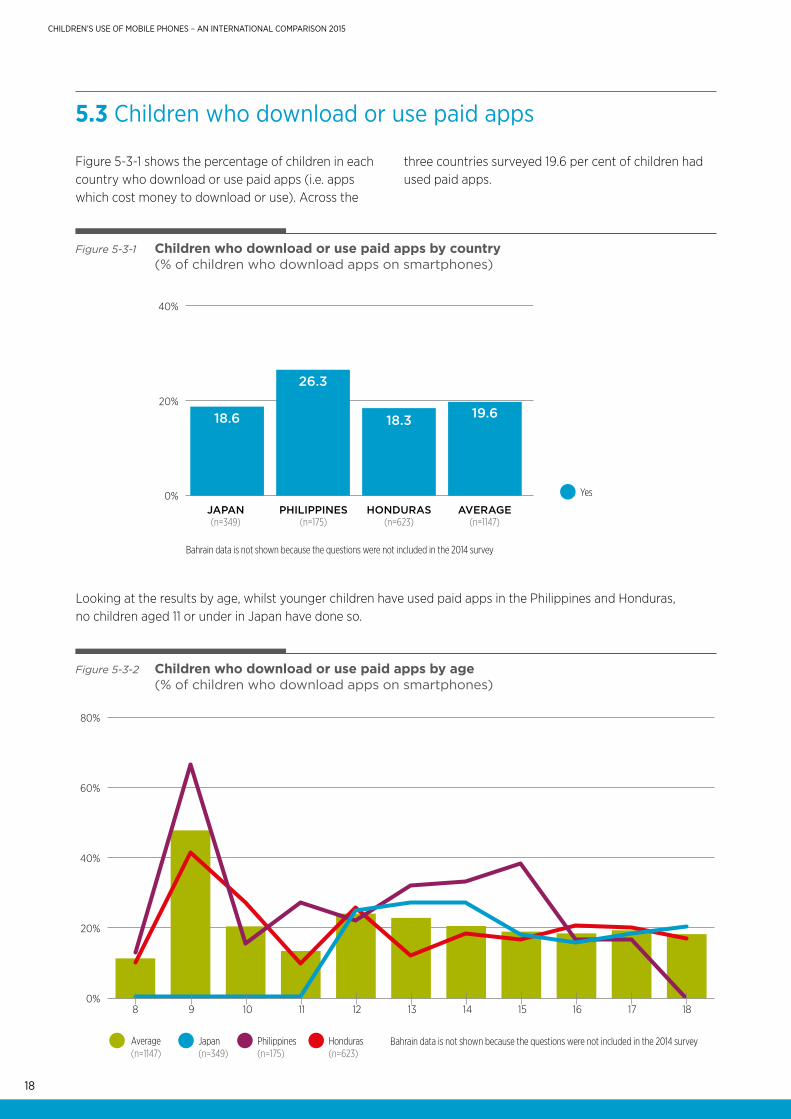
5.3 Children who download or use paid apps
Figure 5-3-1 shows the percentage of children in each country who download or use paid apps (i.e. apps which cost money to download or use). Across the
three countries surveyed 19.6 per cent of children had used paid apps.
Looking at the results by age, whilst younger children have used paid apps in the Philippines and Honduras, no children aged 11 or under in Japan have done so.
Figure 5-3-1 Children who download or use paid apps by country (% of children who download apps on smartphones)
JAPAN(n=349)
PHILIPPINES(n=175)
HONDURAS(n=623)
AVERAGE(n=1147)
0%
20%
40%
18.6
26.3
18.3 19.6
Yes
Figure 5-3-2 Children who download or use paid apps by age (% of children who download apps on smartphones)
Average(n=1147)
Japan(n=349)
Philippines(n=175)
Honduras(n=623)
0%
20%
40%
80%
60%
8 9 10 11 12 13 14 15 16 17 18
Bahrain data is not shown because the questions were not included in the 2014 survey
Bahrain data is not shown because the questions were not included in the 2014 survey
19
CHILDREN’S USE OF MOBILE PHONES – AN INTERNATIONAL COMPARISON 2015
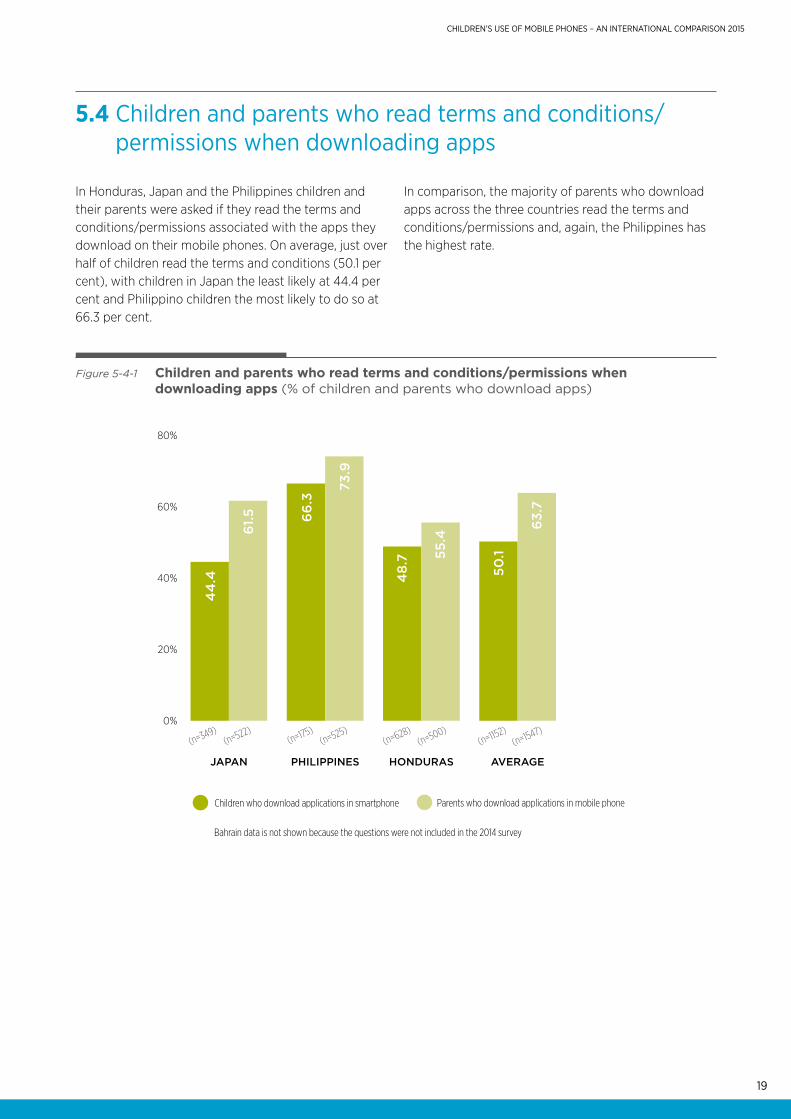
5.4 Children and parents who read terms and conditions/permissions when downloading apps
In Honduras, Japan and the Philippines children and their parents were asked if they read the terms and conditions/permissions associated with the apps they download on their mobile phones. On average, just over half of children read the terms and conditions (50.1 per cent), with children in Japan the least likely at 44.4 per cent and Philippino children the most likely to do so at 66.3 per cent.
In comparison, the majority of parents who download apps across the three countries read the terms and conditions/permissions and, again, the Philippines has the highest rate.
Figure 5-4-1 Children and parents who read terms and conditions/permissions when downloading apps (% of children and parents who download apps)
Children who download applications in smartphone Parents who download applications in mobile phone
0%
20%
40%
60%
80%
(n=349)(n=175)
(n=628)(n=1152)
(n=522)(n=525)
(n=500)(n=1547)
JAPAN PHILIPPINES HONDURAS AVERAGE
44
.4
61.
5 66
.3
73.9
48.
7 55.4
50.1
63.
7
Bahrain data is not shown because the questions were not included in the 2014 survey
20
CHILDREN’S USE OF MOBILE PHONES – AN INTERNATIONAL COMPARISON 2015
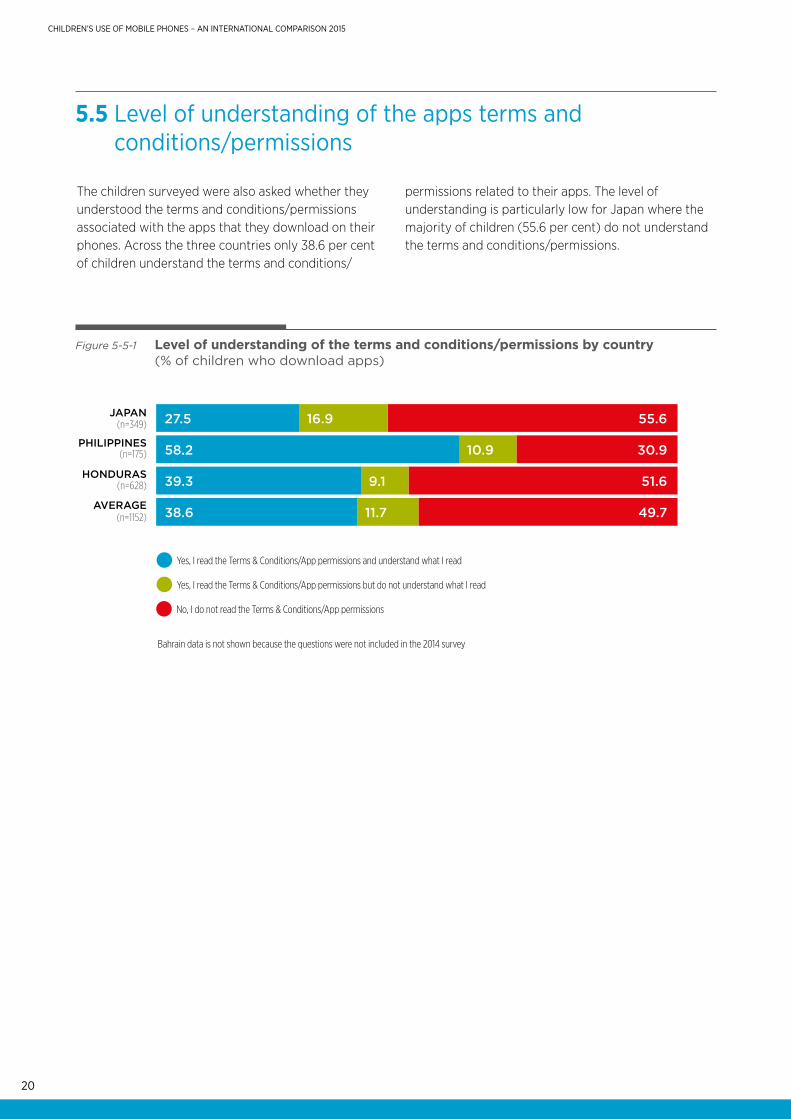
5.5 Level of understanding of the apps terms and conditions/permissions
The children surveyed were also asked whether they understood the terms and conditions/permissions associated with the apps that they download on their phones. Across the three countries only 38.6 per cent of children understand the terms and conditions/
permissions related to their apps. The level of understanding is particularly low for Japan where the majority of children (55.6 per cent) do not understand the terms and conditions/permissions.
Figure 5-5-1 Level of understanding of the terms and conditions/permissions by country (% of children who download apps)
Yes, I read the Terms & Conditions/App permissions and understand what I read
Yes, I read the Terms & Conditions/App permissions but do not understand what I read
No, I do not read the Terms & Conditions/App permissions
(n=349)JAPAN
PHILIPPINES(n=175)
HONDURAS(n=628)
AVERAGE(n=1152)
27.5 16.9 55.6
58.2 10.9 30.9
39.3 9.1 51.6
38.6 11.7 49.7
6Bahrain data is not shown because the questions were not included in the 2014 survey
CHILDREN’S USE OF MOBILE PHONES – AN INTERNATIONAL COMPARISON 2015
80%of children using mobile phones access social networking services on their phones, and this increases to 93 per cent for children using smartphones.
and this age-related trend is particularly evident in Japan.
Key findings
SOCIAL NETWORKING SERVICES (SNS)
This chapter looks at the social networking services that children use on their mobile phones.6
On average
80 per cent of children who use social networking services agree that these services reinforce relationships with close
friends or enable them to have stronger relationships with friends who they were not so close to previously.
The use of social networking services increases with age reaching over 80 per cent of children by aged 15
80%
65% of children who use social networking services communicate with ‘new friends’ online.
Nearly 60 per cent of children have over 100 friends on social networking services, and approximately 70 per cent include their parents on their friends list.
22
CHILDREN’S USE OF MOBILE PHONES – AN INTERNATIONAL COMPARISON 2015
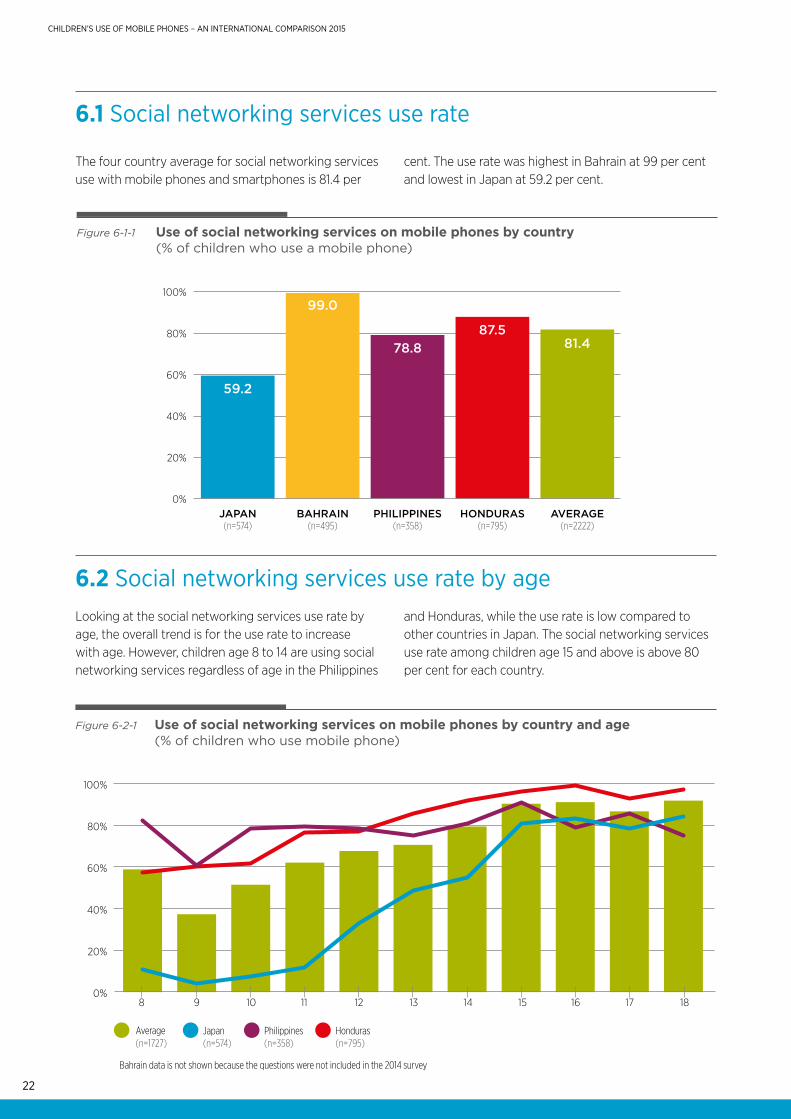
6.1 Social networking services use rate
The four country average for social networking services use with mobile phones and smartphones is 81.4 per
cent. The use rate was highest in Bahrain at 99 per cent and lowest in Japan at 59.2 per cent.
Looking at the social networking services use rate by age, the overall trend is for the use rate to increase with age. However, children age 8 to 14 are using social networking services regardless of age in the Philippines
and Honduras, while the use rate is low compared to other countries in Japan. The social networking services use rate among children age 15 and above is above 80 per cent for each country.
Figure 6-1-1 Use of social networking services on mobile phones by country (% of children who use a mobile phone)
0%
20%
40%
60%
80%
100%
JAPAN(n=574)
BAHRAIN(n=495)
PHILIPPINES(n=358)
HONDURAS(n=795)
AVERAGE(n=2222)
59.2
99.0
78.887.5
81.4
6.2 Social networking services use rate by age
Figure 6-2-1 Use of social networking services on mobile phones by country and age (% of children who use mobile phone)
Average(n=1727)
Japan(n=574)
Philippines(n=358)
Honduras(n=795)
0%
20%
40%
60%
80%
100%
8 9 10 11 12 13 14 15 16 17 18
Bahrain data is not shown because the questions were not included in the 2014 survey
23
CHILDREN’S USE OF MOBILE PHONES – AN INTERNATIONAL COMPARISON 2015
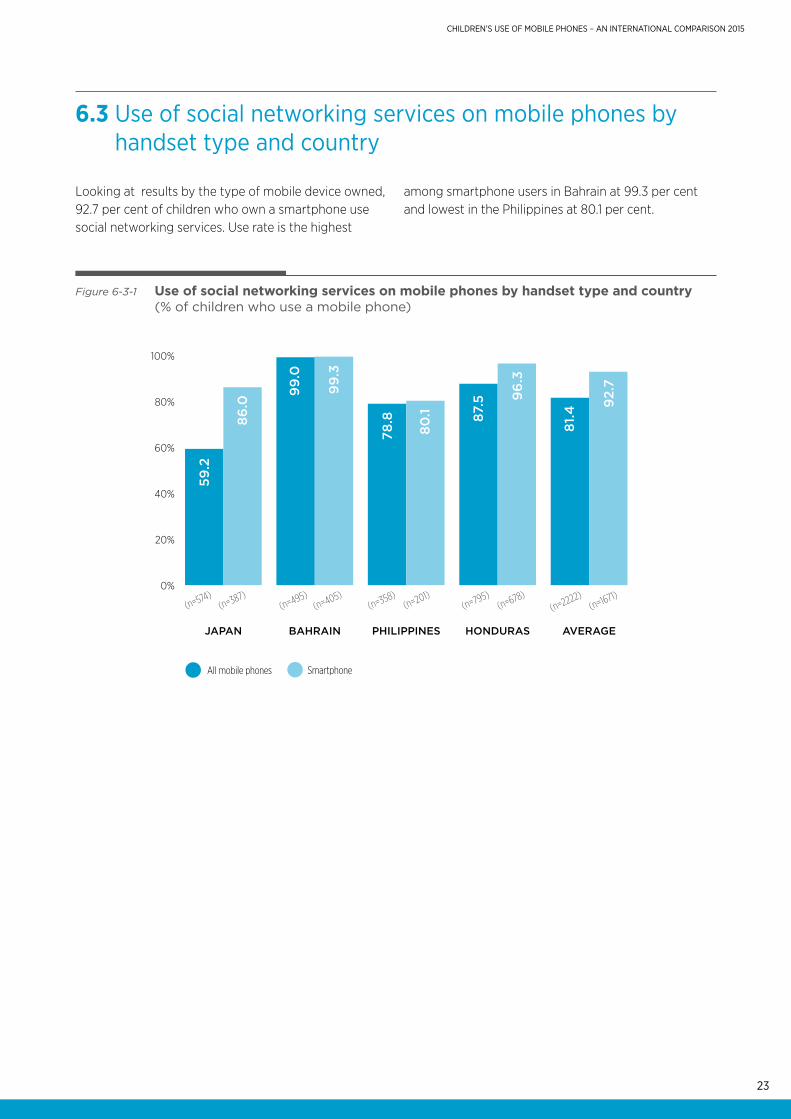
6.3 Use of social networking services on mobile phones by handset type and country
Looking at results by the type of mobile device owned, 92.7 per cent of children who own a smartphone use social networking services. Use rate is the highest
among smartphone users in Bahrain at 99.3 per cent and lowest in the Philippines at 80.1 per cent.
Figure 6-3-1 Use of social networking services on mobile phones by handset type and country (% of children who use a mobile phone)
All mobile phones Smartphone
0%
20%
40%
60%
80%
100%
(n=495)(n=574)
(n=358)(n=795)
(n=2222)(n=405)
(n=387)(n=201)
(n=678)(n=1671)
JAPAN PHILIPPINESBAHRAIN HONDURAS AVERAGE
59.2
86.0
99
.0
99
.3
78.8
80.1 87
.5 96
.3
81.4
92.
7
24
CHILDREN’S USE OF MOBILE PHONES – AN INTERNATIONAL COMPARISON 2015
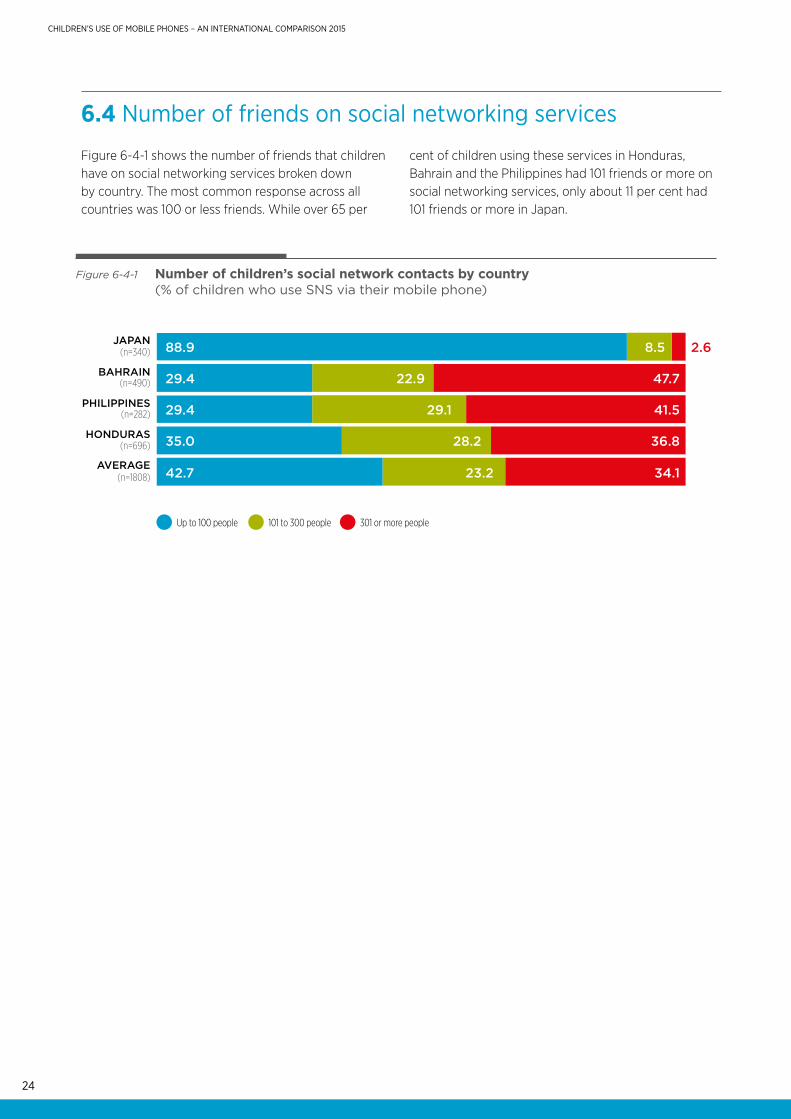
6.4 Number of friends on social networking services
Figure 6-4-1 shows the number of friends that children have on social networking services broken down by country. The most common response across all countries was 100 or less friends. While over 65 per
cent of children using these services in Honduras, Bahrain and the Philippines had 101 friends or more on social networking services, only about 11 per cent had 101 friends or more in Japan.
Figure 6-4-1 Number of children’s social network contacts by country (% of children who use SNS via their mobile phone)
Up to 100 people 101 to 300 people 301 or more people
(n=340)JAPAN
PHILIPPINES(n=282)
BAHRAIN(n=490)
HONDURAS(n=696)
AVERAGE(n=1808)
88.9 8.5 2.6
29.4
42.7 23.2 34.1
22.9 47.7
29.4 29.1 41.5
35.0 28.2 36.8
25
CHILDREN’S USE OF MOBILE PHONES – AN INTERNATIONAL COMPARISON 2015
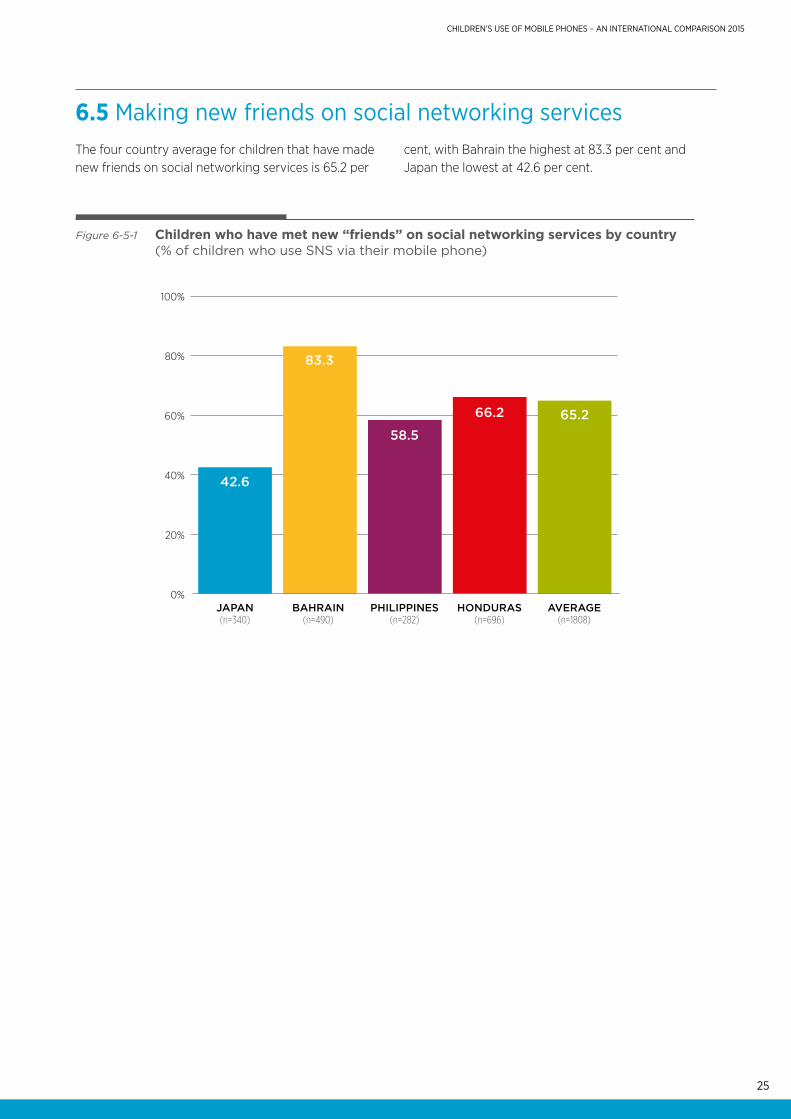
6.5 Making new friends on social networking servicesThe four country average for children that have made new friends on social networking services is 65.2 per
cent, with Bahrain the highest at 83.3 per cent and Japan the lowest at 42.6 per cent.
Figure 6-5-1 Children who have met new “friends” on social networking services by country (% of children who use SNS via their mobile phone)
0%
20%
40%
60%
80%
100%
JAPAN(n=340)
BAHRAIN(n=490)
PHILIPPINES(n=282)
HONDURAS(n=696)
AVERAGE(n=1808)
42.6
83.3
58.5
66.2 65.2
26
CHILDREN’S USE OF MOBILE PHONES – AN INTERNATIONAL COMPARISON 2015
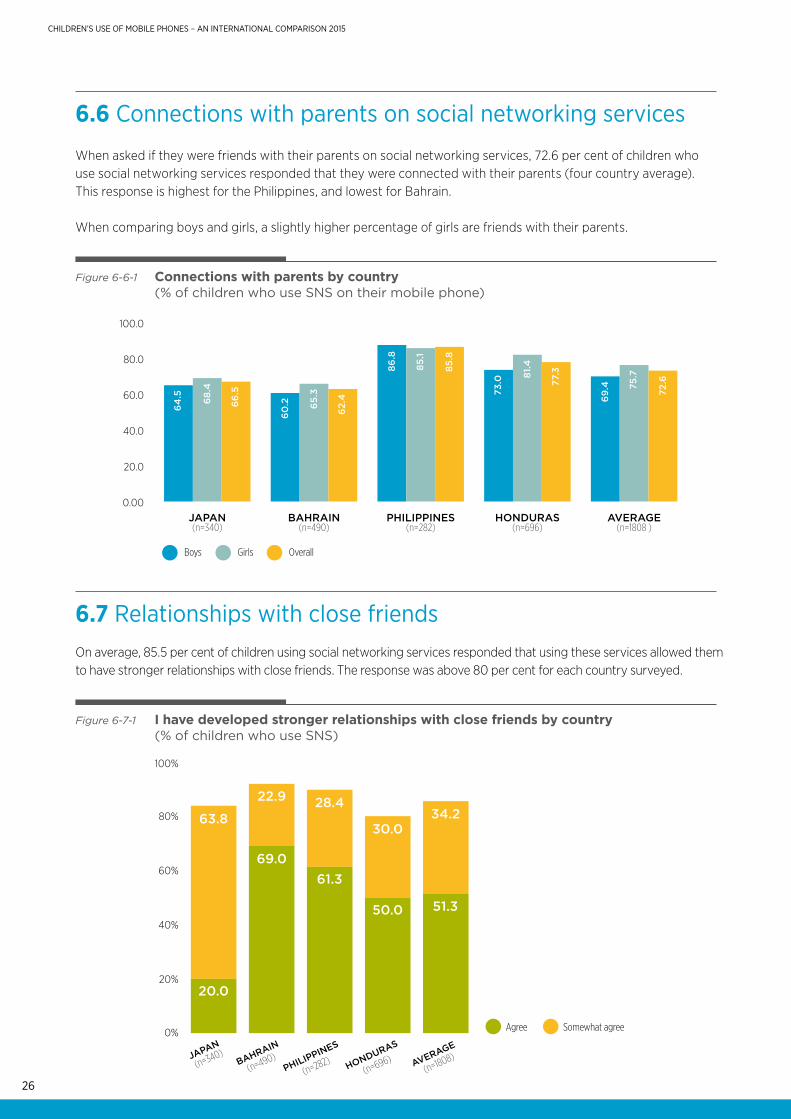
6.6 Connections with parents on social networking services
6.7 Relationships with close friends
When asked if they were friends with their parents on social networking services, 72.6 per cent of children who use social networking services responded that they were connected with their parents (four country average). This response is highest for the Philippines, and lowest for Bahrain.
When comparing boys and girls, a slightly higher percentage of girls are friends with their parents.
On average, 85.5 per cent of children using social networking services responded that using these services allowed them to have stronger relationships with close friends. The response was above 80 per cent for each country surveyed.
Figure 6-6-1 Connections with parents by country (% of children who use SNS on their mobile phone)
0.00JAPAN(n=340)
BAHRAIN(n=490)
PHILIPPINES(n=282)
HONDURAS(n=696)
AVERAGE(n=1808 )
20.0
40.0
60.0
80.0
100.0
64
.5 68.
4
66
.5
60
.2 65.
3
62.
4
86.8
85.1
85.8
73.0 81
.4
77.3
69
.4 75.7
72.6
Boys Girls Overall
Figure 6-7-1 I have developed stronger relationships with close friends by country (% of children who use SNS)
Agree Somewhat agree0%
20%
40%
60%
80%
100%
JAPAN
(n=340)BAHRAIN
(n=490)PHILIPPINES
(n=282) HONDURAS
(n=696) AVERAGE
(n=1808)
63.8
22.9
69.0
28.4
61.3
30.0
50.0
34.2
51.3
20.0
27
CHILDREN’S USE OF MOBILE PHONES – AN INTERNATIONAL COMPARISON 2015
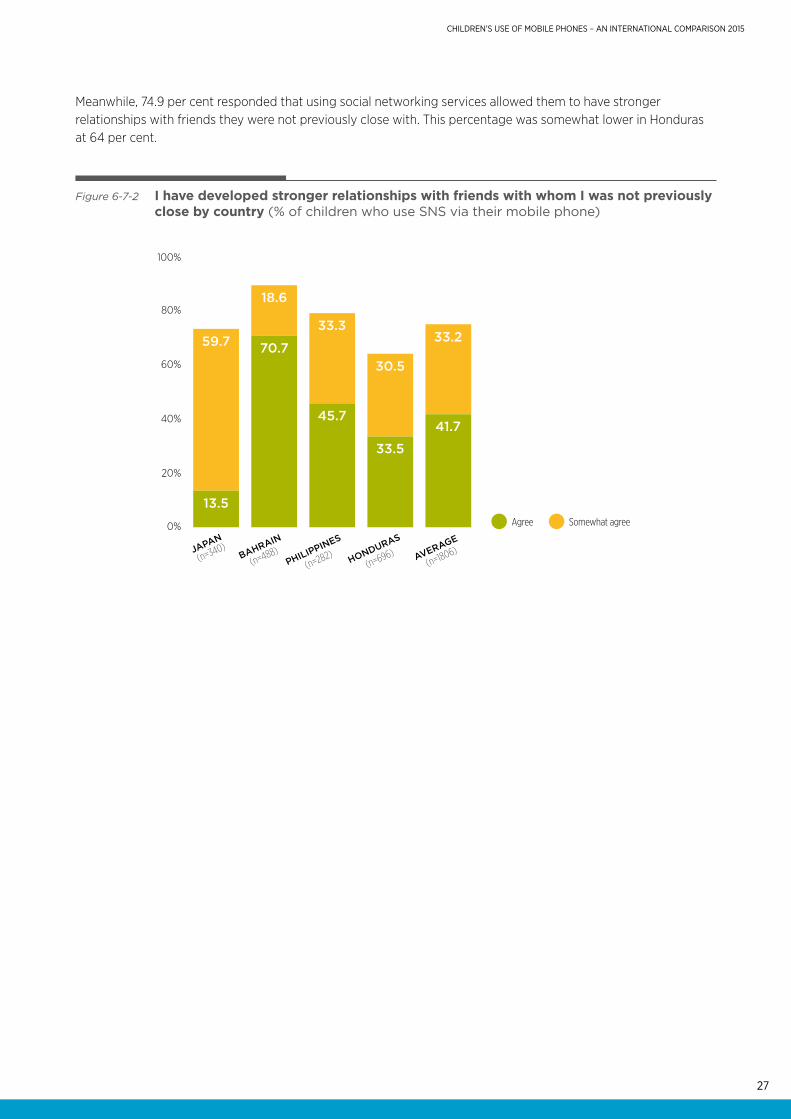
Meanwhile, 74.9 per cent responded that using social networking services allowed them to have stronger relationships with friends they were not previously close with. This percentage was somewhat lower in Honduras at 64 per cent.
Figure 6-7-2 I have developed stronger relationships with friends with whom I was not previously close by country (% of children who use SNS via their mobile phone)
Agree Somewhat agree0%
20%
40%
60%
80%
100%
JAPAN
(n=340)BAHRAIN
(n=488)PHILIPPINES
(n=282) HONDURAS
(n=696) AVERAGE
(n=1806)
59.7
18.6
70.7
33.3
45.7
30.5
33.5
33.2
41.7
13.5
28
CHILDREN’S USE OF MOBILE PHONES – AN INTERNATIONAL COMPARISON 2015
Key findings
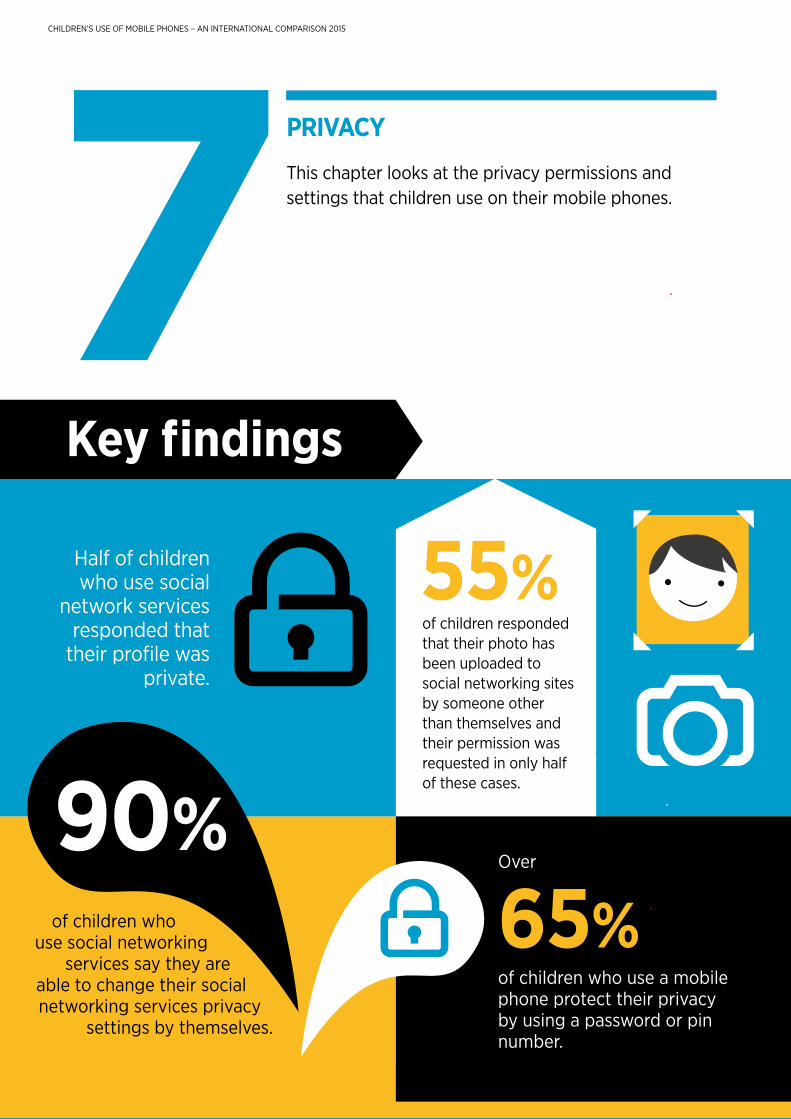
PRIVACY
This chapter looks at the privacy permissions and settings that children use on their mobile phones.7
Half of children who use social
network services responded that
their profile was private.
of children responded that their photo has been uploaded to social networking sites by someone other than themselves and their permission was requested in only half of these cases.
55%
of children who
use social networking services say they are
able to change their social networking services privacy
settings by themselves.
90%65%
of children who use a mobile phone protect their privacy by using a password or pin number.
Over
29
CHILDREN’S USE OF MOBILE PHONES – AN INTERNATIONAL COMPARISON 2015
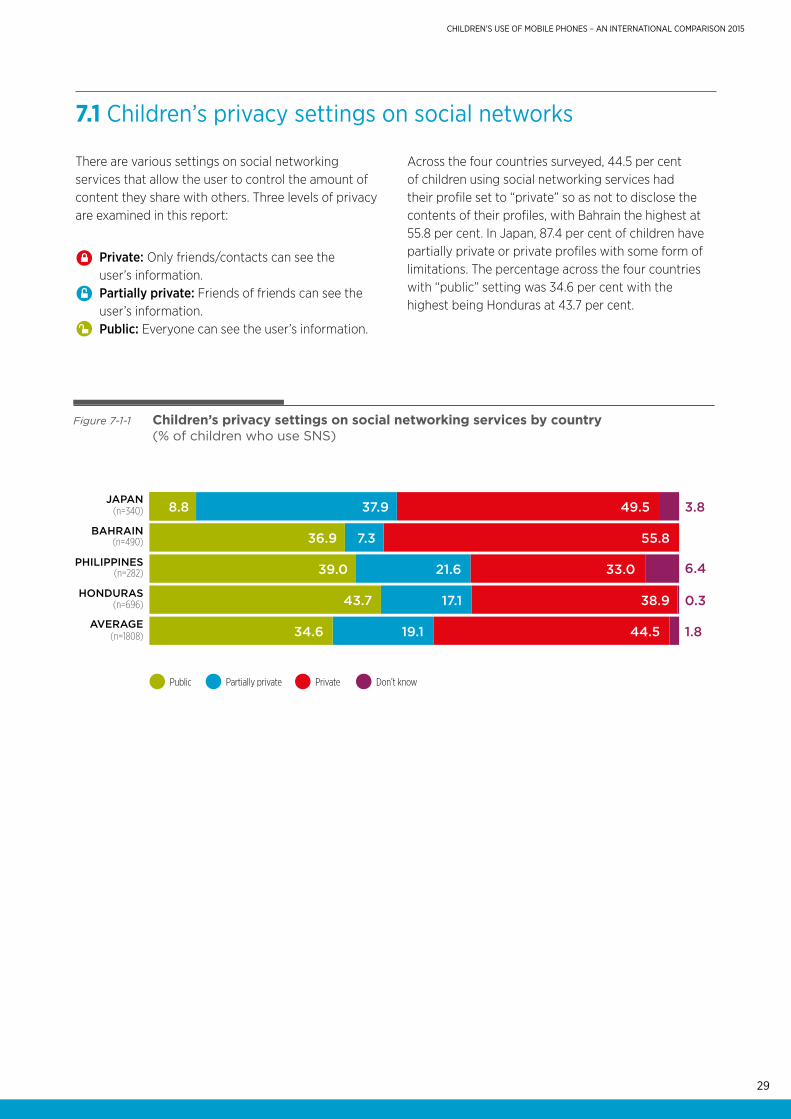
7.1 Children’s privacy settings on social networks
There are various settings on social networking services that allow the user to control the amount of content they share with others. Three levels of privacy are examined in this report:
Private: Only friends/contacts can see the user’s information.
Partially private: Friends of friends can see the user’s information.
Public: Everyone can see the user’s information.
Across the four countries surveyed, 44.5 per cent of children using social networking services had their profile set to “private” so as not to disclose the contents of their profiles, with Bahrain the highest at 55.8 per cent. In Japan, 87.4 per cent of children have partially private or private profiles with some form of limitations. The percentage across the four countries with “public” setting was 34.6 per cent with the highest being Honduras at 43.7 per cent.
Figure 7-1-1 Children’s privacy settings on social networking services by country (% of children who use SNS)
Public Partially private Private Don’t know
(n=340)JAPAN
PHILIPPINES(n=282)
BAHRAIN(n=490)
HONDURAS(n=696)
AVERAGE(n=1808)
8.8
36.9
39.0
43.7
34.6 19.1 44.5
17.1 38.9
21.6 33.0
7.3 55.8
37.9 49.5 3.8
6.4
0.3
1.8
30
CHILDREN’S USE OF MOBILE PHONES – AN INTERNATIONAL COMPARISON 2015
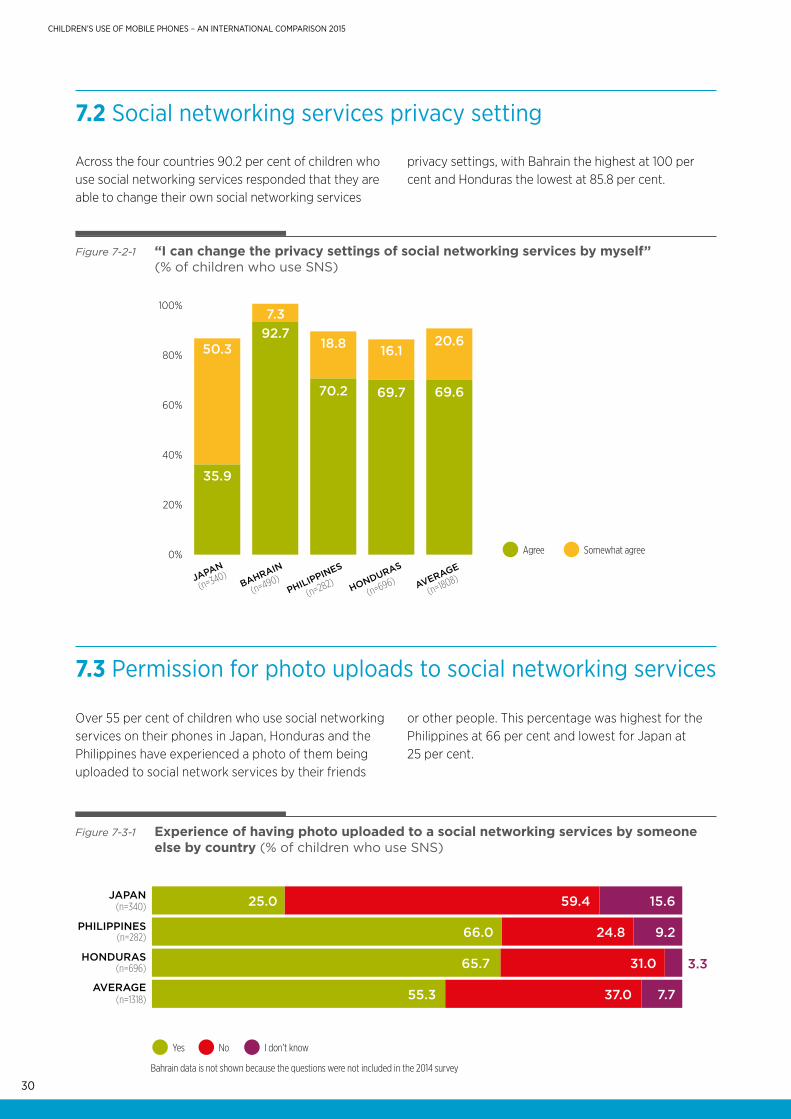
Figure 7-2-1 “I can change the privacy settings of social networking services by myself” (% of children who use SNS)
Agree Somewhat agree0%
20%
40%
60%
80%
100%
JAPAN
(n=340)BAHRAIN
(n=490)PHILIPPINES
(n=282) HONDURAS
(n=696) AVERAGE
(n=1808)
50.3
7.392.7
18.8
70.2
16.1
69.7
20.6
69.6
35.9
7.2 Social networking services privacy setting
7.3 Permission for photo uploads to social networking services
Across the four countries 90.2 per cent of children who use social networking services responded that they are able to change their own social networking services
privacy settings, with Bahrain the highest at 100 per cent and Honduras the lowest at 85.8 per cent.
Over 55 per cent of children who use social networking services on their phones in Japan, Honduras and the Philippines have experienced a photo of them being uploaded to social network services by their friends
or other people. This percentage was highest for the Philippines at 66 per cent and lowest for Japan at 25 per cent.
Figure 7-3-1 Experience of having photo uploaded to a social networking services by someone else by country (% of children who use SNS)
Yes No I don’t know
(n=340)JAPAN
PHILIPPINES(n=282)
HONDURAS(n=696)
AVERAGE(n=1318)
25.0 59.4 15.6
66.0
65.7
55.3 37.0
31.0
24.8 9.2
7.7
3.3
Bahrain data is not shown because the questions were not included in the 2014 survey
31
CHILDREN’S USE OF MOBILE PHONES – AN INTERNATIONAL COMPARISON 2015
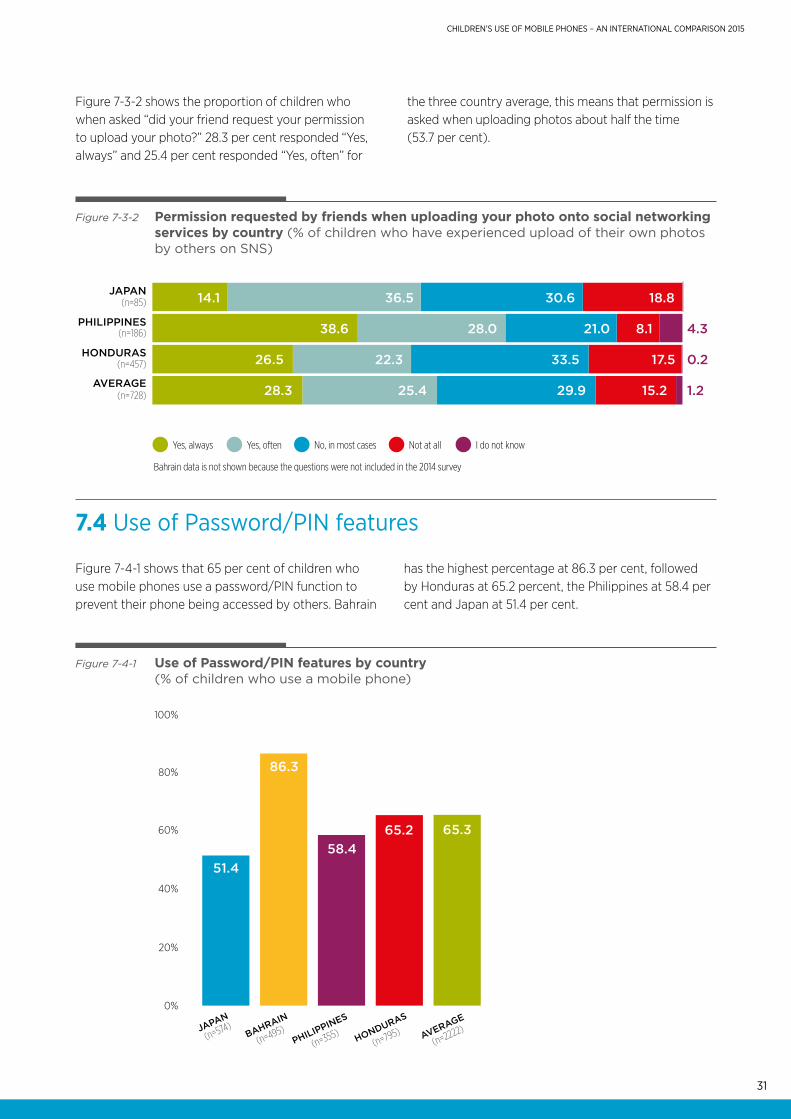
Figure 7-3-2 shows the proportion of children who when asked “did your friend request your permission to upload your photo?” 28.3 per cent responded “Yes, always” and 25.4 per cent responded “Yes, often” for
the three country average, this means that permission is asked when uploading photos about half the time (53.7 per cent).
7.4 Use of Password/PIN features
Figure 7-4-1 shows that 65 per cent of children who use mobile phones use a password/PIN function to prevent their phone being accessed by others. Bahrain
has the highest percentage at 86.3 per cent, followed by Honduras at 65.2 percent, the Philippines at 58.4 per cent and Japan at 51.4 per cent.
Figure 7-3-2 Permission requested by friends when uploading your photo onto social networking services by country (% of children who have experienced upload of their own photos by others on SNS)
Yes, always Yes, often No, in most cases Not at all I do not know
(n=85)JAPAN
PHILIPPINES(n=186)
HONDURAS(n=457)
AVERAGE(n=728)
14.1
38.6
26.5
28.3 25.4 29.9 15.2 1.2
22.3 33.5 17.5
28.0 21.0 8.1 4.3
36.5 30.6 18.8
0.2
Figure 7-4-1 Use of Password/PIN features by country (% of children who use a mobile phone)
JAPAN
(n=574)BAHRAIN
(n=495)PHILIPPINES
(n=355) HONDURAS
(n=795) AVERAGE
(n=2222)
0%
20%
40%
60%
80%
65.365.258.4
86.3
51.4
100%
Bahrain data is not shown because the questions were not included in the 2014 survey
32
CHILDREN’S USE OF MOBILE PHONES – AN INTERNATIONAL COMPARISON 2015
Key findings
44% of children responded that they have tried unsuccessfully to
spend less time on their mobile phone.
In most countries, children primarily seek advice from their parents when they have issues regarding mobile phone use (43 per cent). However, in Bahrain, children most frequently seek advice from friends.
40 per cent of parents have parental control functions activated on their children’s mobile phones.
of children say that having a mobile phone makes them feel more confident. However, the majority feel insecure or bothered when they don’t have their mobile phone.
DIGITAL LITERACY, PARENTAL CONTROLS AND CHILDREN’S WELLBEING
This chapter looks at children’s digital literacy in using mobile phones and the internet and explores where children go for advice. It also examines the extent of parental involvement in their children’s mobile and internet usage and the role that mobile technology plays in children’s wellbeing including whether it has a positive effect on their confidence and relationships.
870%
Nearly
Over 60 per cent of parents set rules on the timing and
location of when their children can use their
mobile phone.
45% of children responded that they have spent less time than they should with either
family, friends or doing schoolwork because of the time they spend on
their mobile phone.
33
CHILDREN’S USE OF MOBILE PHONES – AN INTERNATIONAL COMPARISON 2015
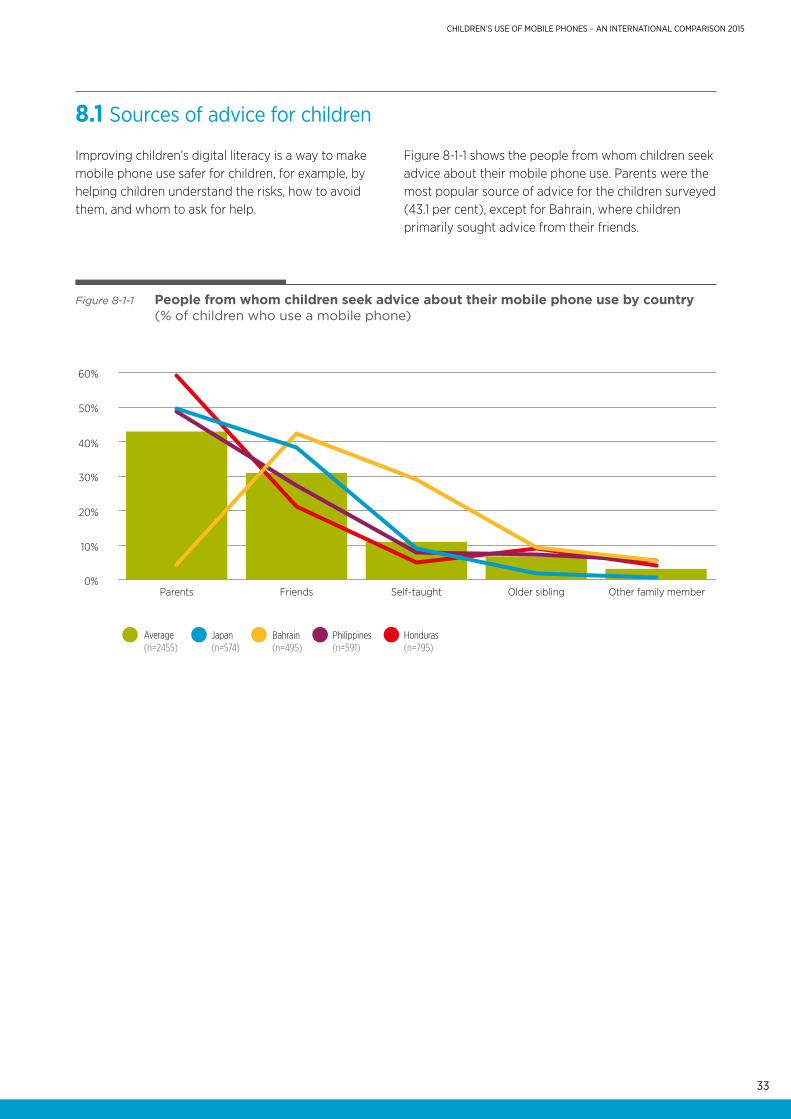
8.1 Sources of advice for children
Improving children’s digital literacy is a way to make mobile phone use safer for children, for example, by helping children understand the risks, how to avoid them, and whom to ask for help.
Figure 8-1-1 shows the people from whom children seek advice about their mobile phone use. Parents were the most popular source of advice for the children surveyed (43.1 per cent), except for Bahrain, where children primarily sought advice from their friends.
Figure 8-1-1 People from whom children seek advice about their mobile phone use by country (% of children who use a mobile phone)
Average(n=2455)
Japan(n=574)
Bahrain(n=495)
Philippines(n=591)
Honduras(n=795)
0%
10%
20%
30%
40%
50%
60%
Parents Friends Self-taught Older sibling Other family member
34
CHILDREN’S USE OF MOBILE PHONES – AN INTERNATIONAL COMPARISON 2015
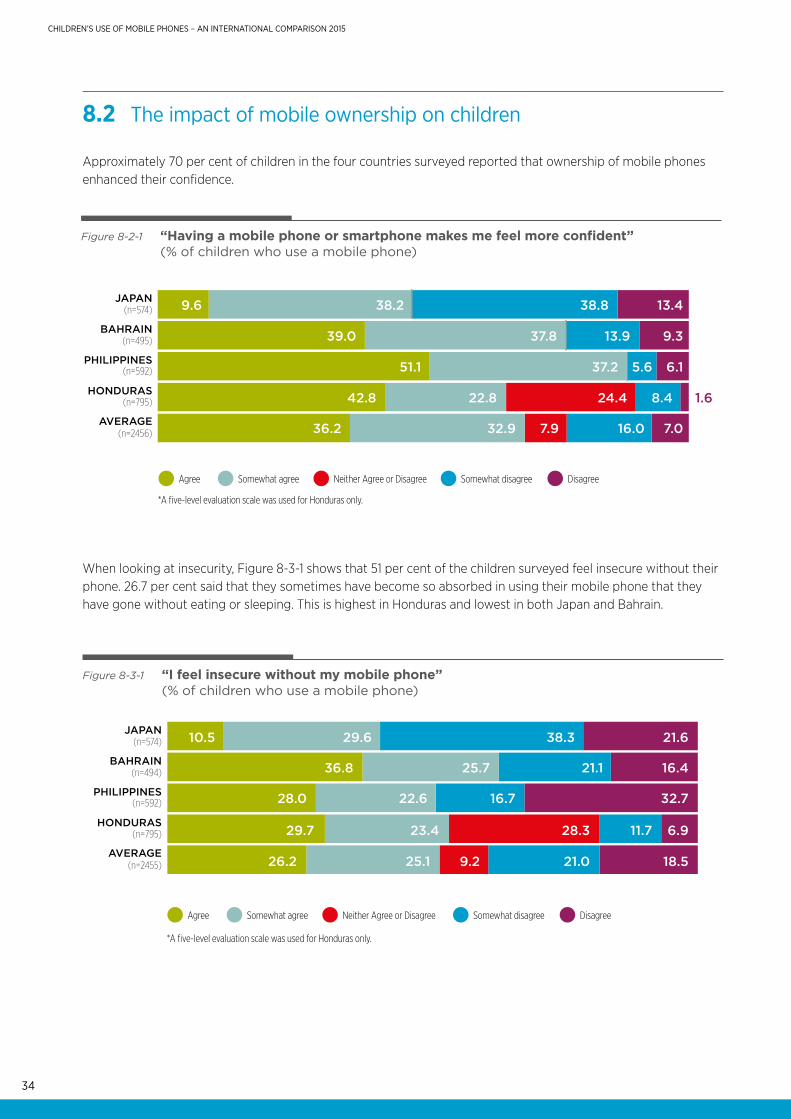
8.2 The impact of mobile ownership on children
Approximately 70 per cent of children in the four countries surveyed reported that ownership of mobile phones enhanced their confidence.
Agree Somewhat agree Neither Agree or Disagree Somewhat disagree Disagree
(n=574)JAPAN
(n=495)BAHRAIN
PHILIPPINES(n=592)
HONDURAS(n=795)
AVERAGE(n=2456)
9.6
39.0
42.8
36.2 32.9 7.9 16.0 7.0
22.8 24.4 8.4 1.6
51.1 37.2 5.6 6.1
37.8 13.9 9.3
38.2 38.8 13.4
Figure 8-2-1 “Having a mobile phone or smartphone makes me feel more confident” (% of children who use a mobile phone)
*A five-level evaluation scale was used for Honduras only.
When looking at insecurity, Figure 8-3-1 shows that 51 per cent of the children surveyed feel insecure without their phone. 26.7 per cent said that they sometimes have become so absorbed in using their mobile phone that they have gone without eating or sleeping. This is highest in Honduras and lowest in both Japan and Bahrain.
Agree Somewhat agree Neither Agree or Disagree Somewhat disagree Disagree
(n=574)JAPAN
(n=494)BAHRAIN
PHILIPPINES(n=592)
HONDURAS(n=795)
AVERAGE(n=2455)
10.5
36.8
28.0
29.7
26.2 25.1 9.2 21.0 18.5
23.4 28.3 11.7 6.9
22.6 16.7 32.7
25.7 21.1 16.4
29.6 38.3 21.6
Figure 8-3-1 “I feel insecure without my mobile phone” (% of children who use a mobile phone)
*A five-level evaluation scale was used for Honduras only.
35
CHILDREN’S USE OF MOBILE PHONES – AN INTERNATIONAL COMPARISON 2015
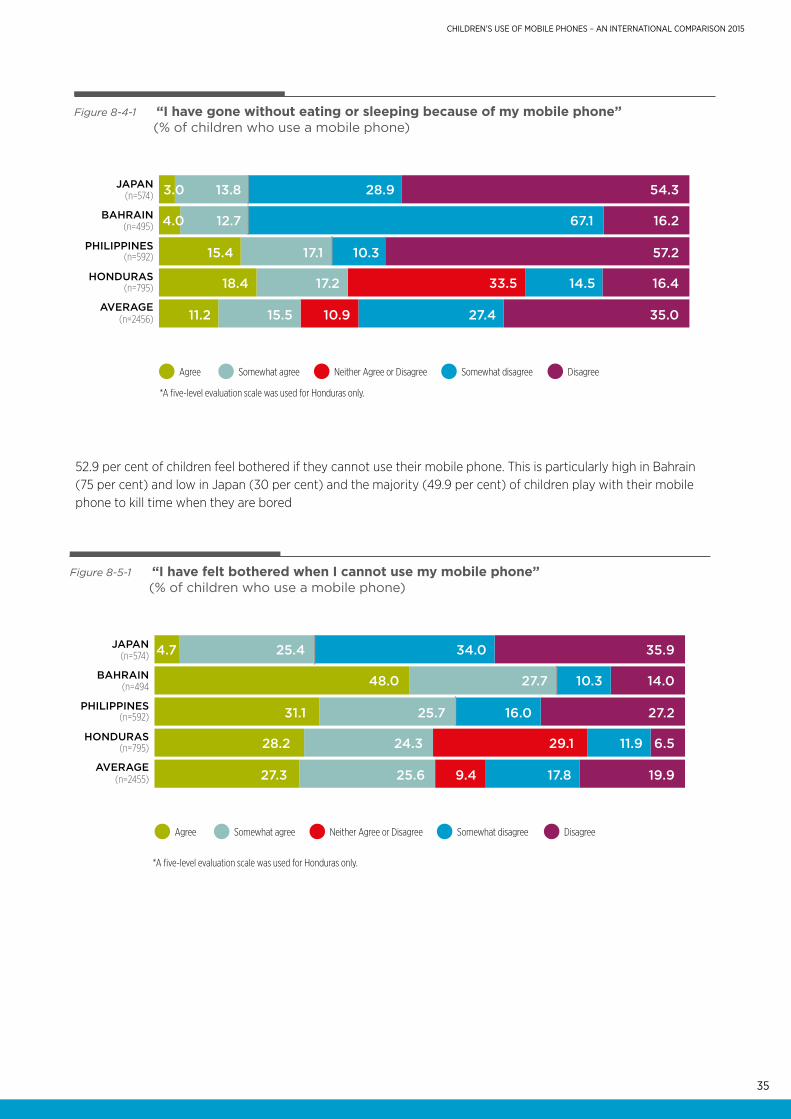
*A five-level evaluation scale was used for Honduras only.
Figure 8-5-1 “I have felt bothered when I cannot use my mobile phone” (% of children who use a mobile phone)
(n=574)JAPAN
(n=494BAHRAIN
PHILIPPINES(n=592)
HONDURAS(n=795)
AVERAGE(n=2455)
4.7
48.0
31.1
28.2
27.3 25.6 9.4 17.8 19.9
24.3 29.1 11.9 6.5
25.7 16.0 27.2
27.7 10.3 14.0
25.4 34.0 35.9
Agree Somewhat agree Neither Agree or Disagree Somewhat disagree Disagree
52.9 per cent of children feel bothered if they cannot use their mobile phone. This is particularly high in Bahrain (75 per cent) and low in Japan (30 per cent) and the majority (49.9 per cent) of children play with their mobile phone to kill time when they are bored
*A five-level evaluation scale was used for Honduras only.
Figure 8-4-1 “I have gone without eating or sleeping because of my mobile phone” (% of children who use a mobile phone)
(n=574)JAPAN
(n=495)BAHRAIN
PHILIPPINES(n=592)
HONDURAS(n=795)
AVERAGE(n=2456)
3.0
4.0
15.4
18.4
11.2 15.5 10.9 27.4 35.0
17.2 33.5 14.5 16.4
17.1 10.3 57.2
12.7 67.1 16.2
13.8 28.9 54.3
Agree Somewhat agree Neither Agree or Disagree Somewhat disagree Disagree
36
CHILDREN’S USE OF MOBILE PHONES – AN INTERNATIONAL COMPARISON 2015
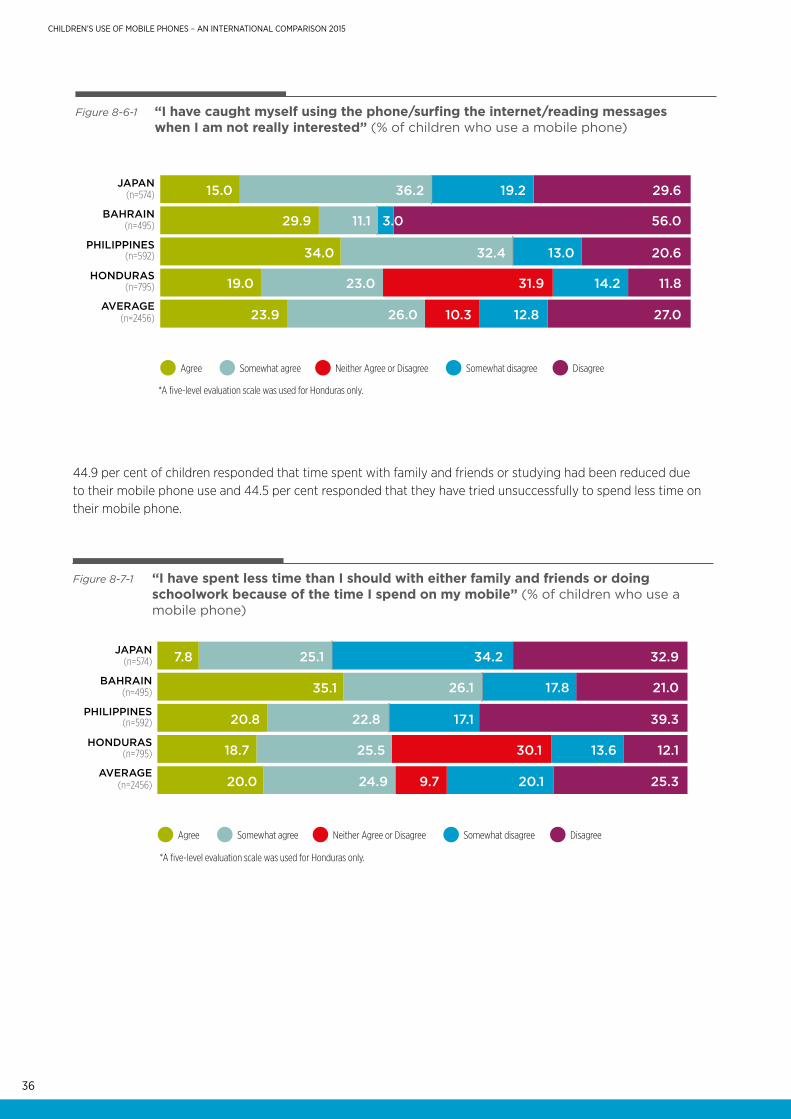
44.9 per cent of children responded that time spent with family and friends or studying had been reduced due to their mobile phone use and 44.5 per cent responded that they have tried unsuccessfully to spend less time on their mobile phone.
*A five-level evaluation scale was used for Honduras only.
Agree Somewhat agree Neither Agree or Disagree Somewhat disagree Disagree
(n=574)JAPAN
(n=495)BAHRAIN
PHILIPPINES(n=592)
HONDURAS(n=795)
AVERAGE(n=2456)
15.0
29.9 11.1 3.0
34.0
19.0
23.9 26.0 10.3 12.8 27.0
23.0 31.9 14.2 11.8
32.4 13.0 20.6
56.0
36.2 19.2 29.6
Figure 8-6-1 “I have caught myself using the phone/surfing the internet/reading messages when I am not really interested” (% of children who use a mobile phone)
Agree Somewhat agree Neither Agree or Disagree Somewhat disagree Disagree
(n=574)JAPAN
(n=495)BAHRAIN
PHILIPPINES(n=592)
HONDURAS(n=795)
AVERAGE(n=2456)
7.8
35.1 26.1 17.8
20.8
18.7
20.0 24.9 9.7 20.1 25.3
25.5 30.1 13.6 12.1
22.8 17.1 39.3
21.0
25.1 34.2 32.9
Figure 8-7-1 “I have spent less time than I should with either family and friends or doing schoolwork because of the time I spend on my mobile” (% of children who use a mobile phone)
*A five-level evaluation scale was used for Honduras only.
37
CHILDREN’S USE OF MOBILE PHONES – AN INTERNATIONAL COMPARISON 2015
*A five-level evaluation scale was used for Honduras only.
Agree Somewhat agree Neither Agree or Disagree Somewhat disagree Disagree
(n=574)JAPAN
(n=495)BAHRAIN
PHILIPPINES(n=592)
HONDURAS(n=795)
AVERAGE(n=2456)
6.1
24.2 25.9 25.9
28.1
20.8
19.8 24.7 11.0 21.1 23.4
21.3 33.9 12.1 11.9
26.4 19.3 26.2
24.0
26.7 31.4 35.8
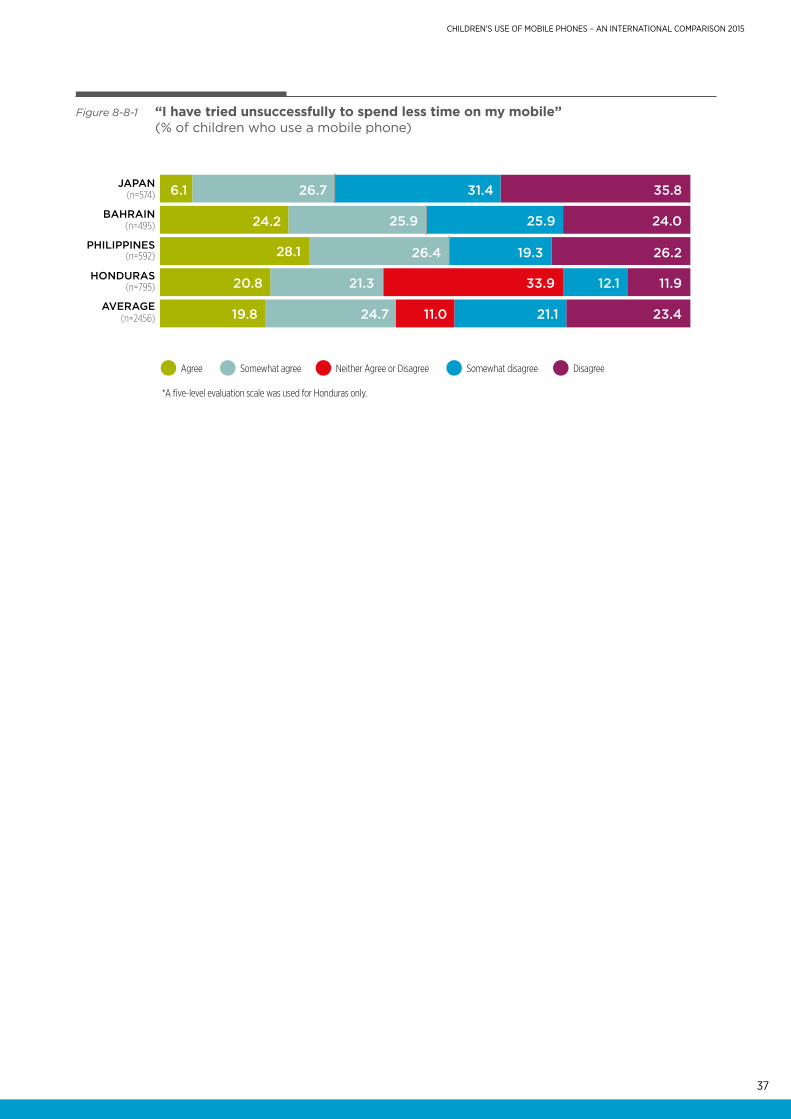
Figure 8-8-1 “I have tried unsuccessfully to spend less time on my mobile” (% of children who use a mobile phone)
38
CHILDREN’S USE OF MOBILE PHONES – AN INTERNATIONAL COMPARISON 2015
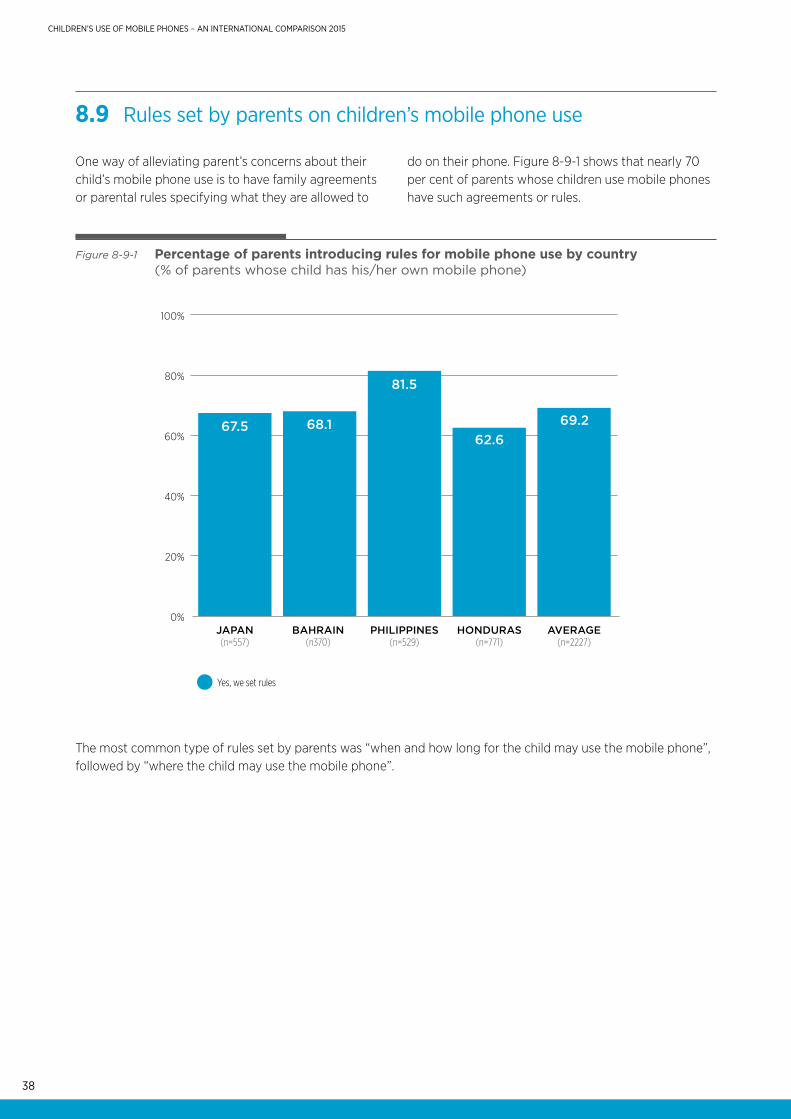
8.9 Rules set by parents on children’s mobile phone use
One way of alleviating parent’s concerns about their child’s mobile phone use is to have family agreements or parental rules specifying what they are allowed to
do on their phone. Figure 8-9-1 shows that nearly 70 per cent of parents whose children use mobile phones have such agreements or rules.
The most common type of rules set by parents was “when and how long for the child may use the mobile phone”, followed by “where the child may use the mobile phone”.
Figure 8-9-1 Percentage of parents introducing rules for mobile phone use by country (% of parents whose child has his/her own mobile phone)
0%
20%
40%
60%
80%
100%
JAPAN(n=557)
BAHRAIN(n370)
PHILIPPINES(n=529)
HONDURAS(n=771)
AVERAGE(n=2227)
67.5 68.1
81.5
62.669.2
Yes, we set rules
39
CHILDREN’S USE OF MOBILE PHONES – AN INTERNATIONAL COMPARISON 2015
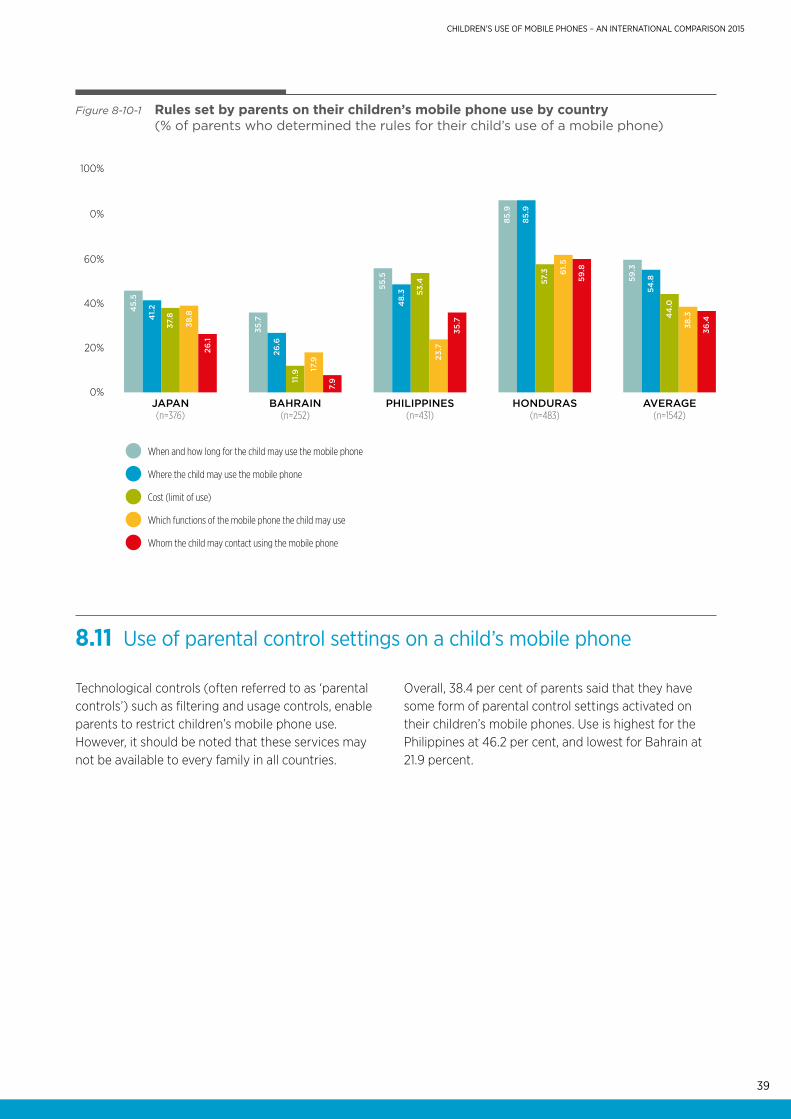
When and how long for the child may use the mobile phone
Where the child may use the mobile phone
Cost (limit of use)
Which functions of the mobile phone the child may use
Whom the child may contact using the mobile phone
0%
20%
40%
60%
0%
100%
JAPAN(n=376)
45.
5
41.
2
37.8
38.8
26.1
AVERAGE(n=1542)
59.3
54.8
44
.0
38.3
36.4
BAHRAIN(n=252)
35.7
26.6
11.9
17.9
7.9
PHILIPPINES(n=431)
55.5
48.
3 53.4
23.7
35.7
HONDURAS(n=483)
85.9
85.9
57.3 6
1.5
59.8
Figure 8-10-1 Rules set by parents on their children’s mobile phone use by country (% of parents who determined the rules for their child’s use of a mobile phone)
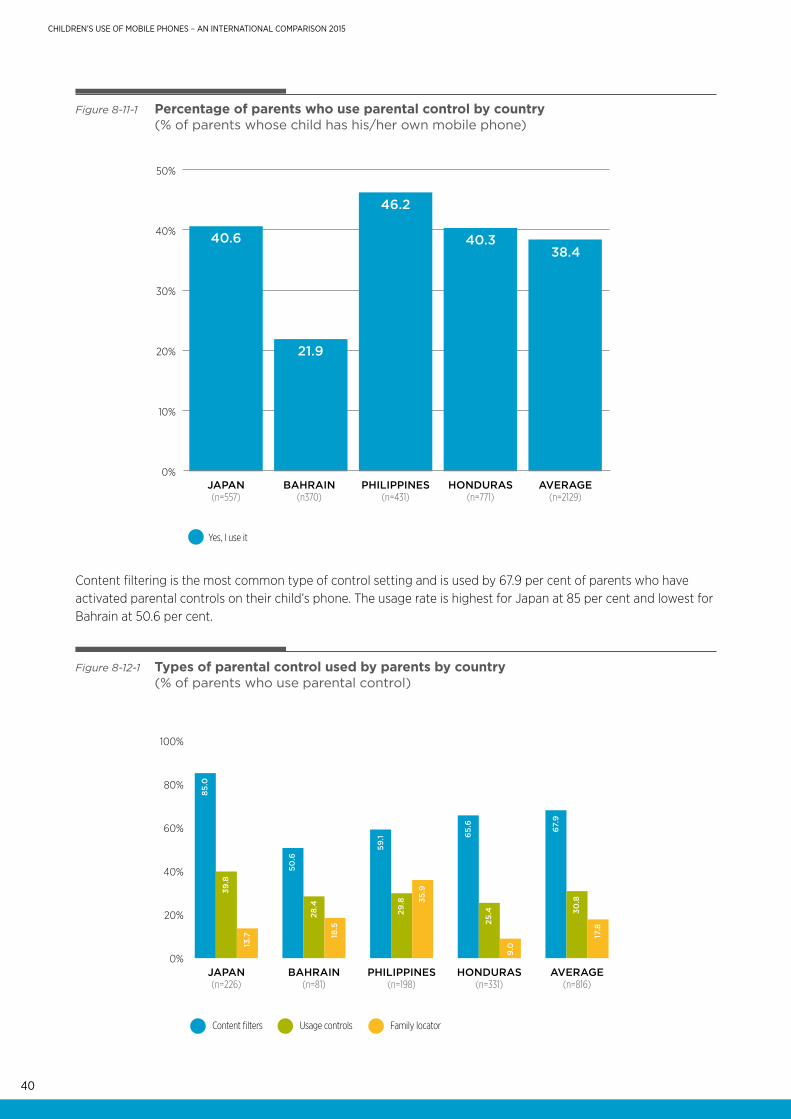
8.11 Use of parental control settings on a child’s mobile phone
Technological controls (often referred to as ‘parental controls’) such as filtering and usage controls, enable parents to restrict children’s mobile phone use. However, it should be noted that these services may not be available to every family in all countries.
Overall, 38.4 per cent of parents said that they have some form of parental control settings activated on their children’s mobile phones. Use is highest for the Philippines at 46.2 per cent, and lowest for Bahrain at 21.9 percent.
40
CHILDREN’S USE OF MOBILE PHONES – AN INTERNATIONAL COMPARISON 2015
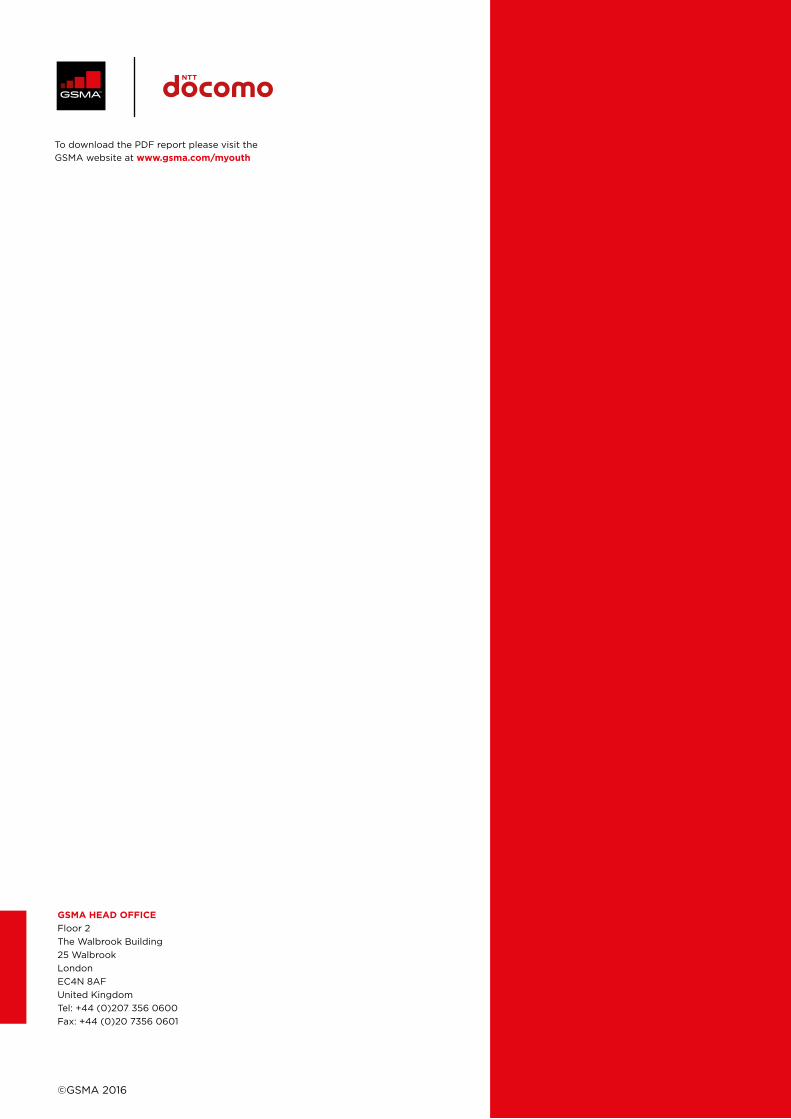
Content filtering is the most common type of control setting and is used by 67.9 per cent of parents who have activated parental controls on their child’s phone. The usage rate is highest for Japan at 85 per cent and lowest for Bahrain at 50.6 per cent.
Figure 8-11-1 Percentage of parents who use parental control by country (% of parents whose child has his/her own mobile phone)
0%
10%
20%
30%
40%
50%
JAPAN(n=557)
BAHRAIN(n370)
PHILIPPINES(n=431)
HONDURAS(n=771)
AVERAGE(n=2129)
40.6
21.9
46.2
40.338.4
Yes, I use it
Figure 8-12-1 Types of parental control used by parents by country (% of parents who use parental control)
Family locatorUsage controlsContent filters
0%
20%
40%
60%
80%
100%
JAPAN(n=226)
BAHRAIN(n=81)
PHILIPPINES(n=198)
HONDURAS(n=331)
AVERAGE(n=816)
85.0
50.6
59.1
29.8 35
.9
65.
6
25.4
9.0
67.9
30.8
17.8
28.4
18.5
39.8
13.7

41
CHILDREN’S USE OF MOBILE PHONES – AN INTERNATIONAL COMPARISON 2015
To download the PDF report please visit the GSMA website at www.gsma.com/myouth
GSMA HEAD OFFICEFloor 2The Walbrook Building 25 WalbrookLondonEC4N 8AFUnited KingdomTel: +44 (0)207 356 0600Fax: +44 (0)20 7356 0601
©GSMA 2016