Embed Size (px)
Citation preview
1
American Society of Sugar Cane Technologists29th Annual Joint Meeting of the Florida and Louisiana Divisions
June 16 - 18, 1999Ft. Walton Beach, Florida
Cane Factory Process Modeling using Sugars™ for Windows®
L. Warner WeissSugars International LLC
30 Glenmoor DriveEnglewood, Colorado 80110 USA
Phone: (303) 761-8442Fax: (303) 761-8048
Email: [email protected] Site: www.sugarsintl.com/sugars
ABSTRACT
The Sugars™ computer program is used extensively for sugar process modeling and simulationto make improvements to existing factories, or design new factories. The new Windows®version of Sugars features a full graphical interface that uses drag-and-drop techniques to drawthe flow diagram and build a model of the process. It is fast, flexible and very user-friendly.Stencils containing shapes of stations are provided with the program and these shapes are used todraw the flow diagram. Connections are made between shapes using a connector tool withautomatic line routing and crossovers. Data for each station and flow stream in the model isentered on dialog screens that are displayed by double clicking on the station shape, or flowstream. All of the data for a model is stored in a Microsoft® Access database that can beaddressed by other programs. Heat, material and color balances are quickly obtained fromsimulations of the model to predict the performance results for the process. A revenue screenshows the net process revenues generated by the process to assist with financial decisions. Thenew Sugars for Windows computer program is a major upgrade to assist cane sugar factory andrefinery process engineers and management with decisions for making improvements to theiroperations.
2
INTRODUCTION
The Sugars™ Computer Program is used to model sugar factories and refineries, and it hassuccessfully modeled thousands of sugar processes since it was first introduced in 1986. It is areliable program that is used by sugar companies and engineering firms to improve existingfactories, or to design new ones. Sugars is the most widely used program in the world formodeling and simulating sugar processes.
Originally, the program was designed with a text-based interface for IBM compatible personalcomputers using the DOS operating system. A flow diagram was made of the process model forsimulation by using a separate CAD, or diagramming program. The flow diagram was used as areference to build text files with a text editor to describe the model for simulation by Sugars.This method worked well for users that were familiar with personal computers, and simulationsfrom Sugars were found to be an accurate representation of the process. However, modernWindows® based software provides opportunities for dramatic improvements in the userinterface and tools were developed that made it possible to integrate the drawing and modelbuilding steps.
In August of 1997, Visio Corporation released version 5.0 of their diagramming software. TheVisio® program was known to be an excellent program for making process flow diagrams;however, it lacked some of the necessary features for integration with Sugars until the release ofversion 5. Once it was determined that this new release had the necessary functionality,development work was directed to a new Windows version of Sugars that would use Visio togive Sugars a robust graphical interface. Early versions of the integrated programs were shownlast year at the SIT meeting in Marseille, France and at the ICUMSA meeting in Berlin,Germany. A beta test version of the new program was released in December 1998 to some sugarcompanies in the USA and the first showing of the complete program was made at the ASSBTmeeting on February 11, 1999 in Orlando, Florida. The new Sugars for Windows program is anexciting change. Now, using Sugars, it is a simple procedure to build a model and obtainmaterial, energy and color balances that can be used to evaluate a process.
NEW USER INTERFACE
The new graphical interface for Sugars makes model building a simple matter of dragging pre-drawn shapes from a Shapes Stencil to the drawing surface. The shapes are designed torepresent stations for modeling the process by Sugars. Connections between the shapes aredrawn using a connection tool that automatically routes connections between associated stations.Data entry dialogs for controlling the performance of each station are displayed by doubleclicking on the station shape. Flow stream properties are entered and displayed on a dialogscreen by double clicking on the flow stream. Sugars for Windows is now a fully functioningWindows 95/98/NT program that gives all of the benefits to a user that are available in theWindows environment; such as, drop-down menus, online help, print preview, scrolling, objectdesign and database storage. It is a dramatic change for users of Sugars and it makes theprogram much easier to learn and use while still providing all of the flexibility needed formodeling sugar processes.
Ththanamdrothethaconouwi
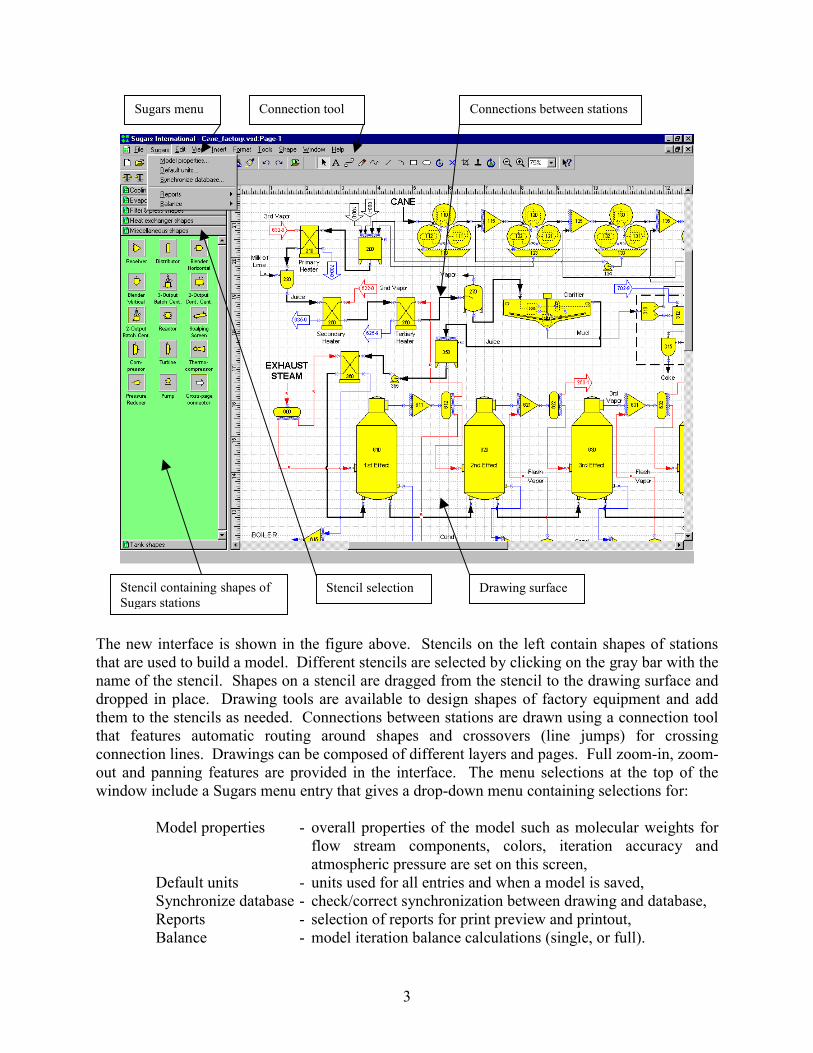
Sugars menu Connection tool Connections between stations
Stencil selection Drawing surface
Stencil containing shapes ofSugars stations3
e new interface is shown in the figure above. Stencils on the left contain shapes of stationst are used to build a model. Different stencils are selected by clicking on the gray bar with thee of the stencil. Shapes on a stencil are dragged from the stencil to the drawing surface and
pped in place. Drawing tools are available to design shapes of factory equipment and addm to the stencils as needed. Connections between stations are drawn using a connection toolt features automatic routing around shapes and crossovers (line jumps) for crossingnection lines. Drawings can be composed of different layers and pages. Full zoom-in, zoom-
t and panning features are provided in the interface. The menu selections at the top of thendow include a Sugars menu entry that gives a drop-down menu containing selections for:
Model properties - overall properties of the model such as molecular weights forflow stream components, colors, iteration accuracy andatmospheric pressure are set on this screen,
Default units - units used for all entries and when a model is saved,Synchronize database - check/correct synchronization between drawing and database,Reports - selection of reports for print preview and printout,Balance - model iteration balance calculations (single, or full).
4
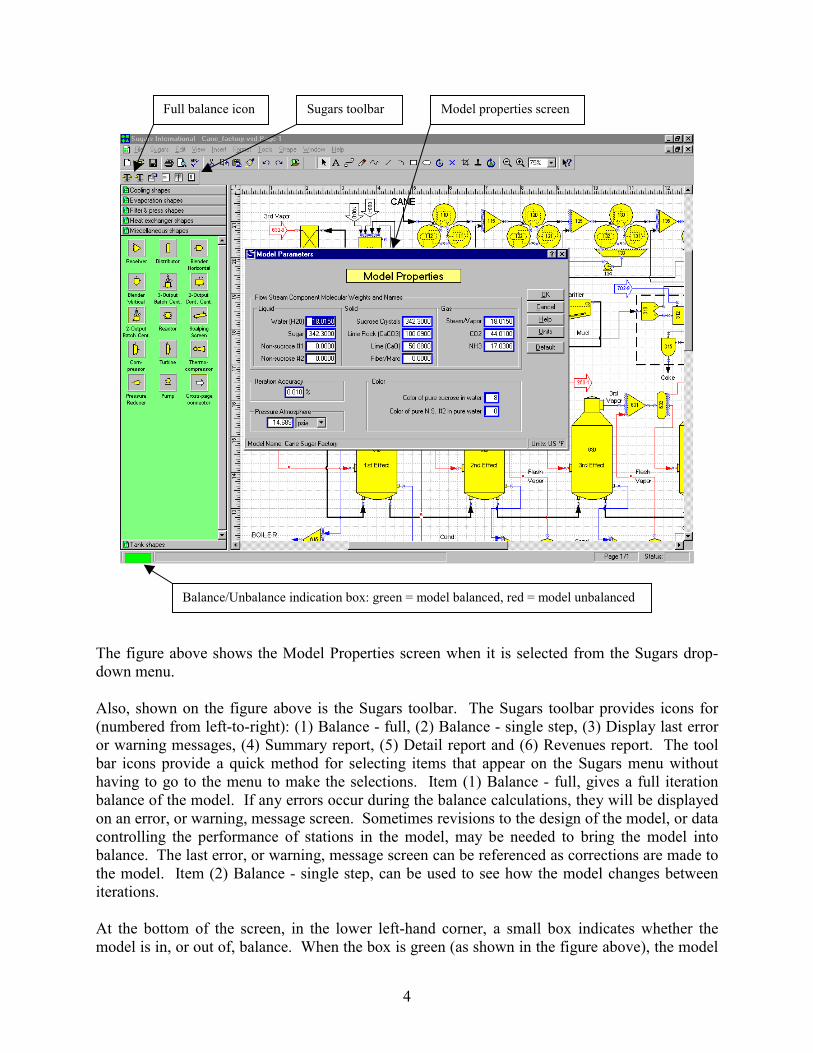
The figure above shows the Model Properties screen when it is selected from the Sugars drop-down menu.
Also, shown on the figure above is the Sugars toolbar. The Sugars toolbar provides icons for(numbered from left-to-right): (1) Balance - full, (2) Balance - single step, (3) Display last erroror warning messages, (4) Summary report, (5) Detail report and (6) Revenues report. The toolbar icons provide a quick method for selecting items that appear on the Sugars menu withouthaving to go to the menu to make the selections. Item (1) Balance - full, gives a full iterationbalance of the model. If any errors occur during the balance calculations, they will be displayedon an error, or warning, message screen. Sometimes revisions to the design of the model, or datacontrolling the performance of stations in the model, may be needed to bring the model intobalance. The last error, or warning, message screen can be referenced as corrections are made tothe model. Item (2) Balance - single step, can be used to see how the model changes betweeniterations.
At the bottom of the screen, in the lower left-hand corner, a small box indicates whether themodel is in, or out of, balance. When the box is green (as shown in the figure above), the model
Model properties screenSugars toolbar
Balance/Unbalance indication box: green = model balanced, red = model unbalanced
Full balance icon
5
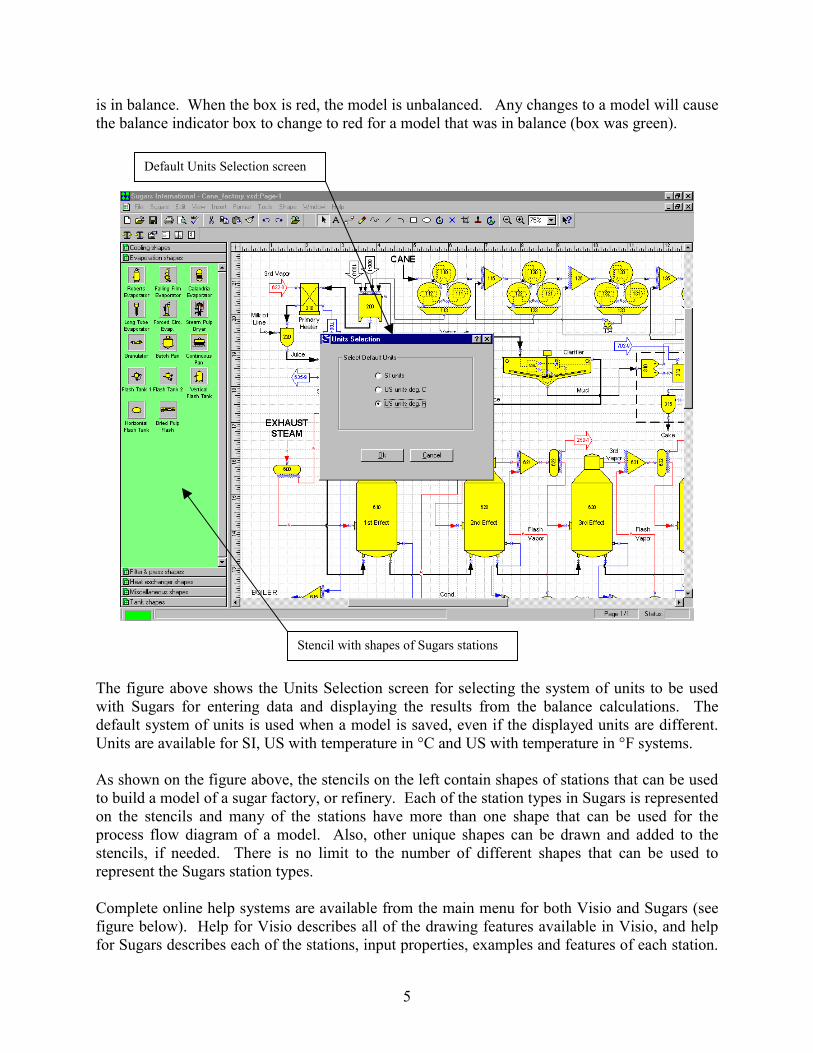
is in balance. When the box is red, the model is unbalanced. Any changes to a model will causethe balance indicator box to change to red for a model that was in balance (box was green).
The figure above shows the Units Selection screen for selecting the system of units to be usedwith Sugars for entering data and displaying the results from the balance calculations. Thedefault system of units is used when a model is saved, even if the displayed units are different.Units are available for SI, US with temperature in °C and US with temperature in °F systems.
As shown on the figure above, the stencils on the left contain shapes of stations that can be usedto build a model of a sugar factory, or refinery. Each of the station types in Sugars is representedon the stencils and many of the stations have more than one shape that can be used for theprocess flow diagram of a model. Also, other unique shapes can be drawn and added to thestencils, if needed. There is no limit to the number of different shapes that can be used torepresent the Sugars station types.
Complete online help systems are available from the main menu for both Visio and Sugars (seefigure below). Help for Visio describes all of the drawing features available in Visio, and helpfor Sugars describes each of the stations, input properties, examples and features of each station.
Default Units Selection screen
Stencil with shapes of Sugars stations
6
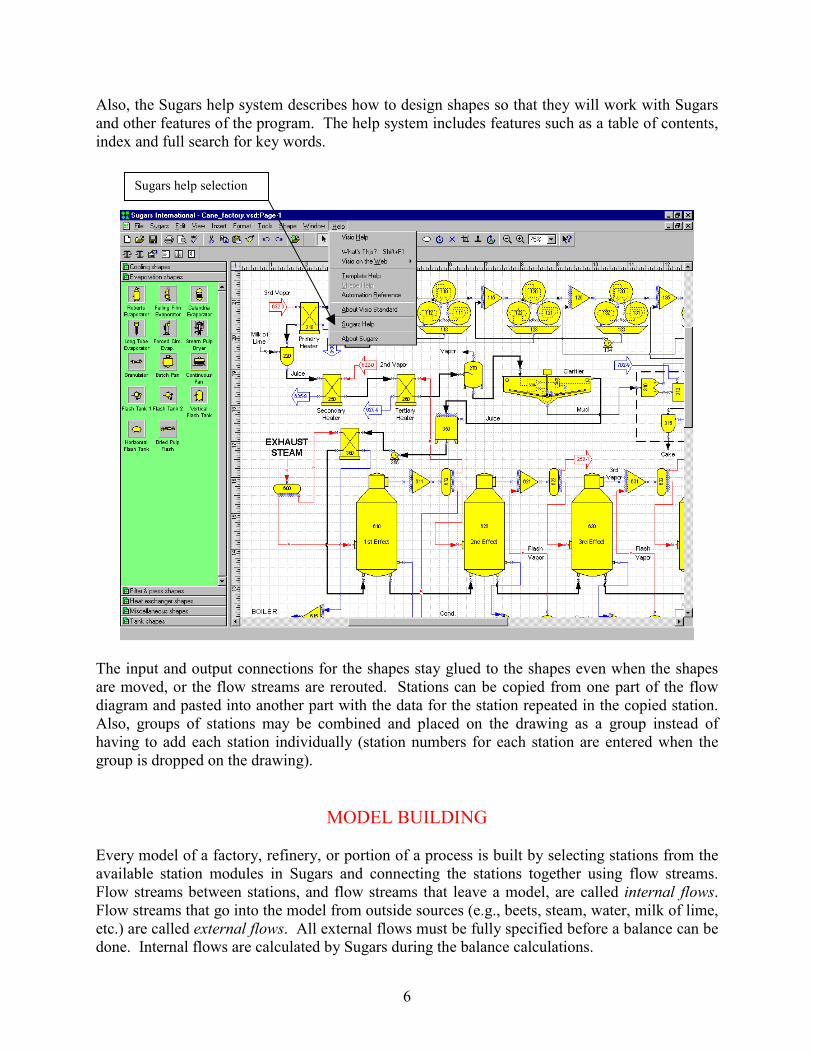
Also, the Sugars help system describes how to design shapes so that they will work with Sugarsand other features of the program. The help system includes features such as a table of contents,index and full search for key words.
The input and output connections for the shapes stay glued to the shapes even when the shapesare moved, or the flow streams are rerouted. Stations can be copied from one part of the flowdiagram and pasted into another part with the data for the station repeated in the copied station.Also, groups of stations may be combined and placed on the drawing as a group instead ofhaving to add each station individually (station numbers for each station are entered when thegroup is dropped on the drawing).
MODEL BUILDING
Every model of a factory, refinery, or portion of a process is built by selecting stations from theavailable station modules in Sugars and connecting the stations together using flow streams.Flow streams between stations, and flow streams that leave a model, are called internal flows.Flow streams that go into the model from outside sources (e.g., beets, steam, water, milk of lime,etc.) are called external flows. All external flows must be fully specified before a balance can bedone. Internal flows are calculated by Sugars during the balance calculations.
Sugars help selection
7
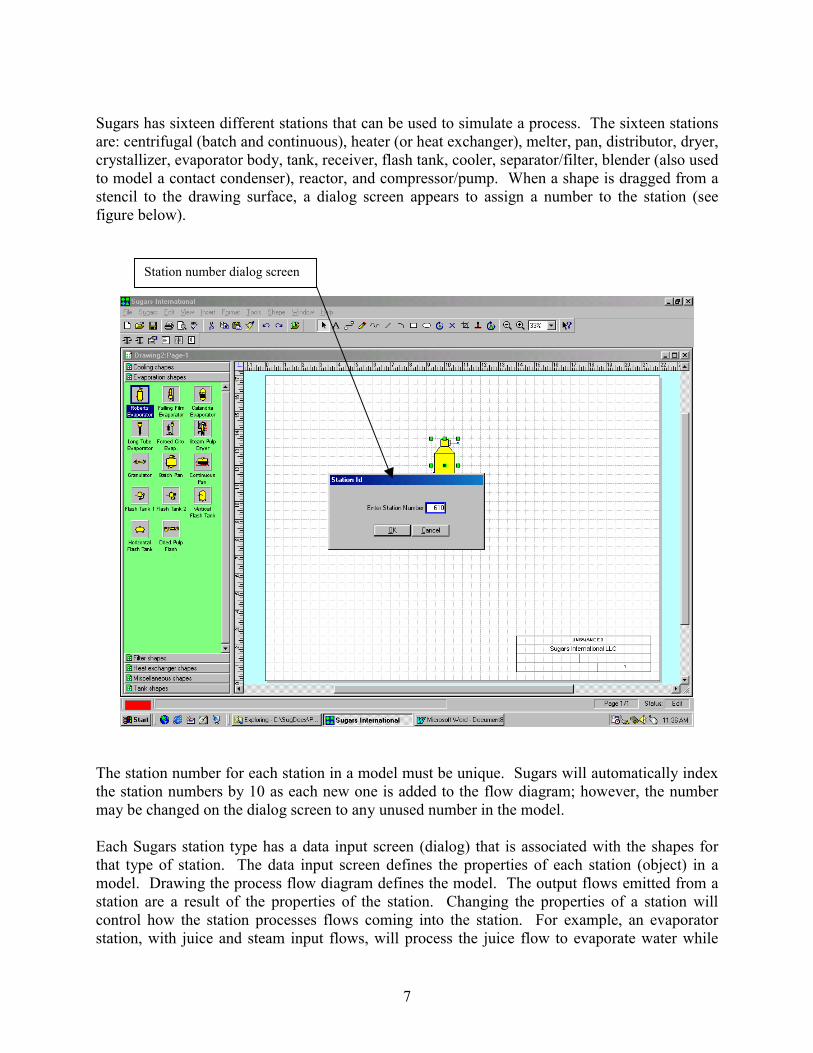
Sugars has sixteen different stations that can be used to simulate a process. The sixteen stationsare: centrifugal (batch and continuous), heater (or heat exchanger), melter, pan, distributor, dryer,crystallizer, evaporator body, tank, receiver, flash tank, cooler, separator/filter, blender (also usedto model a contact condenser), reactor, and compressor/pump. When a shape is dragged from astencil to the drawing surface, a dialog screen appears to assign a number to the station (seefigure below).
The station number for each station in a model must be unique. Sugars will automatically indexthe station numbers by 10 as each new one is added to the flow diagram; however, the numbermay be changed on the dialog screen to any unused number in the model.
Each Sugars station type has a data input screen (dialog) that is associated with the shapes forthat type of station. The data input screen defines the properties of each station (object) in amodel. Drawing the process flow diagram defines the model. The output flows emitted from astation are a result of the properties of the station. Changing the properties of a station willcontrol how the station processes flows coming into the station. For example, an evaporatorstation, with juice and steam input flows, will process the juice flow to evaporate water while
Station number dialog screen
8
using steam, or vapor, to boil the juice. Thus, the properties of the stations in a model and thecharacteristics of the external flows into the model control all of the internal flows betweenstations, and the flows leaving the model. Each station type has a properties dialog screen forentering the appropriate data, and a dialog screen is provided for entering the data to defineexternal flows into the model.
Shapes on the stencils are associated with their respective Sugars stations by naming the shapesin Visio with station names from Sugars and identifying the input and output ports for thestations. The Sugars help system provides full details on how to make shapes that can beidentified by Sugars.
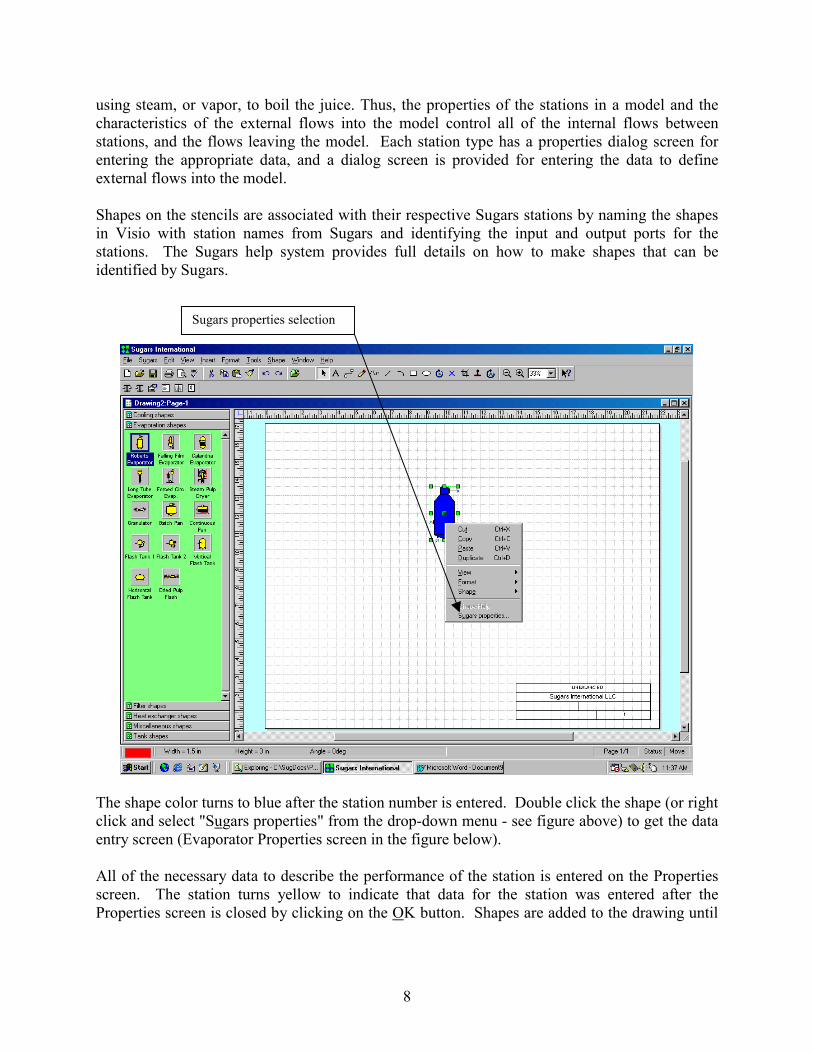
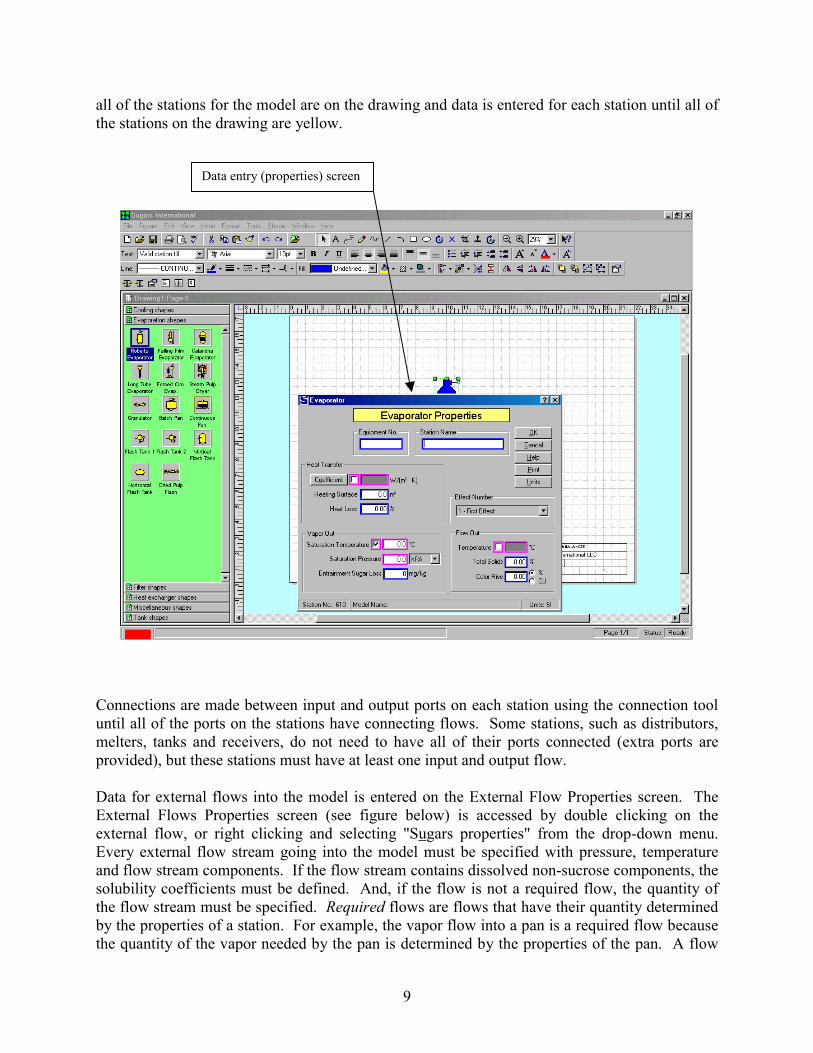
The shape color turns to blue after the station number is entered. Double click the shape (or rightclick and select "Sugars properties" from the drop-down menu - see figure above) to get the dataentry screen (Evaporator Properties screen in the figure below).
All of the necessary data to describe the performance of the station is entered on the Propertiesscreen. The station turns yellow to indicate that data for the station was entered after theProperties screen is closed by clicking on the OK button. Shapes are added to the drawing until
Sugars properties selection
9
all of the stations for the model are on the drawing and data is entered for each station until all ofthe stations on the drawing are yellow.
Connections are made between input and output ports on each station using the connection tooluntil all of the ports on the stations have connecting flows. Some stations, such as distributors,melters, tanks and receivers, do not need to have all of their ports connected (extra ports areprovided), but these stations must have at least one input and output flow.
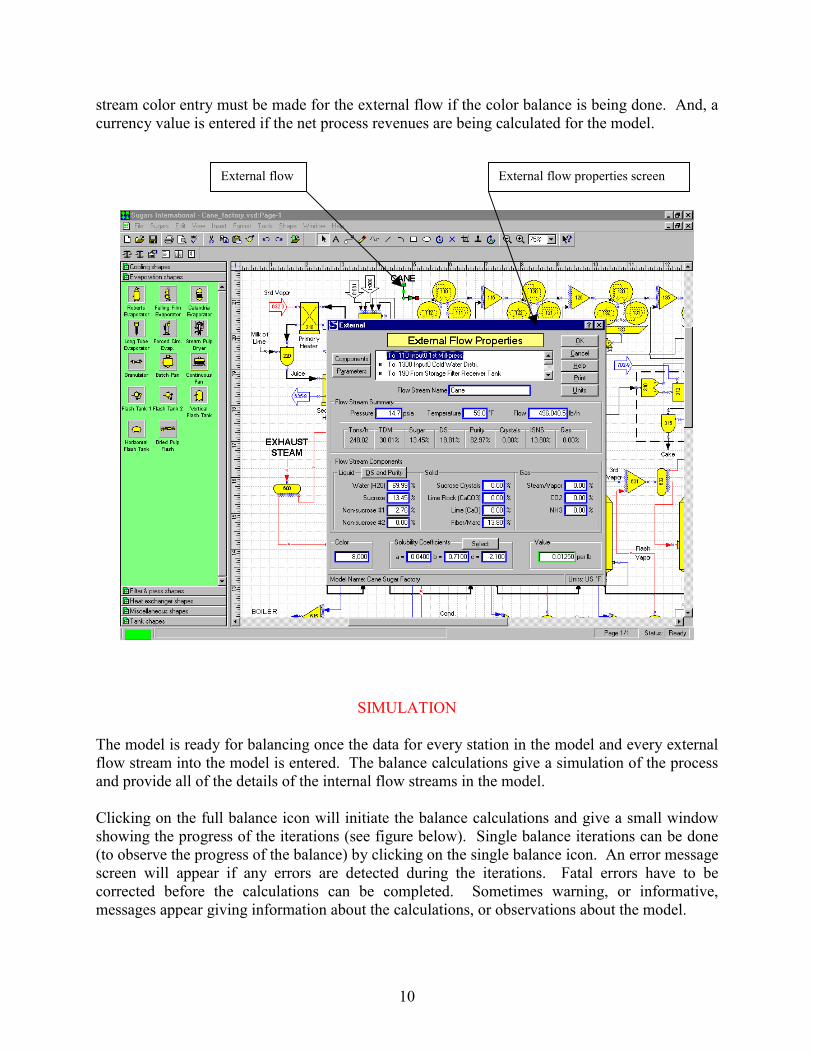
Data for external flows into the model is entered on the External Flow Properties screen. TheExternal Flows Properties screen (see figure below) is accessed by double clicking on theexternal flow, or right clicking and selecting "Sugars properties" from the drop-down menu.Every external flow stream going into the model must be specified with pressure, temperatureand flow stream components. If the flow stream contains dissolved non-sucrose components, thesolubility coefficients must be defined. And, if the flow is not a required flow, the quantity ofthe flow stream must be specified. Required flows are flows that have their quantity determinedby the properties of a station. For example, the vapor flow into a pan is a required flow becausethe quantity of the vapor needed by the pan is determined by the properties of the pan. A flow
Data entry (properties) screen
10
stream color entry must be made for the external flow if the color balance is being done. And, acurrency value is entered if the net process revenues are being calculated for the model.
SIMULATION
The model is ready for balancing once the data for every station in the model and every externalflow stream into the model is entered. The balance calculations give a simulation of the processand provide all of the details of the internal flow streams in the model.
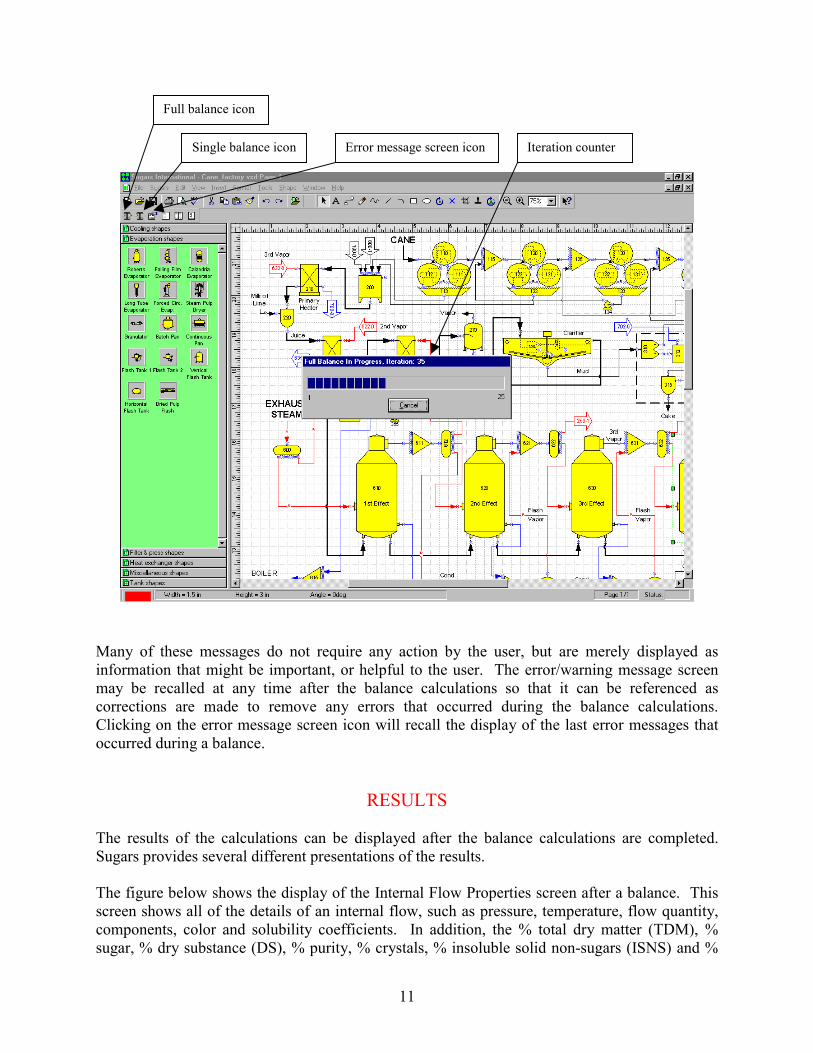
Clicking on the full balance icon will initiate the balance calculations and give a small windowshowing the progress of the iterations (see figure below). Single balance iterations can be done(to observe the progress of the balance) by clicking on the single balance icon. An error messagescreen will appear if any errors are detected during the iterations. Fatal errors have to becorrected before the calculations can be completed. Sometimes warning, or informative,messages appear giving information about the calculations, or observations about the model.
External flow properties screenExternal flow
11
Many of these messages do not require any action by the user, but are merely displayed asinformation that might be important, or helpful to the user. The error/warning message screenmay be recalled at any time after the balance calculations so that it can be referenced ascorrections are made to remove any errors that occurred during the balance calculations.Clicking on the error message screen icon will recall the display of the last error messages thatoccurred during a balance.
RESULTS
The results of the calculations can be displayed after the balance calculations are completed.Sugars provides several different presentations of the results.
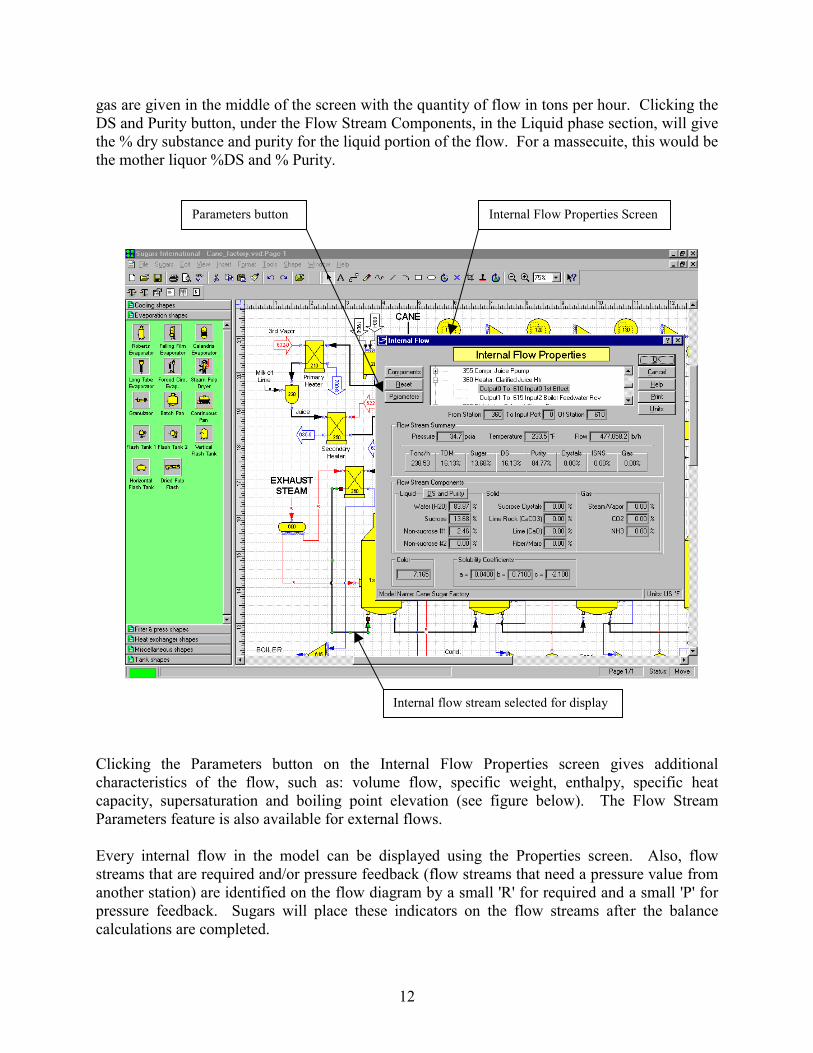
The figure below shows the display of the Internal Flow Properties screen after a balance. Thisscreen shows all of the details of an internal flow, such as pressure, temperature, flow quantity,components, color and solubility coefficients. In addition, the % total dry matter (TDM), %sugar, % dry substance (DS), % purity, % crystals, % insoluble solid non-sugars (ISNS) and %
Full balance icon
Iteration counterError message screen iconSingle balance icon
12
gas are given in the middle of the screen with the quantity of flow in tons per hour. Clicking theDS and Purity button, under the Flow Stream Components, in the Liquid phase section, will givethe % dry substance and purity for the liquid portion of the flow. For a massecuite, this would bethe mother liquor %DS and % Purity.
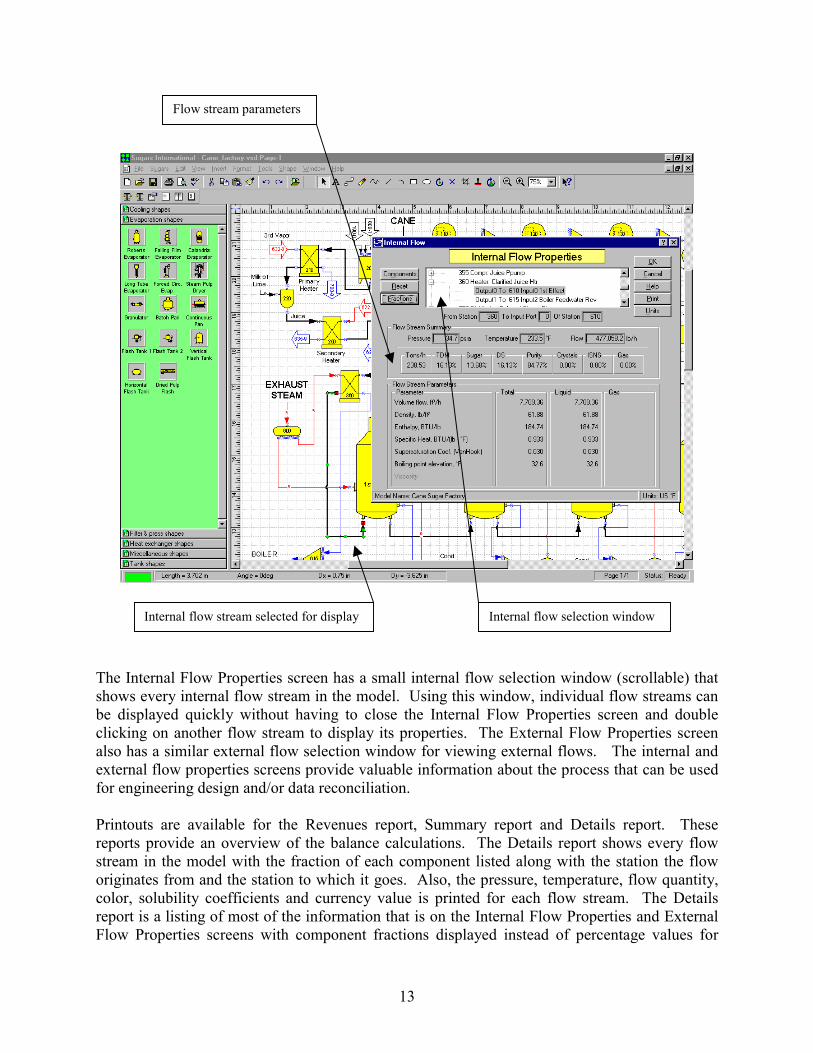
Clicking the Parameters button on the Internal Flow Properties screen gives additionalcharacteristics of the flow, such as: volume flow, specific weight, enthalpy, specific heatcapacity, supersaturation and boiling point elevation (see figure below). The Flow StreamParameters feature is also available for external flows.
Every internal flow in the model can be displayed using the Properties screen. Also, flowstreams that are required and/or pressure feedback (flow streams that need a pressure value fromanother station) are identified on the flow diagram by a small 'R' for required and a small 'P' forpressure feedback. Sugars will place these indicators on the flow streams after the balancecalculations are completed.
Internal Flow Properties ScreenParameters button
Internal flow stream selected for display
13
The Internal Flow Properties screen has a small internal flow selection window (scrollable) thatshows every internal flow stream in the model. Using this window, individual flow streams canbe displayed quickly without having to close the Internal Flow Properties screen and doubleclicking on another flow stream to display its properties. The External Flow Properties screenalso has a similar external flow selection window for viewing external flows. The internal andexternal flow properties screens provide valuable information about the process that can be usedfor engineering design and/or data reconciliation.
Printouts are available for the Revenues report, Summary report and Details report. Thesereports provide an overview of the balance calculations. The Details report shows every flowstream in the model with the fraction of each component listed along with the station the floworiginates from and the station to which it goes. Also, the pressure, temperature, flow quantity,color, solubility coefficients and currency value is printed for each flow stream. The Detailsreport is a listing of most of the information that is on the Internal Flow Properties and ExternalFlow Properties screens with component fractions displayed instead of percentage values for
Flow stream parameters
Internal flow selection windowInternal flow stream selected for display

14
purity, dry substance, etc. The summary information on the Internal Flow Properties andExternal Flow Properties screens is basically the same as shown on the Summary report for eachflow (see figure below).
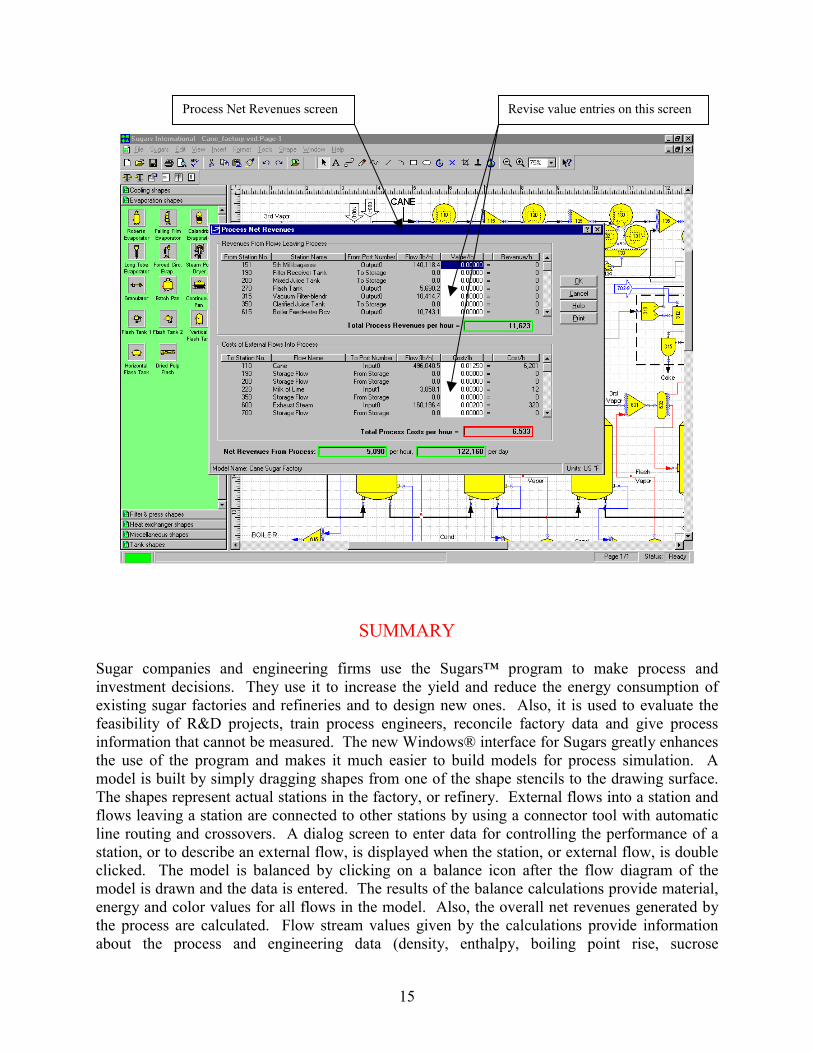
Some of the most useful information from Sugars is given on the Process Net Revenues report(see print preview screen in the figure below). As changes are made to the model, the processnet revenues will either increase, or decrease. New process equipment with new stationproperties, or changes in the process routing, can be evaluated quickly to see now the revenueswill change. The Process Net Revenues are calculated from the values for all flows leaving themodel (internal flows) minus the cost of all flows into the model (external flows). Thisinformation is very useful for making investment decisions. Also, it is the most convenient wayto show how changes to the model will affect the operating performance of the process.
The value entries for all external flows into the model and internal flows that leave the model areentered on the External Flow Properties and Internal Flow Properties screens. These values areused to calculate the process net revenues. The entered values can also be changed on theProcess Net Revenues screen as shown in the figure below.
Summary report
15
SUMMARY
Sugar companies and engineering firms use the Sugars™ program to make process andinvestment decisions. They use it to increase the yield and reduce the energy consumption ofexisting sugar factories and refineries and to design new ones. Also, it is used to evaluate thefeasibility of R&D projects, train process engineers, reconcile factory data and give processinformation that cannot be measured. The new Windows® interface for Sugars greatly enhancesthe use of the program and makes it much easier to build models for process simulation. Amodel is built by simply dragging shapes from one of the shape stencils to the drawing surface.The shapes represent actual stations in the factory, or refinery. External flows into a station andflows leaving a station are connected to other stations by using a connector tool with automaticline routing and crossovers. A dialog screen to enter data for controlling the performance of astation, or to describe an external flow, is displayed when the station, or external flow, is doubleclicked. The model is balanced by clicking on a balance icon after the flow diagram of themodel is drawn and the data is entered. The results of the balance calculations provide material,energy and color values for all flows in the model. Also, the overall net revenues generated bythe process are calculated. Flow stream values given by the calculations provide informationabout the process and engineering data (density, enthalpy, boiling point rise, sucrose
Process Net Revenues screen Revise value entries on this screen
16
supersaturation, etc) that is useful for process design. Process net revenue results are used tomake investment decisions for new equipment, or process decisions. All of the data andcalculated results for a model are saved in a Microsoft® Access database. The new Sugars forWindows program is a dramatic improvement to the Sugars program that makes it much easier tobuild models and show the calculated results to assist with decisions to improve the efficiency ofa factory, or refinery.
ACKNOWLEGEMENTS
Sugars™ is a trademark of Sugars International LLC
Visio® is a registered trademark of Visio Corporation
Microsoft® is a registered trademark of Microsoft Corporation
Windows® is a registered trademark of Microsoft Corporation