Embed Size (px)
Citation preview
Calibration of a Water Temperature Model for Predicting Summer Water Temperatures in Rush Creek below Grant Lake Reservoir
Brad Shepard Ross Taylor
Ken Knudson Chris Hunter
Prepared for: Los Angeles Department of Water Power
Los Angeles, California
November 2009

Shepard et al. Rush Creek Temperature Model Calibration Final Draft – November 2009
Page - ii
Executive Summary
The water temperature model “StreamTemp” (a Windows® version of the SNTEMP model developed by the U.S. Geological Survey [previously the Fish and Wildlife Service; Bartholow 1989] and converted to Windows® by Thomas R. Payne and Associates) was selected as the model to predict water temperatures in Rush Creek under different flow scenarios. Selection of this model was done in conjunction with collaborators representing government and non-governmental constituents that were convened under the direction of the California State Water Resources Control Board. This model uses a stream network approach to track thermal fluxes throughout a stream network. One major advantage to this model is its ability to evaluate different flow and temperature scenarios and predict changes in temperatures and flows throughout a networked system. As with any model, many assumptions must be made and for applying this model in Rush Creek below Grant Lake Reservoir the following assumptions had to be made.
1. Water in the system is instantaneously and thoroughly mixed at all times. Thus, there is no lateral temperature distribution across the stream channel, nor is there any vertical gradient in pools.
2. All stream geometry (e.g., slope, shade, friction coefficient) is characterized by mean conditions.
3. Distribution of lateral inflow is uniformly apportioned throughout the segment length.
4. Solar radiation and the other meteorological and hydrological parameters are 24-hour means.
5. All reaches in the lower Rush Creek system can be reasonably modeled as single-thread channels.
6. No flow was gained or lost in either Parker or Walker creeks between the LADWP conduit and upper thermograph locations in these two streams.
7. Groundwater temperatures could be reasonably estimated as long-term average annual air temperatures.
8. Modeling of temperatures at flows <150 cfs in Rush Creek will adequately describe the high temperature period when water temperatures rise high enough to limit trout growth (conversely, at flows >=150 cfs water temperatures do not get high enough to limit trout growth or survival).
9. Measured water temperatures were accurate and representative of the entire stream cross-section at thermograph locations.
10. About one cfs of groundwater entered the Rush Creek channel at the top of the Gorge reach, immediately below Grant Lake Reservoir dam.
This model was parameterized by estimating values for a wide variety of variables including: stream channel geometry and orientation, weather, shading of the channel, initial water temperatures, and flow conditions (including gains and losses of flow throughout the channel). A calibration process, whereby predicted average daily water temperatures provided by the model were compared to measured daily water temperatures at several sites in the stream network and parameter estimates were iteratively adjusted such that predicted temperatures matched measured temperatures

Shepard et al. Rush Creek Temperature Model Calibration Final Draft – November 2009
Page - iii
as closely as possible, was used to develop a final model. Calibration was done for the year 2008 and then calibration runs were iteratively run during both 2007 and 2008 until the model was considered calibrated. Validation of the calibrated model was then done for the years 2000, 2001, and 2006 and some slight re-adjustments to a few of the parameter estimates were made to better calibrate the model. The final model was then run for all years (2000, 2001, 2006, 2007, and 2008) to assess how well it performed. We used criteria suggested by Bartholow (1989) and in the documentation for the StreamTemp model (Thomas R. Payne and Associates 2005) to evaluate and calibrate the model. These criteria are: 1) correlation coefficient (R-squared) as close to 1.0 as possible; 2) mean error as close to zero as possible; 3) probable error <= 0.5˚C (0.9˚F); 4) maximum error <= 1.5˚C (2.7˚F); 5) number of predicted errors >1.0˚C (1.8˚F) < 10%; and 6) bias minimal. The final best model had: 1) R-squared = 0.98; 2) mean error of 0.07; 3) probable error = 0.43; 4) maximum error = -2.9˚F; 5) <8% of the predicted mean daily temperatures were >1˚F different than observed daily mean temperatures; and 6) error bias = 0.02 for the year 2008, while the mean error was -0.04 for flows <150 cfs across all years. Using these criteria we believe we have a reasonable temperature model to use for evaluating how different flow scenarios affect average daily water temperatures in the Rush Creek system below Grant Lake Reservoir. An assessment of the model’s ability to predict minimum and maximum daily water temperatures indicated the model had limited ability to predict minimum or maximum water temperatures, with predictions of maximum daily temperatures being 5 to 8˚F lower than measured values for the year 2008, the year for which the model was originally calibrated.

Shepard et al. Rush Creek Temperature Model Calibration Final Draft – November 2009
Page - iv
Table of Contents
Executive Summary ........................................................................................................ ii
Table of Contents ............................................................................................................iv
List of Tables ................................................................................................................... v
List of Figures .................................................................................................................. v
Introduction ..................................................................................................................... 1
Methods .......................................................................................................................... 3
Meteorology ................................................................................................................. 7 Stream Flows ............................................................................................................... 7 Water Temperatures .................................................................................................... 9 Delineation of Reaches.............................................................................................. 10 Model Parameterization ............................................................................................. 13 Model Calibration ....................................................................................................... 17 Model Validation ........................................................................................................ 21
Results .......................................................................................................................... 21
Climate ...................................................................................................................... 21 Flows ......................................................................................................................... 21 Grant Lake Reservoir Storage Levels ........................................................................ 22 Calibration ................................................................................................................. 22 Validation ................................................................................................................... 31 Minimum and Maximum Daily Water Temperature Predictions ................................. 34
Conclusions and Recommendations ............................................................................. 40
Acknowledgements ....................................................................................................... 41
References .................................................................................................................... 41
Appendix A – Grant Lake Reservoir Storage to Elevation relationship and Maximum Outflow Temperatures at Different Grant Lake Reservoir Elevations ............................ 45
Appendix B – Data Availability ...................................................................................... 46
Appendix C – Model Calibration .................................................................................... 49
RUSH08_Base model................................................................................................ 49 RUSH08BEST3A model ............................................................................................ 52 RUSH08_5-siphon3A model ...................................................................................... 55
Appendix C – Parameter Estimates for “Best” Models .................................................. 58
RUSH08BEST3A model ............................................................................................ 58 RUSH08_5-siphon3A model ...................................................................................... 67
Appendix D – Final Best Temperature Model Parameters ............................................ 77
Shepard et al. Rush Creek Temperature Model Calibration Final Draft – November 2009
Page - v
List of Tables
Table 1. Estimated flows using regressions developed by California Department of Fish and Game (1991; CDFG) and using data provided by M&T in Rush Creek based on gauged flows out of Grant Lake Reservoir. Note that for the lower reach flows estimated by CDFG and M&T data are nearly identical for Grant Lake Reservoir outlflows > 30 cfs. ............................................................................................................ 9
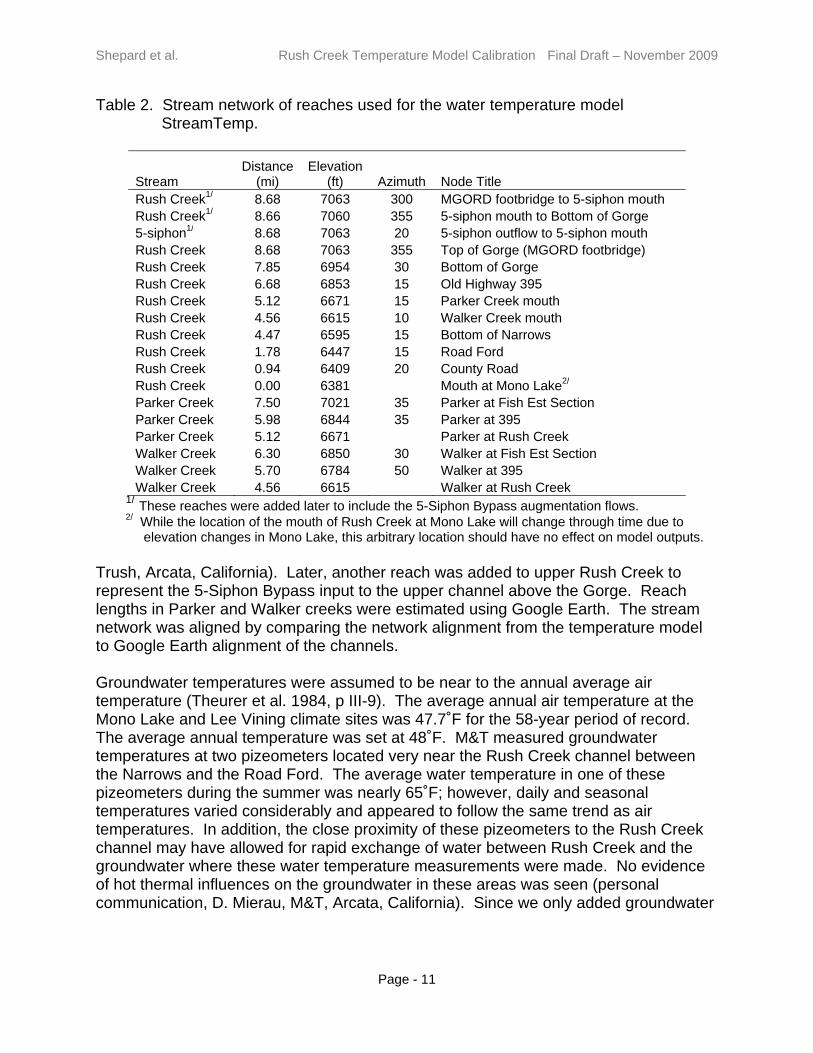
Table 2. Stream network of reaches used for the water temperature model StreamTemp. ................................................................................................................ 11
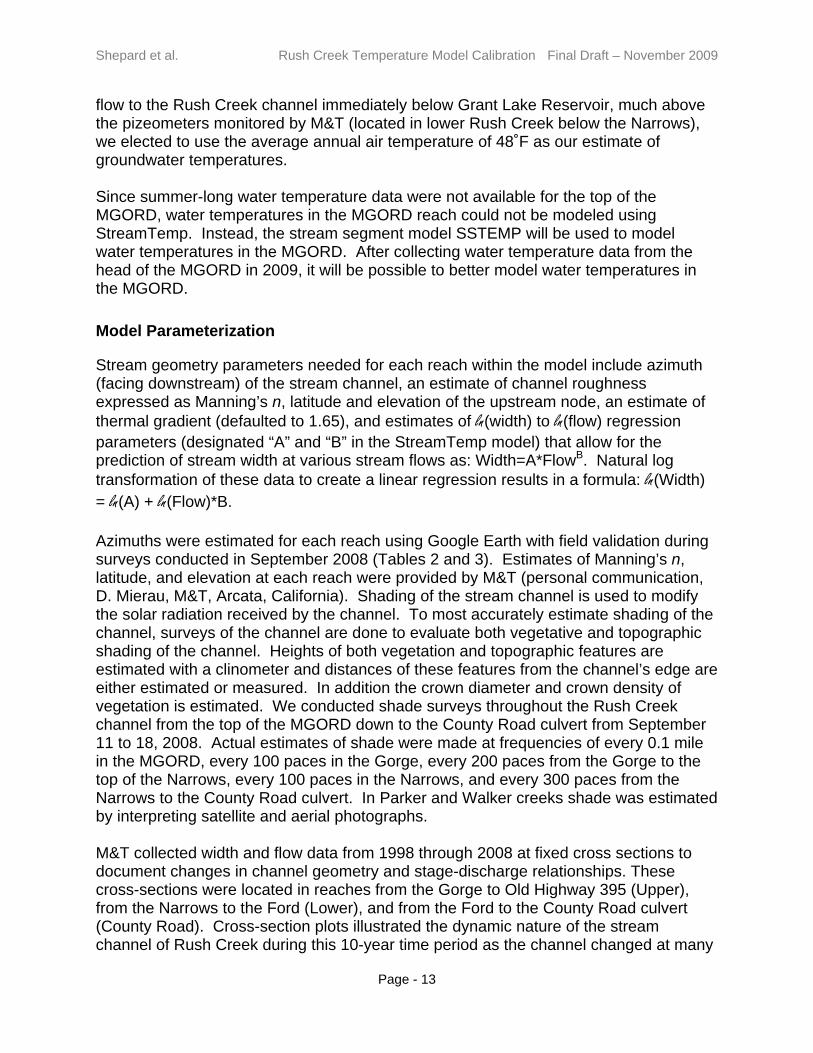
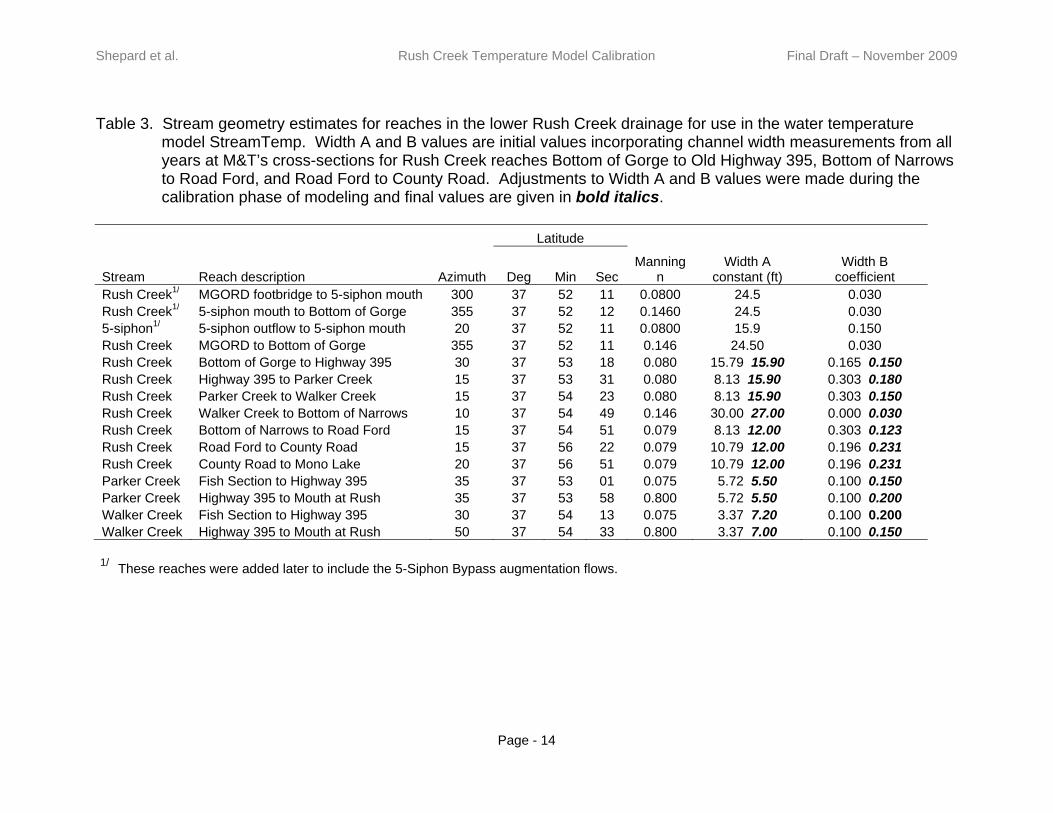
Table 3. Stream geometry estimates for reaches in the lower Rush Creek drainage for use in the water temperature model StreamTemp. Width A and B values are initial values incorporating channel width measurements from all years at M&T’s cross-sections for Rush Creek reaches Bottom of Gorge to Old Highway 395, Bottom of Narrows to Road Ford, and Road Ford to County Road. Adjustments to Width A and B values were made during the calibration phase of modeling and final values are given in bold italics. .................................................................................................................. 14
Table 4. Number of days from June 1 through September 30 (122 days possible) that data were available for various meteorological and hydrological parameters by site from 1999 through 2008. Numbers in parentheses under “Flow” for “Rush-MGORD” indicate the number of days flows were < 150 cfs. ..................................................................... 18
List of Figures
Figure 1. Study area map showing fish monitoring sections (gold rectangles with section names adjacent), flow monitoring sites (black filled circles), and water temperature sites (red triangles). .................................................................................... 2
Figure 2. Relationship between water temperature (C) and growth (expressed in change in energy content per day in calories) with numbers showing proportion of full ration provided to fish (graph from Elliott and Hurley 1999). The shaded portion of the graph is the temperature range used as “ideal temperature” for growth based on several studies (Raleigh et al. 1986; Elliott 1975a; Elliott 1975b; Elliott et al. 1995; Elliott and Hurley 1999; Elliott and Hurley 2000; Ojanguren et al. 2001). Temperature range of the shaded box in degrees Fahrenheit is shown above the shaded box. .............................. 5
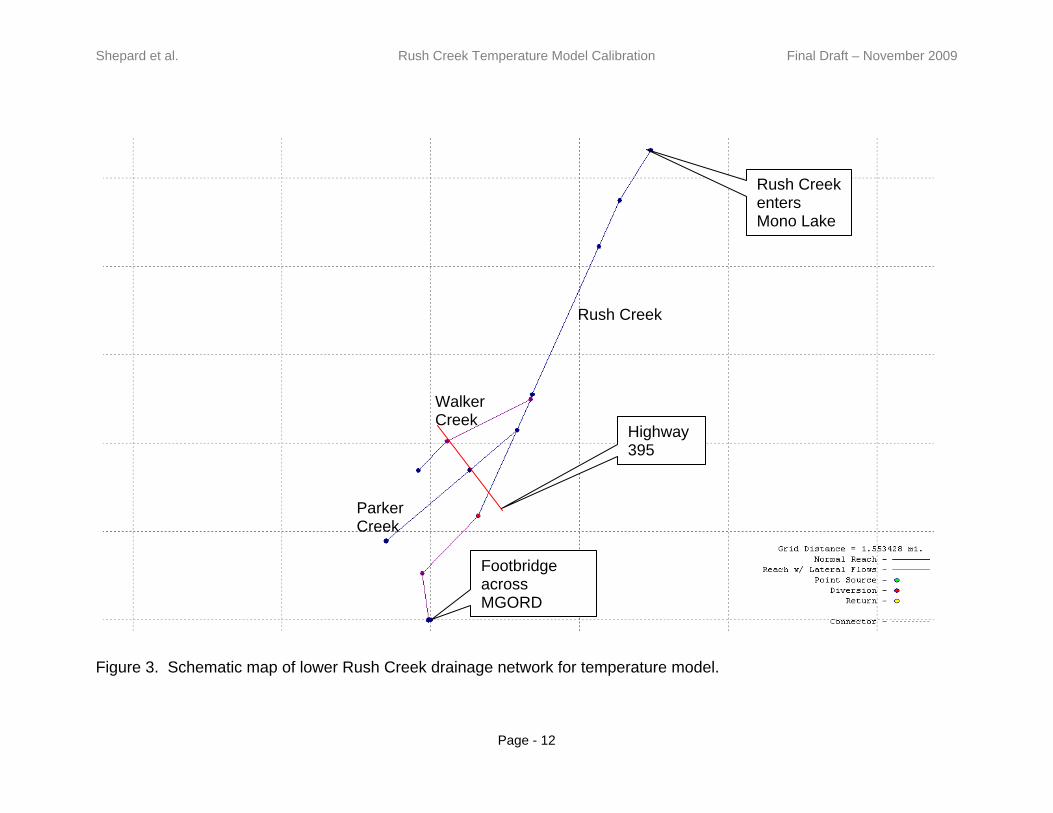
Figure 3. Schematic map of lower Rush Creek drainage network for temperature model. ........................................................................................................................... 12
Figure 4. Number of days maximum daily water temperatures at the bottom of the MGORD and at County Road in Rush Creek reached given temperatures (x-axis) at flows >150 cfs and <150 cfs from 1999 through 2008. .................................................. 16
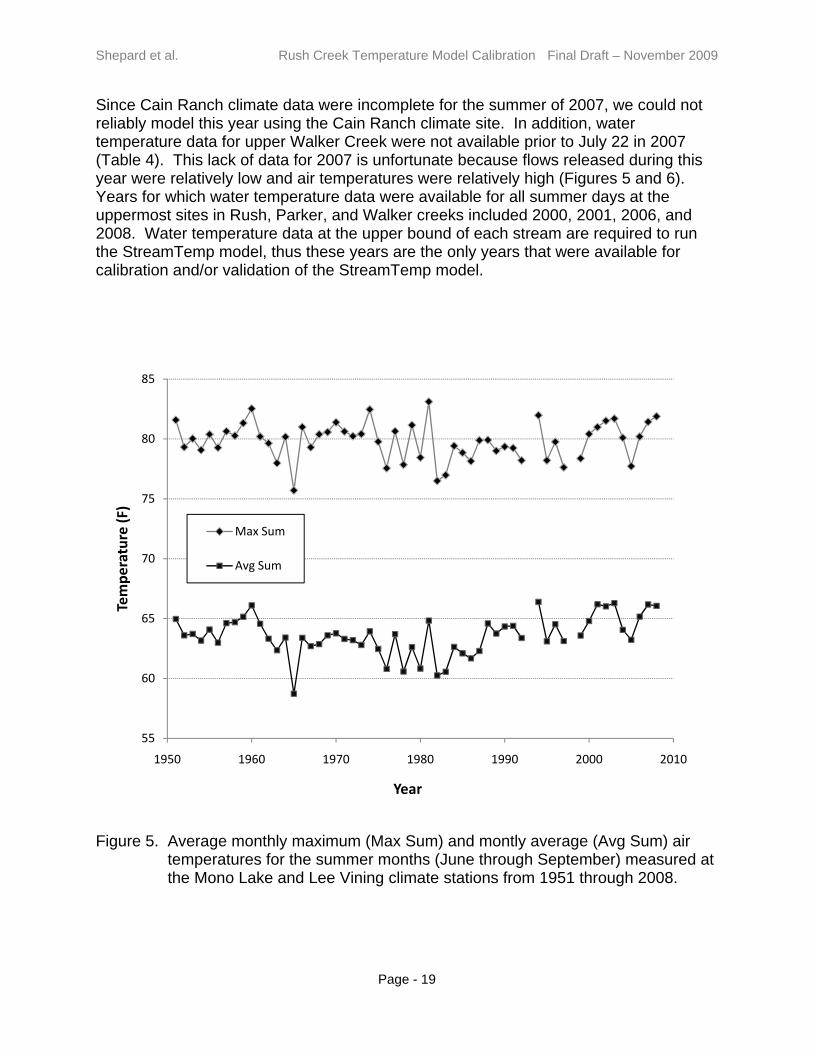
Figure 5. Average monthly maximum (Max Sum) and montly average (Avg Sum) air temperatures for the summer months (June through September) measured at the Mono Lake and Lee Vining climate stations from 1951 through 2008. .................................... 19

Shepard et al. Rush Creek Temperature Model Calibration Final Draft – November 2009
Page - vi
Figure 6. Daily average discharge for Rush Creek below the Return Ditch and below the Narrows since Runoff Year 1995, showing the variation in annual snowmelt peaks since monitoring began under the State Water Board Order 98-05 (graph from M&T Inc. 2009). The early peak of the two peaks shown during 1997 (the one that occurred prior to Apr-97) only occurred below the Narrows due to a winter flood event that affected Parker and Walker creeks. ............................................................................................ 20
Figure 7. Storage (acre-feet) in Grant Lake Reservoir from May 1 to September 30 for the years 1999 through 2008. Data provided by LADWP. ............................................ 22
Figure 8. Daily predicted (blue and green symbols) and observed (red symbols) average water temperatures at Old Highway 395 and County Road in Rush Creek and at the mouth of Parker Creek during 2008 using the “base” conditions without any flow loss or gain (RUSH08_BASE) StreamTemp model. One day’s predicted and measured average daily water temperature (September 1) for Parker Creek below 50˚F is not shown. ........................................................................................................................... 24
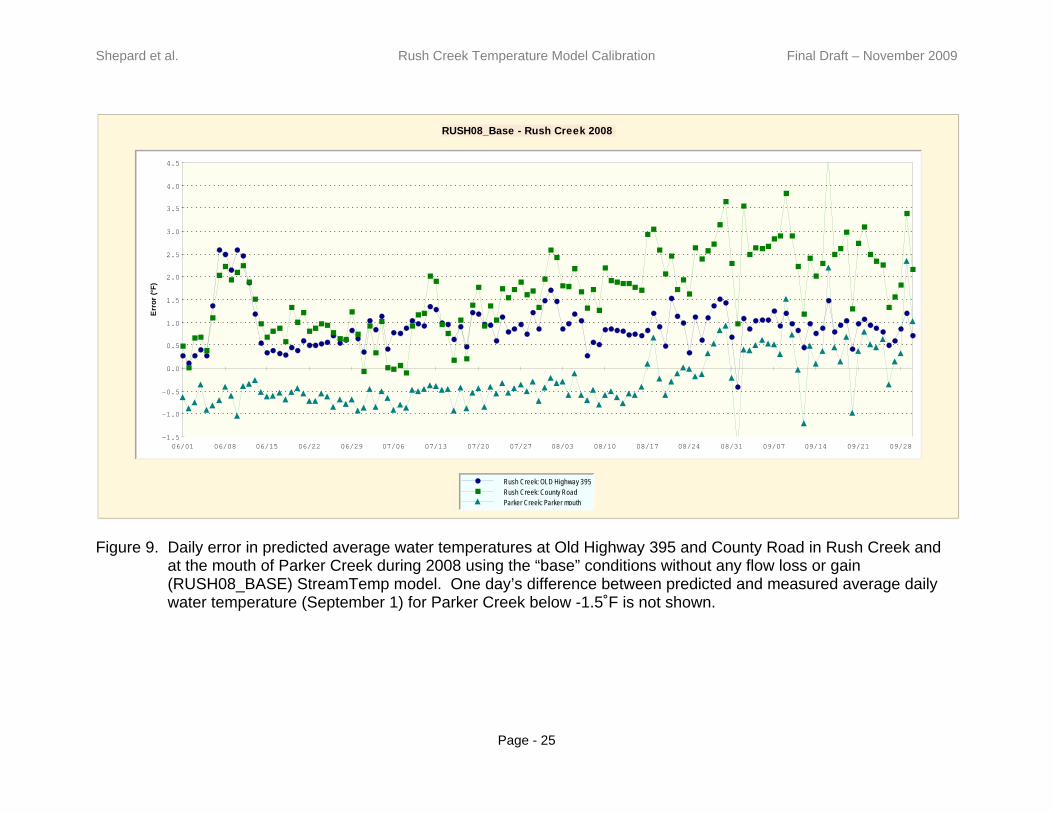
Figure 9. Daily error in predicted average water temperatures at Old Highway 395 and County Road in Rush Creek and at the mouth of Parker Creek during 2008 using the “base” conditions without any flow loss or gain (RUSH08_BASE) StreamTemp model. One day’s difference between predicted and measured average daily water temperature (September 1) for Parker Creek below -1.5˚F is not shown. ......................................... 25
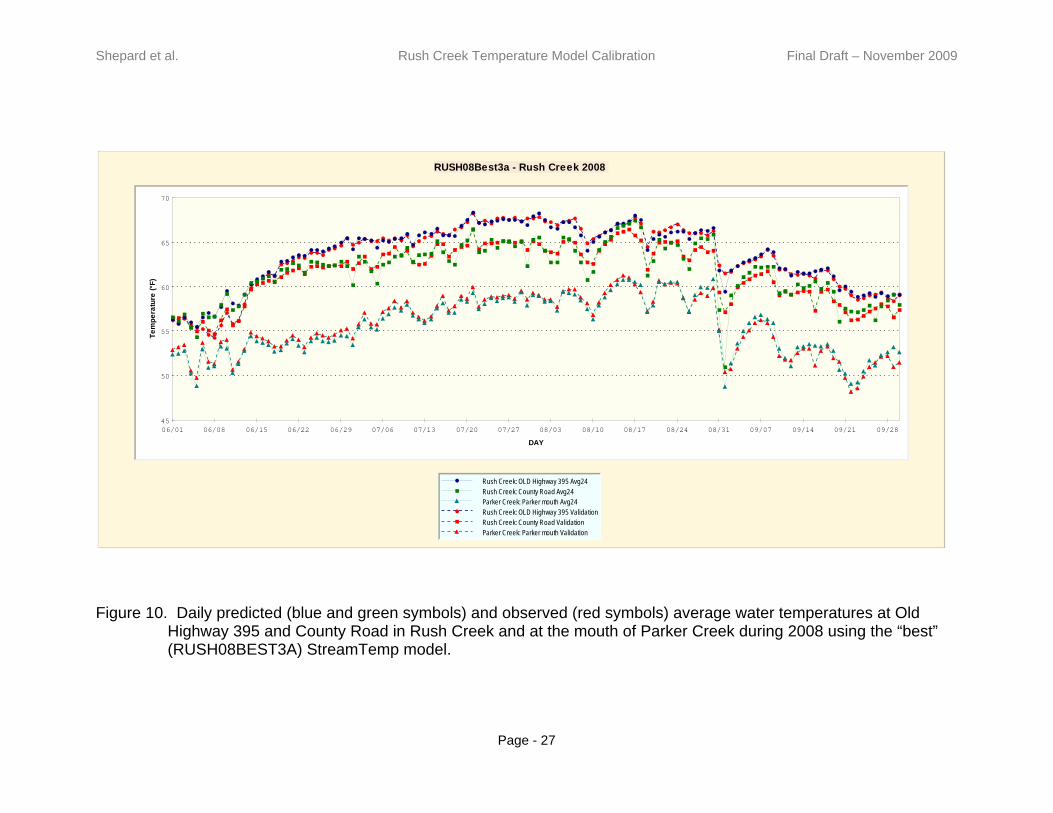
Figure 10. Daily predicted (blue and green symbols) and observed (red symbols) average water temperatures at Old Highway 395 and County Road in Rush Creek and at the mouth of Parker Creek during 2008 using the “best” (RUSH08BEST3A) StreamTemp model. ...................................................................................................... 27
Figure 11. Daily error in predicted average water temperatures at Old Highway 395 and County Road in Rush Creek and at the mouth of Parker Creek during 2008 using the “best” (RUSH08BEST3A) StreamTemp model. Shaded area shows error introduced by excluding 5-Siphon Bypass flows. One day’s difference between predicted and measured average daily water temperature (September 1) for Rush Creek at the County Road culvert below negative 2.5˚F is not shown. .......................................................... 28
Figure 12. Daily error in predicted average water temperatures at Old Highway 395 and County Road in Rush Creek and at the mouth of Parker Creek during 2008 using the final “best” (RUSH08_5_SIPHON_BEST) StreamTemp model. .................................... 29
Figure 13. Daily predicted (blue and green symbols) and observed (red symbols) average water temperatures at Old Highway 395 and County Road in Rush Creek and at the mouth of Parker Creek during 2008 using the final “best” (RUSH08_5_SIPHON_BEST) StreamTemp model. ..................................................... 30
Figure 14. Validation of the final best model developed in 2008 with 2007 data from July 22 through September 30. ..................................................................................... 32
Figure 15. Validation results for 2006 showing daily error in predicted average water temperatures at the Narrows and County Road in Rush Creek during 2006 using the final “best” 2008 StreamTemp model (RUSH08_5_SIPHON_BEST). ........................... 33
Shepard et al. Rush Creek Temperature Model Calibration Final Draft – November 2009
Page - vii
Figure 16. Validation results for 2001 showing daily error in predicted average water temperatures at the Narrows and County Road in Rush Creek during 2001 using the final “best” 2008 StreamTemp model (RUSH08_5_SIPHON_BEST). ........................... 35
Figure 17. Validation results for 2000 showing daily error in predicted average water temperatures at the Narrows and County Road in Rush Creek during 2000 using the final “best” 2008 StreamTemp model (RUSH08_5_SIPHON_BEST). ........................... 36
Figure 18. Prediction errors for daily average water temperatures for all summer flows during all model years. .................................................................................................. 37
Figure 19. Prediction errors for daily average water temperatures for summer flows < 150 cfs during all model years. ...................................................................................... 38
Figure 20. Comparison of predicted versus measured maximum and minimum daily water temperatures at Old Highway 395 (top) and County Road (bottom) of Rush Creek during the summer of 2008. Predictions of maximum daily water temperatures were made with the best calibration of the StreamTemp model for the year 2008 that included the 5-Siphon Bypass (RUSH08_5_SIPHON_BEST). .................................................... 39
Shepard et al. Rush Creek Temperature Model Calibration Final Draft – November 2009
Page - 1
Introduction
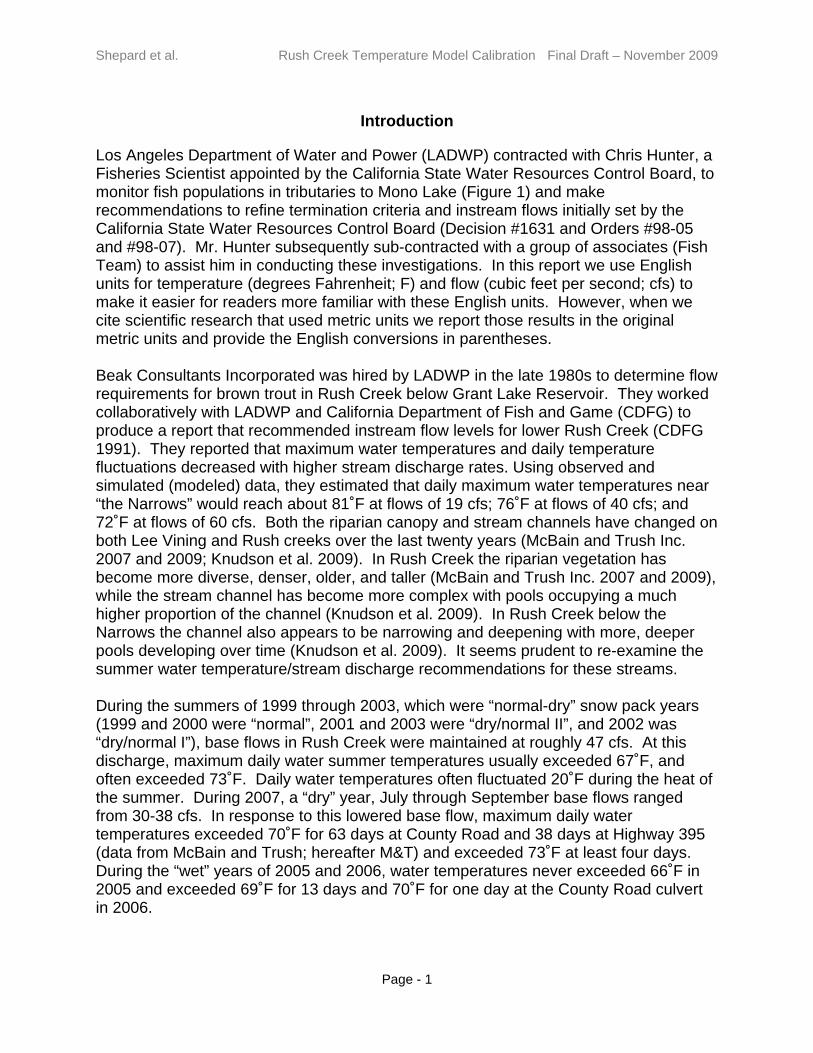
Los Angeles Department of Water and Power (LADWP) contracted with Chris Hunter, a Fisheries Scientist appointed by the California State Water Resources Control Board, to monitor fish populations in tributaries to Mono Lake (Figure 1) and make recommendations to refine termination criteria and instream flows initially set by the California State Water Resources Control Board (Decision #1631 and Orders #98-05 and #98-07). Mr. Hunter subsequently sub-contracted with a group of associates (Fish Team) to assist him in conducting these investigations. In this report we use English units for temperature (degrees Fahrenheit; F) and flow (cubic feet per second; cfs) to make it easier for readers more familiar with these English units. However, when we cite scientific research that used metric units we report those results in the original metric units and provide the English conversions in parentheses. Beak Consultants Incorporated was hired by LADWP in the late 1980s to determine flow requirements for brown trout in Rush Creek below Grant Lake Reservoir. They worked collaboratively with LADWP and California Department of Fish and Game (CDFG) to produce a report that recommended instream flow levels for lower Rush Creek (CDFG 1991). They reported that maximum water temperatures and daily temperature fluctuations decreased with higher stream discharge rates. Using observed and simulated (modeled) data, they estimated that daily maximum water temperatures near “the Narrows” would reach about 81˚F at flows of 19 cfs; 76˚F at flows of 40 cfs; and 72˚F at flows of 60 cfs. Both the riparian canopy and stream channels have changed on both Lee Vining and Rush creeks over the last twenty years (McBain and Trush Inc. 2007 and 2009; Knudson et al. 2009). In Rush Creek the riparian vegetation has become more diverse, denser, older, and taller (McBain and Trush Inc. 2007 and 2009), while the stream channel has become more complex with pools occupying a much higher proportion of the channel (Knudson et al. 2009). In Rush Creek below the Narrows the channel also appears to be narrowing and deepening with more, deeper pools developing over time (Knudson et al. 2009). It seems prudent to re-examine the summer water temperature/stream discharge recommendations for these streams. During the summers of 1999 through 2003, which were “normal-dry” snow pack years (1999 and 2000 were “normal”, 2001 and 2003 were “dry/normal II”, and 2002 was “dry/normal I”), base flows in Rush Creek were maintained at roughly 47 cfs. At this discharge, maximum daily water summer temperatures usually exceeded 67˚F, and often exceeded 73˚F. Daily water temperatures often fluctuated 20˚F during the heat of the summer. During 2007, a “dry” year, July through September base flows ranged from 30-38 cfs. In response to this lowered base flow, maximum daily water temperatures exceeded 70˚F for 63 days at County Road and 38 days at Highway 395 (data from McBain and Trush; hereafter M&T) and exceeded 73˚F at least four days. During the “wet” years of 2005 and 2006, water temperatures never exceeded 66˚F in 2005 and exceeded 69˚F for 13 days and 70˚F for one day at the County Road culvert in 2006.
Shepard et al. Rush Creek Temperature Model Calibration Final Draft – November 2009
Page - 2
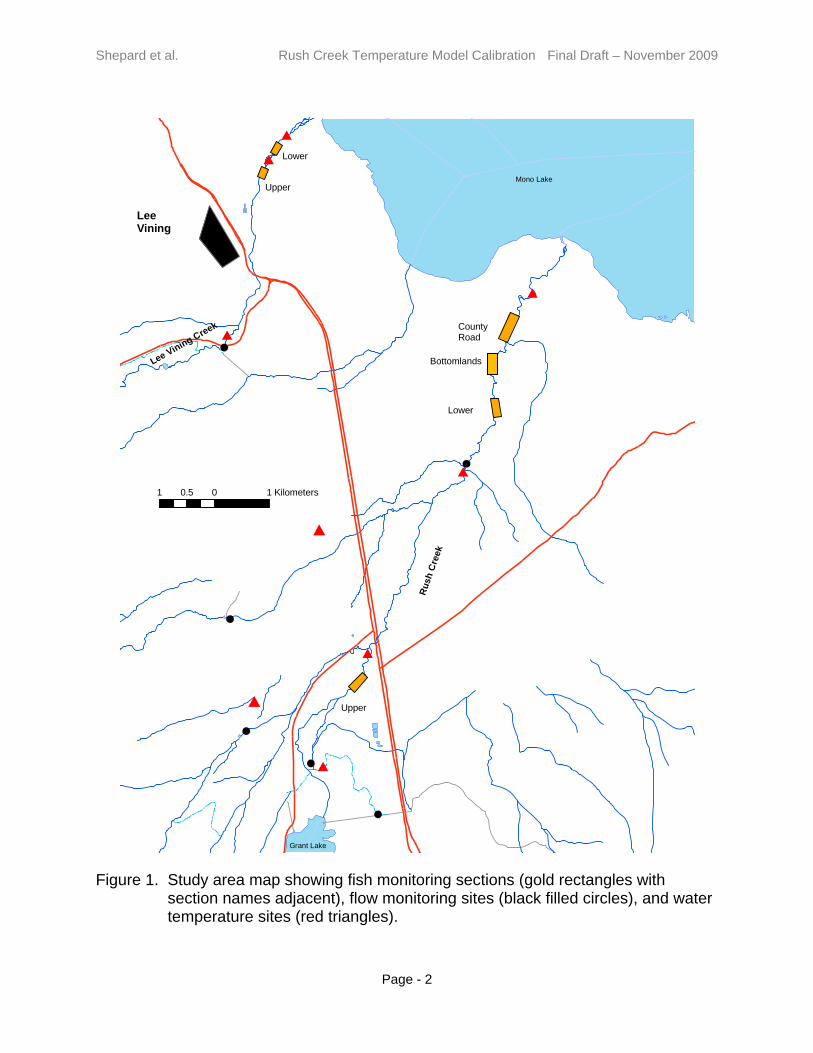
Figure 1. Study area map showing fish monitoring sections (gold rectangles with
section names adjacent), flow monitoring sites (black filled circles), and water temperature sites (red triangles).
#
#
#
#
#
#
#CountyRoad
Lower
Upper
Lower
Upper
LeeVining
Ru
sh C
reek
Lee Vining Creek
Mono Lake
Grant Lake
1 0 10.5 Kilometers
Bottomlands

Shepard et al. Rush Creek Temperature Model Calibration Final Draft – November 2009
Page - 3
Raleigh et al. (1986) reported that the optimum water temperature range for the survival and growth of brown trout (Salmo trutta) is from about 12 to 19˚C (approximately 52 to 67˚F). In more recent studies conducted on experimental (temperature-regulated) streams, Elliott and Hurley (1999) found that growth (positive weight gain) only occurred in brown trout when water temperatures ranged from 3 to 19˚C (37 to 67˚F), with the highest growth rate occurring at 14˚C (57˚F). At water temperatures above 67˚F and below 37˚F no growth occurred, even when the test fish were provided with full rations. Shepard et al. (2009a; 2009b), using data collected by Hunter et al. (2000 through 2008), found that body condition and densities of brown trout in Rush Creek were associated with flow levels and water temperatures. In general, they found that lower peak flows, moderate summer flows, and the number of days that water temperatures were ideal for growth (52 to 67˚F based on work by Raleigh et al. 1986; Elliott 1975a; Elliott 1975b; Elliott et al. 1995; Elliott and Hurley 1999; Elliott and Hurley 2000; Ojanguren et al. 2001) resulted in higher abundance and better body condition of brown trout in Rush Creek. The goal of temperature modeling is to predict the effect that different flow scenarios will have on water temperatures throughout the Rush Creek drainage. The temperature model will be used in conjunction with the mapping of instream habitats at various flows to predict how fish populations will respond to potential flow management scenarios in Rush Creek in a future Synthesis Report. It is anticipated that:
1. Higher summer stream flows will result in more optimal water temperatures for trout growth, but higher flows will also increase water velocities and provide fewer slow-water habitats preferred by brown trout (Taylor et al. 2009).
2. Providing optimal temperatures for trout growth will result in increased annual growth rates for juvenile and adult brown trout, potentially increasing their survival and overall size of trout in the Mono Basin streams.
3. Intermediate flow levels may provide optimal conditions for brown trout by balancing water temperature mediation with availability of slow-water habitats.
In addition to the evaluation of flow and temperature effects on trout in Rush Creek, other ecological functions will also be considered in a future Synthesis Report. While the Synthesis Report will evaluate trade-offs between flow scenarios in supporting various ecological functions, the goal of this calibration report is to select, calibrate, and validate a water temperature model for use in predicting water temperatures in Rush Creek.
Methods
The stream network temperature model “StreamTemp” (version 1.0.4, Thomas R. Payne and Associates 2005) was determined to be the most useful model for predicting stream temperatures in Rush Creek. This model is a Windows® operating system version of the DOS® operating system model SNTEMP (Theurer et al. 1984; Bartholow 1989; Bartholow 1991; Bartholow 2000). SNTEMP was originally developed by the U.S.

Shepard et al. Rush Creek Temperature Model Calibration Final Draft – November 2009
Page - 4
Fish and Wildlife Service (now USGS) team in Fort Collins, Colorado. This model uses a stream network approach to track thermal fluxes throughout a stream network. One major advantage to this model is its ability to evaluate different flow and temperature scenarios and predict changes in temperatures throughout a networked system. Collaborators working on Mono Basin water issues through California’s State Water Resources Control Board supported the use of this model for predicting water temperature effects of different stream flow scenarios. These collaborators included LADWP, the Mono Lake Committee, CalTrout, CDFG, USDA Forest Service, and numerous scientists, including the Fish Team, that have been collecting and analyzing data. This model is not a flow model, so flow measurements throughout the system are necessary input variables. This model was primarily designed to predict average daily water temperatures. While the model can predict daily minimum and maximum water temperatures, predictions of these daily extreme values are less accurate than predictions of daily mean temperatures. In addition, this model was designed to predict summer water temperatures, but has limited value for predicting cold-season (winter) water temperatures. Summer water temperatures will be modeled for various flow scenarios within the Rush Creek drainage below Grant Lake Reservoir. Summer was defined as the period from June 1 through September 30. Only the summer period will be modeled because high summer temperatures appear to limit growth and condition of brown trout in Rush Creek (Shepard et al. 2009) and the selected temperature model was not designed to predict winter temperatures. Only conditions below Grant Lake Reservoir will be modeled. No attempt will be made to model temperatures in Grant Lake Reservoir. The goal of temperature modeling is to predict how different flow management scenarios for Rush Creek below Grant Lake Reservoir would likely affect water temperatures in lower Rush Creek. An objective of this modeling will be to determine what flow conditions (including the balance between flow releases down Rush Creek and water stored in Grant Lake Reservoir) would most likely provide thermal and flow conditions that will be better for brown trout growth during the summer. Temperature criteria for growth of brown trout (primarily developed by Elliott and Hurley 1999 and 2000; Figure 2) was used to define optimal growth conditions. Since the temperature model was not designed to predict winter water temperatures, we made no attempt to evaluate winter conditions. We suggest that testing effects of winter flow variations on winter icing, as suggested by Alfredsen and Tesaker (2002) with an appropriate methodology (i.e. Stickler and Alfredsen 2009), be done by evaluating winter icing conditions at various test flows and winter climatic conditions. However, our observations of winter conditions during radio-tag relocation surveys indicated that winter icing conditions were not very severe during the three winters we visited the basin (2005 through 2008). Fish population monitoring data following a severe winter will also provide data for evaluating whether severe winter conditions result in a reduction in fish populations.

Shepard et al. Rush Creek Temperature Model Calibration Final Draft – November 2009
Page - 5
Figure 2. Relationship between water temperature (C) and growth (expressed in
change in energy content per day in calories) with numbers showing proportion of full ration provided to fish (graph from Elliott and Hurley 1999). The shaded portion of the graph is the temperature range used as “ideal temperature” for growth based on several studies (Raleigh et al. 1986; Elliott 1975a; Elliott 1975b; Elliott et al. 1995; Elliott and Hurley 1999; Elliott and Hurley 2000; Ojanguren et al. 2001). Temperature range of the shaded box in degrees Fahrenheit is shown above the shaded box.
52˚F 67˚F

Shepard et al. Rush Creek Temperature Model Calibration Final Draft – November 2009
Page - 6
Assumptions in the StreamTemp model are:
1. Water in the system is instantaneously and thoroughly mixed at all times. Thus, there is no lateral temperature distribution across the stream channel, nor is there any vertical gradient in pools.
2. All stream geometry (e.g., slope, shade, friction coefficient) is characterized by mean conditions.
3. Distribution of lateral inflow is uniformly apportioned throughout the segment (reach) length.
4. Solar radiation and the other meteorological and hydrological parameters are 24-hour means.
Issues specific in applying the model to the lower Rush Creek drainage are:
1. The Rush Creek channel below Grant Lake Reservoir is a very dynamic system that has been changing dramatically since more water has been allowed to pass down the stream system from Grant Lake Reservoir. In addition, the fluctuating water levels in Mono Lake at the terminus of Rush Creek keeps this system in a state of flux as the stream constantly adjusts to reach a dynamic equilibrium with its terminus elevation. Past and likely future channel changes in the stream channel morphology make it more difficult to model water temperatures in Rush Creek to accurately predict future water temperatures. The development and abandonment of side-channels that have occurred, are currently occurring, and will likely occur in the future cannot be accurately modeled. Consequently, we have assumed a single-thread channel for modeling purposes and recognize that this assumption may result in less accurate predictions of water temperatures; however, we expect that relative predictions of water temperatures for different water management scenarios should provide enough information to effectively evaluate these different scenarios.
2. Water temperatures in Grant Lake Reservoir are difficult to predict due to the transitory nature of thermal stratification within the reservoir caused by periodic windy conditions and the fluctuating reservoir volume (Cullen and Railsback 1993). This inability to accurately predict water temperatures in Grant Lake Reservoir requires actually measuring water temperatures at the outlets of Grant Reservoir (both at the top of the Mono Gate One Return Ditch [hereafter “MGORD”] and for any water that is spilled over Grant Lake Reservoir dam) to apply a stream water temperature model to the system. In addition, assessing effects of different Grant Lake Reservoir water management strategies will require making assumptions related to water temperatures and storage volume of Grant Lake Reservoir suggested by Cullen and Railsback (1993; Appendix A).
3. Transfer of water between different streams in the basin to either upper Rush Creek (via the LADWP conduit), to Grant Lake Reservoir, or out of the basin to Los Angeles, via the Owens River, offers both opportunities for manipulating flows and water temperatures in Rush Creek and complexities in predicting water temperatures without actual measurements of this delivered water.
Shepard et al. Rush Creek Temperature Model Calibration Final Draft – November 2009
Page - 7
Meteorology
Meteorological data were obtained from several sources. Measurements of daily high and low air temperatures and daily average wind speed were obtained from the Cain Ranch site operated by LADWP for the years 1991 through 2008 (data were missing for many days in 2007; Appendix B). The Cain Ranch site is the closest meteorological data site to Rush Creek. Additional climate data were obtained from the Lee Vining and Mono Lake sites (Western Regional Climate Center sites; http://www.wrcc.dri.edu/). Climate data were collected at the Mono Lake site from 1950 to 1988 at which time the site was moved to Lee Vining. Climate data were collected at the Lee Vining site from 1988 to 2008. Relative humidity was measured at the Lee Vining site, but not at the Cain Ranch site. June through September averages of average daily and maximum daily air temperatures were summarized to assess what constituted extremely hot and relatively normal summer air temperatures. The 58 years of data that were available from the Mono Lake and Lee Vining sites were combined for this summary. Since the Cain Ranch climate station was the closest climate station to Rush Creek, data from this station were used to calibrate the model when daily temperature data were available. Humidity data from the Lee Vining site were used because no humidity data were available from the Cain Ranch site. Percentage of sunshine was computed using solar radiation data from Tioga Pass (http://cdec.water.ca.gov/cgiprogs/staMeta ?station_id=TES), Tonopah, Nevada (http://www.cemp.dri.edu/cgi-in/cemp_stations.pl ?stn=tono) and Carson City, Nevada (http://www.wrcc.dri.edu/weather/wncc.html) climate stations. Each day’s average solar radiation (watts/m2 or langleys) for the summer period (June 1 through September 30) within each year was divided by the maximum solar radiation received during the summer to compute percent sunshine for the model. We used the Tioga Pass site for estimating solar radiation in the final model after confirming that this site provided reasonable predictions of water temperatures.
Stream Flows
Daily flow estimates from the LADWP flow gauge site “Grant Lake Release to Mono Lake” (LADWP site GLRML) were used as input flows for Rush Creek in all calibration tests. However, when some flow was spilled over Grant Lake Reservoir dam (not all flow was passed down the MGORD) we were only able to reasonably model days when no spill occurred because no water temperature data were available for water spilled over Grant Lake Reservoir dam. Flows in Rush Creek were occasionally augmented directly with flows from the LADWP conduit, which normally originate primarily from Lee Vining Creek, through the Lee Vining Conduit Spillway above Sand Trap #5 (hereafter designated the “5-Siphon Bypass” as recommended by B. Moges, LADWP, Los Angeles, California). The 5-Siphon Bypass discharged these flows directly into Rush Creek above the junction of the MGORD with the Rush Creek channel. Daily flows estimated by LADWP’s gauges below their water conduit in Parker and Walker creeks were used as input flows for these streams, though the modeled reaches started below
Shepard et al. Rush Creek Temperature Model Calibration Final Draft – November 2009
Page - 8
the conduit. It was assumed that no flow was gained or lost between the LADWP conduit and the upper boundaries of the uppermost reaches in these two streams at fish monitoring sites (Figure 1). To assess flow gains or losses along the length of Rush, Parker, and Walker creeks a few synoptic flow measurements (flow measurements conducted at several sites along the stream within one day of similar flows) were made by McBain and Trush (personal communication, D. Mierau, M&T, Arcata, California). Regression estimates of flow losses in Rush Creek were made based on synoptic flow measurements. Synoptic flow data provided by M&T yielded a regression prediction for flows in lower Rush Creek (near the Road Ford) based on flows released from Grant Lake Reservoir (Q) of 1.016*Q – 12.44. Since M&T only made two flow measurements in Rush Creek above Parker Creek, no synoptic flow regression equation could be reliably computed for this upper portion of lower Rush Creek between the MGORD and Parker Creek. CDFG (1991) conducted a more thorough synoptic flow study. They divided Rush Creek into three study reaches: MGORD to Highway 395, Highway 395 to the Rush Creek Road Ford (“Ford”), and the Ford to below the County Road culvert. For their synoptic flow study they derived regression estimates for flows at the bottom of their middle and lower reaches, based on flows ranging from 19 to 97 cfs released from Grant Lake Reservoir (Q). For their middle reach the regression equation was 0.941*Q – 4.97, and for their lower reach it was: 0.947*Q – 9.23. The slopes of these regression equations were nearly equal and r2-values for these regressions were 0.99. The primary difference was the amount of flow loss (negative slope in the regression). The approximate rate of flow loss (loss of flow per mile) was higher in Rush Creek below the Ford (a loss of about 2.1 cfs/mile) than above (a loss of about 1.2 cfs/mile). The average flow loss from Highway 395 to the County Road culvert was about 1.8 cfs/mile. Flows estimated from the regression equations from the CDFG study and the M&T study were similar for flows over 30 cfs (Table 1), and M&T’s flow data also suggested a flow loss rate of about 1.8 cfs/mile. Only two synoptic flow measurements were made by M&T in Parker and Walker creeks. Flows in Parker Creek were measured at Highway 395. These measurements indicated that Parker Creek was not losing or gaining flows from the LADWP conduit to Highway 395. However, since no flow data were collected near the mouth of Parker Creek, we could not assess flow gains or losses from Highway 395 to its mouth. In Walker Creek flows were measured near its mouth, just above its confluence with Rush Creek. In March 2008 the flow in Walker Creek near its mouth was 6.2 cfs, while the gauged flow below the LADWP conduit was 2.6 cfs, a gain of 3.6 cfs. However, in July 2008 the flow measured near the mouth was almost equal to the flow estimated below the LADWP conduit (6.1 versus 6.5 cfs). Based on this limited data, no adjustments in flow were made in Parker Creek and 1.0 cfs was added from groundwater into Walker Creek from Highway 395 down to the mouth of Walker Creek.

Shepard et al. Rush Creek Temperature Model Calibration Final Draft – November 2009
Page - 9
Table 1. Estimated flows using regressions developed by California Department of Fish and Game (1991; CDFG) and using data provided by M&T in Rush Creek based on gauged flows out of Grant Lake Reservoir. Note that for the lower reach flows estimated by CDFG and M&T data are nearly identical for Grant Lake Reservoir outlflows > 30 cfs.
Flow out of Grant
Lake Reservoir
CDFG flow
estimate for middle
reach
CDFG flow
estimate for lower
reach
M&T flow estimate for lower reach
10 4.4 0.2 -2.6 20 13.9 9.7 7.3 30 23.3 19.2 17.1 40 32.7 28.7 27.0 50 42.1 38.1 36.9 60 51.5 47.6 46.7 70 60.9 57.1 56.6 80 70.3 66.5 66.5 90 79.7 76.0 76.3
100 89.1 85.5 86.2
Water Temperatures
Water temperature data were provided by M&T (personal communication, D. Mierau, M&T, Arcata, California). For Rush Creek, temperature loggers were placed below the footbridge across the MGORD from 2000 through 2002 and from 2005 through 2008, at the old Highway 395 bridge from 2005 through 2008, at the bottom of the Narrows from 2000 through 2002 and in 2004 and 2006, and at the County Road culvert from 2000 through 2008 (2003 had only August data and 2005 had only June data; Appendix B-Table 2). The temperature loggers placed below the MGORD footbridge during 2007 and 2008 were located along the channel margin and may have recorded slightly warmer temperatures than were occurring in the middle of the channel at the lowest range of flow releases (~17 to 33 cfs at MGORD flow gauge) due to the formation of slackwater eddies along the channel margin (personal communication, Darren Mierau email to B. Shepard, August 6, 2009). Temperature loggers were also placed in Parker and Walker creeks at fish sample sections (designated as “upper” sites) and immediately above their terminus at Rush Creek (designated as “lower” sites). For the upper Parker Creek site summer water temperature data were collected from 2000 through 2008, but data were absent or
Shepard et al. Rush Creek Temperature Model Calibration Final Draft – November 2009
Page - 10
incomplete for the summers of 2002, 2004, and 2005. For the lower Parker Creek site summer water temperature data were collected from 2006 through 2008. For the upper Walker Creek site summer water temperature data were available from 2000 through 2008, but data were absent or incomplete for the summers of 2002 and 2007. For the lower Walker Creek site summer water temperature data were available from 2004 through 2007. The temperature logger that was placed in upper Lee Vining Creek was used to estimate water temperatures delivered to Rush Creek via the 5-Siphon Bypass. We suspect that this may slightly under-estimate temperatures delivered from the 5-Siphon Bypass as we believe this water may warm slightly during transport in the LADWP conduit, but we have no data to support this belief.
Delineation of Reaches
Since the “StreamTemp” model requires water temperature and flow measurements at the upstream boundary of the furthest upstream reach in all streams, the bottom of the MGORD was set as the uppermost modeled reach for Rush Creek. This location had both flow and water temperature data available for calibrating the model and flow data were available for all years modeled. Temperature modeling from the top of the MGORD to the footbridge near the bottom of the MGORD will have to be done separately using the SSTEMP model (Bartholow 1990). No modeling of temperatures in Rush Creek during times when water was spilled from Grant Lake Reservoir could be reliably done because no temperature data were available for this spilled water. Since Grant Lake Reservoir spills only occur during the spring snowmelt period, high water temperatures should not be an issue when spills occur. Initially the short reach from the 5-Siphon Bypass outflow to the Rush Creek channel was not included. After initial calibration efforts, and in order to evaluate the potential for augmenting flows and lowering water temperatures in upper Rush Creek using 5-Siphon Bypass flows, the 5-Siphon Bypass outflow to Rush Creek channel reach was added and the topmost Rush Creek reach was split into two reaches: the MGORD footbridge down to the Rush Creek channel where the 5-Siphon Bypass flow entered the channel and from the 5-Siphon Bypass outflow junction with Rush Creek to the bottom of the Gorge at the Sheepherder’s cabin. The uppermost sites in Parker and Walker creeks where water temperatures were measured by M&T were at the fish monitoring sites, these locations were arbitrarily established as the upstream boundaries for the purpose of temperature modeling (Figure 1). The modeled stream network must be set up prior to running the temperature model. Rush Creek was initially stratified into eight reaches and Parker and Walker creeks were each stratified into two reaches (Table 2, Figure 3, and Appendix B). Reach lengths in Rush Creek were estimated by measuring the entire length of Rush Creek using a hip chain and referencing those measurements to landmarks on the map. These reach lengths were then modified slightly based on the channel centerline from the 2008 ortho-rectified aerial photographs (personal communication, McBain and
Shepard et al. Rush Creek Temperature Model Calibration Final Draft – November 2009
Page - 11
Table 2. Stream network of reaches used for the water temperature model StreamTemp.
Stream Distance
(mi) Elevation
(ft) Azimuth Node Title Rush Creek1/ 8.68 7063 300 MGORD footbridge to 5-siphon mouth Rush Creek1/ 8.66 7060 355 5-siphon mouth to Bottom of Gorge 5-siphon1/ 8.68 7063 20 5-siphon outflow to 5-siphon mouth Rush Creek 8.68 7063 355 Top of Gorge (MGORD footbridge) Rush Creek 7.85 6954 30 Bottom of Gorge Rush Creek 6.68 6853 15 Old Highway 395 Rush Creek 5.12 6671 15 Parker Creek mouth Rush Creek 4.56 6615 10 Walker Creek mouth Rush Creek 4.47 6595 15 Bottom of Narrows Rush Creek 1.78 6447 15 Road Ford Rush Creek 0.94 6409 20 County Road Rush Creek 0.00 6381 Mouth at Mono Lake2/ Parker Creek 7.50 7021 35 Parker at Fish Est Section Parker Creek 5.98 6844 35 Parker at 395 Parker Creek 5.12 6671 Parker at Rush Creek Walker Creek 6.30 6850 30 Walker at Fish Est Section Walker Creek 5.70 6784 50 Walker at 395 Walker Creek 4.56 6615 Walker at Rush Creek
1/ These reaches were added later to include the 5-Siphon Bypass augmentation flows. 2/ While the location of the mouth of Rush Creek at Mono Lake will change through time due to
elevation changes in Mono Lake, this arbitrary location should have no effect on model outputs. Trush, Arcata, California). Later, another reach was added to upper Rush Creek to represent the 5-Siphon Bypass input to the upper channel above the Gorge. Reach lengths in Parker and Walker creeks were estimated using Google Earth. The stream network was aligned by comparing the network alignment from the temperature model to Google Earth alignment of the channels. Groundwater temperatures were assumed to be near to the annual average air temperature (Theurer et al. 1984, p III-9). The average annual air temperature at the Mono Lake and Lee Vining climate sites was 47.7˚F for the 58-year period of record. The average annual temperature was set at 48˚F. M&T measured groundwater temperatures at two pizeometers located very near the Rush Creek channel between the Narrows and the Road Ford. The average water temperature in one of these pizeometers during the summer was nearly 65˚F; however, daily and seasonal temperatures varied considerably and appeared to follow the same trend as air temperatures. In addition, the close proximity of these pizeometers to the Rush Creek channel may have allowed for rapid exchange of water between Rush Creek and the groundwater where these water temperature measurements were made. No evidence of hot thermal influences on the groundwater in these areas was seen (personal communication, D. Mierau, M&T, Arcata, California). Since we only added groundwater
Shepard et al. Rush Creek Temperature Model Calibration Final Draft – November 2009
Page - 12
Figure 3. Schematic map of lower Rush Creek drainage network for temperature model.
Walker Creek
Parker Creek
Rush Creek
Rush Creek enters Mono Lake
Footbridge across MGORD
Highway 395
Shepard et al. Rush Creek Temperature Model Calibration Final Draft – November 2009
Page - 13
flow to the Rush Creek channel immediately below Grant Lake Reservoir, much above the pizeometers monitored by M&T (located in lower Rush Creek below the Narrows), we elected to use the average annual air temperature of 48˚F as our estimate of groundwater temperatures. Since summer-long water temperature data were not available for the top of the MGORD, water temperatures in the MGORD reach could not be modeled using StreamTemp. Instead, the stream segment model SSTEMP will be used to model water temperatures in the MGORD. After collecting water temperature data from the head of the MGORD in 2009, it will be possible to better model water temperatures in the MGORD.
Model Parameterization
Stream geometry parameters needed for each reach within the model include azimuth (facing downstream) of the stream channel, an estimate of channel roughness expressed as Manning’s n, latitude and elevation of the upstream node, an estimate of thermal gradient (defaulted to 1.65), and estimates of ln(width) to ln(flow) regression parameters (designated “A” and “B” in the StreamTemp model) that allow for the prediction of stream width at various stream flows as: Width=A*FlowB. Natural log transformation of these data to create a linear regression results in a formula: ln(Width) = ln(A) + ln(Flow)*B. Azimuths were estimated for each reach using Google Earth with field validation during surveys conducted in September 2008 (Tables 2 and 3). Estimates of Manning’s n, latitude, and elevation at each reach were provided by M&T (personal communication, D. Mierau, M&T, Arcata, California). Shading of the stream channel is used to modify the solar radiation received by the channel. To most accurately estimate shading of the channel, surveys of the channel are done to evaluate both vegetative and topographic shading of the channel. Heights of both vegetation and topographic features are estimated with a clinometer and distances of these features from the channel’s edge are either estimated or measured. In addition the crown diameter and crown density of vegetation is estimated. We conducted shade surveys throughout the Rush Creek channel from the top of the MGORD down to the County Road culvert from September 11 to 18, 2008. Actual estimates of shade were made at frequencies of every 0.1 mile in the MGORD, every 100 paces in the Gorge, every 200 paces from the Gorge to the top of the Narrows, every 100 paces in the Narrows, and every 300 paces from the Narrows to the County Road culvert. In Parker and Walker creeks shade was estimated by interpreting satellite and aerial photographs. M&T collected width and flow data from 1998 through 2008 at fixed cross sections to document changes in channel geometry and stage-discharge relationships. These cross-sections were located in reaches from the Gorge to Old Highway 395 (Upper), from the Narrows to the Ford (Lower), and from the Ford to the County Road culvert (County Road). Cross-section plots illustrated the dynamic nature of the stream channel of Rush Creek during this 10-year time period as the channel changed at many
Shepard et al. Rush Creek Temperature Model Calibration Final Draft – November 2009
Page - 14
Table 3. Stream geometry estimates for reaches in the lower Rush Creek drainage for use in the water temperature
model StreamTemp. Width A and B values are initial values incorporating channel width measurements from all years at M&T’s cross-sections for Rush Creek reaches Bottom of Gorge to Old Highway 395, Bottom of Narrows to Road Ford, and Road Ford to County Road. Adjustments to Width A and B values were made during the calibration phase of modeling and final values are given in bold italics.
Latitude
Manning n
Width A constant (ft)
Width B coefficient Stream Reach description Azimuth Deg Min Sec
Rush Creek1/ MGORD footbridge to 5-siphon mouth 300 37 52 11 0.0800 24.5 0.030 Rush Creek1/ 5-siphon mouth to Bottom of Gorge 355 37 52 12 0.1460 24.5 0.030 5-siphon1/ 5-siphon outflow to 5-siphon mouth 20 37 52 11 0.0800 15.9 0.150 Rush Creek MGORD to Bottom of Gorge 355 37 52 11 0.146 24.50 0.030 Rush Creek Bottom of Gorge to Highway 395 30 37 53 18 0.080 15.79 15.90 0.165 0.150 Rush Creek Highway 395 to Parker Creek 15 37 53 31 0.080 8.13 15.90 0.303 0.180 Rush Creek Parker Creek to Walker Creek 15 37 54 23 0.080 8.13 15.90 0.303 0.150 Rush Creek Walker Creek to Bottom of Narrows 10 37 54 49 0.146 30.00 27.00 0.000 0.030 Rush Creek Bottom of Narrows to Road Ford 15 37 54 51 0.079 8.13 12.00 0.303 0.123 Rush Creek Road Ford to County Road 15 37 56 22 0.079 10.79 12.00 0.196 0.231 Rush Creek County Road to Mono Lake 20 37 56 51 0.079 10.79 12.00 0.196 0.231 Parker Creek Fish Section to Highway 395 35 37 53 01 0.075 5.72 5.50 0.100 0.150 Parker Creek Highway 395 to Mouth at Rush 35 37 53 58 0.800 5.72 5.50 0.100 0.200 Walker Creek Fish Section to Highway 395 30 37 54 13 0.075 3.37 7.20 0.100 0.200 Walker Creek Highway 395 to Mouth at Rush 50 37 54 33 0.800 3.37 7.00 0.100 0.150
1/ These reaches were added later to include the 5-Siphon Bypass augmentation flows.

Shepard et al. Rush Creek Temperature Model Calibration Final Draft – November 2009
Page - 15
of these cross-sections during this time period. Many of the monitored channel cross-sections in the Lower and County Road stream reaches appeared to be deepening and narrowing over time. For the purposes of computing reasonable width-to-flow relationships only cross-sections that crossed a single channel were used. Wetted widths were also collected by the Fish Team at fish monitoring sites in early September from 2000 through 2008, throughout the length of Rush Creek during pool surveys on July 18-28, 2008 (Knudson et al. 2009), and from the MGORD down to the County Road during shade surveys on September 11-18, 2008. In addition, the water’s edge was marked with pins or pin flags during habitat mapping for an instream flow study in August 2008 at test flows of 15, 30, 45, 60, and 90 cfs in a typical riffle within each of the Upper Rush and Bottomlands sections and at several of the M&T permanent cross-sections (Taylor et al. 2009; M&T 2009). Widths across these reference pins or pin flags were later measured and related to the flows released during those days. Width-to-flow relationships were adjusted to emphasize data collected after 2005 and during the 2008 test flows because the lower channel of Rush Creek has likely changed over time, primarily narrowing and deepening. For Parker and Walker creeks width-to-flow regression parameters were estimated based on field observations and a limited number of flow measurements taken by M&T. Widths measured during fish population surveys at the upper node of the upper reach were also compared to flows estimated for the same week for each stream. Air temperature and wind speed data from the weather station at Cain Ranch were used for all calibration runs except for 2007, when these data were unavailable for most days during the summer. During 2007 Lee Vining weather station data were used. Relative humidity data from the Lee Vining station were used for all calibrations. For 2008 humidity data were missing from July 25 through August 6 and 35% humidity was arbitrarily used based on average humidity data for the periods immediately prior to and after this period of missing data. An examination of measured daily maximum water temperature and daily flow data indicated that maximum water temperatures seldom rose above 67˚F and never rose above 70˚F when flows in Rush Creek were over 150 cfs from 1999 through 2008 (Figure 4). Since the primary purpose for modeling water temperatures in Rush Creek was to determine flow levels that provide water temperatures that were low enough during the summer to be suitable for growth of brown trout in Rush Creek, water temperature modeling concentrated on accurately modeling water temperatures at flows less than 150 cfs. In addition, water temperature data were not available for water spilled out of Grant Lake Reservoir during the spring and early summer snowmelt period. Spills over Grant Lake Reservoir dam only occurred at flows higher than 150 cfs. We assume that at flows higher than 150 cfs water temperatures do not warm enough to impact brown trout growth or survival and have not attempted to model water temperatures at those higher flows.

Shepard et al. Rush Creek Temperature Model Calibration Final Draft – November 2009
Page - 16
Figure 4. Number of days maximum daily water temperatures at the bottom of the
MGORD and at County Road in Rush Creek reached given temperatures (x-axis) at flows >150 cfs and <150 cfs from 1999 through 2008.
Incorporating flow losses into the StreamTemp model required establishing a diversion at the top of each reach that lost flow and daily removing the flow difference estimated from the above regression equations. For initial model calibration runs we assumed that flow at the bottom of the reach from Old Highway 395 to Parker Creek flow was predicted by the equation 0.941*Q – 4.97, where Q = flow gauged at the bottom of the
0
20
40
60
80
100
120
140
160
180
40 44 48 52 56 60 64 68 72 76 80 84 88
Number of Days
Maximum Daily Temperature (F)
MGORD
Flow >=150
Flow < 150
0
20
40
60
80
100
120
140
160
180
40 44 48 52 56 60 64 68 72 76 80 84 88
Number of Days
Maximum Daily Temperature (F)
County Road
Flow >=150
Flow < 150

Shepard et al. Rush Creek Temperature Model Calibration Final Draft – November 2009
Page - 17
MGORD. Flow loss at Highway 395 (L@395) was initially computed by subtracting this predicted flow from the flow out of Grant Lake Reservoir to divert the lost flow at the head of this reach according to the formula L@395 = (0.941*Q – 4.97) - Q. A similar procedure was followed to predict flow losses from the Ford to the County Road culvert (L@Ford), but we used the regression equation 0.947*Q – 9.23 and the additional flow lost in this reach was computed as: L@Ford = L@395 – Q – (0.986*Q – 12.43). For the 5-siphon reach we were required to include a flow from the 5-Siphon Bypass to run the model, even if no flow was actually delivered from the 5-Siphon Bypass. We elected to dub in a flow of 0.001 cfs for each day the 5-Siphon Bypass did not deliver any flow and we arbitrary assigned the same water temperature as was measured at the MGORD footbridge. Since this dubbed flow was so low and reach lengths of both the MGORD footbridge to the 5-Siphon Bypass mouth and the 5-Siphon Bypass outflow to the 5-Siphon Bypass mouth were equal and very short we believe the effects of dubbing these flows and temperatures would be minimal. Water temperature data were provided by M&T (Arcata, California). All water temperature data were assumed to provide accurate average daily water temperatures that were representative of a fully mixed stream (an assumption of the StreamTemp model). Since water temperature monitors recorded water temperatures at one-hour or half-hour intervals, average daily water temperatures should be relatively precise and maximum and minimum water temperatures should be reasonable. Water temperature data collected in the fish population estimate sections of Parker and Walker creeks were assumed to be the daily water temperatures for the top portions of these two streams.
Model Calibration
A matrix of data availability by data type, site, and year from 1999 through 2008 was used to determine which years should be used for model calibration (Table 4). Since a full complement of flow, water temperature, and Cain Ranch climate data were available for 2008 and stream flows in Rush Creek were fluctuated from 15 to 90 cfs during August 2008 to assess how these flow levels affected aquatic habitat and water temperature, 2008 was selected as the initial calibration year. Air temperatures during the summer of 2008 were some of the higher air temperatures on record (Figure 5), thus climate data for this year should be good for evaluating how different flow scenarios affect high summer water temperatures. During 2008 almost all flow released from Grant Lake Reservoir went down the MGORD. Water temperature data used for calibrating the model during 2008 were available from sites at the Old Highway 395 Bridge, County Road, and the mouth of Parker Creek. Four days of water temperature data were missing from the Old Highway 395 Bridge site and at the footbridge in the MGORD. These water temperatures were estimated from recorded average daily water temperatures on dates on either side of the missing dates.

Shepard et al. Rush Creek Temperature Model Calibration Final Draft – November 2009
Page - 18
Table 4. Number of days from June 1 through September 30 (122 days possible) that
data were available for various meteorological and hydrological parameters by site from 1999 through 2008. Numbers in parentheses under “Flow” for “Rush-MGORD” indicate the number of days flows were < 150 cfs.
DATA TYPE Days of data from June 1 to September 30 Data Site 1999 2000 2001 2002 2003 2004 2005 2006 2007 2008
METEROLOGICAL Air temperature Cain Ranch 122 122 122 122 122 122 122 122 21 122 Lee Vining 120 101 113 116 115 120 122 110 Wind speed Cain Ranch 122 122 122 122 122 122 122 122 122 122 Lee Vining 120 101 113 116 115 120 122 110 Humidity Lee Vining 120 101 113 116 115 120 122 110 Cloud cover
Solar radiation Tioga Pass 0 0 0 0 0 122 122 122 122 122 Dust Fixed Ground reflectivity Fixed
HYDROLOGICAL Flow Rush - MGORD 122 122 122 122 122 122 122 122 122 122
(110) (115) (114) (117) (113) (108) (72) (58) (122) (100) Walker - Conduit 122 122 122 122 122 122 122 122 122 122 Parker - Conduit 122 122 122 122 122 122 122 122 122 122 Water temperature Rush - MGORD 0 122 122 122 0 0 122 122 122 122 Rush - Old 395 0 0 0 0 0 0 122 122 122 118 Rush - Narrows 0 122 122 19 122 0 122 0 0 0 Rush - County Rd 0 122 122 122 50 122 30 122 122 122 Parker - Fish Sec 0 122 122 0 122 0 77 122 122 122 Parker - Mouth 0 0 0 0 0 122 0 122 122 122 Walker - Fish Sec 0 122 122 122 120 122 71 122 Walker - Mouth 0 122 122 122 122
Shepard et al. Rush Creek Temperature Model Calibration Final Draft – November 2009
Page - 19
Since Cain Ranch climate data were incomplete for the summer of 2007, we could not reliably model this year using the Cain Ranch climate site. In addition, water temperature data for upper Walker Creek were not available prior to July 22 in 2007 (Table 4). This lack of data for 2007 is unfortunate because flows released during this year were relatively low and air temperatures were relatively high (Figures 5 and 6). Years for which water temperature data were available for all summer days at the uppermost sites in Rush, Parker, and Walker creeks included 2000, 2001, 2006, and 2008. Water temperature data at the upper bound of each stream are required to run the StreamTemp model, thus these years are the only years that were available for calibration and/or validation of the StreamTemp model.
Figure 5. Average monthly maximum (Max Sum) and montly average (Avg Sum) air
temperatures for the summer months (June through September) measured at the Mono Lake and Lee Vining climate stations from 1951 through 2008.
55
60
65
70
75
80
85
1950 1960 1970 1980 1990 2000 2010
Temperature (F)
Year
Max Sum
Avg Sum

Shepard et al. Rush Creek Temperature Model Calibration Final Draft – November 2009
Page - 20
Figure 6. Daily average discharge for Rush Creek below the Return Ditch and below
the Narrows since Runoff Year 1995, showing the variation in annual snowmelt peaks since monitoring began under the State Water Board Order 98-05 (graph from M&T Inc. 2009). The early peak of the two peaks shown during 1997 (the one that occurred prior to Apr-97) only occurred below the Narrows due to a winter flood event that affected Parker and Walker creeks.
A series of model runs were conducted where selected input variables were modified to calibrate the model for 2008 and then that model was tested for other years where water temperature data were available. This process was repeated numerous times until the input variable estimates provided the best predictions of water temperatures we could estimate over all tested years. For instance, in 2008 we could not calibrate the model for Walker Creek because no water temperature data were collected in lower Walker Creek, thus, we had to rely on data from other years (primarily 2007) to calibrate the model for Walker Creek.
We used criteria suggested by Bartholow (1989) and in the documentation for the StreamTemp model (Thomas Payne and Associates 2005) to evaluate and calibrate the model: 1) correlation coefficient (R-squared) as close to 1.0 as possible; 2) mean error as close to zero as possible; 3) probable error <= 0.5˚C (0.9˚F); 4) maximum error <= 1.5˚C (2.7˚F); 5) number of predicted errors >1.0˚C (1.8˚F) < 10%; and 6) bias minimal.

Shepard et al. Rush Creek Temperature Model Calibration Final Draft – November 2009
Page - 21
Model Validation
As stated above, water temperature data at the upper bound of each stream are required to run the StreamTemp model and these data were only available for the entire summer during 2000, 2001, 2006, and 2008. Since water temperature data were also available for the Narrows and County Road sites in 2000 and 2001, these years were primarily used to validate the model calibrated from the year 2008. Unfortunately, we believe that channel and shade characteristics probably changed somewhat between 2000 and 2008, so validation of the 2008 model using flow and temperature data from 2000 and 2001 was probably less reliable. Flows in 2006 were so high that water was spilled over Grant Lake Reservoir dam for over 50 days (June 1 to July 21) of the 122-day summer period and flows were higher than 150 cfs for much of the summer. Thus, validation in 2006 was restricted to the period July 22 to September 30 with flows dropping below 150 cfs only after August 3. In addition, climate data were not available for much of the summer from the Cain Ranch site, so climate data from the Lee Vining station had to be used. After developing the model that we deemed was the best model using the above iterative process, this model was run for data that combined the summers of 2000, 2001, 2006, and 2008 to test the model over the full range of data.
Results
Climate
Average monthly and maximum monthly air temperatures at the combined Mono Lake and Lee Vining climate sites indicated that 1981 was the year when the summer maximum monthly air temperatures were highest, but that average monthly air temperatures were highest in 1994 (Figure 5). Average monthly air temperatures during the summer averaged 63.6˚F and maximum monthly air temperatures averaged 79.8˚F for the period of record (58 years). During the summer of 1999 average monthly temperatures averaged 63.6˚F and maximum monthly temperatures averaged 78.4˚F indicating that this was an average year for summer air temperatures.
Flows
Since monitoring began under the State Water Board Order 98-05, measurements of flows in Rush Creek indicated that moderately low (200-400 cfs), short-duration peak flows occurred during the period 1999 through 2004 (Figure 6). Longer duration, but still moderately low, peaks occurred in 1996 and 1997. Moderately high peak flows occurred in 2005, 2006, and 2008 with the peak flow in 2006 occurring over a long duration. Relatively high peak flows (> 600 cfs) occurred in 1995 and 1998 and almost no peak flow was released during 2007. Base summer flows since 1998 have typically been between 40 and 60 cfs.

Shepard et al. Rush Creek Temperature Model Calibration Final Draft – November 2009
Page - 22
Grant Lake Reservoir Storage Levels
Data for storage (acre-feet) of Grant Lake Reservoir were also obtained from LADWP. Daily Grant Lake Reservoir storage data from May through September were summarized to evaluate reservoir filling during the spring snowmelt period and reservoir drawdown during the mid- to late-summer period (Figure 7). During the period 1999 through 2008 Grant Lake Reservoir was highest during 2006 after the two high flow years of 2005 and 2006, but has subsequently dropped rapidly and in 2008 was at its lowest level in recent history.
Figure 7. Storage (acre-feet) in Grant Lake Reservoir from May 1 to September 30 for
the years 1999 through 2008. Data provided by LADWP.
Calibration
Calibration of the StreamTemp model for 2008 initially used the width-to-flow relationships from all the measurements taken by M&T at their permanent cross-sections to estimate the “A” and “B” width to flow parameters (Table 3) and base conditions initially detailed in the “Methods” section. No flow gain or loss was included
0
10000
20000
30000
40000
50000
60000
5/1 6/1 7/1 8/1 9/1
Storage (acre‐feet)
Date
Grant Reservoir Storage
2000 2001 2002
2003 2004 2005
2006 2007 2008

Shepard et al. Rush Creek Temperature Model Calibration Final Draft – November 2009
Page - 23
in this base model. Predictions of daily average water temperatures at the Old Highway 395 and County Road sites using these parameter estimates were moderately poor (mean errors in predictions were 0.9 and 1.7˚F, respectively), but predictions for the mouth of Parker Creek were better (mean error = -0.25˚F) indicating that parameter estimates for Parker Creek were better than for Rush Creek (Appendix C RUSH08_Base model). The overall mean error was 0.79. There were several periods in 2008 where there were relatively high deviations between predicted and observed average daily temperatures in Rush Creek, but deviations appeared reasonable for Parker Creek (Figures 8 and 9). Next, the predicted flow losses were taken out at Old Highway 395 and the Narrows based on the CDFG (1991) regression equations. Predictions of daily average water temperatures at the Old Highway 395 and County Road sites using these parameter estimates remained moderately poor (mean errors in predictions were 0.9 and 1.5˚F, respectively). However, these predictions represented a slight improvement, so these flow losses were kept in the model. This type of iterative process continued to calibrate the model. Adjustments were made to the following input parameters: width-to-flow relationship coefficients, shading levels along Parker and Walker creeks, flow accretions and losses, groundwater temperature, and adjusting wind speeds along the various reaches. Adjustments were made to the width-to-flow coefficients because cross-section data indicated that many of the permanent cross-sections had changed through time. We also found that width-to-flow relationships in the model were slightly different than equations provided in the documentation. Thus, width-to-flow relationships were adjusted to better match model predictions of widths at different flows with measured width-to-flow relationships. In addition, we documented through pool surveys (Knudson et al. 2009) and channel cross-sectional measurements (M&T) also indicated that the channel in Rush Creek below the Narrows was generally becoming narrower and deeper through time. Consequently, width-to-flow coefficients that described a narrower and deeper channel were used. While most of these adjustments were based on measurements or on known or suspected physical processes, a few adjustments were necessary to better match predictions to actual measurements (i.e. wind speed adjustments). Shading levels along Parker and Walker creeks were estimated from air photos and site visits and were adjusted slightly to improve the model’s predictive capability. The model averages the percentage of shade along each reach. Flow loss regressions that were originally used to compute flow losses in Rush Creek below Old Highway 395 were replaced by a fixed flow loss of 6.5 cfs that was removed at Old Highway 395. This fixed flow loss equals a loss of about 1.8 cfs per mile that was the rate of loss in both the CDFG (1991) study and from data collected by M&T during their synoptic flow measurements. A flow gain of 1.0 cfs was added to the lower Walker reach based on the limited synoptic flow measurements made by M&T.

Shepard et al. Rush Creek Temperature Model Calibration Final Draft – November 2009
Page - 24
Figure 8. Daily predicted (blue and green symbols) and observed (red symbols) average water temperatures at Old
Highway 395 and County Road in Rush Creek and at the mouth of Parker Creek during 2008 using the “base” conditions without any flow loss or gain (RUSH08_BASE) StreamTemp model. One day’s predicted and measured average daily water temperature (September 1) for Parker Creek below 50˚F is not shown.
50
55
60
65
70
06/01 06/08 06/15 06/22 06/29 07/06 07/13 07/20 07/27 08/03 08/10 08/17 08/24 08/31 09/07 09/14 09/21 09/28
Te
mp
era
ture
(°F
)
DAY
RUSH08_BASE- Rush Creek 2008
Rush Creek: OLD Highway 395 Avg24Rush Creek: County Road Avg24Parker Creek: Parker mouth Avg24Rush Creek: OLD Highway 395 ValidationRush Creek: County Road ValidationParker Creek: Parker mouth Validation
Shepard et al. Rush Creek Temperature Model Calibration Final Draft – November 2009
Page - 25
Figure 9. Daily error in predicted average water temperatures at Old Highway 395 and County Road in Rush Creek and
at the mouth of Parker Creek during 2008 using the “base” conditions without any flow loss or gain (RUSH08_BASE) StreamTemp model. One day’s difference between predicted and measured average daily water temperature (September 1) for Parker Creek below -1.5˚F is not shown.
-1.5
-1.0
-0.5
0.0
0.5
1.0
1.5
2.0
2.5
3.0
3.5
4.0
4.5
06/01 06/08 06/15 06/22 06/29 07/06 07/13 07/20 07/27 08/03 08/10 08/17 08/24 08/31 09/07 09/14 09/21 09/28
Err
or
(°F
)
RUSH08_Base - Rush Creek 2008
Rush Creek: OLD Highway 395Rush Creek: County RoadParker Creek: Parker mouth

Shepard et al. Rush Creek Temperature Model Calibration Final Draft – November 2009
Page - 26
The model consistently over-estimated average water temperatures at the Old Highway 395 site under the base condition. Adding 1.0 cfs of groundwater flow to the top of the Gorge with a groundwater temperature of 48˚F reduced this over-estimate. While there is no empirical data to support this flow addition, it was deemed a reasonable strategy for calibrating the model to provide better temperature predictions. It also seemed reasonable to assume that some groundwater entered the Rush Creek channel between Grant Lake Reservoir and the top of the Gorge. Wind measurements at Cain Ranch were adjusted by multiplying these daily average wind speeds by factors from 1.5 to 3.5 as one moved down towards Mono Lake. Our observations were that winds always appeared to blow harder as one moved closer to Mono Lake. We also observed that the anemometer at Cain Ranch is located in relatively close proximity to a building and speculate that this location resulted in slightly lower wind speeds being recorded than actually occurred. An exception to these wind speed adjustments occurred when wind speeds were above 10 mph. At these high wind speeds we found that these reach adjustments over-estimated the amount of cooling, so wind speeds over 10 mph were adjusted downward to 8 mph. Wind adjustments were made to obtain better calibration results. Adjustments to a single parameter and for combinations of parameters were tested. The model was re-run with many combinations of these adjusted values for several different years and input values that provided the best predictive capability (lower mean error and fewer daily differences >1˚F in predicted versus measured average water temperatures). An initial “best” model was selected based on the model’s ability to accurately predict measured average daily water temperatures over the most years. The initial “best” model had relatively good predictive ability for 2008, the primary year for which it was calibrated, with an overall mean error of 0.06˚F and less than 13% of the daily average temperature predictions being more than 1˚F different than observed values (Appendix C, RUSH08BEST3A model). Mean error was 0.15˚F at Old Highway 395, 0.16˚F at County Road, and -0.13˚F in Parker Creek at its mouth. Predicted daily average temperatures appeared very reasonable when compared to observed daily average temperatures for the calibration year (Figures 10 and 11). The initial best model did not include the flow augmentation from the 5-Siphon Bypass. This initial model did a relatively poor job of predicting water temperatures during June because 5-Siphon Bypass flows that were being added to the upper channel of Rush Creek had not been included in the data set (Figure 11). When 5-Siphon Bypass flows were included in the model we observed a dramatic improvement in predictions of average daily temperatures for those days when 5-Siphon Bypass flows occurred. This final “best” model (RUSH08_5_SIPHON_BEST) had an overall mean error of 0.07 and less than 8% of the predicted mean daily temperatures were more than 1˚F different than observed daily mean temperatures for the entire summer period of 2008 (less than 4% were more than 1˚C different; Figures 12 and 13). We considered this our final “best” model and provide full input and output parameter diagnostics in Appendix D.
Shepard et al. Rush Creek Temperature Model Calibration Final Draft – November 2009
Page - 27
Figure 10. Daily predicted (blue and green symbols) and observed (red symbols) average water temperatures at Old
Highway 395 and County Road in Rush Creek and at the mouth of Parker Creek during 2008 using the “best” (RUSH08BEST3A) StreamTemp model.
45
50
55
60
65
70
06/01 06/08 06/15 06/22 06/29 07/06 07/13 07/20 07/27 08/03 08/10 08/17 08/24 08/31 09/07 09/14 09/21 09/28
Te
mp
era
ture
(°F
)
DAY
RUSH08Best3a - Rush Creek 2008
Rush Creek: OLD Highway 395 Avg24Rush Creek: County Road Avg24Parker Creek: Parker mouth Avg24Rush Creek: OLD Highway 395 ValidationRush Creek: County Road ValidationParker Creek: Parker mouth Validation

Shepard et al. Rush Creek Temperature Model Calibration Final Draft – November 2009
Page - 28
Figure 11. Daily error in predicted average water temperatures at Old Highway 395 and County Road in Rush Creek and
at the mouth of Parker Creek during 2008 using the “best” (RUSH08BEST3A) StreamTemp model. Shaded area shows error introduced by excluding 5-Siphon Bypass flows. One day’s difference between predicted and measured average daily water temperature (September 1) for Rush Creek at the County Road culvert below negative 2.5˚F is not shown.
-2.5
-2.0
-1.5
-1.0
-0.5
0.0
0.5
1.0
1.5
2.0
2.5
3.0
06/01 06/08 06/15 06/22 06/29 07/06 07/13 07/20 07/27 08/03 08/10 08/17 08/24 08/31 09/07 09/14 09/21 09/28
Err
or
(°F
)
RUSH08Best3A- Rush Creek 2008
Rush Creek: OLD Highway 395Rush Creek: County RoadParker Creek: Parker mouth

Shepard et al. Rush Creek Temperature Model Calibration Final Draft – November 2009
Page - 29
Figure 12. Daily error in predicted average water temperatures at Old Highway 395 and County Road in Rush Creek and
at the mouth of Parker Creek during 2008 using the final “best” (RUSH08_5_SIPHON_BEST) StreamTemp model.
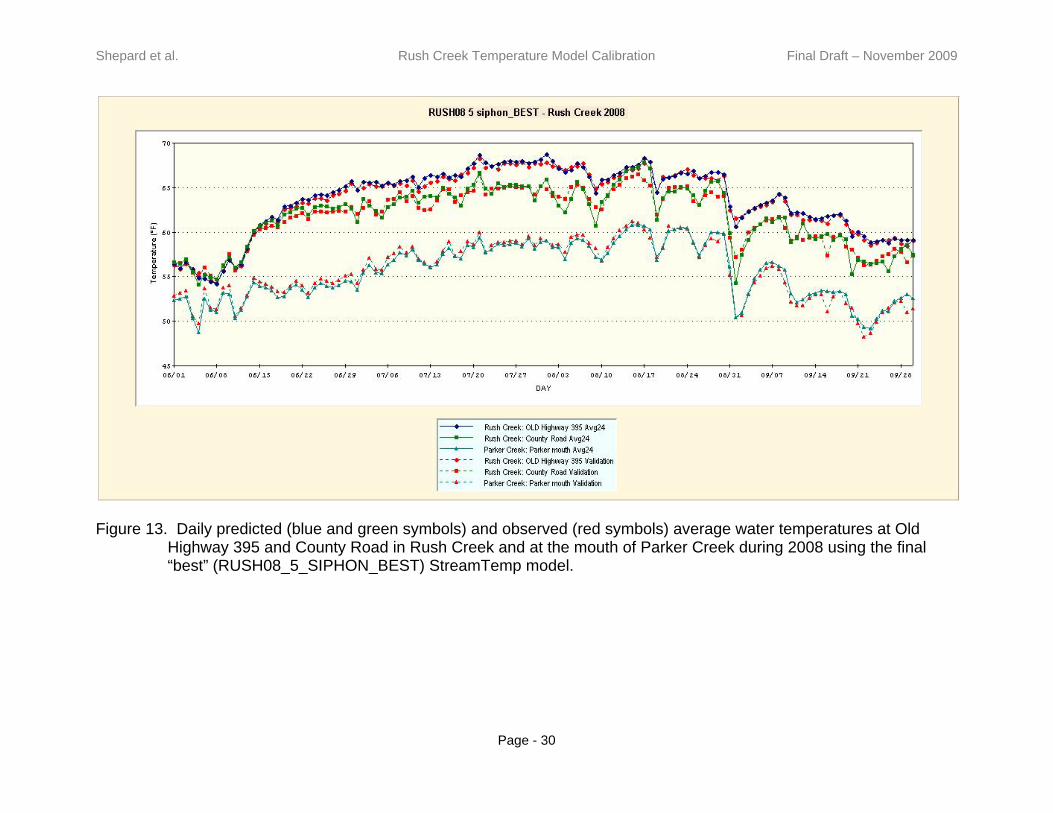
Shepard et al. Rush Creek Temperature Model Calibration Final Draft – November 2009
Page - 30
Figure 13. Daily predicted (blue and green symbols) and observed (red symbols) average water temperatures at Old
Highway 395 and County Road in Rush Creek and at the mouth of Parker Creek during 2008 using the final “best” (RUSH08_5_SIPHON_BEST) StreamTemp model.

Shepard et al. Rush Creek Temperature Model Calibration Final Draft – November 2009
Page - 31
We noted that on September 1, 2008 the model did a poor job of predicting average water temperatures at most calibration sites. The weather changed dramatically from August 30, when the average air temperature was 75˚F, to September 1, when the average air temperature was 49˚F, indicating a cold front moved swiftly into the basin. Another indication of the rapidly changing weather during this 48-hour period was that the average wind speed increased from about 4 mph on August 30, to over 8 mph on August 31, to over 14 mph on September 1. The StreamTemp model uses 24-hour averages to make predictions and it is likely that the water did not actually cool down as fast as the model predicted on these days as this cold front moved into the basin.
Validation
Validation of the final “best” calibration model for the period July 22 to September 30, 2007 indicated that the model did an excellent job of predicting daily average water temperatures in Walker and Parker creeks, but did a poorer job in Rush Creek with many predictions off by 2˚F or more (Figure 14). Since these 2007 data were used to calibrate the model for Walker Creek, it is not surprising that Walker Creek predictions were relatively good. For Rush Creek, it is possible that using the Lee Vining, California climate station rather than the Cain Ranch station produced these slightly poorer predicted temperatures, although the trends in temperatures over time were tracked relatively well. In 2006, an extremely high flow year, the model performed well for the Narrows, Parker, Walker sites after July 30 when flows in upper Rush Creek had dropped below 150 cfs, but extremely poorly at the County Road site (Figure 15). Prediction errors for the Narrows, Parker, and Walker sites after July 30 were generally less than 2˚F (and usually < 1˚F), except for a few days in Walker Creek during early September. However, prediction errors were usually over 5˚F for the County Road site. Even though the model didn't perform well in Rush Creek during 2006, we typically will not be concerned about warm water temperatures during this "wet-year" type because colder water from snowpack melting should maintain relatively cool temperatures later into the summer (even after flows have dropped below 150 cfs). We also speculate that the differences between the predicted and observed average daily water temperatures that occurred at the County Road site in 2006 were most likely caused by the fact that flows during 2006 remained extremely high until late into the summer and much of these high flows went out of the channel over the floodplain (M&T, Inc. 2007). High floodplain flows in 2006 were trapped on the floodplain in side channels and side channel ponds where it may have persisted for days to weeks before flowing back into either the groundwater or the channel (M&T, Inc. 2007). Warming of this floodplain water likely occurs and the temperature model would not account for this additional warming effect.

Shepard et al. Rush Creek Temperature Model Calibration Final Draft – November 2009
Page - 32
Figure 14. Validation of the final best model developed in 2008 with 2007 data from July 22 through September 30.
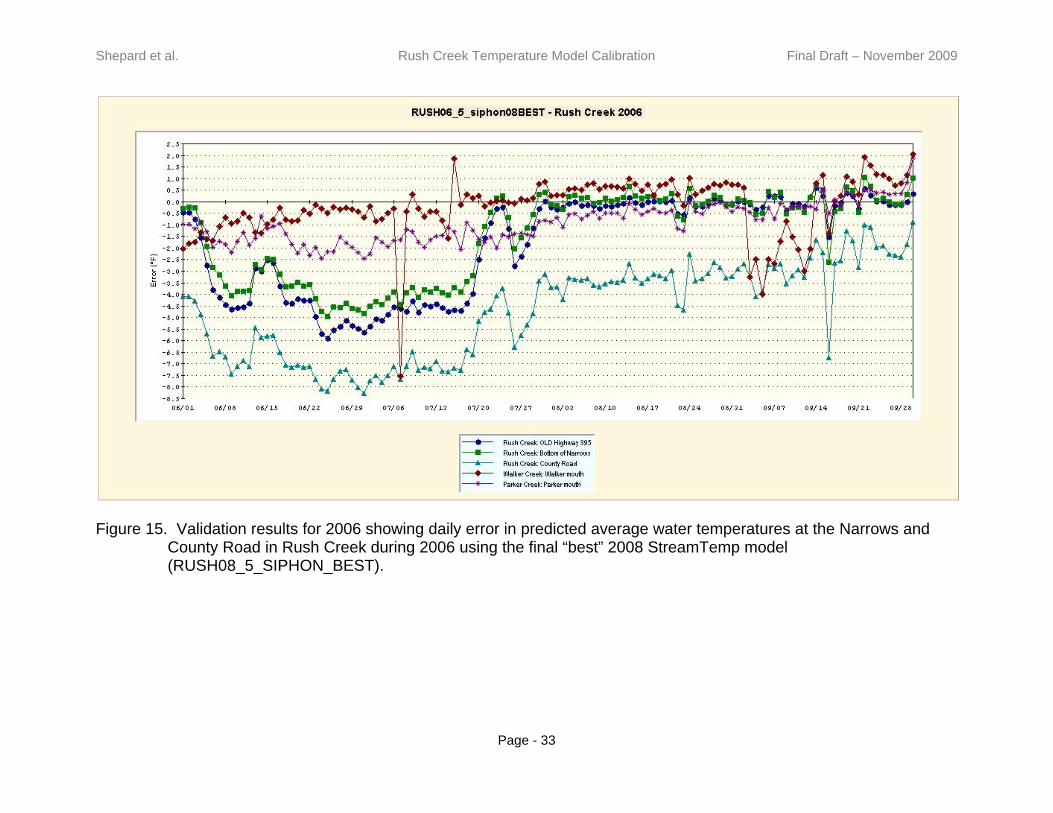
Shepard et al. Rush Creek Temperature Model Calibration Final Draft – November 2009
Page - 33
Figure 15. Validation results for 2006 showing daily error in predicted average water temperatures at the Narrows and
County Road in Rush Creek during 2006 using the final “best” 2008 StreamTemp model (RUSH08_5_SIPHON_BEST).

Shepard et al. Rush Creek Temperature Model Calibration Final Draft – November 2009
Page - 34
For the year 2001 the final “best” calibration model did very well with very few days of predicted errors higher than 2˚F (Figure 16). For both these years solar radiation data from Tioga Pass were not available, so the percent of sunshine was computed from daily solar radiation data daily data from Tioga Pass for 2006. Model outputs did not change much whether these 2006 daily solar radiation estimates or 50% sunshine each day were used. It may be that actual daily sunshine (cloud cover) could have been much different than these arbitrary estimates and these differences may have affected temperature estimates. Validation of the final “best” calibration model (RUSH08_5_siphon_BEST) for the summer of 2000 indicated that the model did a good job of predicting average daily water temperatures at the Narrows and County Road in Rush Creek during 2000 using the model calibrated for 2008 (Figure 17). While prediction errors for many days were >2˚F, not many days had prediction errors higher than 3˚F. When all these years were combined for all flows during the summer that could be modeled predictions of average daily water temperatures were generally good, except for County Road during 2006 and County Road and the Narrows during 2007 (Figure 18). When only flows < 150 cfs for all years were modeled the predictions of daily average water temperatures were good with a mean error in predictions of -0.038˚F. Predictions at all model calibration nodes were very good, except for the County Road node during a few years (Figure 19).
Minimum and Maximum Daily Water Temperature Predictions
Although the StreamTemp model has only limited ability to predict daily minimum and maximum water temperatures we evaluated the best model’s ability to predict minimum and maximum daily water temperatures for the summer of 2008, the year for which the model was calibrated. Predicted maximum daily water temperatures were much lower than measure maximum daily water temperatures and predicted minimum daily water temperatures were much higher than measured minimum daily water temperatures (Figure 20). At Old Highway 395 predicted maximum daily water temperatures were about 5 to 7˚F lower than measured maximum daily water temperatures and at the County Road culvert predicted maximum daily temperatures were 7 to 8˚F lower than measured maximum daily water temperatures. These results confirm that the StreamTemp model did a relatively poor job of predicting minimum and maximum daily water temperatures. The reason for these relatively poor predictions is that the model computes 24-hour averages. Thus, this model has limited ability to predict these minimums and maximums and thus cannot be reliably used to predict daily ranges in water temperatures.

Shepard et al. Rush Creek Temperature Model Calibration Final Draft – November 2009
Page - 35
Figure 16. Validation results for 2001 showing daily error in predicted average water temperatures at the Narrows and
County Road in Rush Creek during 2001 using the final “best” 2008 StreamTemp model (RUSH08_5_SIPHON_BEST).

Shepard et al. Rush Creek Temperature Model Calibration Final Draft – November 2009
Page - 36
Figure 17. Validation results for 2000 showing daily error in predicted average water temperatures at the Narrows and
County Road in Rush Creek during 2000 using the final “best” 2008 StreamTemp model (RUSH08_5_SIPHON_BEST).

Shepard et al. Rush Creek Temperature Model Calibration Final Draft – November 2009
Page - 37
Figure 18. Prediction errors for daily average water temperatures for all summer flows during all model years.

Shepard et al. Rush Creek Temperature Model Calibration Final Draft – November 2009
Page - 38
Figure 19. Prediction errors for daily average water temperatures for summer flows < 150 cfs during all model years.

Shepard et al. Rush Creek Temperature Model Calibration Final Draft – November 2009
Page - 39
Figure 20. Comparison of predicted versus measured maximum and minimum daily water temperatures at Old Highway 395 (top) and County Road (bottom) of Rush Creek during the summer of 2008. Predictions of maximum daily water temperatures were made with the best calibration of the StreamTemp model for the year 2008 that included the 5-Siphon Bypass (RUSH08_5_SIPHON_BEST).
50
55
60
65
70
75
80
6/1 7/1 8/1 9/1
Temperature (F)
Date
Old Highway 395Measured
Predicted
50
55
60
65
70
75
80
6/1 7/1 8/1 9/1
Temperature (F)
Date
County RoadMeasuredPredictedMeasured

Shepard et al. Rush Creek Temperature Model Calibration Final Draft – November 2009
Page - 40
Conclusions and Recommendations
Other than the predictions for the County Road site during 2006 the temperature model as calibrated appeared to reasonably predict average daily water temperatures and summer trends in water temperatures were reasonably tracked. This validation testing indicated that the model should provide reasonable comparative results among different flow scenarios, as long as the flows tested fall within the range of flows used to calibrate the model. The final best model had: 1) R-squared = 0.98; 2) mean error of 0.07˚F; 3) probable error = 0.43˚F; 4) maximum error = -2.9˚F; 5) <8% of the predicted mean daily temperatures were >1˚F different than observed daily mean temperatures; and 6) error bias = 0.02˚F for the year 2008, the year for which the model was calibrated, while the mean error was -0.04˚F for flows <150 cfs across all years. Using these criteria we believe we have a reasonable temperature model to use for evaluating how different flow scenarios affect average daily water temperatures in the Rush Creek system below Grant Lake Reservoir. However, the model had limited ability to reasonably predict maximum daily water temperatures. We again caution that due to the dynamic nature of the stream channel in Rush Creek, particularly in lower Rush Creek below the Narrows, that model predictions of water temperatures should only be used to compare flow scenarios for channel conditions that occurred in 2008. If channel conditions change, as we believe they will, additional channel and flow measurements should be made to re-calibrate the model. We also caution that any mathematical model only represents reality and while these models are useful for comparing different scenarios, they often do not accurately predict reality. Since collaborators working to better the ecological condition within the Mono Basin (through the California State Water Resources Control Board) have agreed to use an adaptive management process to manage water allocation in the basin, we assume that monitoring of flow conditions, Grant Lake Reservoir and Mono Lake elevations, water temperatures, fish populations, and other measures of ecological condition will continue so effects of different test flows on ecological conditions can be quantified. While all monitoring may not need to be as intensive as that which has occurred in the recent past, we recommend that enough monitoring be conducted to evaluate potential changes in these ecological conditions that may be caused or influenced by changes in flow regimes. This monitoring is a critical part of any adaptive management process (i.e., Evans et al. 1987; Milliman et al. 1987). In addition to the above monitoring, we recommend the following as critical data that will be necessary to further refine the temperature model and allow for better predictions and validation of the model.
1. Water temperatures should be measured at a minimum of one-hour intervals from May 1 through October 31 in Rush Creek immediately above Grant Lake Reservoir, at the head of the MGORD, at the intake at the 5-Siphon Bypass, at the outflow of the 5-Siphon Bypass into Rush Creek, where the 5-Siphon Bypass flows enter the Rush Creek channel below the MGORD, and in Rush Creek immediately above the mouth of Parker Creek.
Shepard et al. Rush Creek Temperature Model Calibration Final Draft – November 2009
Page - 41
2. Synoptic flow studies (flow measurements taken at regular spatial intervals along the length of the channel over short time periods) to document flow loss or gain along the stream should be completed in Rush Creek from the top of the MGORD to Mono Lake, in Parker Creek from the LADWP conduit to its terminus at Rush Creek, in Walker Creek from the LADWP conduit to its terminus at Rush Creek, and from the outflow of the 5-Siphon Bypass to its terminus at Rush Creek. Ideally, these synoptic flow studies should be done during several different seasons during different flow year types (i.e. dry, dry/normal, wet).
3. Better wetted width to flow relationships need to be developed for all reaches in Rush, Parker, and Walker creeks by measuring wetted widths at a variety of flows across several cross-sections within each reach. Cross-sections should represent the reach channel characteristics.
Acknowledgements
We wish to thank the Los Angeles Department of Water and Power, especially Bruk Moges, Paul Pau, and Mark Hanna, for funding this work under the direction of California State Water Resources Control Board and for providing climate data from their meterological station at Cain Ranch and flow data for all their flow monitoring stations. We would also like to thank Dave Martin of LADWP and his field staff for help doing shade surveys of Rush Creek. We would also like to thank the California State Water Resources Control Board for facilitating the collaborative effort that resulted in this study. Darren Mierau and Bill Trush of M&T kindly provided water temperature data, stream channel cross-section measurements, synoptic flow data, and information on channel geomorphology. Don Bremm and Thomas Payne of Thomas R. Payne and Associates reviewed an earlier draft of this report and StreamTemp model runs and provided suggestions that improved both the model and this report.
References
Alfredsen, K. and E. Tesaker. 2002. Winter habitat assessment strategies and incorporation of winter habitat in the Norwegian Habitat Assessment Tools. Hydrological Processes 16:927-936.
Bartholow, J.M. 1989. Stream temperature investigations: field and aquatic methods.
Instream Flow Information Paper Number 13. U.S. Fish and Wildlife Service Biological Report 89(17), Fort Collins, Colorado.
Bartholow, J.M. 1990. Stream temperature model. Pages IV-20 to IV-47 in W.S.
Platts, editor. Managing fisheries and wildlife on rangelands grazed by livestock: a guidance and reference document for biologists. W.S. Platts and Associates for the Nevada Department of Wildlife, Carson City, Nevada. December, 1990.
Bartholow, J.M. 1991. A modeling assessment of the thermal regime for an urban sport
fishery. Environmental Management 15(6):833-845.

Shepard et al. Rush Creek Temperature Model Calibration Final Draft – November 2009
Page - 42
Bartholow, J.M. 2000. The stream segment and stream network temperature models: self-study course, version 2.0. U.S. Geological Survey Open File Report 99-112, Fort Collins, Colorado.
California Department of Fish and Game. 1991. Instream flow requirements for brown
trout- Rush Creek, Mono County, California. California Department of Fish and Game Steam Evaluation Report No. 91-2; Volume 1, Sacramento, California.
Cullen, R. T. and S. F. Railsback . 1993. Summer thermal characteristics of Grant
Lake, Mono County, California. Feasibility Study Number 2. Prepared for the Rush Creek Restoration Planning Team by Trihey and Associates, Concord, California.
Elliott, J. M. 1975a. The growth rate of brown trout (Salmo trutta L.) fed on maximum
rations. Journal of Animal Ecology 44:805-821. Elliott, J. M. 1975b. The growth rate of brown trout (Salmo trutta L.) fed on reduced
rations. Journal of Animal Ecology 44:823-842. Elliott, J. M., M. A. Hurley, and R. J. Fryer. 1995. A new, improved growth-model for
brown trout, Salmo trutta. Functional Ecology 9:290-298. Elliott, J. M. and M. A. Hurley. 1999. A new energetics model for brown trout, Salmo
trutta. Freshwater Biology 42:235-246. Elliott, J. M. and M. A. Hurley. 2000. Daily energy intake and growth of piscivorous
brown trout, Salmo trutta. Freshwater Biology 44:237-245. Evans, D. O., B. A. Henderson, N. J. Bax, T. R. Marshall, R. T. Oglesby, and W. J.
Christie. 1987. Concepts and methods of community ecology applied to freshwater fisheries management. Canadian Journal of Fisheries and Aquatic Sciences 44(Suppl. 2):448-470.
Hunter, C., B. Shepard, D. Mierau, K. Knudson, and R. Taylor. 2000. Fisheries
Monitoring Report for Rush, Lee Vining, Parker and Walker Creeks 1999. Los Angeles Department of Water and Power. 32 p.
Hunter, C., B. Shepard, K. Knudson, R. Taylor. 2001. Fisheries Monitoring Report for
Rush, Lee Vining, Parker and Walker Creeks 2000. Los Angeles Department of Water and Power. 32 p.
Hunter, C., B. Shepard, K. Knudson, R. Taylor, M. Sloat and A. Knoche. 2002.
Fisheries Monitoring Report for Rush, Lee Vining, Parker and Walker Creeks 2001. Los Angeles Department of Water and Power. 41 p.
Hunter, C., B. Shepard, K. Knudson, R. Taylor and M. Sloat. 2004a. Fisheries
Monitoring Report for Rush, Lee Vining, Parker and Walker Creeks 2002. Updated report to Los Angeles Department of Water and Power. 42 p.
Shepard et al. Rush Creek Temperature Model Calibration Final Draft – November 2009
Page - 43
Hunter, C., B. Shepard, K. Knudson, R. Taylor and M. Sloat. 2004b. Fisheries
Monitoring Report for Rush, Lee Vining, Parker and Walker Creeks 2003. Los Angeles Department of Water and Power. 62 p.
Hunter, C., R. Taylor, K. Knudson, B. Shepard, and M. Sloat. 2005. Fisheries
Monitoring Report for Rush, Lee Vining, Parker and Walker Creeks 2004. Los Angeles Department of Water and Power. 54 p.
Hunter, C., R. Taylor, K. Knudson and B. Shepard. 2006. Fisheries Monitoring Report
for Rush, Lee Vining, Parker and Walker Creeks 2005. Los Angeles Department of Water and Power. 64 p.
Hunter, C., R. Taylor, K. Knudson and B. Shepard, K. Knudson, R. Taylor. 2007.
Fisheries Monitoring Report for Rush, Lee Vining, Parker and Walker Creeks 2006. Los Angeles Department of Water and Power. 74 p.
Hunter, C., R. Taylor, K. Knudson and B. Shepard. 2008. Fisheries Monitoring Report
for Rush, Lee Vining, Parker and Walker Creeks 2007. Los Angeles Department of Water and Power. 49 p.
Knudson, K., Taylor, R., Shepard, B, and C. Hunter. 2009. Pool and habitat studies on
Rush and Lee Vining creeks. Report to Los Angeles Department of Water Power, Los Angeles, California. 18 p.
McBain and Trush Inc. 2007. Mono Basin Tributaries: Rush, Lee Vining, Walker,
and Parker Creeks. Monitoring Results and Analyses for Runoff Season 2006-2007. Prepared for Los Angeles Department of Water and Power by McBain and Trush, Inc. Aracata, California. 35 p.
McBain and Trush Inc. 2009. Mono Basin Tributaries: Rush, Lee Vining, Walker,
and Parker Creeks. Monitoring Results and Analyses for Runoff Season 2008-09. Prepared for Los Angeles Department of Water and Power by McBain and Trush, Inc. Aracata, California. 40 p.
Milliman, S. R., A. P. Grima, and C. J. Walters. 1987. Policy making within an adaptive
management framework, with an application to lake trout (Salvelinus namaycush) management. Canadian Journal of Fisheries and Aquatic Sciences 44(Suppl. 2):425-430.
Ojanguren, A. F., F. G. Reyes-Gavilan, and F. Brana. 2001. Thermal sensitivity of
growth, food intake and activity of juvenile brown trout. Journal of Thermal Biology 26:165-170.
Raleigh, R. F., L. D. Zuckerman, and P. C. Nelson. 1986. Habitat suitability index
models and instream flow suitability curves: brown trout. Report FWS/OBS-82/10.124, USDI Fish and Wildlife Service, Washington, D.C.

Shepard et al. Rush Creek Temperature Model Calibration Final Draft – November 2009
Page - 44
Shepard, B., R. Taylor, K. Knudson, and C. Hunter. 2009a. Effects of flow, reservoir
storage, and water temperatures on trout in lower Rush and Lee Vining creeks, Mono County, California. Report to Los Angeles Department of Water Power, Los Angeles, California. 64 p.
Shepard, B., R. Taylor, K. Knudson, and C. Hunter. 2009b. Addendum (September 1,
2009): Effects of flow, reservoir storage, and water temperatures on trout in lower Rush and Lee Vining creeks, Mono County, California. Report to Los Angeles Department of Water Power, Los Angeles, California. 3 p.
Stickler, M. and K. T. Alfredsen. 2009. Anchor ice formation in streams: a field study.
Hydrological Processes 23:2307-2315. Taylor, R., Mierau, D., Trush, B., Knudson, K, Shepard, B, and C. Hunter. 2009. Rush
and Lee Vining Creeks - Instream Flow Study. Report to Los Angeles Department of Water Power, Los Angeles, California. 79 p.
Theurer, F.D., K.A. Voos, and W.J. Miller. 1984. Instream water temperature model.
Fish and Wildlife Service, Instream Flow Information Paper 16, FWS/OBS-84/15. Fort Collins, Colorado.
Thomas R. Payne and Associates. 2005. Stream temperature model for Windows.
Version 1.0.4. Arcata, California, (http://www.northcoast.com/~trpa).
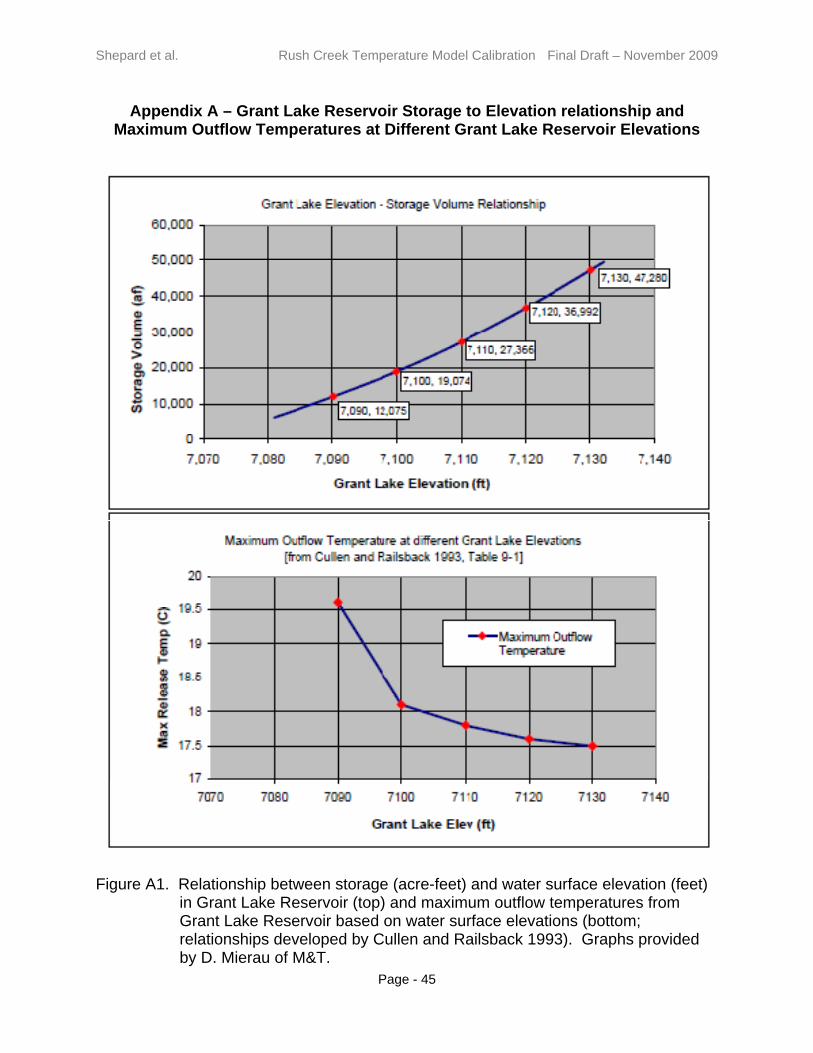
Shepard et al. Rush Creek Temperature Model Calibration Final Draft – November 2009
Page - 45
Appendix A – Grant Lake Reservoir Storage to Elevation relationship and Maximum Outflow Temperatures at Different Grant Lake Reservoir Elevations
Figure A1. Relationship between storage (acre-feet) and water surface elevation (feet)
in Grant Lake Reservoir (top) and maximum outflow temperatures from Grant Lake Reservoir based on water surface elevations (bottom; relationships developed by Cullen and Railsback 1993). Graphs provided by D. Mierau of M&T.

Shepard et al. Rush Creek Temperature Model Calibration Final Draft – November 2009
Page - 46
Appendix B – Data Availability
Table B1. Number of days per month air temperature data were available from the Cain Ranch and
Lee Vining, California by year. Shaded area represents the summer months modeled with the water temperature model.
Month
SITENAME YEAR 1 2 3 4 5 6 7 8 9 10 11 12
Cain Ranch 1991 31 28 31 30 31 30 31 31 30 31 30 31
Cain Ranch 1992 31 29 31 30 31 30 31 31 30 31 30 31
Cain Ranch 1993 31 28 31 30 31 30 31 31 30 31 30 31
Cain Ranch 1994 31 28 31 30 31 30 31 31 30 31 30 31
Cain Ranch 1995 31 28 31 30 31 30 31 31 30 31 30 31
Cain Ranch 1996 31 29 31 30 31 30 31 31 30 31 30 31
Cain Ranch 1997 31 28 31 30 31 30 31 31 30 31 30 31
Cain Ranch 1998 31 28 31 30 31 30 31 31 30 31 30 31
Cain Ranch 1999 31 28 31 30 31 30 31 31 30 31 30 31
Cain Ranch 2000 31 29 31 30 31 30 31 31 30 31 30 31
Cain Ranch 2001 31 28 31 30 31 30 31 31 30 31 30 31
Cain Ranch 2002 31 28 31 30 31 30 31 31 30 31 30 31
Cain Ranch 2003 31 28 31 30 31 30 31 31 30 31 30 31
Cain Ranch 2004 31 29 31 30 31 30 31 31 30 31 30 31
Cain Ranch 2005 31 28 31 30 31 30 31 31 30 31 30 31
Cain Ranch 2006 31 28 31 30 31 30 31 31 30 31 30 31
Cain Ranch 2007 31 24 3 0 0 0 16 4 1 0 0 0
Cain Ranch 2008 0 14 19 2 9 30 31 31 30 27
Lee Vining 2000 5 30 31
Lee Vining 2001 32 28 30 30 31 30 31 31 28 30 30 31
Lee Vining 2002 30 28 31 30 29 23 30 25 23 31 29 31
Lee Vining 2003 31 26 31 30 31 27 31 28 27 29 30 31
Lee Vining 2004 31 27 31 30 25 24 31 31 30 23 21 30
Lee Vining 2005 31 28 31 29 29 28 30 27 30 31 30 31
Lee Vining 2006 31 28 31 30 31 30 31 31 28 31 30 31
Lee Vining 2007 31 28 31 30 31 30 31 31 30 31 30 31
Lee Vining 2008 2 30 25 25 30

Shepard et al. Rush Creek Temperature Model Calibration Final Draft – November 2009
Page - 47
Table B2. Number of days per month water temperature data were available from several sites in Rush, Parker and Walker creeks (Stream) by year. Shaded area represents the summer months modeled with the water temperature model. Data were provided by M&T.
Month
Stream Year 1 2 3 4 5 6 7 8 9 10 11 12
Parker Creek ‐ Lower 2004 26 30 31 31 30 31 30
Parker Creek ‐ Lower 2005 22 30 31
Parker Creek ‐ Lower 2006 31 28 31 30 31 30 31 31 30 31 30 31
Parker Creek ‐ Lower 2007 31 28 31 30 31 30 31 31 30 31 30 31
Parker Creek ‐ Lower 2008 31 29 31 30 31 30 31 31 30 21
Parker Creek ‐ Upper 1999 24 31
Parker Creek ‐ Upper 2000 31 29 31 30 31 30 31 31 30 31 30 31
Parker Creek ‐ Upper 2001 31 28 31 30 31 30 31 31 30 31 30 31
Parker Creek ‐ Upper 2002 31 28 31 30 31 30 31 31 30 31 30 31
Parker Creek ‐ Upper 2003 31 28 31 30 31 30 31 31 30 31 30 31
Parker Creek ‐ Upper 2004 31 29 31 30 31 30 31 31 30 31 30 31
Parker Creek ‐ Upper 2005 31 28 31 30 31 30 31 16 31 30 31
Parker Creek ‐ Upper 2006 31 28 31 30 31 30 31 31 30 31 30 31
Parker Creek ‐ Upper 2007 31 28 31 30 31 30 31 31 30 31 30 31
Parker Creek ‐ Upper 2008 31 29 31 30 31 30 31 31 30 21
Rush Creek ‐ 395 2005 30 31 31 30 31 30 31
Rush Creek ‐ 395 2006 31 28 31 30 31 30 31 31 30 31 30 31
Rush Creek ‐ 395 2007 31 28 31 30 31 30 31 31 30 31 30 31
Rush Creek ‐ 395 2008 31 29 31 30 31 30 31 31 30 21
Rush Creek ‐ At Narrows 1999 22 30 31
Rush Creek ‐ At Narrows 2000 31 29 31 30 31 30 31 31 30 31 30 31
Rush Creek ‐ At Narrows 2001 31 28 31 30 31 30 31 31 30 31 30 31
Rush Creek ‐ At Narrows 2002 31 28 31 5 15 31 30 31
Rush Creek ‐ At Narrows 2003 31 28 31 30 31 19 31 30 31
Rush Creek ‐ At Narrows 2004 31 29 31 30 31 30 31 31 30 19
Rush Creek ‐ At Narrows 2005 10 31
Rush Creek ‐ At Narrows 2006 31 28 31 30 31 30 31 31 30 18
Rush Creek ‐ County Rd 1999 22 30 31
Rush Creek ‐ County Rd 2000 31 29 31 30 31 30 31 31 30 31 30 31
Rush Creek ‐ County Rd 2001 31 28 31 30 31 30 31 31 30 31 30 31
Rush Creek ‐ County Rd 2002 31 28 31 12 31 30 31 31 30 31 30 31
Rush Creek ‐ County Rd 2003 31 28 21 20 30 31 30 31
Rush Creek ‐ County Rd 2004 31 29 31 30 31 30 31 31 30 31 30 31
Rush Creek ‐ County Rd 2005 31 28 31 30 31 30
Rush Creek ‐ County Rd 2006 1 30 31 31 30 31 30 31
Rush Creek ‐ County Rd 2007 31 28 31 30 31 30 31 31 30 31 30 31

Shepard et al. Rush Creek Temperature Model Calibration Final Draft – November 2009
Page - 48
Month
Stream Year 1 2 3 4 5 6 7 8 9 10 11 12
Rush Creek ‐ County Rd 2008 31 29 31 30 31 30 31 31 30 22
Rush Creek ‐ MGORD 1999 22 30 31
Rush Creek ‐ MGORD 2000 31 29 31 30 31 30 31 31 30 31 30 31
Rush Creek ‐ MGORD 2001 31 28 31 30 31 30 31 31 30 31 30 31
Rush Creek ‐ MGORD 2002 31 28 31 12 31 30 31 31 30 31 30 31
Rush Creek ‐ MGORD 2003 31 28 20 31 30 31
Rush Creek ‐ MGORD 2004 31 29 31 30 6 31
Rush Creek ‐ MGORD 2005 31 28 31 30 31 30 31 31 30 31 30 31
Rush Creek ‐ MGORD 2006 31 28 31 30 31 30 31 31 30 31 30 31
Rush Creek ‐ MGORD 2007 31 28 31 30 31 30 31 31 30 31 30 31
Rush Creek ‐ MGORD 2008 31 29 31 30 31 30 31 27 30 19
Walker Creek ‐ Lower 2004 26 30 31 31 30 31 30 31
Walker Creek ‐ Lower 2005 31 28 31 30 31 30 31 31 30 31 30 31
Walker Creek ‐ Lower 2006 31 28 31 30 31 30 31 31 30 31 30 31
Walker Creek ‐ Lower 2007 31 28 31 30 31 30 31 31 30 31 30 31
Walker Creek ‐ Lower 2008 31 29 18
Walker Creek ‐ Upper 1999 24 31
Walker Creek ‐ Upper 2000 31 29 31 30 31 30 31 31 30 31 30 31
Walker Creek ‐ Upper 2001 31 28 31 30 31 30 31 31 30 31 30 31
Walker Creek ‐ Upper 2002 31 28 31 4 31 30 31
Walker Creek ‐ Upper 2003 31 28 31 30 31 30 31 31 30 31 30 31
Walker Creek ‐ Upper 2004 31 29 31 30 5 27
Walker Creek ‐ Upper 2005 31 28 31 30 31 30 31 29 30 31 30 31
Walker Creek ‐ Upper 2006 31 28 31 30 31 30 31 31 30 31 30 31
Walker Creek ‐ Upper 2007 31 28 31 27 10 31 30 31 30 31
Walker Creek ‐ Upper 2008 31 29 31 30 31 30 31 31 30 22
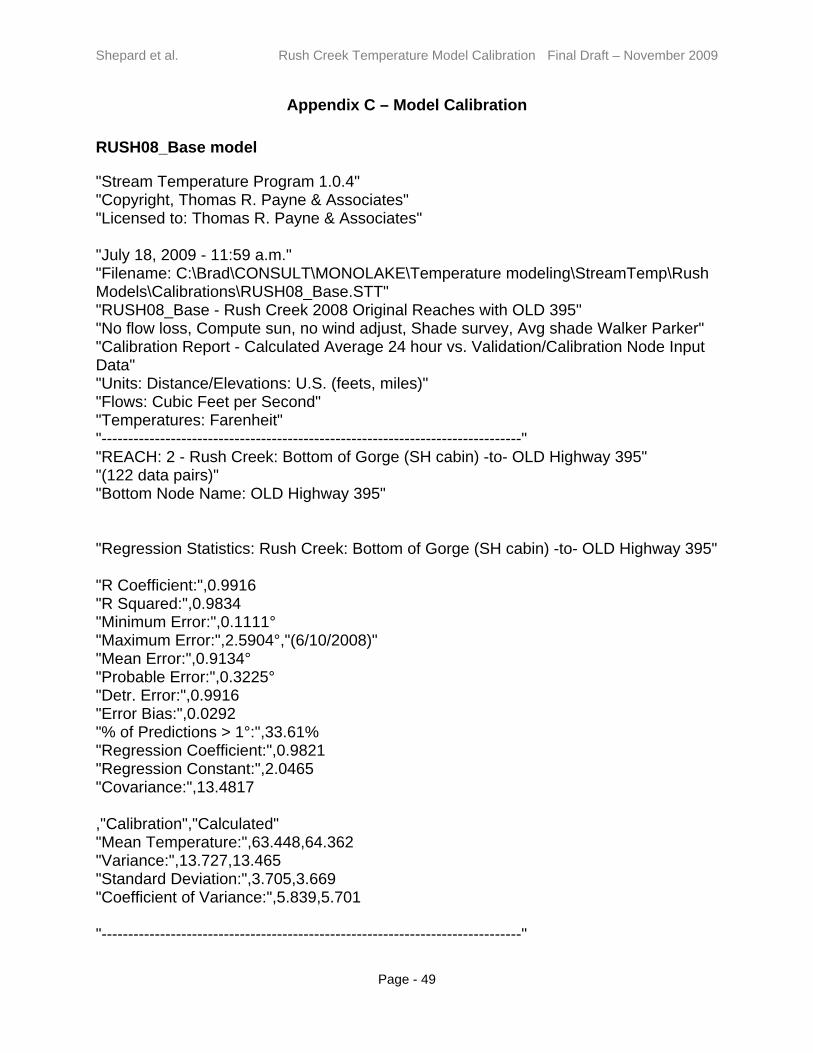
Shepard et al. Rush Creek Temperature Model Calibration Final Draft – November 2009
Page - 49
Appendix C – Model Calibration
RUSH08_Base model
"Stream Temperature Program 1.0.4" "Copyright, Thomas R. Payne & Associates" "Licensed to: Thomas R. Payne & Associates" "July 18, 2009 - 11:59 a.m." "Filename: C:\Brad\CONSULT\MONOLAKE\Temperature modeling\StreamTemp\Rush Models\Calibrations\RUSH08_Base.STT" "RUSH08_Base - Rush Creek 2008 Original Reaches with OLD 395" "No flow loss, Compute sun, no wind adjust, Shade survey, Avg shade Walker Parker" "Calibration Report - Calculated Average 24 hour vs. Validation/Calibration Node Input Data" "Units: Distance/Elevations: U.S. (feets, miles)" "Flows: Cubic Feet per Second" "Temperatures: Farenheit" "-------------------------------------------------------------------------------" "REACH: 2 - Rush Creek: Bottom of Gorge (SH cabin) -to- OLD Highway 395" "(122 data pairs)" "Bottom Node Name: OLD Highway 395" "Regression Statistics: Rush Creek: Bottom of Gorge (SH cabin) -to- OLD Highway 395" "R Coefficient:",0.9916 "R Squared:",0.9834 "Minimum Error:",0.1111° "Maximum Error:",2.5904°,"(6/10/2008)" "Mean Error:",0.9134° "Probable Error:",0.3225° "Detr. Error:",0.9916 "Error Bias:",0.0292 "% of Predictions > 1°:",33.61% "Regression Coefficient:",0.9821 "Regression Constant:",2.0465 "Covariance:",13.4817 ,"Calibration","Calculated" "Mean Temperature:",63.448,64.362 "Variance:",13.727,13.465 "Standard Deviation:",3.705,3.669 "Coefficient of Variance:",5.839,5.701 "-------------------------------------------------------------------------------"

Shepard et al. Rush Creek Temperature Model Calibration Final Draft – November 2009
Page - 50
"REACH: 7 - Rush Creek: Road Ford -to- County Road" "(122 data pairs)" "Bottom Node Name: County Road" "Regression Statistics: Rush Creek: Road Ford -to- County Road" "R Coefficient:",0.9591 "R Squared:",0.9199 "Minimum Error:",-0.0102° "Maximum Error:",4.7027°,"(9/16/2008)" "Mean Error:",1.7052° "Probable Error:",0.62° "Detr. Error:",0.958 "Error Bias:",0.0561 "% of Predictions > 1°:",73.77% "Regression Coefficient:",0.9648 "Regression Constant:",3.8759 "Covariance:",9.9091 ,"Calibration","Calculated" "Mean Temperature:",61.611,63.316 "Variance:",10.271,10.392 "Standard Deviation:",3.205,3.224 "Coefficient of Variance:",5.202,5.091 "-------------------------------------------------------------------------------" "REACH: 12 - Parker Creek: Parker at 395 -to- Parker mouth" "(122 data pairs)" "Bottom Node Name: Parker mouth" "Regression Statistics: Parker Creek: Parker at 395 -to- Parker mouth" "R Coefficient:",0.9813 "R Squared:",0.9629 "Minimum Error:",-0.0145° "Maximum Error:",2.3418°,"(9/29/2008)" "Mean Error:",-0.253° "Probable Error:",0.4268° "Detr. Error:",0.9812 "Error Bias:",0.0386 "% of Predictions > 1°:",5.74% "Regression Coefficient:",0.9566 "Regression Constant:",2.1627 "Covariance:",10.3095
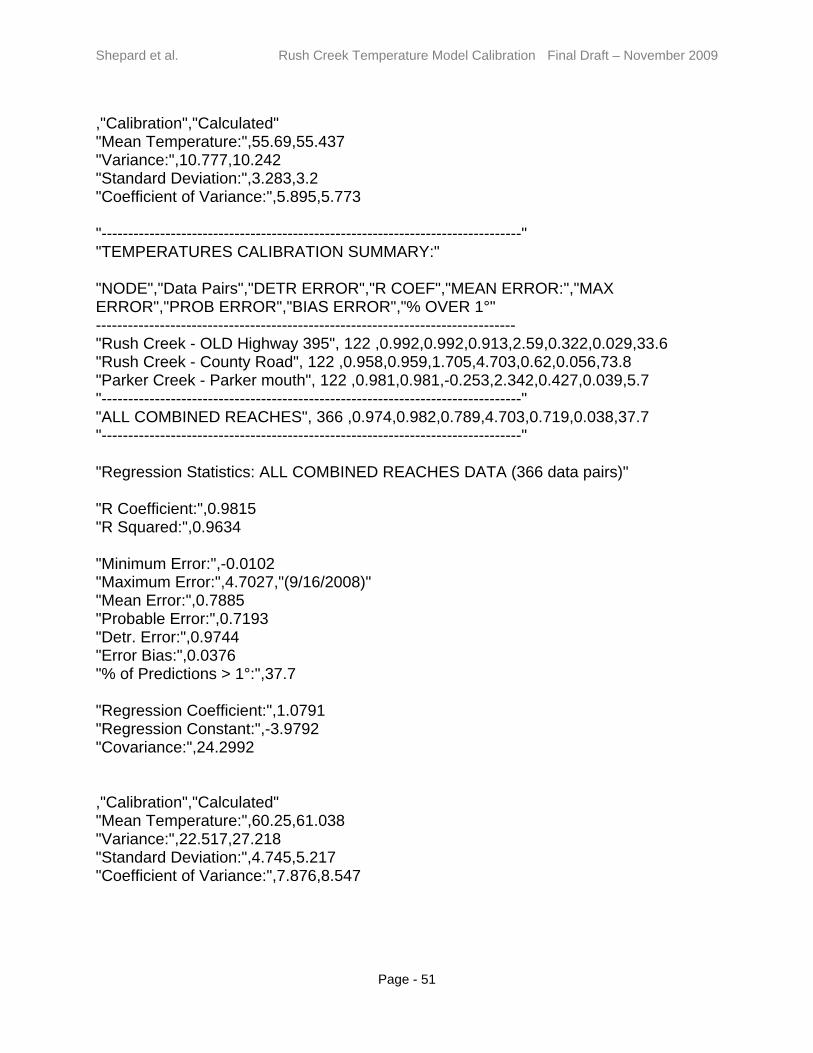
Shepard et al. Rush Creek Temperature Model Calibration Final Draft – November 2009
Page - 51
,"Calibration","Calculated" "Mean Temperature:",55.69,55.437 "Variance:",10.777,10.242 "Standard Deviation:",3.283,3.2 "Coefficient of Variance:",5.895,5.773 "-------------------------------------------------------------------------------" "TEMPERATURES CALIBRATION SUMMARY:" "NODE","Data Pairs","DETR ERROR","R COEF","MEAN ERROR:","MAX ERROR","PROB ERROR","BIAS ERROR","% OVER 1°" ------------------------------------------------------------------------------- "Rush Creek - OLD Highway 395", 122 ,0.992,0.992,0.913,2.59,0.322,0.029,33.6 "Rush Creek - County Road", 122 ,0.958,0.959,1.705,4.703,0.62,0.056,73.8 "Parker Creek - Parker mouth", 122 ,0.981,0.981,-0.253,2.342,0.427,0.039,5.7 "-------------------------------------------------------------------------------" "ALL COMBINED REACHES", 366 ,0.974,0.982,0.789,4.703,0.719,0.038,37.7 "-------------------------------------------------------------------------------" "Regression Statistics: ALL COMBINED REACHES DATA (366 data pairs)" "R Coefficient:",0.9815 "R Squared:",0.9634 "Minimum Error:",-0.0102 "Maximum Error:",4.7027,"(9/16/2008)" "Mean Error:",0.7885 "Probable Error:",0.7193 "Detr. Error:",0.9744 "Error Bias:",0.0376 "% of Predictions > 1°:",37.7 "Regression Coefficient:",1.0791 "Regression Constant:",-3.9792 "Covariance:",24.2992 ,"Calibration","Calculated" "Mean Temperature:",60.25,61.038 "Variance:",22.517,27.218 "Standard Deviation:",4.745,5.217 "Coefficient of Variance:",7.876,8.547

Shepard et al. Rush Creek Temperature Model Calibration Final Draft – November 2009
Page - 52
RUSH08BEST3A model
"Stream Temperature Program 1.0.4" "Copyright, Thomas R. Payne & Associates" "Licensed to: Thomas R. Payne & Associates" "July 18, 2009 - 3:22 p.m." "Filename: C:\Brad\CONSULT\MONOLAKE\Temperature modeling\StreamTemp\Rush Models\Calibrations\RUSH08BEST3a.STT" "RUSH08Best3 - Rush Creek 2008 Original Reaches with OLD 395 - cloud Tioga" "Cain - comp sun, shade surv, wind incr, 1 cfs to Walker, 1.5 to up, 6.5 loss 395" "Calibration Report - Calculated Average 24 hour vs. Validation/Calibration Node Input Data" "Units: Distance/Elevations: U.S. (feets, miles)" "Flows: Cubic Feet per Second" "Temperatures: Farenheit" "-------------------------------------------------------------------------------" "REACH: 2 - Rush Creek: Bottom of Gorge (SH cabin) -to- OLD Highway 395" "(122 data pairs)" "Bottom Node Name: OLD Highway 395" "Regression Statistics: Rush Creek: Bottom of Gorge (SH cabin) -to- OLD Highway 395" "R Coefficient:",0.9872 "R Squared:",0.9746 "Minimum Error:",0.0046° "Maximum Error:",2.4734°,"(6/10/2008)" "Mean Error:",0.1452° "Probable Error:",0.4361° "Detr. Error:",0.9847 "Error Bias:",0.0395 "% of Predictions > 1°:",7.38% "Regression Coefficient:",0.9041 "Regression Constant:",6.2287 "Covariance:",12.4107 ,"Calibration","Calculated" "Mean Temperature:",63.448,63.594 "Variance:",13.727,11.513 "Standard Deviation:",3.705,3.393 "Coefficient of Variance:",5.839,5.335 "-------------------------------------------------------------------------------" "REACH: 7 - Rush Creek: Road Ford -to- County Road" "(122 data pairs)"
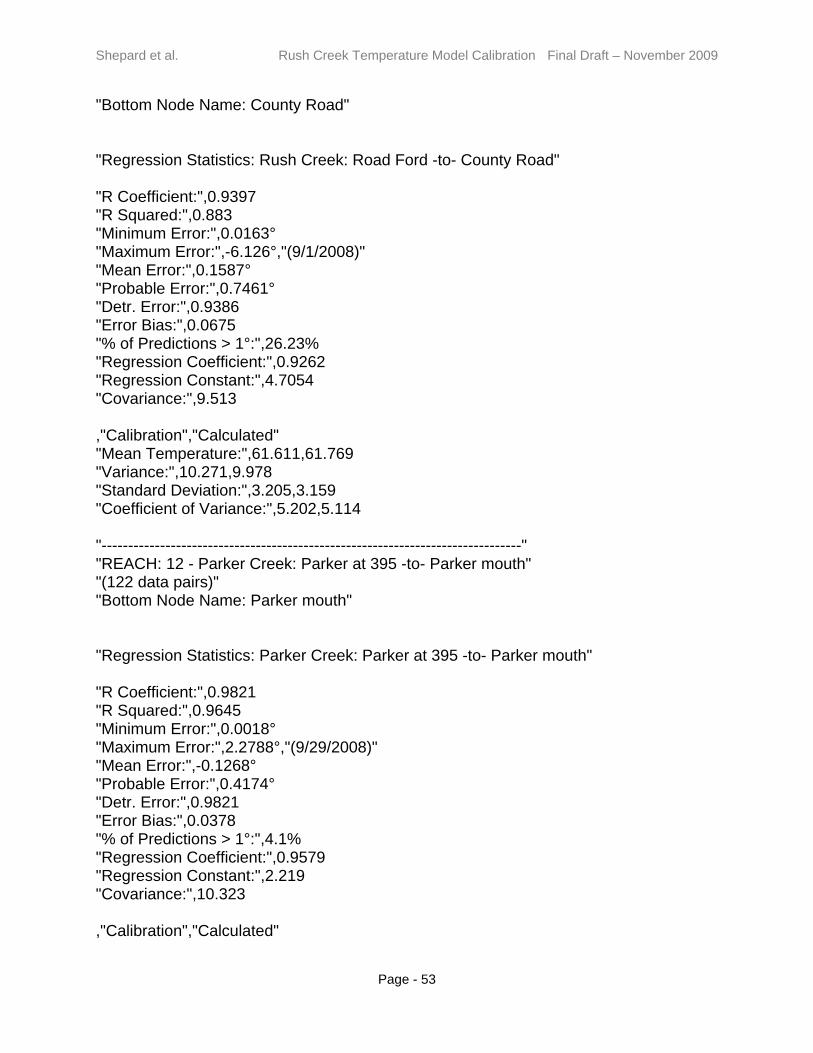
Shepard et al. Rush Creek Temperature Model Calibration Final Draft – November 2009
Page - 53
"Bottom Node Name: County Road" "Regression Statistics: Rush Creek: Road Ford -to- County Road" "R Coefficient:",0.9397 "R Squared:",0.883 "Minimum Error:",0.0163° "Maximum Error:",-6.126°,"(9/1/2008)" "Mean Error:",0.1587° "Probable Error:",0.7461° "Detr. Error:",0.9386 "Error Bias:",0.0675 "% of Predictions > 1°:",26.23% "Regression Coefficient:",0.9262 "Regression Constant:",4.7054 "Covariance:",9.513 ,"Calibration","Calculated" "Mean Temperature:",61.611,61.769 "Variance:",10.271,9.978 "Standard Deviation:",3.205,3.159 "Coefficient of Variance:",5.202,5.114 "-------------------------------------------------------------------------------" "REACH: 12 - Parker Creek: Parker at 395 -to- Parker mouth" "(122 data pairs)" "Bottom Node Name: Parker mouth" "Regression Statistics: Parker Creek: Parker at 395 -to- Parker mouth" "R Coefficient:",0.9821 "R Squared:",0.9645 "Minimum Error:",0.0018° "Maximum Error:",2.2788°,"(9/29/2008)" "Mean Error:",-0.1268° "Probable Error:",0.4174° "Detr. Error:",0.9821 "Error Bias:",0.0378 "% of Predictions > 1°:",4.1% "Regression Coefficient:",0.9579 "Regression Constant:",2.219 "Covariance:",10.323 ,"Calibration","Calculated"
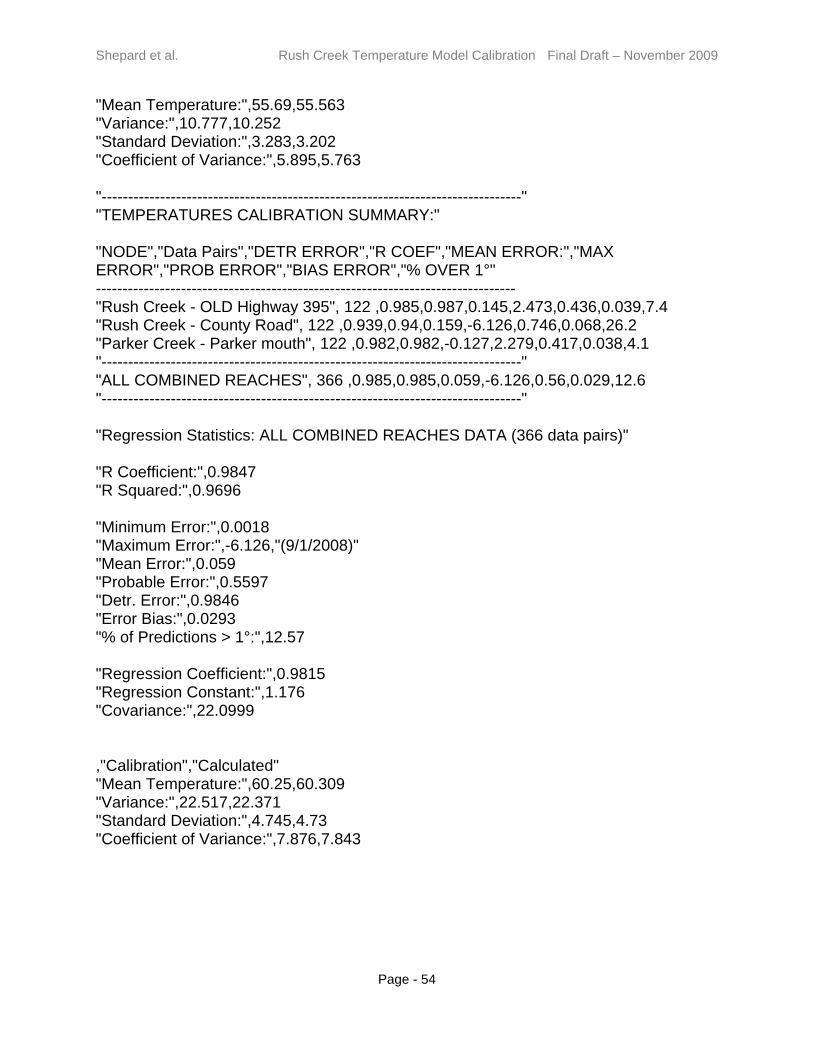
Shepard et al. Rush Creek Temperature Model Calibration Final Draft – November 2009
Page - 54
"Mean Temperature:",55.69,55.563 "Variance:",10.777,10.252 "Standard Deviation:",3.283,3.202 "Coefficient of Variance:",5.895,5.763 "-------------------------------------------------------------------------------" "TEMPERATURES CALIBRATION SUMMARY:" "NODE","Data Pairs","DETR ERROR","R COEF","MEAN ERROR:","MAX ERROR","PROB ERROR","BIAS ERROR","% OVER 1°" ------------------------------------------------------------------------------- "Rush Creek - OLD Highway 395", 122 ,0.985,0.987,0.145,2.473,0.436,0.039,7.4 "Rush Creek - County Road", 122 ,0.939,0.94,0.159,-6.126,0.746,0.068,26.2 "Parker Creek - Parker mouth", 122 ,0.982,0.982,-0.127,2.279,0.417,0.038,4.1 "-------------------------------------------------------------------------------" "ALL COMBINED REACHES", 366 ,0.985,0.985,0.059,-6.126,0.56,0.029,12.6 "-------------------------------------------------------------------------------" "Regression Statistics: ALL COMBINED REACHES DATA (366 data pairs)" "R Coefficient:",0.9847 "R Squared:",0.9696 "Minimum Error:",0.0018 "Maximum Error:",-6.126,"(9/1/2008)" "Mean Error:",0.059 "Probable Error:",0.5597 "Detr. Error:",0.9846 "Error Bias:",0.0293 "% of Predictions > 1°:",12.57 "Regression Coefficient:",0.9815 "Regression Constant:",1.176 "Covariance:",22.0999 ,"Calibration","Calculated" "Mean Temperature:",60.25,60.309 "Variance:",22.517,22.371 "Standard Deviation:",4.745,4.73 "Coefficient of Variance:",7.876,7.843
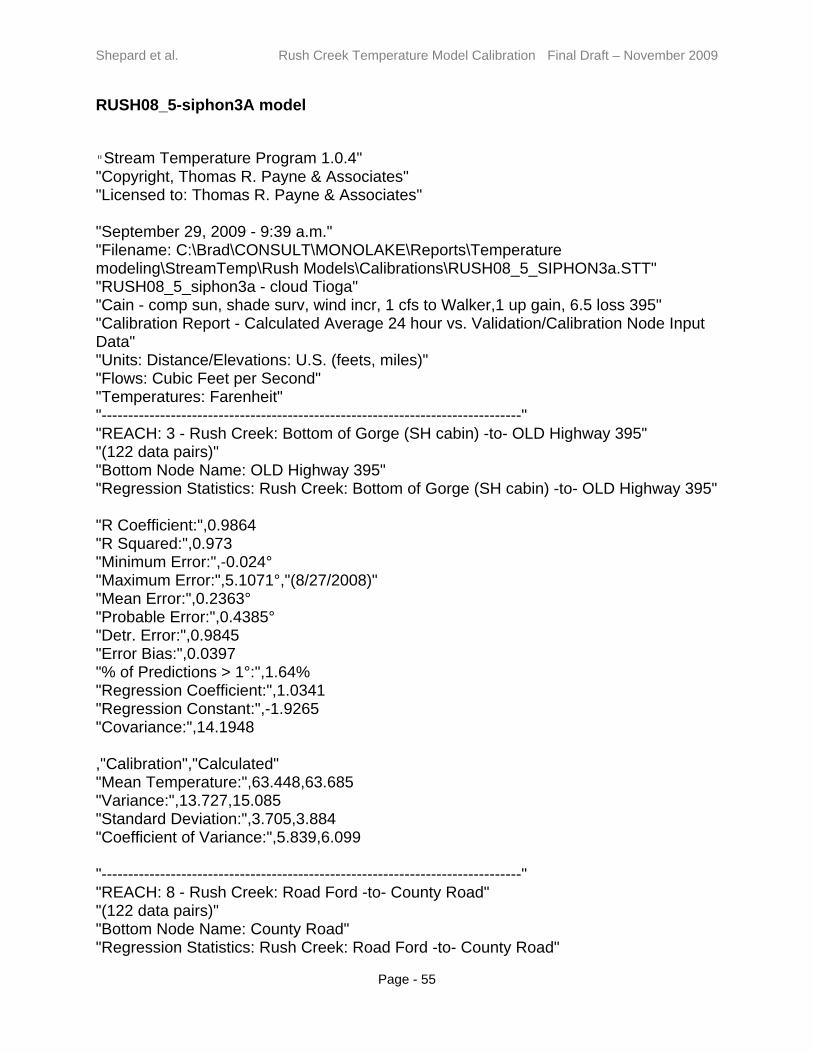
Shepard et al. Rush Creek Temperature Model Calibration Final Draft – November 2009
Page - 55
RUSH08_5-siphon3A model
"Stream Temperature Program 1.0.4" "Copyright, Thomas R. Payne & Associates" "Licensed to: Thomas R. Payne & Associates" "September 29, 2009 - 9:39 a.m." "Filename: C:\Brad\CONSULT\MONOLAKE\Reports\Temperature modeling\StreamTemp\Rush Models\Calibrations\RUSH08_5_SIPHON3a.STT" "RUSH08_5_siphon3a - cloud Tioga" "Cain - comp sun, shade surv, wind incr, 1 cfs to Walker,1 up gain, 6.5 loss 395" "Calibration Report - Calculated Average 24 hour vs. Validation/Calibration Node Input Data" "Units: Distance/Elevations: U.S. (feets, miles)" "Flows: Cubic Feet per Second" "Temperatures: Farenheit" "-------------------------------------------------------------------------------" "REACH: 3 - Rush Creek: Bottom of Gorge (SH cabin) -to- OLD Highway 395" "(122 data pairs)" "Bottom Node Name: OLD Highway 395" "Regression Statistics: Rush Creek: Bottom of Gorge (SH cabin) -to- OLD Highway 395" "R Coefficient:",0.9864 "R Squared:",0.973 "Minimum Error:",-0.024° "Maximum Error:",5.1071°,"(8/27/2008)" "Mean Error:",0.2363° "Probable Error:",0.4385° "Detr. Error:",0.9845 "Error Bias:",0.0397 "% of Predictions > 1°:",1.64% "Regression Coefficient:",1.0341 "Regression Constant:",-1.9265 "Covariance:",14.1948 ,"Calibration","Calculated" "Mean Temperature:",63.448,63.685 "Variance:",13.727,15.085 "Standard Deviation:",3.705,3.884 "Coefficient of Variance:",5.839,6.099 "-------------------------------------------------------------------------------" "REACH: 8 - Rush Creek: Road Ford -to- County Road" "(122 data pairs)" "Bottom Node Name: County Road" "Regression Statistics: Rush Creek: Road Ford -to- County Road"

Shepard et al. Rush Creek Temperature Model Calibration Final Draft – November 2009
Page - 56
"R Coefficient:",0.9414 "R Squared:",0.8863 "Minimum Error:",-0.0042° "Maximum Error:",-9.4352°,"(9/1/2008)" "Mean Error:",0.0847° "Probable Error:",0.8601° "Detr. Error:",0.9174 "Error Bias:",0.0779 "% of Predictions > 1°:",20.49% "Regression Coefficient:",1.085 "Regression Constant:",-5.1536 "Covariance:",11.1442 ,"Calibration","Calculated" "Mean Temperature:",61.611,61.696 "Variance:",10.271,13.644 "Standard Deviation:",3.205,3.694 "Coefficient of Variance:",5.202,5.987 "-------------------------------------------------------------------------------" "REACH: 14 - Parker Creek: Parker at 395 -to- Parker mouth" "(122 data pairs)" "Bottom Node Name: Parker mouth" "Regression Statistics: Parker Creek: Parker at 395 -to- Parker mouth" "R Coefficient:",0.9794 "R Squared:",0.9592 "Minimum Error:",-0.0162° "Maximum Error:",2.5844°,"(9/29/2008)" "Mean Error:",-0.168° "Probable Error:",0.4484° "Detr. Error:",0.9793 "Error Bias:",0.0406 "% of Predictions > 1°:",8.2% "Regression Coefficient:",0.9719 "Regression Constant:",1.3991 "Covariance:",10.4737 ,"Calibration","Calculated" "Mean Temperature:",55.69,55.522 "Variance:",10.777,10.612 "Standard Deviation:",3.283,3.258 "Coefficient of Variance:",5.895,5.867 "-------------------------------------------------------------------------------"
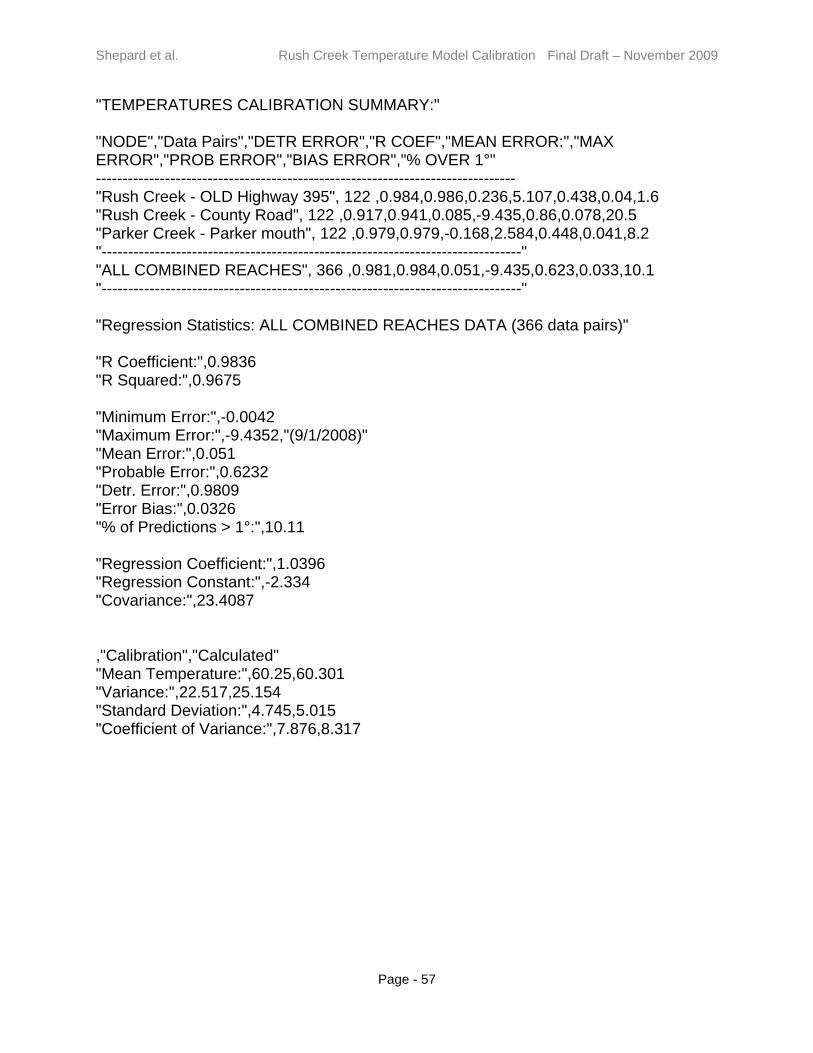
Shepard et al. Rush Creek Temperature Model Calibration Final Draft – November 2009
Page - 57
"TEMPERATURES CALIBRATION SUMMARY:" "NODE","Data Pairs","DETR ERROR","R COEF","MEAN ERROR:","MAX ERROR","PROB ERROR","BIAS ERROR","% OVER 1°" ------------------------------------------------------------------------------- "Rush Creek - OLD Highway 395", 122 ,0.984,0.986,0.236,5.107,0.438,0.04,1.6 "Rush Creek - County Road", 122 ,0.917,0.941,0.085,-9.435,0.86,0.078,20.5 "Parker Creek - Parker mouth", 122 ,0.979,0.979,-0.168,2.584,0.448,0.041,8.2 "-------------------------------------------------------------------------------" "ALL COMBINED REACHES", 366 ,0.981,0.984,0.051,-9.435,0.623,0.033,10.1 "-------------------------------------------------------------------------------" "Regression Statistics: ALL COMBINED REACHES DATA (366 data pairs)" "R Coefficient:",0.9836 "R Squared:",0.9675 "Minimum Error:",-0.0042 "Maximum Error:",-9.4352,"(9/1/2008)" "Mean Error:",0.051 "Probable Error:",0.6232 "Detr. Error:",0.9809 "Error Bias:",0.0326 "% of Predictions > 1°:",10.11 "Regression Coefficient:",1.0396 "Regression Constant:",-2.334 "Covariance:",23.4087 ,"Calibration","Calculated" "Mean Temperature:",60.25,60.301 "Variance:",22.517,25.154 "Standard Deviation:",4.745,5.015 "Coefficient of Variance:",7.876,8.317
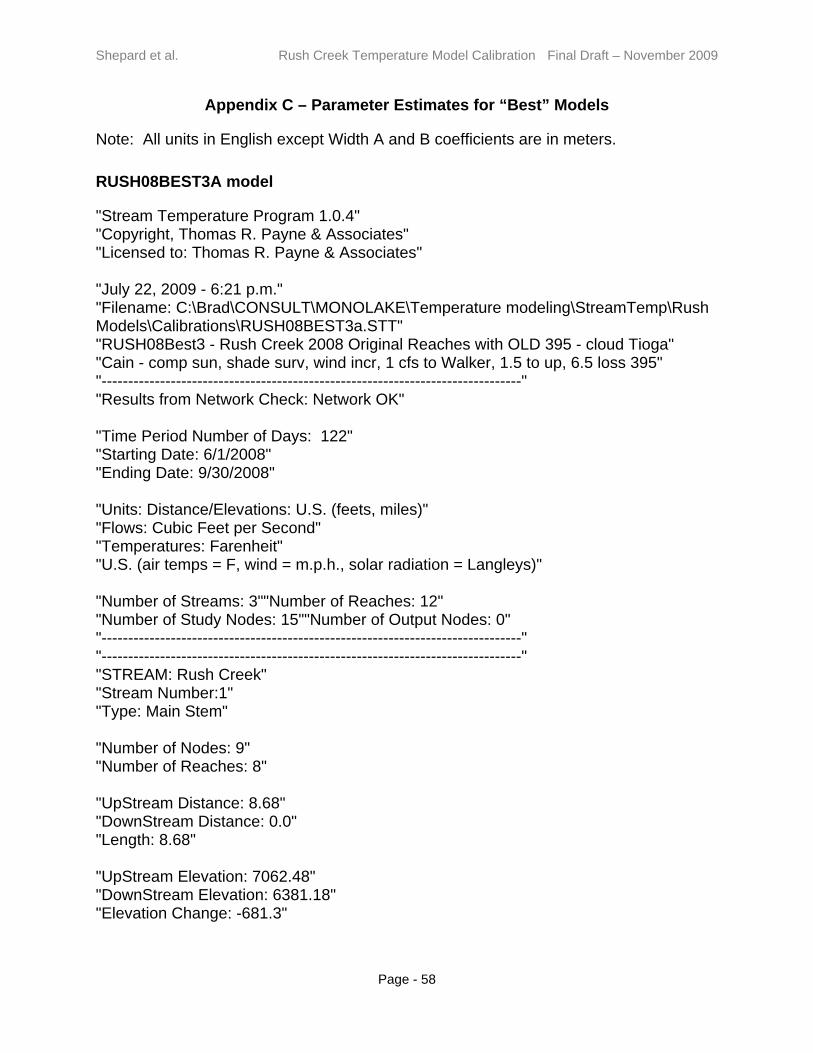
Shepard et al. Rush Creek Temperature Model Calibration Final Draft – November 2009
Page - 58
Appendix C – Parameter Estimates for “Best” Models
Note: All units in English except Width A and B coefficients are in meters.
RUSH08BEST3A model
"Stream Temperature Program 1.0.4" "Copyright, Thomas R. Payne & Associates" "Licensed to: Thomas R. Payne & Associates" "July 22, 2009 - 6:21 p.m." "Filename: C:\Brad\CONSULT\MONOLAKE\Temperature modeling\StreamTemp\Rush Models\Calibrations\RUSH08BEST3a.STT" "RUSH08Best3 - Rush Creek 2008 Original Reaches with OLD 395 - cloud Tioga" "Cain - comp sun, shade surv, wind incr, 1 cfs to Walker, 1.5 to up, 6.5 loss 395" "-------------------------------------------------------------------------------" "Results from Network Check: Network OK" "Time Period Number of Days: 122" "Starting Date: 6/1/2008" "Ending Date: 9/30/2008" "Units: Distance/Elevations: U.S. (feets, miles)" "Flows: Cubic Feet per Second" "Temperatures: Farenheit" "U.S. (air temps = F, wind = m.p.h., solar radiation = Langleys)" "Number of Streams: 3""Number of Reaches: 12" "Number of Study Nodes: 15""Number of Output Nodes: 0" "-------------------------------------------------------------------------------" "-------------------------------------------------------------------------------" "STREAM: Rush Creek" "Stream Number:1" "Type: Main Stem" "Number of Nodes: 9" "Number of Reaches: 8" "UpStream Distance: 8.68" "DownStream Distance: 0.0" "Length: 8.68" "UpStream Elevation: 7062.48" "DownStream Elevation: 6381.18" "Elevation Change: -681.3"
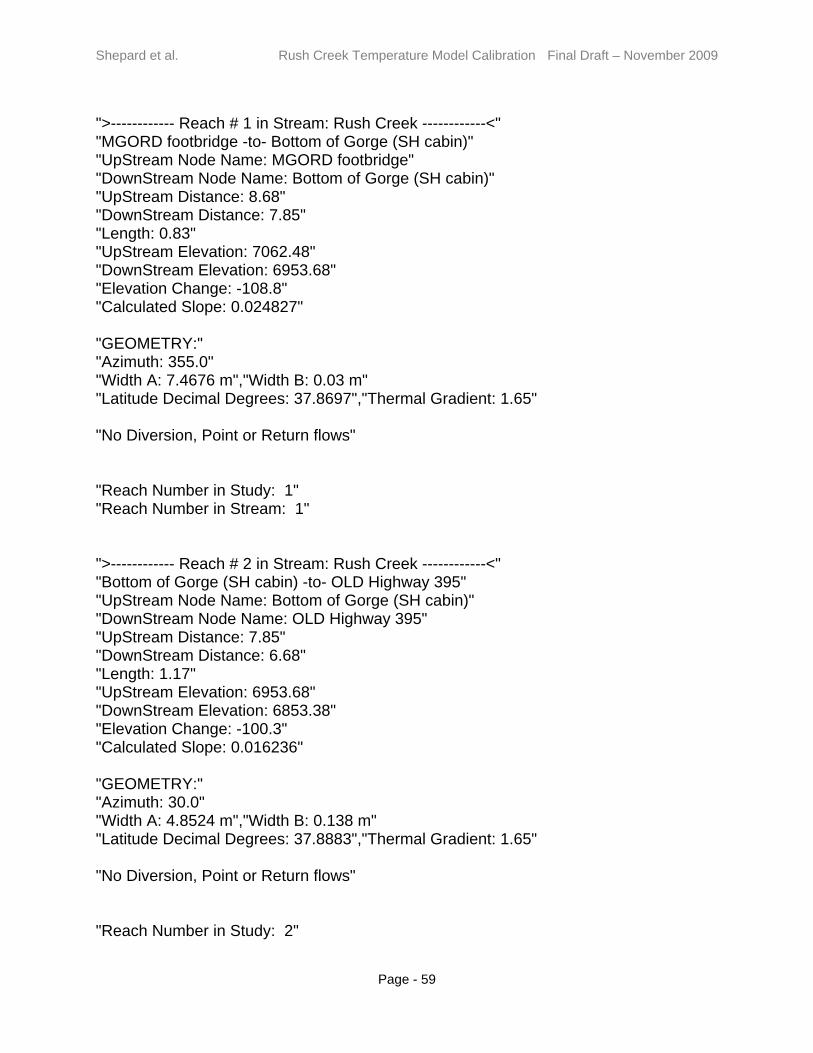
Shepard et al. Rush Creek Temperature Model Calibration Final Draft – November 2009
Page - 59
">------------ Reach # 1 in Stream: Rush Creek ------------<" "MGORD footbridge -to- Bottom of Gorge (SH cabin)" "UpStream Node Name: MGORD footbridge" "DownStream Node Name: Bottom of Gorge (SH cabin)" "UpStream Distance: 8.68" "DownStream Distance: 7.85" "Length: 0.83" "UpStream Elevation: 7062.48" "DownStream Elevation: 6953.68" "Elevation Change: -108.8" "Calculated Slope: 0.024827" "GEOMETRY:" "Azimuth: 355.0" "Width A: 7.4676 m","Width B: 0.03 m" "Latitude Decimal Degrees: 37.8697","Thermal Gradient: 1.65" "No Diversion, Point or Return flows" "Reach Number in Study: 1" "Reach Number in Stream: 1" ">------------ Reach # 2 in Stream: Rush Creek ------------<" "Bottom of Gorge (SH cabin) -to- OLD Highway 395" "UpStream Node Name: Bottom of Gorge (SH cabin)" "DownStream Node Name: OLD Highway 395" "UpStream Distance: 7.85" "DownStream Distance: 6.68" "Length: 1.17" "UpStream Elevation: 6953.68" "DownStream Elevation: 6853.38" "Elevation Change: -100.3" "Calculated Slope: 0.016236" "GEOMETRY:" "Azimuth: 30.0" "Width A: 4.8524 m","Width B: 0.138 m" "Latitude Decimal Degrees: 37.8883","Thermal Gradient: 1.65" "No Diversion, Point or Return flows" "Reach Number in Study: 2"

Shepard et al. Rush Creek Temperature Model Calibration Final Draft – November 2009
Page - 60
"Reach Number in Stream: 2" ">------------ Reach # 3 in Stream: Rush Creek ------------<" "OLD Highway 395 -to- Parker Creek" "UpStream Node Name: OLD Highway 395" "DownStream Node Name: Parker Creek" "UpStream Distance: 6.68" "DownStream Distance: 5.12" "Length: 1.56" "UpStream Elevation: 6853.38" "DownStream Elevation: 6670.68" "Elevation Change: -182.7" "Calculated Slope: 0.022181" "GEOMETRY:" "Azimuth: 15.0" "Width A: 4.8524 m","Width B: 0.138 m" "Latitude Decimal Degrees: 37.8919","Thermal Gradient: 1.65" "Has Diversion flows" "Reach Number in Study: 3" "Reach Number in Stream: 3" ">------------ Reach # 4 in Stream: Rush Creek ------------<" "Parker Creek -to- Walker Creek" "UpStream Node Name: Parker Creek" "DownStream Node Name: Walker Creek" "UpStream Distance: 5.12" "DownStream Distance: 4.56" "Length: 0.56" "UpStream Elevation: 6670.68" "DownStream Elevation: 6615.08" "Elevation Change: -55.6" "Calculated Slope: 0.018804" "GEOMETRY:" "Azimuth: 15.0" "Width A: 4.8524 m","Width B: 0.138 m" "Latitude Decimal Degrees: 37.9064","Thermal Gradient: 1.65" "No Diversion, Point or Return flows"

Shepard et al. Rush Creek Temperature Model Calibration Final Draft – November 2009
Page - 61
"Reach Number in Study: 4" "Reach Number in Stream: 4" ">------------ Reach # 5 in Stream: Rush Creek ------------<" "Walker Creek -to- Bottom of Narrows" "UpStream Node Name: Walker Creek" "DownStream Node Name: Bottom of Narrows" "UpStream Distance: 4.56" "DownStream Distance: 4.47" "Length: 0.09" "UpStream Elevation: 6615.08" "DownStream Elevation: 6594.58" "Elevation Change: -20.5" "Calculated Slope: 0.04314" "GEOMETRY:" "Azimuth: 10.0" "Width A: 9.144 m","Width B: 0.0 m" "Latitude Decimal Degrees: 37.9136","Thermal Gradient: 1.65" "No Diversion, Point or Return flows" "Reach Number in Study: 5" "Reach Number in Stream: 5" ">------------ Reach # 6 in Stream: Rush Creek ------------<" "Bottom of Narrows -to- Road Ford" "UpStream Node Name: Bottom of Narrows" "DownStream Node Name: Road Ford" "UpStream Distance: 4.47" "DownStream Distance: 1.78" "Length: 2.69" "UpStream Elevation: 6594.58" "DownStream Elevation: 6447.08" "Elevation Change: -147.5" "Calculated Slope: 0.010385" "GEOMETRY:" "Azimuth: 15.0" "Width A: 4.7122 m","Width B: 0.123 m" "Latitude Decimal Degrees: 37.9142","Thermal Gradient: 1.65"
Shepard et al. Rush Creek Temperature Model Calibration Final Draft – November 2009
Page - 62
"No Diversion, Point or Return flows" "Reach Number in Study: 6" "Reach Number in Stream: 6" ">------------ Reach # 7 in Stream: Rush Creek ------------<" "Road Ford -to- County Road" "UpStream Node Name: Road Ford" "DownStream Node Name: County Road" "UpStream Distance: 1.78" "DownStream Distance: 0.94" "Length: 0.84" "UpStream Elevation: 6447.08" "DownStream Elevation: 6409.18" "Elevation Change: -37.9" "Calculated Slope: 0.008545" "GEOMETRY:" "Azimuth: 15.0" "Width A: 2.792 m","Width B: 0.231 m" "Latitude Decimal Degrees: 37.9395","Thermal Gradient: 1.65" "No Diversion, Point or Return flows" "Reach Number in Study: 7" "Reach Number in Stream: 7" ">------------ Reach # 8 in Stream: Rush Creek ------------<" "County Road -to- Mono Lake" "UpStream Node Name: County Road" "DownStream Node Name: Mono Lake" "UpStream Distance: 0.94" "DownStream Distance: 0.0" "Length: 0.94" "UpStream Elevation: 6409.18" "DownStream Elevation: 6381.18" "Elevation Change: -28.0" "Calculated Slope: 0.005642" "GEOMETRY:" "Azimuth: 20.0"
Shepard et al. Rush Creek Temperature Model Calibration Final Draft – November 2009
Page - 63
"Width A: 2.792 m","Width B: 0.231 m" "Latitude Decimal Degrees: 37.9475","Thermal Gradient: 1.65" "No Diversion, Point or Return flows" "Reach Number in Study: 8" "Reach Number in Stream: 8" "-------------------------------------------------------------------------------" "-------------------------------------------------------------------------------" "STREAM: Walker Creek" "Stream Number:2" "Type: Tributary" "Assigned to Stream: Rush Creek" "Confluence is at Upstream Distance of 4.56" "Number of Nodes: 3" "Number of Reaches: 2" "UpStream Distance: 6.3" "DownStream Distance: 4.56" "Length: 1.74" "UpStream Elevation: 6849.98" "DownStream Elevation: 6615.08" "Elevation Change: -234.9" ">------------ Reach # 1 in Stream: Walker Creek ------------<" "Walker Fish Est Sect -to- Walker at 395" "UpStream Node Name: Walker Fish Est Sect" "DownStream Node Name: Walker at 395" "UpStream Distance: 6.3" "DownStream Distance: 5.7" "Length: 0.6" "UpStream Elevation: 6849.98" "DownStream Elevation: 6783.88" "Elevation Change: -66.1" "Calculated Slope: 0.020865" "GEOMETRY:" "Azimuth: 30.0" "Width A: 1.0272 m","Width B: 0.1 m" "Latitude Decimal Degrees: 37.9036","Thermal Gradient: 1.65"

Shepard et al. Rush Creek Temperature Model Calibration Final Draft – November 2009
Page - 64
"No Diversion, Point or Return flows" "Reach Number in Study: 9" "Reach Number in Stream: 1" ">------------ Reach # 2 in Stream: Walker Creek ------------<" "Walker at 395 -to- Walker mouth" "UpStream Node Name: Walker at 395" "DownStream Node Name: Walker mouth" "UpStream Distance: 5.7" "DownStream Distance: 4.56" "Length: 1.14" "UpStream Elevation: 6783.88" "DownStream Elevation: 6615.08" "Elevation Change: -168.8" "Calculated Slope: 0.028044" "GEOMETRY:" "Azimuth: 50.0" "Width A: 1.0272 m","Width B: 0.1 m" "Latitude Decimal Degrees: 37.9092","Thermal Gradient: 1.65" "No Diversion, Point or Return flows" "Reach Number in Study: 10" "Reach Number in Stream: 2" "-------------------------------------------------------------------------------" "-------------------------------------------------------------------------------" "STREAM: Parker Creek" "Stream Number:3" "Type: Tributary" "Assigned to Stream: Rush Creek" "Confluence is at Upstream Distance of 5.12" "Number of Nodes: 3" "Number of Reaches: 2" "UpStream Distance: 7.5" "DownStream Distance: 5.12" "Length: 2.38" "UpStream Elevation: 7021.18"

Shepard et al. Rush Creek Temperature Model Calibration Final Draft – November 2009
Page - 65
"DownStream Elevation: 6670.68" "Elevation Change: -350.5" ">------------ Reach # 1 in Stream: Parker Creek ------------<" "Parker Fish Est Sect -to- Parker at 395" "UpStream Node Name: Parker Fish Est Sect" "DownStream Node Name: Parker at 395" "UpStream Distance: 7.5" "DownStream Distance: 5.98" "Length: 1.52" "UpStream Elevation: 7021.18" "DownStream Elevation: 6844.08" "Elevation Change: -177.1" "Calculated Slope: 0.022067" "GEOMETRY:" "Azimuth: 35.0" "Width A: 1.6764 m","Width B: 0.15 m" "Latitude Decimal Degrees: 37.8836","Thermal Gradient: 1.65" "No Diversion, Point or Return flows" "Reach Number in Study: 11" "Reach Number in Stream: 1" ">------------ Reach # 2 in Stream: Parker Creek ------------<" "Parker at 395 -to- Parker mouth" "UpStream Node Name: Parker at 395" "DownStream Node Name: Parker mouth" "UpStream Distance: 5.98" "DownStream Distance: 5.12" "Length: 0.86" "UpStream Elevation: 6844.08" "DownStream Elevation: 6670.68" "Elevation Change: -173.4" "Calculated Slope: 0.038187" "GEOMETRY:" "Azimuth: 35.0" "Width A: 1.6764 m","Width B: 0.35 m" "Latitude Decimal Degrees: 37.8994","Thermal Gradient: 1.65" "No Diversion, Point or Return flows"

Shepard et al. Rush Creek Temperature Model Calibration Final Draft – November 2009
Page - 66
"Reach Number in Study: 12" "Reach Number in Stream: 2"

Shepard et al. Rush Creek Temperature Model Calibration Final Draft – November 2009
Page - 67
RUSH08_5-siphon3A model
"Stream Temperature Program 1.0.4" "Copyright, Thomas R. Payne & Associates" "Licensed to: Thomas R. Payne & Associates" "September 29, 2009 - 9:55 a.m." "Filename: C:\Brad\CONSULT\MONOLAKE\Reports\Temperature modeling\StreamTemp\Rush Models\Calibrations\RUSH08_5_SIPHON3a.STT" "RUSH08_5_siphon3a - cloud Tioga" "Cain - comp sun, shade surv, wind incr, 1 cfs to Walker,1 up gain, 6.5 loss 395" "-------------------------------------------------------------------------------" "Results from Network Check: Network OK" "Time Period Number of Days: 122" "Starting Date: 6/1/2008" "Ending Date: 9/30/2008" "Units: Distance/Elevations: U.S. (feets, miles)" "Flows: Cubic Feet per Second" "Temperatures: Farenheit" "U.S. (air temps = F, wind = m.p.h., solar radiation = Langleys)" "Number of Streams: 4""Number of Reaches: 14" "Number of Study Nodes: 18""Number of Output Nodes: 0" "-------------------------------------------------------------------------------" "-------------------------------------------------------------------------------" "STREAM: Rush Creek" "Stream Number:1" "Type: Main Stem" "Number of Nodes: 10" "Number of Reaches: 9" "UpStream Distance: 8.68" "DownStream Distance: 0.0" "Length: 8.68" "UpStream Elevation: 7062.98" "DownStream Elevation: 6381.18" "Elevation Change: -681.8" ">------------ Reach # 1 in Stream: Rush Creek ------------<"
Shepard et al. Rush Creek Temperature Model Calibration Final Draft – November 2009
Page - 68
"MGORD footbridge -to- 5_siphon mouth" "UpStream Node Name: MGORD footbridge" "DownStream Node Name: 5_siphon mouth" "UpStream Distance: 8.68" "DownStream Distance: 8.66" "Length: 0.02" "UpStream Elevation: 7062.98" "DownStream Elevation: 7059.98" "Elevation Change: -3.0" "Calculated Slope: 0.028413" "GEOMETRY:" "Azimuth: 300.0" "Width A: 7.4676","Width B: 0.03" "Latitude Decimal Degrees: 37.8697","Thermal Gradient: 1.65" "No Diversion, Point or Return flows" "Reach Number in Study: 1" "Reach Number in Stream: 1" ">------------ Reach # 2 in Stream: Rush Creek ------------<" "5_siphon mouth -to- Bottom of Gorge (SH cabin)" "UpStream Node Name: 5_siphon mouth" "DownStream Node Name: Bottom of Gorge (SH cabin)" "UpStream Distance: 8.66" "DownStream Distance: 7.85" "Length: 0.81" "UpStream Elevation: 7059.98" "DownStream Elevation: 6953.68" "Elevation Change: -106.3" "Calculated Slope: 0.024855" "GEOMETRY:" "Azimuth: 355.0" "Width A: 7.4676","Width B: 0.03" "Latitude Decimal Degrees: 37.87","Thermal Gradient: 1.65" "No Diversion, Point or Return flows" "Reach Number in Study: 2" "Reach Number in Stream: 2"

Shepard et al. Rush Creek Temperature Model Calibration Final Draft – November 2009
Page - 69
">------------ Reach # 3 in Stream: Rush Creek ------------<" "Bottom of Gorge (SH cabin) -to- OLD Highway 395" "UpStream Node Name: Bottom of Gorge (SH cabin)" "DownStream Node Name: OLD Highway 395" "UpStream Distance: 7.85" "DownStream Distance: 6.68" "Length: 1.17" "UpStream Elevation: 6953.68" "DownStream Elevation: 6853.38" "Elevation Change: -100.3" "Calculated Slope: 0.016236" "GEOMETRY:" "Azimuth: 30.0" "Width A: 4.8524","Width B: 0.138" "Latitude Decimal Degrees: 37.8883","Thermal Gradient: 1.65" "No Diversion, Point or Return flows" "Reach Number in Study: 3" "Reach Number in Stream: 3" ">------------ Reach # 4 in Stream: Rush Creek ------------<" "OLD Highway 395 -to- Parker Creek" "UpStream Node Name: OLD Highway 395" "DownStream Node Name: Parker Creek" "UpStream Distance: 6.68" "DownStream Distance: 5.12" "Length: 1.56" "UpStream Elevation: 6853.38" "DownStream Elevation: 6670.68" "Elevation Change: -182.7" "Calculated Slope: 0.022181" "GEOMETRY:" "Azimuth: 15.0" "Width A: 4.8524","Width B: 0.138" "Latitude Decimal Degrees: 37.8919","Thermal Gradient: 1.65" "Has Diversion flows" "Reach Number in Study: 4"

Shepard et al. Rush Creek Temperature Model Calibration Final Draft – November 2009
Page - 70
"Reach Number in Stream: 4" ">------------ Reach # 5 in Stream: Rush Creek ------------<" "Parker Creek -to- Walker Creek" "UpStream Node Name: Parker Creek" "DownStream Node Name: Walker Creek" "UpStream Distance: 5.12" "DownStream Distance: 4.56" "Length: 0.56" "UpStream Elevation: 6670.68" "DownStream Elevation: 6615.08" "Elevation Change: -55.6" "Calculated Slope: 0.018804" "GEOMETRY:" "Azimuth: 15.0" "Width A: 4.8524","Width B: 0.138" "Latitude Decimal Degrees: 37.9064","Thermal Gradient: 1.65" "No Diversion, Point or Return flows" "Reach Number in Study: 5" "Reach Number in Stream: 5" ">------------ Reach # 6 in Stream: Rush Creek ------------<" "Walker Creek -to- Bottom of Narrows" "UpStream Node Name: Walker Creek" "DownStream Node Name: Bottom of Narrows" "UpStream Distance: 4.56" "DownStream Distance: 4.47" "Length: 0.09" "UpStream Elevation: 6615.08" "DownStream Elevation: 6594.58" "Elevation Change: -20.5" "Calculated Slope: 0.04314" "GEOMETRY:" "Azimuth: 10.0" "Width A: 8.2296","Width B: 0.03" "Latitude Decimal Degrees: 37.9136","Thermal Gradient: 1.65" "No Diversion, Point or Return flows"

Shepard et al. Rush Creek Temperature Model Calibration Final Draft – November 2009
Page - 71
"Reach Number in Study: 6" "Reach Number in Stream: 6" ">------------ Reach # 7 in Stream: Rush Creek ------------<" "Bottom of Narrows -to- Road Ford" "UpStream Node Name: Bottom of Narrows" "DownStream Node Name: Road Ford" "UpStream Distance: 4.47" "DownStream Distance: 1.78" "Length: 2.69" "UpStream Elevation: 6594.58" "DownStream Elevation: 6447.08" "Elevation Change: -147.5" "Calculated Slope: 0.010385" "GEOMETRY:" "Azimuth: 15.0" "Width A: 4.7122","Width B: 0.123" "Latitude Decimal Degrees: 37.9142","Thermal Gradient: 1.65" "No Diversion, Point or Return flows" "Reach Number in Study: 7" "Reach Number in Stream: 7" ">------------ Reach # 8 in Stream: Rush Creek ------------<" "Road Ford -to- County Road" "UpStream Node Name: Road Ford" "DownStream Node Name: County Road" "UpStream Distance: 1.78" "DownStream Distance: 0.94" "Length: 0.84" "UpStream Elevation: 6447.08" "DownStream Elevation: 6409.18" "Elevation Change: -37.9" "Calculated Slope: 0.008545" "GEOMETRY:" "Azimuth: 15.0" "Width A: 2.792","Width B: 0.231" "Latitude Decimal Degrees: 37.9395","Thermal Gradient: 1.65"

Shepard et al. Rush Creek Temperature Model Calibration Final Draft – November 2009
Page - 72
"No Diversion, Point or Return flows" "Reach Number in Study: 8" "Reach Number in Stream: 8" ">------------ Reach # 9 in Stream: Rush Creek ------------<" "County Road -to- Mono Lake" "UpStream Node Name: County Road" "DownStream Node Name: Mono Lake" "UpStream Distance: 0.94" "DownStream Distance: 0.0" "Length: 0.94" "UpStream Elevation: 6409.18" "DownStream Elevation: 6381.18" "Elevation Change: -28.0" "Calculated Slope: 0.005642" "GEOMETRY:" "Azimuth: 20.0" "Width A: 2.792","Width B: 0.231" "Latitude Decimal Degrees: 37.9475","Thermal Gradient: 1.65" "No Diversion, Point or Return flows" "Reach Number in Study: 9" "Reach Number in Stream: 9" "-------------------------------------------------------------------------------" "-------------------------------------------------------------------------------" "STREAM: 5_siphon" "Stream Number:2" "Type: Tributary" "Assigned to Stream: Rush Creek" "Confluence is at Upstream Distance of 8.66" "Number of Nodes: 2" "Number of Reaches: 1" "UpStream Distance: 8.68" "DownStream Distance: 8.66" "Length: 0.02" "UpStream Elevation: 7062.98"

Shepard et al. Rush Creek Temperature Model Calibration Final Draft – November 2009
Page - 73
"DownStream Elevation: 7059.98" "Elevation Change: -3.0" ">------------ Reach # 1 in Stream: 5_siphon ------------<" "5_siphon outflow -to- 5_siphon input to Rush" "UpStream Node Name: 5_siphon outflow" "DownStream Node Name: 5_siphon input to Rush" "UpStream Distance: 8.68" "DownStream Distance: 8.66" "Length: 0.02" "UpStream Elevation: 7062.98" "DownStream Elevation: 7059.98" "Elevation Change: -3.0" "Calculated Slope: 0.028413" "GEOMETRY:" "Azimuth: 20.0" "Width A: 4.8524","Width B: 0.138" "Latitude Decimal Degrees: 37.8697","Thermal Gradient: 1.65" "No Diversion, Point or Return flows" "Reach Number in Study: 10" "Reach Number in Stream: 1" "-------------------------------------------------------------------------------" "-------------------------------------------------------------------------------" "STREAM: Walker Creek" "Stream Number:3" "Type: Tributary" "Assigned to Stream: Rush Creek" "Confluence is at Upstream Distance of 4.56" "Number of Nodes: 3" "Number of Reaches: 2" "UpStream Distance: 6.3" "DownStream Distance: 4.56" "Length: 1.74" "UpStream Elevation: 6849.98" "DownStream Elevation: 6615.08" "Elevation Change: -234.9"
Shepard et al. Rush Creek Temperature Model Calibration Final Draft – November 2009
Page - 74
">------------ Reach # 1 in Stream: Walker Creek ------------<" "Walker Fish Est Sect -to- Walker at 395" "UpStream Node Name: Walker Fish Est Sect" "DownStream Node Name: Walker at 395" "UpStream Distance: 6.3" "DownStream Distance: 5.7" "Length: 0.6" "UpStream Elevation: 6849.98" "DownStream Elevation: 6783.88" "Elevation Change: -66.1" "Calculated Slope: 0.020865" "GEOMETRY:" "Azimuth: 30.0" "Width A: 1.6764","Width B: 0.2" "Latitude Decimal Degrees: 37.9036","Thermal Gradient: 1.65" "No Diversion, Point or Return flows" "Reach Number in Study: 11" "Reach Number in Stream: 1" ">------------ Reach # 2 in Stream: Walker Creek ------------<" "Walker at 395 -to- Walker mouth" "UpStream Node Name: Walker at 395" "DownStream Node Name: Walker mouth" "UpStream Distance: 5.7" "DownStream Distance: 4.56" "Length: 1.14" "UpStream Elevation: 6783.88" "DownStream Elevation: 6615.08" "Elevation Change: -168.8" "Calculated Slope: 0.028044" "GEOMETRY:" "Azimuth: 50.0" "Width A: 1.6764","Width B: 0.15" "Latitude Decimal Degrees: 37.9092","Thermal Gradient: 1.65" "No Diversion, Point or Return flows" "Reach Number in Study: 12"

Shepard et al. Rush Creek Temperature Model Calibration Final Draft – November 2009
Page - 75
"Reach Number in Stream: 2" "-------------------------------------------------------------------------------" "-------------------------------------------------------------------------------" "STREAM: Parker Creek" "Stream Number:4" "Type: Tributary" "Assigned to Stream: Rush Creek" "Confluence is at Upstream Distance of 5.12" "Number of Nodes: 3" "Number of Reaches: 2" "UpStream Distance: 7.5" "DownStream Distance: 5.12" "Length: 2.38" "UpStream Elevation: 7021.18" "DownStream Elevation: 6670.68" "Elevation Change: -350.5" ">------------ Reach # 1 in Stream: Parker Creek ------------<" "Parker Fish Est Sect -to- Parker at 395" "UpStream Node Name: Parker Fish Est Sect" "DownStream Node Name: Parker at 395" "UpStream Distance: 7.5" "DownStream Distance: 5.98" "Length: 1.52" "UpStream Elevation: 7021.18" "DownStream Elevation: 6844.08" "Elevation Change: -177.1" "Calculated Slope: 0.022067" "GEOMETRY:" "Azimuth: 35.0" "Width A: 2.1946","Width B: 0.2" "Latitude Decimal Degrees: 37.8836","Thermal Gradient: 1.65" "No Diversion, Point or Return flows" "Reach Number in Study: 13" "Reach Number in Stream: 1"

Shepard et al. Rush Creek Temperature Model Calibration Final Draft – November 2009
Page - 76
">------------ Reach # 2 in Stream: Parker Creek ------------<" "Parker at 395 -to- Parker mouth" "UpStream Node Name: Parker at 395" "DownStream Node Name: Parker mouth" "UpStream Distance: 5.98" "DownStream Distance: 5.12" "Length: 0.86" "UpStream Elevation: 6844.08" "DownStream Elevation: 6670.68" "Elevation Change: -173.4" "Calculated Slope: 0.038187" "GEOMETRY:" "Azimuth: 35.0" "Width A: 2.1336","Width B: 0.15" "Latitude Decimal Degrees: 37.8994","Thermal Gradient: 1.65" "No Diversion, Point or Return flows" "Reach Number in Study: 14" "Reach Number in Stream: 2"
Shepard et al. Rush Creek Temperature Model Calibration Final Draft – November 2009
Page - 77
Appendix D – Final Best Temperature Model Parameters
Stream Temperature Program 1.0.4 Copyright, Thomas R. Payne & Associates Licensed to: Thomas R. Payne & Associates
October 02, 2009 - 4:06 p.m. Filename: \RUSH08_5_SIPHON_Best.STT RUSH08_5_siphon3a - cloud Tioga Cain - comp sun, shade surv, wind incr, 1 cfs to Walker,1 up gain, 6.5 loss 395 ------------------------------------------------------------------------------- Results from Network Check: Network OK
Time Period Number of Days: 122 Starting Date: 6/1/2008 Ending Date: 9/30/2008
Units: Distance/Elevations: U.S. (feets, miles) Flows: Cubic Feet per Second Temperatures: Farenheit U.S. (air temps = F, wind = m.p.h., solar radiation = Langleys)
Number of Streams: 4"Number of Reaches: 14 Number of Study Nodes: 18"Number of Output Nodes: 0 ------------------------------------------------------------------------------- ------------------------------------------------------------------------------- STREAM: Rush Creek Stream Number:1 Type: Main Stem
Number of Nodes: 10 Number of Reaches: 9
UpStream Distance: 8.68 DownStream Distance: 0.0 Length: 8.68
UpStream Elevation: 7062.98 DownStream Elevation: 6381.18 Elevation Change: -681.8
>------------ Reach # 1 in Stream: Rush Creek ------------< MGORD footbridge -to- 5_siphon mouth UpStream Node Name: MGORD footbridge DownStream Node Name: 5_siphon mouth UpStream Distance: 8.68 DownStream Distance: 8.66
Shepard et al. Rush Creek Temperature Model Calibration Final Draft – November 2009
Page - 78
Length: 0.02 UpStream Elevation: 7062.98 DownStream Elevation: 7059.98 Elevation Change: -3.0 Calculated Slope: 0.028413
GEOMETRY: Azimuth: 300.0 Width A: 7.4676 Width B: 0.03
Latitude Decimal Degrees: 37.8697 Thermal Gradient: 1.65
No Diversion, Point or Return flows
Reach Number in Study: 1 Reach Number in Stream: 1
>------------ Reach # 2 in Stream: Rush Creek ------------< 5_siphon mouth -to- Bottom of Gorge (SH cabin) UpStream Node Name: 5_siphon mouth DownStream Node Name: Bottom of Gorge (SH cabin) UpStream Distance: 8.66 DownStream Distance: 7.85 Length: 0.81 UpStream Elevation: 7059.98 DownStream Elevation: 6953.68 Elevation Change: -106.3 Calculated Slope: 0.024855
GEOMETRY: Azimuth: 355.0 Width A: 7.4676 Width B: 0.03
Latitude Decimal Degrees: 37.87 Thermal Gradient: 1.65
No Diversion, Point or Return flows
Reach Number in Study: 2 Reach Number in Stream: 2
>------------ Reach # 3 in Stream: Rush Creek ------------< Bottom of Gorge (SH cabin) -to- OLD Highway 395 UpStream Node Name: Bottom of Gorge (SH cabin) DownStream Node Name: OLD Highway 395 UpStream Distance: 7.85 DownStream Distance: 6.68 Length: 1.17

Shepard et al. Rush Creek Temperature Model Calibration Final Draft – November 2009
Page - 79
UpStream Elevation: 6953.68 DownStream Elevation: 6853.38 Elevation Change: -100.3 Calculated Slope: 0.016236
GEOMETRY: Azimuth: 30.0 Width A: 4.8524 Width B: 0.138
Latitude Decimal Degrees: 37.8883 Thermal Gradient: 1.65
No Diversion, Point or Return flows
Reach Number in Study: 3 Reach Number in Stream: 3
>------------ Reach # 4 in Stream: Rush Creek ------------< OLD Highway 395 -to- Parker Creek UpStream Node Name: OLD Highway 395 DownStream Node Name: Parker Creek UpStream Distance: 6.68 DownStream Distance: 5.12 Length: 1.56 UpStream Elevation: 6853.38 DownStream Elevation: 6670.68 Elevation Change: -182.7 Calculated Slope: 0.022181
GEOMETRY: Azimuth: 15.0 Width A: 4.8524 Width B: 0.138
Latitude Decimal Degrees: 37.8919 Thermal Gradient: 1.65
Has Diversion flows
Reach Number in Study: 4 Reach Number in Stream: 4
>------------ Reach # 5 in Stream: Rush Creek ------------< Parker Creek -to- Walker Creek UpStream Node Name: Parker Creek DownStream Node Name: Walker Creek UpStream Distance: 5.12 DownStream Distance: 4.56 Length: 0.56 UpStream Elevation: 6670.68

Shepard et al. Rush Creek Temperature Model Calibration Final Draft – November 2009
Page - 80
DownStream Elevation: 6615.08 Elevation Change: -55.6 Calculated Slope: 0.018804
GEOMETRY: Azimuth: 15.0 Width A: 4.8524 Width B: 0.138
Latitude Decimal Degrees: 37.9064 Thermal Gradient: 1.65
No Diversion, Point or Return flows
Reach Number in Study: 5 Reach Number in Stream: 5
>------------ Reach # 6 in Stream: Rush Creek ------------< Walker Creek -to- Bottom of Narrows UpStream Node Name: Walker Creek DownStream Node Name: Bottom of Narrows UpStream Distance: 4.56 DownStream Distance: 4.47 Length: 0.09 UpStream Elevation: 6615.08 DownStream Elevation: 6594.58 Elevation Change: -20.5 Calculated Slope: 0.04314
GEOMETRY: Azimuth: 10.0 Width A: 8.2296 Width B: 0.03
Latitude Decimal Degrees: 37.9136 Thermal Gradient: 1.65
No Diversion, Point or Return flows
Reach Number in Study: 6 Reach Number in Stream: 6
>------------ Reach # 7 in Stream: Rush Creek ------------< Bottom of Narrows -to- Road Ford UpStream Node Name: Bottom of Narrows DownStream Node Name: Road Ford UpStream Distance: 4.47 DownStream Distance: 1.78 Length: 2.69 UpStream Elevation: 6594.58 DownStream Elevation: 6447.08

Shepard et al. Rush Creek Temperature Model Calibration Final Draft – November 2009
Page - 81
Elevation Change: -147.5 Calculated Slope: 0.010385
GEOMETRY: Azimuth: 15.0 Width A: 4.7122 Width B: 0.123
Latitude Decimal Degrees: 37.9142 Thermal Gradient: 1.65
No Diversion, Point or Return flows
Reach Number in Study: 7 Reach Number in Stream: 7
>------------ Reach # 8 in Stream: Rush Creek ------------< Road Ford -to- County Road UpStream Node Name: Road Ford DownStream Node Name: County Road UpStream Distance: 1.78 DownStream Distance: 0.94 Length: 0.84 UpStream Elevation: 6447.08 DownStream Elevation: 6409.18 Elevation Change: -37.9 Calculated Slope: 0.008545
GEOMETRY: Azimuth: 15.0 Width A: 2.792 Width B: 0.231
Latitude Decimal Degrees: 37.9395 Thermal Gradient: 1.65
No Diversion, Point or Return flows
Reach Number in Study: 8 Reach Number in Stream: 8
>------------ Reach # 9 in Stream: Rush Creek ------------< County Road -to- Mono Lake UpStream Node Name: County Road DownStream Node Name: Mono Lake UpStream Distance: 0.94 DownStream Distance: 0.0 Length: 0.94 UpStream Elevation: 6409.18 DownStream Elevation: 6381.18 Elevation Change: -28.0
Shepard et al. Rush Creek Temperature Model Calibration Final Draft – November 2009
Page - 82
Calculated Slope: 0.005642
GEOMETRY: Azimuth: 20.0 Width A: 2.792 Width B: 0.231
Latitude Decimal Degrees: 37.9475 Thermal Gradient: 1.65
No Diversion, Point or Return flows
Reach Number in Study: 9 Reach Number in Stream: 9
------------------------------------------------------------------------------- ------------------------------------------------------------------------------- STREAM: 5_siphon Stream Number:2 Type: Tributary Assigned to Stream: Rush Creek Confluence is at Upstream Distance of 8.66
Number of Nodes: 2 Number of Reaches: 1
UpStream Distance: 8.68 DownStream Distance: 8.66 Length: 0.02
UpStream Elevation: 7062.98 DownStream Elevation: 7059.98 Elevation Change: -3.0
>------------ Reach # 1 in Stream: 5_siphon ------------< 5_siphon outflow -to- 5_siphon input to Rush UpStream Node Name: 5_siphon outflow DownStream Node Name: 5_siphon input to Rush UpStream Distance: 8.68 DownStream Distance: 8.66 Length: 0.02 UpStream Elevation: 7062.98 DownStream Elevation: 7059.98 Elevation Change: -3.0 Calculated Slope: 0.028413
GEOMETRY: Azimuth: 20.0 Width A: 4.8524 Width B: 0.138

Shepard et al. Rush Creek Temperature Model Calibration Final Draft – November 2009
Page - 83
Latitude Decimal Degrees: 37.8697 Thermal Gradient: 1.65
No Diversion, Point or Return flows
Reach Number in Study: 10 Reach Number in Stream: 1
------------------------------------------------------------------------------- ------------------------------------------------------------------------------- STREAM: Walker Creek Stream Number:3 Type: Tributary Assigned to Stream: Rush Creek Confluence is at Upstream Distance of 4.56
Number of Nodes: 3 Number of Reaches: 2
UpStream Distance: 6.3 DownStream Distance: 4.56 Length: 1.74
UpStream Elevation: 6849.98 DownStream Elevation: 6615.08 Elevation Change: -234.9
>------------ Reach # 1 in Stream: Walker Creek ------------< Walker Fish Est Sect -to- Walker at 395 UpStream Node Name: Walker Fish Est Sect DownStream Node Name: Walker at 395 UpStream Distance: 6.3 DownStream Distance: 5.7 Length: 0.6 UpStream Elevation: 6849.98 DownStream Elevation: 6783.88 Elevation Change: -66.1 Calculated Slope: 0.020865
GEOMETRY: Azimuth: 30.0 Width A: 1.6764 Width B: 0.2
Latitude Decimal Degrees: 37.9036 Thermal Gradient: 1.65
No Diversion, Point or Return flows
Shepard et al. Rush Creek Temperature Model Calibration Final Draft – November 2009
Page - 84
Reach Number in Study: 11 Reach Number in Stream: 1
>------------ Reach # 2 in Stream: Walker Creek ------------< Walker at 395 -to- Walker mouth UpStream Node Name: Walker at 395 DownStream Node Name: Walker mouth UpStream Distance: 5.7 DownStream Distance: 4.56 Length: 1.14 UpStream Elevation: 6783.88 DownStream Elevation: 6615.08 Elevation Change: -168.8 Calculated Slope: 0.028044
GEOMETRY: Azimuth: 50.0 Width A: 1.6764 Width B: 0.15
Latitude Decimal Degrees: 37.9092 Thermal Gradient: 1.65
No Diversion, Point or Return flows
Reach Number in Study: 12 Reach Number in Stream: 2
------------------------------------------------------------------------------- ------------------------------------------------------------------------------- STREAM: Parker Creek Stream Number:4 Type: Tributary Assigned to Stream: Rush Creek Confluence is at Upstream Distance of 5.12
Number of Nodes: 3 Number of Reaches: 2
UpStream Distance: 7.5 DownStream Distance: 5.12 Length: 2.38
UpStream Elevation: 7021.18 DownStream Elevation: 6670.68 Elevation Change: -350.5
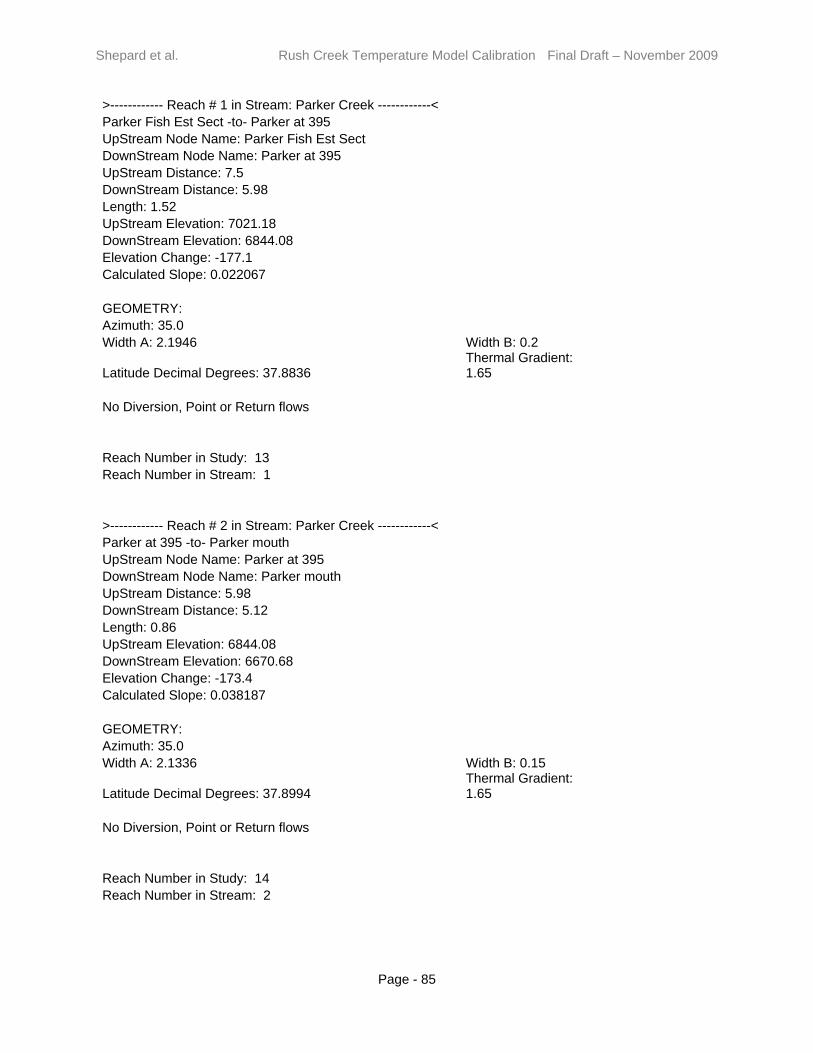
Shepard et al. Rush Creek Temperature Model Calibration Final Draft – November 2009
Page - 85
>------------ Reach # 1 in Stream: Parker Creek ------------< Parker Fish Est Sect -to- Parker at 395 UpStream Node Name: Parker Fish Est Sect DownStream Node Name: Parker at 395 UpStream Distance: 7.5 DownStream Distance: 5.98 Length: 1.52 UpStream Elevation: 7021.18 DownStream Elevation: 6844.08 Elevation Change: -177.1 Calculated Slope: 0.022067
GEOMETRY: Azimuth: 35.0 Width A: 2.1946 Width B: 0.2
Latitude Decimal Degrees: 37.8836 Thermal Gradient: 1.65
No Diversion, Point or Return flows
Reach Number in Study: 13 Reach Number in Stream: 1
>------------ Reach # 2 in Stream: Parker Creek ------------< Parker at 395 -to- Parker mouth UpStream Node Name: Parker at 395 DownStream Node Name: Parker mouth UpStream Distance: 5.98 DownStream Distance: 5.12 Length: 0.86 UpStream Elevation: 6844.08 DownStream Elevation: 6670.68 Elevation Change: -173.4 Calculated Slope: 0.038187
GEOMETRY: Azimuth: 35.0 Width A: 2.1336 Width B: 0.15
Latitude Decimal Degrees: 37.8994 Thermal Gradient: 1.65
No Diversion, Point or Return flows
Reach Number in Study: 14 Reach Number in Stream: 2

Shepard et al. Rush Creek Temperature Model Calibration Final Draft – November 2009
Page - 86
Stream Temperature Program 1.0.4 Copyright, Thomas R. Payne & Associates Licensed to: Thomas R. Payne & Associates
October 02, 2009 - 3:54 p.m. Filename: \RUSH08_5_SIPHON_Best.STT RUSH08_5_siphon3a - cloud Tioga Cain - comp sun, shade surv, wind incr, 1 cfs to Walker,1 up gain, 6.5 loss 395 Units: Metric (air temps = C, wind = meters per second, solar radiation = J/Mイ/Sec)
STUDY WEATHER/SOLAR RADIATION DATA
Cain Ranch (Temp and Wind), LV (humidity), Tioga sunshine
Time Period Number of Days: 122 Starting Date: 6/1/2008 Ending Date: 9/30/2008
------------------------------------------------------------------------------GLOBAL VARIABLES Weather Station Elevation: 1304.55 LATITUDE - Decimal Degrees: 37.8925
Average Annual Air (Ground) Temperature: 48.0ー
Allow Air Temperature and Humidity to change with elevation: YES Allow Solar Radiation to change with elevation: YES
Bowen Ratio: 0.000619 Evaporation Factors - EFA: 40.0
EFB: 15.0
EFC: 0.0
------------------------------------------------------------------------------DAILY DATA AT WEATHER STATION
RECORD Day
Length
High Air
Temp
Low Air
Temp Avg Air Temp
% Humidity
Wind Speed % Sun
SOLAR RAD.
6/1/2008 14.47 73 32 52.5 45 4.6 59.3 592.416/2/2008 14.486 71 37 54 45 4.2 75.5 674.76/3/2008 14.501 75 33 54 45 4.2 64.8 621.216/4/2008 14.516 72 34 53 34 7.8 59.4 599.066/5/2008 14.53 59 27 43 41 11 79 702.516/6/2008 14.543 76 23 49.5 38 4.3 81.2 711.846/7/2008 14.555 74 42 58 38 7.5 81.3 707.616/8/2008 14.566 69 27 48 40 2.9 82.4 7196/9/2008 14.576 78 27 52.5 40 3.2 86.9 738.15
6/10/2008 14.585 85 33 59 25 5 83.9 728.946/11/2008 14.594 76 31 53.5 30 6.2 84.3 731.126/12/2008 14.602 75 25 50 33 3 86.4 742.026/13/2008 14.608 79 27 53 34 3 90.1 757.69
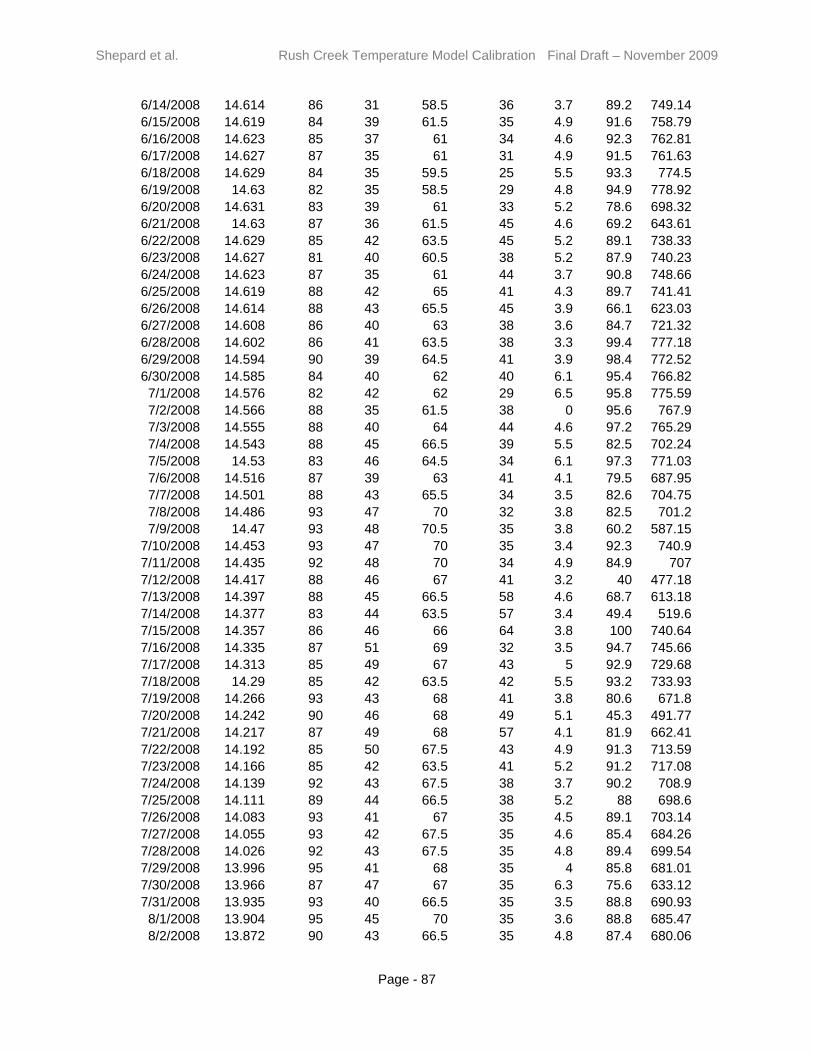
Shepard et al. Rush Creek Temperature Model Calibration Final Draft – November 2009
Page - 87
6/14/2008 14.614 86 31 58.5 36 3.7 89.2 749.146/15/2008 14.619 84 39 61.5 35 4.9 91.6 758.796/16/2008 14.623 85 37 61 34 4.6 92.3 762.816/17/2008 14.627 87 35 61 31 4.9 91.5 761.636/18/2008 14.629 84 35 59.5 25 5.5 93.3 774.56/19/2008 14.63 82 35 58.5 29 4.8 94.9 778.926/20/2008 14.631 83 39 61 33 5.2 78.6 698.326/21/2008 14.63 87 36 61.5 45 4.6 69.2 643.616/22/2008 14.629 85 42 63.5 45 5.2 89.1 738.336/23/2008 14.627 81 40 60.5 38 5.2 87.9 740.236/24/2008 14.623 87 35 61 44 3.7 90.8 748.666/25/2008 14.619 88 42 65 41 4.3 89.7 741.416/26/2008 14.614 88 43 65.5 45 3.9 66.1 623.036/27/2008 14.608 86 40 63 38 3.6 84.7 721.326/28/2008 14.602 86 41 63.5 38 3.3 99.4 777.186/29/2008 14.594 90 39 64.5 41 3.9 98.4 772.526/30/2008 14.585 84 40 62 40 6.1 95.4 766.827/1/2008 14.576 82 42 62 29 6.5 95.8 775.597/2/2008 14.566 88 35 61.5 38 0 95.6 767.97/3/2008 14.555 88 40 64 44 4.6 97.2 765.297/4/2008 14.543 88 45 66.5 39 5.5 82.5 702.247/5/2008 14.53 83 46 64.5 34 6.1 97.3 771.037/6/2008 14.516 87 39 63 41 4.1 79.5 687.957/7/2008 14.501 88 43 65.5 34 3.5 82.6 704.757/8/2008 14.486 93 47 70 32 3.8 82.5 701.27/9/2008 14.47 93 48 70.5 35 3.8 60.2 587.15
7/10/2008 14.453 93 47 70 35 3.4 92.3 740.97/11/2008 14.435 92 48 70 34 4.9 84.9 7077/12/2008 14.417 88 46 67 41 3.2 40 477.187/13/2008 14.397 88 45 66.5 58 4.6 68.7 613.187/14/2008 14.377 83 44 63.5 57 3.4 49.4 519.67/15/2008 14.357 86 46 66 64 3.8 100 740.647/16/2008 14.335 87 51 69 32 3.5 94.7 745.667/17/2008 14.313 85 49 67 43 5 92.9 729.687/18/2008 14.29 85 42 63.5 42 5.5 93.2 733.937/19/2008 14.266 93 43 68 41 3.8 80.6 671.87/20/2008 14.242 90 46 68 49 5.1 45.3 491.777/21/2008 14.217 87 49 68 57 4.1 81.9 662.417/22/2008 14.192 85 50 67.5 43 4.9 91.3 713.597/23/2008 14.166 85 42 63.5 41 5.2 91.2 717.087/24/2008 14.139 92 43 67.5 38 3.7 90.2 708.97/25/2008 14.111 89 44 66.5 38 5.2 88 698.67/26/2008 14.083 93 41 67 35 4.5 89.1 703.147/27/2008 14.055 93 42 67.5 35 4.6 85.4 684.267/28/2008 14.026 92 43 67.5 35 4.8 89.4 699.547/29/2008 13.996 95 41 68 35 4 85.8 681.017/30/2008 13.966 87 47 67 35 6.3 75.6 633.127/31/2008 13.935 93 40 66.5 35 3.5 88.8 690.938/1/2008 13.904 95 45 70 35 3.6 88.8 685.478/2/2008 13.872 90 43 66.5 35 4.8 87.4 680.06

Shepard et al. Rush Creek Temperature Model Calibration Final Draft – November 2009
Page - 88
8/3/2008 13.84 85 42 63.5 35 6.2 86.6 676.448/4/2008 13.807 84 38 61 35 5.8 80.9 650.518/5/2008 13.774 87 39 63 35 4.5 61.4 556.288/6/2008 13.741 84 51 67.5 35 2.6 70.6 593.988/7/2008 13.707 87 46 66.5 36 4.7 79.6 632.298/8/2008 13.672 86 47 66.5 36 6.2 86.1 657.918/9/2008 13.638 81 46 63.5 34 8.3 85.7 656.77
8/10/2008 13.602 88 48 68 31 5.7 87.2 659.158/11/2008 13.567 89 36 62.5 33 3.3 87.8 661.348/12/2008 13.531 91 41 66 36 3.4 87.4 651.888/13/2008 13.495 91 42 66.5 39 3.6 86.5 642.518/14/2008 13.458 95 43 69 37 3.4 82.1 620.468/15/2008 13.422 97 45 71 35 3.6 68.6 558.468/16/2008 13.384 94 46 70 38 3.8 59.7 515.068/17/2008 13.347 91 46 68.5 46 4 84.1 613.168/18/2008 13.309 93 44 68.5 45 3.7 83.1 606.688/19/2008 13.271 81 43 62 38 6.5 59.3 510.398/20/2008 13.233 83 44 63.5 48 4.8 83.6 605.358/21/2008 13.194 92 39 65.5 47 3.3 82.3 595.448/22/2008 13.156 91 45 68 47 4.4 84.1 596.688/23/2008 13.117 93 45 69 44 3.9 82.6 588.368/24/2008 13.078 89 47 68 42 4.7 78.5 570.398/25/2008 13.038 89 48 68.5 32 4.9 74.6 557.618/26/2008 12.999 88 42 65 31 5.2 73.6 552.958/27/2008 12.959 91 36 63.5 44 3.1 73.2 541.278/28/2008 12.919 93 41 67 43 2.8 72.8 534.068/29/2008 12.879 93 43 68 44 3 70.1 518.048/30/2008 12.838 92 43 67.5 32 4.1 47.8 428.448/31/2008 12.798 85 58 71.5 16 7.9 63 497.889/1/2008 12.757 74 39 56.5 27 8 60.8 484.749/2/2008 12.716 74 24 49 31 2.8 64.3 497.329/3/2008 12.676 83 28 55.5 30 3.6 63.3 487.739/4/2008 12.635 86 33 59.5 34 3 61.7 474.449/5/2008 12.594 89 35 62 34 3.1 62.9 474.389/6/2008 12.552 90 36 63 38 2.8 62 464.969/7/2008 12.511 89 37 63 35 3.8 63.5 469.019/8/2008 12.47 87 39 63 37 4.9 58.3 444.169/9/2008 12.428 87 39 63 36 4.6 49.4 405.62
9/10/2008 12.387 78 40 59 41 6.6 48.8 400.179/11/2008 12.345 74 37 55.5 38 3.6 64.1 459.149/12/2008 12.303 78 32 55 34 0 63.3 454.239/13/2008 12.262 86 29 57.5 34 2.8 57.3 426.589/14/2008 12.22 82 32 57 34 3.3 59.4 431.49/15/2008 12.178 86 33 59.5 31 3.1 59.8 429.399/16/2008 12.136 87 34 60.5 38 3.3 26.3 291.039/17/2008 12.094 79 36 57.5 44 4.8 38.6 338.089/18/2008 12.052 79 36 57.5 47 4.3 58 406.889/19/2008 12.01 81 38 59.5 44 4.5 57.1 399.989/20/2008 11.969 72 35 53.5 40 7.8 57.4 401.529/21/2008 11.927 77 32 54.5 38 4.7 54.4 387.31

Shepard et al. Rush Creek Temperature Model Calibration Final Draft – November 2009
Page - 89
9/22/2008 11.885 79 30 54.5 42 4.5 55.1 385.29/23/2008 11.843 75 27 51 40 2.8 56.7 389.249/24/2008 11.801 79 28 53.5 34 3.2 55.7 383.19/25/2008 11.759 83 31 57 30 4 55.6 379.039/26/2008 11.718 78 37 57.5 33 6.8 54.6 370.929/27/2008 11.676 80 35 57.5 42 4.8 56.4 370.79/28/2008 11.634 83 35 59 43 3 35.9 295.639/29/2008 11.593 82 36 59 56 3.5 14.9 208.959/30/2008 11.551 67 41 54 62 3.7 40.4 302.67


![Predicting Isotopic Fractionation in Water from Quantum ... · PDF filePREDICTING ISOTOPIC FRACTIONATION IN WATER FROM ... and Schulman [17]. 2.1.1. Path Integral Quantum ... PREDICTING](https://img.pdfslide.us/doc/110x75/5a79ebdf7f8b9ab05f8dafe9/predicting-isotopic-fractionation-in-water-from-quantum-isotopic-fractionation.jpg)