Embed Size (px)
Citation preview
Water-Temperature Data for the Colorado River and Tributaries between Glen Canyon Dam and Spencer Canyon, Northern Arizona, 1988–2005
By Nicholas Voichick and Scott A. Wright
Data Series 251
U.S. Department of the Interior U.S. Geological Survey

ii
U.S. Department of the Interior DIRK KEMPTHORNE, Secretary
U.S. Geological Survey Mark D. Myers, Director
U.S. Geological Survey, Reston, Virginia 2007
For product and ordering information: World Wide Web: http://www.usgs.gov/pubprod Telephone: 1-888-ASK-USGS
For more information on the USGS—the Federal source for science about the Earth, its natural and living resources, natural hazards, and the environment: World Wide Web: http://www.usgs.gov Telephone: 1-888-ASK-USGS
Suggested citation: Voichick, N., and Wright, S.A., 2007, Water-temperature data for the Colorado River and tributaries between Glen Canyon Dam and Spencer Canyon, northern Arizona, 1988–2005: U.S. Geological Survey Data Series 251, 24 p.
Any use of trade, product, or firm names is for descriptive purposes only and does not imply endorsement by the U.S. Government.
Although this report is in the public domain, permission must be secured from the individual copyright owners to reproduce any copyrighted material contained within this report.
iii
Contents Abstract................................................................................................................................................................................1 Introduction .........................................................................................................................................................................1
Purpose and Scope ........................................................................................................................................................2 Acknowledgments..............................................................................................................................................................2 Methods ...............................................................................................................................................................................2
Instrumentation and Operation ....................................................................................................................................2 Deployment of Temperature Instruments ..................................................................................................................3 Cross-Section Measurements .....................................................................................................................................3 Data Retrieval and Processing.....................................................................................................................................4
Data Summary and Availability ........................................................................................................................................5 References Cited ................................................................................................................................................................5
Figures 1. Map of the Colorado River and its tributaries between Lake Powell and Lake Mead, northern Arizona, showing water-temperature monitoring locations described in this report .........................................................11 2. Daily water temperatures measured or calculated at the U.S. Geological Survey’s (USGS) streamgage (station number 09380000) located at Lees Ferry, Colorado River, 1949–2005 ......................................................12 3. Photograph of Shinumo Creek looking upstream near the confluence with the Colorado River..................13 4. Photograph of the east bank of the Colorado River near river mile 61...............................................................14 5. Time-series plots (A through N) of hourly water temperature for monitoring sites on the mainstem Colorado River...................................................................................................................................................................15 6. Time-series plots (A through H) of hourly water temperature for monitoring sites on tributaries of the Colorado River...................................................................................................................................................................20 7. Box and whisker plots for monitoring sites on the mainstem Colorado River ..................................................23 8. Box and whisker plots for monitoring sites on tributaries of the Colorado River.............................................24
Tables 1. Monitoring sites on the mainstem Colorado River, including site names, locations, periods of record, and instrument types .................................................................................................................................................................7 2. Monitoring sites on tributaries of the Colorado River, including site names, locations, periods of record, and instrument types .........................................................................................................................................................8 3. Temperature range, accuracy, and resolution of the instruments used in the study........................................9 4. Summary of water-temperature statistics over the period of record for all sites based on hourly averaged data .....................................................................................................................................................................................10
iv
Conversion Factors Multiply By To obtain
Length
mile (mi) 1.609 kilometer (km) Temperature in degrees Celsius (°C) may be converted to degrees Fahrenheit (°F) as follows: °F=(1.8×°C)+32 Horizontal coordinate information is referenced to the insert datum name (and abbreviation) here, for instance, “North American Datum of 1983 (NAD 83)”

1
Water-Temperature Data for the Colorado River and Tributaries between Glen Canyon Dam and Spencer Canyon, Northern Arizona, 1988–2005
By Nicholas Voichick and Scott A. Wright
Abstract The regulation of flow of the Colorado River by Glen Canyon Dam began in 1963. This
resulted in significant changes to the downstream ecosystem of the Colorado River in Grand Canyon, contributing to the initiation of the Glen Canyon Environmental Studies program in 1982, followed by establishment of the Glen Canyon Dam Adaptive Management Program in 1996. This report describes a water-temperature dataset collected through these programs for the reach of the Colorado River and selected tributaries between Glen Canyon Dam and Spencer Canyon (approximately 261 river miles) in northern Arizona from 1988 to 2005. The primary purposes of the report are to summarize the methods of data collection, processing, and editing; to present summary statistics; and to make the data described in the report available.
Introduction The regulation of the Colorado River by Glen Canyon Dam, which began in 1963, resulted
in a significant change in the physical and biological environments of the Colorado River downstream from the dam in northern Arizona (fig. 1). Flow regulation by the dam reduced annual peak flows, raised minimum flows, and increased daily fluctuations in flows according to hydropower demand (Topping and others, 2003). As a result of the construction and operation of the dam, sandbars and other fine-grained deposits have been eroded (Topping and others, 2000; Wright and others, 2005). Additionally, the presence of the dam has led to a change in the water temperature below the dam (fig. 2). Before flow regulation by the dam, the temperature of the river at Lees Ferry, located approximately 25 km downstream, fluctuated from near freezing in the winter to nearly 30ºC in the summer. During and after the filling of Lake Powell, which occurred in June 1980, the temperature range and average temperature of the river have both decreased, because the penstock intakes withdraw water from approximately 70 m below the full-conservation pool elevation of 1,128 m. The water withdrawn from the penstocks and released below the dam is significantly cooler during most of the year than the water at the surface of Lake Powell.
In concert with these changes to the downstream physical environment, Glen Canyon Dam has affected the aquatic and terrestrial ecosystems, including the aquatic food base (Kennedy and Gloss, 2005), fish community (Gloss and Coggins, 2005), and terrestrial vegetation (Ralston, 2005). Also, cultural and recreational resources within Grand Canyon have been affected (Fairley, 2005; Kaplinski and others, 2005). Recognition of these changes contributed to the initiation of the Glen Canyon Environmental Studies (GCES) program in 1982, followed by establishment of the

2
Glen Canyon Dam Adaptive Management Program through the Record of Decision for the operation of Glen Canyon Dam in 1996 (U.S. Department of the Interior, 1996).
Purpose and Scope One of the primary responsibilities of the Bureau of Reclamation’s Glen Canyon
Environmental Studies program and subsequently the U.S. Geological Survey’s Grand Canyon Monitoring and Research Center (GCMRC), which succeeded the GCES in 1996, has been to document changes in the Colorado River resulting from the construction and operation of Glen Canyon Dam. The GCES program began collecting temperature data for the Colorado River below Glen Canyon Dam in 1988 and temperature data continues to be collected by the GCMRC. This temperature data assist modelers in predicting the effect of dam operations on downstream water temperature. The water temperature of the Colorado River in Grand Canyon is an important physical property of the aquatic ecosystem in Grand Canyon affecting fish metabolism, fish reproduction, and the aquatic food base, which are key factors in determining fish health.
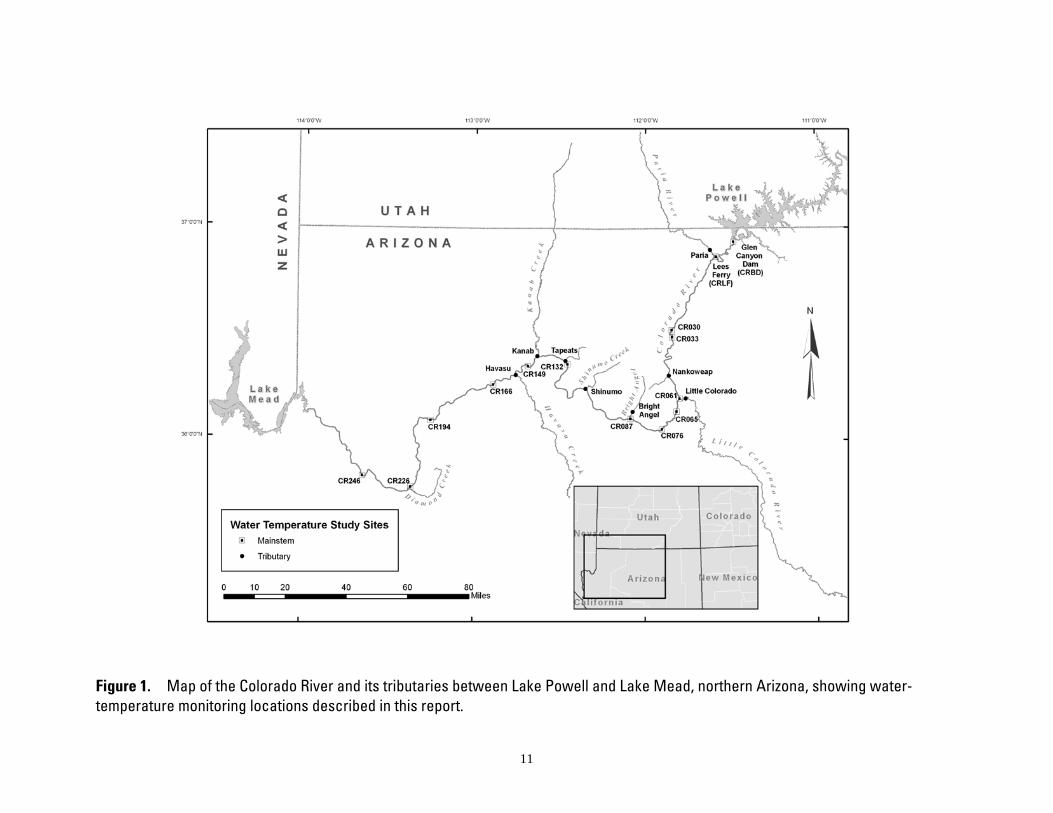
This report references locations on the Colorado River in river miles (RM) downstream from Lees Ferry (RM 0). The river mile is a commonly used unit with considerable historical precedent for describing locations on the Colorado River downstream of Glen Canyon Dam (fig. 1).
The purpose of this report is to present water-temperature data collected by the GCES and the GCMRC at 14 sites along the mainstem of the Colorado River, as well as in 8 tributaries of the Colorado River between Glen Canyon Dam (RM -15) and Spencer Canyon (RM 246) from 1988 to 2005 (fig. 1; tables 1 and 2). This report summarizes the methods of data collection, processing and editing, and presents time-series plots and summary statistics of the data.
Acknowledgments Many people assisted in the collection of the more than 15 years of data presented in this
report. Bill Vernieu, Mike Yard, Allen Haden, Susan Hueftle, Keith Kohl, and Jeanne Korn (all GCES and/or GCMRC employees) played a major role in setting up the sites and collecting the data. Bill Vernieu was also primarily responsible for structuring the database. Tim Andrews (a GCMRC contractor), Glenn Bennett (a GCMRC employee), and Susan Hueftle are responsible for setting up real-time communication systems at four of the study sites. A large number of additional people were involved in collecting the data, in particular, Stuart Reeder, Steve Jones, Jimmy Grissom, Mark Franke, J.P. Running, Pete Weiss, and Brian Dierker (all technical boatmen contracted by GCMRC), as well as Ron Griffiths, Tom Sabol, Amy Draut, Carol Fritzinger, Kara Hilwig, Elizabeth Fuller, Ted Kennedy, Scott Wright, David Topping (all GCMRC employees or contractors), Jesse Granet (a Glen Canyon National Recreation Area employee), Nancy Hornewer, Jim Parent (both USGS Arizona Water Science Center employees), and many others.
Methods
Instrumentation and Operation
Four types of temperature instruments were used to record water temperature at the 22 sites during the period of this report, 1988 to 2005. All four types of instruments used thermistors to measure temperature and had logging and storage capability within the instrument, storing each temperature reading with a date and time stamp. Two of the temperature instruments were
3
manufactured by Onset Computer Corporation—the StowAway XTI32 logger and the HOBO H20 Water Temp Pro logger. The other types of instruments were multiparameter datasondes that record and log temperature in addition to other water-quality parameters—the Yellow Springs Instruments (YSI) 6920 datasonde and the Hydrolab Recorder datasonde. Tables 1 and 2 show the instrument types used at all the sites. Table 3 presents the temperature range, accuracy, and resolution of each of the instrument types.
Sixty-seven percent of the temperature instruments used to collect data in this report were tested for accuracy and potential drift (of particular interest for the older StowAway model instruments) in a room temperature circulating water bath. Temperature readings were recorded in the water bath every 5 minutes for several hours in a series of trials conducted in 2005. These readings were compared to simultaneous temperature measurements taken from a reference Cole-Parmer Digi-Sense model 93210-50 logger equipped with a YSI 401 probe with a combined accuracy of ±0.13ºC in the temperature range tested. A National Institute of Standards and Technology (NIST) traceable calibration certificate for the reference logger and probe combination showed temperature readings within the stated accuracy. All of the tested instruments had an average temperature difference from the Digi-Sense logger that was within the reported accuracy specifications presented in table 3. The average difference between readings from the temperature instruments and the Digi-Sense logger was 0.083ºC.
Deployment of Temperature Instruments
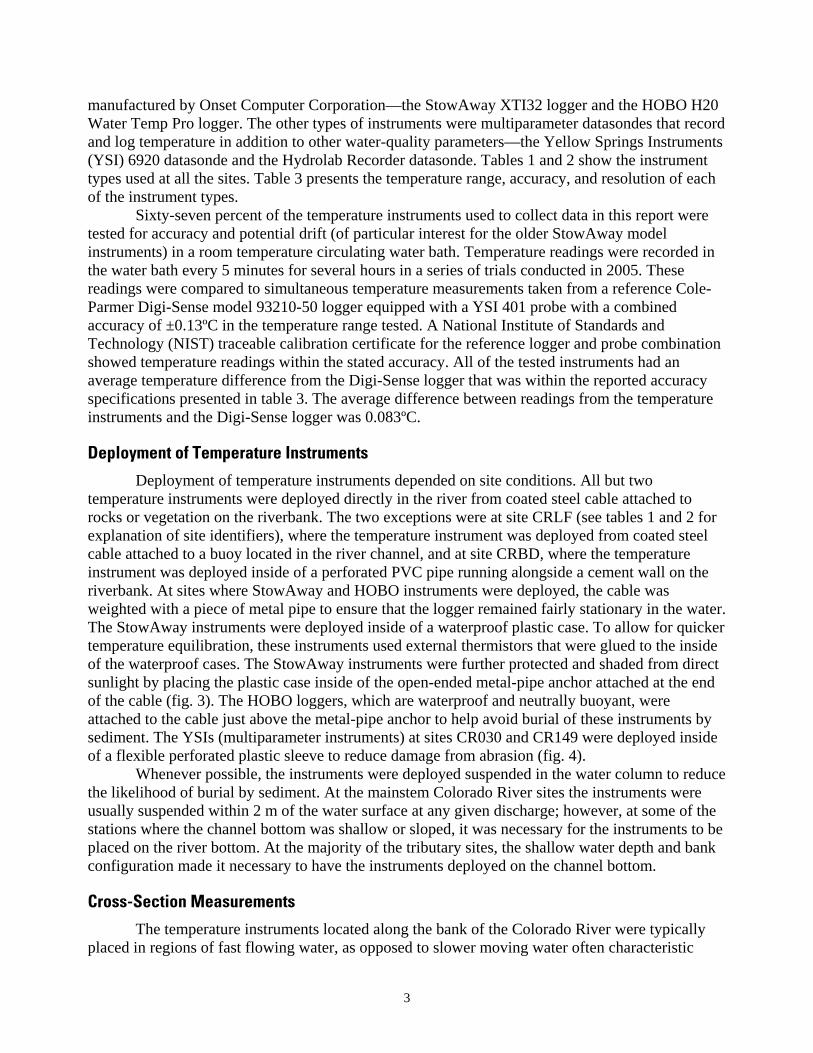
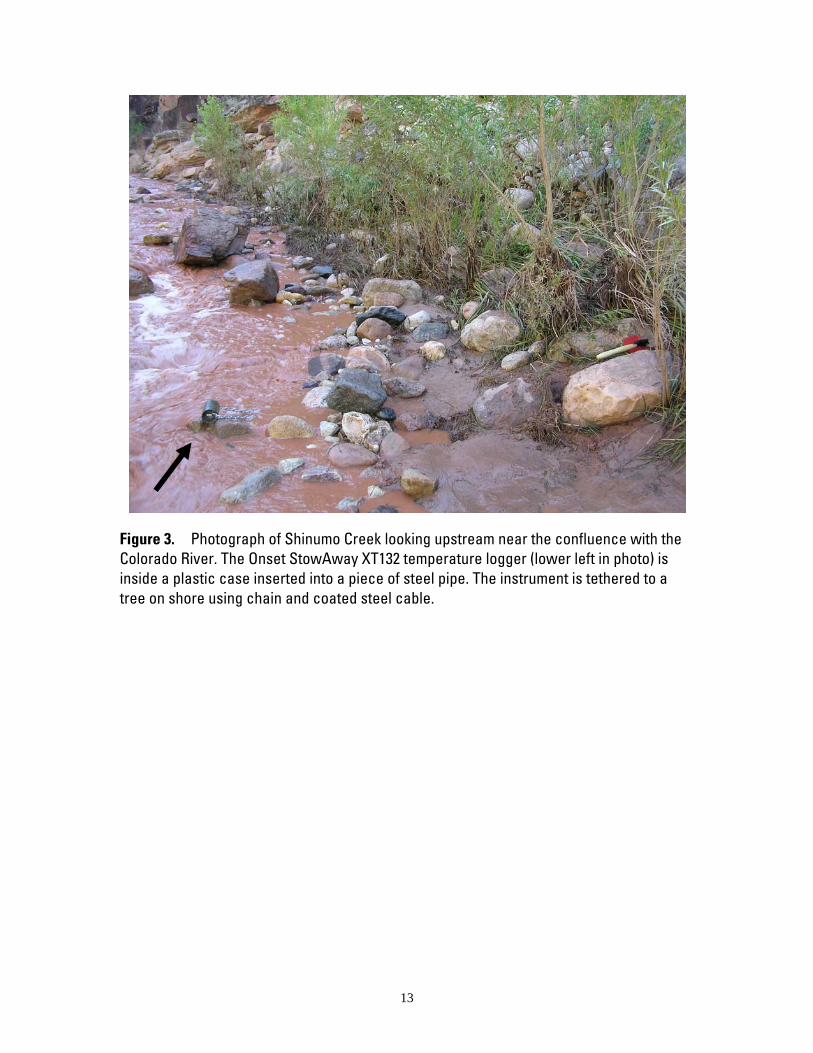
Deployment of temperature instruments depended on site conditions. All but two temperature instruments were deployed directly in the river from coated steel cable attached to rocks or vegetation on the riverbank. The two exceptions were at site CRLF (see tables 1 and 2 for explanation of site identifiers), where the temperature instrument was deployed from coated steel cable attached to a buoy located in the river channel, and at site CRBD, where the temperature instrument was deployed inside of a perforated PVC pipe running alongside a cement wall on the riverbank. At sites where StowAway and HOBO instruments were deployed, the cable was weighted with a piece of metal pipe to ensure that the logger remained fairly stationary in the water. The StowAway instruments were deployed inside of a waterproof plastic case. To allow for quicker temperature equilibration, these instruments used external thermistors that were glued to the inside of the waterproof cases. The StowAway instruments were further protected and shaded from direct sunlight by placing the plastic case inside of the open-ended metal-pipe anchor attached at the end of the cable (fig. 3). The HOBO loggers, which are waterproof and neutrally buoyant, were attached to the cable just above the metal-pipe anchor to help avoid burial of these instruments by sediment. The YSIs (multiparameter instruments) at sites CR030 and CR149 were deployed inside of a flexible perforated plastic sleeve to reduce damage from abrasion (fig. 4).
Whenever possible, the instruments were deployed suspended in the water column to reduce the likelihood of burial by sediment. At the mainstem Colorado River sites the instruments were usually suspended within 2 m of the water surface at any given discharge; however, at some of the stations where the channel bottom was shallow or sloped, it was necessary for the instruments to be placed on the river bottom. At the majority of the tributary sites, the shallow water depth and bank configuration made it necessary to have the instruments deployed on the channel bottom.
Cross-Section Measurements
The temperature instruments located along the bank of the Colorado River were typically placed in regions of fast flowing water, as opposed to slower moving water often characteristic
4
along the channel margins. This approach was expected to result in water temperatures more representative of the entire cross section of the Colorado River. To test this hypothesis, three mainstem Colorado River sites (CR030, CR061, and CR226) were chosen to make cross-section measurements for comparisons (Wagner and others, 2006). In January 2005, at each site, temperature readings were taken at five locations across the river channel. At sites CR030 and CR061, temperature readings were taken from a boat held stationary in the river channel. At site CR226, measurements were taken from a cable car suspended over the river channel. At each of the five locations in the channel, a weighted YSI instrument was lowered to record temperature readings from just below the water surface to the channel bottom at approximately 1-m depth intervals. A separate YSI instrument was used to record temperature readings simultaneously at the near-bank deployment site to detect any change in river temperature during the cross-section measurements. Additionally, after the cross-section measurements were taken, the near-bank logger and the instrument used for the cross-section measurements recorded simultaneous temperature readings at the near-bank deployment site to check for instrument variation.
The variation in temperature readings within each cross section was 0.01 to 0.02ºC, well within the accuracy of the instruments. The maximum difference in temperature readings between the near-bank deployments and the corresponding cross-section measurements was also 0.01 to 0.02ºC. These results validate the approach of characterizing the average water temperature across the channel with a near-bank deployment, at least at these three sites under the flow conditions and time of year when the cross-section measurements were taken.
Data Retrieval and Processing
The temperature instruments were programmed to record data at specific time intervals, varying from 1 minute to 2 hours over the period of record for all sites. The time interval separating temperature readings was most frequently between 15 and 30 minutes. This logging interval was generally considered adequate in capturing water-temperature changes caused by weather events and dam operations. On a 1 to 6 month interval, the instruments were retrieved and replaced by previously programmed loggers or, less commonly, data stored in the loggers were retrieved on site after which the instruments were reprogrammed for the next data collection period. Upon its retrieval, the condition of each instrument was noted, particularly if it was buried, out of the water, or close to the water surface. Additionally, a digital handheld thermometer (with an accuracy of ±0.3ºC) was used to take a water-temperature reading at each site for later comparison with the logger readings.
Several factors were taken into consideration during data processing and editing to determine whether the temperature data accurately reflected the stream temperature. First, the condition of the instrument when it was retrieved was considered. Specifically, whether it was in the proper position in the river, out of the water, or buried in sediment in the river channel was noted, and this gave an indication of the validity of the data at the end of the deployment. The water-temperature reading taken from a handheld thermometer was compared to the temperature reading of the logger when it was retrieved. Additionally, the data were compared with duplicate data from the same site if it existed, data from adjacent sites or other tributaries, and previous years’ data from the same site during the same time of year.
The most common scenarios resulting in invalid temperature readings were when the instruments were buried in sediment or exposed to the air. The data associated with both of these situations were usually significantly different than the data from a properly deployed instrument. No data shifts or corrections were applied to the water-temperature readings; the data were

5
removed from the record if they were unclear, based on the data comparisons listed above, whether or not they accurately represented the true water temperature.
Because of the wide range in recording intervals at different sites during different time periods, hourly records were computed to provide consistency in reporting between sites and over the period of record. The reported water-temperature value for a given hour represents an average of all available readings within the 1-hour window preceding and including the time stamp. In the case when the time interval between temperature readings was 2 hours, the reported hourly averaged data has temperature readings every other hour with no temperature values reported during the intervening hours. The hourly averages are reported to the nearest 0.1°C; although, this is slightly outside the resolution of the StowAway XTI32 logger (table 3), it is well within the resolution of the other instruments and provides consistency throughout the dataset.
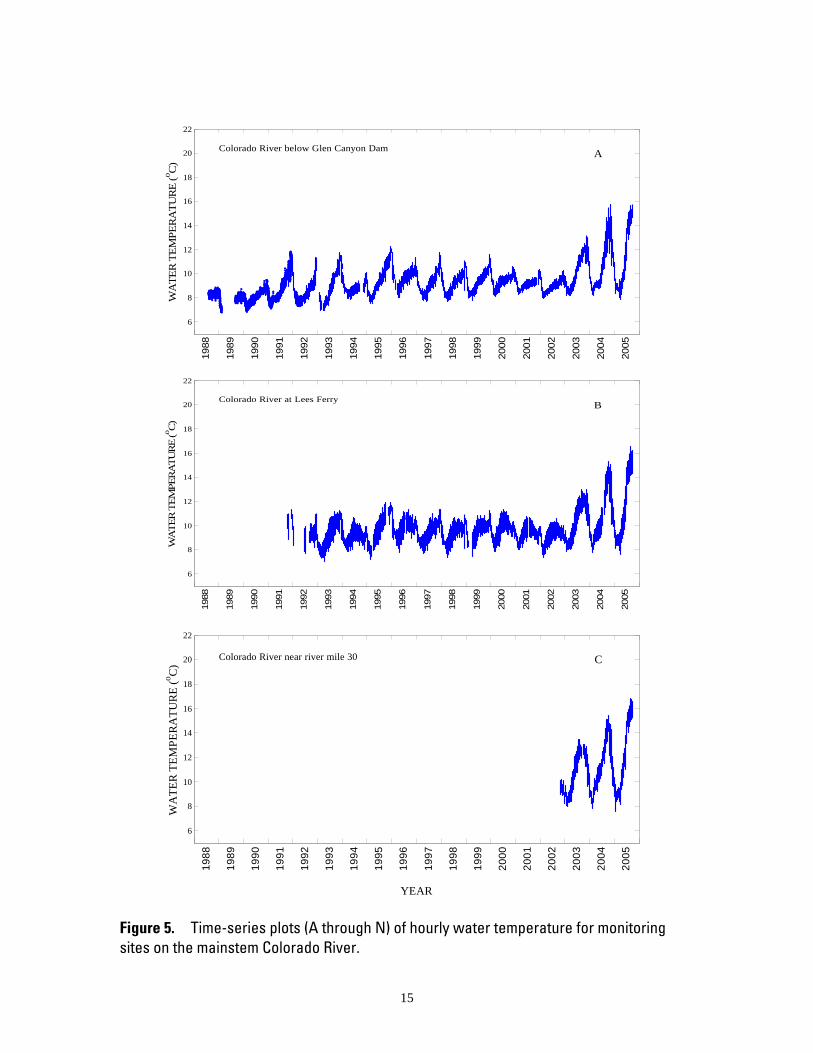
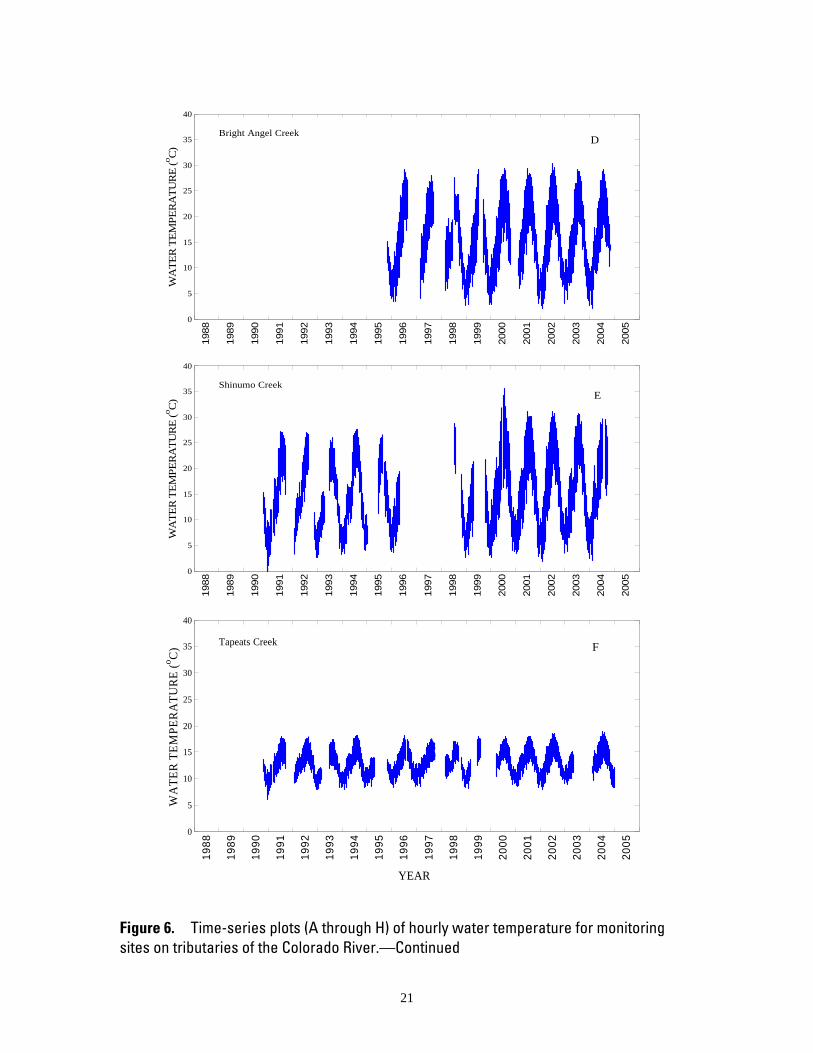
Data Summary and Availability Time-series plots of the processed hourly water-temperature records are presented in figures
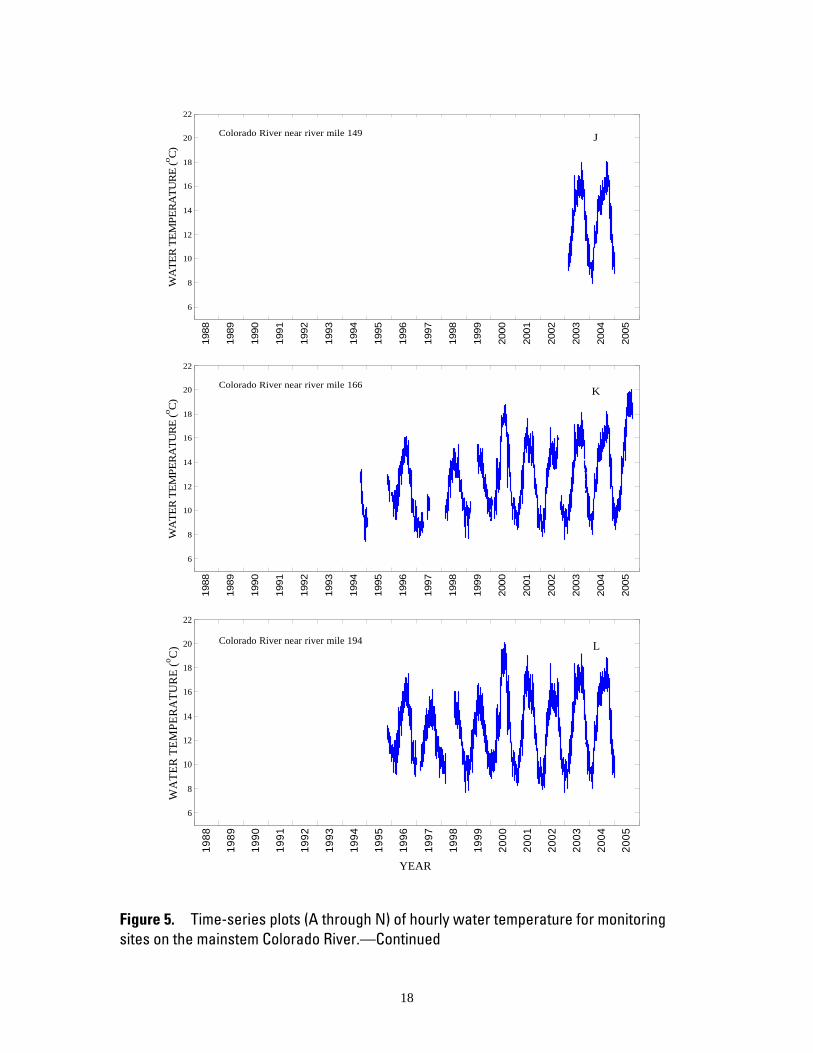
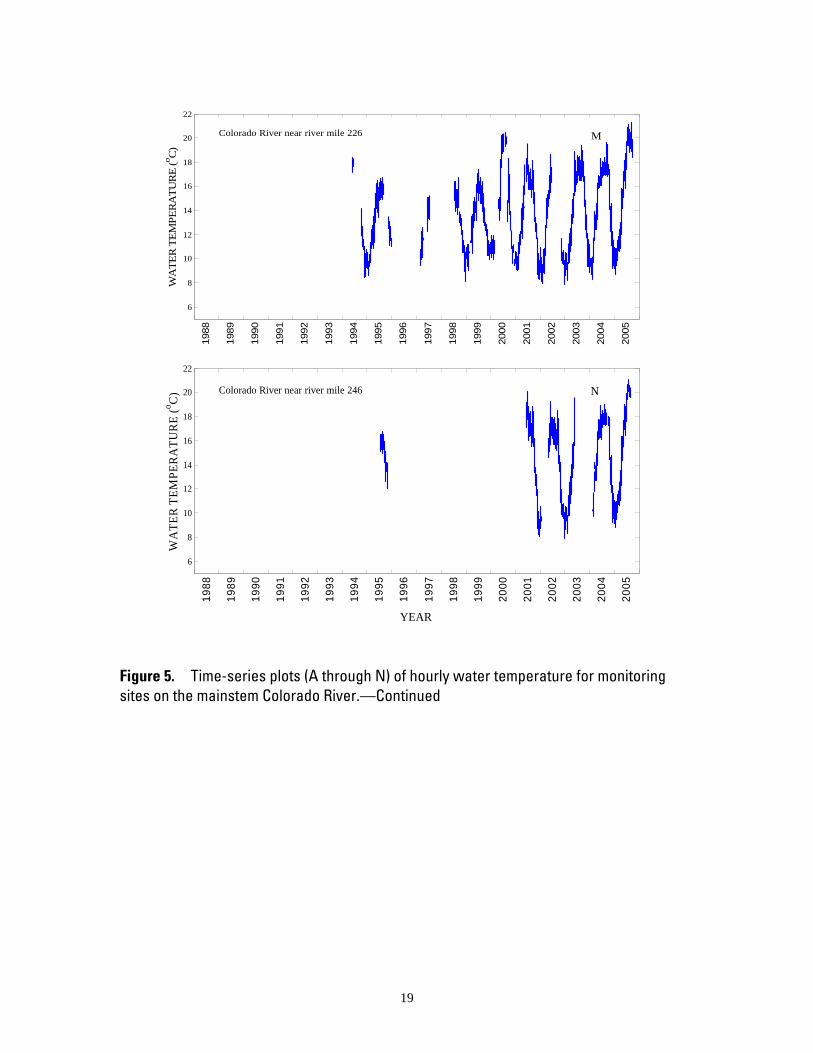
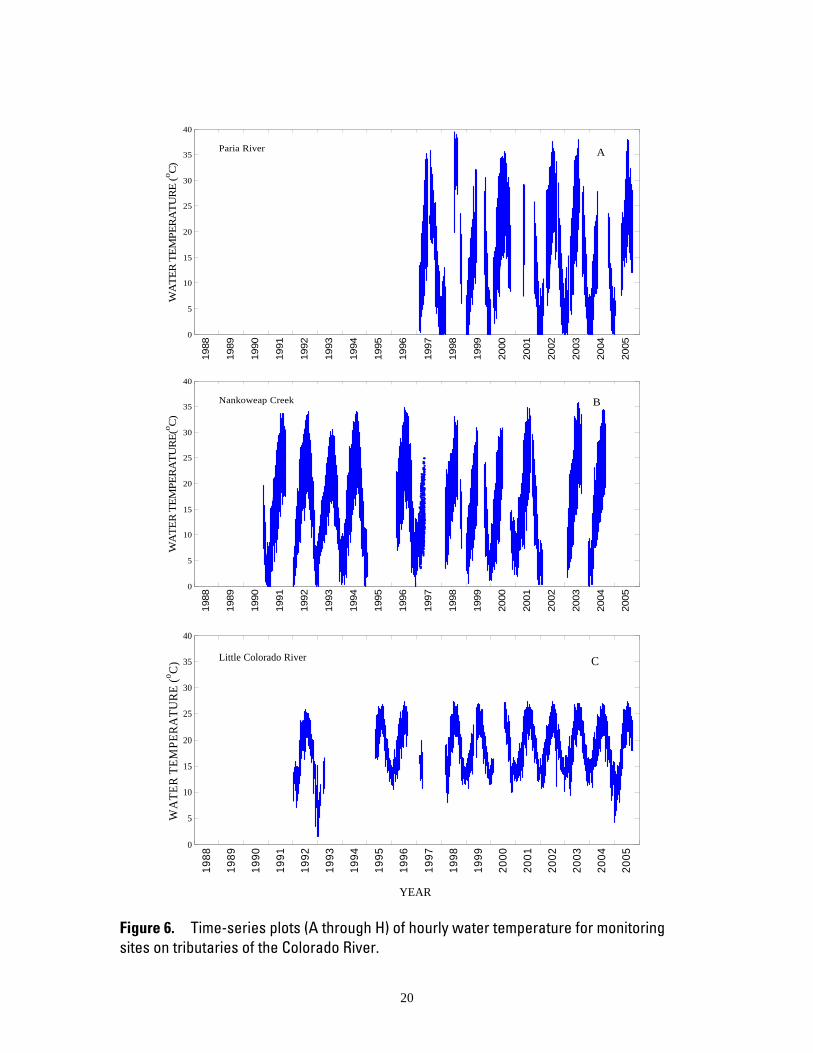
5 and 6 for all sites over the period of record. The same axes were used for all mainstem Colorado River and tributary sites in order to facilitate visual comparison of the sites, as well as to emphasize the differences in the periods of record for the sites. Seasonal fluctuations in water temperature are shown on the mainstem Colorado River in figure 5 and on tributaries of the Colorado River in figure 6. An increase in river temperature particularly at sites closer to the dam started to occur around 2003. These warmer river temperatures are coincident with lower reservoir elevations in Lake Powell.
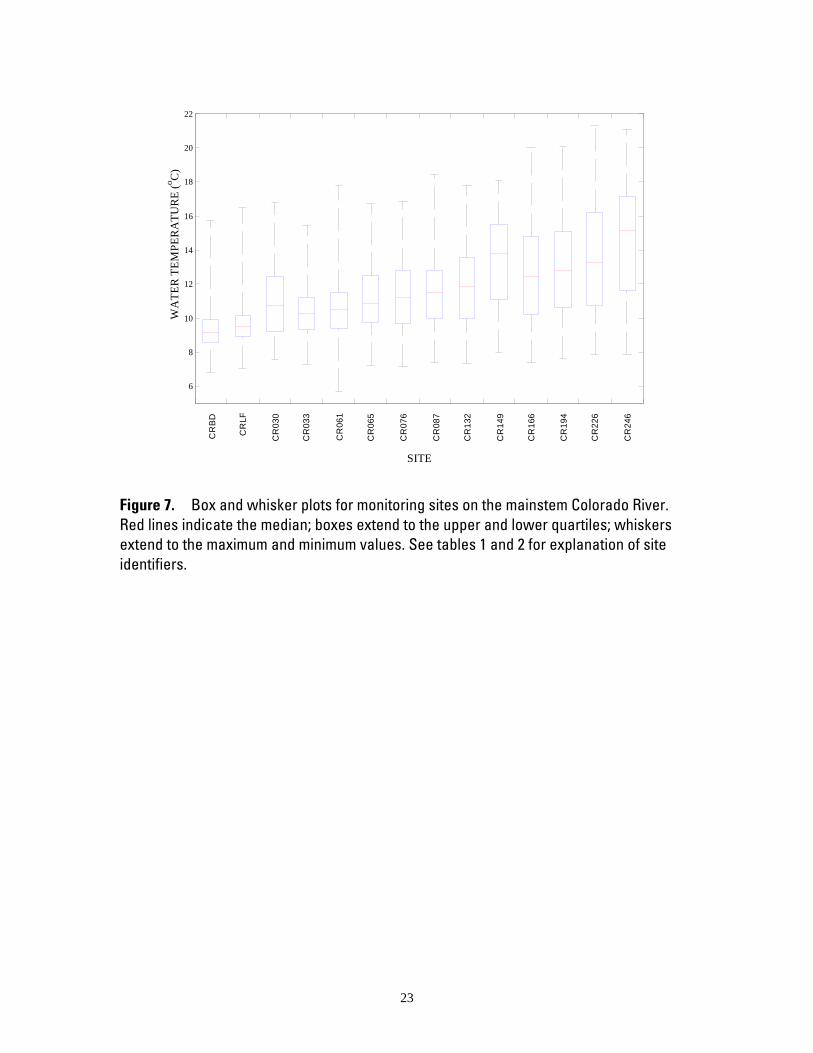
The summary statistics presented in table 4 were computed from the hourly data for each site over the period of record, including the percent missing data, mean, median, standard deviation, maximum, and minimum temperature. The summary statistics computed for the sites are not directly comparable to each other because of the different periods of record for the sites (see tables 1 and 2, figs. 5 and 6). For example, sites R030 and R149 have data since 2002 and 2003, when the river was relatively warm, whereas most of the remaining sites have data starting in the early to mid 1990s and include years of temperature measurements when the river was much cooler. Not including the two sites with the most recent periods of record, R030 and R149, table 4 and figure 7 show a downstream increase in median water temperature of the mainstem Colorado River. With the exception of Tapeats Creek, the median temperature and the range in temperature were significantly greater in each tributary steam than in the mainstem Colorado River at the site nearest to the tributary stream (tables 2 and 4, figs. 7 and 8).
The hourly averaged water-temperature records described in this report are included as Excel files organized by site and named by site identifier (tables 1 and 2).
References Cited Fairley, H.C., 2005, Cultural resources in the Colorado River corridor, in Gloss, S.P., Lovich, J.E.,
and Melis, T.S., eds., The state of the Colorado River ecosystem in Grand Canyon: U.S. Geological Survey Circular 1282, p. 177–192.
Gloss, S.P. and Coggins, L.G., 2005, Fishes of Grand Canyon, in Gloss, S.P., Lovich, J.E., and Melis, T.S., eds., The state of the Colorado River ecosystem in Grand Canyon: U.S. Geological Survey Circular 1282, p. 33–56.
Kaplinski, M., Behan, J., Hazel, J.E., Jr., Parnell, R.A., and Fairley, H.C., 2005, Recreational values and campsites in the Colorado River ecosystem, in Gloss, S.P., Lovich, J.E., and Melis,
6
T.S., eds., The state of the Colorado River ecosystem in Grand Canyon: U.S. Geological Survey Circular 1282, p. 193–205.
Kennedy, T.A., and Gloss, S.P., 2005, Aquatic ecology—the role of organic matter and invertebrates, in Gloss, S.P., Lovich, J.E., and Melis, T.S., eds., The state of the Colorado River ecosystem in Grand Canyon: U.S. Geological Survey Circular 1282, p. 87–101.
Ralston, B.E., 2005, Riparian vegetation and associated wildlife, in Gloss, S.P., Lovich, J.E., and Melis, T.S., eds., The state of the Colorado River ecosystem in Grand Canyon: U.S. Geological Survey Circular 1282, p. 103–122.
Topping, D.J., Rubin, D.M., and Vierra, L.E., Jr., 2000, Colorado River sediment transport, part 1—natural sediment supply limitation and the influence of Glen Canyon Dam: Water Resources Research, v. 36, p. 515–542.
Topping, D.J., Schmidt, J.C., and Vierra, L.E., Jr., 2003, Computation and analysis of the instantaneous-discharge record for the Colorado River at Lees Ferry, Arizona–May 8, 1921, through September 30, 2000: U.S. Geological Survey Professional Paper 1677, 118 p.
U.S. Department of the Interior, 1996, Record of decision, operation of Glen Canyon Dam: Washington, D.C., Office of the Secretary of the Interior, 13 p.
U.S. Geological Survey, 1949, Quality of surface waters of the United States, parts 7–14: U.S. Geological Survey Water-Supply Paper 1163.
U.S. Geological Survey, 1950–1963, Quality of surface waters of the United States, parts 9–14—Colorado River Basin to Pacific Slope basins in Oregon and Lower Columbia River Basin: U.S. Geological Survey Water-Supply Papers 1189 (1950), 1200 (1951), 1253 (1952), 1293 (1953), 1353 (1954), 1403 (1955), 1453 (1956), 1523 (1957), 1574 (1958), 1645 (1959), 1745 (1960), 1885 (1961), 1945 (1962), and 1951 (1963).
U.S. Geological Survey, 1964–1967, Quality of surface waters of the United States, parts 9–11—Colorado River Basin to Pacific Slope Basins in California: U.S. Geological Survey Water Supply Papers 1958 (1964), 1965 (1965), 1995 (1966), and 2015 (1967).
U.S. Geological Survey, 1968–1970, Quality of surface waters of the United States, parts 9 and 10—Colorado River Basin and the Great Basin: U.S. Geological Survey Water-Supply Papers 2098 (1968), 2148 (1969), and 2158 (1970).
U.S. Geological Survey, 1971–2005, Water resources data, Arizona, water years 1971–2005: U.S. Geological Survey Annual Water-Data Report Series.
Wagner, R.J., Boulger, R.W., Jr., Oblinger, C.J., and Smith, B.A., 2006, Guidelines and standard procedures for continuous water-quality monitors—station operation, record computation, and data reporting: U.S. Geological Survey Techniques and Methods 1-D3, 51 p., 8 attachments.
Wright, S.A., Melis, T.S., Topping, D.J., and Rubin, D.M., 2005, Influence of Glen Canyon Dam operations on downstream sand resources of the Colorado River in Grand Canyon, in Gloss, S.P., Lovich, J.E., and Melis, T.S., eds., The state of the Colorado River ecosystem in Grand Canyon: U.S. Geological Survey Circular 1282, p. 17–31.
7
Table 1. Monitoring sites on the mainstem Colorado River, including site names, locations, periods of record, and instrument types. River miles (RM) are distance downstream from Lees Ferry (RM 0); Glen Canyon Dam is (RM -15) because it is 15 miles upstream from Lees Ferry. Four types of temperature instruments were used: Onset StowAway XTI32 logger (StowAway), Onset HOBO H20 Water Temp Pro logger (HOBO), Yellow Springs Instruments 6920 datasonde (YSI), and Hydrolab Recorder datasonde (Hydrolab).
Site name Site identifier Latitude Longitude Start of record End of record Instrument type
Colorado River below Glen Canyon Dam CRBD 36.9361ºN 111.4826ºW Aug. 10, 1988 Continuing Hydrolab through Oct. 2000 then YSI
Colorado River at Lees Ferry CRLF 36.8653ºN 111.5846ºW Oct. 10, 1991 Continuing Hydrolab through Oct. 2000 then YSI
Colorado River near RM 30 CR030 36.5201ºN 111.8457ºW Oct. 26, 2002 Continuing YSI
Colorado River near RM 33 CR033 36.4861ºN 111.8434ºW Apr. 14, 2000 May 28, 2005 StowAway through Oct. 2002 then HOBO
Colorado River near RM 61 CR061 36.1964ºN 111.8003ºW Aug. 11, 1990 Continuing StowAway through Oct. 2002 then HOBO
Colorado River near RM 65 CR065 36.1357ºN 111.8180ºW Oct. 14, 1998 Jan. 3, 2005 StowAway through Oct. 2002 then HOBO
Colorado River near RM 76 CR076 36.0519ºN 111.9028ºW Oct. 15, 1998 May 30, 2005 StowAway through Oct. 2002 then HOBO
Colorado River near RM 87 CR087 36.1011ºN 112.0863ºW May 29, 1994 Continuing StowAway through Oct. 2002 then HOBO
Colorado River near RM 132 CR132 36.3572ºN 112.4563ºW May 25, 1993 Jan. 7, 2005 StowAway through Oct. 2002 then HOBO
Colorado River near RM 149 CR149 36.3470ºN 112.6871ºW Feb. 17, 2003 Jan. 7, 2005 YSI
Colorado River near RM 166 CR166 36.2596ºN 112.8905ºW Oct. 2, 1994 Continuing StowAway through Oct. 2002 then HOBO
Colorado River near RM 194 CR194 36.0895ºN 113.2528ºW Nov. 3, 1995 Jan. 8, 2005 StowAway through Oct. 2002 then HOBO
Colorado River near RM 226 CR226 35.7728ºN 113.3665ºW June 3, 1994 Continuing StowAway through Oct. 2002 then HOBO
Colorado River near RM 246 CR246 35.8243ºN 113.6472ºW July 21, 1995 Continuing StowAway through Oct. 2002 then HOBO
8
Table 2. Monitoring sites on tributaries of the Colorado River, including site names, locations, periods of record, and instrument types. River miles (RM) are distance downstream from Lees Ferry (RM 0). All tributary sites were located within approximately 1 mile of the tributary’s confluence with the Colorado River. Two types of temperature instruments were used: Onset StowAway XTI32 logger (StowAway) and Onset HOBO H20 Water Temp Pro logger (HOBO).
Site name Site identifier
River mile tributary enters Colorado River
Latitude Longitude Start of record End of record Instrument type
Paria River ParR 1 36.8690ºN 111.5918ºW Feb. 14, 1997 Continuing StowAway through Mar. 2005 then HOBO
Nankoweap Creek NanCr 52 36.3052ºN 111.8624ºW Oct. 16, 1990 Aug. 16, 2004 StowAway
Little Colorado River LCR 61 36.1946ºN 111.7996ºW Jan. 11, 1992 Continuing StowAway through Sep. 2003 then HOBO
Bright Angel Creek BACr 88 36.0998ºN 112.0931ºW Oct. 28, 1995 Oct. 27, 2004 StowAway
Shinumo Creek ShnCr 109 36.2407ºN 112.3501ºW Oct. 24, 1990 Sep. 19, 2004 StowAway
Tapeats Creek TapCr 134 36.3728ºN 112.4674ºW Oct. 24, 1990 Jan. 7, 2005 StowAway
Kanab Creek KanCr 143 36.3944ºN 112.6325ºW Oct. 25, 1990 Continuing StowAway through May 2005 then HOBO
Havasu Creek HavCr 157 36.3044ºN 112.7578ºW Jan. 24, 1992 Continuing StowAway through Dec. 2004 then HOBO

9
Table 3. Temperature range, accuracy, and resolution of the instruments used in the study, according to manufacturer’s specifications (±, plus or minus).
Onset StowAway XTI32 logger
Onset HOBO H20 Water Temp Pro
logger
Yellow Springs Instruments 6920
datasonde
Hydrolab Recorder
datasonde
Temperature Range in Water (°C)
-5 to 37 0 to 50 -5 to 45 -5 to 50
Accuracy in Water at 20°C (°C) ±0.32 ±0.2 at 25 °C ±0.15 ±0.15
Resolution (°C) 0.16 0.02 0.01 0.01

10
Table 4. Summary of water-temperature statistics over the period of record for all sites based on hourly averaged data. Percent missing data represents the percentage of missing hourly averaged temperature data over the site’s period of record (tables 1 and 2).
Site name Percent missing
data Mean (°C) Median
(°C)
Standard deviation
(°C)
Minimum (°C)
Maximum (°C)
Mainstem Colorado River sites
CRBD 20 9.4 9.2 1.3 6.8 15.7
CRLF 16 9.8 9.5 1.3 7.1 16.5
CR030 6 11.1 10.8 2.2 7.6 16.8
CR033 13 10.4 10.2 1.5 7.3 15.5
CR061 9 10.6 10.5 1.7 5.7 17.8
CR065 28 11.2 10.9 1.8 7.2 16.8
CR076 14 11.4 11.2 1.9 7.1 16.8
CR087 9 11.6 11.5 2.0 7.4 18.5
CR132 31 11.9 11.9 2.2 7.3 17.8
CR149 28 13.3 13.8 2.5 8.0 18.1
CR166 21 12.6 12.5 2.7 7.4 20.0
CR194 14 12.9 12.8 2.6 7.7 20.1
CR226 34 13.6 13.3 3.1 7.9 21.3
CR246 67 14.5 15.1 3.2 7.9 21.1
Tributary Sites
ParR 38 14.0 13.5 8.8 0.0 39.6
NanCr 41 14.2 13.5 7.6 0.0 35.8
LCR 30 18.0 18.0 4.3 1.6 27.5
BACr 26 14.5 13.9 5.8 2.1 30.2
ShnCr 37 14.0 12.8 6.3 0.0 35.6
TapCr 30 12.5 12.3 1.9 6.0 18.9
KanCr 35 15.1 14.3 6.9 0.0 34.4
HavCr 46 17.0 16.6 3.4 9.7 26.2
11
Figure 1. Map of the Colorado River and its tributaries between Lake Powell and Lake Mead, northern Arizona, showing water-temperature monitoring locations described in this report.

12
0
5
10
15
20
25
30
1948
1953
1958
1963
1968
1973
1978
1983
1988
1993
1998
2003
YEAR
WA
TER
TEM
PER
ATU
RE
(°C
)
Figure 2. Daily water temperatures measured or calculated at the U.S. Geological Survey’s (USGS) streamgage (station number 09380000) located at Lees Ferry, Colorado River, 1949–2005. All data were compiled from USGS Water-Supply Papers and Annual Water-Data Reports (U.S. Geological Survey 1949, 1950–1963, 1964–1967, 1968–1970, 1971–2005). Daily values used for this figure consist of a mix of three types based on the data reported in the USGS publications: (1) a single daily measurement made at an unreported time (7/25/1949–9/30/1952, 10/1/1953–3/8/1977); (2) the average of reported daily maximum and minimum temperatures (10/1/1952–9/30/1953, 10/1/1977–9/30/1984); and (3) mean daily temperatures (3/9/1977–9/30/1977, 10/1/1984–9/30/2005).
13
Figure 3. Photograph of Shinumo Creek looking upstream near the confluence with the Colorado River. The Onset StowAway XT132 temperature logger (lower left in photo) is inside a plastic case inserted into a piece of steel pipe. The instrument is tethered to a tree on shore using chain and coated steel cable.

14
Figure 4. Photograph of the east bank of the Colorado River near river mile 61. The Yellow Springs Instruments multiparameter instrument shown in the center of the photograph is protected from abrasion inside of a perforated plastic sleeve and deployed in the river using coated steel cable.
15
6
8
10
12
14
16
18
20
22
WA
TER
TEM
PER
ATU
RE
(o C)
1988
1989
1990
1991
1992
1993
1994
1995
1996
1997
1998
1999
2000
2001
2002
2003
2004
2005
Colorado River below Glen Canyon Dam A
6
8
10
12
14
16
18
20
22
WA
TER
TEM
PER
ATU
RE
(o C)
1988
1989
1990
1991
1992
1993
1994
1995
1996
1997
1998
1999
2000
2001
2002
2003
2004
2005
Colorado River at Lees Ferry B
6
8
10
12
14
16
18
20
22
YEAR
WA
TER
TEM
PER
ATU
RE
(o C)
1988
1989
1990
1991
1992
1993
1994
1995
1996
1997
1998
1999
2000
2001
2002
2003
2004
2005
Colorado River near river mile 30 C
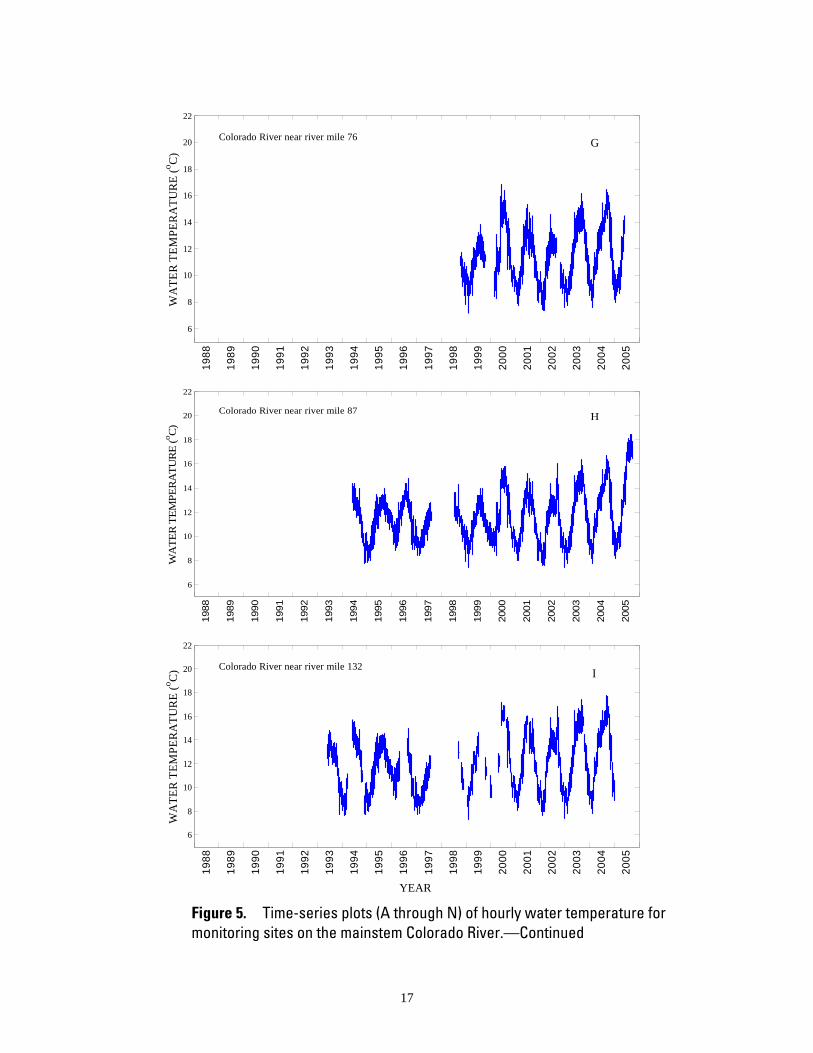
Figure 5. Time-series plots (A through N) of hourly water temperature for monitoring sites on the mainstem Colorado River.
16
6
8
10
12
14
16
18
20
22
WA
TER
TEM
PER
ATU
RE
(o C)
1988
1989
1990
1991
1992
1993
1994
1995
1996
1997
1998
1999
2000
2001
2002
2003
2004
2005
Colorado River near river mile 33D
6
8
10
12
14
16
18
20
22
WA
TER
TEM
PER
ATU
RE
(o C)
1988
1989
1990
1991
1992
1993
1994
1995
1996
1997
1998
1999
2000
2001
2002
2003
2004
2005
Colorado River near river mile 61 E
6
8
10
12
14
16
18
20
22
YEAR
WA
TER
TEM
PER
ATU
RE
(o C)
1988
1989
1990
1991
1992
1993
1994
1995
1996
1997
1998
1999
2000
2001
2002
2003
2004
2005Colorado River near river mile 65 F
Figure 5. Time-series plots (A through N) of hourly water temperature for monitoring sites on the mainstem Colorado River.—Continued
17
6
8
10
12
14
16
18
20
22
WA
TER
TEM
PER
ATU
RE
(o C)
1988
1989
1990
1991
1992
1993
1994
1995
1996
1997
1998
1999
2000
2001
2002
2003
2004
2005
Colorado River near river mile 76 G
6
8
10
12
14
16
18
20
22
WA
TER
TEM
PER
ATU
RE
(o C)
1988
1989
1990
1991
1992
1993
1994
1995
1996
1997
1998
1999
2000
2001
2002
2003
2004
2005
Colorado River near river mile 87 H
6
8
10
12
14
16
18
20
22
YEAR
WA
TER
TEM
PER
ATU
RE
(o C)
1988
1989
1990
1991
1992
1993
1994
1995
1996
1997
1998
1999
2000
2001
2002
2003
2004
2005
Colorado River near river mile 132 I
Figure 5. Time-series plots (A through N) of hourly water temperature for monitoring sites on the mainstem Colorado River.—Continued
18
6
8
10
12
14
16
18
20
22
WA
TER
TEM
PER
ATU
RE
(o C)
1988
1989
1990
1991
1992
1993
1994
1995
1996
1997
1998
1999
2000
2001
2002
2003
2004
2005
Colorado River near river mile 149 J
6
8
10
12
14
16
18
20
22
WA
TER
TEM
PER
ATU
RE
(o C)
1988
1989
1990
1991
1992
1993
1994
1995
1996
1997
1998
1999
2000
2001
2002
2003
2004
2005
Colorado River near river mile 166 K
6
8
10
12
14
16
18
20
22
YEAR
WA
TER
TEM
PER
ATU
RE
(o C)
1988
1989
1990
1991
1992
1993
1994
1995
1996
1997
1998
1999
2000
2001
2002
2003
2004
2005
Colorado River near river mile 194 L
Figure 5. Time-series plots (A through N) of hourly water temperature for monitoring sites on the mainstem Colorado River.—Continued
19
6
8
10
12
14
16
18
20
22
WA
TER
TEM
PER
ATU
RE
(o C)
1988
1989
1990
1991
1992
1993
1994
1995
1996
1997
1998
1999
2000
2001
2002
2003
2004
2005
Colorado River near river mile 226 M
6
8
10
12
14
16
18
20
22
YEAR
WA
TER
TEM
PER
ATU
RE
(o C)
1988
1989
1990
1991
1992
1993
1994
1995
1996
1997
1998
1999
2000
2001
2002
2003
2004
2005
Colorado River near river mile 246 N
Figure 5. Time-series plots (A through N) of hourly water temperature for monitoring sites on the mainstem Colorado River.—Continued
20
0
5
10
15
20
25
30
35
40
WA
TER
TEM
PER
ATU
RE
(o C)
1988
1989
1990
1991
1992
1993
1994
1995
1996
1997
1998
1999
2000
2001
2002
2003
2004
2005
Paria River A
0
5
10
15
20
25
30
35
40
WA
TER
TEM
PER
ATU
RE(
o C)
1988
1989
1990
1991
1992
1993
1994
1995
1996
1997
1998
1999
2000
2001
2002
2003
2004
2005
Nankoweap Creek B
0
5
10
15
20
25
30
35
40
YEAR
WA
TER
TEM
PER
ATU
RE
(o C)
1988
1989
1990
1991
1992
1993
1994
1995
1996
1997
1998
1999
2000
2001
2002
2003
2004
2005
Little Colorado River C
Figure 6. Time-series plots (A through H) of hourly water temperature for monitoring sites on tributaries of the Colorado River.
21
0
5
10
15
20
25
30
35
40
WA
TER
TEM
PER
ATU
RE
(o C)
1988
1989
1990
1991
1992
1993
1994
1995
1996
1997
1998
1999
2000
2001
2002
2003
2004
2005
Bright Angel CreekD
0
5
10
15
20
25
30
35
40
WA
TER
TEM
PER
ATU
RE
(o C)
1988
1989
1990
1991
1992
1993
1994
1995
1996
1997
1998
1999
2000
2001
2002
2003
2004
2005
Shinumo CreekE
0
5
10
15
20
25
30
35
40
YEAR
WA
TER
TEM
PER
ATU
RE
(o C)
1988
1989
1990
1991
1992
1993
1994
1995
1996
1997
1998
1999
2000
2001
2002
2003
2004
2005
Tapeats Creek F
Figure 6. Time-series plots (A through H) of hourly water temperature for monitoring sites on tributaries of the Colorado River.—Continued

22
0
5
10
15
20
25
30
35
40
WA
TER
TEM
PER
ATU
RE
(o C)
1988
1989
1990
1991
1992
1993
1994
1995
1996
1997
1998
1999
2000
2001
2002
2003
2004
2005
Kanab Creek G
0
5
10
15
20
25
30
35
40
YEAR
WA
TER
TEM
PER
ATU
RE
(o C)
1988
1989
1990
1991
1992
1993
1994
1995
1996
1997
1998
1999
2000
2001
2002
2003
2004
2005
Havasu CreekH
Figure 6. Time-series plots (A through H) of hourly water temperature for monitoring sites on tributaries of the Colorado River.—Continued
23
6
8
10
12
14
16
18
20
22
WA
TER
TEM
PER
ATU
RE
(o C)
CR
BD
CR
LF
CR
030
CR
033
SITE
CR
061
CR
065
CR
076
CR
087
CR
132
CR
149
CR
166
CR
194
CR
226
CR
246
Figure 7. Box and whisker plots for monitoring sites on the mainstem Colorado River. Red lines indicate the median; boxes extend to the upper and lower quartiles; whiskers extend to the maximum and minimum values. See tables 1 and 2 for explanation of site identifiers.
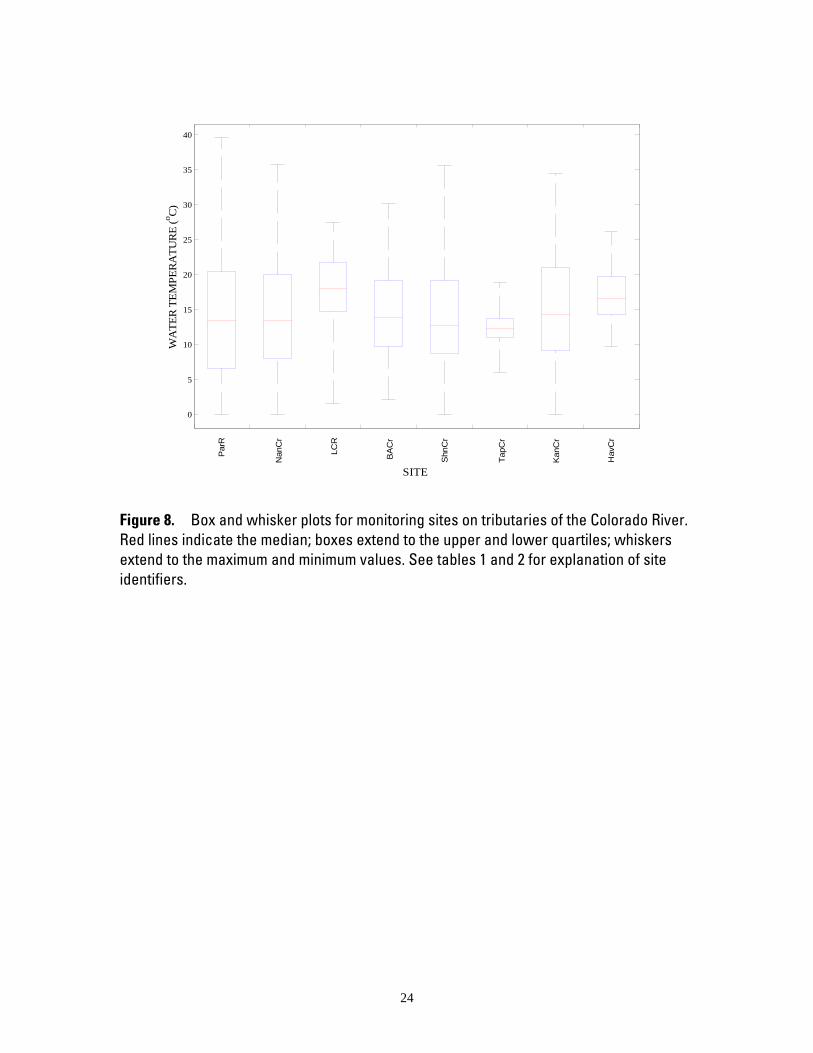
24
0
5
10
15
20
25
30
35
40
WA
TER
TEM
PER
ATU
RE
(o C)
Par
R
SITE
Nan
Cr
LCR
BA
Cr
Shn
Cr
TapC
r
Kan
Cr
Hav
Cr
Figure 8. Box and whisker plots for monitoring sites on tributaries of the Colorado River. Red lines indicate the median; boxes extend to the upper and lower quartiles; whiskers extend to the maximum and minimum values. See tables 1 and 2 for explanation of site identifiers.