Embed Size (px)
Citation preview
HOUSTONFACTS2017
GREATER HOUSTON PARTNERSHIP
AUSTIN | BRAZORIA | CHAMBERS | FORT BEND | GALVESTON | HARRIS | LIBERTY | MONTGOMERY | SAN JACINTO | WALKER | WALLER
DISCOVER THE HOUSTON REGIONThe facts speak for themselves.
HOUSTONFACTSAbout the Greater Houston PartnershipThe mission of the Greater Houston Partnership is to make Houston one of the world’s best places to live, work and build a business. The Partnership works to make Houston greater by promoting economic development, foreign trade and investment, and by advocating for efficient and effective government that supports, rather than impedes, business growth. The Partnership also convenes key stakeholders to solve the region’s most pressing issues.
The Partnership was formed in 1989 in a merger of the Greater Houston Chamber of Commerce, the Houston Economic Development Council and the Houston World Trade Association. Today, the Partnership serves the 11-county greater Houston region and represents a member roster of some 1,000 businesses and institutions. Members of the Partnership account for one-fifth of all jobs in Houston. They engage in various initiatives, committees and task forces to work toward our goal of making Houston greater.
© 2017 Greater Houston Partnership
Data in Houston Facts 2017 are current as of May 2017 unless otherwise noted.
Houston Facts is a registered trademark of the Greater Houston Partnership. Photos courtesy of the Greater Houston Convention and Visitors Bureau.
Houston Facts 2017 was compiled by the research team of the Greater Houston Partnership, including Allegra Ellis, Patrick Jankowski, Roel Gabe Martinez, Josh Pherigo, Jenny Philip, and Nadia Valliani with assistance from our interns, Colton Cox and Gabrielle Myska. This publication was designed by Marc Keosayian and Suzanne Morgan.
TA B L E O F C O N T E N T S
I NTRODUC TION .................................. 2The Houston Region: The Facts Speak for Themselves . . 2
REG ION I N PE RSPEC TIVE ...................... 3Area . . . . . . . . . . . . . . . . . . . . . . . . . . . . . . . . . . . . . . . . . . . . . . . 3People . . . . . . . . . . . . . . . . . . . . . . . . . . . . . . . . . . . . . . . . . . . . . 3Economy . . . . . . . . . . . . . . . . . . . . . . . . . . . . . . . . . . . . . . . . . . . 3
G EOG R APHY ....................................... 4
DEMOG R APH IC S ................................. 5Population . . . . . . . . . . . . . . . . . . . . . . . . . . . . . . . . . . . . . . . . . . 5Income . . . . . . . . . . . . . . . . . . . . . . . . . . . . . . . . . . . . . . . . . . . . . 9Wages . . . . . . . . . . . . . . . . . . . . . . . . . . . . . . . . . . . . . . . . . . . . . 9
HOUSTON ECONOMY ......................... 11Employment . . . . . . . . . . . . . . . . . . . . . . . . . . . . . . . . . . . . . . . .12Corporate Economy . . . . . . . . . . . . . . . . . . . . . . . . . . . . . . . . .13International Business . . . . . . . . . . . . . . . . . . . . . . . . . . . . . . . .13
I N DUSTRI E S ...................................... 15Construction and Real Estate . . . . . . . . . . . . . . . . . . . . . . . . .15Health Care and Social Assistance . . . . . . . . . . . . . . . . . . . .16Manufacturing . . . . . . . . . . . . . . . . . . . . . . . . . . . . . . . . . . . . . .18Professional and Technical Services . . . . . . . . . . . . . . . . . . .19Wholesale and Retail Trade . . . . . . . . . . . . . . . . . . . . . . . . . . 20Energy . . . . . . . . . . . . . . . . . . . . . . . . . . . . . . . . . . . . . . . . . . . . .21NASA and Aerospace . . . . . . . . . . . . . . . . . . . . . . . . . . . . . . . 23Innovation . . . . . . . . . . . . . . . . . . . . . . . . . . . . . . . . . . . . . . . . . 23
GOVE RN M E NT ................................... 25City of Houston . . . . . . . . . . . . . . . . . . . . . . . . . . . . . . . . . . . . 25Counties . . . . . . . . . . . . . . . . . . . . . . . . . . . . . . . . . . . . . . . . . . 25State Government . . . . . . . . . . . . . . . . . . . . . . . . . . . . . . . . . . 26United States Congress . . . . . . . . . . . . . . . . . . . . . . . . . . . . . 26Council of Governments . . . . . . . . . . . . . . . . . . . . . . . . . . . . . 26Taxation . . . . . . . . . . . . . . . . . . . . . . . . . . . . . . . . . . . . . . . . . . . 27Public Safety . . . . . . . . . . . . . . . . . . . . . . . . . . . . . . . . . . . . . . . 27
E DUCATION ...................................... 28Schools . . . . . . . . . . . . . . . . . . . . . . . . . . . . . . . . . . . . . . . . . . . 28Libraries . . . . . . . . . . . . . . . . . . . . . . . . . . . . . . . . . . . . . . . . . . 29Colleges and Universities . . . . . . . . . . . . . . . . . . . . . . . . . . . 29
I N FR A STRUC TU RE ............................. 30Public Utilities . . . . . . . . . . . . . . . . . . . . . . . . . . . . . . . . . . . . . 30Land Transportation . . . . . . . . . . . . . . . . . . . . . . . . . . . . . . . . .31Ports . . . . . . . . . . . . . . . . . . . . . . . . . . . . . . . . . . . . . . . . . . . . . . 32Air Transportation . . . . . . . . . . . . . . . . . . . . . . . . . . . . . . . . . . 34
COM MU N ICATIONS M E DIA ................. 35Broadcast . . . . . . . . . . . . . . . . . . . . . . . . . . . . . . . . . . . . . . . . . 35Digital and Print . . . . . . . . . . . . . . . . . . . . . . . . . . . . . . . . . . . . 35
E NVI RON M E NT .................................. 36Renewable Energy . . . . . . . . . . . . . . . . . . . . . . . . . . . . . . . . . 36Clean Air . . . . . . . . . . . . . . . . . . . . . . . . . . . . . . . . . . . . . . . . . . 36City of Houston’s Green Transportation Initiative . . . . . . . 36
LI FE I N HOUSTON .............................. 37Cost of Living . . . . . . . . . . . . . . . . . . . . . . . . . . . . . . . . . . . . . . 37Weather . . . . . . . . . . . . . . . . . . . . . . . . . . . . . . . . . . . . . . . . . . . 38Lodging . . . . . . . . . . . . . . . . . . . . . . . . . . . . . . . . . . . . . . . . . . . 39Dining . . . . . . . . . . . . . . . . . . . . . . . . . . . . . . . . . . . . . . . . . . . . . 39Arts and Culture . . . . . . . . . . . . . . . . . . . . . . . . . . . . . . . . . . . . 39Religious and Cultural Diversity . . . . . . . . . . . . . . . . . . . . . . 42Convention and Sports Facilities . . . . . . . . . . . . . . . . . . . . . 44Major Events and Conventions . . . . . . . . . . . . . . . . . . . . . . . 45Golf . . . . . . . . . . . . . . . . . . . . . . . . . . . . . . . . . . . . . . . . . . . . . . . 45Racing . . . . . . . . . . . . . . . . . . . . . . . . . . . . . . . . . . . . . . . . . . . . 45Biking and Hiking . . . . . . . . . . . . . . . . . . . . . . . . . . . . . . . . . . . 45Parks . . . . . . . . . . . . . . . . . . . . . . . . . . . . . . . . . . . . . . . . . . . . . 45Forests . . . . . . . . . . . . . . . . . . . . . . . . . . . . . . . . . . . . . . . . . . . . 47Wildlife Refuges . . . . . . . . . . . . . . . . . . . . . . . . . . . . . . . . . . . . 47Houston Zoo . . . . . . . . . . . . . . . . . . . . . . . . . . . . . . . . . . . . . . . 47
H ISTORY .......................................... 4 8
T H E H O U S T O N R E G I O N : T H E FA C T S S P E A K F O R T H E M S E LV E S
I N T R O D U C T I O N
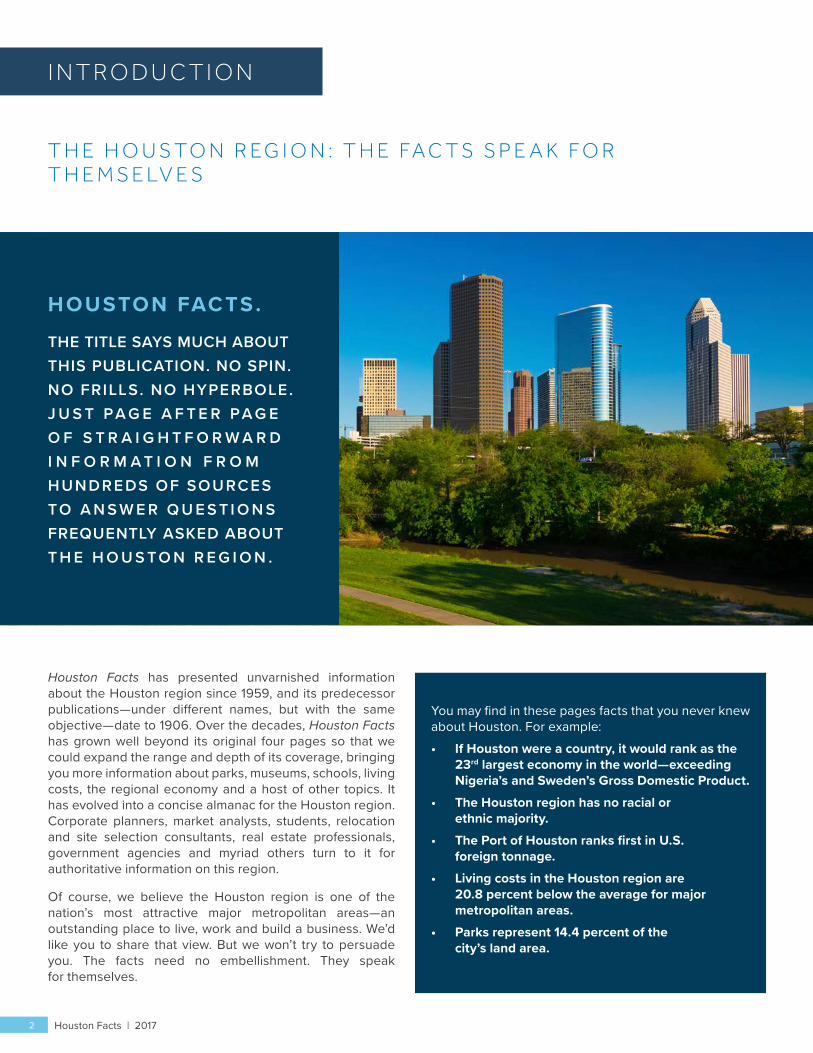
Houston Facts has presented unvarnished information about the Houston region since 1959, and its predecessor publications—under different names, but with the same objective—date to 1906. Over the decades, Houston Facts has grown well beyond its original four pages so that we could expand the range and depth of its coverage, bringing you more information about parks, museums, schools, living costs, the regional economy and a host of other topics. It has evolved into a concise almanac for the Houston region. Corporate planners, market analysts, students, relocation and site selection consultants, real estate professionals, government agencies and myriad others turn to it for authoritative information on this region.
Of course, we believe the Houston region is one of the nation’s most attractive major metropolitan areas—an outstanding place to live, work and build a business. We’d like you to share that view. But we won’t try to persuade you. The facts need no embellishment. They speak for themselves.
HOUSTON FACTS.
THE TITLE SAYS MUCH ABOUT THIS PUBLICATION. NO SPIN. NO FRILLS. NO HYPERBOLE. J U S T PA G E A F T E R PA G E O F S T R A I G H T F O R W A R D I N F O R M A T I O N F R O M HUN DRE DS OF SOURCES TO A N S W E R Q U E S T I O N S FREQUENTLY ASKED ABOUT T H E H O U S T O N R E G I O N .
You may find in these pages facts that you never knew about Houston. For example:• If Houston were a country, it would rank as the
23rd largest economy in the world—exceeding Nigeria’s and Sweden’s Gross Domestic Product.
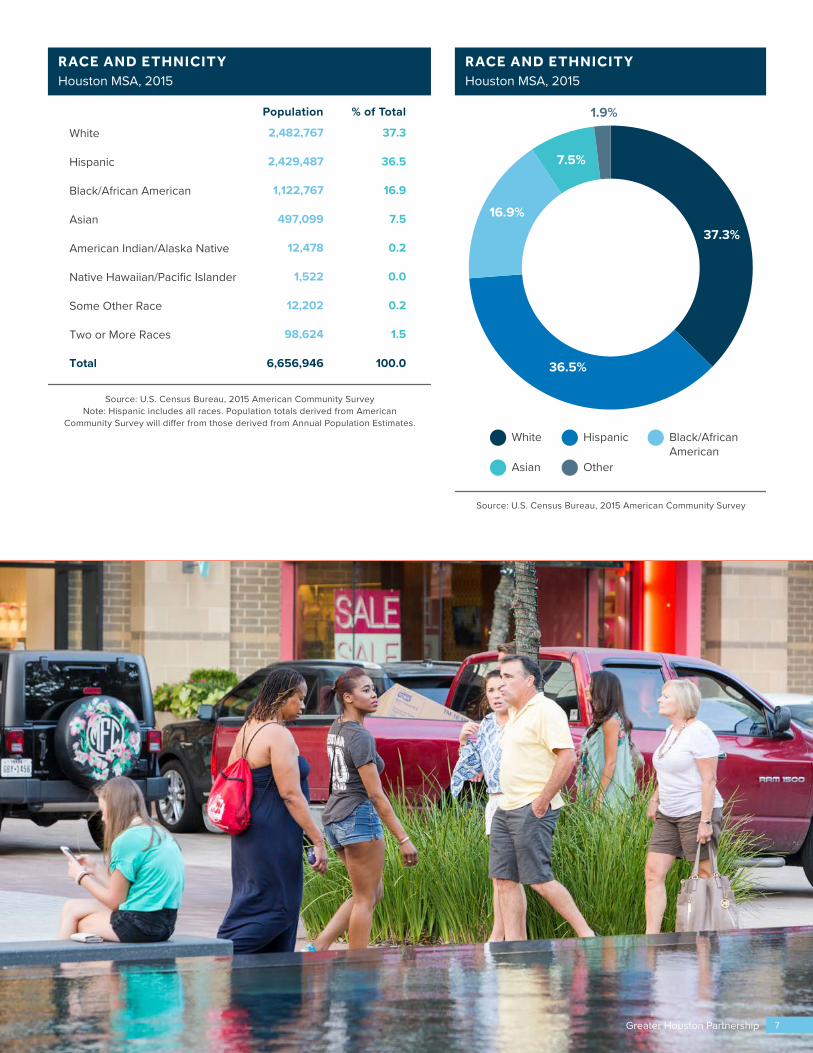
• The Houston region has no racial or ethnic majority.
• The Port of Houston ranks first in U.S. foreign tonnage.
• Living costs in the Houston region are 20.8 percent below the average for major metropolitan areas.
• Parks represent 14.4 percent of the city’s land area.
Houston Facts | 20172
R EG I O N I N P E R S P EC T I V E
A R E A
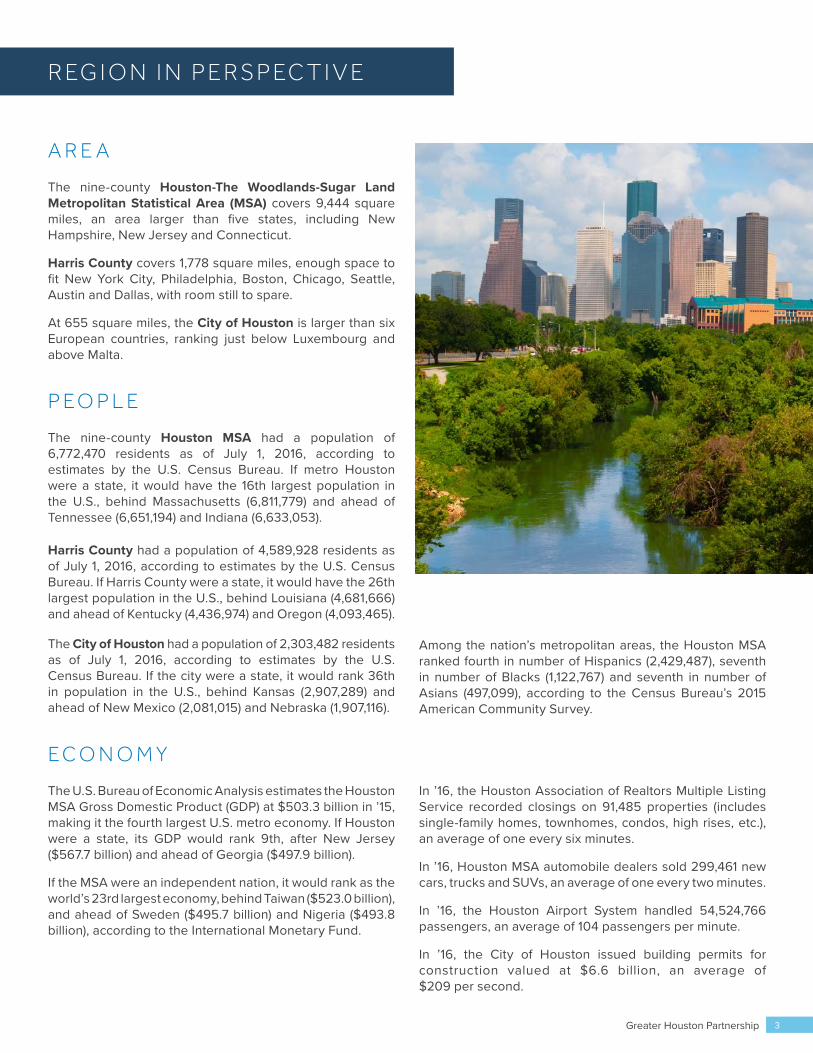
The nine-county Houston-The Woodlands-Sugar Land Metropolitan Statistical Area (MSA) covers 9,444 square miles, an area larger than five states, including New Hampshire, New Jersey and Connecticut.
Harris County covers 1,778 square miles, enough space to fit New York City, Philadelphia, Boston, Chicago, Seattle, Austin and Dallas, with room still to spare.
At 655 square miles, the City of Houston is larger than six European countries, ranking just below Luxembourg and above Malta.
P E O P L E
The nine-county Houston MSA had a population of 6,772,470 residents as of July 1, 2016, according to estimates by the U.S. Census Bureau. If metro Houston were a state, it would have the 16th largest population in the U.S., behind Massachusetts (6,811,779) and ahead of Tennessee (6,651,194) and Indiana (6,633,053).
Harris County had a population of 4,589,928 residents as of July 1, 2016, according to estimates by the U.S. Census Bureau. If Harris County were a state, it would have the 26th largest population in the U.S., behind Louisiana (4,681,666) and ahead of Kentucky (4,436,974) and Oregon (4,093,465).
The City of Houston had a population of 2,303,482 residents as of July 1, 2016, according to estimates by the U.S. Census Bureau. If the city were a state, it would rank 36th in population in the U.S., behind Kansas (2,907,289) and ahead of New Mexico (2,081,015) and Nebraska (1,907,116).
Among the nation’s metropolitan areas, the Houston MSA ranked fourth in number of Hispanics (2,429,487), seventh in number of Blacks (1,122,767) and seventh in number of Asians (497,099), according to the Census Bureau’s 2015 American Community Survey.
E C O N O M Y
The U.S. Bureau of Economic Analysis estimates the Houston MSA Gross Domestic Product (GDP) at $503.3 billion in ’15, making it the fourth largest U.S. metro economy. If Houston were a state, its GDP would rank 9th, after New Jersey ($567.7 billion) and ahead of Georgia ($497.9 billion).
If the MSA were an independent nation, it would rank as the world’s 23rd largest economy, behind Taiwan ($523.0 billion), and ahead of Sweden ($495.7 billion) and Nigeria ($493.8 billion), according to the International Monetary Fund.
In ’16, the Houston Association of Realtors Multiple Listing Service recorded closings on 91,485 properties (includes single-family homes, townhomes, condos, high rises, etc.), an average of one every six minutes.
In ’16, Houston MSA automobile dealers sold 299,461 new cars, trucks and SUVs, an average of one every two minutes.
In ’16, the Houston Airport System handled 54,524,766 passengers, an average of 104 passengers per minute.
In ’16, the City of Houston issued building permits for construction valued at $6.6 billion, an average of $209 per second.
Greater Houston Partnership 3
G EO G R A P H Y
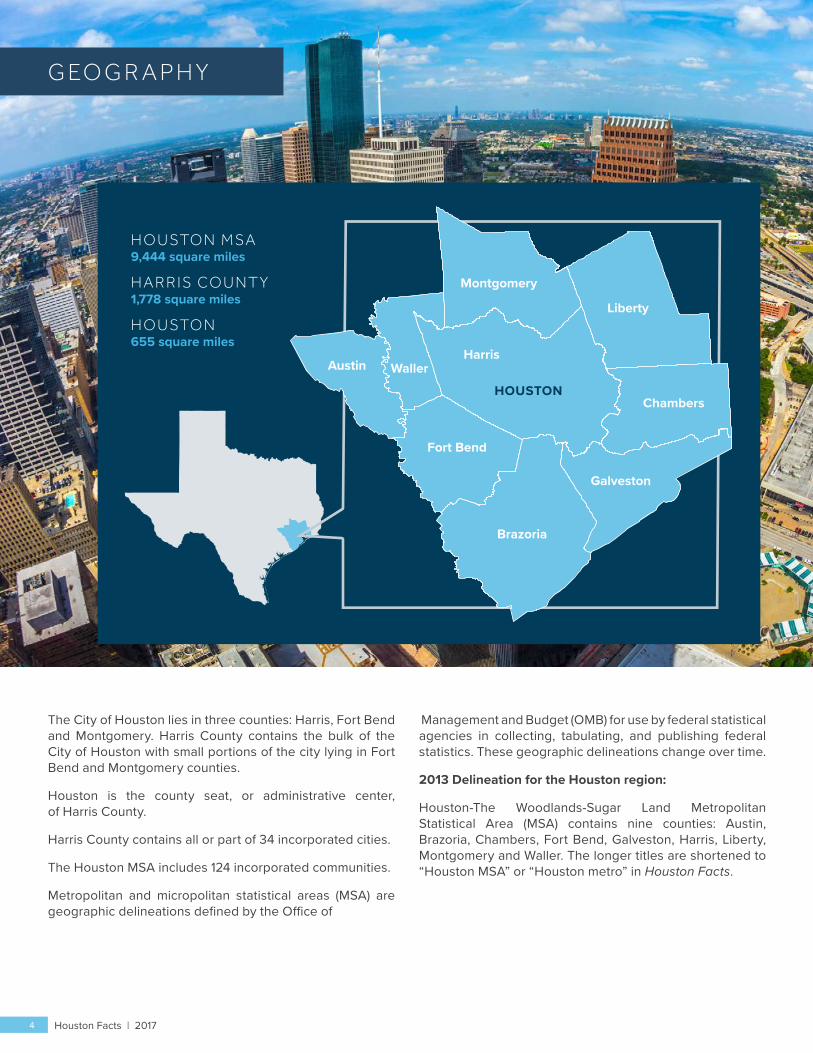
The City of Houston lies in three counties: Harris, Fort Bend and Montgomery. Harris County contains the bulk of the City of Houston with small portions of the city lying in Fort Bend and Montgomery counties.
Houston is the county seat, or administrative center, of Harris County.
Harris County contains all or part of 34 incorporated cities.
The Houston MSA includes 124 incorporated communities.
Metropolitan and micropolitan statistical areas (MSA) are geographic delineations defined by the Office of
Management and Budget (OMB) for use by federal statistical agencies in collecting, tabulating, and publishing federal statistics. These geographic delineations change over time.
2013 Delineation for the Houston region:
Houston-The Woodlands-Sugar Land Metropolitan Statistical Area (MSA) contains nine counties: Austin, Brazoria, Chambers, Fort Bend, Galveston, Harris, Liberty, Montgomery and Waller. The longer titles are shortened to “Houston MSA” or “Houston metro” in Houston Facts.
Liberty
Chambers
Galveston
Brazoria
Fort Bend
Harris
HOUSTON
Austin
Montgomery
Waller
H O U STO N M SA9,444 square miles
H A R R I S CO U N T Y1,778 square miles
H O U STO N655 square miles
Houston Facts | 20174
D E M O G R A P H I C S
P O P U L AT I O N
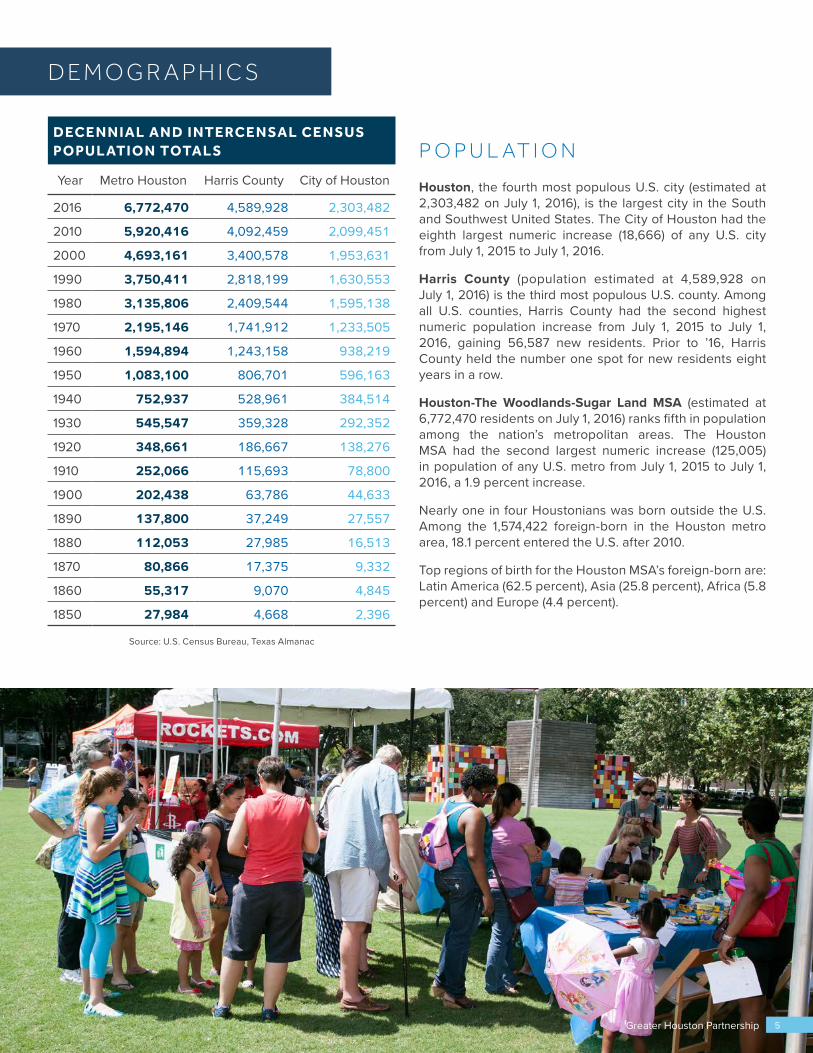
Houston, the fourth most populous U.S. city (estimated at 2,303,482 on July 1, 2016), is the largest city in the South and Southwest United States. The City of Houston had the eighth largest numeric increase (18,666) of any U.S. city from July 1, 2015 to July 1, 2016.
Harris County (population estimated at 4,589,928 on July 1, 2016) is the third most populous U.S. county. Among all U.S. counties, Harris County had the second highest numeric population increase from July 1, 2015 to July 1, 2016, gaining 56,587 new residents. Prior to ’16, Harris County held the number one spot for new residents eight years in a row.
Houston-The Woodlands-Sugar Land MSA (estimated at 6,772,470 residents on July 1, 2016) ranks fifth in population among the nation’s metropolitan areas. The Houston MSA had the second largest numeric increase (125,005) in population of any U.S. metro from July 1, 2015 to July 1, 2016, a 1.9 percent increase.
Nearly one in four Houstonians was born outside the U.S. Among the 1,574,422 foreign-born in the Houston metro area, 18.1 percent entered the U.S. after 2010.
Top regions of birth for the Houston MSA’s foreign-born are: Latin America (62.5 percent), Asia (25.8 percent), Africa (5.8 percent) and Europe (4.4 percent).
DECE N N IAL AN D I NTE RCE N SAL CE N SUS POPU L ATI ON TOTAL S
Year Metro Houston Harris County City of Houston
2016 6,772,470 4,589,928 2,303,482
2010 5,920,416 4,092,459 2,099,451
2000 4,693,161 3,400,578 1,953,631
1990 3,750,411 2,818,199 1,630,553
1980 3,135,806 2,409,544 1,595,138
1970 2,195,146 1,741,912 1,233,505
1960 1,594,894 1,243,158 938,219
1950 1,083,100 806,701 596,163
1940 752,937 528,961 384,514
1930 545,547 359,328 292,352
1920 348,661 186,667 138,276
1910 252,066 115,693 78,800
1900 202,438 63,786 44,633
1890 137,800 37,249 27,557
1880 112,053 27,985 16,513
1870 80,866 17,375 9,332
1860 55,317 9,070 4,845
1850 27,984 4,668 2,396
Source: U.S. Census Bureau, Texas Almanac
5Greater Houston Partnership
POPU L ATI ON , AG E , H OUSE H OLDS, FORE I G N BORNBy Houston MSA and County, 2015
Geography 2016Population
Median Age
(In Years)
Total Households
Average Persons Per Household
Foreign Born Estimate
Percent Of Total Population
Foreign Born
Houston MSA 6,772,470 34.1 2,292,992 2.87 1,574,422 23.2
Austin County 29,758 40.6 11,308 2.59 2,646 8.9
Brazoria County 354,195 35.5 112,510 2.85 43,434 12.3
Chambers County 39,899 36.2 13,018 2.84 3,859 9.7
Fort Bend County 741,237 35.5 206,188 3.17 175,535 23.7
Galveston County 329,431 37.5 113,866 2.66 30,097 9.1
Harris County 4,589,928 32.8 1,499,528 2.88 1,106,763 24.1
Liberty County 81,704 36.4 25,319 2.82 5,678 6.9
Montgomery County 556,203 36.4 173,238 2.88 64,131 11.5
Waller County 50,115 29.1 13,937 2.94 6,412 12.8
Source: U.S. Census Bureau, 2016 Population Estimates, 2015 American Community Survey
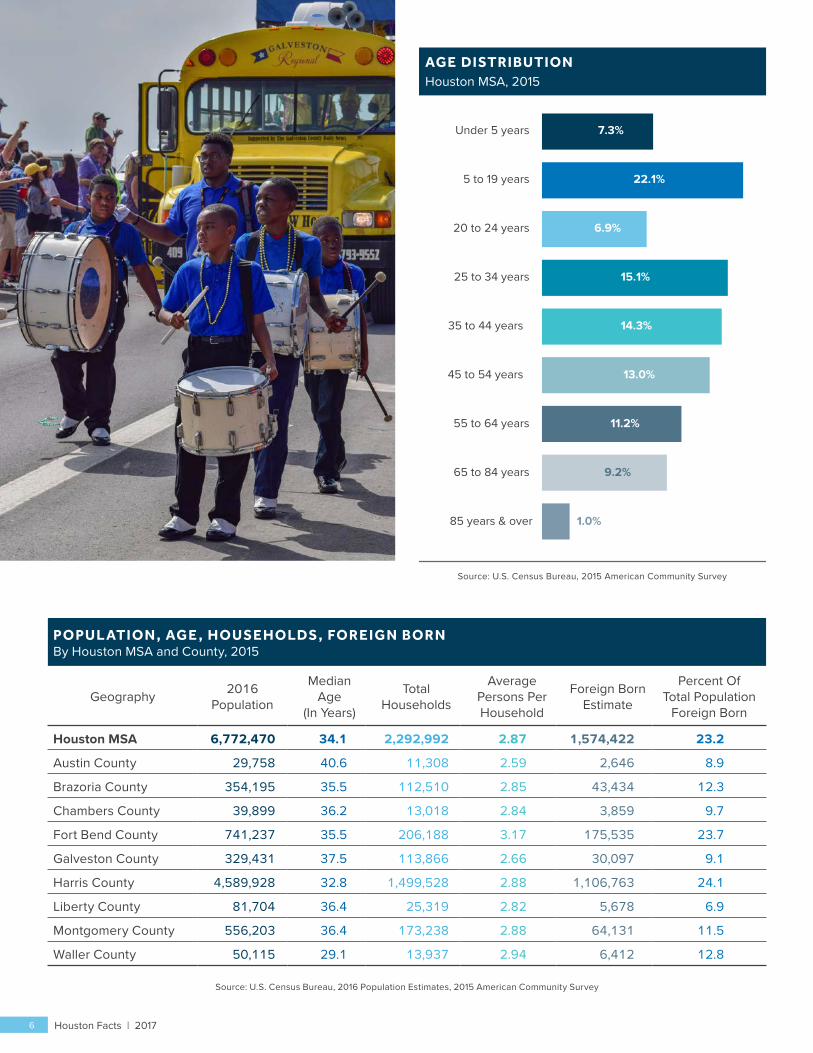
AGE DISTRIBUTIONHouston MSA, 2015
Source: U.S. Census Bureau, 2015 American Community Survey
Under 5 years 7.3%
25 to 34 years
55 to 64 years
5 to 19 years
35 to 44 years
65 to 84 years
20 to 24 years
45 to 54 years
85 years & over 1.0%
22.1%
6.9%
15.1%
14.3%
13.0%
11.2%
9.2%
Houston Facts | 20176
Source: U.S. Census Bureau, 2015 American Community SurveyNote: Hispanic includes all races. Population totals derived from American
Community Survey will di�er from those derived from Annual Population Estimates.
RACE AND ETHNICITYHouston MSA, 2015
White
Hispanic
Black/African American
Asian
American Indian/Alaska Native
Native Hawaiian/Pacific Islander
Some Other Race
Two or More Races
Total
2,482,767
2,429,487
1,122,767
497,099
12,478
1,522
12,202
98,624
6,656,946
Population
37.3
36.5
16.9
7.5
0.2
0.0
0.2
1.5
100.0
% of Total
Source: U.S. Census Bureau, 2015 American Community Survey
RACE AND ETHNICITYHouston MSA, 2015
Asian
White Hispanic
Other
Black/AfricanAmerican
16.9%
7.5%
37.3%
36.5%
1.9%
7Greater Houston Partnership
COM PON E NTS OF POPU L ATI ON CHAN G EBy Houston MSA and County, 2016
Geography Population July 1, 2016
Net Domestic Migration
Net International Migration Births Deaths
Total Population
Change(’10-’16)
Houston MSA 6,772,470 283,239 193,618 599,542 226,559 851,971
Austin County 29,758 701 206 2,153 1,675 1,347
Brazoria County 354,195 21,414 2,915 29,538 13,403 41,068
Chambers County 39,899 3,303 100 2,982 1,629 4,800
Fort Bend County 741,237 92,739 23,750 54,353 17,019 156,534
Galveston County 329,431 23,720 3,784 25,163 15,382 38,128
Harris County 4,589,928 65,282 153,824 432,780 150,560 496,686
Liberty County 81,704 3,602 299 6,689 4,628 6,063
Montgomery County 556,203 67,824 8,641 42,104 20,484 100,453
Waller County 50,115 4,654 99 3,780 1,779 6,892Source: U.S. Census Bureau, 2016 Population Estimates
Note: In some cases, the natural increase and the increase due to in-migration won’t sum to the change in population due to rounding errors and the Bureau’s use of residual values in generating the estimates.
E DUC ATI ONAL AT TAI N M E NTHouston MSA, 2015
Highest Education Level Attained
Percent of Population age 25 or older
Graduate or Professional Degree 11.4
Bachelor’s Degree 20.1
Bachelor’s Degree or Higher 31.5
Associate Degree 6.6
Some College, No Degree 20.8
High School Diploma or GED 23.4
High School Graduate or higher 82.3
9th to 12th grade, no diploma 8.1
Less than 9th grade 9.6
Total Population over age 25 4,241,381
Source: U.S. Census Bureau, 2015 American Community Survey
8 Houston Facts | 2017
TOTAL WAG E SHouston MSA, 2016, ($, Millions)
Houston MSA 184,176.4
Austin County 445.5
Brazoria County 5,722.5
Chambers County 812.3
Fort Bend County 8,625.2
Galveston County 5,055.1
Harris County 153,336.2
Liberty County 666.1
Montgomery County 8,827.5
Waller County 686.0
Source: Texas Workforce Commission, Quarterly Census of Employment and Wages
I N C O M E
Per Capita Personal Income
The nine-county Houston MSA pretax per capita personal income (PCPI) in ’15 was $54,346, 13.0 percent above the U.S. average of $48,103, according to the latest data available by the U.S. Bureau of Economic Analysis. PCPI increased 1.3 percent in the Houston MSA and 3.7 percent nationwide from ’14 to ’15.
Total Personal Income
Total personal income in the nine-county Houston MSA in ’15 was $361.8 billion, up 3.8 percent from ’14.
W A G E S
The average weekly wage in the Houston MSA in ’16 was $1,231. Total wages for the metro area were $184.2 billion.
Source: U.S. Census Bureau, 2015 American Community Survey
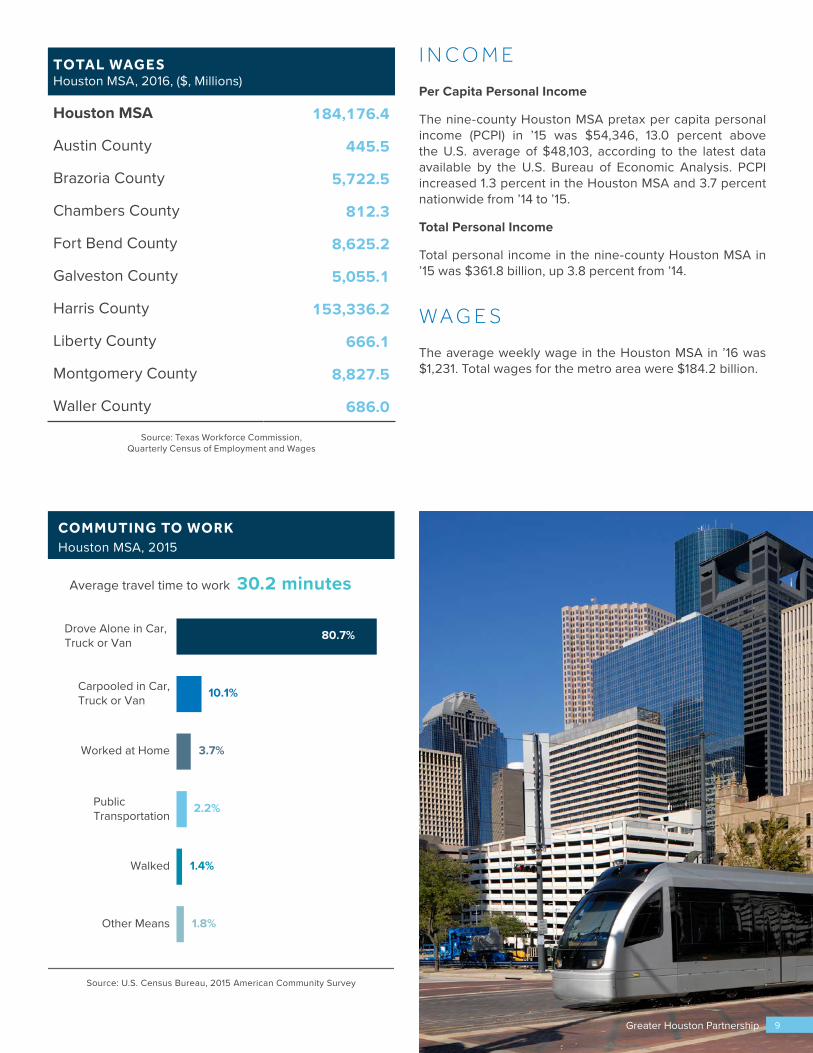
Average travel time to work 30.2 minutes
COMMUTING TO WORKHouston MSA, 2015
Drove Alone in Car, Truck or Van 80.7%
Carpooled in Car,Truck or Van 10.1%
Worked at Home 3.7%
PublicTransportation 2.2%
Walked 1.4%
Other Means 1.8%
9Greater Houston Partnership
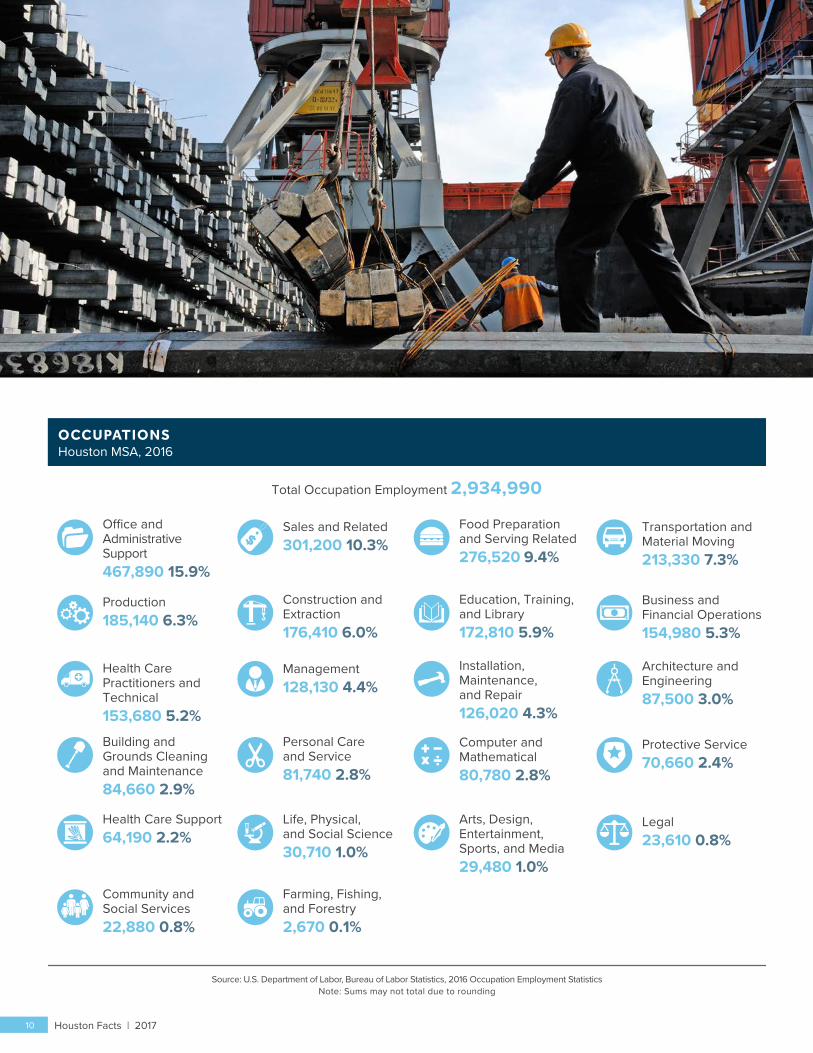
OCCUPATIONSHouston MSA, 2016
Source: U.S. Department of Labor, Bureau of Labor Statistics, 2016 Occupation Employment StatisticsNote: Sums may not total due to rounding
Total Occupation Employment 2,934,990
Installation,Maintenance,and Repair126,020 4.3%
Transportation and Material Moving213,330 7.3%
Production185,140 6.3%
Business and Financial Operations154,980 5.3%
Architecture and Engineering87,500 3.0%
Management 128,130 4.4%
Computer andMathematical80,780 2.8%
Life, Physical,and Social Science30,710 1.0%
Education, Training,and Library172,810 5.9%
Community andSocial Services22,880 0.8%
Legal23,610 0.8%
Health Care Support64,190 2.2%
Health Care Practitioners andTechnical153,680 5.2%
Arts, Design,Entertainment,Sports, and Media29,480 1.0%
Food Preparation and Serving Related276,520 9.4%
Personal Care and Service81,740 2.8%
Protective Service70,660 2.4%
Building and Grounds Cleaningand Maintenance84,660 2.9%
Construction and Extraction176,410 6.0%
O�ce and AdministrativeSupport 467,890 15.9%
Sales and Related 301,200 10.3%
Farming, Fishing, and Forestry2,670 0.1%
Houston Facts | 201710
H O U S TO N EC O N O M Y
The price of West Texas Intermediate (WTI) fell from $108 per barrel in June ’14 to $26 in February ’16. The number of active U.S. rigs followed the same precipitous drop, falling from a high of 1,931 rigs in September ’14 to a historic low of 404 in May ’16. Job losses in energy followed. From December ’14 to December ’16, Houston’s upstream energy sector shed 81,100 jobs, equivalent to one in every four jobs in the sector. Two-thirds of those losses occurred in ’15, the remainder in ’16.
The energy industry is now settling in to a slow recovery. By the end of the first quarter of ’17, the North American rig count had more than doubled from its trough to 824 rigs. However, oilfield service companies do not expect a full recovery in the rig count and their margins remain under pressure. Oil prices have somewhat stabilized, fluctuating between $47 and $54 per barrel in Q1/17, but the expectation is for prices to remain flat. The U.S. Energy Information Administration is forecasting WTI to average $51 in ’17 and $55 in ’18. Guarded optimism is the industry’s disposition at this point in the recovery.
As the energy capital of the world, Houston was brought along on this roller coaster ride. The metro area created 118,200 jobs in ’14, then job growth fell to 200 in ’15 and rebounded to 18,700 in ’16. Despite the tumult that occurred in energy, Houston still managed to eke out job growth primarily in industries dependent on population growth (e.g., public education, health care, leisure and hospitality). Job
losses occurred primarily in sectors that include Houston’s economic base (e.g., oil and gas, manufacturing). Houston’s GDP slipped from $522.0 billion in ’14 to $503.3 billion in ’15.
Houston’s office real estate market is feeling the stress from the slowing economy. During the most recent construction boom, the office market added approximately 22.4 million square feet of space from ’10-’16. As of Q1/17, an estimated 11 million square feet of sublease space pushed the effective vacancy rate above 20 percent. Asking rents peaked at $28.87 per square foot in Q1/16 and declined for four consecutive quarters. However, effective rents are roughly 20 to 25 percent below asking rents, suggesting office rents have declined nearly 30 percent from their peaks.
Despite these challenges, there are bright spots. As of April ’17, the Houston Purchasing Managers Index has stayed above 50 for five consecutive months, signaling economic expansion. The housing market has remained resilient with the 12-month running total of property sales never falling below 89,000 units from ’14 to ’16. In the 12-months ending April ’17, Houston-area realtors closed on 93,140 properties, a new record for the region. Prices also posted historic highs: the 12-month average of the median sales price of single-family homes reached $224,000. Supply remains tight with inventory remaining below a four-month supply throughout the downturn.
11Greater Houston Partnership
Source: Texas Workforce Commission, Employment Estimates
PAYROLL EMPLOYMENTMetro Houston
’17’16’15’14’13’12’11’10’09’08’07
2.4
2.6
2.5
2.9
2.8
2.7
3.0
3.1
-150
-100
50
0
-50
100
150
Non
farm
Pay
roll
Empl
oym
ent (
Mill
ions
) 12-M
onth Change (Thousands)
Employment 12-Month Change
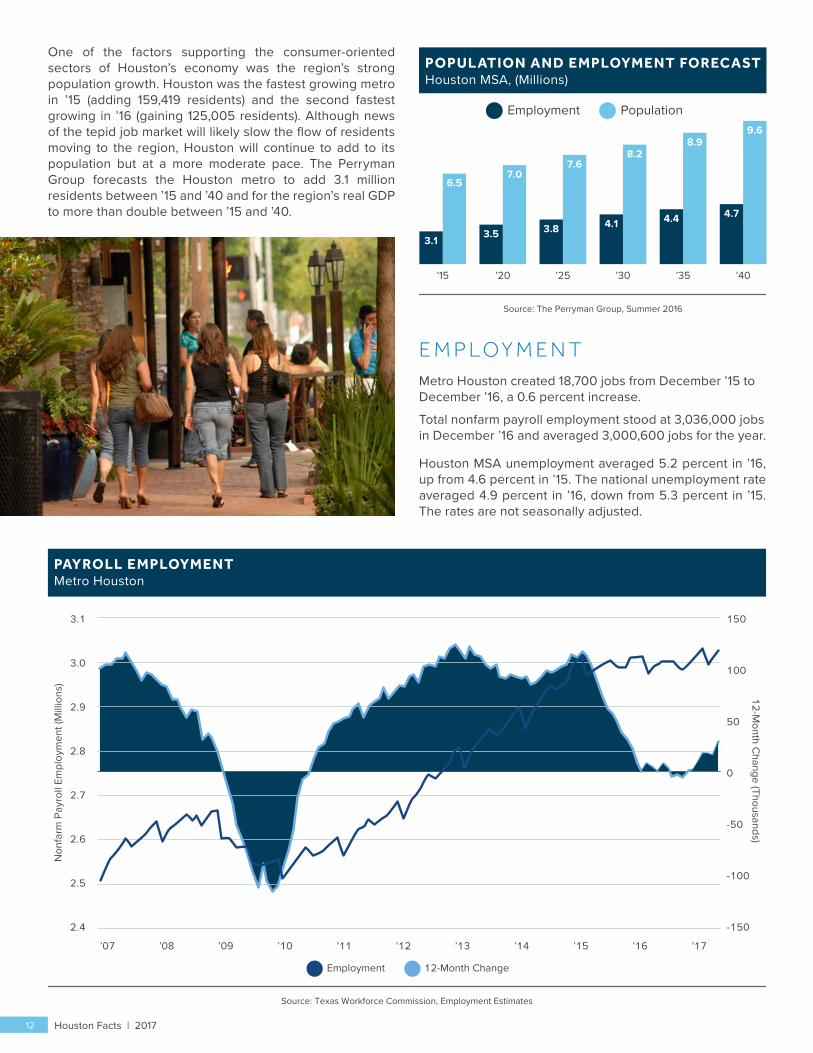
One of the factors supporting the consumer-oriented sectors of Houston’s economy was the region’s strong population growth. Houston was the fastest growing metro in ’15 (adding 159,419 residents) and the second fastest growing in ’16 (gaining 125,005 residents). Although news of the tepid job market will likely slow the flow of residents moving to the region, Houston will continue to add to its population but at a more moderate pace. The Perryman Group forecasts the Houston metro to add 3.1 million residents between ’15 and ’40 and for the region’s real GDP to more than double between ’15 and ’40.
E M P L O Y M E N TMetro Houston created 18,700 jobs from December ’15 to December ’16, a 0.6 percent increase.
Total nonfarm payroll employment stood at 3,036,000 jobs in December ’16 and averaged 3,000,600 jobs for the year.
Houston MSA unemployment averaged 5.2 percent in ’16, up from 4.6 percent in ’15. The national unemployment rate averaged 4.9 percent in ’16, down from 5.3 percent in ’15. The rates are not seasonally adjusted.
Source: The Perryman Group, Summer 2016
POPUL ATION AND EMPLOYMENT FORECASTHouston MSA, (Millions)
3.1
6.5
’15
3.5
7.0
’20
3.8
7.6
’25
4.1
8.2
’30
4.4
8.9
’35
4.7
9.6
’40
Employment Population
12 Houston Facts | 2017Houston Facts | 2017
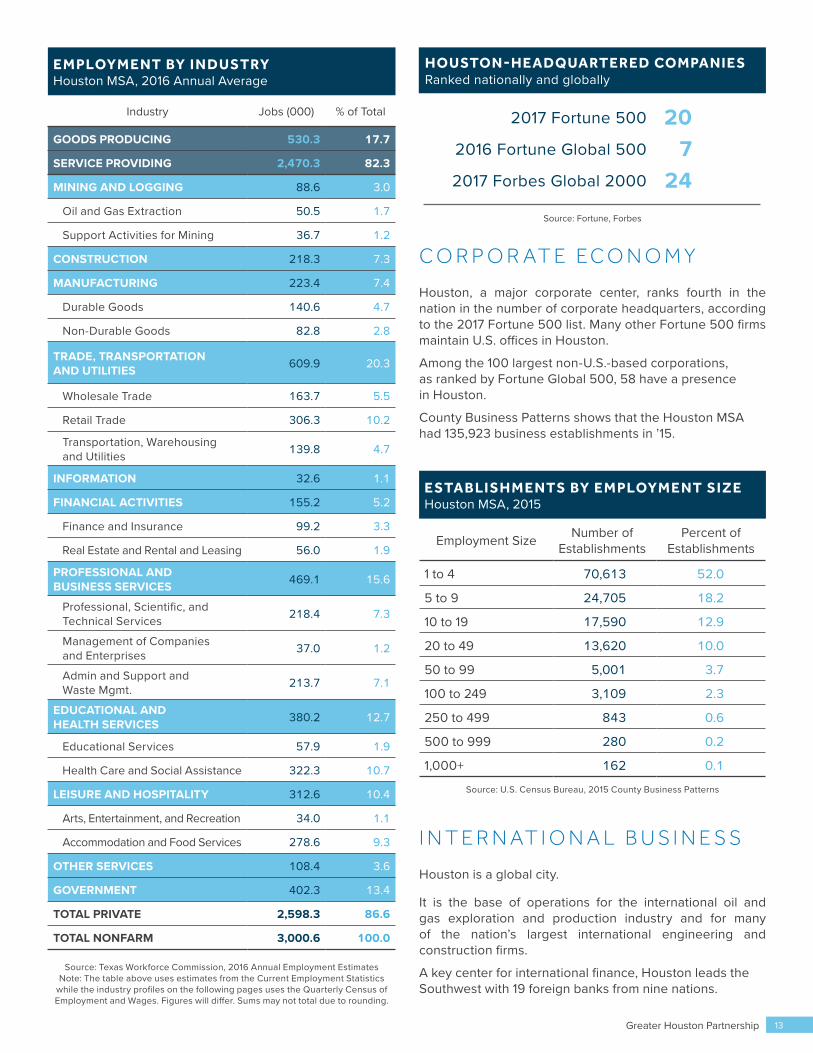
C O R P O R AT E E C O N O M Y
Houston, a major corporate center, ranks fourth in the nation in the number of corporate headquarters, according to the 2017 Fortune 500 list. Many other Fortune 500 firms maintain U.S. offices in Houston.
Among the 100 largest non-U.S.-based corporations, as ranked by Fortune Global 500, 58 have a presence in Houston.
County Business Patterns shows that the Houston MSA had 135,923 business establishments in ’15.
I N T E R N AT I O N A L B U S I N E S S
Houston is a global city.
It is the base of operations for the international oil and gas exploration and production industry and for many of the nation’s largest international engineering and construction firms.
A key center for international finance, Houston leads the Southwest with 19 foreign banks from nine nations.
202017 Fortune 500
72016 Fortune Global 500
242017 Forbes Global 2000
HOUSTON-HEADQUARTERED COMPANIESRanked nationally and globally
Source: Fortune, Forbes
E M PLOYM E NT BY I N DUSTRYHouston MSA, 2016 Annual Average
Industry Jobs (000) % of Total
GOODS PRODUCING 530.3 17.7
SERVICE PROVIDING 2,470.3 82.3
MINING AND LOGGING 88.6 3.0
Oil and Gas Extraction 50.5 1.7
Support Activities for Mining 36.7 1.2
CONSTRUCTION 218.3 7.3
MANUFACTURING 223.4 7.4
Durable Goods 140.6 4.7
Non-Durable Goods 82.8 2.8
TRADE, TRANSPORTATION AND UTILITIES 609.9 20.3
Wholesale Trade 163.7 5.5
Retail Trade 306.3 10.2
Transportation, Warehousing and Utilities 139.8 4.7
INFORMATION 32.6 1.1
FINANCIAL ACTIVITIES 155.2 5.2
Finance and Insurance 99.2 3.3
Real Estate and Rental and Leasing 56.0 1.9
PROFESSIONAL AND BUSINESS SERVICES 469.1 15.6
Professional, Scientific, and Technical Services 218.4 7.3
Management of Companies and Enterprises 37.0 1.2
Admin and Support and Waste Mgmt. 213.7 7.1
EDUCATIONAL AND HEALTH SERVICES 380.2 12.7
Educational Services 57.9 1.9
Health Care and Social Assistance 322.3 10.7
LEISURE AND HOSPITALITY 312.6 10.4
Arts, Entertainment, and Recreation 34.0 1.1
Accommodation and Food Services 278.6 9.3
OTHER SERVICES 108.4 3.6
GOVERNMENT 402.3 13.4
TOTAL PRIVATE 2,598.3 86.6
TOTAL NONFARM 3,000.6 100.0
Source: Texas Workforce Commission, 2016 Annual Employment EstimatesNote: The table above uses estimates from the Current Employment Statistics
while the industry profiles on the following pages uses the Quarterly Census of Employment and Wages. Figures will differ. Sums may not total due to rounding.
E STAB LI SH M E NTS BY E M PLOYM E NT SI Z EHouston MSA, 2015
Employment Size Number of Establishments
Percent of Establishments
1 to 4 70,613 52.0
5 to 9 24,705 18.2
10 to 19 17,590 12.9
20 to 49 13,620 10.0
50 to 99 5,001 3.7
100 to 249 3,109 2.3
250 to 499 843 0.6
500 to 999 280 0.2
1,000+ 162 0.1
Source: U.S. Census Bureau, 2015 County Business Patterns
Greater Houston Partnership 13
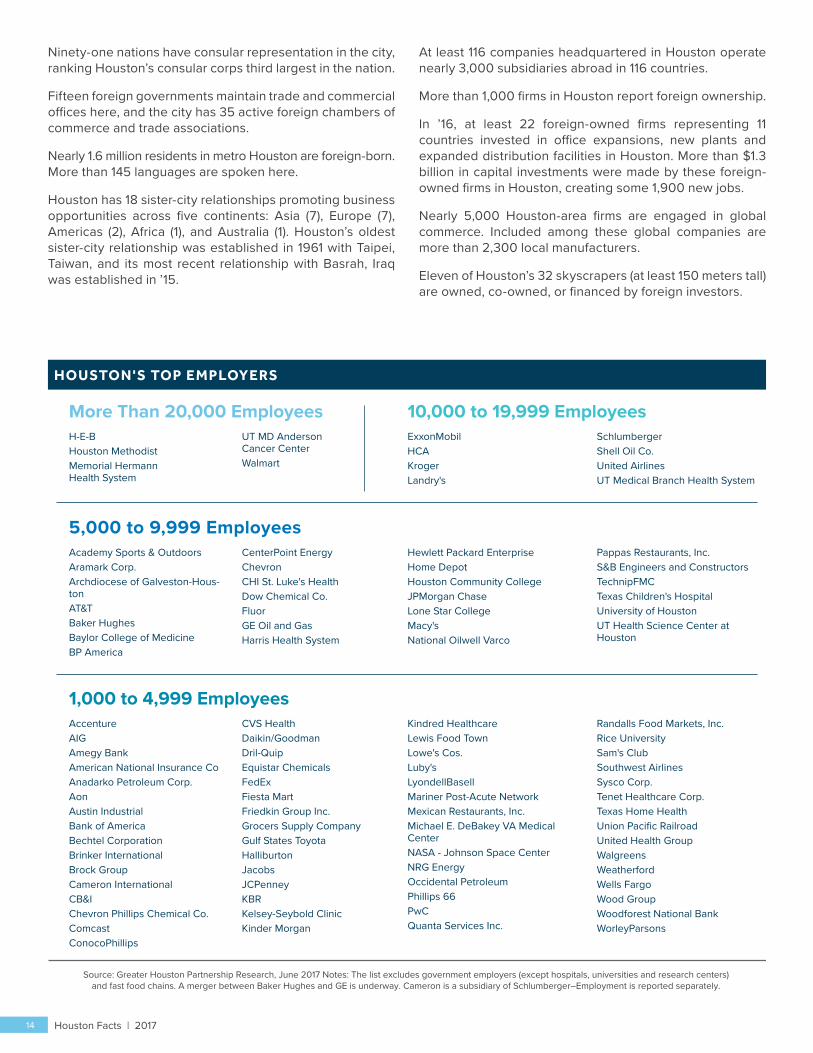
Source: Greater Houston Partnership Research, June 2017 Notes: The list excludes government employers (except hospitals, universities and research centers) and fast food chains. A merger between Baker Hughes and GE is underway. Cameron is a subsidiary of Schlumberger–Employment is reported separately.
HOUSTON'S TOP EMPLOYERS
10,000 to 19,999 EmployeesExxonMobilHCAKrogerLandry's
SchlumbergerShell Oil Co.United AirlinesUT Medical Branch Health System
More Than 20,000 EmployeesH-E-BHouston MethodistMemorial Hermann Health System
UT MD Anderson Cancer CenterWalmart
5,000 to 9,999 EmployeesAcademy Sports & OutdoorsAramark Corp.Archdiocese of Galveston-Hous-tonAT&TBaker HughesBaylor College of MedicineBP America
CenterPoint EnergyChevronCHI St. Luke's Health Dow Chemical Co.FluorGE Oil and GasHarris Health System
Hewlett Packard EnterpriseHome DepotHouston Community CollegeJPMorgan ChaseLone Star CollegeMacy'sNational Oilwell Varco
Pappas Restaurants, Inc.S&B Engineers and ConstructorsTechnipFMCTexas Children's HospitalUniversity of HoustonUT Health Science Center at Houston
1,000 to 4,999 EmployeesAccentureAIGAmegy BankAmerican National Insurance CoAnadarko Petroleum Corp.AonAustin IndustrialBank of AmericaBechtel CorporationBrinker InternationalBrock GroupCameron InternationalCB&IChevron Phillips Chemical Co.ComcastConocoPhillips
CVS HealthDaikin/GoodmanDril-QuipEquistar ChemicalsFedExFiesta MartFriedkin Group Inc.Grocers Supply CompanyGulf States ToyotaHalliburtonJacobsJCPenneyKBRKelsey-Seybold ClinicKinder Morgan
Kindred HealthcareLewis Food TownLowe's Cos.Luby'sLyondellBasellMariner Post-Acute NetworkMexican Restaurants, Inc.Michael E. DeBakey VA Medical CenterNASA - Johnson Space CenterNRG EnergyOccidental PetroleumPhillips 66PwCQuanta Services Inc.
Randalls Food Markets, Inc.Rice UniversitySam's ClubSouthwest AirlinesSysco Corp.Tenet Healthcare Corp.Texas Home HealthUnion Pacific RailroadUnited Health GroupWalgreensWeatherfordWells FargoWood GroupWoodforest National BankWorleyParsons
Ninety-one nations have consular representation in the city, ranking Houston’s consular corps third largest in the nation.
Fifteen foreign governments maintain trade and commercial offices here, and the city has 35 active foreign chambers of commerce and trade associations.
Nearly 1.6 million residents in metro Houston are foreign-born. More than 145 languages are spoken here.
Houston has 18 sister-city relationships promoting business opportunities across five continents: Asia (7), Europe (7), Americas (2), Africa (1), and Australia (1). Houston’s oldest sister-city relationship was established in 1961 with Taipei, Taiwan, and its most recent relationship with Basrah, Iraq was established in ’15.
At least 116 companies headquartered in Houston operate nearly 3,000 subsidiaries abroad in 116 countries.
More than 1,000 firms in Houston report foreign ownership.
In ’16, at least 22 foreign-owned firms representing 11 countries invested in office expansions, new plants and expanded distribution facilities in Houston. More than $1.3 billion in capital investments were made by these foreign-owned firms in Houston, creating some 1,900 new jobs.
Nearly 5,000 Houston-area firms are engaged in global commerce. Included among these global companies are more than 2,300 local manufacturers.
Eleven of Houston’s 32 skyscrapers (at least 150 meters tall) are owned, co-owned, or financed by foreign investors.
Houston Facts | 201714
I N D U S T R I E S
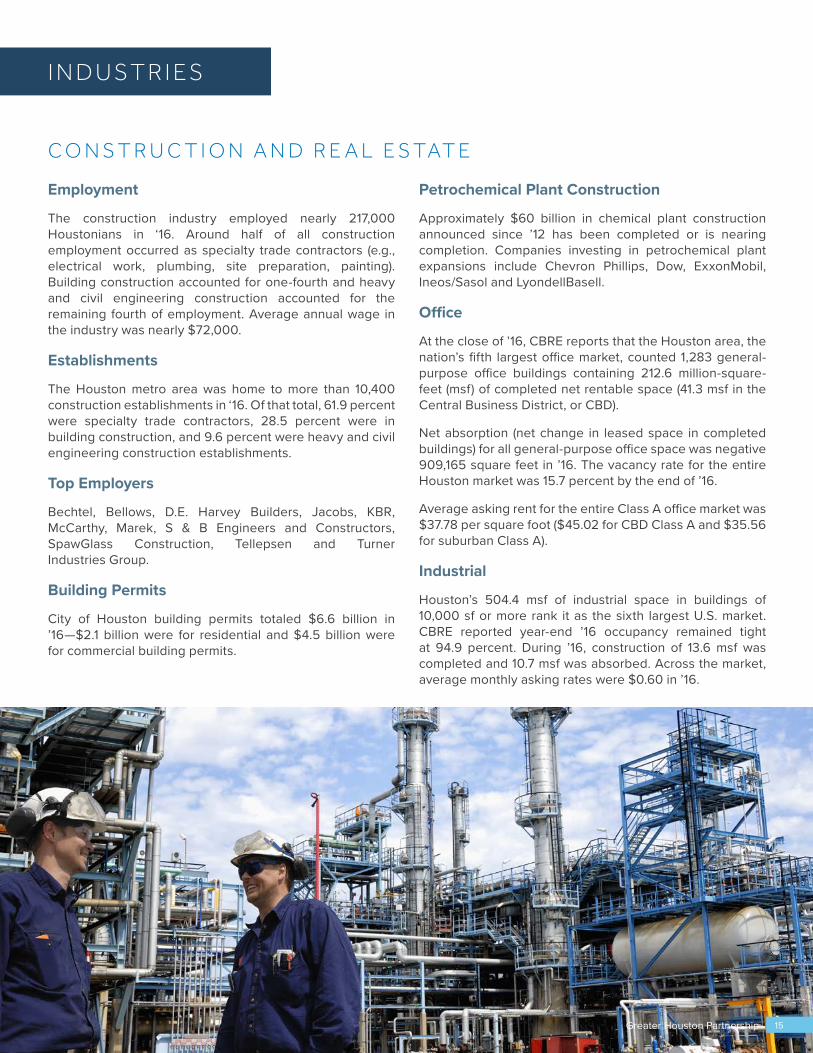
C O N S T R U C T I O N A N D R E A L E S TAT E
Employment
The construction industry employed nearly 217,000 Houstonians in ‘16. Around half of all construction employment occurred as specialty trade contractors (e.g., electrical work, plumbing, site preparation, painting). Building construction accounted for one-fourth and heavy and civil engineering construction accounted for the remaining fourth of employment. Average annual wage in the industry was nearly $72,000.
Establishments
The Houston metro area was home to more than 10,400 construction establishments in ‘16. Of that total, 61.9 percent were specialty trade contractors, 28.5 percent were in building construction, and 9.6 percent were heavy and civil engineering construction establishments.
Top Employers
Bechtel, Bellows, D.E. Harvey Builders, Jacobs, KBR, McCarthy, Marek, S & B Engineers and Constructors, SpawGlass Construction, Tellepsen and Turner Industries Group.
Building Permits
City of Houston building permits totaled $6.6 billion in ’16—$2.1 billion were for residential and $4.5 billion were for commercial building permits.
Petrochemical Plant Construction
Approximately $60 billion in chemical plant construction announced since ’12 has been completed or is nearing completion. Companies investing in petrochemical plant expansions include Chevron Phillips, Dow, ExxonMobil, Ineos/Sasol and LyondellBasell.
Office
At the close of ’16, CBRE reports that the Houston area, the nation’s fifth largest office market, counted 1,283 general-purpose office buildings containing 212.6 million-square-feet (msf) of completed net rentable space (41.3 msf in the Central Business District, or CBD).
Net absorption (net change in leased space in completed buildings) for all general-purpose office space was negative 909,165 square feet in ’16. The vacancy rate for the entire Houston market was 15.7 percent by the end of ’16.
Average asking rent for the entire Class A office market was $37.78 per square foot ($45.02 for CBD Class A and $35.56 for suburban Class A).
Industrial
Houston’s 504.4 msf of industrial space in buildings of 10,000 sf or more rank it as the sixth largest U.S. market. CBRE reported year-end ’16 occupancy remained tight at 94.9 percent. During ’16, construction of 13.6 msf was completed and 10.7 msf was absorbed. Across the market, average monthly asking rates were $0.60 in ’16.
15Greater Houston Partnership
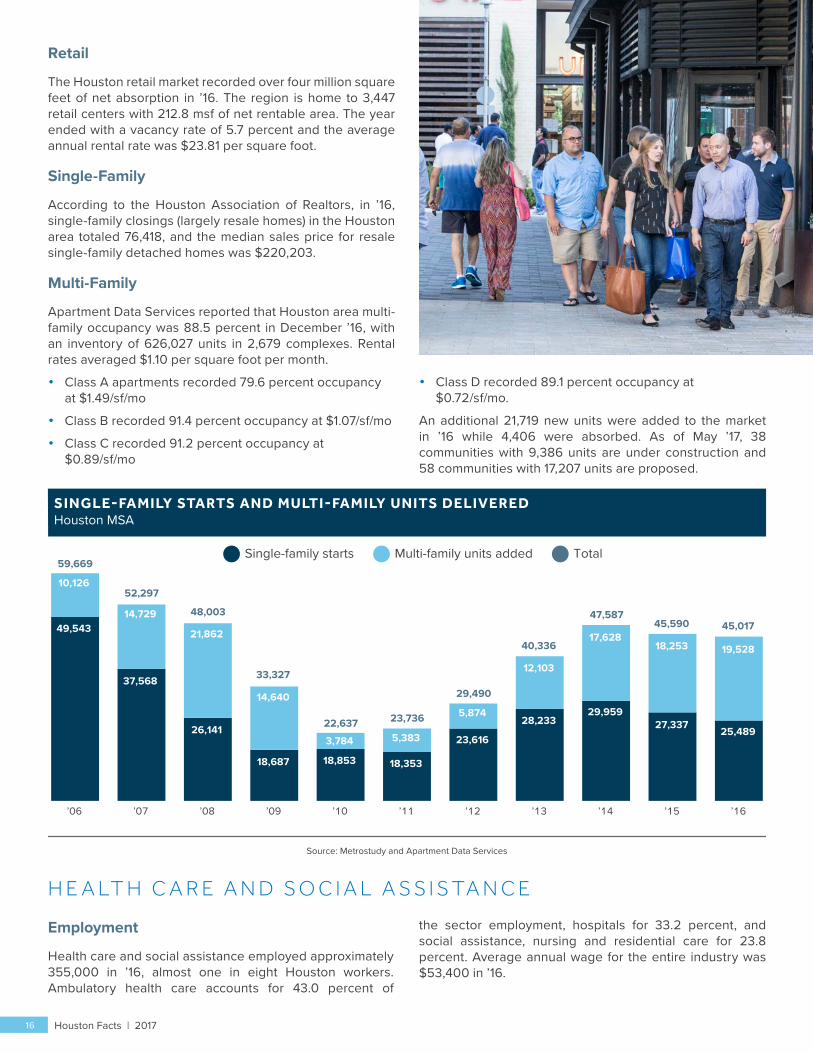
Source: Metrostudy and Apartment Data Services
Single-family starts Multi-family units added Total
SINGLE-FAMILY STARTS AND MULTI-FAMILY UNITS DELIVEREDHouston MSA
’06 ’07 ’08 ’09 ’10 ’11 ’12 ’13 ’14 ’15 ’16
49,543
10,126
59,669
37,568
14,729
52,297
26,141
21,862
48,003
18,687
14,640
33,327
18,853
3,784 22,637
18,353
5,383
23,736
23,616
5,874
29,490
28,233
12,103
40,336
29,959
17,628
47,587
27,337
18,253
45,590
25,489
19,528
45,017
Retail
The Houston retail market recorded over four million square feet of net absorption in ’16. The region is home to 3,447 retail centers with 212.8 msf of net rentable area. The year ended with a vacancy rate of 5.7 percent and the average annual rental rate was $23.81 per square foot.
Single-Family
According to the Houston Association of Realtors, in ’16, single-family closings (largely resale homes) in the Houston area totaled 76,418, and the median sales price for resale single-family detached homes was $220,203.
Multi-Family
Apartment Data Services reported that Houston area multi-family occupancy was 88.5 percent in December ’16, with an inventory of 626,027 units in 2,679 complexes. Rental rates averaged $1.10 per square foot per month.
• Class A apartments recorded 79.6 percent occupancy at $1.49/sf/mo
• Class B recorded 91.4 percent occupancy at $1.07/sf/mo
• Class C recorded 91.2 percent occupancy at $0.89/sf/mo
• Class D recorded 89.1 percent occupancy at $0.72/sf/mo.
An additional 21,719 new units were added to the market in ’16 while 4,406 were absorbed. As of May ’17, 38 communities with 9,386 units are under construction and 58 communities with 17,207 units are proposed.
H E A LT H C A R E A N D S O C I A L A S S I S TA N C E
Employment
Health care and social assistance employed approximately 355,000 in ’16, almost one in eight Houston workers. Ambulatory health care accounts for 43.0 percent of
the sector employment, hospitals for 33.2 percent, and social assistance, nursing and residential care for 23.8 percent. Average annual wage for the entire industry was $53,400 in ’16.
Houston Facts | 201716
• The region is home to 17,400 physicians, and 136 hospitals with 20,665 beds.
• Harris County has 14,100 physicians, and 95 hospitals with 17,369 beds.
• Houston is home to a larger concentration of anesthesiologists, nurse anesthetists, cardiovascular technologists and technicians, and occupational health and safety specialists and technicians than the national average.
Establishments
Houston’s 19,000 health care establishments are comprised of 12,600 ambulatory health care services, 5,600 social assistance establishments, 600 nursing and residential care facilities and about 200 hospitals.
Top Employers
CHI St. Luke’s, HCA, Harris Health System, Houston Methodist, MD Anderson Cancer Center, Memorial Hermann Healthcare System, Michael E. DeBakey Veterans Affairs Medical Center, Texas Children’s Hospital and UTMB Health.
Texas Medical Center
Houston’s Texas Medical Center is the world’s largest medical complex by multiple measures: number of hospitals, number of physicians, square footage and patient volume. The Texas Medical Center’s 58 member institutions have been consistently recognized as some of the best hospitals and universities in the nation by U.S. News and World Report.
TMC by the numbers
• $3 billion in construction projects underway
• 50 million developed square feet
• 10 million patient visits per year
• 750,000 ER visits per year
• 180,000 + surgeries
• 106,000 + employees
• 13,600 + total heart surgeries
• 8th largest business district in the U.S. with 1,345 total acres
Some prominent members include:
Baylor College of Medicine, CHI St. Luke’s Health, Gulf Coast Regional Blood Center, Harris Health System, Houston Methodist Hospital, Memorial Hermann, The Menninger Clinic, Michael E. DeBakey Veterans Affairs Medical Center, San Jose Clinic, Shriners Hospitals for Children, Texas A&M University Health Science Center, Texas Children’s Hospital, Texas Heart Institute, The University of Texas Health Science Center and The University of Texas MD Anderson Cancer Center
The Texas Medical Center is working to develop five Institutes that foster collaboration across all member institutions. The five institutes include:
• Innovation: To become the global leader in health and life sciences innovation. Houses TMCx, an accelerator that advances the development of health and medical technology companies, and TMCx+, an incubator for health startups.
• Health Policy: To develop the most effective policy solutions to improve the health of diverse populations in Houston and Texas that will serve as models for the world.
• Clinical Research: To be the world leader in clinical research by more efficiently translating research discoveries into breakthrough therapies and cures.
• Regenerative medicine: To lead the world in discovering, developing and delivering curative regenerative therapies.
• Genomics: To create the world’s premier clinical genomics program.
17Greater Houston Partnership
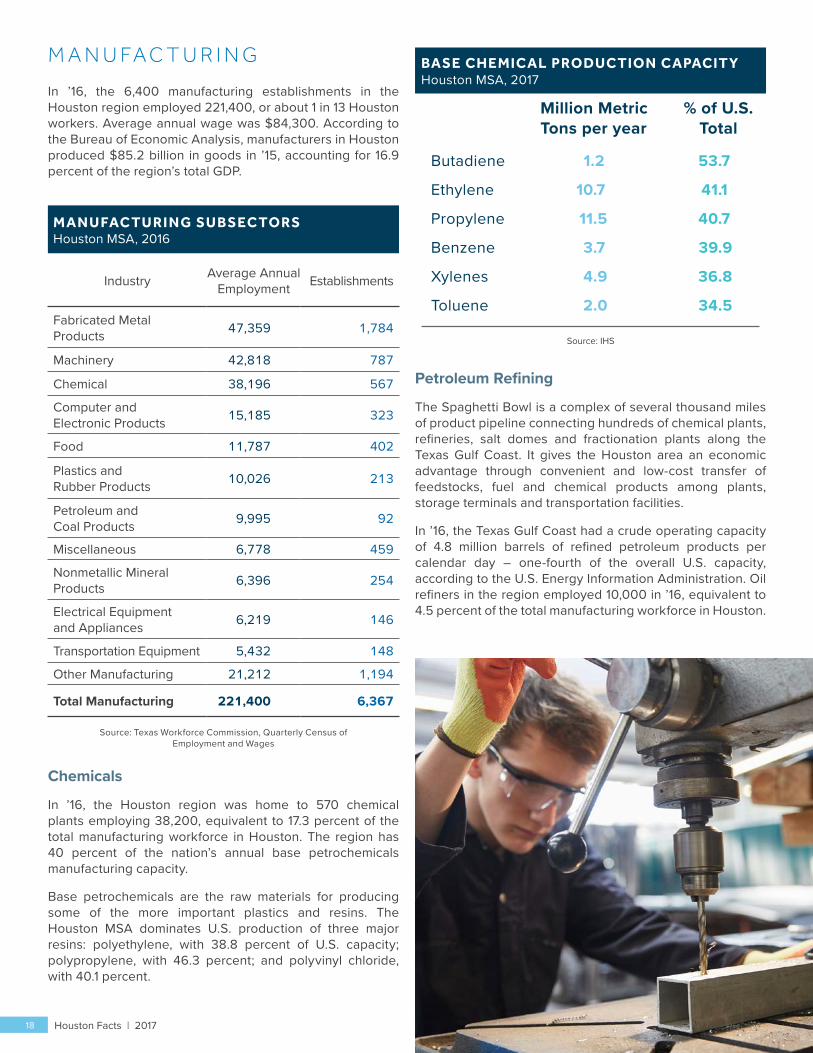
M A N U FA C T U R I N G
In ’16, the 6,400 manufacturing establishments in the Houston region employed 221,400, or about 1 in 13 Houston workers. Average annual wage was $84,300. According to the Bureau of Economic Analysis, manufacturers in Houston produced $85.2 billion in goods in ’15, accounting for 16.9 percent of the region’s total GDP.
Chemicals
In ’16, the Houston region was home to 570 chemical plants employing 38,200, equivalent to 17.3 percent of the total manufacturing workforce in Houston. The region has 40 percent of the nation’s annual base petrochemicals manufacturing capacity.
Base petrochemicals are the raw materials for producing some of the more important plastics and resins. The Houston MSA dominates U.S. production of three major resins: polyethylene, with 38.8 percent of U.S. capacity; polypropylene, with 46.3 percent; and polyvinyl chloride, with 40.1 percent.
M AN U FAC TU RI N G SU BSEC TORSHouston MSA, 2016
Industry Average Annual Employment Establishments
Fabricated Metal Products 47,359 1,784
Machinery 42,818 787
Chemical 38,196 567
Computer and Electronic Products 15,185 323
Food 11,787 402
Plastics and Rubber Products 10,026 213
Petroleum and Coal Products 9,995 92
Miscellaneous 6,778 459
Nonmetallic Mineral Products 6,396 254
Electrical Equipment and Appliances 6,219 146
Transportation Equipment 5,432 148
Other Manufacturing 21,212 1,194
Total Manufacturing 221,400 6,367
Source: Texas Workforce Commission, Quarterly Census of Employment and Wages
Butadiene 1.2 53.7
Ethylene 10.7 41.1
Propylene 11.5 40.7
Benzene 3.7
Xylenes 4.9
Toluene 2.0
39.9
36.8
34.5
BASE CHEMICAL PRODUCTION CAPACITYHouston MSA, 2017
Source: IHS
Million Metric Tons per year
% of U.S.Total
Petroleum Refining
The Spaghetti Bowl is a complex of several thousand miles of product pipeline connecting hundreds of chemical plants, refineries, salt domes and fractionation plants along the Texas Gulf Coast. It gives the Houston area an economic advantage through convenient and low-cost transfer of feedstocks, fuel and chemical products among plants, storage terminals and transportation facilities.
In ’16, the Texas Gulf Coast had a crude operating capacity of 4.8 million barrels of refined petroleum products per calendar day – one-fourth of the overall U.S. capacity, according to the U.S. Energy Information Administration. Oil refiners in the region employed 10,000 in ’16, equivalent to 4.5 percent of the total manufacturing workforce in Houston.
Houston Facts | 201718
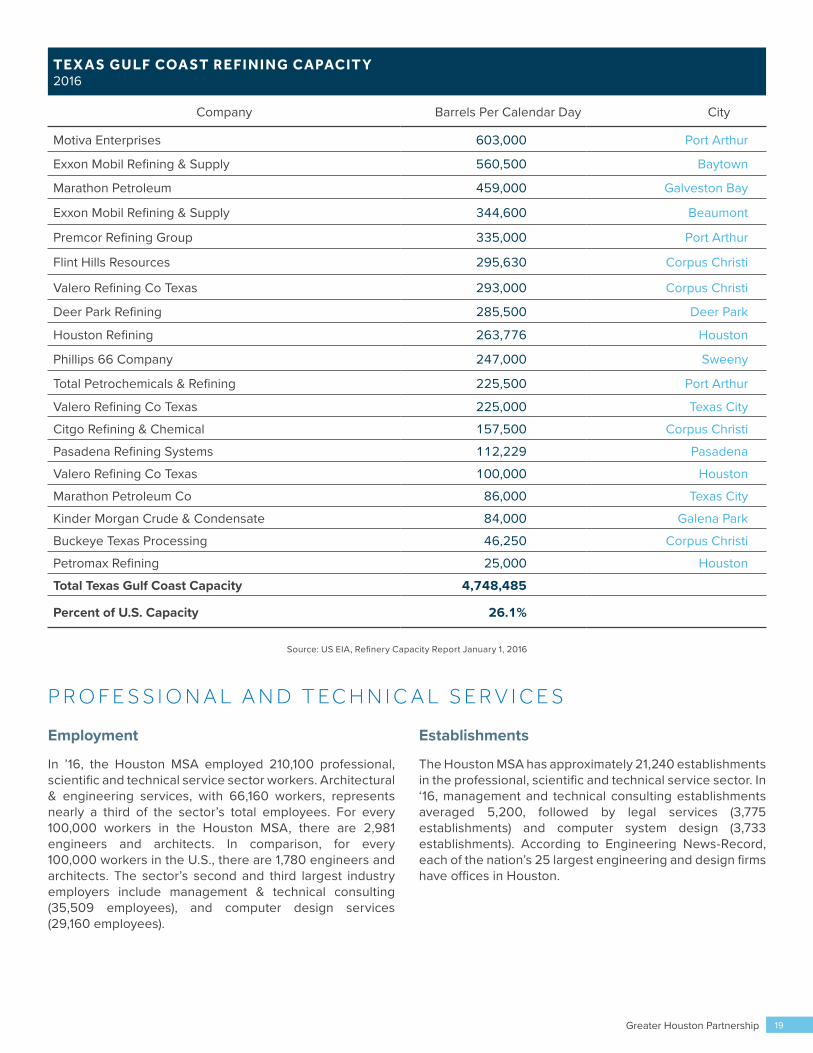
TE X A S G U LF COA ST RE FI N I N G C APAC IT Y2016
Company Barrels Per Calendar Day City
Motiva Enterprises 603,000 Port Arthur
Exxon Mobil Refining & Supply 560,500 Baytown
Marathon Petroleum 459,000 Galveston Bay
Exxon Mobil Refining & Supply 344,600 Beaumont
Premcor Refining Group 335,000 Port Arthur
Flint Hills Resources 295,630 Corpus Christi
Valero Refining Co Texas 293,000 Corpus Christi
Deer Park Refining 285,500 Deer Park
Houston Refining 263,776 Houston
Phillips 66 Company 247,000 Sweeny
Total Petrochemicals & Refining 225,500 Port Arthur
Valero Refining Co Texas 225,000 Texas City
Citgo Refining & Chemical 157,500 Corpus Christi
Pasadena Refining Systems 112,229 Pasadena
Valero Refining Co Texas 100,000 Houston
Marathon Petroleum Co 86,000 Texas City
Kinder Morgan Crude & Condensate 84,000 Galena Park
Buckeye Texas Processing 46,250 Corpus Christi
Petromax Refining 25,000 Houston
Total Texas Gulf Coast Capacity 4,748,485
Percent of U.S. Capacity 26.1%
Source: US EIA, Refinery Capacity Report January 1, 2016
P R O F E S S I O N A L A N D T E C H N I C A L S E R V I C E S
Employment
In ’16, the Houston MSA employed 210,100 professional, scientific and technical service sector workers. Architectural & engineering services, with 66,160 workers, represents nearly a third of the sector’s total employees. For every 100,000 workers in the Houston MSA, there are 2,981 engineers and architects. In comparison, for every 100,000 workers in the U.S., there are 1,780 engineers and architects. The sector’s second and third largest industry employers include management & technical consulting (35,509 employees), and computer design services (29,160 employees).
Establishments
The Houston MSA has approximately 21,240 establishments in the professional, scientific and technical service sector. In ‘16, management and technical consulting establishments averaged 5,200, followed by legal services (3,775 establishments) and computer system design (3,733 establishments). According to Engineering News-Record, each of the nation’s 25 largest engineering and design firms have offices in Houston.
Greater Houston Partnership 19
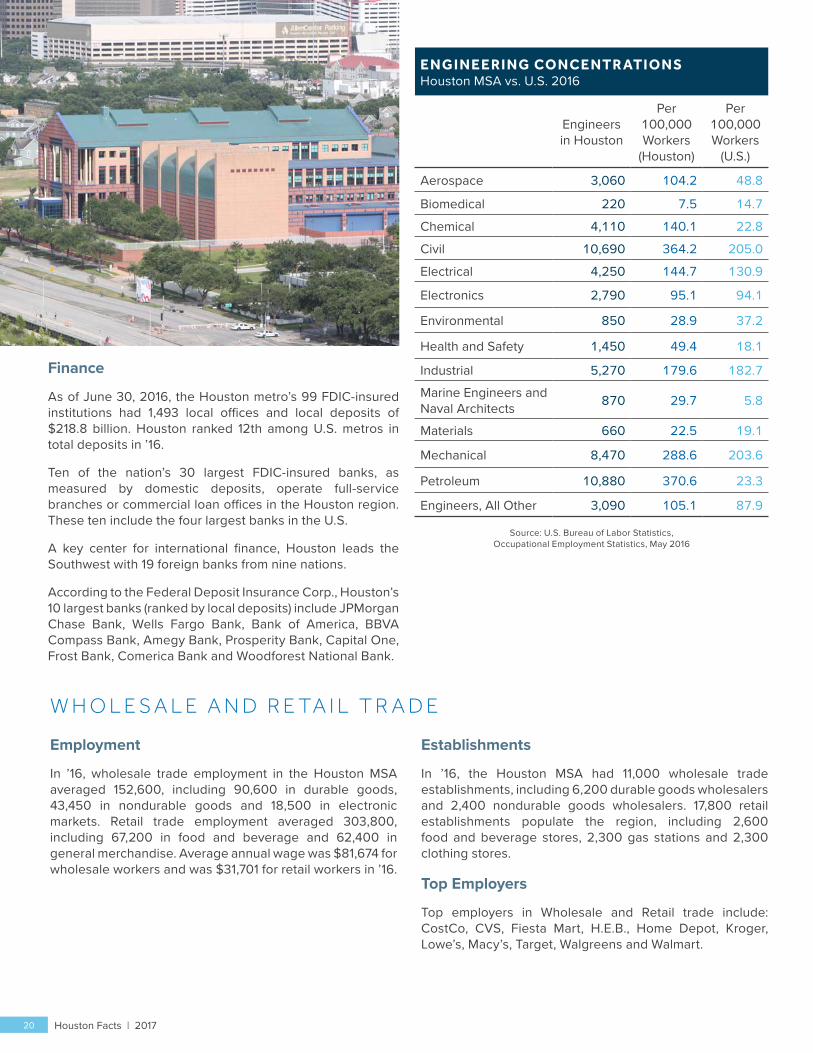
E N G I N E E RI N G CON CE NTR ATI ON SHouston MSA vs. U.S. 2016
Engineers in Houston
Per 100,000 Workers
(Houston)
Per 100,000 Workers
(U.S.)
Aerospace 3,060 104.2 48.8
Biomedical 220 7.5 14.7
Chemical 4,110 140.1 22.8
Civil 10,690 364.2 205.0
Electrical 4,250 144.7 130.9
Electronics 2,790 95.1 94.1
Environmental 850 28.9 37.2
Health and Safety 1,450 49.4 18.1
Industrial 5,270 179.6 182.7
Marine Engineers and Naval Architects 870 29.7 5.8
Materials 660 22.5 19.1
Mechanical 8,470 288.6 203.6
Petroleum 10,880 370.6 23.3
Engineers, All Other 3,090 105.1 87.9
Source: U.S. Bureau of Labor Statistics, Occupational Employment Statistics, May 2016
W H O L E S A L E A N D R E TA I L T R A D E
Employment
In ’16, wholesale trade employment in the Houston MSA averaged 152,600, including 90,600 in durable goods, 43,450 in nondurable goods and 18,500 in electronic markets. Retail trade employment averaged 303,800, including 67,200 in food and beverage and 62,400 in general merchandise. Average annual wage was $81,674 for wholesale workers and was $31,701 for retail workers in ’16.
Establishments
In ’16, the Houston MSA had 11,000 wholesale trade establishments, including 6,200 durable goods wholesalers and 2,400 nondurable goods wholesalers. 17,800 retail establishments populate the region, including 2,600 food and beverage stores, 2,300 gas stations and 2,300 clothing stores.
Top Employers
Top employers in Wholesale and Retail trade include: CostCo, CVS, Fiesta Mart, H.E.B., Home Depot, Kroger, Lowe’s, Macy’s, Target, Walgreens and Walmart.
Finance
As of June 30, 2016, the Houston metro’s 99 FDIC-insured institutions had 1,493 local offices and local deposits of $218.8 billion. Houston ranked 12th among U.S. metros in total deposits in ’16.
Ten of the nation’s 30 largest FDIC-insured banks, as measured by domestic deposits, operate full-service branches or commercial loan offices in the Houston region. These ten include the four largest banks in the U.S.
A key center for international finance, Houston leads the Southwest with 19 foreign banks from nine nations.
According to the Federal Deposit Insurance Corp., Houston’s 10 largest banks (ranked by local deposits) include JPMorgan Chase Bank, Wells Fargo Bank, Bank of America, BBVA Compass Bank, Amegy Bank, Prosperity Bank, Capital One, Frost Bank, Comerica Bank and Woodforest National Bank.
Houston Facts | 201720
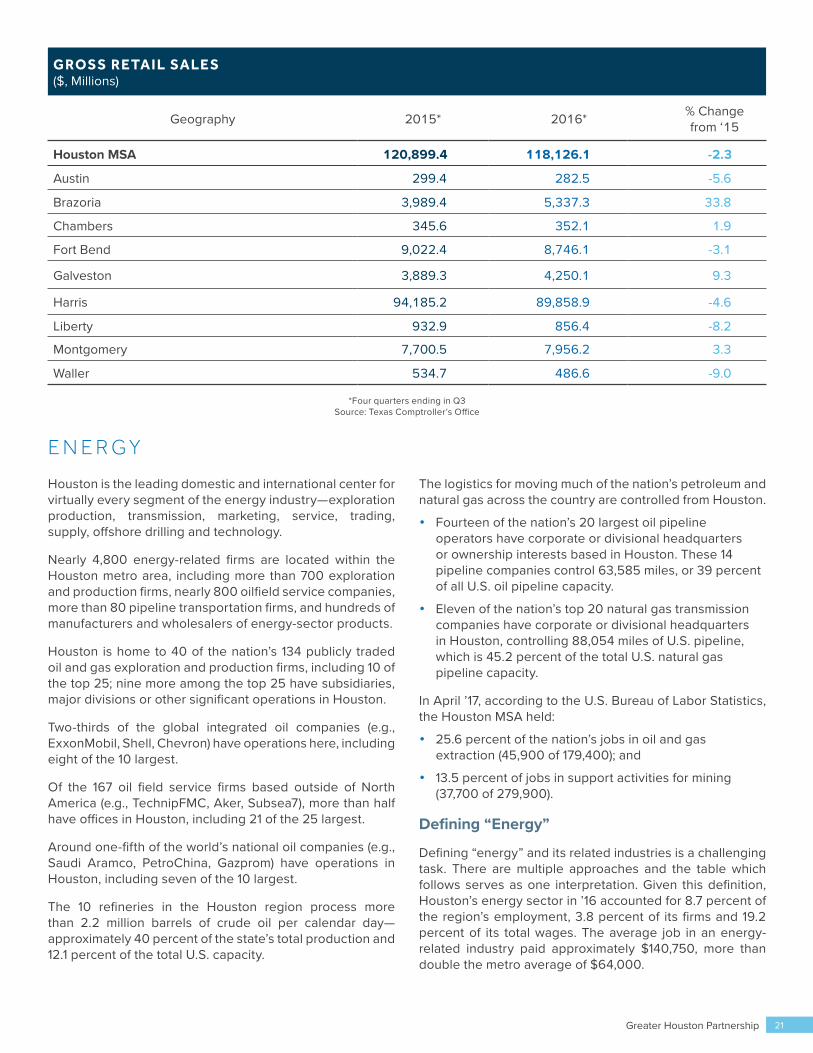
G ROSS RETAI L SALE S($, Millions)
Geography 2015* 2016* % Change from ‘15
Houston MSA Houston MSA 120,899.4 118,126.1 -2.3
Austin 299.4 282.5 -5.6
Brazoria 3,989.4 5,337.3 33.8
Chambers 345.6 352.1 1.9
Fort Bend 9,022.4 8,746.1 -3.1
Galveston 3,889.3 4,250.1 9.3
Harris 94,185.2 89,858.9 -4.6
Liberty 932.9 856.4 -8.2
Montgomery 7,700.5 7,956.2 3.3
Waller 534.7 486.6 -9.0
*Four quarters ending in Q3Source: Texas Comptroller’s Office
E N E R G Y
Houston is the leading domestic and international center for virtually every segment of the energy industry—exploration production, transmission, marketing, service, trading, supply, offshore drilling and technology.
Nearly 4,800 energy-related firms are located within the Houston metro area, including more than 700 exploration and production firms, nearly 800 oilfield service companies, more than 80 pipeline transportation firms, and hundreds of manufacturers and wholesalers of energy-sector products.
Houston is home to 40 of the nation’s 134 publicly traded oil and gas exploration and production firms, including 10 of the top 25; nine more among the top 25 have subsidiaries, major divisions or other significant operations in Houston.
Two-thirds of the global integrated oil companies (e.g., ExxonMobil, Shell, Chevron) have operations here, including eight of the 10 largest.
Of the 167 oil field service firms based outside of North America (e.g., TechnipFMC, Aker, Subsea7), more than half have offices in Houston, including 21 of the 25 largest.
Around one-fifth of the world’s national oil companies (e.g., Saudi Aramco, PetroChina, Gazprom) have operations in Houston, including seven of the 10 largest.
The 10 refineries in the Houston region process more than 2.2 million barrels of crude oil per calendar day—approximately 40 percent of the state’s total production and 12.1 percent of the total U.S. capacity.
The logistics for moving much of the nation’s petroleum and natural gas across the country are controlled from Houston.
• Fourteen of the nation’s 20 largest oil pipeline operators have corporate or divisional headquarters or ownership interests based in Houston. These 14 pipeline companies control 63,585 miles, or 39 percent of all U.S. oil pipeline capacity.
• Eleven of the nation’s top 20 natural gas transmission companies have corporate or divisional headquarters in Houston, controlling 88,054 miles of U.S. pipeline, which is 45.2 percent of the total U.S. natural gas pipeline capacity.
In April ’17, according to the U.S. Bureau of Labor Statistics, the Houston MSA held:
• 25.6 percent of the nation’s jobs in oil and gas extraction (45,900 of 179,400); and
• 13.5 percent of jobs in support activities for mining (37,700 of 279,900).
Defining “Energy”
Defining “energy” and its related industries is a challenging task. There are multiple approaches and the table which follows serves as one interpretation. Given this definition, Houston’s energy sector in ’16 accounted for 8.7 percent of the region’s employment, 3.8 percent of its firms and 19.2 percent of its total wages. The average job in an energy-related industry paid approximately $140,750, more than double the metro average of $64,000.
Greater Houston Partnership 21
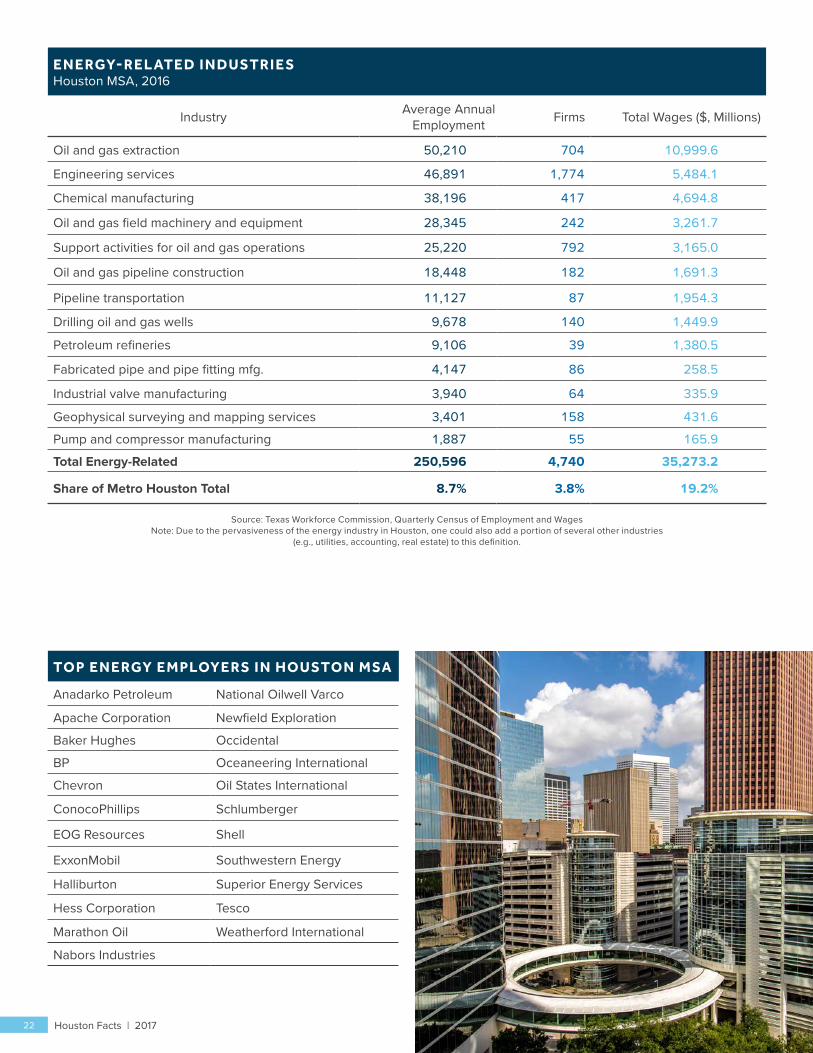
E N E RGY- RE L ATE D I N DUSTRI E SHouston MSA, 2016
Industry Average AnnualEmployment Firms Total Wages ($, Millions)
Oil and gas extraction 50,210 704 10,999.6
Engineering services 46,891 1,774 5,484.1
Chemical manufacturing 38,196 417 4,694.8
Oil and gas field machinery and equipment 28,345 242 3,261.7
Support activities for oil and gas operations 25,220 792 3,165.0
Oil and gas pipeline construction 18,448 182 1,691.3
Pipeline transportation 11,127 87 1,954.3
Drilling oil and gas wells 9,678 140 1,449.9
Petroleum refineries 9,106 39 1,380.5
Fabricated pipe and pipe fitting mfg. 4,147 86 258.5
Industrial valve manufacturing 3,940 64 335.9
Geophysical surveying and mapping services 3,401 158 431.6
Pump and compressor manufacturing 1,887 55 165.9
Total Energy-Related 250,596 4,740 35,273.2
Share of Metro Houston Total 8.7% 3.8% 19.2%
Source: Texas Workforce Commission, Quarterly Census of Employment and WagesNote: Due to the pervasiveness of the energy industry in Houston, one could also add a portion of several other industries
(e.g., utilities, accounting, real estate) to this definition.
TOP E N E RGY E M PLOYE RS I N H OUSTON MSA
Anadarko Petroleum National Oilwell Varco
Apache Corporation Newfield Exploration
Baker Hughes Occidental
BP Oceaneering International
Chevron Oil States International
ConocoPhillips Schlumberger
EOG Resources Shell
ExxonMobil Southwestern Energy
Halliburton Superior Energy Services
Hess Corporation Tesco
Marathon Oil Weatherford International
Nabors Industries
Houston Facts | 201722
N A S A A N D A E R O S PA C E
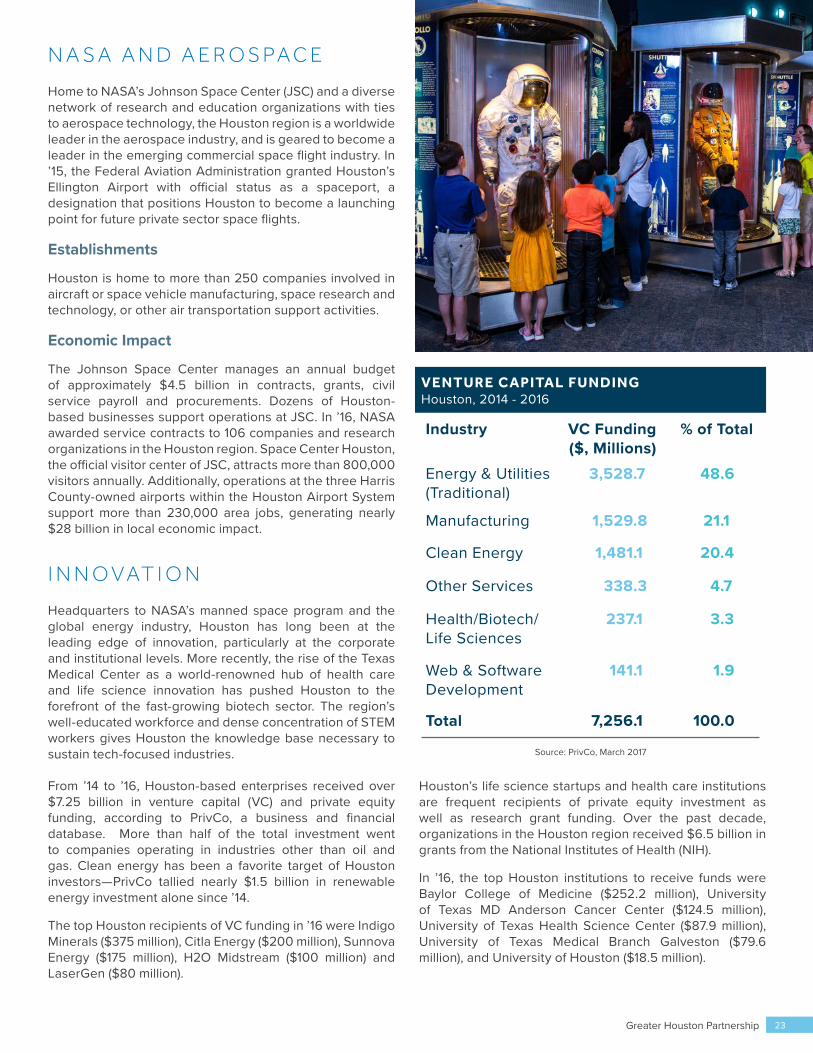
Home to NASA’s Johnson Space Center (JSC) and a diverse network of research and education organizations with ties to aerospace technology, the Houston region is a worldwide leader in the aerospace industry, and is geared to become a leader in the emerging commercial space flight industry. In ’15, the Federal Aviation Administration granted Houston’s Ellington Airport with official status as a spaceport, a designation that positions Houston to become a launching point for future private sector space flights.
Establishments
Houston is home to more than 250 companies involved in aircraft or space vehicle manufacturing, space research and technology, or other air transportation support activities.
Economic Impact
The Johnson Space Center manages an annual budget of approximately $4.5 billion in contracts, grants, civil service payroll and procurements. Dozens of Houston-based businesses support operations at JSC. In ’16, NASA awarded service contracts to 106 companies and research organizations in the Houston region. Space Center Houston, the official visitor center of JSC, attracts more than 800,000 visitors annually. Additionally, operations at the three Harris County-owned airports within the Houston Airport System support more than 230,000 area jobs, generating nearly $28 billion in local economic impact.
I N N O V AT I O N
Headquarters to NASA’s manned space program and the global energy industry, Houston has long been at the leading edge of innovation, particularly at the corporate and institutional levels. More recently, the rise of the Texas Medical Center as a world-renowned hub of health care and life science innovation has pushed Houston to the forefront of the fast-growing biotech sector. The region’s well-educated workforce and dense concentration of STEM workers gives Houston the knowledge base necessary to sustain tech-focused industries.
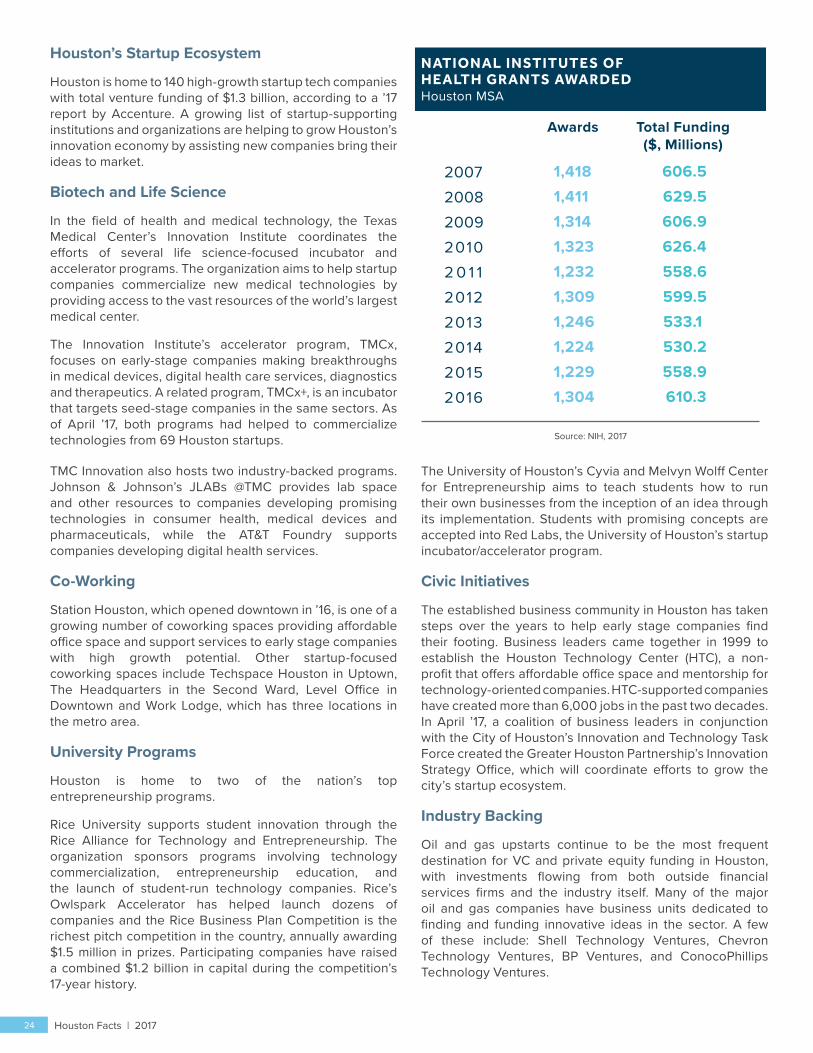
From ’14 to ’16, Houston-based enterprises received over $7.25 billion in venture capital (VC) and private equity funding, according to PrivCo, a business and financial database. More than half of the total investment went to companies operating in industries other than oil and gas. Clean energy has been a favorite target of Houston investors—PrivCo tallied nearly $1.5 billion in renewable energy investment alone since ’14.
The top Houston recipients of VC funding in ’16 were Indigo Minerals ($375 million), Citla Energy ($200 million), Sunnova Energy ($175 million), H2O Midstream ($100 million) and LaserGen ($80 million).
Houston’s life science startups and health care institutions are frequent recipients of private equity investment as well as research grant funding. Over the past decade, organizations in the Houston region received $6.5 billion in grants from the National Institutes of Health (NIH).
In ’16, the top Houston institutions to receive funds were Baylor College of Medicine ($252.2 million), University of Texas MD Anderson Cancer Center ($124.5 million), University of Texas Health Science Center ($87.9 million), University of Texas Medical Branch Galveston ($79.6 million), and University of Houston ($18.5 million).
Energy & Utilities (Traditional)
3,528.7 48.6
Manufacturing 1,529.8 21.1
Clean Energy
Other Services
Health/Biotech/Life Sciences
Web & Software Development
Total
1,481.1 20.4
338.3 4.7
237.1 3.3
141.1 1.9
7,256.1 100.0
VENTURE CAPITAL FUNDINGHouston, 2014 - 2016
Source: PrivCo, March 2017
VC Funding($, Millions)
Industry % of Total
Greater Houston Partnership 23
Houston’s Startup Ecosystem
Houston is home to 140 high-growth startup tech companies with total venture funding of $1.3 billion, according to a ’17 report by Accenture. A growing list of startup-supporting institutions and organizations are helping to grow Houston’s innovation economy by assisting new companies bring their ideas to market.
Biotech and Life Science
In the field of health and medical technology, the Texas Medical Center’s Innovation Institute coordinates the efforts of several life science-focused incubator and accelerator programs. The organization aims to help startup companies commercialize new medical technologies by providing access to the vast resources of the world’s largest medical center.
The Innovation Institute’s accelerator program, TMCx, focuses on early-stage companies making breakthroughs in medical devices, digital health care services, diagnostics and therapeutics. A related program, TMCx+, is an incubator that targets seed-stage companies in the same sectors. As of April ’17, both programs had helped to commercialize technologies from 69 Houston startups.
TMC Innovation also hosts two industry-backed programs. Johnson & Johnson’s JLABs @TMC provides lab space and other resources to companies developing promising technologies in consumer health, medical devices and pharmaceuticals, while the AT&T Foundry supports companies developing digital health services.
Co-Working
Station Houston, which opened downtown in ’16, is one of a growing number of coworking spaces providing affordable office space and support services to early stage companies with high growth potential. Other startup-focused coworking spaces include Techspace Houston in Uptown, The Headquarters in the Second Ward, Level Office in Downtown and Work Lodge, which has three locations in the metro area.
University Programs
Houston is home to two of the nation’s top entrepreneurship programs.
Rice University supports student innovation through the Rice Alliance for Technology and Entrepreneurship. The organization sponsors programs involving technology commercialization, entrepreneurship education, and the launch of student-run technology companies. Rice’s Owlspark Accelerator has helped launch dozens of companies and the Rice Business Plan Competition is the richest pitch competition in the country, annually awarding $1.5 million in prizes. Participating companies have raised a combined $1.2 billion in capital during the competition’s 17-year history.
The University of Houston’s Cyvia and Melvyn Wolff Center for Entrepreneurship aims to teach students how to run their own businesses from the inception of an idea through its implementation. Students with promising concepts are accepted into Red Labs, the University of Houston’s startup incubator/accelerator program.
Civic Initiatives
The established business community in Houston has taken steps over the years to help early stage companies find their footing. Business leaders came together in 1999 to establish the Houston Technology Center (HTC), a non-profit that offers affordable office space and mentorship for technology-oriented companies. HTC-supported companies have created more than 6,000 jobs in the past two decades. In April ’17, a coalition of business leaders in conjunction with the City of Houston’s Innovation and Technology Task Force created the Greater Houston Partnership’s Innovation Strategy Office, which will coordinate efforts to grow the city’s startup ecosystem.
Industry Backing
Oil and gas upstarts continue to be the most frequent destination for VC and private equity funding in Houston, with investments flowing from both outside financial services firms and the industry itself. Many of the major oil and gas companies have business units dedicated to finding and funding innovative ideas in the sector. A few of these include: Shell Technology Ventures, Chevron Technology Ventures, BP Ventures, and ConocoPhillips Technology Ventures.
20072008200920102 0 1 120122013201420152016
1,4181,4111,3141,3231,2321,3091,2461,2241,2291,304
606.5629.5606.9626.4558.6599.5533.1530.2558.9610.3
NATIONAL INSTITUTES OF HEALTH GRANTS AWARDEDHouston MSA
Source: NIH, 2017
Awards Total Funding($, Millions)
24 Houston Facts | 2016Houston Facts | 2017
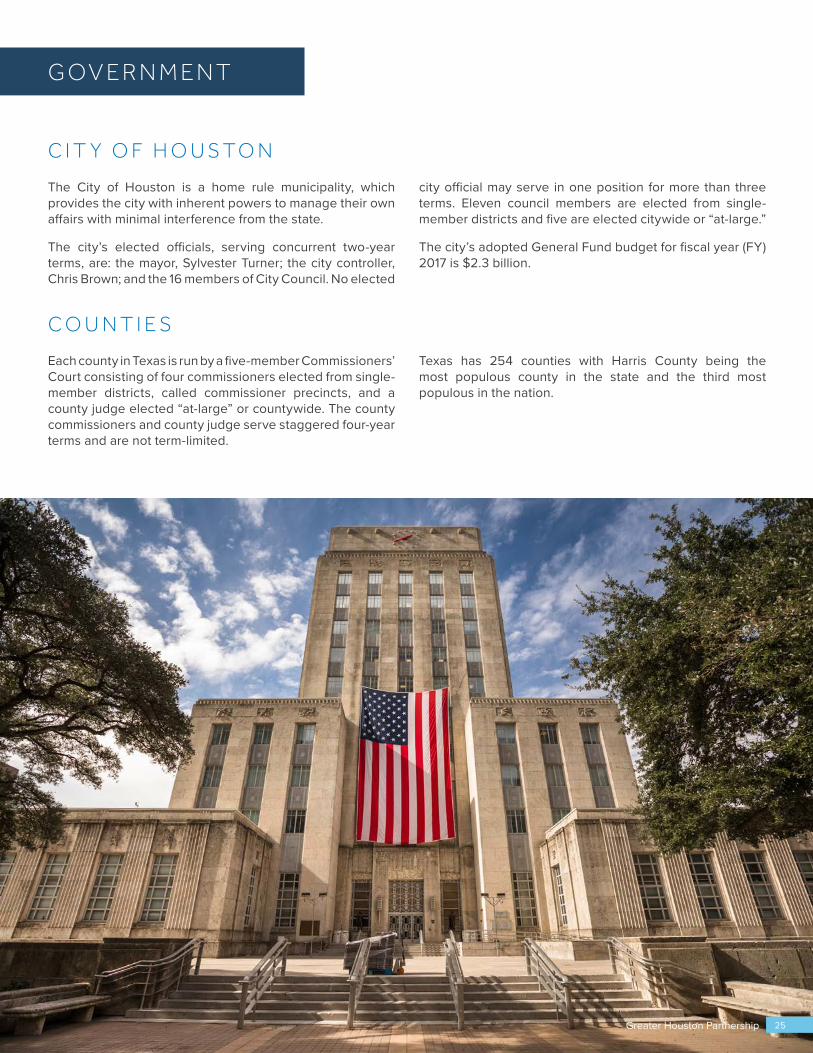
G OV E R N M E N T
C I T Y O F H O U S T O N
The City of Houston is a home rule municipality, which provides the city with inherent powers to manage their own affairs with minimal interference from the state.
The city’s elected officials, serving concurrent two-year terms, are: the mayor, Sylvester Turner; the city controller, Chris Brown; and the 16 members of City Council. No elected
city official may serve in one position for more than three terms. Eleven council members are elected from single-member districts and five are elected citywide or “at-large.”
The city’s adopted General Fund budget for fiscal year (FY) 2017 is $2.3 billion.
C O U N T I E S
Each county in Texas is run by a five-member Commissioners’ Court consisting of four commissioners elected from single-member districts, called commissioner precincts, and a county judge elected “at-large” or countywide. The county commissioners and county judge serve staggered four-year terms and are not term-limited.
Texas has 254 counties with Harris County being the most populous county in the state and the third most populous in the nation.
25Greater Houston Partnership
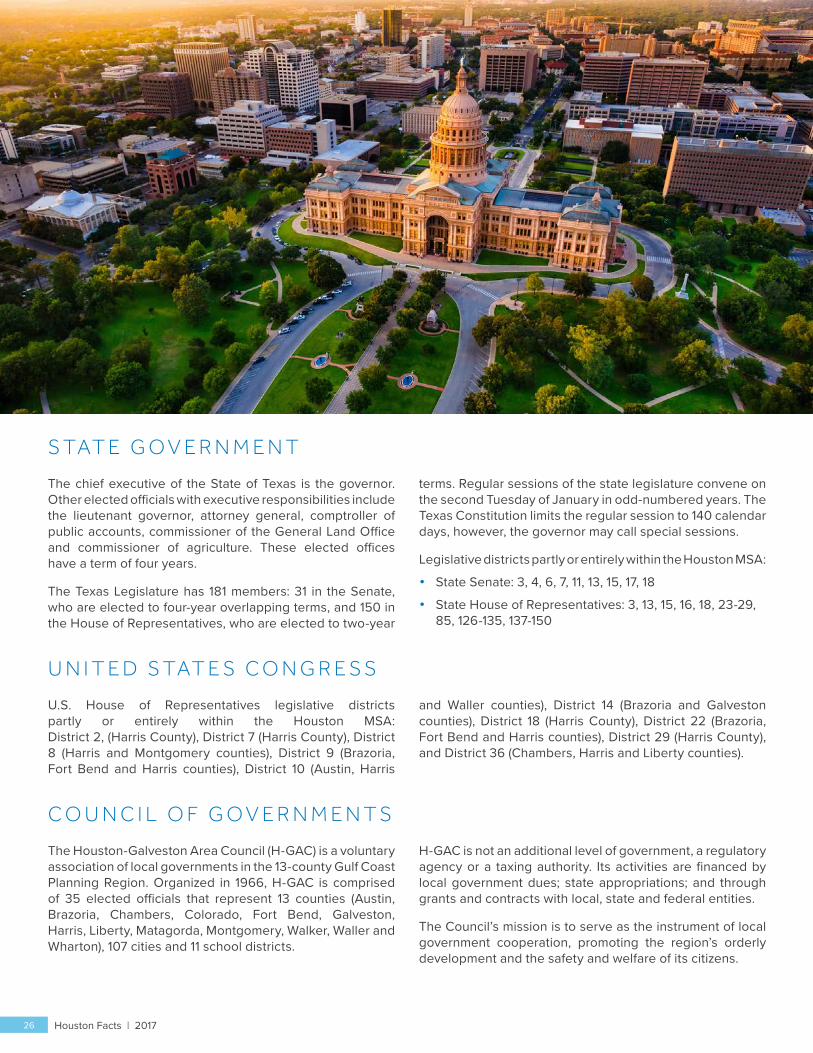
S TAT E G O V E R N M E N T
The chief executive of the State of Texas is the governor. Other elected officials with executive responsibilities include the lieutenant governor, attorney general, comptroller of public accounts, commissioner of the General Land Office and commissioner of agriculture. These elected offices have a term of four years.
The Texas Legislature has 181 members: 31 in the Senate, who are elected to four-year overlapping terms, and 150 in the House of Representatives, who are elected to two-year
terms. Regular sessions of the state legislature convene on the second Tuesday of January in odd-numbered years. The Texas Constitution limits the regular session to 140 calendar days, however, the governor may call special sessions.
Legislative districts partly or entirely within the Houston MSA:
• State Senate: 3, 4, 6, 7, 11, 13, 15, 17, 18
• State House of Representatives: 3, 13, 15, 16, 18, 23-29, 85, 126-135, 137-150
U N I T E D S TAT E S C O N G R E S S
U.S. House of Representatives legislative districts partly or entirely within the Houston MSA: District 2, (Harris County), District 7 (Harris County), District 8 (Harris and Montgomery counties), District 9 (Brazoria, Fort Bend and Harris counties), District 10 (Austin, Harris
and Waller counties), District 14 (Brazoria and Galveston counties), District 18 (Harris County), District 22 (Brazoria, Fort Bend and Harris counties), District 29 (Harris County), and District 36 (Chambers, Harris and Liberty counties).
C O U N C I L O F G O V E R N M E N T S
The Houston-Galveston Area Council (H-GAC) is a voluntary association of local governments in the 13-county Gulf Coast Planning Region. Organized in 1966, H-GAC is comprised of 35 elected officials that represent 13 counties (Austin, Brazoria, Chambers, Colorado, Fort Bend, Galveston, Harris, Liberty, Matagorda, Montgomery, Walker, Waller and Wharton), 107 cities and 11 school districts.
H-GAC is not an additional level of government, a regulatory agency or a taxing authority. Its activities are financed by local government dues; state appropriations; and through grants and contracts with local, state and federal entities.
The Council’s mission is to serve as the instrument of local government cooperation, promoting the region’s orderly development and the safety and welfare of its citizens.
Houston Facts | 201726
TA X AT I O N
The maximum sales and use tax rate in the state of Texas is 8.25 percent (6.25 percent for the state and up to 2 percent for local jurisdictions); certain food and drug items are exempt.
The table below shows typical tax rates for property located within the city limits of Houston. The tax rates are expressed as dollars per $100 taxable value.
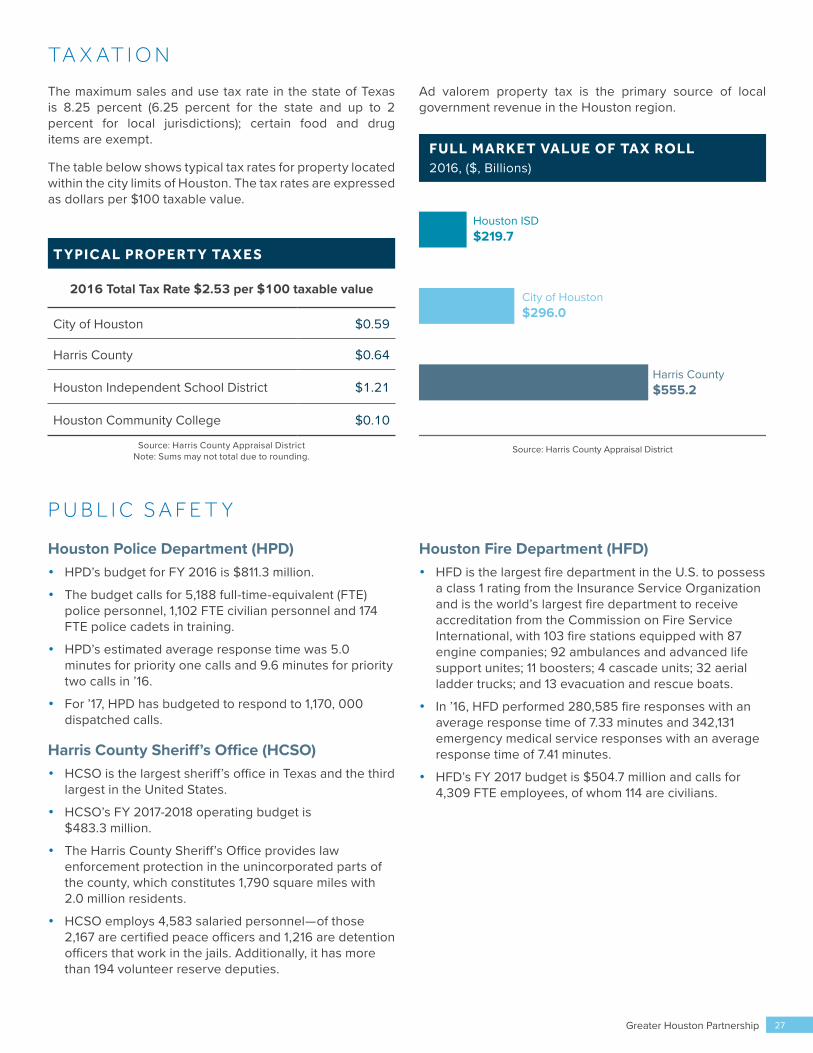
Ad valorem property tax is the primary source of local government revenue in the Houston region.
P U B L I C S A F E T Y
Houston Police Department (HPD)• HPD’s budget for FY 2016 is $811.3 million.
• The budget calls for 5,188 full-time-equivalent (FTE) police personnel, 1,102 FTE civilian personnel and 174 FTE police cadets in training.
• HPD’s estimated average response time was 5.0 minutes for priority one calls and 9.6 minutes for priority two calls in ’16.
• For ’17, HPD has budgeted to respond to 1,170, 000 dispatched calls.
Harris County Sheriff’s Office (HCSO)• HCSO is the largest sheriff’s office in Texas and the third
largest in the United States.
• HCSO’s FY 2017-2018 operating budget is $483.3 million.
• The Harris County Sheriff’s Office provides law enforcement protection in the unincorporated parts of the county, which constitutes 1,790 square miles with 2.0 million residents.
• HCSO employs 4,583 salaried personnel—of those 2,167 are certified peace officers and 1,216 are detention officers that work in the jails. Additionally, it has more than 194 volunteer reserve deputies.
Houston Fire Department (HFD)• HFD is the largest fire department in the U.S. to possess
a class 1 rating from the Insurance Service Organization and is the world’s largest fire department to receive accreditation from the Commission on Fire Service International, with 103 fire stations equipped with 87 engine companies; 92 ambulances and advanced life support unites; 11 boosters; 4 cascade units; 32 aerial ladder trucks; and 13 evacuation and rescue boats.
• In ’16, HFD performed 280,585 fire responses with an average response time of 7.33 minutes and 342,131 emergency medical service responses with an average response time of 7.41 minutes.
• HFD’s FY 2017 budget is $504.7 million and calls for 4,309 FTE employees, of whom 114 are civilians.
Source: Harris County Appraisal District
FULL MARKET VALUE OF TAX ROLL2016, ($, Billions)
City of Houston$296.0
Harris County$555.2
Houston ISD$219.7
T YPI C AL PROPE RT Y TA XE S
2016 Total Tax Rate $2.53 per $100 taxable value
City of Houston $0.59
Harris County $0.64
Houston Independent School District $1.21
Houston Community College $0.10
Source: Harris County Appraisal District Note: Sums may not total due to rounding.
Greater Houston Partnership 27
E D U C AT I O N
S C H O O L S
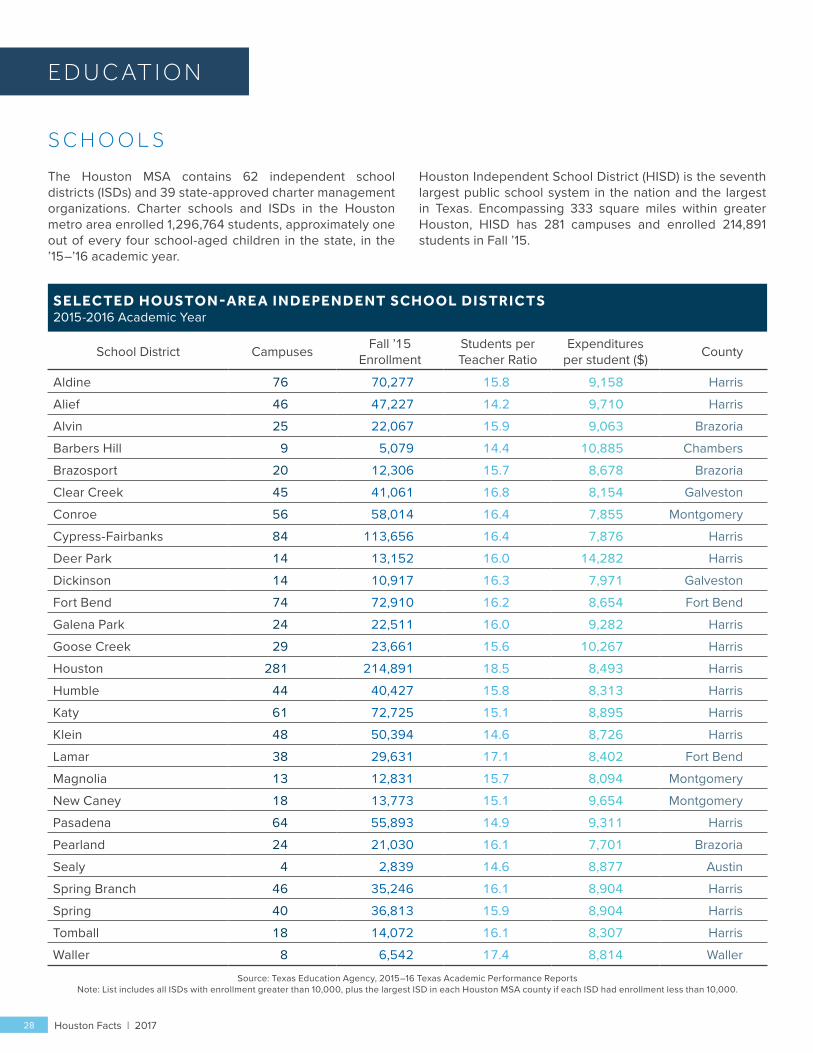
The Houston MSA contains 62 independent school districts (ISDs) and 39 state-approved charter management organizations. Charter schools and ISDs in the Houston metro area enrolled 1,296,764 students, approximately one out of every four school-aged children in the state, in the ’15–’16 academic year.
Houston Independent School District (HISD) is the seventh largest public school system in the nation and the largest in Texas. Encompassing 333 square miles within greater Houston, HISD has 281 campuses and enrolled 214,891 students in Fall ’15.
SE LEC TE D H OUSTON -ARE A I N DE PE N DE NT SCH OOL D I STRI C TS2015-2016 Academic Year
School District Campuses Fall ’15 Enrollment
Students per Teacher Ratio
Expenditures per student ($) County
Aldine 76 70,277 15.8 9,158 HarrisAlief 46 47,227 14.2 9,710 HarrisAlvin 25 22,067 15.9 9,063 BrazoriaBarbers Hill 9 5,079 14.4 10,885 ChambersBrazosport 20 12,306 15.7 8,678 BrazoriaClear Creek 45 41,061 16.8 8,154 GalvestonConroe 56 58,014 16.4 7,855 MontgomeryCypress-Fairbanks 84 113,656 16.4 7,876 HarrisDeer Park 14 13,152 16.0 14,282 HarrisDickinson 14 10,917 16.3 7,971 GalvestonFort Bend 74 72,910 16.2 8,654 Fort BendGalena Park 24 22,511 16.0 9,282 HarrisGoose Creek 29 23,661 15.6 10,267 HarrisHouston 281 214,891 18.5 8,493 HarrisHumble 44 40,427 15.8 8,313 HarrisKaty 61 72,725 15.1 8,895 HarrisKlein 48 50,394 14.6 8,726 HarrisLamar 38 29,631 17.1 8,402 Fort BendMagnolia 13 12,831 15.7 8,094 MontgomeryNew Caney 18 13,773 15.1 9,654 MontgomeryPasadena 64 55,893 14.9 9,311 HarrisPearland 24 21,030 16.1 7,701 BrazoriaSealy 4 2,839 14.6 8,877 AustinSpring Branch 46 35,246 16.1 8,904 HarrisSpring 40 36,813 15.9 8,904 HarrisTomball 18 14,072 16.1 8,307 HarrisWaller 8 6,542 17.4 8,814 Waller
Source: Texas Education Agency, 2015–16 Texas Academic Performance Reports Note: List includes all ISDs with enrollment greater than 10,000, plus the largest ISD in each Houston MSA county if each ISD had enrollment less than 10,000.
Houston Facts | 201728
L I B R A R I E S • The Houston Public Library is comprised of 44 branches
with total circulation of 4,214,217 in ’16.
• Harris County Public Library is a system of 26 branch libraries with total circulation of 8,182,971 in ’16.
C O L L E G E S A N D U N I V E R S I T I E S
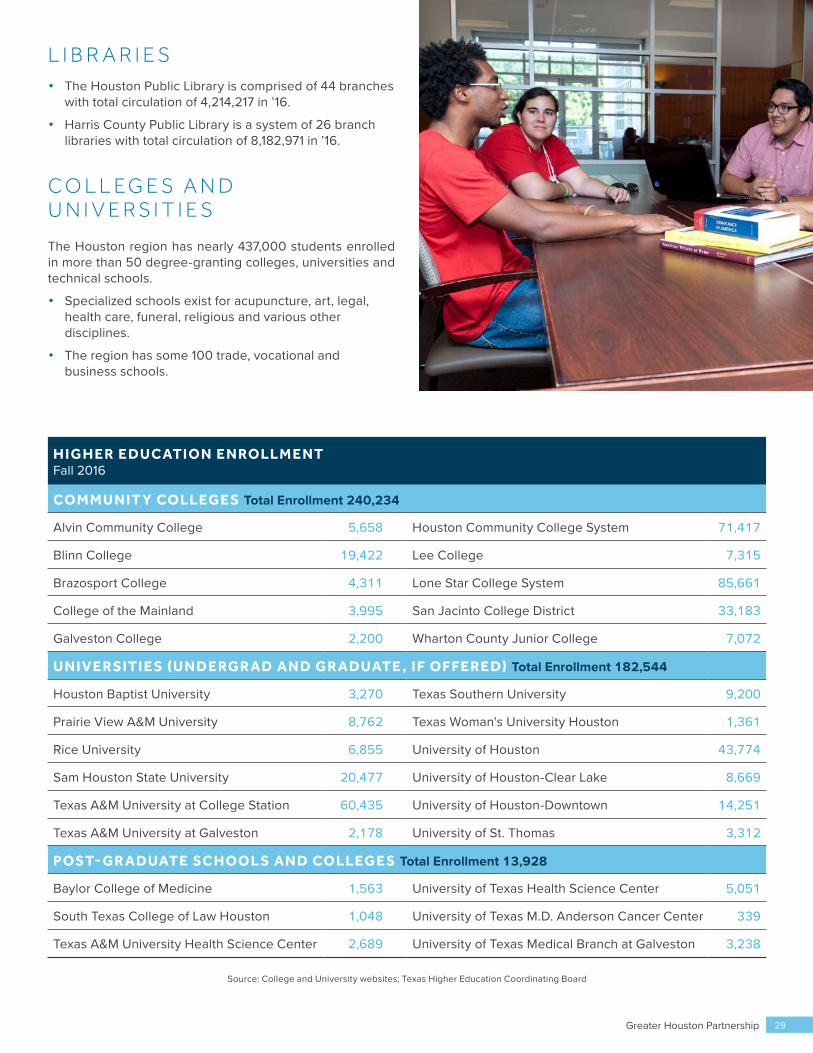
The Houston region has nearly 437,000 students enrolled in more than 50 degree-granting colleges, universities and technical schools.
• Specialized schools exist for acupuncture, art, legal, health care, funeral, religious and various other disciplines.
• The region has some 100 trade, vocational and business schools.
H I G H E R E DUC ATI ON E N ROLLM E NTFall 2016
COM M U N IT Y COLLEG E S Total Enrollment 240,234
Alvin Community College 5,658 Houston Community College System 71,417
Blinn College 19,422 Lee College 7,315
Brazosport College 4,311 Lone Star College System 85,661
College of the Mainland 3,995 San Jacinto College District 33,183
Galveston College 2,200 Wharton County Junior College 7,072
U N IVE RSITI E S (U N DE RG R AD AN D G R ADUATE , I F OFFE RE D) Total Enrollment 182,544
Houston Baptist University 3,270 Texas Southern University 9,200
Prairie View A&M University 8,762 Texas Woman's University Houston 1,361
Rice University 6,855 University of Houston 43,774
Sam Houston State University 20,477 University of Houston-Clear Lake 8,669
Texas A&M University at College Station 60,435 University of Houston-Downtown 14,251
Texas A&M University at Galveston 2,178 University of St. Thomas 3,312
POST- G R ADUATE SCH OOL S AN D COLLEG E S Total Enrollment 13,928
Baylor College of Medicine 1,563 University of Texas Health Science Center 5,051
South Texas College of Law Houston 1,048 University of Texas M.D. Anderson Cancer Center 339
Texas A&M University Health Science Center 2,689 University of Texas Medical Branch at Galveston 3,238
Source: College and University websites; Texas Higher Education Coordinating Board
29Greater Houston Partnership Greater Houston Partnership
I N F R A S T R U C T U R EP U B L I C U T I L I T I E S
Electricity and Natural Gas
Headquartered in Houston, CenterPoint Energy (CNP) is a domestic energy delivery company that includes electric transmission and distribution, natural gas distribution, competitive natural gas sales and services, interstate pipelines, and field services operations.
• CNP’s assets total more than $21.9 billion and the company employs 7,727, of which 4,985 work in Houston.
• In ’16, CNP delivered 86.8 million megawatt hours of electricity to 2,129,773 residential and 273,567 commercial/industrial/municipal customers in its 5,000-square mile service area in the Houston region.
• In ’16, CNP delivered 411 billion cubic feet of natural gas to 3,183,538 residential and 255,806 commercial/industrial customers.
Telecommunications
Seven overlaid area codes serve the Houston area: 281, 346, 409, 713, 832, 936, and 979.
• The Public Utilities Commission of Texas (PUC) has certified 287 active Competitive Local Exchange Carriers to provide local phone service in the state.
• The Texas PUC has registered 266 active long distance Interexchange Carriers.
• More than a dozen cellular service providers offer mobile voice and data communications in the Houston MSA.
Water
The City of Houston is the regional water provider for Harris County and portions of the seven surrounding counties.
The City has sufficient water supplies for its wholesale and retail customers through the year 2050.
• The City owns water rights to over 1.2 billion gallons per day of reliable surface water and over 200 million gallons per day of available groundwater supplies.
• The City of Houston owns a 70 percent share of Lake Livingston, 70 percent of Lake Conroe and 100 percent of Lake Houston. The City of Houston is also promised 70 percent of the water rights for Allens Creek Reservoir, a proposed lake in Austin County.
• Houston’s Drinking Water Operations produced and distributed more than 160 billion gallons of water in ’16 through a 7,000-mile pipeline distribution system.
• In ’16, the City of Houston treated an average of 439 million gallons of water per day. Most of this water is used for industrial and manufacturing purposes.
• The City has four purification plants: Northeast Water Plant, East Water Plant, Southeast Water Plant and the Ground Water Treatment Process facility.
• The City of Houston’s drinking water system maintains a “Superior” rating, the highest rating for water quality issued by the Texas Commission on Environmental Quality (TCEQ).
Wastewater
The City of Houston operates 40 wastewater treatment facilities, three wet weather facilities, 18 storm water underpass pump stations and over 380 sanitary lift stations. These facilities serve an area of approximately 590 square miles and a population of 2.3 million people. The City treats an average of 225 million gallons per day (MGD) of raw sewage with an overall permitted capacity of 565 MGD. It maintains 6,100 miles of sewer pipelines with over 126,000 manholes.
I N F R A S T R U C T U R E
30 Houston Facts | 2017
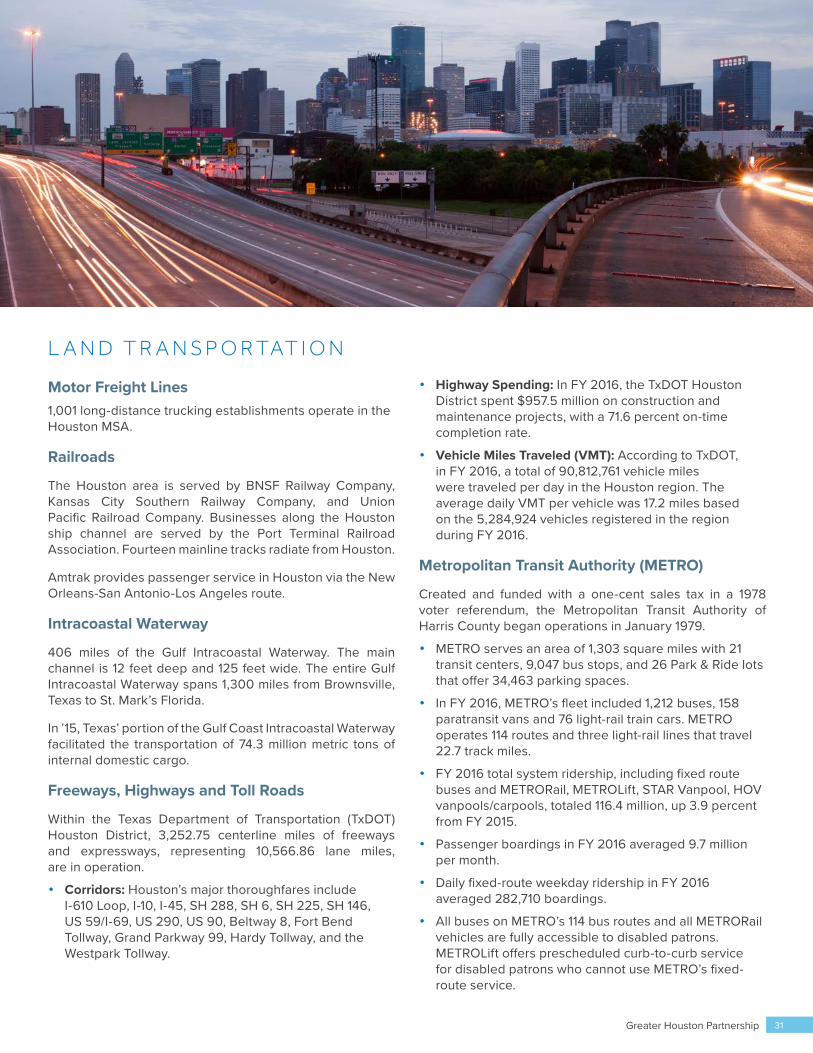
L A N D T R A N S P O R TAT I O N
Motor Freight Lines1,001 long-distance trucking establishments operate in the Houston MSA.
Railroads
The Houston area is served by BNSF Railway Company, Kansas City Southern Railway Company, and Union Pacific Railroad Company. Businesses along the Houston ship channel are served by the Port Terminal Railroad Association. Fourteen mainline tracks radiate from Houston.
Amtrak provides passenger service in Houston via the New Orleans-San Antonio-Los Angeles route.
Intracoastal Waterway
406 miles of the Gulf Intracoastal Waterway. The main channel is 12 feet deep and 125 feet wide. The entire Gulf Intracoastal Waterway spans 1,300 miles from Brownsville, Texas to St. Mark’s Florida.
In ’15, Texas’ portion of the Gulf Coast Intracoastal Waterway facilitated the transportation of 74.3 million metric tons of internal domestic cargo.
Freeways, Highways and Toll Roads
Within the Texas Department of Transportation (TxDOT) Houston District, 3,252.75 centerline miles of freeways and expressways, representing 10,566.86 lane miles, are in operation.
• Corridors: Houston’s major thoroughfares include I-610 Loop, I-10, I-45, SH 288, SH 6, SH 225, SH 146, US 59/I-69, US 290, US 90, Beltway 8, Fort Bend Tollway, Grand Parkway 99, Hardy Tollway, and the Westpark Tollway.
• Highway Spending: In FY 2016, the TxDOT Houston District spent $957.5 million on construction and maintenance projects, with a 71.6 percent on-time completion rate.
• Vehicle Miles Traveled (VMT): According to TxDOT, in FY 2016, a total of 90,812,761 vehicle miles were traveled per day in the Houston region. The average daily VMT per vehicle was 17.2 miles based on the 5,284,924 vehicles registered in the region during FY 2016.
Metropolitan Transit Authority (METRO)
Created and funded with a one-cent sales tax in a 1978 voter referendum, the Metropolitan Transit Authority of Harris County began operations in January 1979.
• METRO serves an area of 1,303 square miles with 21 transit centers, 9,047 bus stops, and 26 Park & Ride lots that offer 34,463 parking spaces.
• In FY 2016, METRO’s fleet included 1,212 buses, 158 paratransit vans and 76 light-rail train cars. METRO operates 114 routes and three light-rail lines that travel 22.7 track miles.
• FY 2016 total system ridership, including fixed route buses and METRORail, METROLift, STAR Vanpool, HOV vanpools/carpools, totaled 116.4 million, up 3.9 percent from FY 2015.
• Passenger boardings in FY 2016 averaged 9.7 million per month.
• Daily fixed-route weekday ridership in FY 2016 averaged 282,710 boardings.
• All buses on METRO’s 114 bus routes and all METRORail vehicles are fully accessible to disabled patrons. METROLift offers prescheduled curb-to-curb service for disabled patrons who cannot use METRO’s fixed-route service.
Greater Houston Partnership 31
P O R T S
Sea Ports
The Houston Region has four seaports which handled 194.3 million metric tons in trade in ’16.
PORT OF H OUSTON - FORE I G N TR ADE2016
Leading Export Commodities
By Value ($, Millions)
Petroleum/Petroleum Products 21,225.4 Organic Chemicals 9,150.2Industrial Machinery 7,766.6Plastics 5,863.5Electric Machinery 2,723.9
By Weight (Metric Tons, Thousands)Petroleum/Petroleum Products 60,999.4 Organic Chemicals 10,371.4 Cereals 6,629.0 Plastics 4,606.3Inorganic Chemicals 1,098.1
Leading Import Commodities
By Value ($, Millions)Petroleum/Petroleum Products 12,178.0 Industrial Machinery 5,693.3 Vehicles/Vehicle Parts 3,531.6 Articles of Iron or Steel 3,422.9 Organic Chemicals 2,728.0
By Weight (Metric Tons, Thousands)Petroleum/Petroleum Products 42,364.8 Natural Stone 3,380.1 Organic Chemicals 3,338.6 Articles of Iron or Steel 2,500.8 Iron and Steel 2,437.3
Leading Trading Partners (Combined Imports and Exports)
By Value ($, Millions)Mexico 10,608.1 China 10,323.5 Brazil 7,705.3 Germany 7,039.2 Netherlands 5,342.9
By Weight (Metric Tons, Thousands)Mexico 10,492.5 Brazil 3,023.5 China 3,865.7 Colombia 2,591.1 Japan 2,094.6
Source: WISERTrade
1 Houston 154,195,600
17 Texas City 21,922,778
27 Freeport 13,633,391
47 Galveston 4,554,330
SEAPORTS RANKED BY FOREIGN TRADE2016
Source: WiserTrade
PortU.S. Rank Total Trade inMetric Tons
32 Houston Facts | 2017
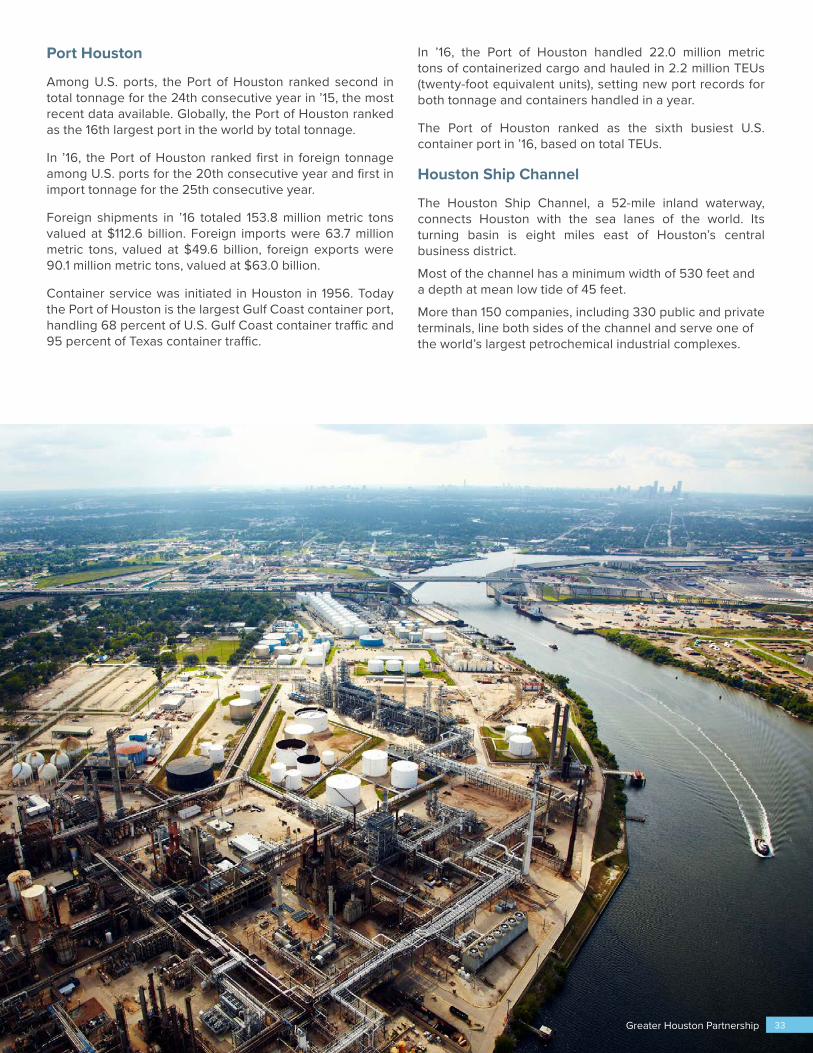
Port Houston
Among U.S. ports, the Port of Houston ranked second in total tonnage for the 24th consecutive year in ’15, the most recent data available. Globally, the Port of Houston ranked as the 16th largest port in the world by total tonnage.
In ’16, the Port of Houston ranked first in foreign tonnage among U.S. ports for the 20th consecutive year and first in import tonnage for the 25th consecutive year.
Foreign shipments in ’16 totaled 153.8 million metric tons valued at $112.6 billion. Foreign imports were 63.7 million metric tons, valued at $49.6 billion, foreign exports were 90.1 million metric tons, valued at $63.0 billion.
Container service was initiated in Houston in 1956. Today the Port of Houston is the largest Gulf Coast container port, handling 68 percent of U.S. Gulf Coast container traffic and 95 percent of Texas container traffic.
In ’16, the Port of Houston handled 22.0 million metric tons of containerized cargo and hauled in 2.2 million TEUs (twenty-foot equivalent units), setting new port records for both tonnage and containers handled in a year.
The Port of Houston ranked as the sixth busiest U.S. container port in ’16, based on total TEUs.
Houston Ship Channel
The Houston Ship Channel, a 52-mile inland waterway, connects Houston with the sea lanes of the world. Its turning basin is eight miles east of Houston’s central business district.
Most of the channel has a minimum width of 530 feet and a depth at mean low tide of 45 feet.
More than 150 companies, including 330 public and private terminals, line both sides of the channel and serve one of the world’s largest petrochemical industrial complexes.
33Greater Houston Partnership
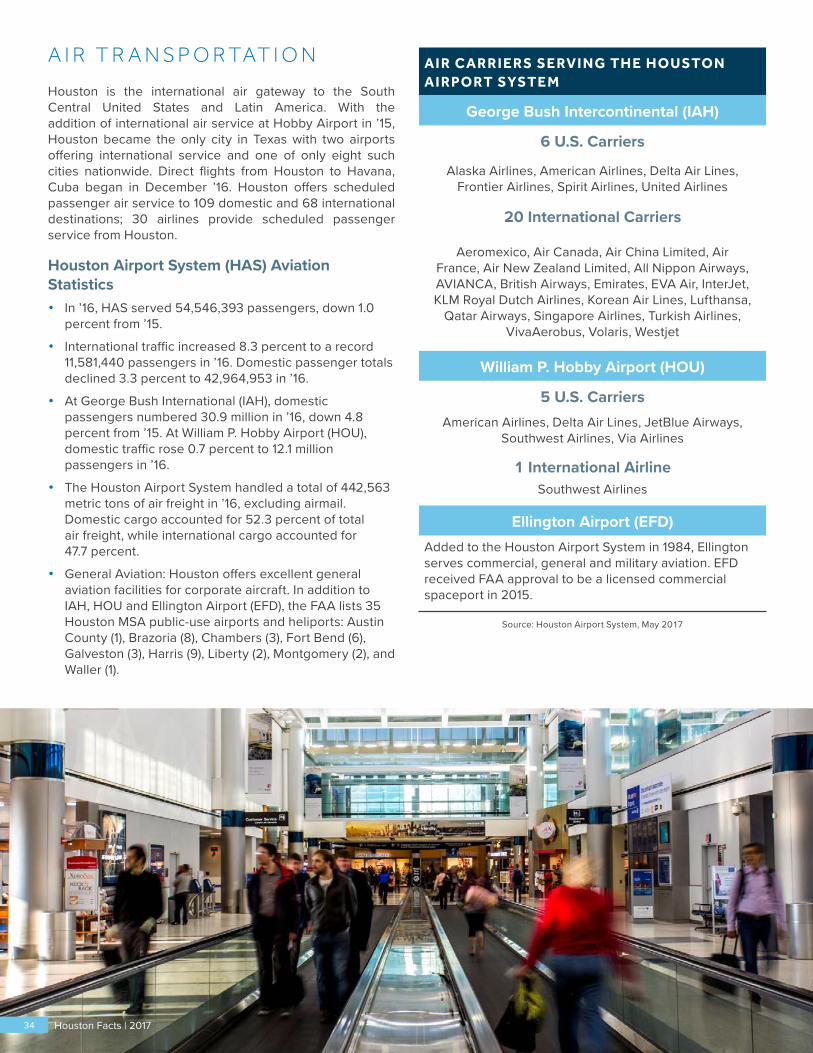
A I R T R A N S P O R TAT I O N
Houston is the international air gateway to the South Central United States and Latin America. With the addition of international air service at Hobby Airport in ’15, Houston became the only city in Texas with two airports offering international service and one of only eight such cities nationwide. Direct flights from Houston to Havana, Cuba began in December ’16. Houston offers scheduled passenger air service to 109 domestic and 68 international destinations; 30 airlines provide scheduled passenger service from Houston.
Houston Airport System (HAS) Aviation Statistics• In ’16, HAS served 54,546,393 passengers, down 1.0
percent from ’15.
• International traffic increased 8.3 percent to a record 11,581,440 passengers in ’16. Domestic passenger totals declined 3.3 percent to 42,964,953 in ’16.
• At George Bush International (IAH), domestic passengers numbered 30.9 million in ’16, down 4.8 percent from ’15. At William P. Hobby Airport (HOU), domestic traffic rose 0.7 percent to 12.1 million passengers in ’16.
• The Houston Airport System handled a total of 442,563 metric tons of air freight in ’16, excluding airmail. Domestic cargo accounted for 52.3 percent of total air freight, while international cargo accounted for 47.7 percent.
• General Aviation: Houston offers excellent general aviation facilities for corporate aircraft. In addition to IAH, HOU and Ellington Airport (EFD), the FAA lists 35 Houston MSA public-use airports and heliports: Austin County (1), Brazoria (8), Chambers (3), Fort Bend (6), Galveston (3), Harris (9), Liberty (2), Montgomery (2), and Waller (1).
AI R C ARRI E RS SE RVI N G TH E H OUSTON AI RPORT SYSTE M
George Bush Intercontinental (IAH)
6 U.S. Carriers
Alaska Airlines, American Airlines, Delta Air Lines, Frontier Airlines, Spirit Airlines, United Airlines
20 International Carriers
Aeromexico, Air Canada, Air China Limited, Air France, Air New Zealand Limited, All Nippon Airways, AVIANCA, British Airways, Emirates, EVA Air, InterJet, KLM Royal Dutch Airlines, Korean Air Lines, Lufthansa,
Qatar Airways, Singapore Airlines, Turkish Airlines, VivaAerobus, Volaris, Westjet
William P. Hobby Airport (HOU)
5 U.S. CarriersAmerican Airlines, Delta Air Lines, JetBlue Airways,
Southwest Airlines, Via Airlines
1 International AirlineSouthwest Airlines
Ellington Airport (EFD)Added to the Houston Airport System in 1984, Ellington serves commercial, general and military aviation. EFD received FAA approval to be a licensed commercial spaceport in 2015.
Source: Houston Airport System, May 2017
34 Houston Facts | 2017
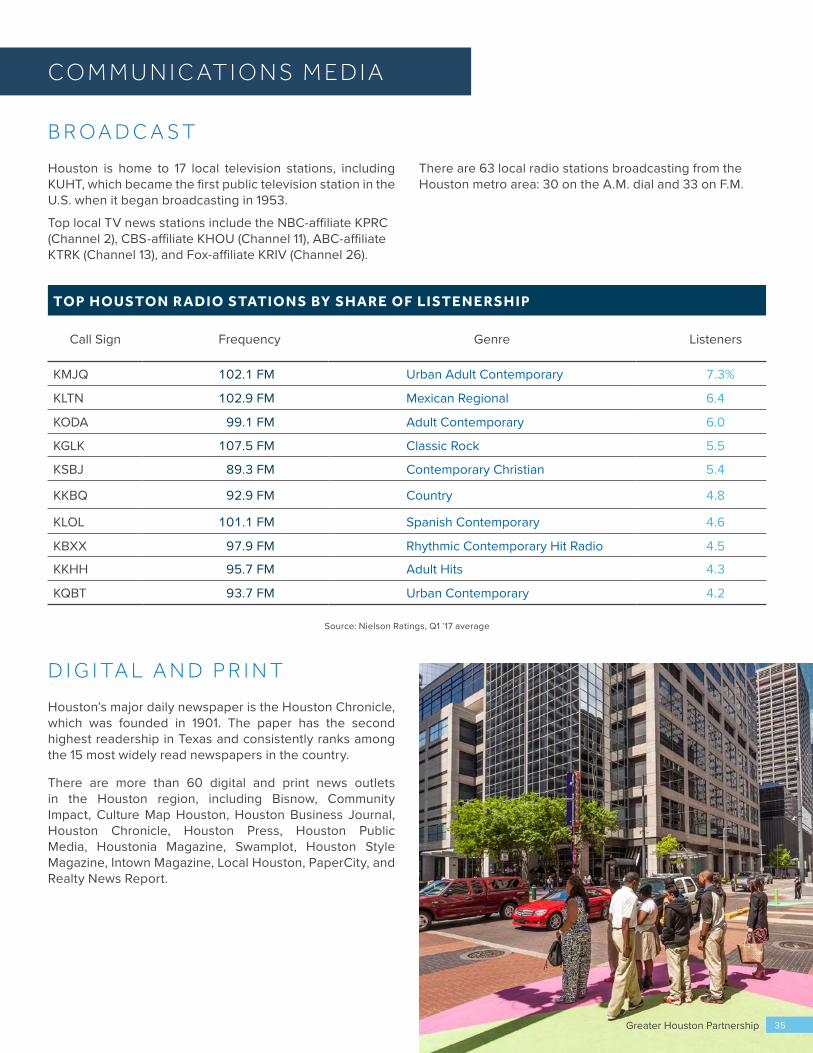
C O M M U N I C AT I O N S M E D I A
B R O A D C A S T
Houston is home to 17 local television stations, including KUHT, which became the first public television station in the U.S. when it began broadcasting in 1953.
Top local TV news stations include the NBC-affiliate KPRC (Channel 2), CBS-affiliate KHOU (Channel 11), ABC-affiliate KTRK (Channel 13), and Fox-affiliate KRIV (Channel 26).
There are 63 local radio stations broadcasting from the Houston metro area: 30 on the A.M. dial and 33 on F.M.
D I G I TA L A N D P R I N T
Houston’s major daily newspaper is the Houston Chronicle, which was founded in 1901. The paper has the second highest readership in Texas and consistently ranks among the 15 most widely read newspapers in the country.
There are more than 60 digital and print news outlets in the Houston region, including Bisnow, Community Impact, Culture Map Houston, Houston Business Journal, Houston Chronicle, Houston Press, Houston Public Media, Houstonia Magazine, Swamplot, Houston Style Magazine, Intown Magazine, Local Houston, PaperCity, and Realty News Report.
TOP H OUSTON R AD I O STATI ON S BY SHARE OF LI STE N E RSH I P
Call Sign Frequency Genre Listeners
KMJQ 102.1 FM Urban Adult Contemporary 7.3%
KLTN 102.9 FM Mexican Regional 6.4
KODA 99.1 FM Adult Contemporary 6.0
KGLK 107.5 FM Classic Rock 5.5
KSBJ 89.3 FM Contemporary Christian 5.4
KKBQ 92.9 FM Country 4.8
KLOL 101.1 FM Spanish Contemporary 4.6
KBXX 97.9 FM Rhythmic Contemporary Hit Radio 4.5
KKHH 95.7 FM Adult Hits 4.3
KQBT 93.7 FM Urban Contemporary 4.2
Source: Nielson Ratings, Q1 ’17 average
35Greater Houston Partnership
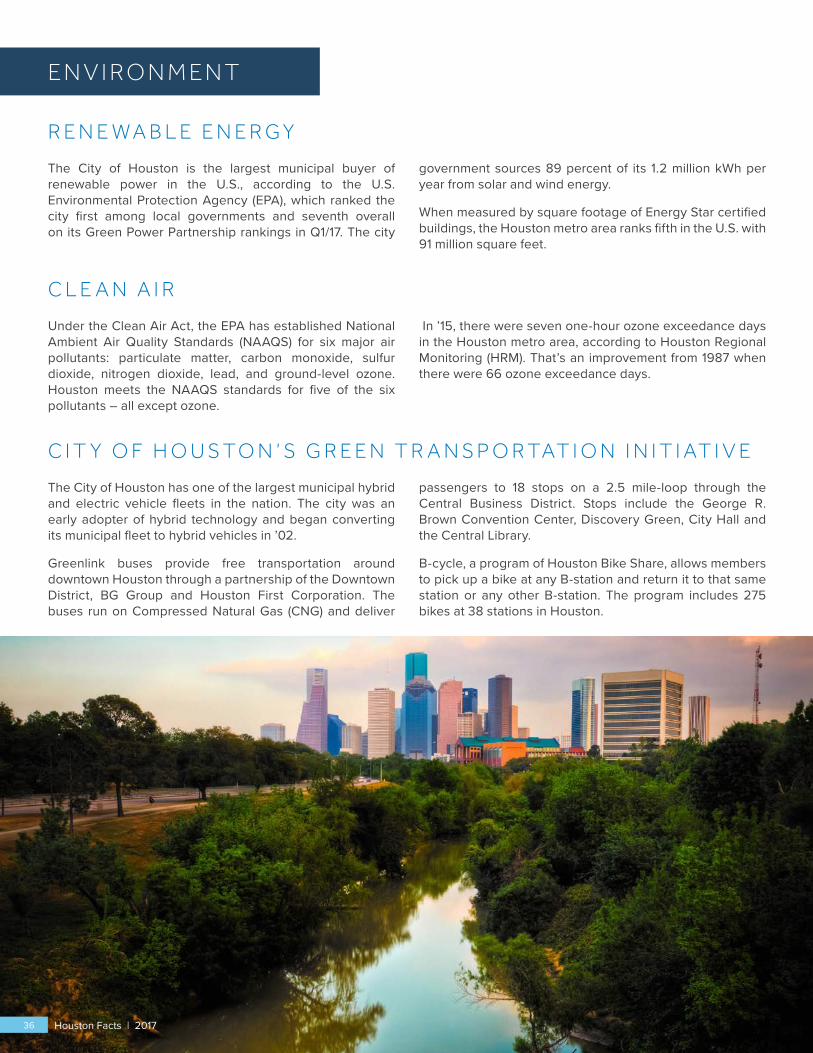
R E N E W A B L E E N E R G Y
The City of Houston is the largest municipal buyer of renewable power in the U.S., according to the U.S. Environmental Protection Agency (EPA), which ranked the city first among local governments and seventh overall on its Green Power Partnership rankings in Q1/17. The city
government sources 89 percent of its 1.2 million kWh per year from solar and wind energy.
When measured by square footage of Energy Star certified buildings, the Houston metro area ranks fifth in the U.S. with 91 million square feet.
C L E A N A I R
Under the Clean Air Act, the EPA has established National Ambient Air Quality Standards (NAAQS) for six major air pollutants: particulate matter, carbon monoxide, sulfur dioxide, nitrogen dioxide, lead, and ground-level ozone. Houston meets the NAAQS standards for five of the six pollutants – all except ozone.
In ’15, there were seven one-hour ozone exceedance days in the Houston metro area, according to Houston Regional Monitoring (HRM). That’s an improvement from 1987 when there were 66 ozone exceedance days.
C I T Y O F H O U S T O N ’ S G R E E N T R A N S P O R TAT I O N I N I T I AT I V E
The City of Houston has one of the largest municipal hybrid and electric vehicle fleets in the nation. The city was an early adopter of hybrid technology and began converting its municipal fleet to hybrid vehicles in ’02.
Greenlink buses provide free transportation around downtown Houston through a partnership of the Downtown District, BG Group and Houston First Corporation. The buses run on Compressed Natural Gas (CNG) and deliver
passengers to 18 stops on a 2.5 mile-loop through the Central Business District. Stops include the George R. Brown Convention Center, Discovery Green, City Hall and the Central Library.
B-cycle, a program of Houston Bike Share, allows members to pick up a bike at any B-station and return it to that same station or any other B-station. The program includes 275 bikes at 38 stations in Houston.
E N V I R O N M E N T
36 Houston Facts | 2017
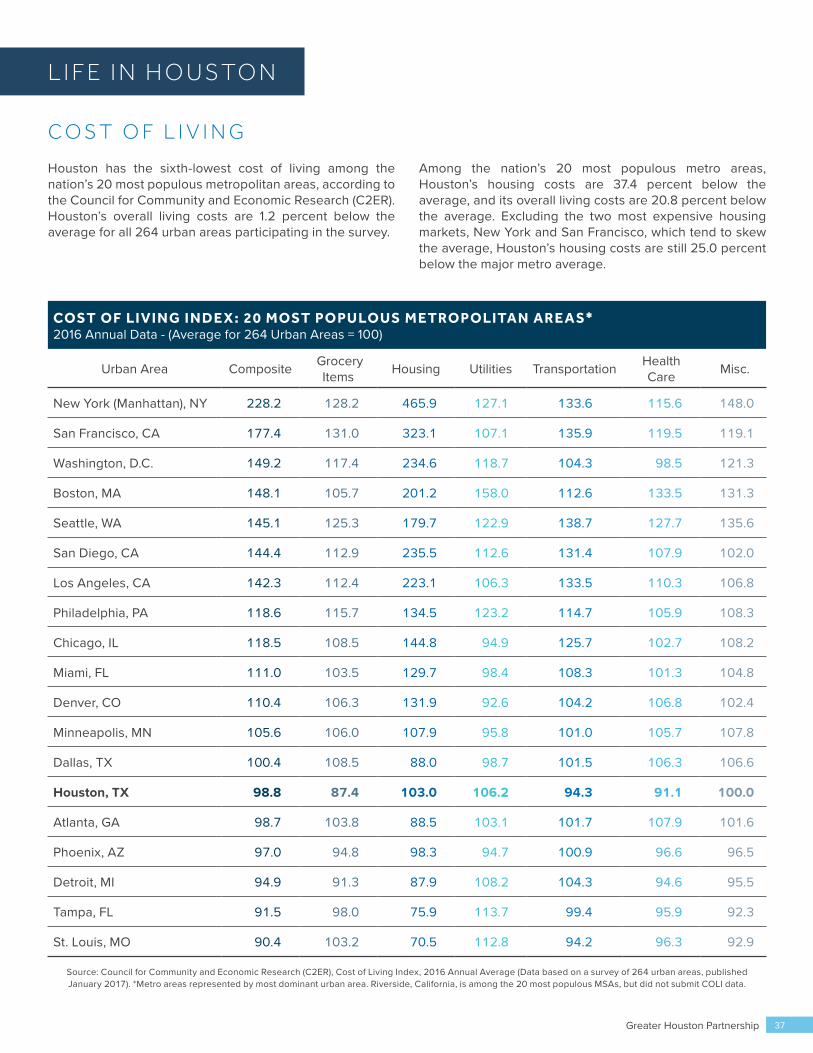
L I F E I N H O U S TO N
C O S T O F L I V I N G
Houston has the sixth-lowest cost of living among the nation’s 20 most populous metropolitan areas, according to the Council for Community and Economic Research (C2ER). Houston’s overall living costs are 1.2 percent below the average for all 264 urban areas participating in the survey.
Among the nation’s 20 most populous metro areas, Houston’s housing costs are 37.4 percent below the average, and its overall living costs are 20.8 percent below the average. Excluding the two most expensive housing markets, New York and San Francisco, which tend to skew the average, Houston’s housing costs are still 25.0 percent below the major metro average.
COST OF LIVI N G I N DE X: 20 MOST POPU LOUS M ETROPOLITAN ARE A S*2016 Annual Data - (Average for 264 Urban Areas = 100)
Urban Area Composite Grocery Items Housing Utilities Transportation Health
Care Misc.
New York (Manhattan), NY 228.2 128.2 465.9 127.1 133.6 115.6 148.0
San Francisco, CA 177.4 131.0 323.1 107.1 135.9 119.5 119.1
Washington, D.C. 149.2 117.4 234.6 118.7 104.3 98.5 121.3
Boston, MA 148.1 105.7 201.2 158.0 112.6 133.5 131.3
Seattle, WA 145.1 125.3 179.7 122.9 138.7 127.7 135.6
San Diego, CA 144.4 112.9 235.5 112.6 131.4 107.9 102.0
Los Angeles, CA 142.3 112.4 223.1 106.3 133.5 110.3 106.8
Philadelphia, PA 118.6 115.7 134.5 123.2 114.7 105.9 108.3
Chicago, IL 118.5 108.5 144.8 94.9 125.7 102.7 108.2
Miami, FL 111.0 103.5 129.7 98.4 108.3 101.3 104.8
Denver, CO 110.4 106.3 131.9 92.6 104.2 106.8 102.4
Minneapolis, MN 105.6 106.0 107.9 95.8 101.0 105.7 107.8
Dallas, TX 100.4 108.5 88.0 98.7 101.5 106.3 106.6
Houston, TX 98.8 87.4 103.0 106.2 94.3 91.1 100.0
Atlanta, GA 98.7 103.8 88.5 103.1 101.7 107.9 101.6
Phoenix, AZ 97.0 94.8 98.3 94.7 100.9 96.6 96.5
Detroit, MI 94.9 91.3 87.9 108.2 104.3 94.6 95.5
Tampa, FL 91.5 98.0 75.9 113.7 99.4 95.9 92.3
St. Louis, MO 90.4 103.2 70.5 112.8 94.2 96.3 92.9
Source: Council for Community and Economic Research (C2ER), Cost of Living Index, 2016 Annual Average (Data based on a survey of 264 urban areas, published January 2017). *Metro areas represented by most dominant urban area. Riverside, California, is among the 20 most populous MSAs, but did not submit COLI data.
Greater Houston Partnership 37

H OUSTON WE ATH E R 2016
Average High
Temperature (˚F)
Average Low Temperature
(˚F)
Total Precipitation
(inches)
January 63.1 41.6 2.2
February 70.9 47.3 2.0
March 75.2 55.6 3.3
April 78.9 59.1 14.4
May 83.1 65.9 7.2
June 90.9 73.4 13.1
July 96.4 77.8 1.1
August 93.4 75.8 10.4
September 91.8 73.5 1.7
October 86.6 63.3 0.1
November 77.9 55.5 2.0
December 66.6 50.6 3.6
Annual 81.2 61.6 61.0
Source: National Oceanic and Atmospheric Administration (NOAA)Note: As recorded at George Bush Intercontinental Airport’s weather station.
W E AT H E R
Temperature• Normal daily maximum temperatures: January 62.5˚ F;
April 79.4˚ F; July 93.7˚ F; October 81.9˚ F
• Normal daily minimum temperatures: January 42.1˚ F; April 58.7˚ F; July 74.0˚ F; October 59.5˚ F
• Record extremes: 109˚F on August 27, 2011 and September 4, 2000; 5˚F on January 18, 1930.
• The Houston MSA lies in a zone with 260-275 frost-free days per year.
Precipitation• Annual average precipitation: 49.2 inches.
• Thunderstorms occur, on average, 62.0 days per year.
• Record monthly rainfall: 19.2 inches in June 2001.
• Highest daily total: 10.3 inches fell on June 26, 1989.
• Houston has had 15 measurable snowfalls since 1939.
• Record monthly snowfall: 2.8 inches in February 1973.
• Record daily snowfall: 2.0 inches in January 1973.
• Annual average relative humidity: 84 percent at midnight; 89 percent at 6:00 a.m.; 58 percent at noon; 64 percent at 6:00 p.m.
Sunshine• In ’16, Houston averaged 73 percent of possible
sunshine annually, ranging from 37 percent in December to 93 percent in September.
• Related annual averages:
• “Clear” on 90.3 days, concentrated in October and November.
• “Partly cloudy” on 114.5 days, typical of June through September.
• “Cloudy” on 160.3 days, common in December through May.
• Fog limiting visibility to a quarter of a mile or less occurs on average 26.3 days per year.
Wind• Prevailing wind in Houston is south-southeasterly at a
mean speed of 7.5 miles per hour.
Houston Facts | 201738
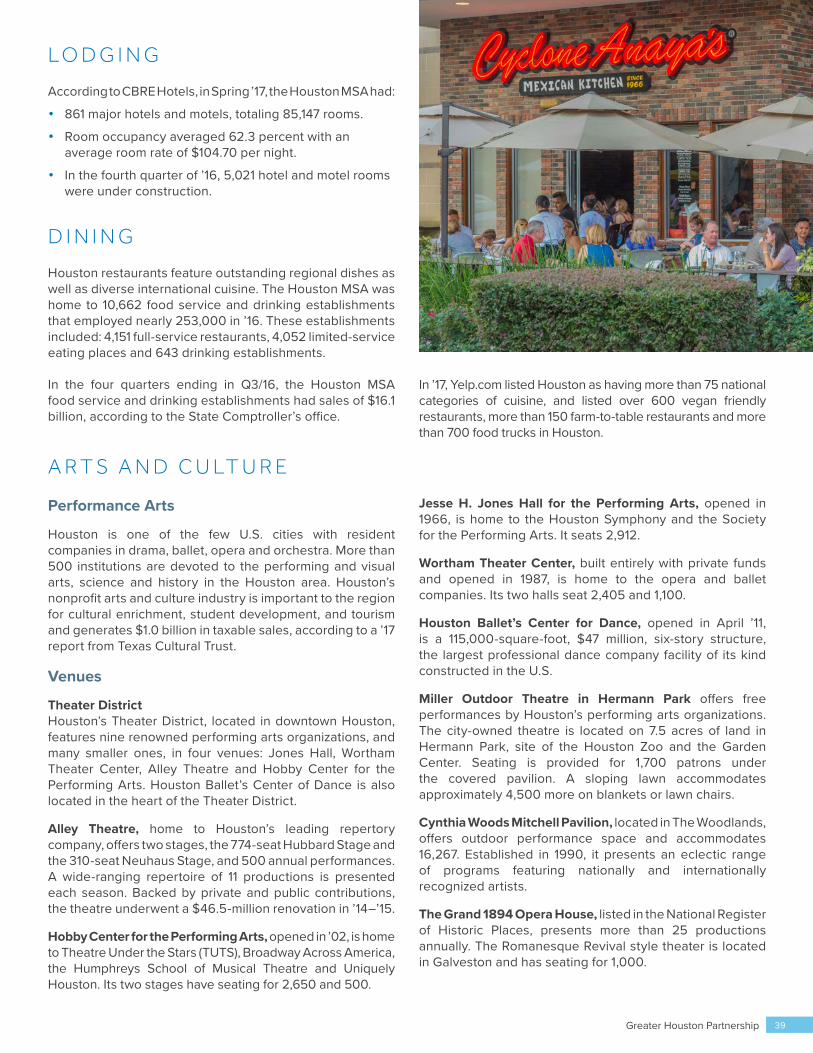
L O D G I N G
According to CBRE Hotels, in Spring ’17, the Houston MSA had:
• 861 major hotels and motels, totaling 85,147 rooms.
• Room occupancy averaged 62.3 percent with an average room rate of $104.70 per night.
• In the fourth quarter of ’16, 5,021 hotel and motel rooms were under construction.
D I N I N G
Houston restaurants feature outstanding regional dishes as well as diverse international cuisine. The Houston MSA was home to 10,662 food service and drinking establishments that employed nearly 253,000 in ’16. These establishments included: 4,151 full-service restaurants, 4,052 limited-service eating places and 643 drinking establishments.
In the four quarters ending in Q3/16, the Houston MSA food service and drinking establishments had sales of $16.1 billion, according to the State Comptroller’s office.
In ’17, Yelp.com listed Houston as having more than 75 national categories of cuisine, and listed over 600 vegan friendly restaurants, more than 150 farm-to-table restaurants and more than 700 food trucks in Houston.
A R T S A N D C U LT U R E
Performance Arts
Houston is one of the few U.S. cities with resident companies in drama, ballet, opera and orchestra. More than 500 institutions are devoted to the performing and visual arts, science and history in the Houston area. Houston’s nonprofit arts and culture industry is important to the region for cultural enrichment, student development, and tourism and generates $1.0 billion in taxable sales, according to a ’17 report from Texas Cultural Trust.
Venues
Theater DistrictHouston’s Theater District, located in downtown Houston, features nine renowned performing arts organizations, and many smaller ones, in four venues: Jones Hall, Wortham Theater Center, Alley Theatre and Hobby Center for the Performing Arts. Houston Ballet’s Center of Dance is also located in the heart of the Theater District.
Alley Theatre, home to Houston’s leading repertory company, offers two stages, the 774-seat Hubbard Stage and the 310-seat Neuhaus Stage, and 500 annual performances. A wide-ranging repertoire of 11 productions is presented each season. Backed by private and public contributions, the theatre underwent a $46.5-million renovation in ’14–’15.
Hobby Center for the Performing Arts, opened in ’02, is home to Theatre Under the Stars (TUTS), Broadway Across America, the Humphreys School of Musical Theatre and Uniquely Houston. Its two stages have seating for 2,650 and 500.
Jesse H. Jones Hall for the Performing Arts, opened in 1966, is home to the Houston Symphony and the Society for the Performing Arts. It seats 2,912.
Wortham Theater Center, built entirely with private funds and opened in 1987, is home to the opera and ballet companies. Its two halls seat 2,405 and 1,100.
Houston Ballet’s Center for Dance, opened in April ’11, is a 115,000-square-foot, $47 million, six-story structure, the largest professional dance company facility of its kind constructed in the U.S.
Miller Outdoor Theatre in Hermann Park offers free performances by Houston’s performing arts organizations. The city-owned theatre is located on 7.5 acres of land in Hermann Park, site of the Houston Zoo and the Garden Center. Seating is provided for 1,700 patrons under the covered pavilion. A sloping lawn accommodates approximately 4,500 more on blankets or lawn chairs.
Cynthia Woods Mitchell Pavilion, located in The Woodlands, offers outdoor performance space and accommodates 16,267. Established in 1990, it presents an eclectic range of programs featuring nationally and internationally recognized artists.
The Grand 1894 Opera House, listed in the National Register of Historic Places, presents more than 25 productions annually. The Romanesque Revival style theater is located in Galveston and has seating for 1,000.
39Greater Houston Partnership
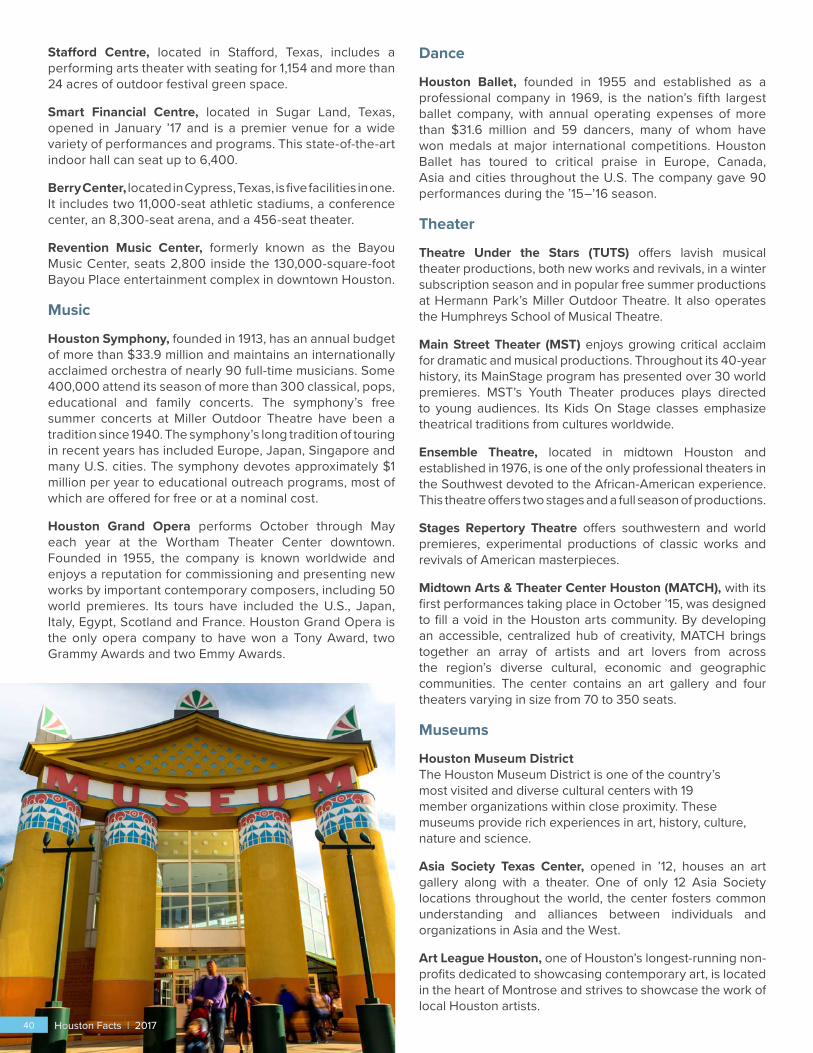
Stafford Centre, located in Stafford, Texas, includes a performing arts theater with seating for 1,154 and more than 24 acres of outdoor festival green space.
Smart Financial Centre, located in Sugar Land, Texas, opened in January ’17 and is a premier venue for a wide variety of performances and programs. This state-of-the-art indoor hall can seat up to 6,400.
Berry Center, located in Cypress, Texas, is five facilities in one. It includes two 11,000-seat athletic stadiums, a conference center, an 8,300-seat arena, and a 456-seat theater.
Revention Music Center, formerly known as the Bayou Music Center, seats 2,800 inside the 130,000-square-foot Bayou Place entertainment complex in downtown Houston.
Music
Houston Symphony, founded in 1913, has an annual budget of more than $33.9 million and maintains an internationally acclaimed orchestra of nearly 90 full-time musicians. Some 400,000 attend its season of more than 300 classical, pops, educational and family concerts. The symphony’s free summer concerts at Miller Outdoor Theatre have been a tradition since 1940. The symphony’s long tradition of touring in recent years has included Europe, Japan, Singapore and many U.S. cities. The symphony devotes approximately $1 million per year to educational outreach programs, most of which are offered for free or at a nominal cost.
Houston Grand Opera performs October through May each year at the Wortham Theater Center downtown. Founded in 1955, the company is known worldwide and enjoys a reputation for commissioning and presenting new works by important contemporary composers, including 50 world premieres. Its tours have included the U.S., Japan, Italy, Egypt, Scotland and France. Houston Grand Opera is the only opera company to have won a Tony Award, two Grammy Awards and two Emmy Awards.
Dance
Houston Ballet, founded in 1955 and established as a professional company in 1969, is the nation’s fifth largest ballet company, with annual operating expenses of more than $31.6 million and 59 dancers, many of whom have won medals at major international competitions. Houston Ballet has toured to critical praise in Europe, Canada, Asia and cities throughout the U.S. The company gave 90 performances during the ’15–’16 season.
Theater
Theatre Under the Stars (TUTS) offers lavish musical theater productions, both new works and revivals, in a winter subscription season and in popular free summer productions at Hermann Park’s Miller Outdoor Theatre. It also operates the Humphreys School of Musical Theatre.
Main Street Theater (MST) enjoys growing critical acclaim for dramatic and musical productions. Throughout its 40-year history, its MainStage program has presented over 30 world premieres. MST’s Youth Theater produces plays directed to young audiences. Its Kids On Stage classes emphasize theatrical traditions from cultures worldwide.
Ensemble Theatre, located in midtown Houston and established in 1976, is one of the only professional theaters in the Southwest devoted to the African-American experience. This theatre offers two stages and a full season of productions.
Stages Repertory Theatre offers southwestern and world premieres, experimental productions of classic works and revivals of American masterpieces.
Midtown Arts & Theater Center Houston (MATCH), with its first performances taking place in October ’15, was designed to fill a void in the Houston arts community. By developing an accessible, centralized hub of creativity, MATCH brings together an array of artists and art lovers from across the region’s diverse cultural, economic and geographic communities. The center contains an art gallery and four theaters varying in size from 70 to 350 seats.
Museums
Houston Museum District The Houston Museum District is one of the country’s most visited and diverse cultural centers with 19 member organizations within close proximity. These museums provide rich experiences in art, history, culture, nature and science.
Asia Society Texas Center, opened in ’12, houses an art gallery along with a theater. One of only 12 Asia Society locations throughout the world, the center fosters common understanding and alliances between individuals and organizations in Asia and the West.
Art League Houston, one of Houston’s longest-running non-profits dedicated to showcasing contemporary art, is located in the heart of Montrose and strives to showcase the work of local Houston artists.
Houston Facts | 201740 Houston Facts | 2017
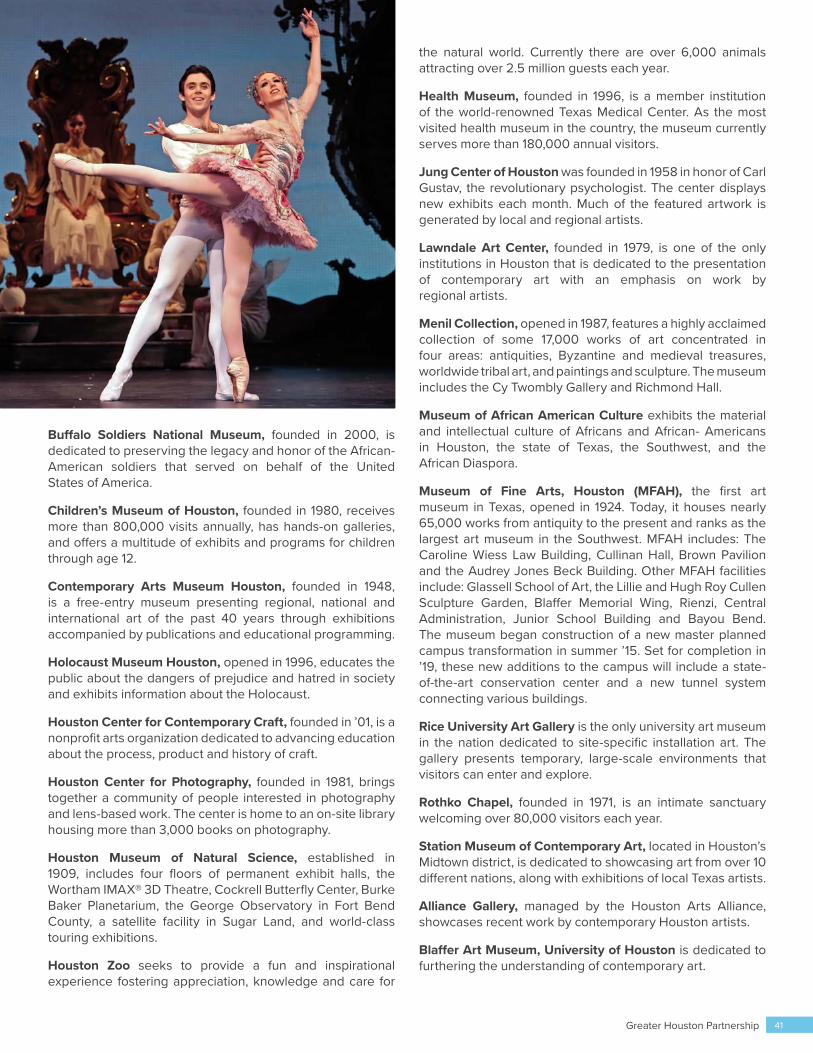
Buffalo Soldiers National Museum, founded in 2000, is dedicated to preserving the legacy and honor of the African-American soldiers that served on behalf of the United States of America.
Children’s Museum of Houston, founded in 1980, receives more than 800,000 visits annually, has hands-on galleries, and offers a multitude of exhibits and programs for children through age 12.
Contemporary Arts Museum Houston, founded in 1948, is a free-entry museum presenting regional, national and international art of the past 40 years through exhibitions accompanied by publications and educational programming.
Holocaust Museum Houston, opened in 1996, educates the public about the dangers of prejudice and hatred in society and exhibits information about the Holocaust.
Houston Center for Contemporary Craft, founded in ’01, is a nonprofit arts organization dedicated to advancing education about the process, product and history of craft.
Houston Center for Photography, founded in 1981, brings together a community of people interested in photography and lens-based work. The center is home to an on-site library housing more than 3,000 books on photography.
Houston Museum of Natural Science, established in 1909, includes four floors of permanent exhibit halls, the Wortham IMAX® 3D Theatre, Cockrell Butterfly Center, Burke Baker Planetarium, the George Observatory in Fort Bend County, a satellite facility in Sugar Land, and world-class touring exhibitions.
Houston Zoo seeks to provide a fun and inspirational experience fostering appreciation, knowledge and care for
the natural world. Currently there are over 6,000 animals attracting over 2.5 million guests each year.
Health Museum, founded in 1996, is a member institution of the world-renowned Texas Medical Center. As the most visited health museum in the country, the museum currently serves more than 180,000 annual visitors.
Jung Center of Houston was founded in 1958 in honor of Carl Gustav, the revolutionary psychologist. The center displays new exhibits each month. Much of the featured artwork is generated by local and regional artists.
Lawndale Art Center, founded in 1979, is one of the only institutions in Houston that is dedicated to the presentation of contemporary art with an emphasis on work by regional artists.
Menil Collection, opened in 1987, features a highly acclaimed collection of some 17,000 works of art concentrated in four areas: antiquities, Byzantine and medieval treasures, worldwide tribal art, and paintings and sculpture. The museum includes the Cy Twombly Gallery and Richmond Hall.
Museum of African American Culture exhibits the material and intellectual culture of Africans and African- Americans in Houston, the state of Texas, the Southwest, and the African Diaspora.
Museum of Fine Arts, Houston (MFAH), the first art museum in Texas, opened in 1924. Today, it houses nearly 65,000 works from antiquity to the present and ranks as the largest art museum in the Southwest. MFAH includes: The Caroline Wiess Law Building, Cullinan Hall, Brown Pavilion and the Audrey Jones Beck Building. Other MFAH facilities include: Glassell School of Art, the Lillie and Hugh Roy Cullen Sculpture Garden, Blaffer Memorial Wing, Rienzi, Central Administration, Junior School Building and Bayou Bend. The museum began construction of a new master planned campus transformation in summer ’15. Set for completion in ’19, these new additions to the campus will include a state-of-the-art conservation center and a new tunnel system connecting various buildings.
Rice University Art Gallery is the only university art museum in the nation dedicated to site-specific installation art. The gallery presents temporary, large-scale environments that visitors can enter and explore.
Rothko Chapel, founded in 1971, is an intimate sanctuary welcoming over 80,000 visitors each year.
Station Museum of Contemporary Art, located in Houston’s Midtown district, is dedicated to showcasing art from over 10 different nations, along with exhibitions of local Texas artists.
Alliance Gallery, managed by the Houston Arts Alliance, showcases recent work by contemporary Houston artists.
Blaffer Art Museum, University of Houston is dedicated to furthering the understanding of contemporary art.
Greater Houston Partnership 41
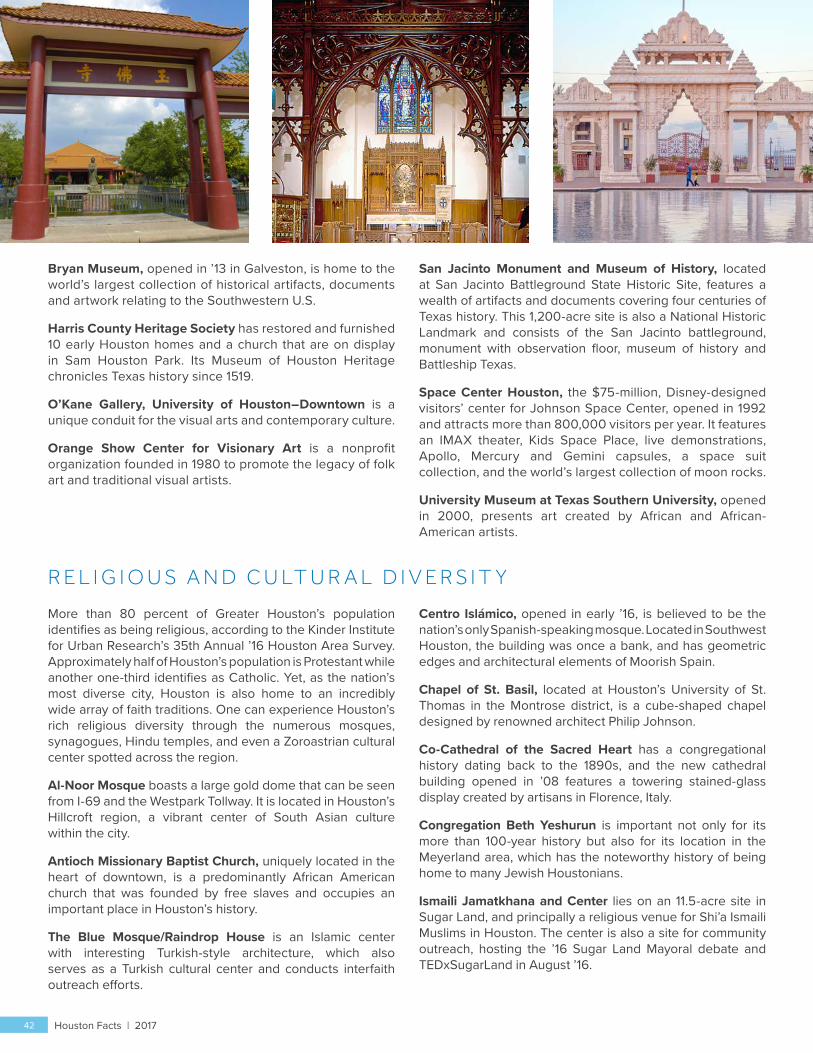
Bryan Museum, opened in ’13 in Galveston, is home to the world’s largest collection of historical artifacts, documents and artwork relating to the Southwestern U.S.
Harris County Heritage Society has restored and furnished 10 early Houston homes and a church that are on display in Sam Houston Park. Its Museum of Houston Heritage chronicles Texas history since 1519.
O’Kane Gallery, University of Houston–Downtown is a unique conduit for the visual arts and contemporary culture.
Orange Show Center for Visionary Art is a nonprofit organization founded in 1980 to promote the legacy of folk art and traditional visual artists.
San Jacinto Monument and Museum of History, located at San Jacinto Battleground State Historic Site, features a wealth of artifacts and documents covering four centuries of Texas history. This 1,200-acre site is also a National Historic Landmark and consists of the San Jacinto battleground, monument with observation floor, museum of history and Battleship Texas.
Space Center Houston, the $75-million, Disney-designed visitors’ center for Johnson Space Center, opened in 1992 and attracts more than 800,000 visitors per year. It features an IMAX theater, Kids Space Place, live demonstrations, Apollo, Mercury and Gemini capsules, a space suit collection, and the world’s largest collection of moon rocks.
University Museum at Texas Southern University, opened in 2000, presents art created by African and African-American artists.
R E L I G I O U S A N D C U LT U R A L D I V E R S I T Y
More than 80 percent of Greater Houston’s population identifies as being religious, according to the Kinder Institute for Urban Research’s 35th Annual ’16 Houston Area Survey. Approximately half of Houston’s population is Protestant while another one-third identifies as Catholic. Yet, as the nation’s most diverse city, Houston is also home to an incredibly wide array of faith traditions. One can experience Houston’s rich religious diversity through the numerous mosques, synagogues, Hindu temples, and even a Zoroastrian cultural center spotted across the region.
Al-Noor Mosque boasts a large gold dome that can be seen from I-69 and the Westpark Tollway. It is located in Houston’s Hillcroft region, a vibrant center of South Asian culture within the city.
Antioch Missionary Baptist Church, uniquely located in the heart of downtown, is a predominantly African American church that was founded by free slaves and occupies an important place in Houston’s history.
The Blue Mosque/Raindrop House is an Islamic center with interesting Turkish-style architecture, which also serves as a Turkish cultural center and conducts interfaith outreach efforts.
Centro Islámico, opened in early ’16, is believed to be the nation’s only Spanish-speaking mosque. Located in Southwest Houston, the building was once a bank, and has geometric edges and architectural elements of Moorish Spain.
Chapel of St. Basil, located at Houston’s University of St. Thomas in the Montrose district, is a cube-shaped chapel designed by renowned architect Philip Johnson.
Co-Cathedral of the Sacred Heart has a congregational history dating back to the 1890s, and the new cathedral building opened in ’08 features a towering stained-glass display created by artisans in Florence, Italy.
Congregation Beth Yeshurun is important not only for its more than 100-year history but also for its location in the Meyerland area, which has the noteworthy history of being home to many Jewish Houstonians.
Ismaili Jamatkhana and Center lies on an 11.5-acre site in Sugar Land, and principally a religious venue for Shi’a Ismaili Muslims in Houston. The center is also a site for community outreach, hosting the ’16 Sugar Land Mayoral debate and TEDxSugarLand in August ’16.
Houston Facts | 201742
Lakewood Church, housed in a former sports arena, is the largest religious congregation in the United States. It is pastored by Joel Osteen and features both English and Spanish language services.
Mohammedi Masjid, Dawoodi Bohra Center Houston is a mosque that is home to members of the Bohra sect of Shi’a Islam, making it another fascinating glimpse into the religious diversity in Houston. The complex features elaborate gardens and Egyptian architecture.
MTO Shahmaghsoudi School of Islamic Sufism, located along Beltway 8, is an elaborate Sufi temple with stunning architecture, along with an energy efficient design featuring solar panels.
Our Lady of Guadalupe Church, founded in 1912 in Houston’s Second Ward, was the first church in Houston to offer services in Spanish.
BAPS Sri Swaminarayan Mandir is a beautiful Hindu temple and cultural center in the Stafford area constructed with stones imported directly from India.
St. Paul’s United Methodist Church, located in the heart of Houston’s Museum District, is renowned for its choir and Neo-Gothic architecture.
Texas Guandi Temple (Buddhist), founded in 1999, is a focal point of Houston Old Chinatown. Many building materials were imported from China.
The Zarthushti Heritage and Cultural Center is a house of worship and cultural community founded by Persian and South Asian Zoroastrians (Parsis) in 1998, and further attests to Houston’s dynamic religious and cultural diversity.
RECU RRI N G EVE NTS AN D FE STIVAL S
January February MarchBlack Heritage Society’s Annual “Original” MLK Birthday Parade
Chevron Houston Marathon
Martin Luther King Jr. Grande Parade
Lunar New Year Festival
Mardi Gras! Galveston
Azalea Trail
Bayou City Art Festival Memorial
Buffalo Bayou Regatta
Houston Holi Festival
Houston Livestock Show and Rodeo
Kite Festival in Hermann Park
Shell Houston Open
April May JuneBP MS 150
Houston Art Car Parade
Houston Barbecue Festival
Houston’s Children’s Festival
Lunar Lantern Festival
Southwest International Boat Show
WorldFest: Houston International Film Festival
Brew Fest
Carnival Houston Show + Parade
Cinco de Mayo Parade and Celebration
Dragon Boat Festival
Houston Polish Festival
Japan Festival
Pasadena Strawberry Festival
Big Texas Beer Fest
Caribbean Heritage Month Festival Houston
Free Press Summer Fest
Juneteenth Freedom Festival
Pride Houston
July August SeptemberFreedom Over Texas Festival
Star-Spangled Salute
Houston International Jazz Festival
Houston Shakespeare Festival
White Linen Night in the Heights
Fiestas Patrias Houston
Fine Arts Fair
Houston Black Heritage Music and Arts Festival
October November DecemberHouston Italian Festival
Original Greek Festival
Texas Renaissance Festival
Wings Over Houston Airshow
Day of the Dead
Interfaith Thanksgiving Service at Rothko Chapel
International Quilt Festival
Lighting Zoo Lights
Nutcracker Market Uptown Houston
Texas Championship Native American Pow Wow
Turkish Festival
Candlelight Tour in the Park
Day for Night
Dickens on the Strand
Fiesta Guadalupana
Mayor’s Official Downtown Houston Holiday Celebration
Greater Houston Partnership 43
C O N V E N T I O N A N D S P O R T S FA C I L I T I E S
George R. Brown (GRB) Convention Center, opened in 1987 and expanded in ’03, offers 1.2 million square feet of exhibition, registration, and meeting space, seven exhibit halls, retractable seating for 6,500, a 31,500-square foot grand ballroom, and a 3,600-seat tiered amphitheater. A grand entryway and four restaurants were added in ’17.
Adjacent to the GRB is the 12-acre Discovery Green and the 1,200-room Hilton Americas hotel. The 1,000-room Marriott Marquis features a rooftop Texas-shaped lazy river, five restaurants, a skybridge to the GRB and the largest ballroom in the city.
Avenida Houston is the newly renovated district in front of the GRB. The renovation, completed in time for Super Blow LI in February ’17, houses new restaurants and an outdoor plaza that connects the GRB to Discovery Green across the street.
NRG Park, which occupies 350 acres and offers 26,000 parking spaces, is among the most versatile sports and meeting complexes in the United States. NRG Park includes the following venues:
• NRG Stadium, a $453-million, 72,220-seat football stadium with a retractable roof, opened in 2002. It is home to the NFL Houston Texans and the Houston Livestock Show and Rodeo.
• NRG Center, a $150-million convention center, opened in ’02. It has 1.4 million square feet, which includes 706,213 square feet of contiguous exposition space and 59 meeting rooms.
• NRG Arena, has 350,000 square feet of exhibit space, an 8,000-seat arena and a 2,000-seat pavilion.
• NRG Astrodome debuted in 1965 as the first full-enclosed sports stadium seating 70,000.
Toyota Center, a $235-million sports arena/entertainment center located downtown, seats 18,300 for basketball and as many as 19,000 for concerts. Opened in ’03, it has covered parking for 2,500 vehicles.
Minute Maid Park, the Houston Astros’ retractable-roof downtown baseball stadium with seating for 40,963, opened in 2000. Renovations to its centerfield seating were completed in time for the ’17 season.
BBVA Compass Stadium, the state-of-the-art, open-air stadium designed to host Dynamo and Dash matches, as well as additional sporting and concert events, opened in May ’12. The 22,000-seat stadium is the first soccer-specific stadium in Major League Soccer located in a city’s downtown district.
Constellation Field, opened in ’12 as home of the Sugar Land Skeeters minor league baseball team. The stadium hosts sporting events as well as concerts. It has a capacity of 7,500 spectators for baseball games and 10,000 for concerts.
TEDCU Stadium, opened in August ’14, is located on the campus of the University of Houston in the Third Ward. It cost $125 million to build. The stadium features 40,000 seats including 5,000 in club and suite areas. Sun and shade studies were also conducted to improve the best level of comfort for Houston fans and not affect student-athletes.
Rice Stadium, opened in 1950, is located in the historic museum district. It seats up to 70,000 fans. It is the location where President John F. Kennedy made his famous challenge to America to place a man on the moon.
Hofheinz Pavilion, home to the University of Houston Cougars men’s and women’s basketball teams, is an 8,500-seat multipurpose arena built in 1969. A $60-million renovation will be completed in 2018, and the facility will become the Fertitta Center, named after UH donor, Tilman Fertitta.
Houston Dash National Women’s
Soccer LeagueBBVA Compass Stadium
Scrap Yard Dawgs National Pro FastpitchScrap Yard Sports Complex
Houston Roller Derby Women’s Flat Track Derby AssociationRevention Music Center
Sugar Land Skeeters Atlantic League of Professional BaseballConstellation Field
Houston AstrosMajor League Baseball’s
American LeagueMinute Maid Park
Houston RocketsWestern Conference in the
National Basketball AssociationToyota Center
Houston TexansAmerican Football Conference in the National Football League
NRG Stadium
Houston DynamoMajor League Soccer’s
Eastern ConferenceBBVA Compass Stadium
PROFESSIONAL TEAMS IN THE HOUSTON MSA
44 Houston Facts | 2017
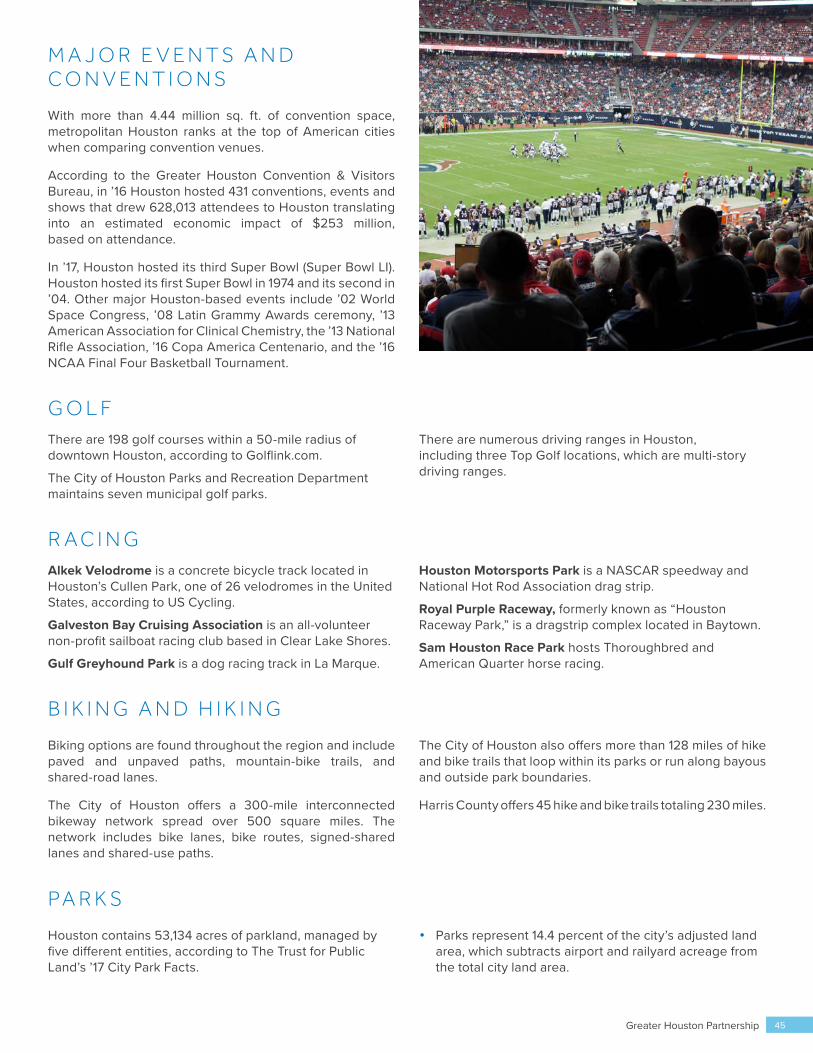
M A J O R E V E N T S A N D C O N V E N T I O N S
With more than 4.44 million sq. ft. of convention space, metropolitan Houston ranks at the top of American cities when comparing convention venues.
According to the Greater Houston Convention & Visitors Bureau, in ’16 Houston hosted 431 conventions, events and shows that drew 628,013 attendees to Houston translating into an estimated economic impact of $253 million, based on attendance.
In ’17, Houston hosted its third Super Bowl (Super Bowl LI). Houston hosted its first Super Bowl in 1974 and its second in ’04. Other major Houston-based events include ’02 World Space Congress, ’08 Latin Grammy Awards ceremony, ’13 American Association for Clinical Chemistry, the ’13 National Rifle Association, ’16 Copa America Centenario, and the ’16 NCAA Final Four Basketball Tournament.
G O L FThere are 198 golf courses within a 50-mile radius of downtown Houston, according to Golflink.com.
The City of Houston Parks and Recreation Department maintains seven municipal golf parks.
There are numerous driving ranges in Houston, including three Top Golf locations, which are multi-story driving ranges.
R A C I N GAlkek Velodrome is a concrete bicycle track located in Houston’s Cullen Park, one of 26 velodromes in the United States, according to US Cycling.
Galveston Bay Cruising Association is an all-volunteer non-profit sailboat racing club based in Clear Lake Shores.
Gulf Greyhound Park is a dog racing track in La Marque.
Houston Motorsports Park is a NASCAR speedway and National Hot Rod Association drag strip.
Royal Purple Raceway, formerly known as “Houston Raceway Park,” is a dragstrip complex located in Baytown.
Sam Houston Race Park hosts Thoroughbred and American Quarter horse racing.
B I K I N G A N D H I K I N G
Biking options are found throughout the region and include paved and unpaved paths, mountain-bike trails, and shared-road lanes.
The City of Houston offers a 300-mile interconnected bikeway network spread over 500 square miles. The network includes bike lanes, bike routes, signed-shared lanes and shared-use paths.
The City of Houston also offers more than 128 miles of hike and bike trails that loop within its parks or run along bayous and outside park boundaries.
Harris County offers 45 hike and bike trails totaling 230 miles.
PA R K S
Houston contains 53,134 acres of parkland, managed by five different entities, according to The Trust for Public Land’s ’17 City Park Facts.
• Parks represent 14.4 percent of the city’s adjusted land area, which subtracts airport and railyard acreage from the total city land area.
Greater Houston Partnership 45
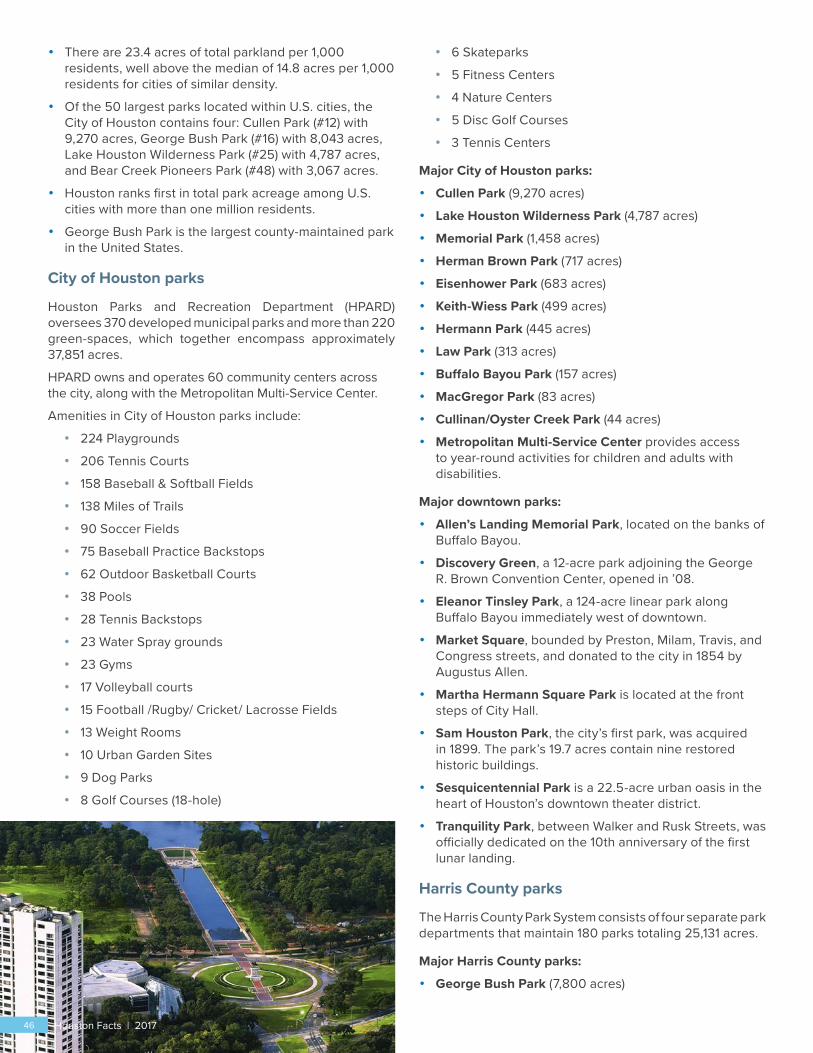
• There are 23.4 acres of total parkland per 1,000 residents, well above the median of 14.8 acres per 1,000 residents for cities of similar density.
• Of the 50 largest parks located within U.S. cities, the City of Houston contains four: Cullen Park (#12) with 9,270 acres, George Bush Park (#16) with 8,043 acres, Lake Houston Wilderness Park (#25) with 4,787 acres, and Bear Creek Pioneers Park (#48) with 3,067 acres.
• Houston ranks first in total park acreage among U.S. cities with more than one million residents.
• George Bush Park is the largest county-maintained park in the United States.
City of Houston parks
Houston Parks and Recreation Department (HPARD) oversees 370 developed municipal parks and more than 220 green-spaces, which together encompass approximately 37,851 acres.
HPARD owns and operates 60 community centers across the city, along with the Metropolitan Multi-Service Center.
Amenities in City of Houston parks include:
• 224 Playgrounds
• 206 Tennis Courts
• 158 Baseball & Softball Fields
• 138 Miles of Trails
• 90 Soccer Fields
• 75 Baseball Practice Backstops
• 62 Outdoor Basketball Courts
• 38 Pools
• 28 Tennis Backstops
• 23 Water Spray grounds
• 23 Gyms
• 17 Volleyball courts
• 15 Football /Rugby/ Cricket/ Lacrosse Fields
• 13 Weight Rooms
• 10 Urban Garden Sites
• 9 Dog Parks
• 8 Golf Courses (18-hole)
• 6 Skateparks
• 5 Fitness Centers
• 4 Nature Centers
• 5 Disc Golf Courses
• 3 Tennis Centers
Major City of Houston parks:
• Cullen Park (9,270 acres)
• Lake Houston Wilderness Park (4,787 acres)
• Memorial Park (1,458 acres)
• Herman Brown Park (717 acres)
• Eisenhower Park (683 acres)
• Keith-Wiess Park (499 acres)
• Hermann Park (445 acres)
• Law Park (313 acres)
• Buffalo Bayou Park (157 acres)
• MacGregor Park (83 acres)
• Cullinan/Oyster Creek Park (44 acres)
• Metropolitan Multi-Service Center provides access to year-round activities for children and adults with disabilities.
Major downtown parks:
• Allen’s Landing Memorial Park, located on the banks of Buffalo Bayou.
• Discovery Green, a 12-acre park adjoining the George R. Brown Convention Center, opened in ’08.
• Eleanor Tinsley Park, a 124-acre linear park along Buffalo Bayou immediately west of downtown.
• Market Square, bounded by Preston, Milam, Travis, and Congress streets, and donated to the city in 1854 by Augustus Allen.
• Martha Hermann Square Park is located at the front steps of City Hall.
• Sam Houston Park, the city’s first park, was acquired in 1899. The park’s 19.7 acres contain nine restored historic buildings.
• Sesquicentennial Park is a 22.5-acre urban oasis in the heart of Houston’s downtown theater district.
• Tranquility Park, between Walker and Rusk Streets, was officially dedicated on the 10th anniversary of the first lunar landing.
Harris County parks
The Harris County Park System consists of four separate park departments that maintain 180 parks totaling 25,131 acres.
Major Harris County parks:
• George Bush Park (7,800 acres)
46 Houston Facts | 2017
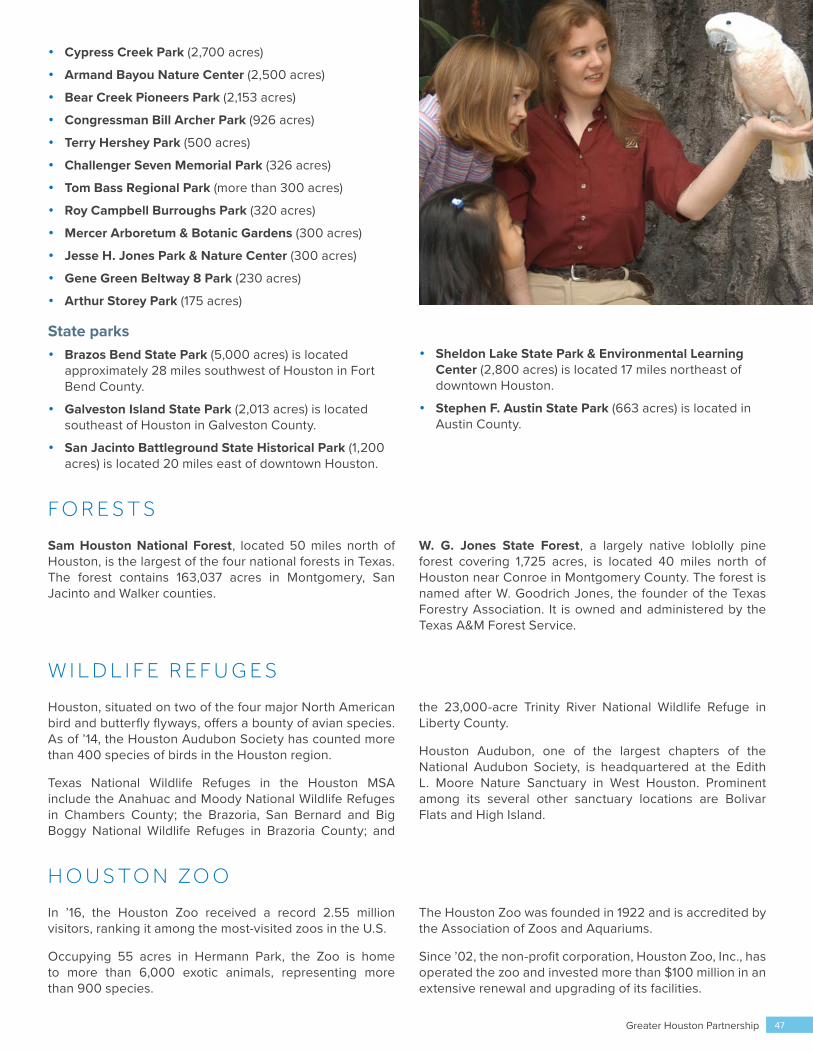
• Cypress Creek Park (2,700 acres)
• Armand Bayou Nature Center (2,500 acres)
• Bear Creek Pioneers Park (2,153 acres)
• Congressman Bill Archer Park (926 acres)
• Terry Hershey Park (500 acres)
• Challenger Seven Memorial Park (326 acres)
• Tom Bass Regional Park (more than 300 acres)
• Roy Campbell Burroughs Park (320 acres)
• Mercer Arboretum & Botanic Gardens (300 acres)
• Jesse H. Jones Park & Nature Center (300 acres)
• Gene Green Beltway 8 Park (230 acres)
• Arthur Storey Park (175 acres)
State parks• Brazos Bend State Park (5,000 acres) is located
approximately 28 miles southwest of Houston in Fort Bend County.
• Galveston Island State Park (2,013 acres) is located southeast of Houston in Galveston County.
• San Jacinto Battleground State Historical Park (1,200 acres) is located 20 miles east of downtown Houston.
• Sheldon Lake State Park & Environmental Learning Center (2,800 acres) is located 17 miles northeast of downtown Houston.
• Stephen F. Austin State Park (663 acres) is located in Austin County.
F O R E S T S
Sam Houston National Forest, located 50 miles north of Houston, is the largest of the four national forests in Texas. The forest contains 163,037 acres in Montgomery, San Jacinto and Walker counties.
W. G. Jones State Forest, a largely native loblolly pine forest covering 1,725 acres, is located 40 miles north of Houston near Conroe in Montgomery County. The forest is named after W. Goodrich Jones, the founder of the Texas Forestry Association. It is owned and administered by the Texas A&M Forest Service.
W I L D L I F E R E F U G E S
Houston, situated on two of the four major North American bird and butterfly flyways, offers a bounty of avian species. As of ’14, the Houston Audubon Society has counted more than 400 species of birds in the Houston region.
Texas National Wildlife Refuges in the Houston MSA include the Anahuac and Moody National Wildlife Refuges in Chambers County; the Brazoria, San Bernard and Big Boggy National Wildlife Refuges in Brazoria County; and
the 23,000-acre Trinity River National Wildlife Refuge in Liberty County.
Houston Audubon, one of the largest chapters of the National Audubon Society, is headquartered at the Edith L. Moore Nature Sanctuary in West Houston. Prominent among its several other sanctuary locations are Bolivar Flats and High Island.
H O U S T O N Z O O
In ’16, the Houston Zoo received a record 2.55 million visitors, ranking it among the most-visited zoos in the U.S.
Occupying 55 acres in Hermann Park, the Zoo is home to more than 6,000 exotic animals, representing more than 900 species.
The Houston Zoo was founded in 1922 and is accredited by the Association of Zoos and Aquariums.
Since ’02, the non-profit corporation, Houston Zoo, Inc., has operated the zoo and invested more than $100 million in an extensive renewal and upgrading of its facilities.
Greater Houston Partnership 47
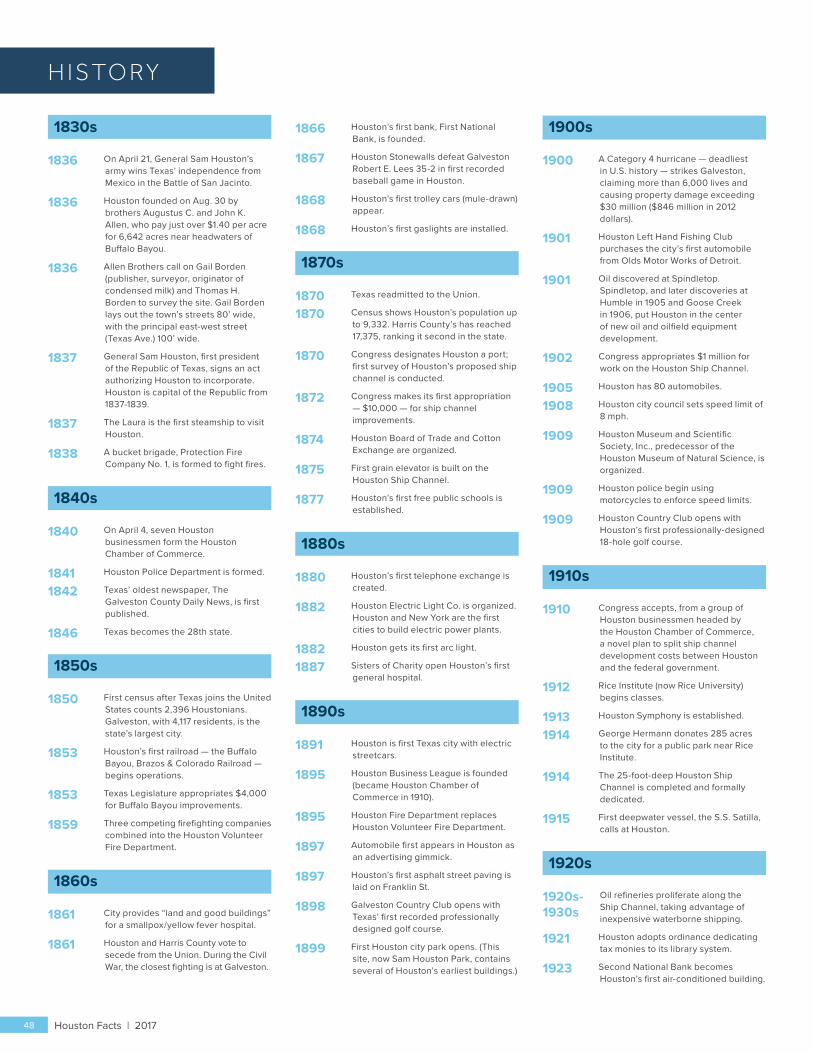
1830s
1836 On April 21, General Sam Houston’s army wins Texas’ independence from Mexico in the Battle of San Jacinto.
1836 Houston founded on Aug. 30 by brothers Augustus C. and John K. Allen, who pay just over $1.40 per acre for 6,642 acres near headwaters of Buffalo Bayou.
1836 Allen Brothers call on Gail Borden (publisher, surveyor, originator of condensed milk) and Thomas H. Borden to survey the site. Gail Borden lays out the town’s streets 80’ wide, with the principal east-west street (Texas Ave.) 100’ wide.
1837 General Sam Houston, first president of the Republic of Texas, signs an act authorizing Houston to incorporate. Houston is capital of the Republic from 1837-1839.
1837 The Laura is the first steamship to visit Houston.
1838 A bucket brigade, Protection Fire Company No. 1, is formed to fight fires.
1840s
1840 On April 4, seven Houston businessmen form the Houston Chamber of Commerce.
1841 Houston Police Department is formed.
1842 Texas’ oldest newspaper, The Galveston County Daily News, is first published.
1846 Texas becomes the 28th state.
1850s
1850 First census after Texas joins the United States counts 2,396 Houstonians. Galveston, with 4,117 residents, is the state’s largest city.
1853 Houston’s first railroad — the Buffalo Bayou, Brazos & Colorado Railroad — begins operations.
1853 Texas Legislature appropriates $4,000 for Buffalo Bayou improvements.
1859 Three competing firefighting companies combined into the Houston Volunteer Fire Department.
1860s
1861 City provides “land and good buildings” for a smallpox/yellow fever hospital.
1861 Houston and Harris County vote to secede from the Union. During the Civil War, the closest fighting is at Galveston.
1866 Houston’s first bank, First National Bank, is founded.
1867 Houston Stonewalls defeat Galveston Robert E. Lees 35-2 in first recorded baseball game in Houston.
1868 Houston’s first trolley cars (mule-drawn) appear.
1868 Houston’s first gaslights are installed.
1870s
1870 Texas readmitted to the Union.
1870 Census shows Houston’s population up to 9,332. Harris County’s has reached 17,375, ranking it second in the state.
1870 Congress designates Houston a port; first survey of Houston’s proposed ship channel is conducted.
1872 Congress makes its first appropriation — $10,000 — for ship channel improvements.
1874 Houston Board of Trade and Cotton Exchange are organized.
1875 First grain elevator is built on the Houston Ship Channel.
1877 Houston’s first free public schools is established.
1880s
1880 Houston’s first telephone exchange is created.
1882 Houston Electric Light Co. is organized. Houston and New York are the first cities to build electric power plants.
1882 Houston gets its first arc light.
1887 Sisters of Charity open Houston’s first general hospital.
1890s
1891 Houston is first Texas city with electric streetcars.
1895 Houston Business League is founded (became Houston Chamber of Commerce in 1910).
1895 Houston Fire Department replaces Houston Volunteer Fire Department.
1897 Automobile first appears in Houston as an advertising gimmick.
1897 Houston’s first asphalt street paving is laid on Franklin St.
1898 Galveston Country Club opens with Texas’ first recorded professionally designed golf course.
1899 First Houston city park opens. (This site, now Sam Houston Park, contains several of Houston’s earliest buildings.)
1900s
1900 A Category 4 hurricane — deadliest in U.S. history — strikes Galveston, claiming more than 6,000 lives and causing property damage exceeding $30 million ($846 million in 2012 dollars).
1901 Houston Left Hand Fishing Club purchases the city’s first automobile from Olds Motor Works of Detroit.
1901 Oil discovered at Spindletop. Spindletop, and later discoveries at Humble in 1905 and Goose Creek in 1906, put Houston in the center of new oil and oilfield equipment development.
1902 Congress appropriates $1 million for work on the Houston Ship Channel.
1905 Houston has 80 automobiles.
1908 Houston city council sets speed limit of 8 mph.
1909 Houston Museum and Scientific Society, Inc., predecessor of the Houston Museum of Natural Science, is organized.
1909 Houston police begin using motorcycles to enforce speed limits.
1909 Houston Country Club opens with Houston’s first professionally-designed 18-hole golf course.
1910s
1910 Congress accepts, from a group of Houston businessmen headed by the Houston Chamber of Commerce, a novel plan to split ship channel development costs between Houston and the federal government.
1912 Rice Institute (now Rice University) begins classes.
1913 Houston Symphony is established.
1914 George Hermann donates 285 acres to the city for a public park near Rice Institute.
1914 The 25-foot-deep Houston Ship Channel is completed and formally dedicated.
1915 First deepwater vessel, the S.S. Satilla, calls at Houston.
1920s
1920s- Oil refineries proliferate along the Ship Channel, taking advantage of inexpensive waterborne shipping.
1921 Houston adopts ordinance dedicating tax monies to its library system.
1923 Second National Bank becomes Houston’s first air-conditioned building.
H I S TO R Y
1930s
Houston Facts | 201748
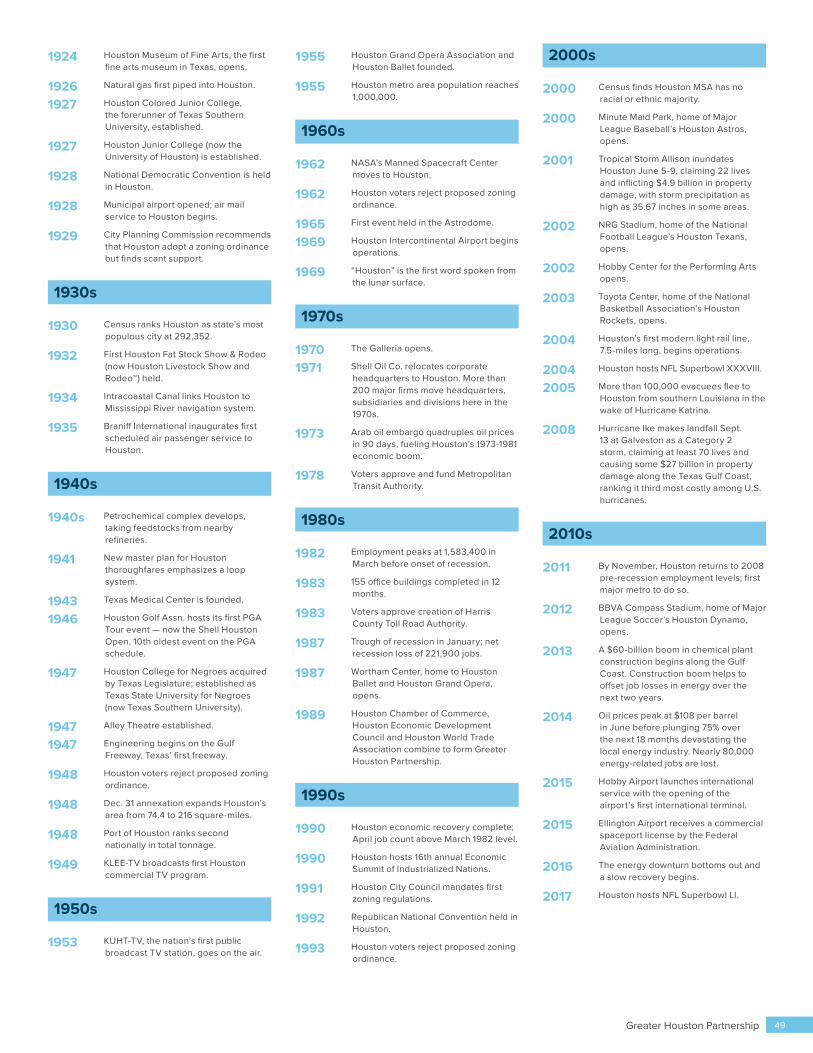
1924 Houston Museum of Fine Arts, the first fine arts museum in Texas, opens.
1926 Natural gas first piped into Houston.
1927 Houston Colored Junior College, the forerunner of Texas Southern University, established.
1927 Houston Junior College (now the University of Houston) is established.
1928 National Democratic Convention is held in Houston.
1928 Municipal airport opened; air mail service to Houston begins.
1929 City Planning Commission recommends that Houston adopt a zoning ordinance but finds scant support.
1930s
1930 Census ranks Houston as state’s most populous city at 292,352.
1932 First Houston Fat Stock Show & Rodeo (now Houston Livestock Show and Rodeo™) held.
1934 Intracoastal Canal links Houston to Mississippi River navigation system.
1935 Braniff International inaugurates first scheduled air passenger service to Houston.
1940s
1940s Petrochemical complex develops, taking feedstocks from nearby refineries.
1941 New master plan for Houston thoroughfares emphasizes a loop system.
1943 Texas Medical Center is founded.
1946 Houston Golf Assn. hosts its first PGA Tour event — now the Shell Houston Open, 10th oldest event on the PGA schedule.
1947 Houston College for Negroes acquired by Texas Legislature; established as Texas State University for Negroes (now Texas Southern University).
1947 Alley Theatre established.
1947 Engineering begins on the Gulf Freeway, Texas’ first freeway.
1948 Houston voters reject proposed zoning ordinance.
1948 Dec. 31 annexation expands Houston’s area from 74.4 to 216 square-miles.
1948 Port of Houston ranks second nationally in total tonnage.
1949 KLEE-TV broadcasts first Houston commercial TV program.
1950s
1953 KUHT-TV, the nation’s first public broadcast TV station, goes on the air.
1955 Houston Grand Opera Association and Houston Ballet founded.
1955 Houston metro area population reaches 1,000,000.
1960s
1962 NASA’s Manned Spacecraft Center moves to Houston.
1962 Houston voters reject proposed zoning ordinance.
1965 First event held in the Astrodome.
1969 Houston Intercontinental Airport begins operations.
1969 “Houston” is the first word spoken from the lunar surface.
1970s
1970 The Galleria opens.
1971 Shell Oil Co. relocates corporate headquarters to Houston. More than 200 major firms move headquarters, subsidiaries and divisions here in the 1970s.
1973 Arab oil embargo quadruples oil prices in 90 days, fueling Houston’s 1973-1981 economic boom.
1978 Voters approve and fund Metropolitan Transit Authority.
1980s
1982 Employment peaks at 1,583,400 in March before onset of recession.
1983 155 office buildings completed in 12 months.
1983 Voters approve creation of Harris County Toll Road Authority.
1987 Trough of recession in January; net recession loss of 221,900 jobs.
1987 Wortham Center, home to Houston Ballet and Houston Grand Opera, opens.
1989 Houston Chamber of Commerce, Houston Economic Development Council and Houston World Trade Association combine to form Greater Houston Partnership.
1990s
1990 Houston economic recovery complete; April job count above March 1982 level.
1990 Houston hosts 16th annual Economic Summit of Industrialized Nations.
1991 Houston City Council mandates first zoning regulations.
1992 Republican National Convention held in Houston.
1993 Houston voters reject proposed zoning ordinance.
2000s
2000 Census finds Houston MSA has no racial or ethnic majority.
2000 Minute Maid Park, home of Major League Baseball’s Houston Astros, opens.
2001 Tropical Storm Allison inundates Houston June 5-9, claiming 22 lives and inflicting $4.9 billion in property damage, with storm precipitation as high as 35.67 inches in some areas.
2002 NRG Stadium, home of the National Football League’s Houston Texans, opens.
2002 Hobby Center for the Performing Arts opens.
2003 Toyota Center, home of the National Basketball Association’s Houston Rockets, opens.
2004 Houston’s first modern light rail line, 7.5-miles long, begins operations.
2004 Houston hosts NFL Superbowl XXXVIII.
2005 More than 100,000 evacuees flee to Houston from southern Louisiana in the wake of Hurricane Katrina.
2008 Hurricane Ike makes landfall Sept. 13 at Galveston as a Category 2 storm, claiming at least 70 lives and causing some $27 billion in property damage along the Texas Gulf Coast, ranking it third most costly among U.S. hurricanes.
2010s
2011 By November, Houston returns to 2008 pre-recession employment levels; first major metro to do so.
2012 BBVA Compass Stadium, home of Major League Soccer’s Houston Dynamo, opens.
2013 A $60-billion boom in chemical plant construction begins along the Gulf Coast. Construction boom helps to offset job losses in energy over the next two years.
2014 Oil prices peak at $108 per barrel in June before plunging 75% over the next 18 months devastating the local energy industry. Nearly 80,000 energy-related jobs are lost.
2015 Hobby Airport launches international service with the opening of the airport’s first international terminal.
2015 Ellington Airport receives a commercial spaceport license by the Federal Aviation Administration.
2016 The energy downturn bottoms out and a slow recovery begins.
2017 Houston hosts NFL Superbowl LI.
Greater Houston Partnership 49

PA RT N E RS H I P TO W E R | 7 0 1 AV E N I D A D E L AS A M E R I CAS, S U I T E 9 0 0 | H O U STO N , T X 7 7 0 1 0 | H O U STO N .O R G
AU ST I N | B R A ZO R I A | C H A M B E RS | FO RT B E N D | G A LV E STO N | H A R R I S | L I B E RT Y | M O N TG O M E RY | SA N JAC I N TO | WA L K E R | WA L L E R