Embed Size (px)
Citation preview
This PDF is a selection from an out-of-print volume from the National Bureau of Economic Research
Volume Title: Commodity Flow and Capital Formation, Volume 1
Volume Author/Editor: Simon Kuznets
Volume Publisher: NBER
Volume ISBN: 0-87014-033-7
Volume URL: http://www.nber.org/books/kuzn38-1
Publication Date: 1938
Chapter Title: Part III: The Spread in 1929 between the Values of Finished Commodities at Producers'Prices and at Their Cost to Ultimate Consumers
Chapter Author: Simon Kuznets
Chapter URL: http://www.nber.org/chapters/c4744
Chapter pages in book: (p. 161 - 214)
PART III
THE SPREAD IN 1929 BETWEEN THE VALUES OF
FINISHED COMMODITIES AT PRODUCERS' PRICES
AND AT THEIR COST TO ULTIMATE CONSUMERS
Preface
1 Allocation of Producers' Sales and Transportation Charges 164
2 Flow to and from Wholesale Trade 166
3 Flow to and from Retail Trade 169
4 Sources of Disparity between Totals of Retail Sales Derived by the
Mark-up and the Volume-of-Sales Methods 171
5 Conclusion 176
Basic Tables III—! to 111—5 S 177—2 13

a
PART IIITHE SPREAD IN 1929 BETWEEN THE VALUES OF FINISHEDCOMMODITIES AT PRODUCERS' PRICES AND AT THEIR COST
TO ULTIMATE CONSUMERS
PREFACE
THE next step in the analysis is the transitionfrom the annual volumes of finished commoditiesand servicing, destined for domestic consumption,at prices charged by producers, to the same vol-umes measured at their cost to ultimate consum-ers. Servicing and repairs rendered by manufac-turing establishments do not call for treatment atthis stage; it may be assumed that their value, asshown in the Census of Manufactures and esti-mated by us for intercensal years, representslargely their cost to the ultimate holders of thedurable goods.' But in order to measure the flowof finished commodities at the cost to ultimateconsumers we must first estimate the value oftransportation and distributive charges. Since, aswill appear presently, these charges are substantial,their inclusion produces important quantita-tive effects on the final estimates.
The large spread between producers' pricesand the cost to ultimate consumers makes it es-pecially deplorable that data relevant to this stageof the analysis are meager. The first comprehen-sive census of distribution for the United Stateswas taken for 1929; in addition to wholesale andretail trade, the distribution of sales of manu-facturing plants was surveyed. A second censusof wholesale and retail trade was taken for1933, but its extensive, and particularly its in-tensive, coverage were less than that attained for1929. Another census of trade was taken for 1935,but the results were not published until 1937 andwere not available at the time the major part of
1 This statement does not hold of the servicing of consumers'durable goods, which may be done through a middleman andfor which, therefore, manufacturers' charges do not neces-sarily represent total cost to consumers. But servicing of con-sumers' durable commodities accounts for a minor fraction ofthe total value of servicing and repairs rendered by manufac-turing establishments.
the present study was being prepared. For otheryears the data on distributive trades are scatteredand restricted samples, which become sparser asone goes back to the early years of the post-Warperiod. For transportation charges the only com-prehensive data available for many commoditiesare freight charges on steam railroads, publishedby the Interstate Commerce Commission for 1928,1930, 1933, and with somewhat less detail for1922.
The contrast between the wealth of informa-tion for 1929 and the other years in the periodmade it advisable to arrange the transition fromthe flow of finished commodities in producers'prices to their flow at the cost to ultimate con-sumers in three steps, presented in Parts III, IV,and V. Part III is confined to 1929 data andattempts to measure, on the basis of the ex-tensive information available for that year, thetotal spread between the value of finished com-modities at producers' prices and -their value atthe cost to ultimate consumers. Part IV is a sur-vey of the available information on transporta-tion and distributive charges for years other than1929, primarily with a view to establishingwhether these charges, when expressed as per-centages of costs or final values, are variable overtime; and if so, what changes they have under-gone during the period studied. Part V combinesthe information in Parts III and IV, and arrivesby a series of approximations at an estimate of theannual value of finished products flowing into do-mestic consumption, at cost to their ultimate con-sumers.
Part III traces the flow of finished commoditiesfrom their producers through the channels of dis-tributive trade during 1929. First, the distributionof sales of finished commodities by their pro-
[163]
PART IIIducers is studied: the portion going directly to ul-timate consumers, to retailers or to wholesalers isestimated. Second, the flow to and from whole-sale trade is analyzed: the flow to wholesale tradefrom producers or imports is compared with theflow from wholesale trade into exports, directsales to ultimate consumers, or sales to retailers.Third, the flow to and from retailers is studied:the flow to them from producers and wholesalersis compared with the flow from them to ultimateconsumers. Fourth, we juxtapose the total flow offinished commodities into domestic consumption,at producers' prices, against the total movementto ultimate consumers, at the cost to them, flowingeither from producers or wholesalers, or from re-tail trade; and thus obtain the total spread in 1929between the value of finished commodities at thedoor of the producing establishment and theircost to ultimate recipients.
1 ALLOCATION OF PRODUCERS' SALES ANDTRANSPORTATION CHARGES
Beginning the analysis at the point where fin-ished commodities leave manufacturing or otherproducing establishments, it is essential, as thefirst step, to observe into what channels they godirectly. Since finished products alone are dealtwith, those which move to other establishments tobe used in business processes are omitted. On theother hand, finished products that do reach ulti-mate consumers, via either wholesale or retailtrade, or both, are included. Thus producers' salesof finished commodities are divided into those go-ing directly to ultimate consumers, to wholesaletrade, to retail trade.
This apportionment, presented in Table III—!,is based largely upon the Census data on the dis-tribution of sales of manufacturing plants. Forthe small groups of non-manufactured finishedcommodities, except coal, we assumed that allsales went through wholesale channels; for coal,the availability of specific retail prices made itunnecessary to trace the flow in the several stagesof commodity circulation. The values in column2 are of total domestic sales, not of finished com-modities, sold and imported, destined for domes-tic consumption. The assumption that the phaseof commodity circulation represented by importsand exports takes place exclusively at the whole-sale stage 2 was forced upon us by the apportion-2 This is true with the exception of two minor groups—pleas-tire water-craft and aircraft—for which wholesale and retailchannels could not be segregated. In Tables 111—3 and 111—4the wholesale and retail stages are combined, and the entriesmade in Table 111—4 under retail trade.
ment in Distribution of Sales ofPlants, which applies to total sales rather than tsales adjusted for imports and exports. Butassumption does little violence to the facts. Wholesale trade being defined, as it is in the subsequenanalysis, to include not only wholesalers prope:but also manufacturers' wholesale branches anall agents and brokers, it may safely be state.that the preponderant part of imports and cxports of finished commodities goes throughchannels of wholesale trade.
The application of the apportionment in Distribution of Sales to total sales by minor cornmodity groups encounters two sets of problemsThe first is the proper segregation of thegoing directly to ultimate consumers. The placof the Census category 'sales to household consumers' in our classification is clear. But the category 'sales to industrial and other large consumers' may combine items that in our classificatiorappear as finished and unfinished commoditiesIn a few industries in which the product was obviously finished, e.g., trunks, valises, and bagsthis category was considered by us assales to ultimate consumers. In a few other industries whose products were mixed, all sales incategory that were in excess of the total valueunfinished as estimated by us in Part I were alscconsidered finished. Note A to Table 111—1all the industries whose sales to industrial ancother large consumers were interpreted in thesctwo ways.
The second set of problems arose because arexactly corresponding allocation of manufacturing plant sales could not be found in thefor every commodity. The Census allocationsindustries, and within some industries for important subdivisions, were matched as closely apossible with our commodity estimates, butsome commodities no exactly corresponding a!location of sales could be found. For these cornmodities we used the allocation of sales forclosely related commodity or industry; andseveral of these, unpublished Census allocationsThese adjustments are described in detail inB to Table III—!, which presents also the variouother modifications of industry andtotals made to obtain the best allocation of salefor each commodity or group of commodities.commodities for which approximate allocationhad to be used, i.e., excluding those adjustedthe use of unpublished Census data and suciproper modifications of the totals as exclusion 0interplant transfers, were not numerous; and, S(
[164]
TOTAL SPREAI) IN 1929
far as the commodity group totals were concerned,could not affect greatly the reliability of the ap-portionment (except for a few minor commoditygroups, such as cotton goods, and printing andpublishing).
The general results of the apportionment canbe summarized for the major commodity classtotals and the grand totals in columns 2, 3, 4, and5 of Table 111—I. Of the total sales of finishedproducts, 37.7 billion dollars, the larger portion,about 56 per cent, went to wholesale trade; slightlyless than one-third to retail dealers; and onlyabout 12 per cent directly to ultimate consumers.But this apportionment varied significantly amongthe major commodity classes. In the perishable,seinidurable, and consumers' durable classes, onlya small fraction, from 4 to 6 per cent, went directlyto ultimate consumers; in the producers' durablethis share was nearly one-half. The large share ofdirect sales to ultimate consumers among pro-ducers' durable commodities is obviously a re-flection of the large average size of purchases inthis field and of the prevalence of production onorder from the ultimate holder of the product.The share going to wholesale trade is largest inthe perishable group, almost 70 per cent—a reflec-tion of the great task the distributive system hasto assemble the multitude of products from thenumerous groups of scattered producers and dis-tribute them to the numerous groups of scattered,small retail units.3 The share going through whole-salers is also appreciable in the consumers' durablegroup, 55 per cent (as against less than 40 percent in semidurable and about 40 per cent inproducers' durable), largely because a major por-tion of the output of such industries as the pas-senger car, auto parts, radio, electric refrigerator,is handled through wholesalers or manufacturers'wholesale branches. The share of retail trade waslargest in the semidurable group—slightly overone-half—a reflection of the importance of largeretail units such as department stores and chainstores. Thus, the differences in the percentage al-location of total sales among the four major com-modity classes, as shown in Table III—!, reflectclearly the well-known differences among thesefour groups of finished products in the organiza-tion of the distributive system.
In measuring transportation charges, the esti-mates for which have been added in columns 6, 7,
S This result was partly due also to our assumption that all thefinished non-manufactured farm products (fruits and vege-tables, dairy and poultry) except those consumed on farms wentthrough wholesale channels.
8, and 9 of Table III—! to the value of finishedproducts flowing from their producers into thethree channels distinguished, the lack of ade-
data forced upon us several assumptions.First, the cost of transportation was measured onlyat those stages of commodity circulation whichhave the producing establishment as their start-ing point. Jn the subsequent analysis, wheneverthe commodity moves from wholesalers to retail-ers, or from wholesalers or retailers to ultimateconsumers, it was assumed that the cost of trans-portation was covered in the wholesale and retailmark-ups. Since in reality only part of this trans-portation cost is covered in wholesale and retailmark-ups, this assumption undoubtedly led to anunderestimate of the final totals of transportationcosts. Second, the transportation charges coveredin Table Ill—I are based on railroad rates forcarload lots. Since the rates do not include thecost of trucking from the railroad station to theconsignee; since they are lower than the rates forless than carload lots; and since they are appliedto the transportation of commodities moved bytruck, the rates foi which are, if anything, some-what higher than those for railroad transport, thetotal charges included are again somewhat lessthan the actual cost of moving the commoditiesfrom the producing establishments to the whole-salers, retailers, or ultimate consumers.4 On theother hand, the resulting undervaluation of trans-portation costs may be partly offset if the commod-ity volume not reported in the available data ontransportation charges is subject to less extensivetransportation than the commodity volume in-cluded in the data.
The specific transportation charges added tothe values for the several minor commoditygroups in Table III—! were based on the railroadfreight charges for 1928, as published by the Inter-state Commerce Commission. The matching ofthese charges, available for several of the more im-portant commodities, with our commodity classi-fication could be only approximate; it is describedin detail in the note to Table IV—!. The total ad-dition to the value of finished commodities in1929 was approximately 2 billion dollars, or about5.3 per cent of the value at the door of the pro-ducing establishments. The percentage added foreach minor commodity group was the same foreach channel of trade, there being no way todistinguish between the size of transportation
4 Water transportatiorl, which is often less costly than railroad.accounts for an insignificant fraction of the movement of fin-ished commodities.
[165]
PART 111
charges for flowing into the differ-ent channels.
2 FLOW TO AND FROM WHOLESALE TRADE'Wholesale trade, taken as a unit, receives the com-modities that it sells from either domestic pro-ducers or foreign sources. The value of domesticsales of finished commodities going in 1929 towholesale trade is estimated in Table 111—1, and isshown, with transportation charges added, in col-umn 8. Since, as stated above, it is assumed thatall importing and exporting is via wholesaletrade, the addition of all finished imports for 1929yields the foreign share of the flow of finishedcommodities to domestic wholesalers. The de-tailed commodity classification of imports and ex-ports, and the totals by minor commodity groups,are given in Table 111—2. entries in column2 of Table 111—3 are, accordingly, the sum ofthe sales in 1929 by producing establishments towholesalers,' of the transportation charges on thesecommodities, and of the value of finished com-modities imported. The total flow in 1929 of fin-ished commodities to wholesale trade was esti-mated at some 23 billion dollars.
In tracing what occurred to this commodityvolume in the channels of wholesale trade cog-nizance must be taken of two possibilities. First,it may have been retained completely or in partwithin the channels of wholesale trade, eventhough passed along from one wholesaler to thenext. If inventories were to be measured uniformlyat cost, total inventories would be increased bythe original value of commodities retained pluswhatever mark-up wholesalers realize when theysell to other wholesalers. Second, this volume ofcommodities flowing to wholesale trade may besold in toto or in part by wholesalers to retailersand consumers, i.e., units outside wholesale trade;the value will then be increased by the total whole-sale mark-up. Given the apportionment of thesesales by wholesale trade, taken as a unit, it will bepossible to trace further the movement of at leasta part of them through the channels of retail trade.
Since the ultimate aim of Part III is to measurethe. spread in 1929 between the values of finishedcommodities at producers' prices and at their costto consumers, the first task is to estimate the por-tion of this spread accounted for by the passage offinished commodities through wholesale tradechannels. This estimate, like that of the spread ac-counted for by the passing of commodities throughretail trade, may be obtained by one of two meth-ods. In the first, the flow of commodities into the
hands of a given group of traders is compared withits outflow, i.e., with sales by that group. This cornpauson, when supplemented by information onchanges in inventories, yields the gross margin be-tween the cost of the commodities to the tradeuand the values received by them at 'the point olsale. In the second method information is obtaineddirectly on the usual mark-up added and realizedby the given group of traders in return for han-dling the commodities. When these mark-ups, usu-ally available in the form of percentages to thecost of commodities, are multiplied by the costvalues of the commodities sold the result is thetotal spread added to these values. The firstmethod, which can be designated the volume-of-sales method, requires data on sales and inven-tories for the commodity for which it is
deemed important to obtain the specific spreads.The second method, the mark-up, requires ade-quate and detailed data on the percentage mark-upapplied and realized on the various commoditygroups.
In choosing between the two methods the firstconsideration is the necessity of measuring thespread for the minor commodity groups. To applythe first method, data are needed on sales andchanges in inventories in 1929 by minor com-modity groups. Such specific data on changes ininventories are lacking, since inventories are re-ported in the Census of Distribution only as ofDecember 31, 1929. But since changes in inven-tories are likely to be a minor factor as comparedwith the volume of sales, the lack of these particu-lar data is not a serious obstacle to the applicationof the first method. The difficulty lies primarilyin obtaining sales by the specific commoditygroups analyzed in Table 111—3. The commodityclassification of sales in the Census of WholesaleDistribution distinguishes some 91 divisions (seeU. S. Summary, Table 13). But of these, over 50are either for completely unfinished commoditiesor for mixed with a preponderance of unfinished,while the other 40 odd are so allocated that onlya few of our minor commodity groups can be pro-vided with even an approximate counterpart. Ofthese 40 odd commodity classes in the Census,which represent largely finished commodities, fully9 belong to the single group of food products, and5 to the single group of dry goods and notions;leaving an obvious shortage of commodity divi-sioris to be matched with the remaining 42 'groupsin our classification. The application of the vol-urne-of-sales method at the wholesale stage would,therefore, have meant a significant and undesir-
[166]
TOTAL SPREAD IN 1929
able reduction in the number of commoditygroups in the classification used in. this report. Itwas, therefore, applie4 only to the very few groupsin our classification for which some approximatecounterpart could be found in the commodity di-visions of the wholesale census.
But even for these few groups, for which entrieswill be found in columns 3 and 4 of Table 111—3,there are further obstacles to ascertaining netvalue of wholesale sales of finished commodities.The first obstacle; viz., the failure of the com-modity breakdown of wholesale sales to cover allsales in the various lines of trade, is minor sincethe percentage of coverage is high (running inmost branches of trade over 95 per cent). The ad-justment can easily be made by raising the dollarvalues by a corresponding percentage to bringthe coverage up to 100 per cent; the values inTable 111—3, column 3, are the result of this minoradjustment or projection. The second difficultyis, however, much more significant and not easilysolved in a satisfactory fashion. Wholesalers maysell to other wholesalers, and the allocation ofwholesale sales in 1929 by channels of destinationdoes not distinguish sales to other wholesalersfrom sales to retailers. Hence, in the analysis,which requires measurement of sales by whole-sale trade, taken as a unit and exclusive of dupli-cations, only by excluding from the flow of goodssales by certain types of wholesaler on the assump-
that they were selling exclusively to otherwholesalers was it possible to adjust for duplica-tion in sales. Accordingly, sales by all agents andbrokers were omitted as constituting duplications.As a matter of fact, agents and brokers may sell toretailers and industrial consumers; on the otherhand, wholesalers, other than brokers and agents,may sell to other wholesalers. If we judge by thepartial evidence in the Census of Wholesale Dis-tribution for 1933, the duplication representedby wholesalers' sales to other wholesalers exceedssales by agents and brokers to retailers or indus-trial household consumers. Our adjustment forduplication, by the exclusion of sales by agentsand brokers, was therefore probably inadequate.The third difficulty was that the commodityclasses taken from the wholesale trade census stillcontain fractions of unfinished commodities. Con-sequently, after duplication of sales was correctedfor, the sales values were adjusted for sales to in-dustrial consumers. The two adjustments weremade as follows: (1) Commodity sales were ad-justed for duplication by the exclusion of sales byagents and brokers. (2) The volume of sales by
lines of trade (U. S. Summary of Wholesale Distri-bution, Table 3) was corrected for duplication byapplying to it the percentage of downward scalingobtained from step 1. (3) The percentage that thevolume of sales to industrial consumers consti-tuted of the adjusted sales Was computed for thevarious lines of trade. (4) The percentages thusobtained for one branch of trade or more dealingprimarily in commodities belonging to each ofthe several minor commodity groups were appliedto the sales as measured in step 1, yielding the es-timated sales of the commodity group to industrialconsumers. (5) The volume obtained as a resultof step 4 was subtracted from the volume obtainedas the result of step I, to obtain the fully adjustedentries in Table 111—3, column 4. The details ofthe commodity classification, as well as a detaileddescription of the three types of adjustmtht, arepresented in Note A to Table 111—3.
The lack of correspondence between the com-modity classification of the Census of WholesaleDistribution and, our commodity classification ac-counts for the sparsity of entries in columns 3 and4 of Table 111—3; and the inadequacy of our cor-rection for duplication bars any confidence in thetotals in column 4. Indeed, when these totals arecompared with those in column 2, the mark-up isso strikingly different from the mark-up indicatedby other information as to cast grave doubt uponany one or all three magnitudes: sales to whole-salers and imports in column 2, sales by whole-salers in column 4, or the mark-up in column 6.Apparently, the source of error is the estimate incolumn 4; in any event, the application of thevolume-of-sales method to wholesale trade is, withexisting data, definitely a failure. For two minorcommodity groups alone, both relatively unim-portant (furs and fur goods, and office and storeequipment), could the total in column 4, uponbeing checked with the results of the mark-upmethod, be adopted as the final estimate of thenet volume of wholesale sales in column 7. Forall other minor commodity groups the mark-upmethod had to be used.
The largest portion of the mark-up in trade isaccounted for by operating expenses, the differencebetween total mark-up and operating expensesbeing net profits or losses of trading establish-ments. Data on operating expenses are avail-able for 1929 in considerable detail, reported inthe census of both wholesale and retail trade. Thedata are for branches or lines of trade, however,not for commodity groups. Two steps must there-fore he taken to pass from operating expense data
[167]
PART IIIto mark-up percentages: (1) the lines and types oftrade selected must be those whose sales are dom-inated by the commodities of a given commodity.group, so as to allow for the treatment of operat-ing expenses that are applicable to our severalminor commodity groups; (2) an approximatefraction must be added to operating expenses toallow for net profits during the year. Note B toTable 111—3 shows in detail how the various linesand types of trade have been combined to deriveoperating expense ratios for each minor com-modity group, and what additions were made tothese percentages to account for net profits. Thenet profit ratio is based on that reported to theIncome Tax unit by corporations in wholesaletrade. The over-all rate of 1.1 per cent is modifiedfrom branch to branch according to the differencesin profit ratios as revealed by sample studies.
The total mark-up (Table III—3, column 6)amounted to 14.9 per cent, varying but slightlyfrom one major commodity group to another. Re-calculated on the basis of the value of sales, thismark-up amounts to a gross margin of 13.0 percent (14.9/114.9 multiplied by 100). This marginseems at first too large, since for all wholesale tradethe percentage of total expenses to volume of saleswas in 1929 only 8.85 (see U. S. Summary, Table 4,p. 85). But the latter ratio is for all wholesale trade,including sales of unfinished commodities andduplicating sales by agents and brokers. If salesand expenses are taken for wholesalers alone andfor manufacturers' sales branches, the two groupsof wholesale trade that together account for thepreponderant share of non-duplicating sales of fin-ished commodities, the totals become 44.4 billiondollars for sales (instead of 69.3 for all wholesaletrade) and 4.84. billion for expenses (instead of6.14 billion for all wholesale trade). The operatingexpense ratio thus rises at once from 8.85 to 10.9per cent. If, further, from sales and expenses ofwholesalers alone, sales and expenses in the majorlines of unfinished commodities (farm products,n.e.c,, farm supplies except machinery and equip-ment, leather and leathergoods except gloves andshoes, lumber and building materials, forest prod-ucts except lumber, iron and steel scrap and otherwaste products, metals and minerals except petro-leum and scrap, plumbing and heating equipment
5 See National Income, 1929—1932, Sen. Doc. 124, 73d Cong., 2(1Sess. (Washington, 1934), pp. 223—4. This profit rate is, per-haps, too low, since operating expenses do not include com-pensation of proprietors, which in closely-held corporationsmay have been deducted as compensation of officers. However,the attempt here was to be as conservative as possible in ap-plying the mark-up method.
and supplies) are subtracted, the operatingratio rises from 10.9 to 11.9 per cent. Thusover-all mark-up for wholesale trade in finisheccommodities in Table 111—3 checks with the operating expense ratio in the Census of WholesaliDistribution, as was predetermined by the methocof estimating the mark-up.
The application of the percentages of mark-uiin 111—3, column 6, to the values in columr2 yields the estimated sales of finished productby wholesalers in column 7. The dollar values ircolumn 7 represent not actual sales wholesalersbut the, finished commodities at wholesalethat the wholesalers would have sold had
the finishedbought by them in 1929 (and no other commodities), at the mark-up commonly realized that yearBut if our estimates in columns 2 and 6 are correct,' those in column 7 cannot be materially different from the actual net sales of finished cornmodities, excluding duplication, since wholesaliinventories are relatively small and theirconstitute properly but a minor fraction of totalsales. According to our calculations in Part Vtotal inventories of• finished commodities heldwhOlesalers at the end of 1929 amounted, oncost basis, to about 2.3 billion dollars, or about ifper cent of the total cost of goods flowing to wholesalers. Hence, even an appreciable change in inventories would cause but a small adjustment incolumn 7, were it to express actual rather thanhypothetical sales. And the estimated change inthese inventories (Part V) amounted to an increascof less than 30 million dollars.
The cost of . finished commodities reaching'domestic wholesalers in 1929 was 23.2 billiondollars; their value at wholesale prices, 26.fbillion dollars, was not far from the actual valuof sales of finished commodities by wholesahtrade. In the next task, to trace the various chan
• nels into which this volume of commoditieshave three possibilities must be distinguished: (1) exports; (2) direct sales to domestiultimate consumers; (3) sales to retailers (TabliIII--3, columns 8, 9, and 10).
Exports which, according to our assumption,are a part of wholesale sales alone, are taken fronithe detailed analysis in Table 111—2, and theiiderivation need not be described here. Sales direcito ultimate consumers are estimated on theof the Census of Wholesale Distribution, whichhas for the various lines of trade a category entitled 'sales to ultimate consumers (at retail)'The main problem was that encountered above
[168]
TOTAL SPREAD IN 1929
ii estimating sales to industrial consumers (in ad-usting entries in column 4 for the fraction repre-ented by unfinished commodities): the difficultyf applying the quantities shown for total salesincluding duplications) by branches of trade toret sales by commodity groups. The solution ofhis difficulty is described in Note A to Table III—, and repeats most of the steps listed above in theLerivation of sales to industrial consumers. Sincehis adjustment for duplication is, perhaps, made-Luate, the percentages of direct sales to ultimateonsumers, being calculated on a somewhat exag-;erated base, are perhaps a little too low, and hencehe estimates in column 9 also may be too low.-lowever, in view of the small importance of theselirect sales by wholesalers to ultimate consumers,he error has little significance in the final esti-nates of the cost of commodities to ultimate con-umers.
Exports and direct sales by wholesalers to ulti-nate consumers measured, the flow to retailers,he most important part of wholesale sales, is ob-ained by subtraction (column 10). It will be seenrom the grand totals of columns 8, 9, and 10 that
and direct sales to ultimate consumers ac-:ount for only abQut 8 and 9 per cent, respectively,f total sales, the other 83 per cent being sales toetailers. But just as in the distribution of sales
manufacturing plants, the percentage of directales to ultimate consumers is particularly high inhe producers' durable group, slightly over 60er cent. Similarly, the share of exports in this
is also much larger than in the other major:ommodity classes, about 23 per cent as comparedvith percentages ranging from 8 for the consuin-
durable class to about 5 for perishable. Inhese three classes of consumers' finished products
and direct sales to ultimate consumers areunimportant, and the percentage of
ales to retailers is high, accounting for from over)0 per cent in perishable and semidurable to over
per cent in consumers' durable.
3 FLOW TO AND FROM RETAIL TRADEcommodities flow into the channels of
etail trade either directly from the producing es-ablishinents or from wholesale trade. The first)art of this flow (Table 111—1, column 6), the cost
finished commodities, including transportation:harges, flowing from producers directly to re-ailers, was 12.5 billion dollars in 1929. The sec-md part of this flow (Table 111—3, column 10),he value of finished commodities flowing from
trade into retail channels, was 22.2 bil-
lion dollars in 1929. Thus of the total, 34.6 billion(Table 111—4, column 1) slightly more than one-third came directly from producers and slightlyless than two-thirds from wholesale trade.
The application of the volume-of-sales methodto the analysis of wholesale trade proved unsuc-'cessful, largely because the commodity classifica-tion of wholesale sales was inadequate, and to ad-,just for duplicated sales from one wholesale unitto another was difficult. For retail trade, both ob-stacles are much less formidable. The commodityclassification of retail sales, with some 200 com-modity divisions, is more detailed, and it applieslargely to finished commodities and constructionmaterials, excluding the large volume of other un-finished products handled by wholesale trade.Duplicated sales from one retailer to other retail-ers are a very minor fraction of total retail salesand, being largely in unfinished commodities, maybe disregarded ifl our analysis. Hence, an attemptwas made to apply the volume-of-sales method ex-tensively, and to compute, from the Census, retailsales in 1929 for each minor commodity group,excluding, of course, those whose products do notpass through retail channels.
The commodity breakdown of sales, as givenin the Census of Retail Distribution for each stateand for the country as a whole, is based upon amuch less substantial sample of total sales than isthe corresponding commodity coverage of whole-sale sales, owing partly to the fact that commodityreports were not requested from stores with an-nual sales less than $60,000, or from stores inplaces with less than 10,000 population; partly tothe fact that many stores from which such infor-mation was requested could not provide it. Thecoverage varied from one line of trade to another,was naturally much higher in the larger than inthe smaller cities and country places, and variedfrom state to state depending largely upon the con-centration of population (see Census of Disirthu-tion, Vol. 1, Retail Distribution, Part 2, pp. 18—20). But since the percentage of coverage ran inall states from 25 to 40, the sample may be con-sidered sufficiently large to give an approximateallocation of total sales by commodities. The com-modity classification in the Census was matchedwith our classification by minor commodity groups(for the details see the first part of Note A toTable 111—4). It was possible to retain all theminor commodity groups, except that groups 15and 36, household furniture, and office furnitureand equipment, had to be combined; and that forsome 91 the small groups in the producers' durable
[169]
PART IIIclass sales could not l)e computed from the Census.
Table 15 of the Census shows both for the coun-try as a whole and for each state the percentage ac-counted for by each commodity in the total sales ofeach group of stores (each kind-of-business group).The state percentages were weighted by thevolume of sales, i.e., they were computed byadding together total sales of all stores that re-ported sales of the given commodity, adding thesales of the given commodity by all these stores,and then computing the percentage of the lattertotal to the former. So far as the stores reportingcommodity coverage were a substantial sample,and their commodity breakdown typical of allstores in the state, the percentages thus obtainedenabled us to estimate for the state the approxi-mate sales of each commodity. This was done inaccordance with Census instructions: "Go throughthe separate sections of the table and list everykind of business in which the commodity appears,setting down opposite each the percentages shownin the second column (i.e., the column giving thepercentage distribution of total sales of each kind-of-business group among the various commodi-ties). From Table 1 set down opposite each itemthe total sales of all stores of that kind. Apply thepercentage to the total sales of the kind of store towhich it applies, thereby determining the approxi-mate sales of the commodity in each kind of store.Adding these dollars together, the total is the ap-proximate total sales of the commodity in allstores in the city (or state), except only the kind-of-business classifications which are not reportedin Table 15" [i.e., the table which shows the com-modity breakdown] (ibid., p. 22). We have ap-plied this procedure, state by state for all states,for most durable and semidurable commodities(Table 111—4, column 4). The only element of es-timating was in measuring commodity sales in thekind-of-business classification not reported inTable 15 of the Census. For these (but a minorfraction of the total sales of each commodity) wetook the commodity percentage in the same kind-of-business classification from a contiguous statein which this classification did appear in Table 15.
The laboriousness of this procedure restrictedits use, and suggested the advisability of using thecommodity percentages for the country as a whole.These national averages were computed, however,by a method different from that used for the stateaverages. ". . . the Bureau has averaged the sev-eral State percentages in each geographic division• . . and then has averaged the divisional aver-ages to produce the national figures. . • . No
workable weighting could be devised" (Census oDistribution, Vol. I, Retail Distribution, Part 1p. 958). Furthermore, the percentages are characterized as 'consistently reported' and 'variouslreported'. For each geographic division the cornmod ities reported in all states, or all states but oncwere listed as 'consistently reported'. If the cornmodity was omitted in more than one state, nohaving been reported sufficiently to yield a statpercentage, the item was listed in its geographidivision as 'variously reported', and instead ofsingle percentage, the highest and lowest percentages for the state were given. Similarly, in thetional averages, a consistently reported commodit)with a single percentage, was one reported consistently in all nine, or in eight of the nine gecgraphic divisions. If more than one geographic division listed the commodity as variously reportedit was so characterized in the national
a single percentage, two were giventhe highest and the lowest among those geographidivisions in which it was consistently reportedFinally, the, national averages differed from thstate averages in another respect: the latter did nccover the commodity breakdown of the sales bnational chains, while "the national figure is thaverage of the divisional averages, unweightecplus the chain ratios, weighted in the proportio'which chain sales bear to independent store sales(ibid., p. 958).
In applying the national averages, i.e., theage percentage accounted for by each commoditin the total sales of each groupstores, the oniy estimating necessary was in obtaliing a single percentage for the variously reporteentries. The practice was' to obtain the geometrimean of each pair of percentages reported, sunmate these means for all the commodities various]reported for a given group of stores, and then radjust each single mean proportionately sotheir sum equaled the single percentage given iCensus Table 15 for all the variously reported conmodities in the given group of stores. Inspectioof Census Table' 15 (ibid., pp. 959—68) showsthis adjustment affected but a minor fractionthe total sales of each commodity.°
The estimates of retail sales by minor conmodity groups, resulting from this applicationthe national averages, are given in Table III—column 3. For the minor commodity groups fwhich both state and national averages were useithe difference, in most lines, appears to be sligh
6 An additional minor adjustment was made in estimating tcommodity breakdown of sales by general stores.
[170]
TOTAL SPREAD IN 1929
a large absolute vol-irne of sales, the discrepancy rarely runs above 3
cent of either total. It may, therefore, be as-umed that the estimates of retail sales for minorommodity groups in column 3, for which the la-
procedure based on state percentages hasLot been followed, are good approximations to theotals that would have been yielded by a more de-ailed study of the Census of Retail Distribution.
The main purpose of the estimates of retailales by minor commodity groups is to enable uso measure the specific spreads between the cost ofommodities to retail todtimate consumers. The next task is, therefore,o compare the totals in columns 3 and 4 withhose in column 2, compute the spread representedy the difference and observe whether its magni-ude is corroborated by the information, other-vise available, on the amount of the retail mark-ip. This information, summarized in column 7 of['able 111—4, is based largely upon the same type
source that was utilized in order to measure the)revalhng mark-up in wholesale trade. Note B to['able 111—4 provides specific indications of theources of the operating expense ratios and mark-ips, and the nature of the allowance for net profit.
Comparison of columns 2, 3, 4, 5, 6, and 7 re-reals in most of the minor commodity groups aack of agreement between our estimates of the:ost of the commodities flowing to retailers, theales of these commodities by retailers as estimatedrom the Census of Retail Distribution, and thenark-up as based upon fairly extensive informa-ion provided in it as well as in other sources. Thislisagreetnent is especially marked in the perish-ible class, but it is frequent also among the corn-nodity groups in the sernidurable and the twolurable classes. In these three last-mentioned,
seven minor commodity groups were foundor which estimated retail sales could be accepteds consonant with the cost of goods flowing to re-ailers raised by the usual retail mark-up. Whilehese results indicate a much greater validity ofhe volume-of-sales method in retail then in whole-ale trade, the disparity between retail sales as de-ived from the Census and the hypothetical vol..irne of retail sales based upon the addition of theisual mark-up to the cost of commodities flowingo retailers is too large to be dismissed withoutnalysis. The sources of this disparity must be as-ertained, and, if possible, measured, before theroper basis for measuring the retail spread in929 can be determined.
4 SOURCES OF DISPARITY BETWEENTOTALS OF RETAIL SALES DERIVED
BY THE MARK-UP AND THEVOLUME-OF-SALES METHODS
If we take the minor commodity groups for whichretail sales could be estimated by the two methods,i.e., excluding minor commodity groups 5a and Sb(manufactured fuels and petroleum products, andcoal) and those small groups among producers'durable commodities for which no retail saleswere indicated, the two totals are 37.57 billiondollars (column 3), and 45.45 billion (column8). The disparity, 7.88 billion dollars, or approxi-mately 19 per cent of the average o. the two totals,is too large to be due to differences in precision ofthe two methods. It must obviously arise from thelack of comparability between the two totals, orsubstantial shortages and excesses of coverage inone -
We analyze first the discrepancy arising fromtwo aspects of the lack of strict comparabilityof the two totals. First, the total based on themark-up method takes no account of changes ininventories, since it measures not the actual salesby retailers but what would have been their saleshad they sold all and only the commodities flow-ing from production and imports during 1929,and had wholesalers sold to retailers the usualproportion of all the commodities flowing to themfrom production and imports. But part of this flowto wholesalers and retailers might have been re-tained by either the former or the latter, and hencebe reflected in increased inventories. Approximatecalculations in Part V show that during 1929wholesale inventories of finished commodities in-creased some 25 million dollars, and retail in-ventories of finished commodities increased almost120 million dollars. Adding to these increases thecorresponding average wholesale and retail mark-tips we obtain the retail value of these increases ininventories of roughly 200 million dollars.
The second aspect of lack of comparability isthat finished commodities, whose cost was esti-mated in Table 111—4, column 2, may have passedto ultimate consumers outside the channels in-cluded by the Census of Distribution under retailtrade. Several types of outside channel suggest
7 The remaining 11.5 billion dollars which goes to make upthe Census total of 49.1 billion is composed of the followingcommodities as estimated by the use of national averages: coal,0.97; manufactured fuel and lighting products, 2.03; buildingmaterials, 3.41; fertilizer, 0.98; flowers and wreaths, 0.16;0.01; sign shops, 0.01; servicing, 1.17; second-hand merchandise,1.52; miscellaneous, not classified, 0.78; goods sold to otherdealers, 0.51
[171]
PART IIIthemselves. First, some finished farm products,such as fruits and vegetables, and dairy and poul-try products, may be sold by farmers directly toultimate consumers. In the calculation above, itwas assumed that the finished part of these com-modity groups was all sold to wholesalers. Hencethe major part (95 per cent, see Table Ill—i, linefor Minor Commodity Group 1) is assumed to goalso to retailers and swell sales as estimated inTable 111—4, column 8. All direct sales of suchproducts by farmers appear, with appropriatetransportation charges and mark-ups, as retailsales in column 8. Since the Census of Retail Dis-tribution does not, of course, cover direct sales byfarmers, they do not appear in any of the estimatesin column 3 or 4. It is difficult to evaluate the re-tail value of these direct sales of finished productsby farmers in 1929. According to the estimate inTable TI—i, the total value, at producers' prices,of fruits and vegetables, and dairy and poultryproducts, sold by farmers was 4,068 million dollarsin 1929, of which 2,781 were finished and 1,287unfinished. If it is assumed that 10 per cent of thesales of finished products were direct by farmersto ultimate consumers, and the cumulated trans-portation charges and wholesale and retail mark-ups are added, the result is a retail value of thesedirect sales of some 500 million dollars.
Second, the Census of Retail Distribution doesnot cover hotels that serve meals and dispense alsosome other perishable and even semidurable prod-ucts (e.g., tobacco and accessories, novelties). Thevalue of meals alone amounted to 358 milliondollars in 1929, and it may be added as appearinginthe estimates based on the mark-up method butnot in those based on the method(see Census of Distribution, Vol. I, Retail Distri-bution, Part 1, p. 14).
Third, a considerable group of the commoditiesconsidered in Table 111-4 as going into retailchannels may have been bought and dispensed toultimate consumers through such servicing busi-nesses as cleaning and dyeing establishments,laundries, barber shops, hotels (excluding meals),by public utility enterprises (selling gas and elec-tric appliances to ultimate consumers), and by in-dividuals in professions such as medicine (dis-
pensing drugs). The commodities thus distributedwere not considered unfinished, so long as theirnature was such that they could have just as easilypassed to ultimate consumers through retail tradeproper. When a wholesaler sells hair tonics to abarber, he probably classifies them as sales to aretailer; and hence the estimates, based on the
[1
mark-up method, include all these commodities a
their approximate retail value. No such sales arpear in the Census of Retail l)istrihution. Ur,fortunately, data that would throw light on thivolume of finished commodities passing to finaconsumers through these service, public utilit)or professional establishments are not available.A round sum of 500 million dollars for them doenot seem unreasonable, although it is, of courscmerely a guess.
Finally, it is to be ,doubted that the Census oRetail Distribution covered retail unitswithout a fixed place of business, such as huckstenpeddlers, and itinerant vendors. No definite information on this score is given in the Census fo1929, but in that for 1933 it was stated: "Itineranvendors and others who maintain no regularlestablished place of business were not included'(Vol. IV, p. 1). Some perishable products, such afruits and vegetables, and other foods, some semidurable and perhaps even a very small amount oconsumers' durable commodities may thus passultimate consumers. Again there is lack of information on the subject, and we can merely guesthe retail value of the amounts at 500 million do]I ars.
Thus the differences in coverage between thetirnates based on the mark-up method andderived from the Census of Retail Distributiolaccount for the following excess, in millions odollars, of the former estimates.
Retail value of increase in inventories of finished com-moditiesDirect sales by farmers (retail value)Meal sales in hotelsSales through servicing and public utilities and profes-sional establishmentsSales through itinerant units
Total
This reduces the total discrepancy from 7.88 billion dollars to 5.82.
We may now consider some of the deficiencie
2050
35
50
50
2,05
8 Receipts from sales of lamps and appliances by the gas iidustry, as reported in ihe Census of Manufactures, weremillion dollars in 1929. Sales of electrical appliances by electrilight and power companies were 113 million dollars in(see Sales of Electrical Appliances b't Electric Light andCompanies, 1931—1935, by Statistical Department, Edison Eletric Institute, February 18, 1933, p. 1). Of course, some of
the Census of Distribution.William H. Lough estimates "sales of farm products direi
from farms to consumers and sales by hucksters and peddleihaving no established place of business" at 1,500 million dolars (cf. High-Level Consumption, McGraw Hill, 1935, p. 265Direct sales by farmers were estimated by us- at 500 milliedollars, and all sales by itinerant vendors at 500 million, yieking a total of 1 billion. There is little basis for judgmentto the relative accuracy of the two estimates.
TOTAL'SPREAD IN 1929
in the commodity coverage of the Census of Re-tail Distribution, so far as retail trade proper asdefined by the Census itself is concerned. First,776 million dollars o' retail sales were not classi-fied in the Census according to their commoditycomposition, and hence could not be included inthe estimates by minor commodity groups and thetotals in column 3 or 4 of Table 111—4. Column 3covers 37.6 billion dollars of retail sales out of atotal reported by the Census of 49.2 billion. Ap-plying the percentage that the,first total constitutesof the second to the unclassified item of 776 mil-lion, we obtain some 600 million dollars Of retailsales, which should be added to the 37.6 billionin column 3 to reduce the discrepancy still further.
Second, there is an obvious reason why theCensus of Retail Distribution could not have cov-ered completely the retail sales, actually made in1929. It was taken in 1930, with an April 1 date,and could not, of course, reach business units thatoperated through all or part of 1929 but went outof existence or were not' operating at the time itwas taken. This non-existence of retail units in1930 that had operated in 1929 could be due totwo, essentially different, reasons: (1) The mor-tality common in retail trade meant that a numberof retail stores either failed or retired betweenJanuary 1, 1929 and the date in 1930 when theCensus was taken. The period over which suchvoluntary or involuntary retirement could haveoccurred was thus at least one year and a quarter.(2) Many retail units operate on a seasonal basis,and those that operate oniy during the summer,fall, or winter, even though they were in existencein 1929 and may have begun functioning againin 1930, could hardly have beth reached by theCensus in the spring of
There are no data that would make possible anaccurate estimate of the shortage arising from suchdisappearance or non-operation at the time ofcensus-taking in 1930 of retail units that func-tioned in 1929. But there is some basis for makinga reasonable guess at the shortage in coverage dueto failures and retirement. The Census of RetailDistribution for 1933 gives the number of storesthat operated in both 1933 and 1929, and indicatesthat about 36 per cent of the stores functioning in1929 had disappeared by early 1934. The sales ofthe stores existing in both 1929 and 1933 were19.9 billion dollars in 1933 (see Vol. IV, pp. iv and3), and constituted 79.6 per cent of total sales. Butwe are interested in the sales by the stores in 1929that handled finished commodities whose flow isanalyzed in Table 111—4. The total decline in re-
tail sales from 1929 to 1933 was from 49.1 to 25.0billion dollars, or 49 per cent; if we exclude thegroup of lumber and building products, second-hand stores, coal yards, and a few other minor linesnot included in Table 111—4, the percentage de-cline becomes 48.4, the sales in 1929 amounting to43.8 billion dollars, and in 1933 to 21.1. The dc-dine in the sales of the surviving stores must havebeen less appreciable, but for purposes of carry-ing the calculation further we may assume it tohave been identical with that o all stores in thesame group, thus probably underestimating thecorrection to be made.b0 On this assumption, ap.plied to each branch o. trade, sales by those storeswhich operated in 1)0th 1929 and 1933 must haveamounted in 1929 to 34.9 billion dollars; totalsales by all stores were 43.8 billion. Hence, sales bystores that operated in 1929 but went out off ex-istence by the end of 1933 must have been 8.9billion dollars; and this would have representedthe minimum shortage in coverage of 1929 sales,were the Census of Distribution for 1929 taken inearly 1934, i.e., at the time the Census of Distri-bution for 1933 was taken. This total shortage, ap-plied to our totals for 1,929 (whkh cover only 37.8of the 43.8 billion mentioned above), amounts to7.7 billion dollars. Since five years elapsed from thebeginning of 1929 through the end of 1933, thisyields an annual shortage of 1.54 billion. And forthe year and a quarter elapsing from January 1929to the time of census-taking in 1930, the estimatedshortage would be 1 .92 billion.
Of course, it would be dangerous to assume thatthis shortage of 1.92 billion dollars represents theshortage due to non-coverage of business units thatwere operating in 1929 but had failed or retiredby the time of the census-taking in 1930. Theomission of firms that retired early in 1929 repre-sented most likely a smaller loss in coverage thanthat of firms that retired later in 1929 or duringthe first quarter of 1930. The relative rate offailures and withdrawals must have been greatlyaccelerated by the development of the depres-sion and must have been materially higher inthe later part of 1930, 1931, 1932, and the earlypart of 1933, than during 1929 or the first quarterof although the secular mortality rate in re-tail trade is fairly high at all times. On the otherhand, two factors reduce this difference betweenabsolute trade mortality in 1929 and in the later10 How large such an underestimate may be is shown by anapplication of a rate of decline of 40 per cent for the total satesof stores surviving from 1929 to 1933. This rate would yield ashortage in coverage of the 1929 sales amounting to 13.8 billiondollars, instead of the 8.9 derived in the text.
[173]
PART 111
years. First, sales and prices declined precipitouslyin 1930, 1931, 1932, and 1933 as compared with
1929. The relative mortality rate in 1933, which
would be twice as high as in 1929, means, con-
sequently, an absolute shortage of coverage thatwould be just equal to the absolute shortage ofcoverage of a mortality rate half as small in 1929.Second, it may even be assumed that, other con-(litions being equal, the mortality rate would behigher in the first or second year of the period, thesurviving population being subject to a lowermortality rate after the weaker units have with-drawn. The balance of all these considerations
suggests that the shortage of coverage due to re-tirement in 1929 and the first quarter of 1930could not have been much less than about two-thirds of the figure suggested above, thus yieldingan absolute shortage of about 1.5. billion dollars.1'
This still fails to allow for any shortage in cover-age that may arise from the seasonal character ofretail trade, since the Census of 1930 could nothave obtained information for business units op-erating during the summer, fall, and winter, andthe Census of 1933 could not have covered retailunits operating only during late spring, summer,and fall. No adequate basis of estimating thisshortage is available, although some remote mdi-cation is given by the fact that during 1929 receiptsof hotels (with 25 or more guest rooms) operatingfrom two to eight months of the year were about8 per cent of the receipts of hotels operatingthrough the year (see Abstract of the FifteenthCensus, pp. 954—5, Washington, 1933). This per-centage is obviously too high to be applied to re-tail trade. But it does not seem unreasonable toestimate ibis percentage at about 2, and thus ob-tain a shortage in reporting, owing to seasonal fac-tors, of roughly 750 million dollars.
Adding these estimates of the various parts ofretail trade in 1929 that either could not be classi-fied by commodities or could not have been coy-èred by the Census of Retail Distribution becauseo. the disaippearance or at the timeof census-taking of retail units operating in 1929,we obtain the following picture, in millioiis ofdollars.
accounted for so far (clue to difference inscope)
J.1 Dun and Bradstreet show that annual total liabilities of fail-ing trading firms were for 1929—33 about 303 million dollars. For1929 they were 225 million, or 75 per cent of the annual averagefor (see Statistical Abstract, 1934, p. 282). In the lightof these figures, the reduction of the estimated shortage from1.92 to 1.5 billion dollars in the text appears approximatelycorrect.
Not classified by commoditiesShortage on account of failure or retirementShortage to allow for seasonal operation
Total discrepancy accounted for 4,908
Total (liscrepancy between estimates
Residual discrepancy
6001,500'
750'
1W. H. Lough estimates the total shortage due to omission of"sales of retaileis who went out of business at any time betweenJan. 1, 1929 and the date of census-taking or who operatedseasonally and therefore were not reported in the Census" at1,500 million dollars (op. cit., p. 265). Our estimates for thosetwo items are 2.25 billion dollars, and if the analysis uponwhich they are based is correct, there is reason to assume thatMr. Lough's allowance is somewhat too low.
This residual discrepancy may be somewhat toosmall, if we consider that our data on productionfail to include establishments with a value ofproduct under $5,000, which should have reducedthe totals based on the mark-up method and couldnot have affected those based on volume of sales.12Also, some shortage may exist in the coverage ofthe Census of Manufactures because of retirementof manufacturing establishments, although itcould not have been large. It is perhaps reasonableto assume that the residual discrepancy is close to3 billion dollars.
What may be the sources of this residual discrep-ancy? If we assume that our analysis is correct, theymay lie either in the failure of the Census of Re-tail Distribution to cover total sales even in theretail units within its scope that were operating atthe date of census-taking; or in the exaggeration,in the estimates based on the mark-up method,of the dollar value of commodity flow to retailersand/or the gross margin between the cost of thesecommodities to retailers and the retail sales value.Finally, we may have underestimated the mag-nitude of the shortages arising from the specificsources described.
The analysis of the discrepancy between the twoestimates for specific commodity groups suggestsclearly that either we have underestimated themagnitude of the shortages arising from thesources indicated above, especially the value ofsales through the servicing industries and theshortages due to retirement or seasonality; or thatthe Census of Retail Distribution failed to coverfully sales of retail establishments that were within
2,058 its scope and were in operation at the time ofcensus-taking. Of the two possibilities, the formerseems much more plausible; although a shortageestimated at 130 million dollars is reported in the
12 The total output of these units in 1919 was 167 million dollars(see Abstract of the Census of Manufactures for 1919, Table201, p. 357).
[174]
7,880
2,970
TOTAL SPREAD IN 1929
Census of Retail Distribution itself with referenceto its coverage of sales by milk dealers. We maycite two conspicuous examples among many:Minor Group 2, Cigars, cigarettes and tobacco.The discrepancy in this group is 1.2 billion do!-lars. Mark-ups, which gave the larger total, werecarefully checked by using the annual data on con-sumption available from the Bureau of InternalRevenue, and the known wholesale and retailprices. We can scarcely assume that the large dis-crepancy between the two estimates is accountedfor by the specific sources of shortage listed above,unless the magnitude of such shortages has beenunderestimated. The changes in inventories for allfinished commodities were 200 million dollars;total flow through servicing and other establish-ments, 500 million; the share of this commoditygroup in shortages that arise from retirement,seasonal operation, itinerant selling, or the un-classified item must be relatively small. We maywell have underestimated sales through servicingestablishments, hotels, clubs, etc., if they accountfor a large part of the tobacco sales not reportedin the Census of Retail Distribution.Minor Group 11, Shoes and other footwear.Total output, at manufacturers' prices, amountedin 1929 to 1,085 million dollars. Retail sales, de-rived from the Census of Retail Distribution, wereonly 1,338 million. Sales direct to ultimate con-sumers by either manufacturers or wholesalers arenegligible. The total mark-up indicated by thetwo totals, of about 22 per cent on a cost basis, andless than 20 per cent on a sales-value basis, seems,therefore, highly inadequate. Half of the outputgoes to retailers via wholesalers, the other half di-rectly. The wholesale mark-up is 18.5 per cent oncost; the retail, 50 per cent, representing grossmargins of 16 and 33 per cent, respectively. Thediscrepancy of some 470 million dollars betweenthe estimates by the mark-up and the volume-of-sales method, amounting 35 per cent of thelatter, could hardly be explained by factors of re-tirement, seasonality (which together account forabout a 7 per cent shortage), by changes in inven-tories or any other sources of shortage, unless theirmagnitude has been underestimated above.
Of course, the estimates based on the mark-upmethod may easily contain an element of exag-geration. In the original breakdown of mixed com-modity items the estimate of the unfinished partwas usually a minimum, and hence there may havebeen some exaggeration in the finished part ob-tained as a residual. Thus, in a minor commoditygroup such as magazines, newspapers, stationery,
and paper products (Minor Group 4), the excessof the estimate based on the mark-up method overthat based on volume of sales, 850 million dollars,may have arisen not only because a vast volume ofmagazines and newspapers is distributed throughhotel lobbies, clubs, newsboys, corner newsstands,train butcher boys, etc; but also because of a pos-sible overestimate of the finished figures at themanufacturing stage. For perishable commoditieslike stationery and paper products, it is impossibleto distinguish between sales to wholesalers and re-tailers for their own use, and sales to them that aredestined for resale.
There is much less likelihood that the mark-upsused contained an element of exaggeration, sincethey were based largely on fairly comprehensivedata on operating expenses, and the profit ratiosadded were quite moderate. The general characterof the wholesale mark-ups has already been dis-cussed. The much more important retail mark-up(Table 111—4) is 37.5 per cent of cost for all retail
trade in finished commodities, or 27.3 per cent ofthe value of sales. This mark-up is based on op-erating expenses as reported in the Census of Re-tail Distribution, plus a profit ratio taken fromthe reports of retail trade corporations. This gen-eral profit ratio amounted in 1929 to 1.6 per centof total and was varied from one com-modity group to another on the basis of samplestudies of net profit rates for various branches oftrade. It is doubtful that any element of exagger-ation crept into the profit ratios thus allowed. Butthere may have been some overestimate of retailexpense ratios in the Census for 1929, because ofthe method of computing proprietors' compen-sation, an item included among operating ex-penses. However, the total item was 1,823 milliondollars for all retail trade, and, excluding thelargely unfinished groups listed above, 1,673 mil-lion. Moreover, transportation charges were, per-haps, underestimated in the calculations based onthe mark-up
The final conclusion of this tentative analysisis that, of the discrepancy of some 8 billion dollarsbetween retail sales as estimated by the mark-up and the volume-of-sales methods, at least 5 bil-lion dollars and perhaps somewhat more is fullyaccounted for by differences in the scope of cover-age and the difference between the universe sur-18 See National Income, 1929—1932, pp. 223—4. The profit figureused was exclusive of exempt interest receipts and dividendsfrom domestic corporations, and after payment of taxes.14 Also, the elimination of duplicated sales in wholesale tradeserved to reduce the mark.up estimate, since it took no cog.
of wholesalers who sell to other wholesalers.
[175]
PART III
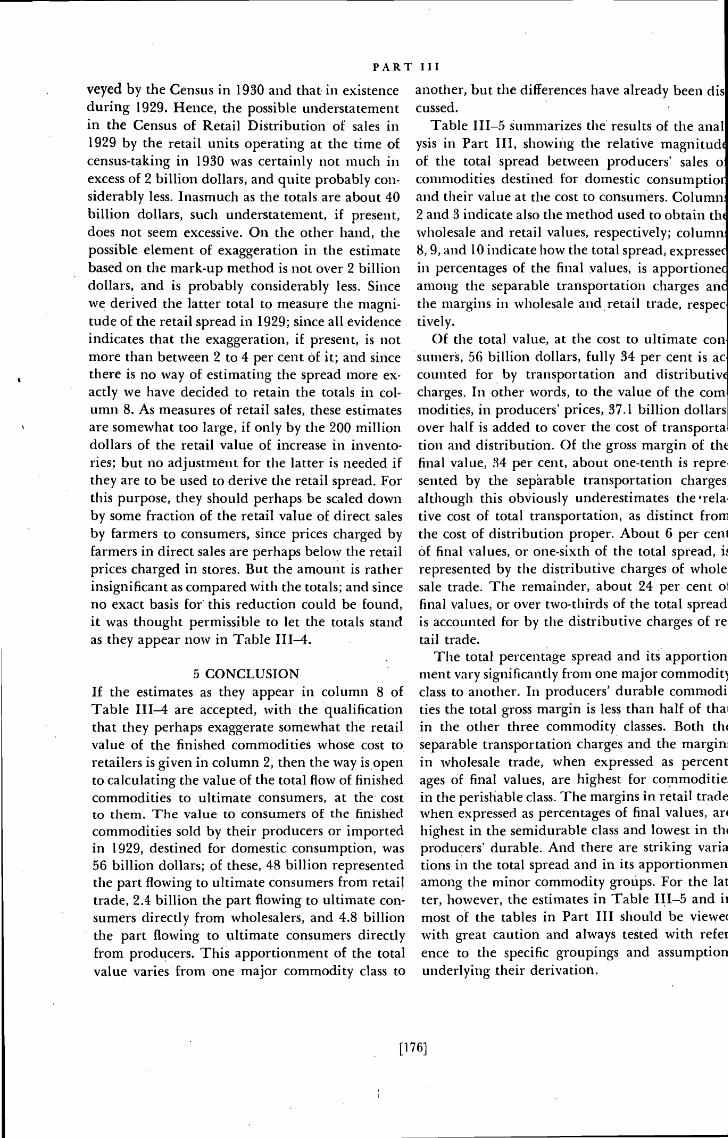
veyed by the Census in 1930 and that in existenceduring 1929. Hence, the possible understatementin the Census of Retail Distribution of sales in1929 by the retail units operating at the time ofcensus-taking in 1930 was certainly not much inexcess of 2 billion dollars, and quite probably con-siderably less. Inasmuch as the totals are about 40billion dollars, such understatement, if present,does not seem excessive. On the other hand, thepossible element of exaggeration in the estimatebased on the mark-up method is not over 2 billiondollars, and is probably considerably less. Sincewe derived the latter total to measure the magni-tude of the retail spread in 1929; since all evidenceindicates that the exaggeration, if present, is notmore than between 2 to 4 per cent Of it; and sincethere is no way of estimating the spread more ex-actly we have decided to. retain the totals in col-umn 8. As measures of retail sales, these estimatesare somewhat too large, if oniy by the 200 milliondollars of the retail value of increase in invento-ries; but no adjustment for the latter is needed ifthey are to be used to derive the retail spread. Forthis purpose, they should perhaps be scaled downby some fraction of the retail value of direct salesby farmers to consumers, since prices charged byfarmers in direct sales are perhaps below the retailprices charged in stores. But the amount is ratherinsignificant as compared with the totals; and sinceno exact basis for' this reduction could be found,it was thought permissible to let the totals standas they appear now in Table 111—4.
5 CONCLUSIONIf the estimates as they appear in column 8 ofTable 111—4 are accepted, with the qualificationthat they perhaps exaggerate somewhat the retailvalue of the finished commodities whose cost toretailers is given in column 2, then the way is opento calculating the value of the total flow of finishedcommodities to ultimate consumers, at the costto them. The value to consumers of the finishedcommodities sold by their prOducers or importedin 1929, destined for domestic consumption, was56 billion dollars; of these, 48 billion representedthe part flowing to ultimate consumers from retailtrade, 2.4 billion the part flowing to ultimate con-sumers directly from wholesalers, and 4.8 billionthe part flowing to ultimate consumers directlyfrom producers. This apportionment of the totalvalue varies from one major commodity class to
another, but the differences have already been discussed.
Table 111—5 summarizes the results of the analysis in Part III, showing the relative rnagnitudof the total spread between producers' sales ocOmmodities destined for domestic consumptioland their value at the cost to consumers. Column2 and 3 indicate also the method used to obtain thwholesale and retail values, respectively; column8, 9, and 10 indicate how the total spread, expressein percentages of the final values, is apportioneamong the separable transportation charges amthe margins in wholesale and retail trade, respectively.
Of the total value, at the cost to ultimate consumers, 56 billion dollars, fully 34 per cent is accounted for, by transportation and distributivcharges. In other words, to the value of the cornmodities, in producers' prices, 37.1 billion dollarsover half is added to cover the cost of transportation and distribution. Of the gross margin of th4final value, 34 per cent, about one-tenth is represeated by the separable transportation chargesalthough this obviously underestimates the 'relative cost of total transportation, as distinct fronthe cost of distribution proper. About 6 per ceiiOf final values, or one-sixth of the total spread, Irepresented by the distributive charges of wholesale trade. The remainder, about 24 per cent olfinal values, or over two-thirds of the total spreadis accounted for by the distributive charges of re•tail trade.
The total percentage spread and its apportion.rnent vary significantly from one major commodit)class to another. In producers' durable commodities the total gross margin is less than half of thaiin the other three commodity classes. Both thseparable transportation charges and the margimin ivholesale trade, when expressed as percentages of final values, are highest forin the perishable class. The margins in retail tradewhen expressed as percentages of final values, arhighest in the semidurable class and lowest in thproducers' durable. And there are striking variations in the total spread and in its apportionmenamong the minor commodity groups. For the latter, however, the estimates in Table 111—5 and irmost of the tables in Part III should be viewecwith great caution and always tested with reference to the specific groupings and assumptionunderlying their derivation.
[176]
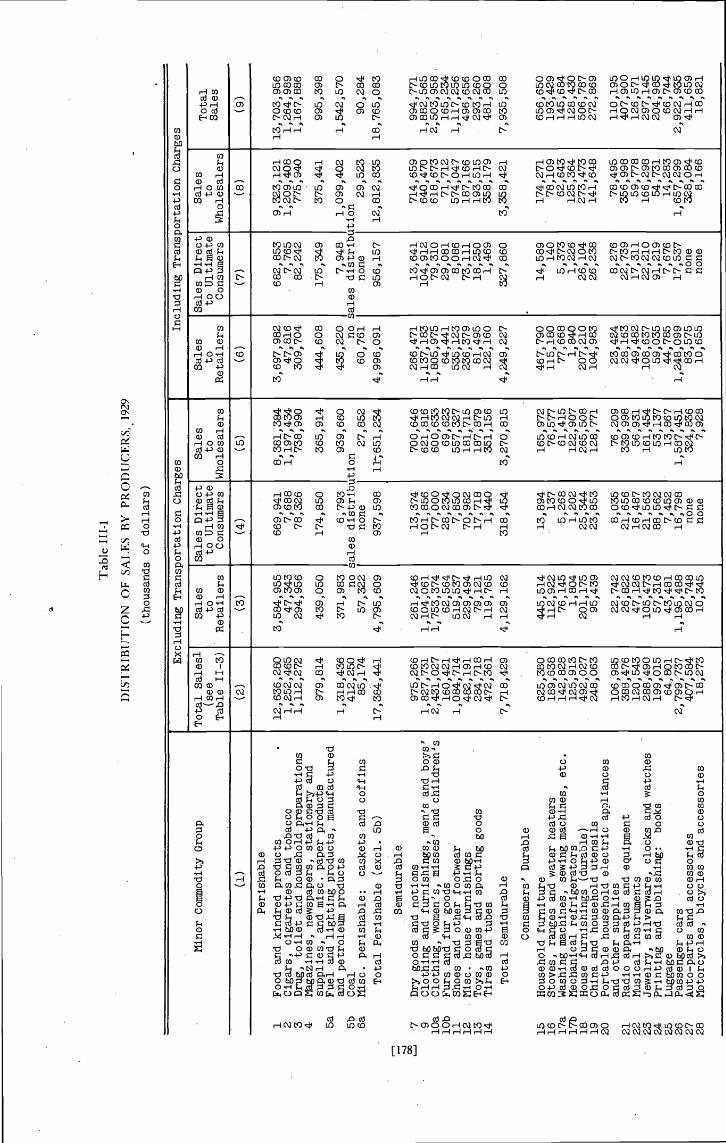
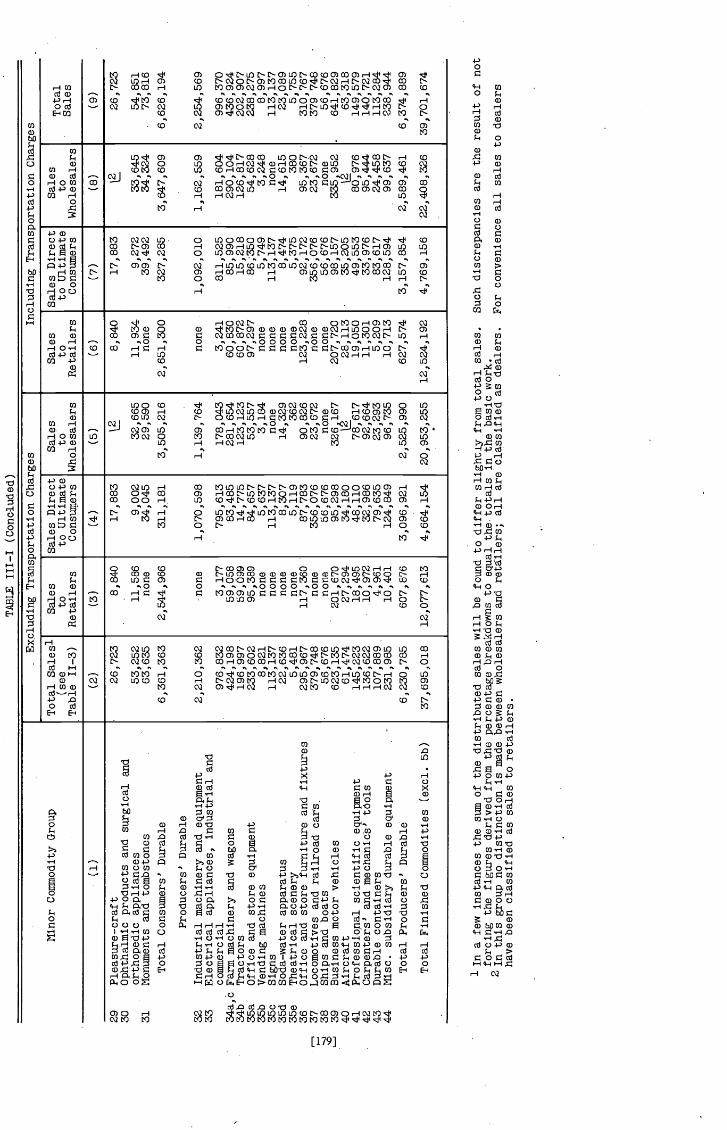
Table III—!
DISTRIBUTION OF SALES BY PRODUCERS OF FINISHED
PRODUCTS
MINOR COMMODITY GROUPS, 1929
This table the volume of sales in 1929, inclusive and exclusive of trans-portation charges, by producers of finished commodities to wholesalers, re-tailers and direct to ultimate consumers. The basis For estimating the distri-bution of sales is described in Notes A and B following the table; additionalcomments are presented in the Preface to Part III, Section 1. The basic datafor estimating transportation charges are provided in Table IV—1.
4
Consumers' Durable
Tab
le I
ll-i
DIS
TR
IBU
TIO
N O
F SA
LE
S B
Y P
RO
DU
CE
RS,
192
9
(tho
usan
ds o
f do
llars
)
Ninor Commodity Group
.
Excluding Transportation Charges
Including Transportation Charges
Total Salesl
(see
Table 11—3)
Sales
to
Retailers
Sales Direct
to Ultimate
Consumers
Sales
to
Wholesalers
Sales
to
Retailers
Sales Direct
to Ultimate
Consumers
Sales
to
Wholesalers
T tal
s°ia es
-
(i)
(2)
(3)
(4)
(5)
(6)
(7)
(8)
(9)
—
Perishable
1Food and
kind
red
products
2Cigars, cigarettes and tobacco
3Drug, toilet and
hous
ehol
dpreparations
4Ilagazines, newspapers, stationery and
supp
lies,
and
mis
c.paper products
5a
Fuel and
light
ing
products, manufactured
and
petr
oleu
mproducts
5b
Coal
6a
perishable:
caskets and co±f ins
Total Perishable (excl. 5b)
Semiclurable
12,636,280
1,252,465
1,11
2,27
2
979,814
1,318,436
412,250
85,174
17,384,441
975,266
1,827,731
2,431,027
160,421
1,084,714
482,191
284,718
472,361
7,718,429
625,380
189,638
142,828
125,913
492,027
248,063
106,985
388,476
120,543
288,490
199,015
64,801
2,799,737
407,584
18,2
73
7Dry goods and notions
9lOa
Clothing and
furn
ishi
ngs,
men's and boys'
Clothing, women's, misses' and children's
lOb
Furs and
fur
goods
11
Shoes and
othe
rfootwear
1213 14
house furnishings
Toys, games and
spor
ting
goods
Tires and
tube
sTotal Semidurable
15
Household furniture
16
Stoves, ranges
and
water heaters
17a
Washing machines, sewing machines, etc.
17b
18Ilechanlcal refrigerators
House furnishings (durable)
19
China and household utensils
20
Portable household electric appliances
arid
oth
ersupplies
21
Radio apparatus and equipment
22
MusIcal instruments
23
Jewelry, silverware, clocks and watches
24
Printing and
publ
ishi
ng:
books
25
Luggage
26
Passenger cars
27
Auto—parts and accessories
28
Motorcycles, bicycles and
acce
ssor
ies
3,584,955
47,343
294,
956
439,050
371,983no
57,322
4,795,609
261,246
1,104,061
1,753,374
62,564
519,537
229,494
79,121
119,765
4,129,162
445,514
112,
922
76,14-5
1,804
201,175
95,439
22,742
26,822
47,126
105,473
57,316
43,481
1,195,488
82,748
10,345
669,941
7,688
78,326
174,850
6,793
3ales distribi
none
937,598
13,374
101,856
77,000
28,234
7,850
70,982
17,718
1,440
318,
454
13,894
137
5,268
1,202
25,344
23,8
53
8,035
21, 656
16,487
21,563
88,562
7,452
16,7
98none
none
8,381,384
1,197,434
738,990
365,914
939,660
Ltio
n27,852
700,646
621,816
600,633
69,623
557,327
181,
715
187,879
351,156
3,270,815
165,972
76,5
7761,415
122,907
265,
508
128,771
76,209
339,998
56,931
161,454
53,137
13,867
1,587,451
324,836
7,92
8
3,697,982
47,816
309,704
444,608
435,
220 no
60,761
4,996,091
266,471
1,137,183
1,805,975
64,441
535,123
236,379
81,495
122,160
4,249,227
467,790
115,180
77,6
681,840
207,
210
104,983
23,424
28, 163
49,482
108,637
59,035
44,7
851,248,099
83,575
10,6
55
682,853
7,765
82,242
175,349
7,948
ales distribi
none
956,157
13,641
104,912
79,310
29,081
8,086
73,111
18,250
1,469
327,
860
14,589
140
5,373
1,226
26,104
26,238
8,276
22,739
17,311
22,210
91,219
7,676
17,5
37none
none
9,323,121
1,209,408
775,940
375,441
1,099,402
itio
n29,523
12,812,835
714,659
640,470
618,673
71,7
1257
4,04
7187,166
193,
515
358,179
3,358,421
174,271
78,109
62,643
125,364
273,473
141,648
78,495
356,998
59,778
166,298
54,731
14,283
1,657,299
328,084
8,166
13,703,956
1,264,989
1,167,886
995,398
1,542,570
90,284
18,765,083
994,771
1,882,565
2,503,958
165,234
1,11
7,25
6496,656
293,
260
481,
808
7,935,508
656,
650
193,429
145,684
128,430
506,787
272,869
110,195
407,900
126,571
297,145
204,985
66,744
2,922,935
411,659
18,821
'0
1 In a few instances the sum
ofthe distributed sales will be found
todiffer slightly from total sales.
forcing the figures
deri
ved
from the percentage breakdowns to equal the. totals in the basic work.
21n this group no distinction is made between wholesalers and
all are' classified as dealers.
have been classified as sales to retailers.
Such discrepancies are the result of not
For convenience all sales to dealers
TABLE Ill—I (Conc-luded)
Minor Commodity Group
Excluding Transportation Charges
Including Transportation Charges
Total Sales1
(see
Table 11—3)
Sales
to
Retailers
Sales Direct
to Ultimate
Consumers
Sales
to
Wholesalers
Sales
to
Retailers
Sales Direct
to Ultimate
Consumers
Sales
to
Wholesalers
Ta
301a es
(1)
(2)
(3)
(4)
(5)
(6)
(7)
(8)
(9)
29 30
,
31
Pleasure—craft
Ophthalmic products and surgical
arid
orthopedic appliances
Monuments and tombstones
'
26,723
53,252
63,635
8,840
.
11,5
86none
17,883
9,002
34,045
32,6
6529,590
8,840
11,934
none
17,883
9,272
39,492
33,645
34,324
26,723
54,851
73,816
Total Consumers' Durable
6,361,363
2,544,966
311,181
3,505,216
2,651,300
327,285
3,647,609
6,626,194
Producers' Durable
'.
3233
,
34a,
c34b
35a
35b
35c
35d
35e
363738 39
40
4142
4344
Industrial machinery and equipment
Electrical appliances, industrial and
commercial
Farm machinery and
wag
ons
Tractors
Office arid store equipment
Vending machines
Signs
Soda-water apparatus
Theatrical scenery
Office arid store furniture and fixtures
Locomotives and railroad cars
Ships arid boats
Business motor vehicles
Aircraft
Professional scientific equipment
Carpenters' and mechanics' tOols
Durable containers
Misc. subsidiary durable equipment
Total Producers' Durable
Total Finished Commodities (exci. 5b)
-
2,210,362
976,832
424,198
196,
997
233,602
8,821
113,137
22,636
5,481
295,967
379,748
56,676
623,135
61,474
145,223
136,622
107,889.
231,985
6,230,785
37,695,018
•none
3,177
59,058
59,099
95,389
none
none
none
none
117,360
none
none
'20
1,67
027,294
18,495
'10
,972
4,961
10,401
607,876
12,077,613
1,070,598
795,613
83,485
14,775
84,657
5,637
113,137
8,307
5,11
987,783
356,076
56,676
95,298
34,180
48,1
1032,986
79,6
35124,849
3,096,921
4,664,154
1,139,764
.
178,
043
281,654
123,123
53,557
3,184
none
14,329
362
90,826
23,672
none
326 167
78,617
92,664
23,293
96,735
2,52
5,99
0
20,953,255
none
3,241
60,8
3060,872
97,297
none
none
none
none
123,228
none
none
207,720
'28
,113
19,050
11,301
5,209
10,713
627,574
12,524,192
1,092,010
811,525
85,990
15,218
86,350
5,749
113,137
8,474
5,375
92,172
356,076
56,676
98,157
35,205
49,553
33,976
83,617
128,594
3,157,854
4,769,156
1,162,559
181,604
290,104
126,817
54,628
3,248
none
14,615
380
95,367
23,672
none
335,952
80,976
95,444
24,4
58,
99,6
372,589,461
22,408,326
2,254,569
996,370
436,924
202,907
238,275
8,997
113,137
23,089
5,755
310,767
379 748
56,676
.64
1,82
963,318
149,579
140,721
113,
284
238,
944
6,37
4,88
9
39,701,674
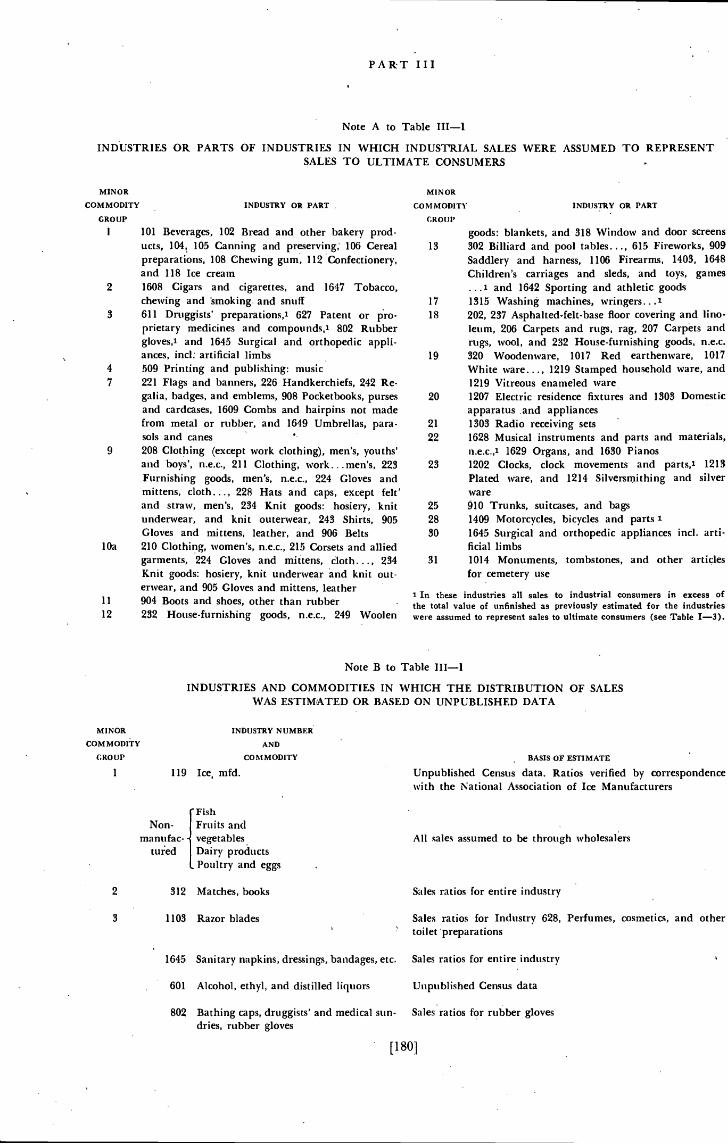
PART III
Note A to Table 111—1
INDUSTRIES OR PARTS OF INDUSTRIES IN WHICH INDUSTRIAL SALES WERE ASSUMED TO REPRESENTSALES TO ULTIMATE CONSUMERS
MINOR
COMMODITY
GROUP
MINOR
COMMODITY INDUSTRY OR PART
C.ROUL'
Note B to Table JII—l
INDUSTRIES AND COMMODITIES IN WHICH THE DISTRIBUTION OF SALESWAS ESTIMATED OR BASED ON UNPUBLISHED DATA
M INOR
COMMODITY
CR0 UP
119 Ice, mfd.
INDUSTRY NUMBER
AND
COMMODITY BASIS OF ESTIMATE
Unpublished Census data. Ratios verified by correspondencewith the National Association of Ice Manufacturers
Fruits andvegetablesDairy productsPoultry and eggs
2
S
312 Matches, books
1103 Razor blades
1645 Sanitary napkins, dressings, bandages, etc.
601 Akohol, ethyl, and distilled liquors
802 Bathing caps, druggists' and medical sun-dries, rubber gloves
Sales ratios for entire industry
Sales ratios for Industry 628, Perfumes, cosmetics, and othertoilet preparations
Sales ratios for entire industry
Unpublished Census data
Sales ratios for rubber gloves
[180]
INDUSTRY OR PART
101 Beverages, 102 Bread and other bakery prod-ucts, 104, 105 Canning and preserving; 106 Cerealpreparations, 108 Chewing gum. 112 Confectionery,and 118 Ice cream
2 1608 Cigars and cigarettes, and 1647 Tobacco,chewing and 'smoking. and snuff
3 611 Druggists' preparations,1 627 Patent or pro-prietary medicines and cornpounds,1 802 Rubbergloves,' and 1645 Surgical and orthopedic appli-ances, incL artificial limbs
4 509 Printing and publishing: music7 221 Flags and banners, 226 Handkerchiefs, 242 Re-
galia, badges, and emblems, 908 Pocketbooks, pursesand cardcases, 1609 Combs and hairpins not madefrom metal or rubber, and 1649 Umbrellas, para-sols and canes
9 208 Clothing (except work clothing), men's, youths'and boys', n.e.c., 211 Clothing, work. .men's, 223Furnishing goods, men's, n.e.c., 224 Gloves andmittens, cloth..,, 228 Hats and caps, except felt'and straw, men's, 234 Knit goods: hosiery, knitunderwear, and knit outerwear, 243 Shirts, 905Gloves and mittens, leather, and 906 Belts
l0a 210 Clothing, women's, n.e.c., 215 Corsets and alliedgarments, 224 Gloves and mittens, cloth. ., 234
Knit goods: hosiery, knit underwear and knit out-erwear, and 905 Gloves and mittens, leather
11 904 Boots and shoes, other than rubber12 232 House-furnishing goods, n.e.c., 249 Woolen
goods: blankets, and 318 Window and door screens13 302 Billiard and pool tables. . -, 615 Fireworks, 909
Saddlery and harness, 1106 Firearms, 1403, 1648Children's carriages and sleds, and toys, games- ..' and 1642 Sporting and athletic goods
17 1315 Washing machines, wringers. -18 202, 237 Asphalted-felt-base floor covering and lino-
leum, 206 Carpets and rugs, rag, 207 Carpets andrugs, wool, and 232 House-furnishing goods, n.e.c.
19 320 Woodenware, 1017 Red earthenware, 1017
White ware..., 1219 Stamped household ware, and1219 Vitreous enameled ware
20 1207 Electric residence fixtures and 1303 Domesticapparatus and appliances
21 1303 Radio receiving sets22 1628 Musical instruments and parts and materials,
n.e.c,,l 1629 Organs, and 1630 Pianos23 1202 Clocks, clock movements and parts,l 1215
Plated ware, and 1214 Silversrnithing and silverware
25 910 Trunks, suitcases, and bags28 1409 Motorcycles, bicycles and parts 130 1645 Surgical and orthopedic appliances md. arti-
ficial limbs51 1014 Monuments, tombstones, and other articles
for cemetery use
1 In these industries all sales to industrial consumers in excess ofthe total value of unfinished as previously estimated for the industrieswere assumed to represent sales to ultimate consumers (see Table 1—3).
FishNon-
manufac-tured
All sales assumed to be through wholesalers
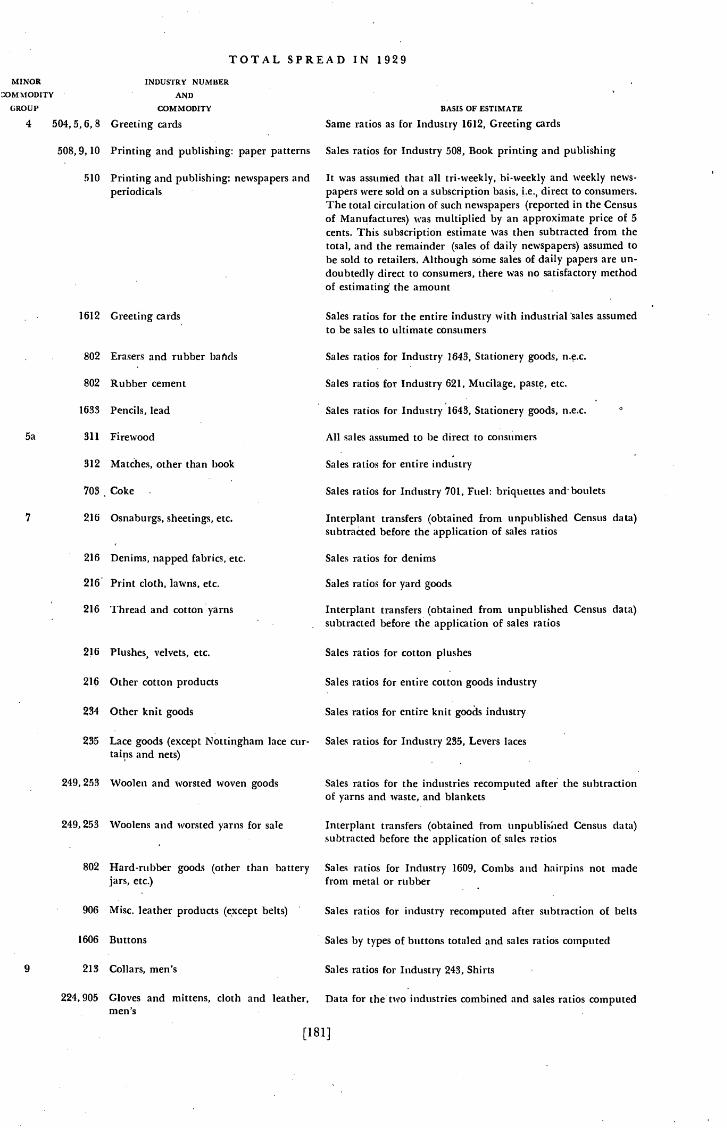
TOTAL SPREAD IN 1929MINOR INDUSTRY NUMBER
.OMMODITY AND
GROUP COMMODITY BASIS OF ESTIMATE
4 504, 5,6, 8 Greeting cards Same ratios as for Industry 1612, Greeting cards
508, 9, 10 Printing and publishing: paper patterns Sales ratios for Industry 508, Book printing and publishing
510 Printing and publishing: newspapers and It was assumed that all tn-weekly, bi-weekly and weekly news-periodicals papers were sold on a subscription basis, i.e., direct to consumers.
The total circulation of such newspapers (reported in the Censusof Manufactures) was multiplied by an approximate price of 5cents. This subscription estimate was then subtracted from thetotal, and the remainder (sales of daily newspapers) assumed tobe sold to retailers. Although some sales of daily papers are un-doubtedly direct to consumers, there was no satisfactory methodof estimating the amount
1612 Greeting cards Sales ratios for the entire industry with industrial sales assumedto be sales to ultimate consumers
802 Erasers and rubber baftds Sales ratios for Industry 1643, Stationery goods, n.e.c.
802 Rubber cement Sales ratios for Industry 621, Mucilage, paste, etc.
1633 Pencils, lead Sales ratios for Industry 1643, Stationery goods, n.e.c.
5a 311 Firewood All sales assumed to be direct to consumers
312 Matches, other than book Sales ratios for entire industry
703 Coke Sales ratios for Industry 701, Fuel: briquettes andboulets
216 Osnaburgs, sheetings, etc. Interplant transfers (obtained from unpublished Census data)subtracted before the application of sales ratios
216 Denims, napped fabrics, etc. Sales ratios for denims
216 Print cloth, lawns, etc. Sales ratios for yard goods
216 Thread and cotton yarns Interplant transfers (obtained from unpublished Census data)subtracted before the application of sales ratios
216 Plushes, velvets, etc. Sales ratios for cotton plushes
216 Other cotton products Sales ratios for entire cotton goods industry
234 Other knit goods Sales ratios for entire knit industry
235 Lace goods (except Nottingham lace cur- Sales ratios for Industry 235, Levers lacestains and nets)
249, 253 Woolen and worsted woven goods Sales ratios for the industries recomputed after the subtractionof yarns and waste, and blankets
249, 253 Woolens and worsted yarns for sale Interplant transfers (obtained from unpublisied Census data)subtracted before the application of sales ratios
802 Hard-rubber goods (other than battery Sales ratios for Industry 1609, Combs and hairpins not macicjars, etc.) from metal or rubber
906 Misc, leather products (except belts) Sales ratios for industry recomputed after subtraction of belts
1606 Buttons Sales by types of buttons totaled and sales ratios computed
213 Collars, men's Sales ratios for Industry 243, Shirts
224, 905 Gloves and mittens, cloth and leather, Data for the' two industries combined and sales ratios computedmen's '
[181]
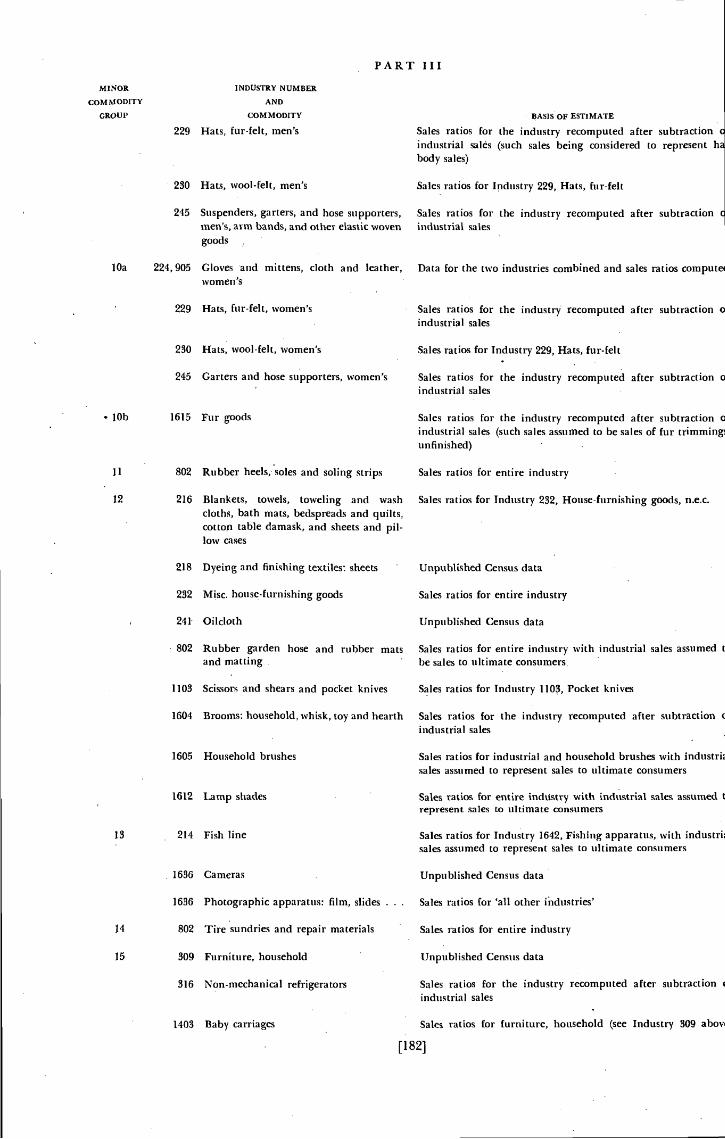
PART III
BASIS OF £STIMATE
Sales ratios for the industry recomputed after subtractionindustrial sales (such sales being considered to representbody sales)
Sales ratios for Industry 229, Hats, fur-felt
Sales ratios for the industry recomputed after subtractionindustrial sales
Data for the two industries combined and sales ratios compute
Sales ratios for the industry recomputed after subtractionindustrial sales
Sales ratios for Industry 229, Hats, fur-felt
Sales ratios for the industry recomputed after subtractionindustrial sales
Sales ratios for the industry recomputed after subtractionindustrial sales (such sales assumed to be sales of fur trimmingunfinished)
Sales ratios for entire industry
Sales ratios for Industry 232, House-furnishing goods, n.e.c.
MINOR INDUSTRY NUMBER
COMMODITY AND
GROUP COMMODITY
229 Hats, fur-felt, men's
230 Hats, wool-felt, men's
245 Suspenders, garters, and hose supporters,men's, am bands, and other elastic wovengoods
lOa 224,905 Gloves and mittens, cloth and leather,women's
229 Hats, fur-felt, women's
230 Hats, wool-felt, women's
245 Garters and hose supporters, women's
lOb 1615 Fur goods
11 802 Rubber heels, soles and soling strips
12 216 Blankets, towels, toweling and washcloths, bath mats, bedspreads and quilts,cotton table damask, and sheets and pil-low cases
218 Dyeing and finishing textiles: sheets Unpublished Census data
232 Misc, house-furnishing goods Sales ratios for entire industry
241 Oilcloth Unpublished Census data
802 Rubber garden hose and rubber matsand matting
Sales ratios for entire industry with industrial sales assumed tbe sales to ultimate consumers,
1103 Scissors and shears and pocket knives Sales ratios for Industry 1103, Pocket knives
1604 Brooms: household, whisk, toy and hearth Sales ratios for the industry recomputed after subtractionindustrial sales
1605 Household brushes Sales ratios for industrial and household brushes withsales assumed to represent sales to ultimate consumers
1612 Lamp shades Sales ratios for entire industry with industrial sales assumed trepresent sa1es to ultimate consumers
13 • 214 Fish line Sales ratios for Industry 1642, Fishing apparatus, with industrisales assumed to represent sales to ultimate consumers
1636 Cameras Unpublished Census data
1636 Photographic apparatus: film, slides . . Sales ratios for 'all other ibdustries'
14 802 Tire sundries and repair materials Sales ratios for entire industry
15 309 Furniture, household Unpublished Census data
316 Non-mechanical refrigerators.
Sales ratios for the industry recomputed after subtractionindustrial sales
1403 Baby carriages Sales ratios for furniture, household (see Industry 309 abov
[182]
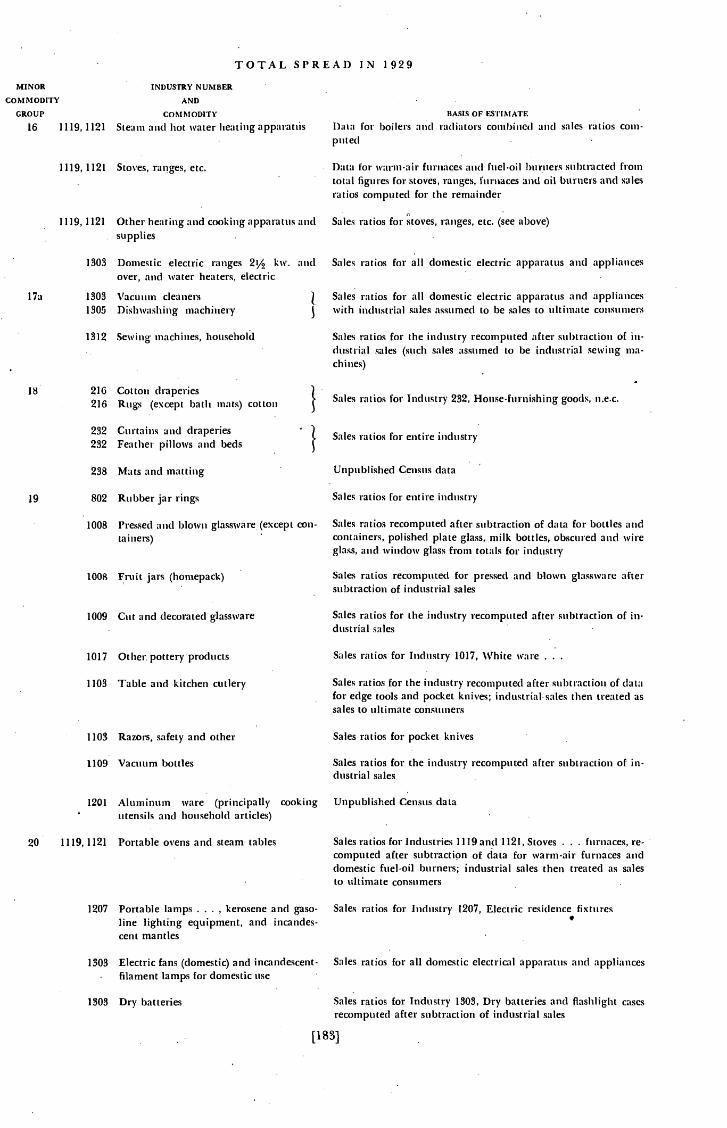
TOTAL SPREAD IN 1929MINOR INDUSTRY NUMBER
COMMODITY AND
GROUP COMMODITY BASIS OF ESTIMATE
16 1119, 1121 Steam and hot water heating apparatus 1)ata for boilers aiicl radiators combiiicd and sales ratios corn-puted
1119, 1121 Stoves, ranges, etc. Data for warm-air furnaces and fuel-oil burners subtracted fromtotal figures for stoves, ranges, furnaces and oil burners anti salesratios computed for the remainder
1119, 1121 Other heating and cooking apparatus and Sales ratios for stoves, ranges, etc. (see above)supplies
1303 Domestic electric ranges 2¼ kw. and Sales ratios for all domestic electric apparatus and appliancesover, and water heaters, electric
17a 1303 Vacuum cleaners Sales ratios for all domestic electric apparatus and appliances1305 Dishwashing machinery with industrial sales assumed to be sales to ultimate consumers
1312 Sewing machines, household Sales ratios for the industry recomputed after subtraction of in-(lustrial sales (such sales assumed to be industrial sewing ma-chines)
18 216 Cotton draperies )
216 Rugs (except bath mats) Sales ratios for Industry 232, House-furnishing goods, n.e.c.
232 Curtains and draperies - -
Sales ratios for entire industry232 Feather pillows and beds
238 Mats and matting Unpublished Census data
19 802 Rubber jar rings Sales ratios for entire industry
1008 Pressed and blown glassware (except con- Sales ratios recomputed after subtraction of data for bottles andtainers) - containers, polished plate glass, milk bottles, obscured antI wire
glass, and window glass from totals for industry
100R Fruit jars (homepack) Sales ratios recomputed for pressed and blown glassware altersubtraction of industrial sales
1009 Cut and decorated glassware Sales ratios for the industry recomputed after subtraction of in.dustrial sales
1017 Other, pottery products Sales ratios for Industry 1017, White ware
1103 Table and kitchen cutlery Sales ratios for the industry recomputed after subtraction of datafor edge tools and pocket knives; industrial sales then treated assales to ultimate consumers
1103 Razors, safety and other Sales ratios for pocket knives
1109 Vacuum bottles Sales ratios for the industry recomputed after subtraction of in-dustrial sales
1201 Aluminum ware (principally cooking Unpublished Census datautensils and household articles)
20 1119, 1121 Portable ovens and steam tables Sales ratios for Industries 1119 and 1121, Stoves - . - Furnaces, re-computed after subtraction of data for warm-air furnaces anddomestic fuel-oil burners; industrial sales then treated as salesto ultimate consumers
1207 Portable lamps . - . , kerosene and gaso- Sales ratios for Industry 1207, Electric residence fixturesline lighting equipment, and incandes-cent mantles
1303 Electric fans (domestic) and incandescent- Sales ratios for all domestic electrical apparatus and appliancesfilament lamps for domestic use
1303 Dry batteries Sales ratios for Industry 1803, Dry batteries and flashlight casesrecomputed after subtraction of industrial sales
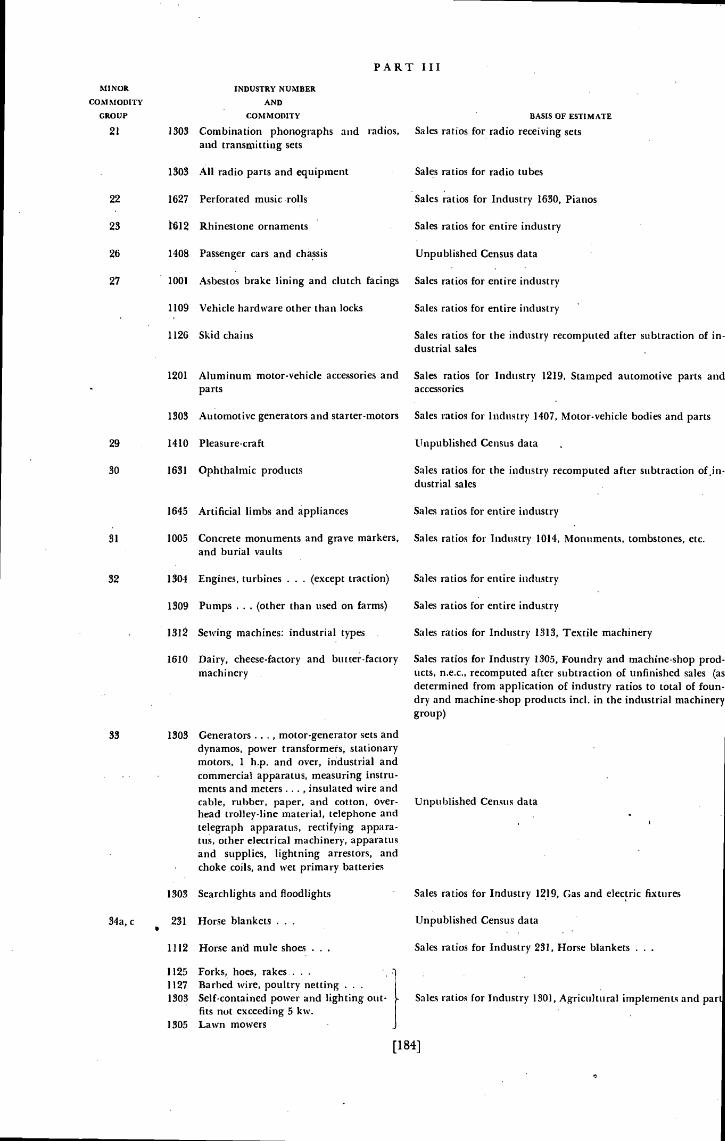
PART IIIMINOR INDUSTRY NUMBER
COMMODITY AND
GROUP COMMODITY BASIS OF ESTIMATE
21 1303 Combination phonographs and radios, Sales ratios for radio receiving setsand transmitting sets
1303 All radio parts and equipment Sales ratios for radio tubes
22 1627 Perforated music rolls Sales ratios for Industry 1630, Pianos
23 Rhinestone ornaments Sales ratios for entire industry
26 1408 Passenger cars and chassis Unpublished Census data
27 1001 Asbestos brake lining and clutch facings Sales ratios for entire industry
1109 Vehicle hardware other than locks Sales ratios for entire industry
1126 Skid chains Sales ratios for the industry recomputed after subtraction of in-dustrial sales
1201 Aluminum motor-vehicle accessories and Sales ratios for Industry 1219, Stamped automotive parts andparts accessories
1303 Automotive generators and starter-motors Sales ratios for 1407, Motor-vehicle bodies and parts
29 1410 Pleasure-craft Unpublished Census data
80 1631 Ophthalmic products Sales ratios for the industry recomputed after subtractiondustrial sales
1645 Artificial limbs and appliances Sales ratios for entire industry
51 1005 Concrete monuments and grave markers, Sales ratios for Industry 1014, Monuments, tombstones, etc.and burial vaults
32 1304 Engines, turbines . - . (except traction) Sales ratios for entire industry
1309 Pumps . . - (other than used on farms) Sales ratios for entire industry
- 1312 Sewing machines: industrial types Sales ratios for Industry 1318, Textile machinery
1610 Dairy, cheese-factory and butter-factory Sales ratios for Industry 1305, Foundry and machine-shop prod.machinery ucts, n.e.c., recomputed after subtraction of unfinished sales (as
determined from application of industry ratios to total of foun-dry and machine-shop products mci. in the industrial machinerygroup)
33 1303 Generators.. . , motor-generator sets anddynamos, power transformers, stationarymotors, I h.p. and over, industrial andcommercial apparatus, measuring instru-ments and meters. . - , insulated wire andcable, rubber, paper. and cotton, over- Unpublished Census datahead trolley-line material, telephone andtelegraph apparatus, rectifying appara-tus, other electrical machinery, apparatusand supplies, lightning arrestors, andchoke coils, and wet primary batteries
1303 Searchlights and floodlights Sales ratios for Industry 1219, Gas and electric fixtures
34a, c 251 Horse blankets - . - Unpublished Census data
1112 Horse and mule shoes - . . Sales ratios for Industry 231, Horse blankets .
1125 Forks, hoes, rakes . - . -
1127 Barbed wire, poultry netting - .
1303 Self-contained power and lighting out- Sales ratios for Industry 1301, Agricultural implements and partfits not exceeding 5 kw.
1305 Lawn mowers
[184]
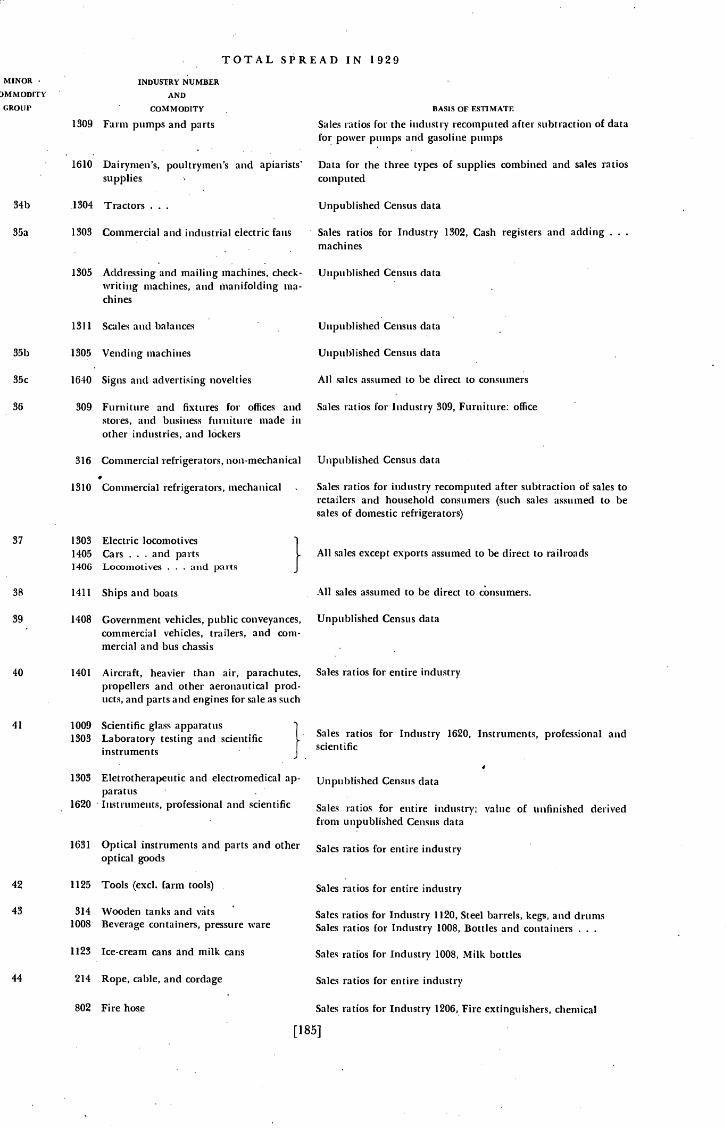
TOTAL SPREAD IN 1929MINOR NUMBER
)MMODITY AND
GROW' COMMODITY BASIS OF ESTIMATE
1309 Farm pumps and parts Sales ratios for the industry recomputed after subtraction of datafor power pumps and gasoline pumps
1610 Dairymen's, poultrymen's and apiarists' Data for the three types of supplies combined and sales ratiossupplies computed
34b 1304 Tractors . . Unpublished Census data
35a 1303 Commercial and industrial electric fans Sales ratios for Industry 1302, Cash registers and addingmachines
1305 Addressing and mailing machines, check- Unpublished Census datawriting machines, and man ifolding ma-chines
1311 Scales and balances Unpublished Census data
1305 Vending machines Unpublished Census data
35c 1640 Signs and advertising novelties All sales assumed to be (lirect to
36 309 Furniture and fixtures for offices and Sales ratios for Industry 309, Furniture: officestores, and business furniture made inother industries, and lockers
316 Commercial refrigerators, non-mechanical Unpublished Census data
1310 Commercial refrigerators, mechanical Sales ratios for industry recomputed after subtraction of sales toretailers and household consumers (such sales assumed to besales of domestic refrigerators)
37 1303 Electric locomotives1405 Cars . . and parts
}All sales except exports assumed to be direct to railroads
1406 Locomotives . . and parts
1411 Ships and boats All sales assumed to be direct to
1408 Government vehicles, public conveyances, Unpublished Census datacommercial vehicles, trailers, and com-mercial and bus chassis
1401 Aircraft, heavier than air, parachutes, Sales ratios for entire industrypropellers and other aeronautical prod.ucts, and parts and engines for sale as such
1009 Scientific glass apparatus1303 Laboratory testing and scientific
}
Sales ratios for Industry 1620, Instruments, professional andscientificinstruments
4
1303 Eletrotherapeutic and electromedical ap- Unpublished Census dataparatus
1620 Instruments, professional and scientific Sales ratios for entire industry; value of unfinished derivedfrom unpublished Census data
1631 Optical instruments and parts and other Sales ratios for entire industryoptical goods
42 1125 Tools (excl. farm tools) Sales ratios for entire industry
314 Wooden tanks and Vats Sales ratios for Industry 1120, Steel barrels, kegs, and drums1008 Beverage containers, pressure ware Sales ratios for Industry 1008, Bottles and containers
1123 Ice-cream cans and milk cans Sales ratios for Industry 1008, Milk bottles
44 214 Rope, cable, and cordage Sales ratios for entire industry
802 Fire hose Sales ratios for Industry 1206, Fire extinguishers, chemical
[185]

MINOR
COMMODITY
GROUP
1011 Grindstones1012 Hones, whetstones
PART III
INDUSTRY NUMBER
AND
COMMODITY
1006 CrUcibles1011 Chemical stoneware and porcelain1017 Saggers
1103
1109
1604
1696
Other cutlery
Padlocks
Industrial brooms
Misc, photographic equipment
BASIS OF ESTIMATE
Sales ratios for Industry 1004, Clay products: fire brick
Sales ratios for Industry 1007, Emery wheels and other abrasi
f appliances
Sales ratios for Industry 1103, Edge tools
Sales ratios for entire industry
Sales ratios for Industry 901, Belting, leather
Unpublished Census data
[186]
Table 111—2
IMPORTS AND EXPORTS OF FINISHED COMMODITIES,
MINOR COMMODITY GROUPS, 1929
This table provides the list of specific commodities included under eachminor commodity group. Unlike the values in Table 11—4, the export valueshere are at export prices as given in the annual Department of Commercereports, Foreign Commerce and Navigation of the United States.
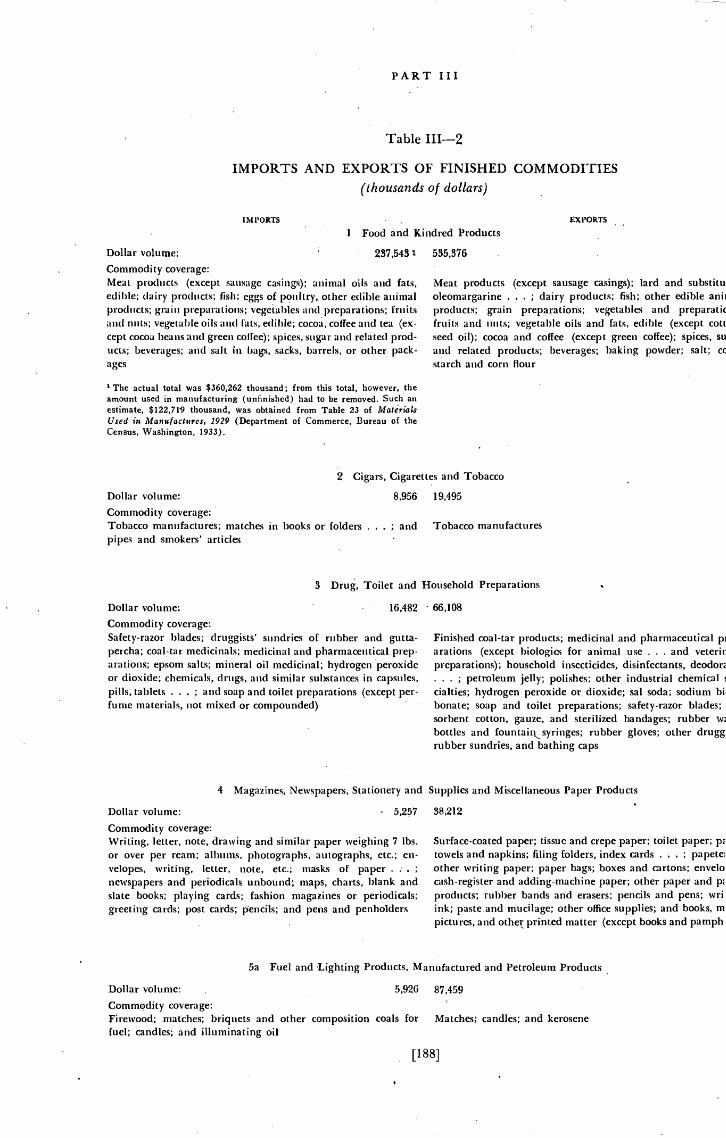
PART III
Table 111—2
IMPORTS AND EXPORTS OF FINISHED COMMODITIES
IMPORTS
(thousands of dollars)
1 Food and Kindred Products
The actual total was $360,262 thousand; from this total, however, theantount used in manufacturing (unfinished) had to be removed. Such anestimate, $122,719 thousand, was obtained from Table 23 of Ma.tiriaisUsed in Manufactures, 1929 (Department of Commerce, Bureau of theCensus, Washington, 1933).
£Xl'ORTS
Meat products (except sausage casings); lard and substituoleomargarine . ; dairy products; fish; other edible aniiproducts; grain preparations; vegetables and preparaticfruits and nuts; vegetable oils and fats, edible (except cottseed oil); cocoa and coffee (except green coffee); spices, suand related products; beverages; baking powder; salt; cc
starch and corn flour
2 Cigars, Cigarettes and Tobacco
Dollar volume: 8,956 19,495
Commodity coverage:Tobacco manufactures; matches in books or folders . . ; and 'robacco manufacturespipes and smokers' articles
Dollar volume: 16,482 - 66,108
Commodity coverage:Safety-razor blades; druggists' sundries of rubber and gutta-percha; coal -tar medicinals; medicinal and pharmaceutical prep-arations; epsom salts; mineral oil medicinal; hydrogen peroxideor dioxide; chemicals, drugs, and similar substances in capsules,pills, tablets . . . ; and soap and toilet preparations (except per.fume materials, not mixed or compounded)
Finished coal-tar products; medicinal and pharmaceutical piarations (except biologics for animal use . . . and veterirpreparations); household insecticides, disinfectants, deodor;
petroleum jelly; polishes; other industrial chemicalcialties; hydrogen peroxide or dioxide; sal soda; sodium bibonate; soap and toilet preparations; safety-razor blades;sorbent cotton, gauze, and sterilized bandages; rubber w;bottles and rubber gloves; other druggrubber sundries, and bathing caps
4 Magazines, Newspapers, Stationery and Supplies and Miscellaneous Paper Products
Dollar volume: 5,257 38,212
Commodity coverage:Writing, letter, note, drawing and similar paper weighing 7 lbs.or over per ream; albums, photographs, autographs, etc.; en-
writing, letter, note, etc.; masks of paper .newspapers and periodicals unbound; maps, charts, blank andslate books; playing cards; fashion magazines or periodicals;greeting cards; post cards; pencils; and pens and penholders
Surface-coated paper; tissue and crepe paper; toilet paper; p;towels and napkins; filing folders, index cards . ; papete:other writing paper; paper bags; boxes and cartons; envelocash-register and adding-machine paper; other paper and p;products; rubber bands and erasers; pencils and pens; wriink; paste.and mucilage; other office supplies; and books, mpictures, and other printed matter (except books and pamph
5a Fuel and -Lighting Products, Manufactured and Petroleum Products
Dollar volume: 5,926 87,459
Commodity coverage:Firewood; matches; briquets and other composition coals for Matches; candles; and kerosenefuel; candles; and illuminating oil
Dollar volume: 1 535,376
Commodity coverage:Meat products (except sausage casings); animal oils and fats,edible; dairy products; fish; eggs of poultry, other edible animalproducts; grain preparations; vegetables and preparations; fruitsand nuts; vegetable oils and fats, edible; cocoa, coffee and tea (ex-cept cocoa beans and green coffee); spices. sugar and related prod-ucts; beverages; and salt in bags, sacks, barrels, or other pack-ages
3 Drug, Toilet and Household Preparations
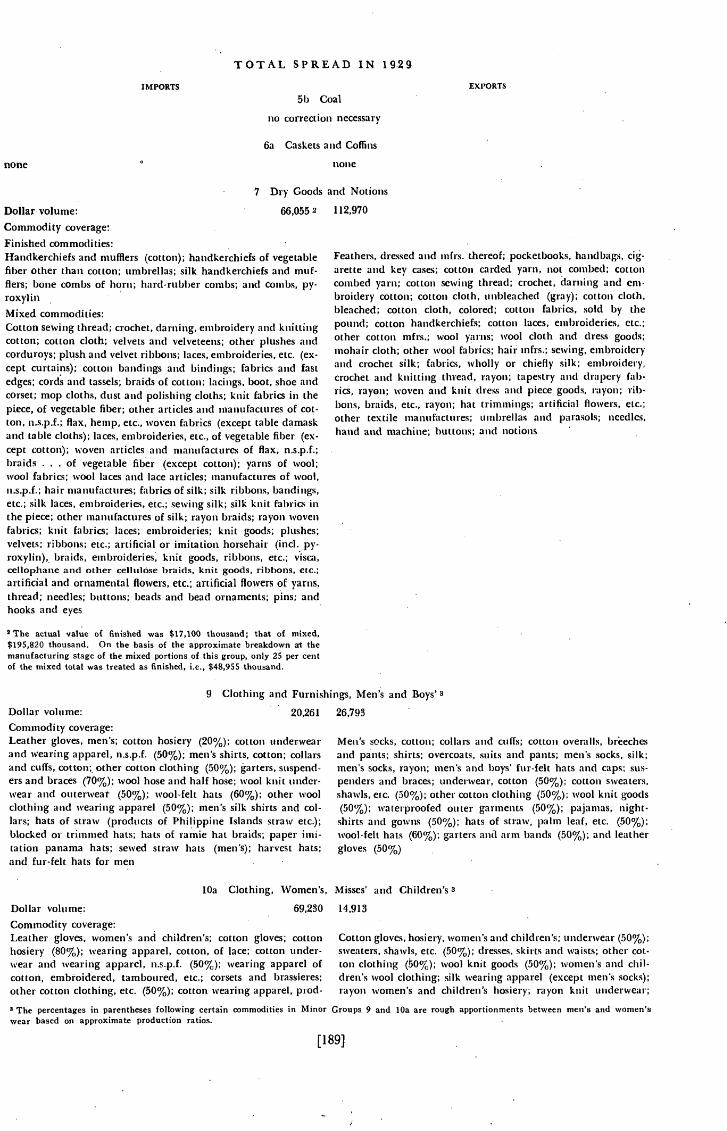
IMPORTS
TOTAL SPREAD IN 19.29
5b Coal
no correction necessary
6a Caskets and Collins
none
7 Dry Goods and Notions
EXPORTS
Dollar volume: 66,055 2 112,970
Commodity coverage:
Finished commodities:Handkerchiefs and mufflers (cotton); handkerchiefs of vegetablefiber other than cotton; umbrellas; silk handkerchiefs and inuf-flers; bone combs of horn; hard-rubber combs; and combs, py-roxylinMixed commodities:Cotton sewing thread; crochet, darning, embroidery and knittingcotton; cotton cloth; velvets and velveteens; other plushes andcorduroys; plush and velvet ribbons; laces, embroideries, etc. (ex-cept curtains); cotton bandings and bindings; fabrics and fastedges; cords and tassels; braids of cotton; lacings, boot, shoe andcorset; mop cloths, dust and polishing cloths; knit fabrics in thepiece, of vegetable fiber; other articles and manufactures of cot-ton, n.s.p.f.; flax, hemp, etc., woven fabrics (except table damaskand table cloths); laces, embroideries, etc., of vegetable fiber (ex-cept cotton); woven articles and manufactures of flax, n.s.p.f.;braids . . . of vegetable fiber (except cotton); yarns of wool;wool fabrics; wool laces and lace articles; manufactures of wool,n.s.p.f.; hair manufactures; fabrics of silk; silk ribbons, bandings,etc.; silk laces, embroideries, etc.; sewing silk; silk knit fabrics inthe piece; other manufactures of silk; rayon braids; rayon wovenfabrics; knit fabrics; laces; embroideries; knit goods; plushes;velvets; ribbons; etc.; artificial or imitation horsehair (in py-roxylin), braids, knit goods, ribbons, etc.; visca,cellophane and other cellulose braids, knit goods, ribbons, etc.;artificial and ornamental flowers, etc.; artificial flowers of yarns,thread; needles; buttons; beads and bead ornaments; pins; andhooks and eyes
2 The actual value of finished was $17,100 thousand; that of mixed,$195,820 thousand. On the basis of the approximate breakdown aS themanufacturing stage of the mixed portions of this group, only 25 per centof the mixed total was treated as finished, i.e., $48,955 thousand.
Feathers, dressed and mirs. thereof; pocketbooks, handbags, cig-arette and key cases; cotton carded yarn, not combed; cottoncombed yarn; cotton sewing thread; crochet, darning and em-broidery cotton; cotton cloth, unbleached (gray); cotton cloth,bleached; cotton cloth, colored; cotton fabrics, sold by thepound; cotton handkerchiefs; cotton laces, embroideries, etc.;other cotton mirs.; wool yarns; wool cloth and dress goods;mohair cloth; other wool fabrics; hair rnfrs.; sewing, embroideryand crochet silk; fabrics, wholly or chiefly silk; embroidery,crochet and knitting thread, rayon; tapestry and draperyrics, rayon; woven and knit dress and piece goods, rayon; rib-hotis, braids, etc., rayon; hat trimmings; artificial flowers, etc.;other textile manufactures; umbrellas and parasols; needles,hand and machine; buttons; and notions
9 Clothing and Furnishings, Men's and Boys' S
Dollar volume: 20,261 26,793
Commodity coverage:Leather gloves, men's; cotton hosiery (20%); cotton underwearand wearing apparel, n.s.p.f. (50%); men's shirts, cotton; collarsand cuffs, cotton; other cotton clothing (50%); garters, suspend-ers and braces (70%); wool hose and half hose; wool knit under-wear and outerweaf (50%); wool-felt hats (60%); other woolclothing and wearing apparel (50%); men's silk shirts and col-lars; hats of straw (products of Philippine Islands straw etc.);blocked or trimmed hats; hats of ramie hat braids; paper imi-tation panama hats; sewed straw hats (men's); harvest hats;and fur-felt hats for men
Men's socks, cotton; collars and cuffs; cotton overalls,and pants; shirts; overcoats, suits and pants; men's socks, silk;men's socks, rayon; men's and boys' fur-felt hats and caps; sus-penders and braces; underwear, cotton (50%); cotton sweaters,shawls, etc. (50%); other cotton clothing (50%); wool knit goods(50%); terproofed outer garments (50%); pajamas, night-shirts and gowns (50%); hats of straw, palm leaf, etc. (50%);wool-felt hats (60%); garters and arm bands (50%); and leathergloves (50%)
lOa Clothing, Women's, Misses' and Children's 3
Dollar volume: 69,230 14,913
Commodity coverage:Leather gloves, women's and children's; cotton gloves; cottonhosiery (80%); wearing apparel, cotton, of lace; cotton under-wear and wearing apparel, n.s.p.f. (50%); wearing apparel ofcotton, embroidered, tamboured, etc.; corsets and brassieres;other cotton clothing, etc. (50%); cotton wearing apparel, prod.
Cotton gloves, hosiery, women's and children's; underwear (50%);sweaters, shawls, etc. (50%); dresses, skirts and waists; other cot-ton clothing (50%); wool knit goods (50%); women's and dill-dren's wool clothing; silk wearing apparel (except mcii's socks);rayon women's and children's hosiery; rayon knit underwear;
none
The percentages in parentheses following certain commodities in Minor Groups 9 and lOa are rough apportionments between men's and women'swear based on approximate production ratios.
[189]
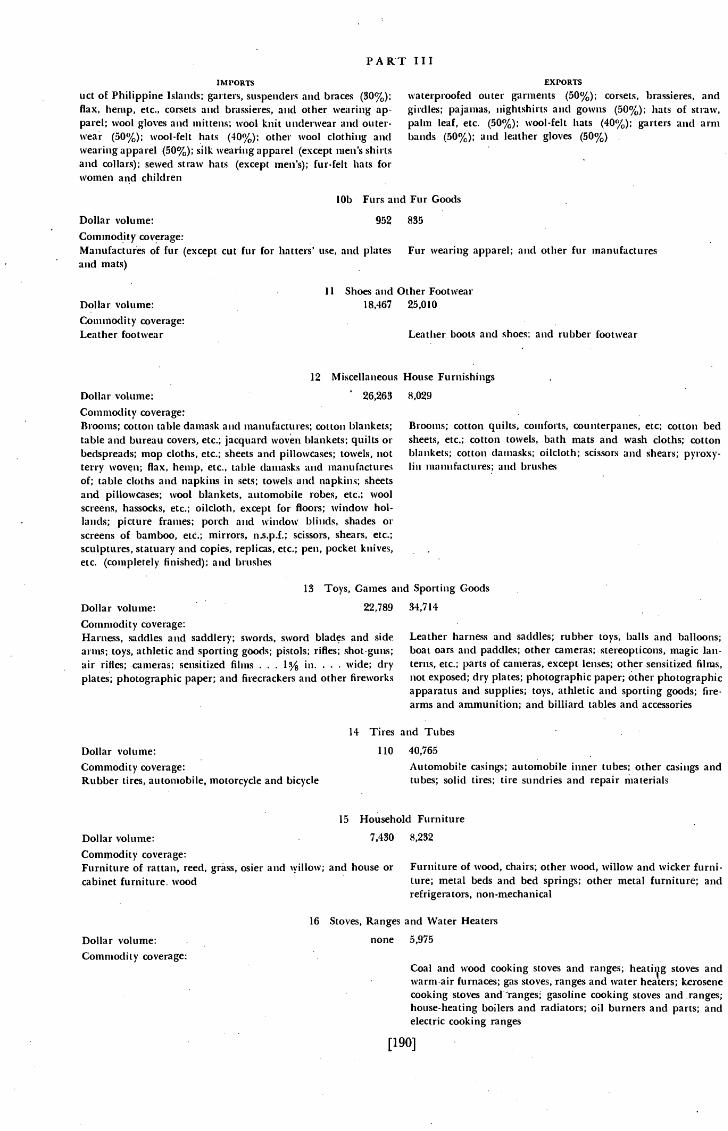
PART IIIIMPORTS
uct of Philippine Islands; garters, suspenders and braces (30%);flax, hemp, etc., corsets and brassieres, and other wearing ap-parel; wool gloves and mittens; wool knit underwear and outer-wear (50%); wool-felt hats (40%); other wool clothing andwearing apparel (50%); silk wearing apparel (except men's shirtsand collars); sewed straw hats (except men's); fur-felt hats forwomen and children
EXPORTS
waterproofed outer garments (50%); corsets, brassieres, andgirdles; pajamas, nightshirts and gowns (50%); hats of straw,palm leaf, etc. (50%); wool-felt hats (40%); garters and armbands (50%); and leather gloves (50%)
lOb Furs and Fur Goods
Dollar volume: 952 835
Coin modi ty coverage:Manufactures of fur (except cut fur for hatters' use, and plates Fur wearing apparel; and other fur manufacturesand mats)
11 Shoes and Other Footwear
Dollar volume: 26,263 8,029
Commodity coverage:Brooms; cotton table damask and manufactures; cotton blankets;table and bureau covers, etc.; jacquard woven blankets; quilts orbedspreads; mop cloths, etc.; sheets and pillowcases; towels, notterry wovçn; flax, hemp, etc., table damasks andof; table cloths and napkins in sets; towels and napkins; sheetsand pillowcases; wool blankets, automobile robes, etc.; woolscreens, hassocks, etc.; oilcloth, except for floors; window hol-lands; picture frames; porch and window blinds, shades orscreens of bamboo, etc; mirrors, n.s.pf.; scissors, shears, etc.;sculptures, statuary and copies, replicas, etc.; pen, pocket knives,etc. (conipletely finished): and brushes
Brooms; cotton quilts, comforts, counterpanes, etc; cotton bedsheets, etc.; cotton towels, bath mats and wash cloths; cottonblankets; cotton damnasks; oilcloth; scissors and shears; pyroxy-liii manufactures; and brushes
13 Toys, Games and Sporting Goods
Dollar volume: 22,789 34,714
Commodity coverage:Harness, saddles and saddler)'; swords, sword blades and sidearms; toys, athletic and sporting gOods; pistols; rifles; shot-guns;air rifles; cameras; sensitized films - . - in. . . . wide; dryplates; photographic paper; and firecrackers and other fireworks
Leather harness and saddles; rubber toys, balls and balloons;boat oars and paddles; other cameras; stereopticons, magic lan-terns, etc.; parts of cameras, except lenses; other sensitized films,not exposed; dry plates; photographic paper; other photographicapparatus and supplies; toys, athletic and sporting goods; fire-arms and ammunition; and billiard tables and accessories
14 Tires and Tubes
15 Household Furniture
Dollar volume: 7,430 8,232
Commodity coverage:Furniture of rattan, reed, grass, osier and willow; and house or Furniture of wood, chairs; other wood, willow and wicker furni-cabinet furniture, wood ture; metal beds and bed springs; other metal furniture; and
refrigerators, non-mechanical
16 Stoves, Ranges and Water Heaters
Dollar volume:Commodity coverage:
none 5,975
Coal and wood cooking stoves and ranges; stoves andwarm-air furnaces; gas stoves, ranges and water heaters; kerosenecooking stoves gasoline cooking stoves and ranges;house-heating boilers and radiators; oil burners and parts; andelectric cooking ranges
[190]
Dollar volume: 18,467 25,010
Commodity coverage:Leather footwear Leather l)oots and shoes: and rubber footwear
12 Miscellaneous House Furnishings -
Dollar volume: 110 40,765
Commodity coverage:Rubber tires, automobile, motorcycle and bicycle
Automobile casings; automobile inner tubes; other casings andtubes; solid tires; tire sundries and repair materials
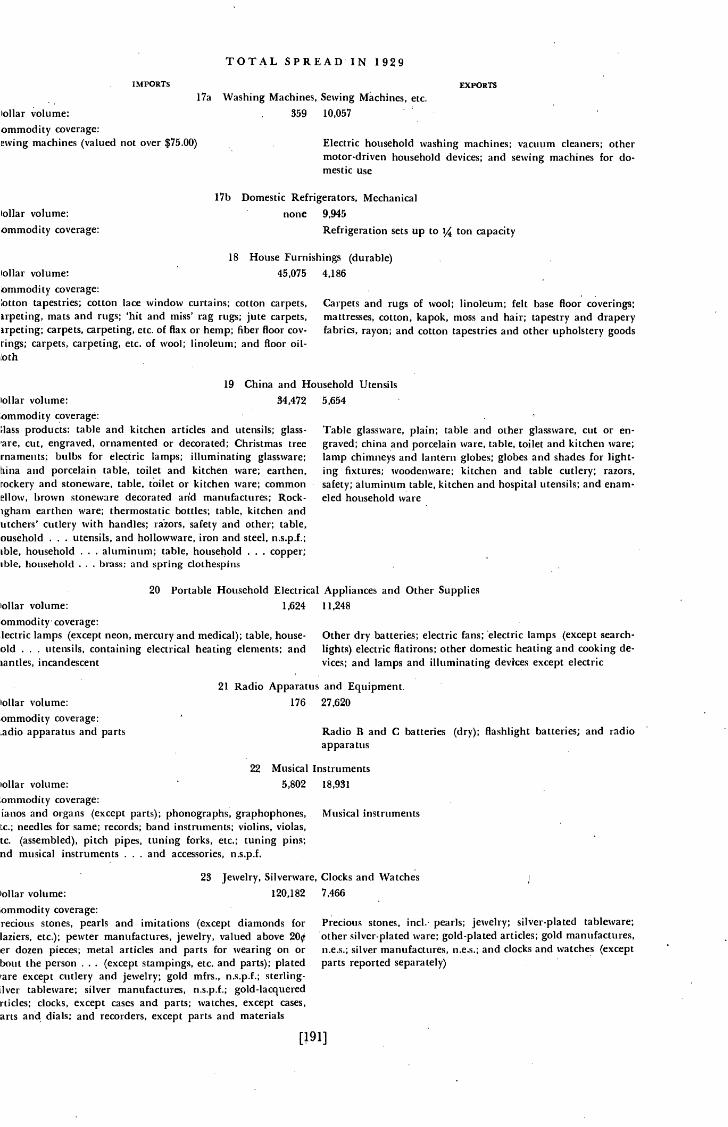
TOTAL SPREAD IN 1929
ollar volume:
IMPORTS
ommodity coverage:ewing machines (valued not over $75.00)
17a Washing Machines, Sewing Machines, etc.359 10,057
EXPORTS
Electric household washing machines; vacuum cleaners; othermotor-driven hoLisehold devices; and sewing machines for do-mestic use
17b Domestic Refrigerators, Mechanicalollar volume:ommodi ty coverage:
none 9,945
Refrigeration sets up to 1/4 ton capacity
ommódity coverage:otton tapestries; cotton lace window curtains; cotton carpets,
mats and rugs; 'hit and miss' rag rugs; jute carpets,Irpeting; carpets, carpeting, etc. of flax or hemp; fiber floor coy-rings; carpets, carpeting, etc. of wool; linoleum; and floor oil-oth
ommodity coverage:lass products: table and kitchen articles and utensils; glass-are, cut, engraved, ornamented or decorated; Christmas treernaments: bulbs for electric lamps; illuminating glassware;
and porcelain table, toilet and kitchen ware; earthen,rockery and stoneware, table, toilet or kitchen ware; commondlow, brown stoneware decorated manufactures; Rock-
earthen ware; thermostatic bottles; table, kitchen andutchers' cutlery with handles; safety and other; table,ousehold . . . utensils, and hollowware, iron and steel, n.s.p.f.;tble, household . . . aluminum; table, household . . . copper;thie, household - - . brass; and spring clothespins
Carpets and rugs of wool; linoleum; felt base floor coverings;mattresses, cotton, kapok, moss and hair; tapestry and draperyfabrics, rayon; and cotton tapestries and other upholstery goods
Table glassware, plain; table and other glassware, cut or en-graved; china and porcelain ware, table, toilet and kitchen ware;lamp chimneys and lantern globes; globes and shades for light-ing fixtures; woodenware; kitchen and table cutlery; razors,safety; aluminum table, kitchen and hospital utensils; and enam-eled household ware
20 Portable Household Electrical Appliances and Other Supplies
22 Musical Instrumentsollar volume: 5,802 18,931
ommodity coverage:ianos and organs (except parts); phonographs, graphophones, Musical instrumentsLc.; needles for same; records; band instruments; violins, violas,tc. (assembled), pitch pipes, tuning forks, etc.; tuning pins;nd musical instruments . . - and accessories, n.s.p.f.
23 Jewelry, Silverware, Clocks and Watchesollar volume: 120,182 7,466
ommodity coverage:recious stones, pearls and imitations (except diamonds forlaziers, etc.); pewter manufactures, jewelry, valued aboveer dozen pieces; metal articles and parts for wearing on orbout the person - . . (except stampings, etc. and parts); plated'are except cutlery and jewelry; gold mfrs., n.s.p.f.; sterling-iver tableware; silver manufactures, n .s.p.f.; gold-lacqueredrticles; clocks, except cases and parts; watches, except cases,arts and dials; and recorders, except parts and materials
Precious stones, mci. pearls; jewelry; sil tableware;other silver-plated ware; gold-plated articles; gold manufactures,n.e.s.; silver manufactures, ii.e.s.; and clocks and watches (exceptparts reported separately)
[191]
18 House Furnishings (durable)ollar volume: 45,075 4,186
19 China and Household Utensilsollar volume: 84,472 5,654
ollar volume: 1,624 11,248
ommodity coverage:lectric lamps (except neon, mercury and medical); table, house- Other dry batteries; electric fans; electric lamps (except search-old . . . utensils, containing electrical heating elements; and lights) electric flatirons; other domestic heating and cooking de-iantles, incandescent vices; and lamps and illuminating devices except electric
21 Radio Apparatus and Equipment.ollar volume: 176 27,620
ommodity coverage:,adio apparatus and parts Radio B and C batteries (dry); flashlight batteries; and radio
apparatus
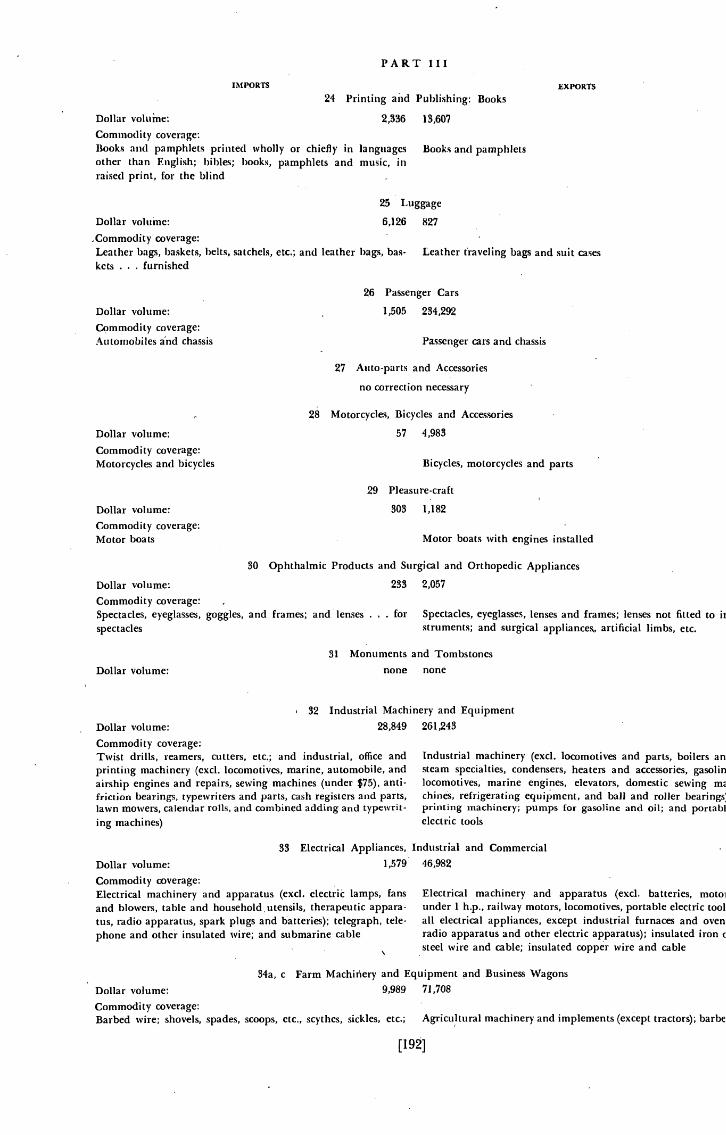
PART III
Dollar volume: 2,336 13,607
Commodity coverage:Books and pamphlets printed wholly or chiefly inother than English; bibles; books, pamphlets andraised print, for the blind
25 Luggage
Dollar volume: 6,126 827
coverage:Leather bags, baskets, belts, satchels, etc.; and leather bags, bas- Leather traveling bags and suit caseskets . . . furnished
26 Passenger Cars
Dollar volume:Commodity coverage:Automobiles chassis
Dollar volume:Commodity coverage:Motorcycles and bicycles
Dollar volume:Commodity coverage:Motor boats
1,505 234,292
Passenger cars and chassis
27 Auto-parts and Accessories
no correction necessary
28 Motorcycles, Bicycles and Accessories
57 4,983
Bicycles, motorcycles and parts
29 Pleasure-craft
303 1,182
Motor boats with engines installed
30 Ophthalmic Products and Surgical and Orthopedic Appliances
Dollar volume: 233 2,057
Commodity coverage:Spectacles, eyeglasses, goggles, and frames; and lenses . . . for Spectacles, eyeglasses, lenses and frames; lenses not fitted to ixspectacles struments; and surgical artificial limbs, etc.
31 Monuments and TombstonesDollar volume: none none
Commodity coverage:Twist drills, learners, cutters, etc.; and industrial, office andprinting machinery (cxci. locomotives, marine, automobile, andairship engines and repairs, sewing machines (under $75), anti-friction bearings, typewriters and parts, cash registers and parts,lawn mowers, calendar rolls, and combined adding and typewrit-ing machines)
Commodity coverage:Electrical machinery and apparatus (cxci. electric lamps, fansand blowers, table and householdutensils, therapeutic appara-tus, radio apparatus, spark plugs and batteries); telegraph, tele-phone and other insulated wire; and submarine cable
Industrial machinery (cxci. locomotives and parts, boilers ansteam specialties, condensers, heaters and accessories, gasoiinlocomotives, marine engines, elevators, domestic sewingchines, refrigerating equipment, and ball and rollerprinting machinery; pumps for gasoline and oil; and portablelectric tools
Electrical machinery and apparatus (excl. batteries, motoiunder 1 h.p., railway motors, locomotives, portable electric toolall electrical appliances, except industrial furnaces and ovenradio apparatus and other electric apparatus); insulated iron csteel wire and cable; insulated copper wire and cable
IMPORTS EXPORTS
24 Printing and Publishing: Books
languages Books and pamphletsmusic, in
32 Industrial Machinery and EquipmentDollar volume: 28,849 261,243
33 Electrical Appliances, Industrial and CommercialDollar volume: 1,579 46,982
Dollar volume:34a, c Farm Machidery and Equipment and Business Wagons
9,989 71,708
Commodity coverage:Barbed wire; shovels, spades, scoops, etc., scythes, sickles, etc.; Agricultural machinery and implements (except tractors); barbe
[192]
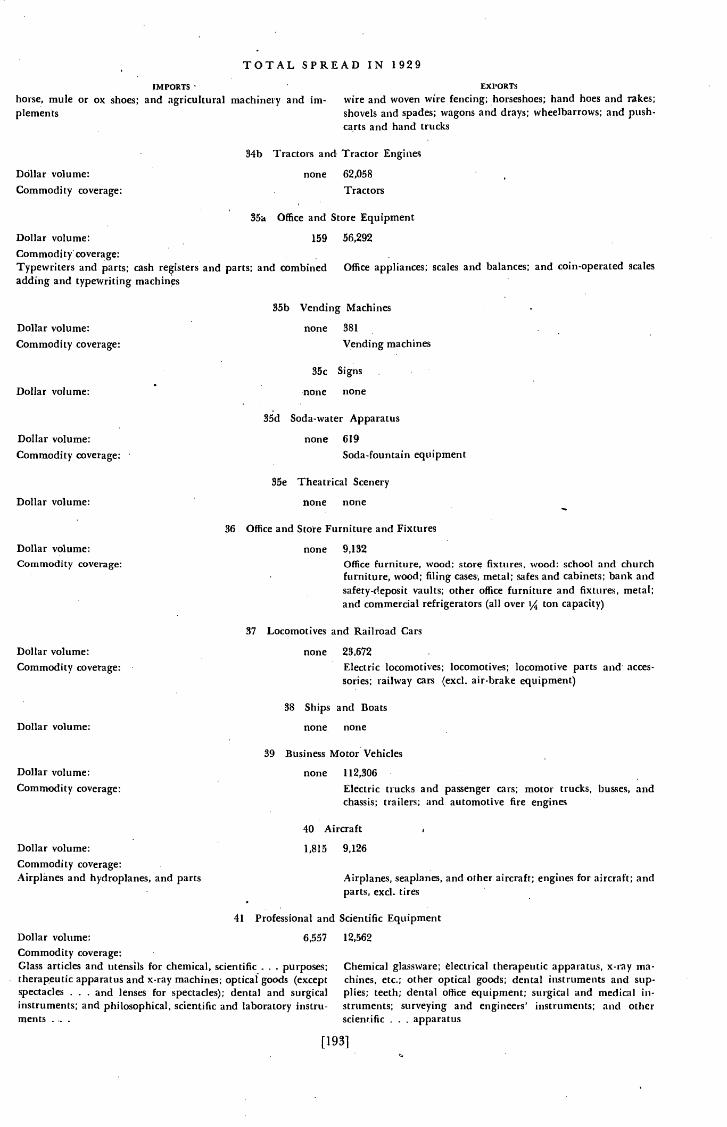
TOTAL SPREAD IN 1929iMPORTS' EXPORTS
horse, mule or shoes; and agricultural machinery and im- wire and woven wire fencing; horseshoes; hand hoes and rakes;plements shovels and spades; wagons and drays; wheelbarrows; and push-
carts and hand trucks
34b Tractors and Tractor Engines
Ddllar volume:Commodity coverage:
none 62,058
Tractors
35a Office and Store Equipment
Dollar volume: 159 56,292
Commodity coverage: S
Typewriters and parts; cash registers and parts; and combined Office appliances; scales and balances; and coin-operated scalesadding and typewriting machinçs
35b Vending Machines
Dollar volume:
Commodity coverage:
Dollar volume:
Dollar volume:Commodity coverage:
Dollar volume:
Dollar volume:Commodity coverage:
Dollar volume:Commodity coverage:
Dollar volume:Commodity coverage:Airplanes and hydroplanes, and parts
Dollar volume:
none none
35d Soda-water Apparatus
none 619
Soda-fountain equipment
35e Theatrical Scenery
none none
36 Office and Store Furniture and Fixtures
none 9,132
Commodity coverage:Glass articles and utensils for chemical, scientific - purposes;therapeutic apparatus and x-ray machines; optical goods (exceptspectacles - . and lenses for spectacles); dental and surgicalinstruments; and philosophical, scientific and laboratory instru-ments -
Office furniture, wood: store fixtures, wood: school and churchfurniture, wood; filing cases, metal; sales and cabinets; bank andsafety-deposit vaults; other office furniture and fixtures, metal;and commercial refrigerators (all over 1/4 ton capacity)
Electric trucks and passenger cars; motor trucks, busses, andchassis; trailers; and automotive fire engines
Chemical glassware; electrical therapeutic apparatus, x-ray ma-chines, etc.; other optical goods; dental instruments and sup-plies; teeth; dental office equipment; surgical and medical in-struments; surveying and engineers' instruments; and otherscientific . . . apparatus
[193]
none 381
Vending machines
35c Signs
Dollar volume:
Dollar volume:Commodity coverage:
37 Locomotives and Railroad Cars
none 23,672
Electric locomotives; locomotives; locomotive parts and acces-sories; railway cars (excl. air-brake equipment)
38 Ships and Boats
none, none
39 Business Motor Vehicles
none 112,306
40 Aircraft
1,815 9,126
Airplanes, seaplanes, and other aircraft; engines for aircraft; andparts, excl. tires S
41 Professional and Scientific Equipment
6,557 12,562
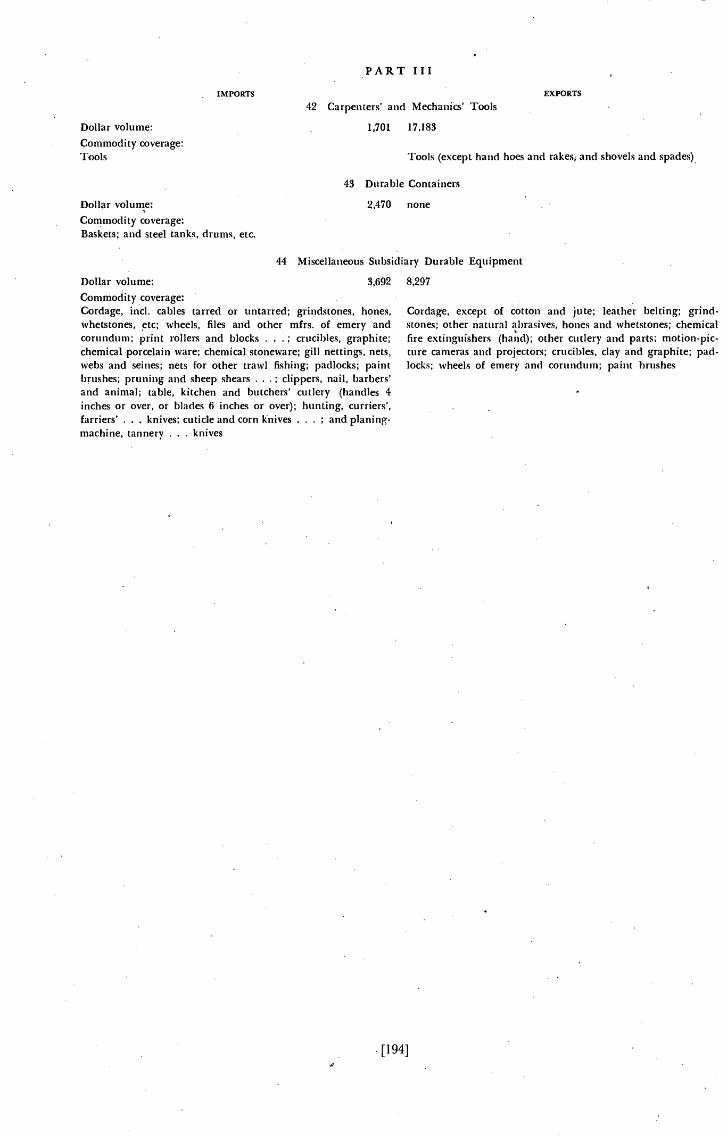
IMPORTS
PART III
42 Carpenters' and Tools
Dollar volume: 2,470 noneCommodity coverage:Baskets; and steel tanks, drums, etc.
Dollar volume: 8,692 8,297
EXPORTS
Commodity coverage:Cordage, md. cables tarred or untarred; grindstones, hones,whetstones, etc; wheels, files and other mfrs. of emery andcorundum; print rollers and blocks ; cnlcil)les, graphite;chemical porcelain ware; chemical stoneware; gill nettings, nets,webs and seines; nets for other trawl fishing; padlocks; paintbrushes; pruning and sheep shears . ; clippers, nail, barbers'and animal; table, kitchen and butchers' cutlery (handles 4inches or over, or blades 6 inches or over); hunting, curriers',farriers' . knives; cuticle and corn knives . ; and planing-machine, tannery . knives
Cordage, except of cotton and jute; leather belting; grind-stones; other natural abrasives, hones and whetstones; chemicalfire extinguishers (hand); other cutlery and parts; motion-pic-ttire cameras and projectors; crucibles, clay and graphite; pad-locks; wheels of emery and corundum; paint brushes
Dollar volume: 1,701 17,183
Commodity coverage:Tools Tools (except hand hoes and and shovels and spades)
43 Durable Containers
44 Miscellaneous Subsidiary Durable Equipment
.[194]
Table 111—3
FINISHED PRODUCTS IN WHOLESALE TRADE,
MINOR COMMODITY GROUPS, 1929
This table shows the cost to wholesalers of finished commodities purchasedin 1929 (including transportation charges and imports), sales by wholesalers(estimated by the volume of sales and the mark-up methods), and the dis-tribution of sales among exports, sales to ultimate consumers and sales toretailers. The steps in estimating wholesale sales by the volume of salesmethod and in determining the distribution of sales are described in NoteA. The derivation of 'the wholesale margins used in the mark-up methodis shown in Note B.
Comments on this table will be found in the Preface to Part III, Section 2.
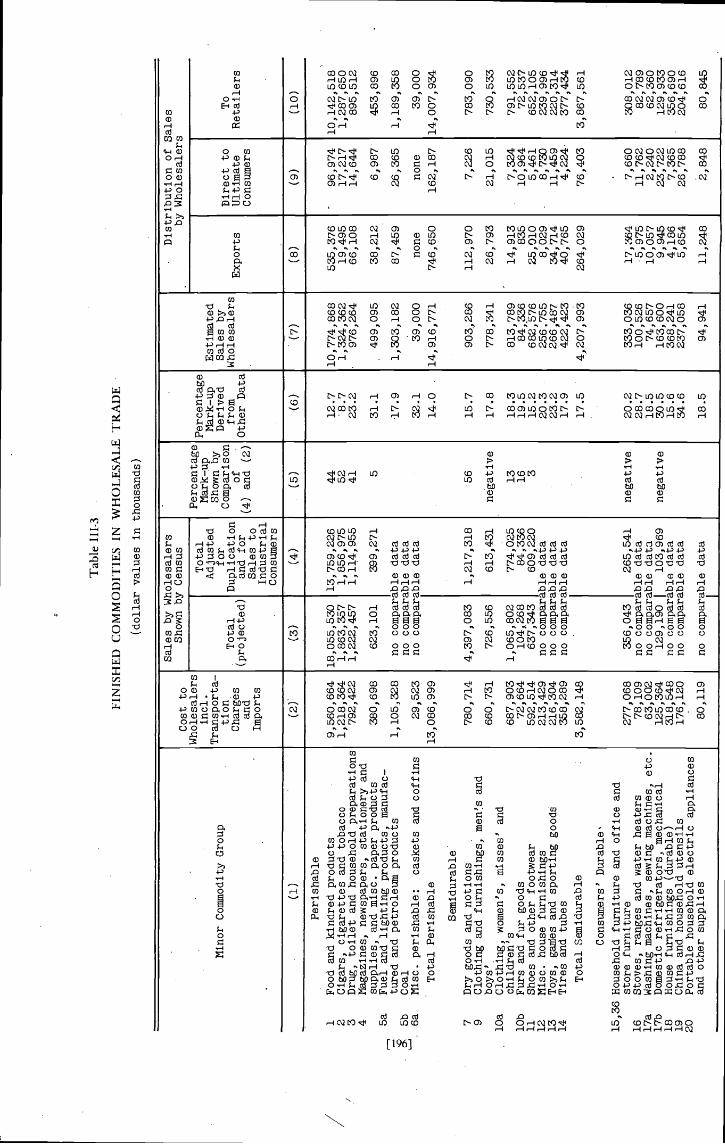
Tab
le 1
11-3
FIN
ISH
ED
CO
MM
OD
ITIE
S IN
WH
OL
ESA
LE
TR
AD
E
(dol
lar
valu
es in
thou
sand
s)
.
Minor Commodity Group
.
Cost to
Wholesalers
Trans
orta
-Charges
and
imorts
p
Sales by Wholesalers
Shown by Census
Percentage
Shown b
Corn
(4) arid
(2)
Percentage
Derived
from
Other Data
Sales by
Wholesalers
•
-D
istr
ibut
ion
of Sales
by Wholesalers
Total
.
Total
us e
for
Duplication
and for
Sales to
Industrial
Consumers
Exports
Direct to
Ultimate
Consumers
To
Retailers
(1)
(2)
(3)
(4)
(5)
-(s)
(7)
(8)
(9)
(10)
Perishable
1Food and
kind
red
products
2Cigars, cigarettes and
toba
cco
3Drug, toilet and household preparations
4Magazines, newspapers, stationery and
supplies, and misc. paper products
5a
Fuel and
light
ing
products, manufac—
tured and
petr
oleu
mproducts
5b
Coal
6a
Misc. perishable:
caskets and coffins
Total Perishable
Semidurable
7Dry goods and notions
9Clothing and
furn
ishi
ngs,
men's and
boys
'.lOa
Clothing, women's, misses' and
child
ren'
slOb
Furs and fur
good
s11
Shoes and
othe
rfootwear
12
Misc. house furnishings
13
Toys, galilee and sporting goods
14
TIres and tubes
Total Semidurable
Consumers' Durable'
15,36 Household furniture and
offi
ceand
store furnIture
16
Stoves, ranges and water heaters
17a
Washing machines, sewing machines, etc.
17b
Dom
estic
refrigerators, mechanical
18
House furnishings (durable)
19
China and household utensils
20
Portable household electric appliances
and other supplies
9,560,664
1,218,364
792,422
380,698
1,105,328
29,523
13,086,999
780,714
660,731
687,903
72,664
592,514
213,429
216,304
358,289
3,582,148
277,068
78,109
63,002
125,364
318,
548
176,120
- 80,1
19
18,055,530
13,759,226
1,863,357
1,856,975
1,222,457
1,114,955
623,101
399,271
no comparable data
no comparable data
no comparable data
4,397,083
1,217,318
726,556
613,431
1,065,802
774,025
104,268
84,336
637,343
609,220
no comparable data
no comparable data
no comparable data
.
356,
043
265,541
no comparable data
no comparable data
129,190
103,969
no comparable data
no comparable data
no comparable data
44
5241 5
56
negative
13 16 3
negative
negative
12.7
8.7
23.2
31.1
-17.9
32.1
14.0
15.7
17.8
18.3
19.5
15.2
20.3
23.2
17.9
17.5
20.2
28.7
18.5
30.5
15.6
34.6
18.5
10,774,868
1,324,362
976,264
499,095
1,303,182
. 39,0
0014,916,771
903,286
778,341
813,789
84,336
682,576
256.755
266,487
422,423
4,207,993
333,036
100,526
74,657
163,600
368,241
237,058
94,941
535,376
19,495
66,108
38,212
87,459
none
746,650
112,970
26,793
14,913
835
25,010
8,029
34,714
40,765
264,029
17,364
5,975
10,057
9,945
4,186
5,654
11,248
-96
,974
17,217
14,644
6,987
26,365
none
162,187
7,226
21,015
7,324
10,964
5,461
8,730
11,459
4,224
76,403
. 7,66
011,762
2,240
23,7
227,365
26,788
. 2,84
8
10,142,518
1,287,650
895,512
453,896
1,189,358
39,000
14,007,934
783,090
730,533
791,552
72,537
652,105
239,996
220,314
377,434
3,867,561
308,012
82,789
62,360
129,933
356,690
204,616
80,845
'0 C'
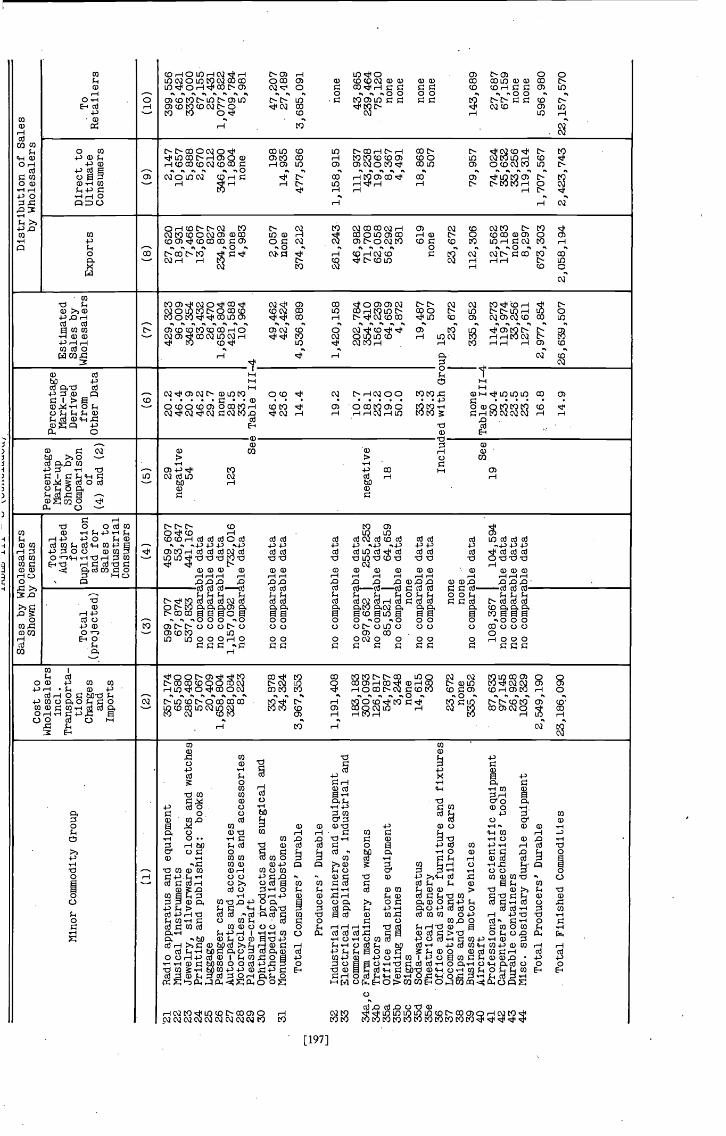
.Lflh
Jl_1
LaiL
l.s,
Minor Commodity Group
Sales by Wholesalers
Shown by Census
Cost to
Wholesalers
mci.
Transporta-
ti on
Charges
and.
Imports
Total
(projected)
Total
Ad jus
ted
for
Duplication
and for
Sales to
Industrial
Consumers
Percentage
Hark-up
Shown by
Comparison
of
(4) and (2)
Percentage
Hark-up
Derived
from
Other Data
Distribution of Sales
by Wholesalers
Estimated.
Sales by
Wholesalers
Exports
Direct to
Ultimate
Consumers
r
To
Retailers
.(1)
(2)
(3)
(5)
(6)
(7)
(8)
(9)
(10)
2122
RadIo apparatus and equipment
Musical instruments
357,174
65,580
599,707
459,607
67,874
53,647
29
negative
20.2
46.4
429,323
96,009
27,620
18,931
2,147
10,657
399,556
.66,421
2324
25
26272829
Jewelry, silverware, clocks and watches
Printing and publishing:
books
Luggage
Passenger cars
Auto—parts and accessories
Motorcycles, bicycles and accessories
Pleasure—craft
286,480
57,067
20,409
1,658,804
328,084
8,223
.
537,833
441,167
no comparable data
no comparable data
no comparable data
1,157,092
I73
2,01
6no comparable data
5.
20.9
346,354
46.2
83,4-32
29.7
26,470
none
1,658,804
123
28.5
421,588
33.3
10,964
See Table 111—4
7,466
13,607
827
234,892
none
4,983
5,888
2,670
212
346,690
11,804
none
333,000
67,155
25,431
1,077,822
409,784
5,98
1.
30
31
OphthalmIc products and surgical and
orthopedic appliances
Monuments and tombstones
,
33,8
7834,324
no comparable data
no comparable data
46.0
23.6
49,462
42,424
?,057
none
198
14,935
47,207
27,489
Total Consumers' Durable
3,967,353
.14.4
4,536,889
374,212
477,586
3,685,091
Producers' Durable
3233
Industrial machinery and equipment
Electrical appliances, industrial and
1,191,408
no comparable data
.19.2
.
1,420,158
261,243
1,158,915
none
34a,c
34b
35a
35b
commercial
Farm machinery and wagons
Trac.tors
Off ice and store equipment
Vending machines
183,183
300,093
126,817
54,787
3,248
no
data
297,632
255,253
no comparable data
85,521
64,659
no comparable data
.
nega
tive
.
18
10.7
18.1
23.2
19.0
50.0
202,784
354,410
156,239
64,659
4,872
46,982
71,708
62,058
56,292
381
111,937
43,238
19,061
8,367
4,491
43,865
239,464
75,120
none
none
35c
Signs
none
none
35d
35e
Soda-water apparatus
Theatrical scenery
14,615
380
no comparable data
no comparable data
33.3
33.3
19,487
507
619
none
18,868
507
none
none
36
Office and store furniture and fixtures
Included with Group 15
37
38
Locomotives and railroad cars
Ships and boats
23,672
none
none
none
.23,672
23,672
.
3940
Business motor vehicles
Aircraft
335,952
no comparable data
See
none
335,952
Table 111-4
112,306
79,957
143,689
0
4142
4344
Professional and scientific equipment
Carpenters' and mechanics' tools
Durable containers
Misc. subsidiary durable equipment
87,633
97,145
26,928
103,329
108,367
104,594
no comparable data
no comparable data
no comparable data
19
.30.4
2,3.5
23.5
23.5
114,273
119,974
33,2560
127,
611
12,562
17,183
none
8,297
74,024
35,632
33,256
119,314
27,687
67,159
none
none
Total Producers' Durable
2,549,190
16.8
2,977,854
673,303
1,707,567
596,980
Total Finished Commodities
23,186,090
14.9
26,639,507
2,058,194
2,423,743
22,157,570
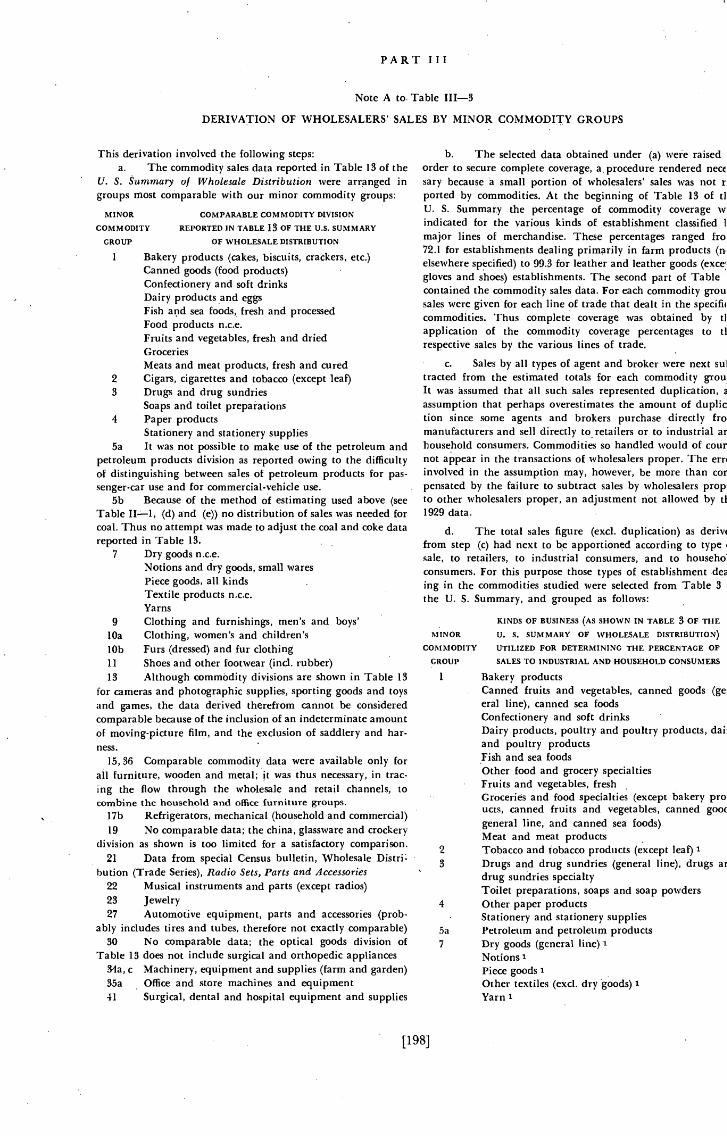
PART III
Note A to Table 111—3
DERIVATION OF WHOLESALERS' SALES BY MINOR COMMODITY GROUPS
This derivation involved the following steps:a. The commodity sales data reported in Table 13 of the
U. S. Summary of Wholesale Distribution were arranged ingroups most comparable with our minor commodity groups:
1 Bakery products (cakes, biscuits, crackers, etc.)Canned goods (food products)Confectionery and soft drinksDairy products and eggsFish and sea foods, fresh and processedFood products n.c.e.Fruits and vegetables, fresh and driedGroceriesMeats and meat products, fresh and cured
2 Cigars, cigarettes and tobacco (except leaf)3 Drugs and drug sundries
Soaps and toilet preparations4 Paper products
Stationery and stationery supplies5a It was not possible to make use of the petroleum and
petroleum products division as reported owing to the difficultyof distinguishing between sales of petroleum products for pas-senger-car use and for commercial-vehicle use.
Sb Because of the method of estimating used above (seeTable lI—I, (d) and (e)) no distribution of sales was needed forcoal. Thus no attempt was made to adjust the coal and coke datareported in Table 13.
7 Dry goods n.c.e.Notions and dry goods, small waresPiece goods, all kindsTextile products n.c.e.YarnsClothing and furnishings, men's and boys'Clothing, women's and children'sFurs (dressed) and fur clothingShoes and other footwear (md. rubber)
13 Although commodity divisions are shown in Table 13for cameras and photographic supplies, sporting goods and toysand games, the data derived therefrom cannot be consideredcomparable because of the inclusion of an indeterminate amountof moving-picture film, and the exclusion of saddlery and har-ness.
15, 36 Comparable commodity data were available only forall furniture, wooden and metal; it was thus necessary, in trac-ing the flow through the wholesale and retail channels, tocombine the household and office furniture groups.
17b Refrigerators, mechanical (household and commercial)19 No comparable data; the china, glassware and crockery
division as shown is too limited for a satisfactory comparison.21 Data from special Census bulletin, Wholesale Distri
bution (Trade Series), Radio Sets, Parts and Accessories22 Musical instruments and parts (except radios)23 Jewelry27 Automotive equipment, parts and accessories (prob-
ably includes tires and tubes, therefore not exactly comparable)30 No comparable data; the optical goods division of
Table 13 does not include surgical and orthopedic appliances34a, c Machinery, equipment and supplies (farm and garden)35a Office and store machines and equipment41 Surgical, dental and hospital equipment and supplies
b. The selected data obtained under (a) were raisedorder to secure complete coverage, a procedure rendered neccsary because a small portion of wholesalers' sales was not rported by commodities. At the beginning of Table 13 of tlU. S. Summar.y the percentage of commodity coverage windicated for the various kinds of establishment classified 1
major lines of merchandise. These percentages ranged fro721 for establishments dealing primarily in farm products (nelsewhere specified) to 99.3 for leather and leather goods (excegloves and shoes) establishments. The second part of Tablecontained the commodity sales data. For each commodity grousales were given for each line of trade that dealt in the speciflicommodities. Thus complete coverage was obtained by iiapplication of the commodity coverage percentages to tlrespective sales by the various lines of trade.
c. Sales by all types of agent and broker were next sultracted from the estimated totals for each commodity grouIt was assumed that all such sales represented duplication,assumption that perhaps overestimates the amount of dupliction since some agents and brokers purchase directly fromanufacturers and sell directly to retailers or to industrial athousehold consumers. Commodities so handled would of cournot appear in the transactions of wholesalers proper. The erriinvolved in the assumption may, however, be more than coiipensated by the failure to subtract sales by wholesalers propito other wholesalers proper, an adjustment not allowed by ti1929 data.
d. The total sales figure (exci. duplication) as derivefrom step (c) had next to be apportioned according to typesale, to retailers,, to industrial consumers, and to householconsumers. For this purpose those types of establishment deaing in the commodities studied were selected from Table 3the U. S. Summary, and grouped as follows:
[198]
KINDS OF BUSINESS (As SHOWN IN TABLE 3 OF THE
U. S. SUMMARY OF WHOLESALE DISTRIBUTION)
UTILIZED FOR DETERMINING THE PERCENTAGE OF
SALES TO INDUSTRIAL AND HOUSEHOLD CONSUMERS
Bakery productsCanned fruits and vegetables, canned goods (geleral line), canned sea foodsConfectionery and soft drinksDairy products, poultry and poultry products, daiiand poultry productsFish and sea foodsOther food and grocery specialtiesFruits and vegetables, freshGroceries and food specialties (except bakery proucts, canned fruits and vegetables, canned goo*igeneral line, and canned sea foods)Meat and meat products
2 Tobacco and tobacco products (except leaf) I3 Drugs and drug sundries (general line), drugs ar
drug sundries specialtyToilet preparations, soaps and soap powders
4 Other paper productsStationery and stationery supplies
5a Petroleum and petroleum products7 Dry goods (general line)
Notions 1Piece goods 1Other textiles (excl. dry goods) 1Yarn 1
MINOR
COMMODITY
GROUP
COMPAItABLE COMMODITY DIVISION
REPORTED IN TABLE 13 OF THE U.S. SUMMARY
OF WHOLESALE DISTRIBUTION
9
I Oa
I Ob
11
MINOR
COMMODITY
GROUP
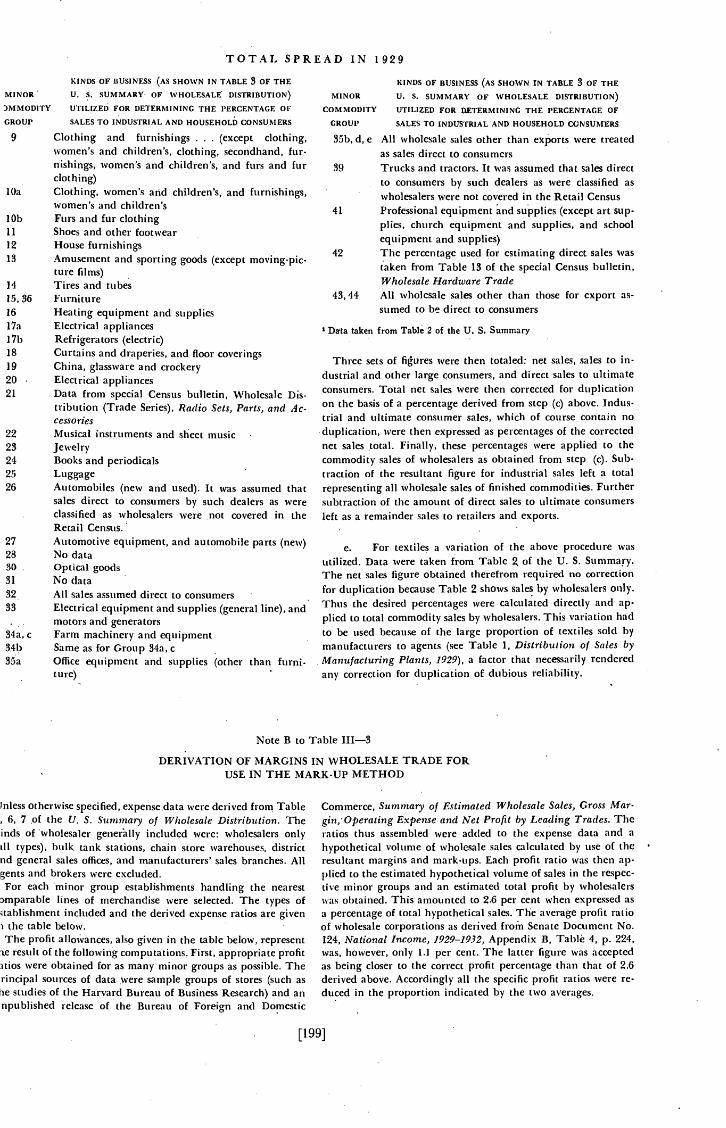
TOTAL SPREAD IN 1929KINDS OF BUSINESS (As SHOWN IN TABLE 3 OF THE
U. S. SUMMARY- OF SVHOLESALE DISTRIBUTION)
UTILIZED FOR DETERMINING THE PERCENTAGE OF
SALES TO INDUSTRIAL AND HOUSEHOLD CONSUMERS
9 Clothing and furnishings . . . (except clothing,women's and children's, clothing, secondhand, fur-nishings, women's and children's, and furs and furclothing)
lOa Clothing, women's and children's, and furnishings,women's and children's
lOb Furs and fur clothing11 Shoes and other footwear12 House furnishings13 Amusement and sporting goods (except moving-pic-
ture films)14 Tires and tubes15,36 Furniture16 Heating equipment and supplies17a Electrical appliances17b Refrigerators (electric)18 Curtains and draperies, and floor coverings19 China, glassware and crockery20 Electrical appliances21 Data from special Census bulletin, Wholesale Dis-
tribution (Trade Series), Radio Sets, Parts, and 4c-Cessories
22 Musical instruments and sheet music23 Jewelry24 Books and periodicals25 Luggage26 Automobiles (new and used). It was assumed that
sales direct to consumers by such dealers as wereclassified as wholesalers were not covered in theRetail Census.Automotive equipment, and automobile parts (new)No dataOptical goodsNo dataAll sales assumed direct to consumersElectrical equipment and supplies (general line), andmotors and generatorsFarm machinery and equipmentSame as for Group 34a, c -
Office equipment and supplies (other than furni-ture) -
KINDS OF BUSINESS (AS SHOWN IN TABLE 3 OF THE
U. S. SUMMARY OF WHOLESALE DISTRIBUTION)
UTILIZED FOR DETERMINING THE PERCENTAGE OF
SALES TO INDUSTRIAL AND HOUSEHOLD CONSUMERS
35b, d, e All wholesale sales other than exports were treatedas sales direct to consumers
39 Trucks and tractors. It was assumed that sales directto consumers by such dealers as were classified aswholesalers were not covered in the Retail Census
41 Professional equipment and supplies (except art sup-plies, church equipment and supplies, and schoolequipment and supplies)
42 The percentage used for estimating direct sales wastaken from Table 13 of the special Census bulletin,Wholesale Hardware Trade
43, 44 All wholesale sales other than those for export as-sumed to be direct to consumers
1 Data taken from Table 2 of the U. S. Summary
Three sets of figures were then totaled: net sales, sales to in-dustrial and other large consumers, and direct sales to ultimateconsumers. Total net sales were then corrected for duplicationon the basis of a percentage derived from step (c) above. Indus-trial and ultimate consumer sales, which of course contain noduplication, were then expressed as percentages of the correctednet sales total. Finally, these percentages were applied to thecommodity sales of wholesalers as obtained from step (c). Sub-traction of the resultant figure for industrial sales left a totalrepresenting all wholesale sales of finished commodities. Furthersubtraction of the amount of direct sales to ultimate consumersleft as a remainder sales to retailers and exports.
e. For textiles a variation of the above procedure wasutilized. Data were taken from Table of the U. S. Surnmaiy.The net sales figure obtained therefrom required no correctionfor duplication because Table 2 shows sales by wholesalers only.Thus the desired percentages were calculated directly and ap.plied to total commodity sales by wholesalers. This variation hadto be used because of the large proportion of textiles sold bymanufacturers to agents (see Table 1, Distribution of Sales by
•Manufacturing Plants, 1929), a factor that necessarily renderedally correction for duplication of dubious reliability.
Note B to Table 111—3
DERIVATION OF MARGINS IN WHOLESALE TRADE FORUSE IN THE MARK-UP METHOD
rnless otherwise specified, expensedata were derived from Table6, 7 of the U. S. Summary of Wholesale Distribution. The
inds of wholesaler included were: wholesalers onlydl types), bulk tank stations, chain store warehouses, districtnd general sales offices, and manufacturers' sales branches. Allgents and brokers were excluded.For each minor group establishments handling the nearestmparable lines of merchandise were selected. The types of
included and the derived expense ratios are giveni the table below.The profit allowances, also given in the table below, represent
ie result of the following computations. First, appropriate profitwere obtained for as many minor groups as possible. The
rincipal sources of data were sample groups of stores (such ashie studies of the Harvard Bureau of Business Research) and annpublished release of the Bureau of Foreign and Domestic
[199]
Commerce, Summary of Estimated Wholesale Sales, Gross Mar-gin; Operating Expense and Net Profit by Leading Trades. Theratios thus assembled were added to the expense data and a
hypothetical volume of wholesale sales calculated by use of theresultant margins and mark-tips. Each profit ratio was then ap-plied to the estimated hypothetical volume of sales in the respec-tive minor groups and an estimated total profit by wholesalerswas obtained. This amounted to 2.6 per cent when expressed asa percentage of total hypothetical sales. The average profit ratioof wholesale corporations as derived from Senate Document No.124, National Income, 1929—1932, Appendix B, Table 4, p. 224,was, however, only 1.1 per cent. The latter figure was acceptedas being closer to the correct profit percentage than that of 2.6derived above. Accordingly all the specific profit ratios were re-duced in the proportion indicated by the two averages.
MINOR'
DMMODITY
GROUP
MINOR
COMMODITY
GROUP
272830
31
3233
34a, c34b35a
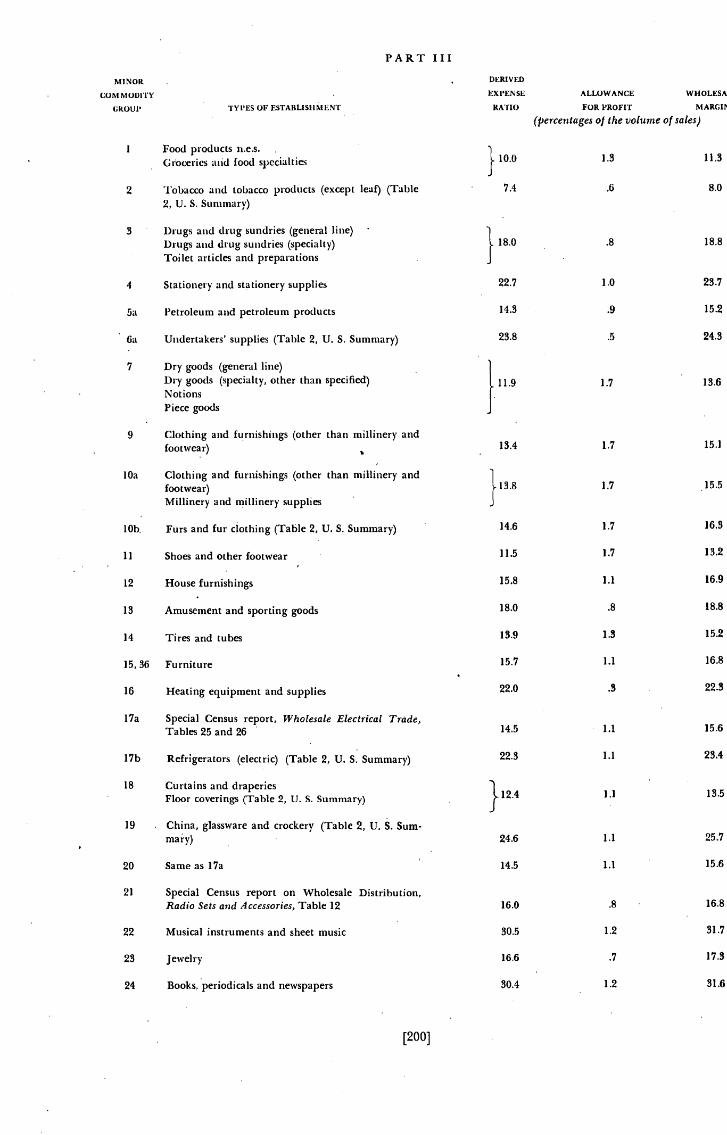
PART IIIMINOR , DERIVED
COMMODITY EXPENSE ALLOWANCE WHOLESA
CROUP TYPES OF ESTABLISHMENT RAIi() FOR PROFIT MARGII
(percentages of the volume of sales)
1 Food products n.e.s.Giocerics atid food specialties 10.0 1.3 11.3
2 Tobacco and tobacco products (except leaf) (Table 7.4 .6 8.0
2, U. S. Summary)
3 Drugs and drug sundries (general line)Drugs and drug sundries (specialty) 18.0 .8 18.8
Toilet articles and preparations J
4 Stationery and stationery supplies 22.7 1.0 23.7
5a Petroleum and petroleum products 14.3 .9 15.2
6a Undertakers' supplies (Table 2, U. S. Summary) 23.8 .5 24.3
7 Dry goods (general line)Dry goods (specialty, other than specified) 11.9 1.7 13.6NotionsPiece goods
9 Clothing and furnishings (other than millinery andfootwear) 13.4 1.7 15.1
lOa Clothing and furnishings (other than millinery and 1
footwear) 1.7 15.5
Millinery and millinery supplies J
lob. Furs and fur clothing (Table 2, U. S. Summary) 14.6 1.7 16.3
11 Shoes and other footwear 11.5 1.7 13.2
12 House furnishings 15.8 1.1 16.9
13 Amusement and sporting goods 18.0 .8 18.8
14 Tires and tubes 13.9 1.3 15.2
15, 36 Furniture 15.7 1.1 16.8
16 Heating equipment and supplies 22.0 .3 22.3
17a Special Census report, Wholesale Electrical Trade,Tables 25 and 25 14.5 1.1 15.6
17b Refrigerators (electric) (Table 2, U. S. Summary) 22.3 1.1 23.4
18 Curtains and draperiesFloor coverings (Table 2, U. S. Summary) }i24 1.1 13.5
19 China, glassware and crockery (Table 2, U. S. Sum-mary) 24.6 1.1 25.7
20 Same as 17a 14.5 1.1 15.6
21 Special Census report on Wholesale Distribution,Radio Sets and Accessories, Table 12 16.0 .8 16.8
22 Musical instruments and sheet music 30.5 1.2 31.7
23 Jewelry 16.6 .7 17.3
24 Books, periodicals and newspapers 1.2 31.6
[200]
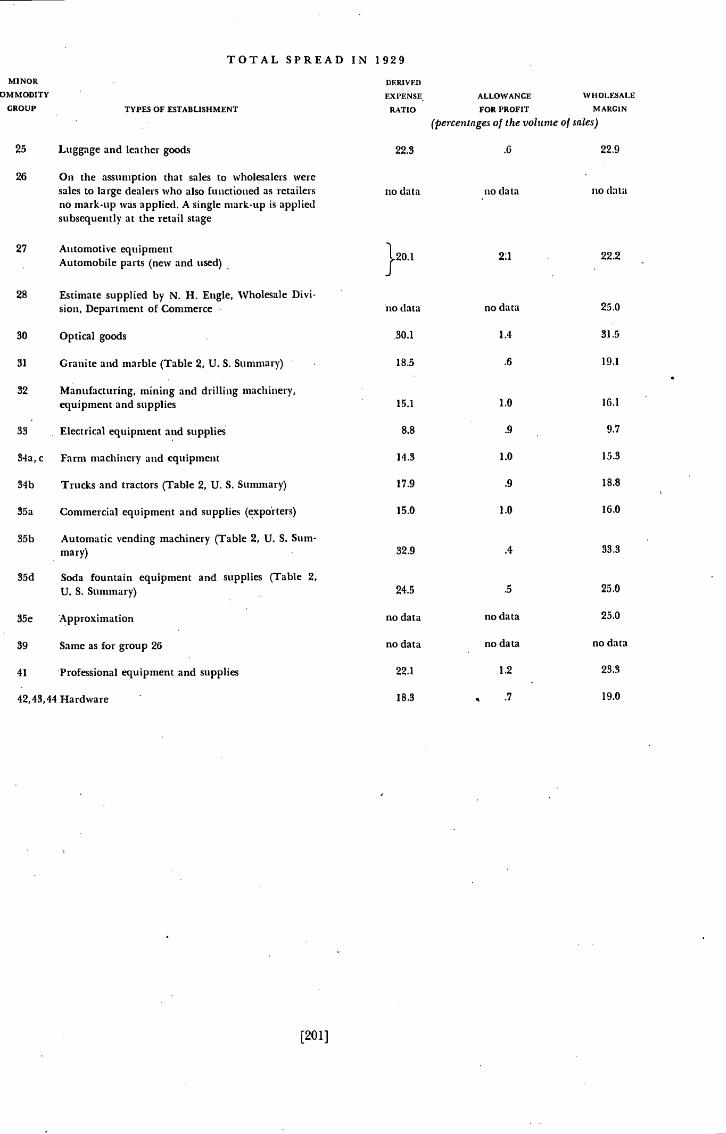
25 Luggage and leather goods
26 On the assumption that sales to wholesalers weresales to large dealers who also functioned as retailersno mark-up was applied. A single mark-up is appliedsubsequently at the retail stage
27 Automotive equipment20 1Automobile parts (new and used) -
28 Estimate supplied by N. H. Engle, Wholesale Divi-sion, Department of Commerce
30 Optical goods
31 Granite and marble (Table 2, U. S. Summary)
32 Manufacturing, mining and drilling machinery,equipment and supplies
Electrical equipment and supplies33
34a, c Farm machinery and equipment
34b Trucks and tractors (Table 2, U. S. Summary)
35a Commercial equipment and supplies (exporters)
35b Automatic vending machinery (Table 2, U. S. Sum-mary)
35d Soda fountain equipment and supplies (Table 2,U. S. Summary)
35e 'Approximation
39 Same as for group 26
41 Professional equipment and supplies
42, 43, 44 Hardware
MINOR
OMMODITY
GROUP
TOTAL SPREAD IN 1929DERIVED
EXPENSE
TYPES OF ESTABLISHMENT RATIO
22.3
ALLOWANCE WHOLESALE
FOR PROFIT MARGIN
(percentages of the volume of sales)
.6 22.9
no data
no data
data no data
2:1 22.2
no data 25.0
30.1 1.4 31,5
18.5 .6 19.1
15.1 1.0 16.1
8.8 .9 . 9.7
14.3 1.0 15.3
17.9 .9 18.8
15.0 1.0 16.0
32.9 .4 33.3
24.5 .5 25.0
no data no data 25.0
no data no data no data
22.1 1.2 23.9
18.3 .7 19.0
[201]

p

Table 111—4
FINISHED COMMODITIES IN RETAIL TRADE, 1929
This table shows for 1929 the cost to retailers of finished commodities, thesales of such commodities by retailers (estimated by the volume of sales andthe mark-up methods), and the total sales of finished commodities at cost toultimate consumers. The steps in estimating retail sales by the volume ofsales method are described in Note A, and the derivation of the retail marginsused for the mark-up method in Note B.
Comments on this table will be found in the Preface to Part III, Sections3 and 4.
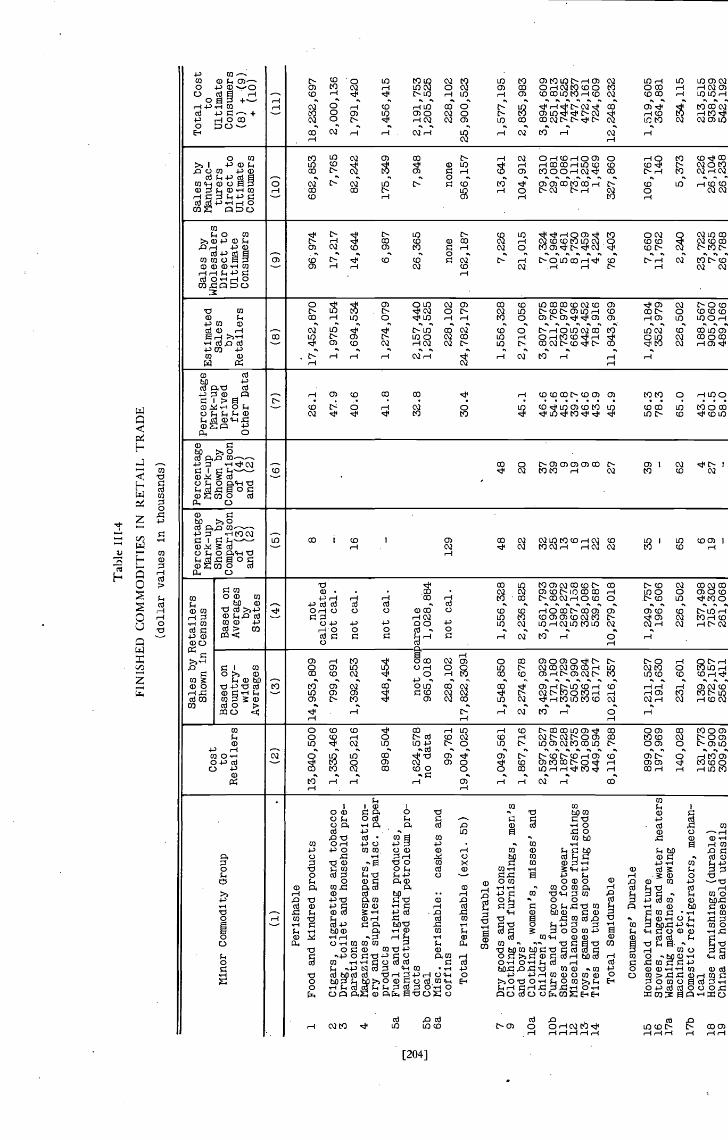
Tab
le I
I[-4
FIN
ISH
ED
CO
MM
OD
ITIE
S IN
RE
TA
IL T
RA
DE
(dol
lar
valu
es in
thou
sand
s)
Minor
ConmiodityGroup
Cost
to
Retailers
Sales by Retailers
Shown in Census
Percentage
Mark-up
Shown by
Comparison
of (3)
and
Percentage
Mark-Up
Shown by
Comparison
of (4)
and (2)
Percentage
Mark-up
Derived
from
Other Data
Estimated
Sales
by
Retailers
Sales by
Wholesalers
Direct to
Ultimate
Consumers
Sales by
?Iariu!ac—
turers
Direct to
Ultimate
Consumers
Total Cost
to
Ultimate
Consumers
(8) +
(9)
+(1
0)
Based on
Country—
wide
Averages
Based Ofl
Averages
by
States
.,(1
).
(2)
(3)
(4)
(5)
(6)
(7)
(8)
(9)
(10)
(11)
S
Perishable
1Food and kindred products
2Cigars, cigarettes and tobacco
3D
rug,
toile
tand.
hous
ehol
dpre-
parations
4Magazines, newspapers, station-
ery and supplies and misc. paper
products
Sa
Fuel and lighting products,
manufactured and petroleum pro-
ducts
5b
Coal
6a
Misc. perishable:
caskets and
coffins
Total Perishable (excl. 5b)
Semidurable
7Dry goods and notions
9Clothing and furnishings, men's
and boys'
lOa
Clothing, women's, misses' and
children's
lOb
Furs and fur goods
11
Shoes and other footwear
12
Miscellaneous house furnishings
13
Toys, games and sporting goods
14
Tires and tubes
Total Semidurable
Consumers' Durable
15
Household furniture
16
Stoves, ranges and water heaters
l7a
Washing machines, sewing
machines, etc.
17b
Domestic refrigerators, mechan—
i cal
18
House furnishings (durable)
19
China and household utensils
13,8
40,5
00
1,33
5,46
6
1,205,216
898,504
1,624,578
no data
99,761
19,004,025
1,049,561
1,867,716
2,597,527
136,978
1,187,228
476,375
301,809
449,594
8,11
6,78
8
899,030
197,969
140,028
131,
773
563,900
309,599
14,953,809
799,691
1,392,253
448,454
not comj
965,018
228, 102
17,822,3091
1,548,850
2,274,678
3,429,929
171,180
1,337,729
505,990
336,284
611,717
10,216,357
1,211,527
191,630
231,601
139,630
672,
157
256,411
not
calculated
not cal.
not cal.
not cal.
)araole
1,028,884
not cal.
1,556,328
2,236,825
3,56
1,79
3190,869
1,298,272
567,158
328,086
539,687
10,279,018
1,249,757
196,
606
226,502
137,498
715,302
261,
068
8
16
129
48
22
3225
13 6
1122
26
35
65 6
19
26.1
47.9
40 6
41.8
32.8
30.4
45.1
46.6
54.6
45.8
39.7
46.6
43.9
45.9
56.3
78.3
65.0
43.1
60.5
58.0
17,4
52,8
70
1,97
5,15
4
1,69
4,53
4
1,274,079
2,157,440
1,205,525
228,102
24,782,179
1,55
6,32
8
2,71
0,05
6
3,807,975
211,768
1,730,978
665,496
442,452
718,916
11,843,969
1,40
5,18
435
2,97
9
226,
502
188,567
905,060
489,166
96,974
17,217
14,6
44
6,98
7
26,365
none
162,187
7,226
21,015
7,324
10,964
5,461
8,730
11,4
594,224
76,4
03
7,66
011,762
2,240
23,
722
7,36
526,788
682,853
7,765
82,2
42
175,
349
7,94
8
none
956,
157
13,6
41
104,
912
79,310
29,081
8,086
73,111
l8,250
1,469
327,860
106,761
140
5,373
1,226
26,104
26,2
38
18,232,697
2,000,136
1,79
1,42
0
1,456,415
2,19
1,75
31,205,525
228,
102
25,9
00,5
23
1,57
7,19
5
2,83
5,98
3
3,89
4,60
925
1,81
31,
744,
525
747,
337
472,
161
724,609
12,2
48,2
32
1,51
9,60
5364,881
234,
115
213,
515
938,
529
542,
192
48
20
37
39 9
19 9 8
27
39
62 427
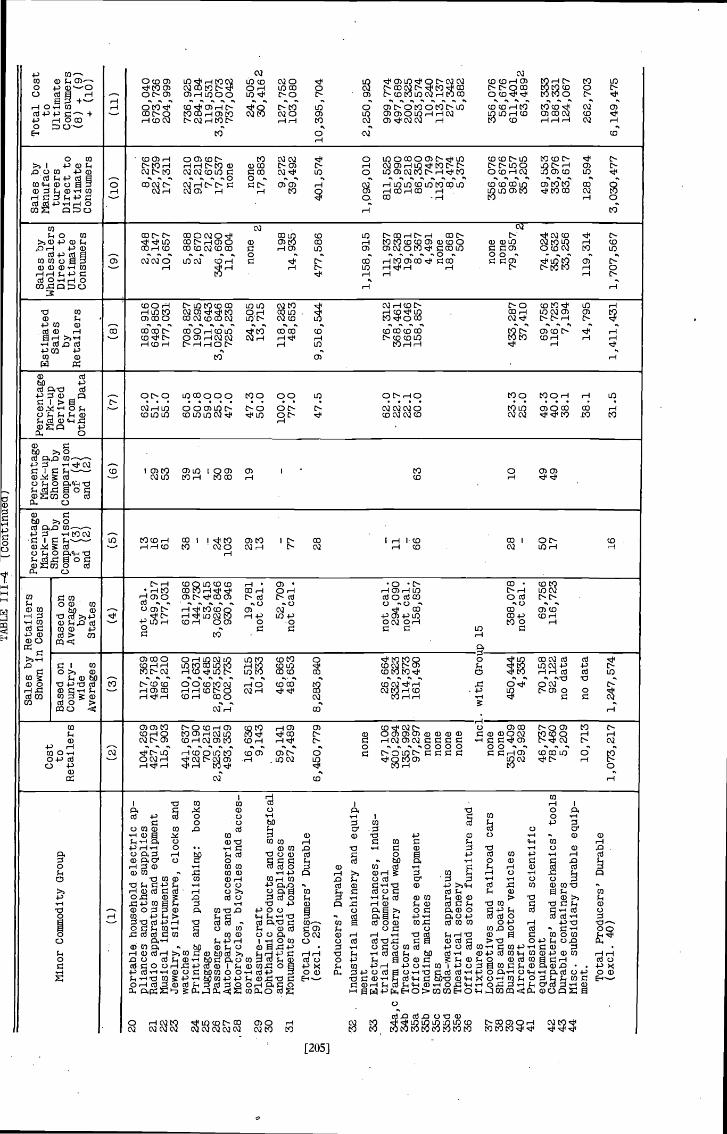
('I
IIF—
4(ContinueG)
Minor Commodity Group
Cost
to
Retailers
Sales by Retailers
Shown in Census
Percentage
Mark—up
Shown by
Comparison
(3)
and (25
Percentage
Mark-up
Shown by
Comparison
(4)
and (2)
Percentage
Mark-up
Derived
from
Other Data
Estimated
Sales
by
Retailers
Sales by
Wholesalers
Direct to
Ultimate
Consumers
Sales by
Manufac-
turers
Direct to
Ultimate
Consumers
Total Cost
to
Ultimate
Consumers
(8) +
(9)
+(1
0)
Based on
Country—
wide
Averages
Based on
Averages
by
States
•(1)
(2)
(3)
(4)
(5)
(6)
(7)
.
(8)
(9)
(10)
(11)
20
2122
Portable. household electric ap—
pliances and other supplies
Radio apparatus and equipment
Musical instruments
104,269
427,719
115,903
117,369
496,718
186,210
not cal.
549,917
177,031
13
1661
—.
29 53
62.0
51.7
55.0
168,916
648,850
177,031
2,848
2,147
10,657
.
8,27
622,739
17,311
180,040
673,736
204,999
23
24
252627
Jewelry, silverware, clocks and
watches
.
Prin
ting
and publishing:
books
Luggage
Passenger cars
Auto—parts and accessories
441,637
126,190
70,216
2,325,921
493,359
610,150
110,631
66,485
2,873,552
1,002,735
611,986
144,730
53,415
3,026,846
930,946
38 — —
24 103
39
15 —
30 89
60.5
50.8
59.0
25.0
47.0
708,827
190,295
111,643
3,026,846
725,238
5,888
2,670
212
346,690
11,804
22,210
91,219
7,676
17,537
none
736,925
284,184
119,531
3,391,073
737,042
28
29
Motorcycles, bicycles and acces—
cones
Pleasure-craft
. 16,6
369,143
21,515
10,333
-19
,781
not cal.
29 13
19
47.3
50.0
24,505
13,715
none
2none
17,883
24,505
30,4162
30 31
Oph
thal
mic
pro
duct
s an
dsurgical
and orthopedic appliances
Monuments and tombstones
59,141
27,489
46,866
48,653
52,709
not cal.
—.
77- .
100.
077
.011
8,28
248
,653
198
14,9
35-
9,27
239
,492
127,
752
103,
080
Total Consumers' Durable
.
(excl. 29)
6,450,779
8,283,840
28
47.5
9,516,544
477,586
401,574
10,395,704
Producers' Durable
32
33
Industrial machinery and equip-
ment
Electrical appliances, indus—
trial and
com
mer
cial
none
47,106
26,664
not cal.
.
—62.0
76,312
1,158,915
111,937
1,092,010
811,525
.
2,25
0,92
5
999,774
34a,c
34b
35a
35b
35c
35d
35e
Farm
mac
hine
ryand wagons
Tractors
Office and store equipment
Vending machines
Signs
.
Sod
a—w
ater
apparatus
Theatrical scenery
300,294
135,992
97,297
none
none
none
none
332,323
114,373
161,490
294,090
not cal.
158,857
.
11 — 66
63
22.7
22.1
60.0
368,461
166,046
158,857
-
43,238
19,061
8,367
4,491
none
18,868
507
85,990
15,218
86,350
5,749
113,137
8,474
5,375
497,689
200,325
253,574
10,240
113,137
27,342
5,882
36
Office and store furniture and-
-
fixtures
md.
with Group 15
.
37
Locomotives and railroad cars
none
.
.none
356,076
356,076
3839
40
Ships and boats
Business motor vehicles
Aircraft
none
351,409
29,928
450,444
4,335
388,078
not cal.
28 -
10
23.3
25.0
-43
3,28
737,410
none
56,676
98,157
35,205
56,676
611,401
63,4892
41
Professional and scientific
42
equipment
Carpenters' and mechanics' tools
46,737
78,460
70,158
92,122
69,756
116,723
.50 17
49
49
49.3
40.0
69,756
116,723
74,024
35,632
49,553
33,976
193,333
186,331
43
Durable containers
5,209
no data
38.1
7,194
33,256
83,617
124,067
44
Misc. subsidiary durable equip-
ment.
10,713
no data
.
-
38.1
14,795
119,314
128,594
262,703
Total Producers' Durable
•(exci. 40)
.1,073,217
1,247,574
16
31.5
1,411,431
1,707,567
3,030,477
6,149,475
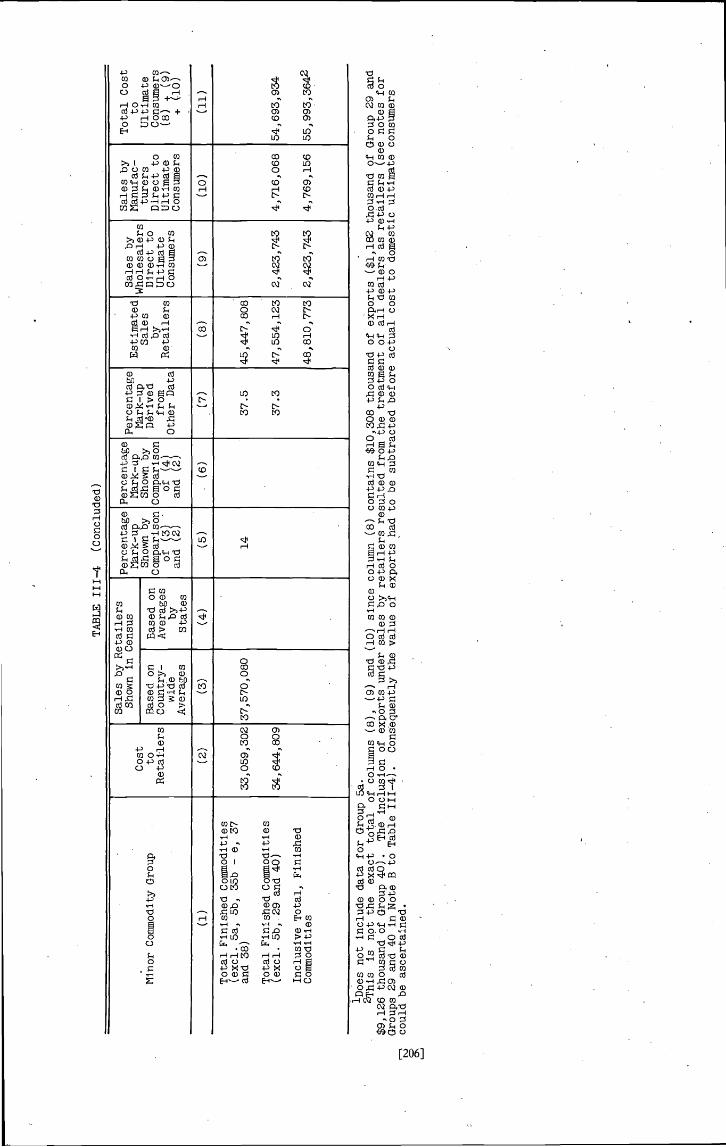
TABLE 111-4
(Concluded)
.M
inor
Commodity Group
Cost
to
Retailers
Sales by Retailers
Shown in Census
Percentage
Mark—up
Shown by
Comparison
of
and (2)
Percentage
Mark—up
Shown by
Comparison
Of
and
(2)
Percentage
Derived
from
Other Data
Estimated
Sales
by
Retailers
Sales by
Wholesalers
Direct to
Ultimate
Consumers
Sales by
Manufac—
turers
Direct to
Ultimate
Consumers
Total Cost
to
Ultimate
Consumers
(8) + (9)
+(.
10)
.
Based on
Country-
wide
Averages
Based on
Averages
Sta
tes
(1)
(2)
(3)
(4)
(5)
.(6
)(7)
(8)
(9)
(10)
(11)
Total Finished Commodities
(exci. 5a, 5b, 35b —
e,37
and 38)
Total Finished Commodities
(exci. 5b, 29 and 40)
Inclusive Total, Finished
Commodities
33,059,302
34,644,809
37,570,080
.
14
37.5
37.3
45,447,808
.
47,5
54,1
23
48,810,773
2,423,743
2,423,743
4,716,068
4,769,156
54,693,934
55,993,3642
a-Does not include data for Group 5a.
2'rhis
is not the
exact total of columns (8),
(9) and (10) since column (8) contains $10,308 thousand of exports ($1,182 thousand of Group 29 and
$9,126 thousand of Group 40).
The inclusion of exports under sales by retailers resulted from the treatment of all dealers as retailers (see notes for
Groups 29 and 40 in Note B to Table 111—4).
Consequently the value of exports had to be subtracted before actual cost to domestic ultimate consumers
could be ascertained.
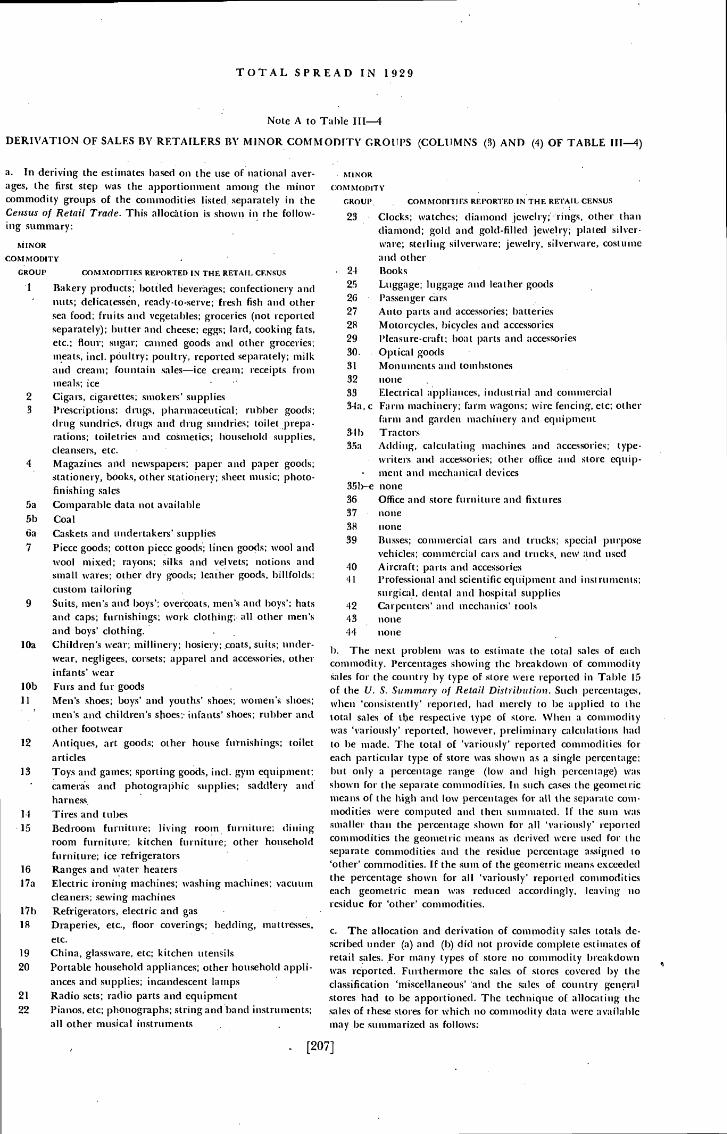
TOTAL SPREAD IN 1929
Note A to Table IlI—4
DERIVATION OF SALES BY RETAILERS BY MINOR COMMODITY GROUPS (COLUMNS (3) AND (4) OF TABLE 111—4)
a. In deriving the estimates based on the use of national aver-ages, the first step was the apportionment among the minorcommodity groups of the commodities listed separately in the
of Retail Trade. This is shown in the follow-ing summary:
MINOR
COMMODITY
GROUP COMMODITIES REPORTED IN THE RETAIL CENSUS
1 Bakery products; bottled beverages; confectionery andnuts; ready-to-serve; fresh fish and othersea food; fruits and vegetables; groceries (not reportedseparately); butter and cheese; eggs; lard, cooking fats,etc.; flour; sugar; canned goods and other groceries;meats, md. poultry: poultry reported separately; milkand cream; fountain sales—ice creani; receipts frommeals; ice
2 Cigars, cigarettes; smokers' supplies3 Prescriptions; drugs, phariiaceutical; rubber goods;
drug sun(lrles, drugs and drug sundries; toilet prepa-rations; toiletries and cosmetics; household supplies,cleansers, etc.
4 Magazines and newspapers; paler and paper goods;stationery, books, other stationery; sheet music; photo-finishing sales
5a Comparable data not available5b Coal6a Caskets and undertakers' supplies7 Piece goods; cotton piece goods; linen goods; wool and
wool mixed; rayons; silks and velvets; notions andsmall wares; other dry goods; leather goods, billfolds:custom tailoring
9 Suits, men's and boys'; overcoats, men's and boys'; hatsand caps; furnishings; work clothing;, all other men'sand boys' clothing.
lOa Children's wear; millinery; hosiery; coats, suits; tinder-wear, negligees, corsets; apparel and accessories, otherinfants' wearFurs and fur goodsMen's shoes; boys' and youths' shoes; women's shoes;men's and children's shoes;' infants' shoes; rubber antiother footwear
12 Antiques, art goods; other house toiletarticles
13 Toys and games; sporting goods, md. gym equipment;- a a rid
harnessTires and tithesBedr'ooiu furniture; living rooi'n furniture; di iii ngroom furniture; kitchen furniture; other householdfurniture; ice refrigerators
16 Ranges and water heatersl7a Electric ironing machines; washing machines; vacuum
cleaners; sewing machines17h Refrigerators, electric and gas18 Draperies, etc., floor coverings; bedding, mattresses,
etc.19 China, glassware, etc; kitchen utensils20 Portable household appliances; other household appli-
ances and supplies; incandescent lamps21 Radio sets; radio parts arid equipment22 Pianos, etc; phonographs; string and band instruments;
all other musical instruments
MINOR
c:ost MODITV
GROUt' COMMOI)ITIES REI'ORTEI) IN THE RETAIL CENSUS
23 Clocks; watches; diamond jewelry; rings, other thandiamond; gold and gold-filled jewe!ry; l)lated silver-ware; sterling silverware; jewelry, silverware, costumea rid other-
24 Books25 Luggage; luggage and leather goods26 Passenger cars27 Auto parts and accessories; batteries28 Motorcycles, bicycles and accessories29 Pleasure-craft; boat parts and accessories30, Optical goods31 Monuments and tombstones32
33
3-la, c
noneElectrical appi iaitces, industrial and commercialFarm machinery; farm wagons; wir-e fencing, dc; otherfarm and garden machinery and eqIliplilelit
31b Tractors33a Adding, calculating machines and accessories; type-
writers and accessories; other office arid Stoic equip-— ment and mechanical devices
35b—e none36 OffIce and store furniture audI fixtures37 nOne38 none39 Busses; commercial cars and trucks; special PU1'l)OSe
vehicles; commercial cat's and trucks, new and used40 Aircraft; and accessories41 Professional and scientific equipment an(l inst riumenis;
surgical, dental and hospital supplies42 Carpenters' and mechanics' tools43 none44
b. The next problem was to estimate the total sales of eachcommodity. Percentages showing the breakdown of corn mod isales for the coin ii try by type of store were reported iii Ta 1)1 C ISof the U. S. Summary of Retail Distribution. Such percentages,when 'consistently' reported, had merely to be al)pliCd to thetotal sales of the respective type of store. \Vhen a commoditywas 'variously' reported, however, prelirui na u'y calculations hadto be made. The total o 'variously' reported commodities foreach particular type of store was shown as a single percentage;hut only a percentage range (low and high percentage) wasshown for the separate commodities. In such cases the geometricmeans of the high and low percentages for all the separatemodities were computed and then summated. If the sum wassmaller than the shown for all 'variously' reportedcommodities the geometric means as derive(l were used for' theseparate commodities and the residue percentage assigned to'other' commodities. If the sum of the geometric means exceededthe percentage shown for all 'variously' reported commoditieseach geometi'ic mean was reduced accordingly, leaving noresidue for 'other' commodities.
c. The allocation and derivation of commodity sales totals de-scril)ed under (a) and (b) did not provide complete estimates ofretail sales. •For many types of store no commodity breakdownwas reported. Furthermore the sales of stoics covered by theclassification 'miscellaneous' 'arid the sales of country generalstores had to be apportioned. The technique of allocating thesales of these stores for which no commodity data wet-c availablemay be summarized as follows:
[207]
none
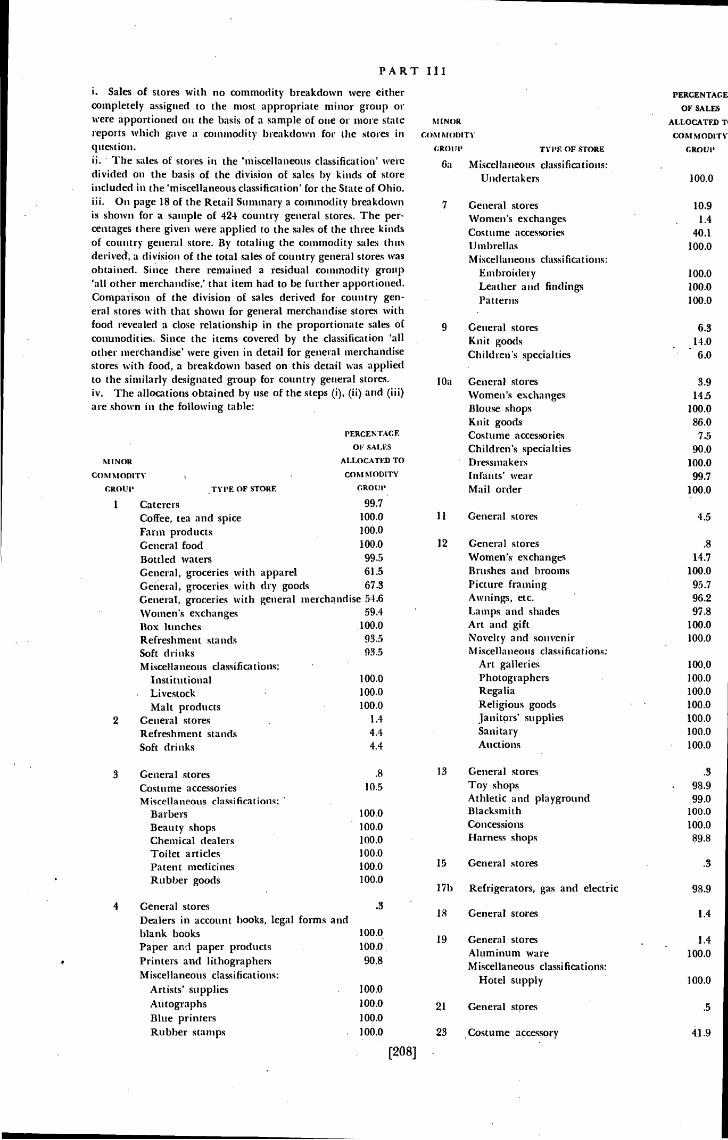
PART III
CaterersCoffee, tea and spiceFarm productsGeneral foodBottled watersGeneral, groceries withGeneral, groceries withGeneral, groceries withWomen's exchangesBox lunchesRefreshment standsSoft drinksMiscellaneous classifications:
InstitutionalLivestockMalt products
2 General storesRefreshment standsSoft drinks
PEP.CENTAc.E
OF SALES
ALLOCATED TO
COMMODITY
CROUP
99.5
100.0100.0100.0
1.4
4.44.4
PERCENTAGE
OF SALES
ALLOCATED
COMMODITY
GROUP
100.0
10.91.4
40.1
100.0
100.0100.0100.0
6.314.0
- 6.0
3.914.5
100.086.0
7.590.0
100.099.7
100.0
4.5
.8
14.7
100.095.796.297.8
100.0100.0
100.0100.0100.0100.0100.0100.0100.0
3 General storesCostume accessoriesMiscellaneous classifications:
BarbersBeauty shopsChemical dealersToilet articlesPatent medicinesRubber goods
4 General storesDealers in account books, legal forms andblank booksPaper paper productsPrinters and lithographersMiscellaneous classifica Lions:
Artists' supplies
13 General storesToy shopsAthletic and playgroundBlacksmithConcessionsHarness shops
15 General stores .3
17b Refrigerators, gas and electric 98.9
18 General stores 1.4
19 General stores . 1.4
Aluminum ware 100.0Miscellaneous classifications:
Hotel supply 100.0
21 General stpres .5
23 Costume accessory 41.9
i. Sales of stores with no commodity breakdown were eithercompletely assigned to the most appropriate minor group orwere apportioned on the basis of a sample of one or more statereports which gave a commodity breakdown for the stores in(lilestion.ii. The sales of stores in the 'miscellaneous classification' weredivided on the basis of the division of sales by kinds of storeincluded in the 'miscellaneous classification' for the State of Ohio.iii. On page 18 of the Retail Sununary a commodity breakdownis shown for a sample of 424 country general stores. The per.centages there given were applied to the sales of the three kindsof country general store. By totaling the comnioclity sales thus
a division of the total sales of country general stores wasobtained. Since there remained a residual commodity group'all other merchandise,' that item had to be further apportioned.Comparison of the division of sales derived for country gen-eral stores with that shown for general merchandise stores withfood revealed a close relationship in the proportionate sales ofcotiunodities. Since the items covered by the classification 'allother merchandise' were given in detail for general merchandisestores with food, a breakdown based on this detail was appliedto the similarly designated group for country general stores.iv. The allocations obtained by use of the steps (i), (ii) and (iii)are shown in the following table:
MINOR
COMMODITY
GROUt'
1
TYPE OF STORE
MINOR
CoSt MOIflTV
CR0111' TYPE OF STORE
Ga Miscellaneous classifications:Undertakers
7 General stomesWomen's exchangesCostume accessoriesUmbrellasMiscellaneous classifications:
EmbroideryLeather and findingsPatterns
9 General storesKnit goodsChildren's specialties
l0a General storesWomen's exchangesBlouse shopsKnit goodsCostume accessoriesChildren's specialtiesDressmakersInfants' wearMail order
Ii General stores
12 General storesWomen's' exchangesBrushes and broomsPicture framingAwnings, etc.Lamps and shadesArt and gift
and souvenirMiscellaneous classifications:
Art galleriesPhotographersRegaliaReligious goodsjann9rs' suppliesSanitaryAuctions
99.7100.0100.0100.0
apparel 61.5dry goods 67.3general merchandise 54.6
59.4
100.093.593.5
.3
98.999.0
100.0100.089.8
.8
10.5
100.0100.0100.0100.0100.0100.0
.3
100.0100.0
90.8
100.0
100.0
100.0
100.0
AutographsBlue printersRubber stamps
[208]
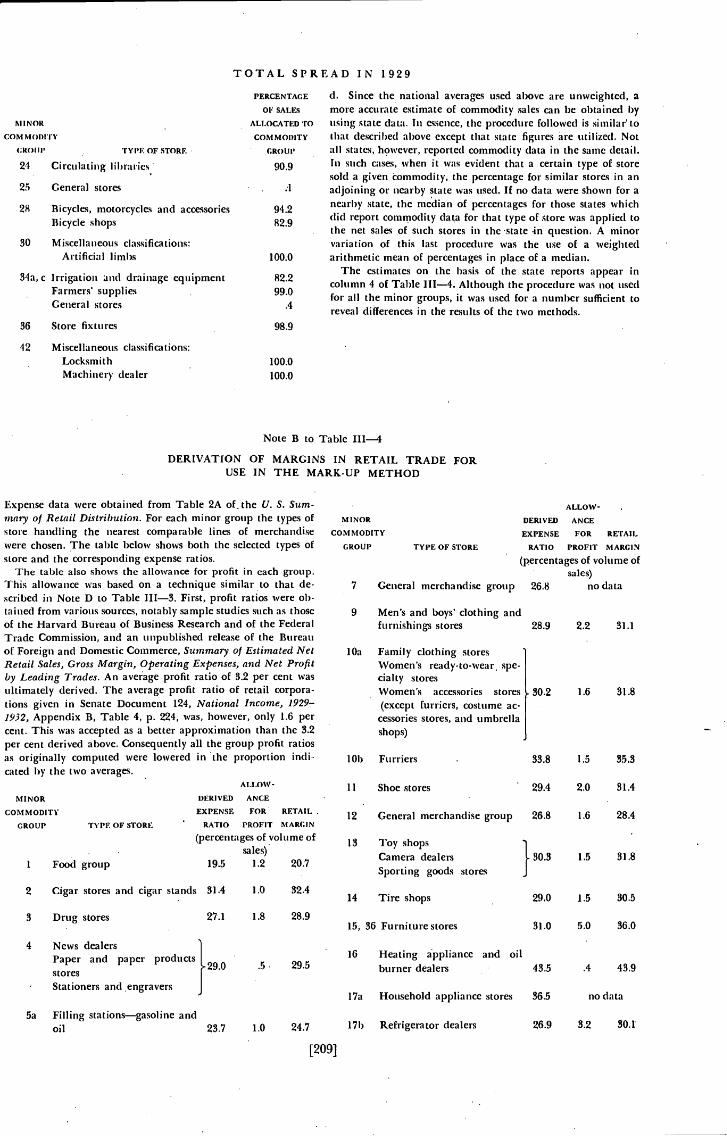
TOTAL SPREAD IN 1929
12 Miscellaneous classifications:LocksmithMachinery dealer
d. Since the national averages used above are unweighted, amore accurate estimate of commodity sales can be obtained byusing state data. In essence, the procedure followed is similar1 tothat (lescribed above except that state figures are utilized. Notall states, however, reported commotlity data in the same detail.In such cases, when it was evident that a certain type of storesold a given commodity, the percentage for similar stores in an
:1 adjoining or nearby state was used. If no data were shown for anearby state, the median of percentages for those states whichdid report commodity data for that type of store was applied tothe net sales of such stores in the state •in question. A minorvariation of this last procedure was the use of a weightedarithmetic mean of percentages in place of a median.
The estimates on the basis of the state reports appear incolumn 4 oF Table 111—4. Although the procedure was not usedfor all the minor groups, it was used for a number sufficient toreveal differences in the results of the two methods.
98.9
DERIVATION OF MARGINS IN RETAIL TRADE FORUSE IN THE MARK-UP METHOD
Expense data were obtained from Table 2A of. the U. S. Sum-mary of Retail Distribution. For each minor group the types ofstore handling the nearest comparable lines of merchandisewere chosen. The tal)le below shows both the selected types ofstore and the corresponding expense ratios.
The table also shows the allowance for profit in each group.This allowance was based on a technique similar to that de-scribed iii Note D to Table 111—3. First, profit ratios were ob-tained from various sources, notably sample studies such as thoseof the Harvard Bureau of Business Research and of the FederalTrade Commission, and an unpublished release of the Bureauof Foreign and Domestic Commerce, Summary of Estimated NetRetail Sales, Gross Margin, Operating Expenses, and Net Profitby Leading Trades. An average profit ratio of 3.2 per cent wasultimately derived. The average profit ratio of retail corpora-tions given in Senate Document 124, National Income, 1929—1932, Appendix B, Table 4, p. 224, was, however, only 1.6 petcent. This was accepted as a better approximation than the 3.2per cent derived above. Consequently all the group profit ratiosas originally computed were lowered in the proportioncated by the two averages.
ALLOW -
DERIVED ANCE
EXPENSE FOR RETAIL.RATIO PROFIT MARGIN
(percentages of volume ofsales)
1 Food group 19.5 1.2 20.7
2 Cigar stores and cigar stands 31.4 1.0 32.4
S Drug stores 27.1 1.8 28.9
storesStationers and engravers
5a Filling stations—gasoline andoil 23.7 1.0 24.7
7 General merchandise group 26.8 no data
9 Men's and boys' clothing andfurnishings stores 28.9 2.2 31.1
lOa Family clothing storesWomen's ready-to-wear spe-cialty storesWomen's accessories stores(except furriers, costume ac-cessories stores, and umbrellashops)
101) Furriers 33.8 1.5 35.3
11 Shoe stores 29.4 2.0 31.4
12 General merchandise group 26.8 1.6 28.4
13 Toy shopsCamera dealersSporting goods stores
14 Tire shops 29.0 1.5 30.5
15, 36 Furniture stores 31.0 5.0 36.0
16 Heating appliance and oilburner dealers 43.5
17a Household appliance stores 36.5 no data
171) Refrigerator dealers 26.9 3.2 30.1
PERCENTAGE
01: SALES
ALLOCATED TO
COM MOI)ITY
GROUP
90.9
CR0111' TYPE OF STORE
24 Circulating libraries
25 General stores
28 Bicycles, motorcycles and accessoriesBicycle shops
30 Miscellaneous classifications:Artificial limbs
34a, c Irrigation and drainage equipmentsupplies
General stores
36 Store fixtures
94.282.9
100.0
82.299.0
.4
100.0
100.0
Note B to Table II1—4
MINOR
COMMODITY
GROUP TYPE OF STORE
ALLOW-
DERIVED ANCE
EXPENSE FOR RETAIL
RATIO PROFIT MARGIN
(percentages of volume ofsales)
MINOR
COMMODITY
GROUP
30.2 1.6 31.8
TYPE OF STORE
4 News dealers
} 30.31.5 31.8
.5. 29.5 .4 43.9
[209]
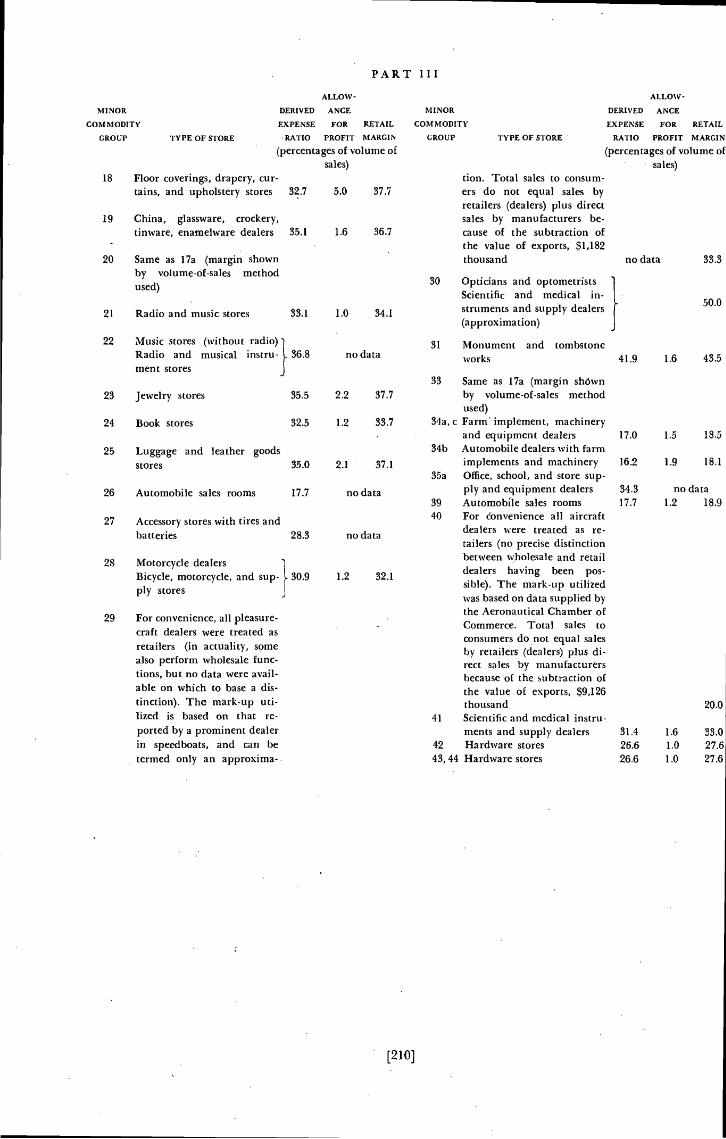
PART IIIALLOW- ALLOW-
MINOR DERIVED ANCE MINOR DERIVED ANCE
COMMODITY EXPENSE FOR RETAIL COMMODITY EXPENSE FOR RETAIL
GROUP TYPE OF STORE RATIO PROFIT MARGIN GROUP TYPE OF STORE RATIO PROFIT MARGIN
of volume of (percentages of volume ofsales) sales)
18 Floor coverings, drapery, cur- don. Total sales to consum-tains, and upholstery stores 32.7 5.0 37.7 ers do not equal sales by
retailers (dealers) plus direct19 China, glassware, crockery, sales by manufacturers be-
tinware, enameiware dealers 35.1 1.6 36.7 cause of the subtraction of-
' the value of exports, $1,18220 Same as 17a (margin shown thousand no data 33.3
by volume-of-sales method'30 Opticians and optometristsused)
Scientific and medical in-
}21 Radio and music stores 38.1 1.0 34.1 struments and supply dealers
(approximation)
22 Music stores (without radio) 31 Monument and tombstoneRadio and musical Instru-} 36.8 no data works 41.9 1.6 43.5ment stores
33 Same as 17a (margin shOwn23 Jewelry stores 35.5 2.2 37.7 by volume-of-sales method
used)24 Book stores 32.5 1.2 33.7 34a, c Farm implement, machinery
and equipment dealers 17.0 1.5 18.5
25 Luggage and leather goods 34b Automobile dealers with farm
stores 35.0 2.1 37.1 implements and machinery 16.2 1.9 18.1
35a Office, school, and store slip-
26 Automobile sales rooms 17.7 no data ply and equipment dealers 34.3 no data39 Automobile sales rooms 17.7 1.2 18.940 For convenience all aircraft27 Accessory stores with tires and
dealers were treated as re-batteries 28.3 no datatailers (no precise distinctionbetween wholesale and retail
28 Motorcycle dealersdealers having been pos-Bicycle, motorcycle, and 30.9 1.2 32.1sible). The mark-up utilizedply storeswas based on data supplied bythe Aeronautical Chamber of
29 For convenience, all pleasure-Commerce. Total sales tocraft dealers were treated as -consumers do not equal sales
retailers (in actuality, some by retailers (dealers) plus di-also perform wholesale func- rect sales by manufacturerstions, but no data were avail- because of the subtraction ofable on which to base a dis- the value of exports, $9,126tinction). The mark-up uti thousand 20.0lized is based on that re- 41 Scientific and medical instru-ported by a prominent dealer ments and supply dealers 31.4 1.6 33.0in speedboats, and can be 42 Hardware stores 26.6 1.0 27.6termed only an approxima-. 43,44 Hardware stores 26.6 1.0 27.6
[210]
Table 111—5
TOTAL SPREAD BETWEEN VALUES OF FINISHED COM-
MODITIES AT PRODUCERS' PRICES AND AT COST
TO ULTIMATE CONSUMERS, MINOR
COMMODITY GROUPS, 1929
This table recapitulates the results of the analysis in Part III. It shows for1929 the total spread between the values of finished commodities, destinedfor domestic consumption, at producers' prices and at final cost to ultimateconsumers; as well as distribution of this spread among transportationcharges, wholesale margins and retail margins.
Comments on this table will be found in the Preface to Part III, Section 5.
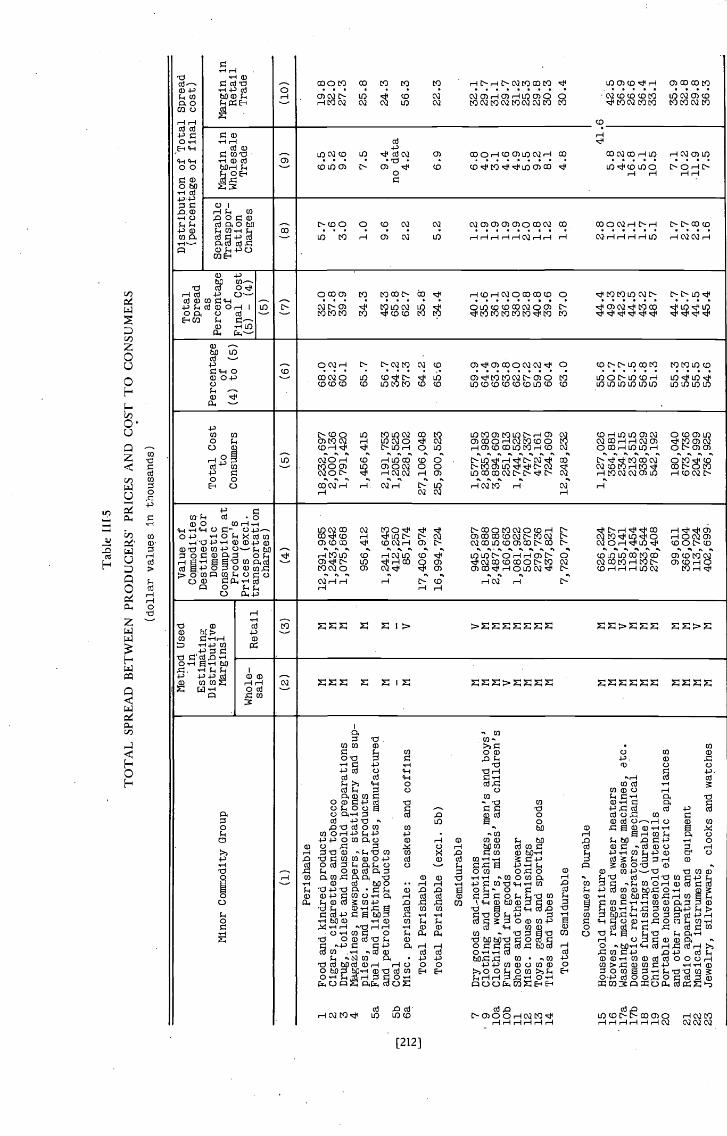
Tab
le
TO
TA
L S
PRE
AD
BE
TW
EE
N P
RO
DU
CE
RS'
PR
ICE
S A
ND
CO
ST T
O C
ON
SUM
ER
S
(dol
lar
values in thousands)
.
Ninor Commodity Group
Method Used
in
Estiinating
Distributive
Margins1
Value of
Commodities
Destined for
Domestic
Consumption at
Producer's
Prices (exci.
transportation
charges)
Total Cost
to
Consumers
.
Percentage
of
(4) to (5)
Total
Spread
as
Percentage
of
Final Cost
(5) —
(4)
(5)
Distribution of Total Spread
(percentage of final cost)
Separable
Transpor-
tation
Charges
in
in
Trade
Retail
(1)
(2)
(3)
(4)
(5)
(6)
(7)
(8)
(9)
(10)
Perishable
..
1 2 3 4 5a
Food and kindred products
Cigars, cigarettes and. tobacco
toile
tand household preparations
Magazines, newspapers, stationery and sup—
plies, and misc. paper products
Fuel and lighting products, manufactured
N N N N
N N N N
12,391,985
1,243,642
1,075,868
956,412
18,232,697
2,000,136
1,791,420
1,456,415
68.0
62.2
60.1
65.7
32.0
37.8
39.9
.
34.3
5.7 .6
3.0
1.0
6.5
5.2
9.6
7.5
19.8
32.0
27.3
25.8
5b6a
and petroleum products
Coal
Misc. perishable:
caskets and coffins
N - N
N — V
1,241,643
412,250
85,174
2,191,753
1,205,525
228,102
56.7
34.2
37.3
43.3
65.8
62.7
9.6
2.2
9.4
no data
4.2
24.3
56.3
Total Perishable
17,406,974
27,106,048
64.2
35.8
Total Perishable (excl. Sb)
16,994,724
25,900,523
65.6
34.4
5.2
6.9
22.3
Semidurable
.
7 9lOa
lOb
11 12
13 14
Dry goods and-notions
Clothing and furnishings, men's and boys'
Clothing, women's, misses' and children's
Furs and fur goods
Shoes and other footwear
Misc. house furnishings
Toys, gaines and sporting goods
Tires and tubes
N N N V N N N N
V N N N N N N N
945,297
1,825,888
2,487,580
160,663
1,081,922
501,870
279,736
437,821
1,577,195
2,835,983
3,894,609
251,813
1,744,525
747,337
472,161
724,609
59.9
64.4
63.9
63.8
62.0
67.2
59.2
60.4
40.1
35.6
36.1
36.2
38.0
32.8
40.8
39.6
1.2
1.9
1.9
1.9
1.9
2.0
1.8
1.2
6.8
4.0
3.1
4.6
4.9
5.5
9.2
8.1
32.1
29.7
31.1
29.7
31.2
25.3
29.8
30.3
Total Seinidurable
7,720,777
12,248,232
63.0
37.0
1.8
4.8
30.4
.
Consumers' Durable
.
151617a
17b
1819
Household furniture
Stoves, ranges and water heaters
Washing machines, sewing machines, etc.
Domestic refrigerators, mechanical
House furnishings (durable)
China and household utensils
N N N N N N
N N V N N N
626,224
185,037
135,141
118,454
533,544
278,408
1,127,026
364,881
234,115
213,515
938,529
542,192
5.5.6
50.7
57.7
55.5
56.8
51.3
44.4
49.3
42.3
44.5
43.2
48.7
?.8
1.0
1.2
1.1
1.7
5.1
41.6
5.8
42.5
4.2
36.9
16.8
26.6
5.1
36.4
10.5
33.1
20
212223
Portable household electric appliances
and other nupplies
Radio apparatus and equipment
Musical instruments
Jewelry, silverware, clocks and watches
N N N N
N N V N
99,611
366,004
113,724
402,699
180,040
673,736
204,999
736,925
•
55.3
54.3
56.5
54.6
44.7
45.7
44.5
45.4
1.7
2.7
2.8
1.6
7.1
10.2
.11.9
7.5
35.9
32.8
29.8
36.3
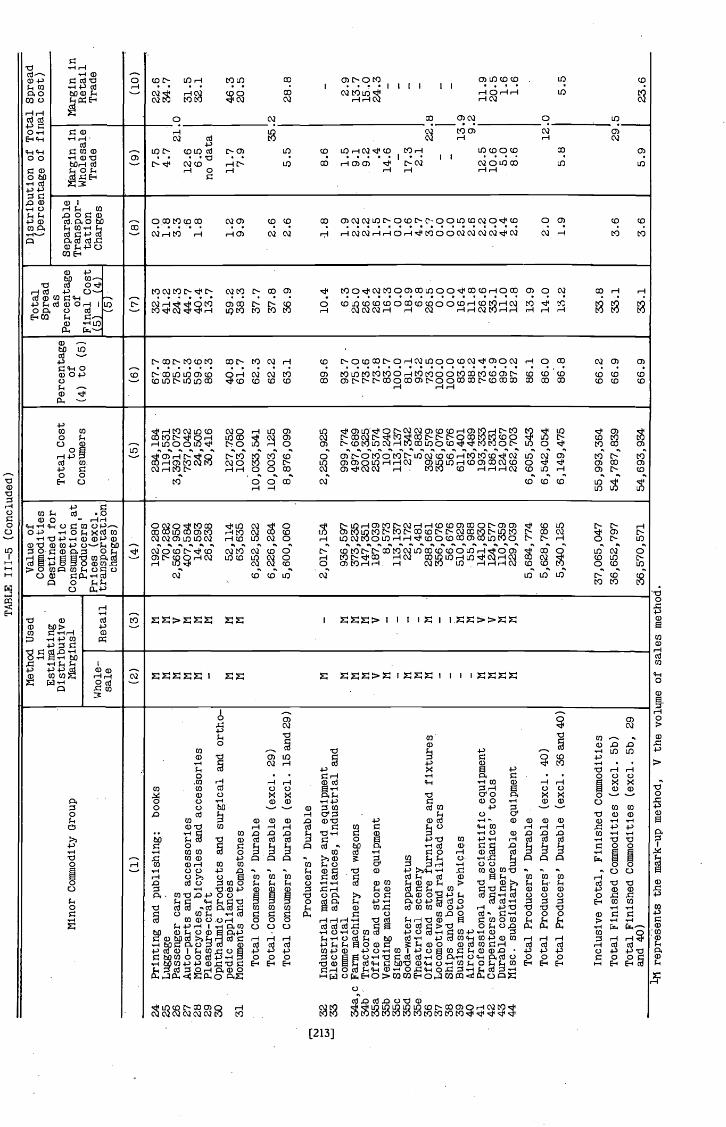
Producers' Durable
TA
BLE
111
—5
(Con
clud
ed)
Minor
CommodityGroup
:
Method Used
in
Dis
trib
utiv
eM
argi
ns1
Value of
Commodities
Destined
for
Dom
estic
Con
sum
ptio
nat
Producerst
Prices (exci.
transportation
charges)
Tot
al C
ost
to
Consumers
Percentage
of
(4) to (5)
Spread
as
Percentage
of
Final Cost
(5) —
(4)
(5)
Distribution of Total Spread
(percentage of final cost)
Separable
Transpor—
tation
Charges
Margin in
Wholesale
Trade
Margin in
Retail
Trade
Whole-
sale
Retail
(1)
(2)
(3)
(5)
(6)
(7)
(8)
(9)
(10)
•
24
-25 26 27 2829 30 31
3233
34a, c
34b
35a
35b
35c
35d
35e
3637 38 3940414243
44
N N N N N N N N N N N V N N N N N N N N
N N V N N N N N N N N V M N N V V F! N
Printing and publishing:
books
Luggage
-
Pas
seng
ercars
Auto—parts and accessories
Motorcycles, bicycles and accessories
Pleasure—craft
Ophthalmic products and surgical and ortho-
pedic appliances
Monuments and tombstones
Total
Con
sum
ers'
Dur
able
Tot
alC
onsu
mer
s' D
urab
le (
exci
. 29)
Tot
alConsumers' Durable (exci. l5and29)
Industrial machinery and equipment
Electrical appliances, industrial and
commercial
Farm machinery and wagons
Tractors
-
Offi
ceand store equipment
Vending machines
Signs
Soda-water apparatus
Theatrical scenery
Office and store furniture and fixtures
Locomotives and railroad cars
Ships and boats
Business motor vehicles
kircraft
Professional and scientific equipment
Carpenters' and mechanics' tools
Durable containers
Misc. subsidiary durable equipment
Total Producers' Durable
Total Producers' Durable (excl. 40)
Total Producers' Durable (excl. 36and40)
Inclusive Total, Finished Commodities
Total Finished Commodities (exci. 5b)
Total Finished Commodities (excl. Sb, 29
and 40)
192,280
70,282
2,566,950
407,584
14,593
26,238
52,114
63,635
6,252,522
6,226,284
5,600,060
2,017,154
936,597
373,235
147,351
187,039
8,573
113,137
22,1
725,481
288,661
356,076
56,6
76510,829
55,988
141,830
124,
577
110,
359
229,
039
5,68
4,77
45,
628,
786
5,340,125
37,065,047
36,6
52,7
97
36,570,571
284,184
119,531
3,391,073
737,042
24,505
30,416
127,
752
103,
080
10,033,541
10,003,125
8,876,099
2,250,925
999,774
497,689
200,
325
253,
574
10,2
4011
3,13
7-27
,342
5,88
239
2,57
9356,076
56,6
76611,401
63,489
193,333
186,331
124,067
262,
703
6,605,543
6,54
2,05
46,
149,
475
55,993,364
54,787,839
54,6
93,9
34
67.7
58.8
75.7
55.3
59.6
86.3
-40.8
61.7
62.3
62.2
63.1
89.6
93.7
75.0
73.6
73.8
.83.7
100.0
81.1
93.2
73.5
100.0
100 .0
83.6
88.2
73.4
66.9
89.0
87.2
86.1
86.0
86.8
66.2
66.9
66.9
32.3
41.2
24.3
44 •
740.4
13.7
59.2
38.3
37.7
37.8
36.9
10.4
6.3
25.0
26.4
26.2
16.3
0.0
18.9
6.8
26.5
0.0
0.0
16.4
11.8
26.6
33.1
11.0
12.8
13.9
14.0
13.2
33.8
33.1
33.1
2.0
1.8
3.3 .6
1.8
1.2
9.9
2.6
2.6
1.8
1.9
2.2
2.2
1.5
1.7
0.0
1.6
4.7
3.?
0.0
0.0
2.5
2.6
2.2
-2.
04.
42.6
2.0
1.9
3.6
3.6
7.5
22.6
4.7
34.7
21.0
12.6
31.5
6.5
32.1
no data
11.7
46.3
7.9
20.5
35.2
5.5
28.8
8.6
1.5
2.9
9.1
13.7
.9.2
15.0
.4
24.3
14.6
-17.3
-2.122.8
-
-13
.99.2
12.5
10.6
5.0
8.6
11.9
20.5
1.6
1.6
12.0
5.8
5.5
29 5
5.9
23.6
1M represents the mark—up method,
V the volume of sales method.