Embed Size (px)
Citation preview

Raj Chetty, HarvardJohn N. Friedman, BrownNathaniel Hendren, HarvardMichael Stepner, University of Torontoand the Opportunity Insights Team
June 2021
The Economic Impacts of COVID-19:
Evidence from a New Public DatabaseBuilt Using Private Sector Data

How has COVID-19 affected the American economy and what policies can best mitigate its adverse impacts going forward?
Since Kuznets (1941), macroeconomic policy decisions have been based on data from surveys of households and businesses
These data provide vital aggregate information (GDP, unemployment rates), but have two key limitations
1. Some statistics available only at low frequencies, often with significant lags
2. Some statistics cannot be disaggregated to examine variation across areas or subgroups
Motivation: Measuring the Impacts of COVID-19

We build a publicly available economic tracker using transaction data from several private companies to measure daily economic activity by ZIP code, income group, and industry
Use these new data to analyze economic impacts of COVID-19 pandemic:
1. [Mechanisms] Why did COVID-19 lead to unprecedented job losses?
2. [Policy Responses] Causal effects of fiscal stabilization policies enacted to date
This work serves as a prototype motivating further development in collaboration with federal statistical agencies
This Project

Data Construction
DataCase Study:
StimulusImpacts of COVID-19

Consumer Spending
Small Business Revenues
Employment
Job Postings
Education
Data Partners

Starting from raw data, construct series suitable for economic analysis as follows:
1. Clean series to remove artifacts that arise in transaction data
2. Smooth seasonal fluctuations using data from 2019
3. Protect privacy: index to January 2020 values, exclude small cells, combine data from multiple companies
4. Benchmark to national statistics to characterize group each dataset represents to mitigate bias from non-representative selection
Constructing Publicly Available Economic Indices Based on Private-Sector Data
-50
-40
-30
-20
-10
0
10
Cha
nge
in E
mpl
oym
ent v
s. J
anua
ry 2
020
(%)
Jan2020
Feb2020
Mar2020
Apr2020
May2020
Jun2020
Jul2020
Aug2020
Sep2020
Oct2020
Nov2020
Dec2020
Jan2021
Feb2021
Mar2021
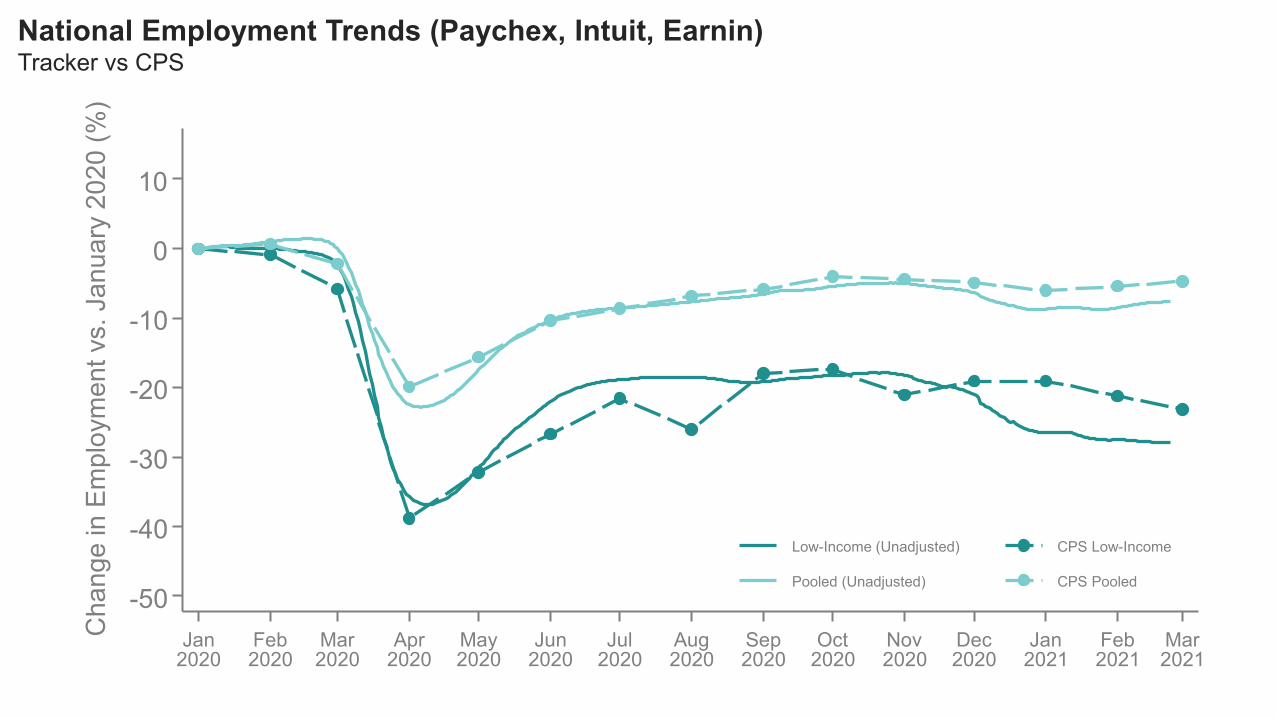
Low-Income (Unadjusted) CPS Low-Income
Pooled (Unadjusted) CPS Pooled
National Employment Trends (Paychex, Intuit, Earnin)Tracker vs CPS
-50
-40
-30
-20
-10
0
10
Cha
nge
in E
mpl
oym
ent v
s. J
anua
ry 2
020
(%)
Jan2020
Feb2020
Mar2020
Apr2020
May2020
Jun2020
Jul2020
Aug2020
Sep2020
Oct2020
Nov2020
Dec2020
Jan2021
Feb2021
Mar2021
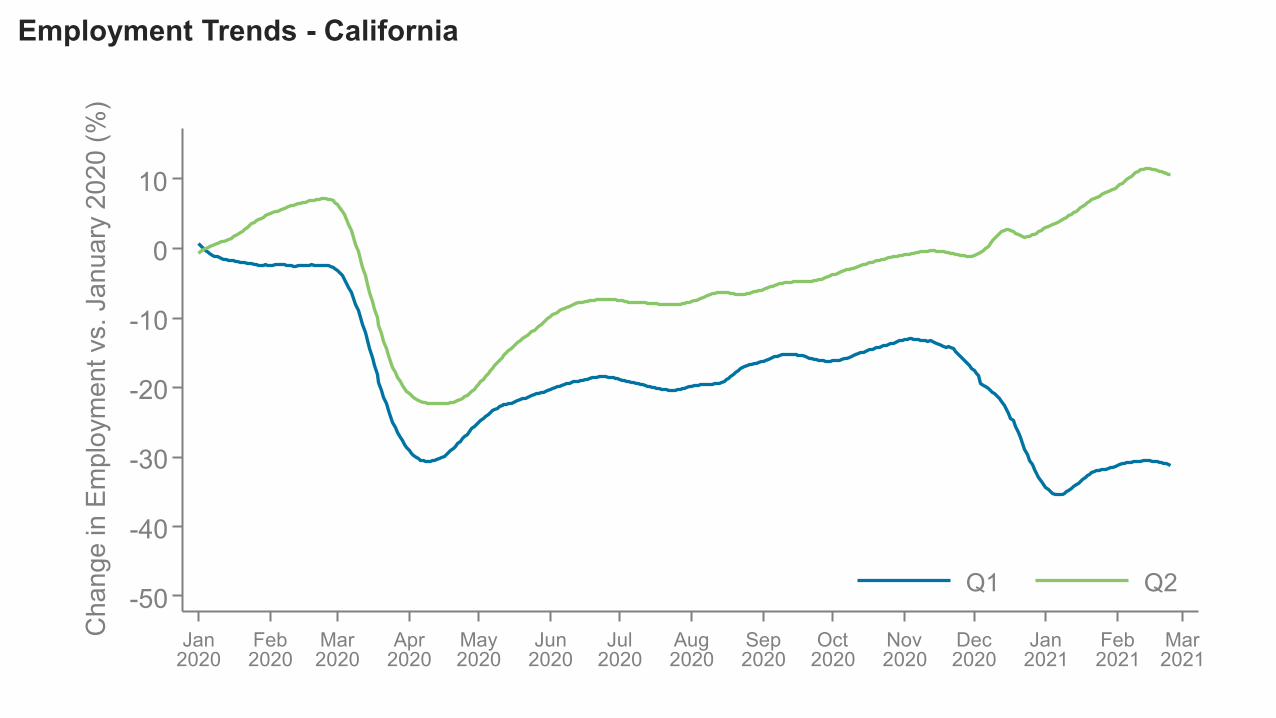
Q1 Q2
Employment Trends - California

-50
-40
-30
-20
-10
0
10
Cha
nge
in E
mpl
oym
ent v
s. J
anua
ry 2
020
(%)
Jan2020
Feb2020
Mar2020
Apr2020
May2020
Jun2020
Jul2020
Aug2020
Sep2020
Oct2020
Nov2020
Dec2020
Jan2021
Feb2021
Mar2021
Low-Income (Unadjusted) CPS Low-Income
Pooled (Unadjusted) CPS Pooled
National Employment Trends (Paychex, Intuit, Earnin)Tracker vs CPS
-50
-40
-30
-20
-10
0
10
Cha
nge
in E
mpl
oym
ent v
s. J
anua
ry 2
020
(%)
Jan2020
Feb2020
Mar2020
Apr2020
May2020
Jun2020
Jul2020
Aug2020
Sep2020
Oct2020
Nov2020
Dec2020
Jan2021
Feb2021
Mar2021
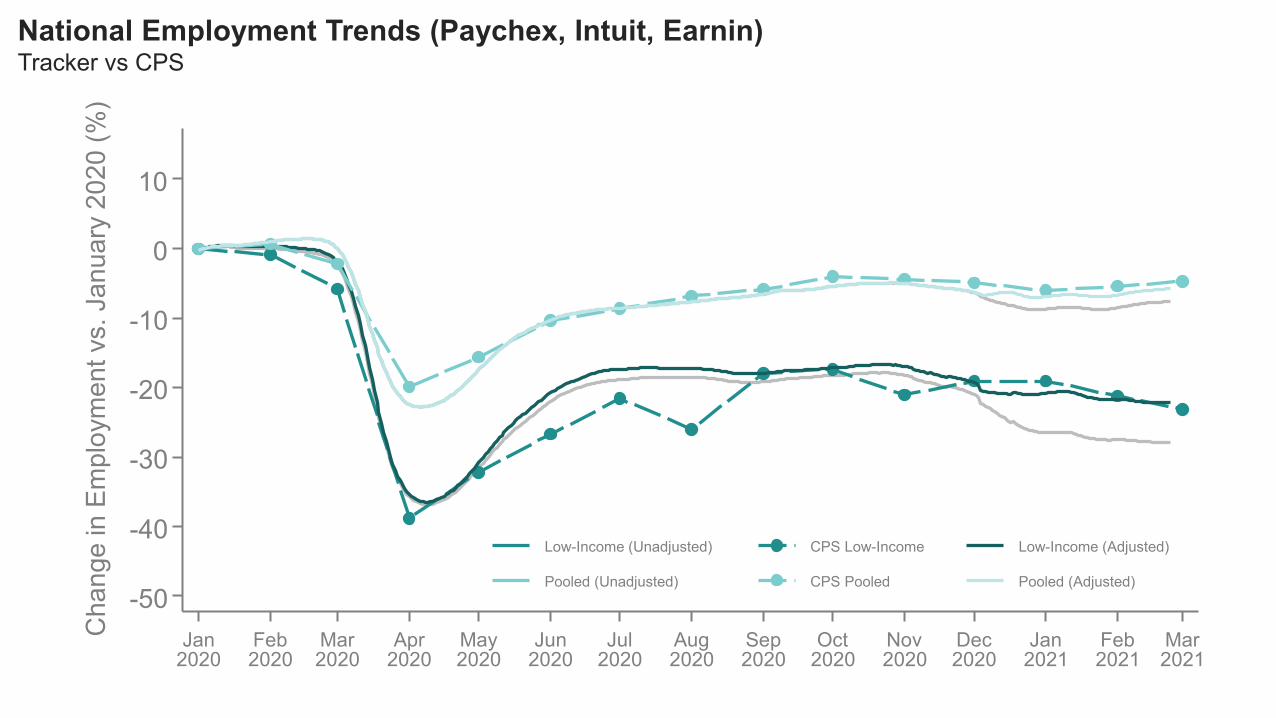
Low-Income (Unadjusted) CPS Low-Income Low-Income (Adjusted)
Pooled (Unadjusted) CPS Pooled Pooled (Adjusted)
National Employment Trends (Paychex, Intuit, Earnin)Tracker vs CPS

Impacts of COVID-19
DataCase Study:
StimulusImpacts of COVID-19

-$1.73T
0
-.4
-.8
-1.2
-1.6
-2
Cha
nge
in R
eal G
DP
from
Q1
2020
to Q
2 20
20(in
trilli
ons
of c
hain
ed 2
012
dolla
rs)
GrossDomesticProduct
National Accounts Data: Changes in GDP and its Components
(-31.7%)

$0.04T $0.05T
-$1.73T
-$0.47T
-$1.35T
0
-.4
-.8
-1.2
-1.6
-2
Cha
nge
in R
eal G
DP
from
Q1
2020
to Q
2 20
20(in
trilli
ons
of c
hain
ed 2
012
dolla
rs)
GrossDomesticProduct
PrivateDomestic
Investment
Govt.Expend.
NetExports
PersonalConsumption
Expend. (PCE)
National Accounts Data: Changes in GDP and its Components
(-31.7%)

$0.04T $0.05T
-$1.73T
-$0.47T
-$1.35T
-$1.03T
(-31.7%)
0
-.4
-.8
-1.2
-1.6
-2
Cha
nge
in R
eal G
DP
from
Q1
2020
to Q
2 20
20(in
trilli
ons
of c
hain
ed 2
012
dolla
rs)
GrossDomesticProduct
PrivateDomestic
Investment
Govt.Expend.
NetExports
PersonalConsumption
Expend. (PCE)
Credit CardSpendingin PCE
National Accounts Data: Changes in GDP and its Components

2019 Top Income Quartile 2020 Top Income Quartile
$-0.7 Billion(-7.3%)
2
4
6
8
10
Feb 1 Mar 1 Apr 1 May 1 Jun 1 Jul 1 Aug 1 Sep 1 Oct 1 Nov 1 Dec 1
$-3.1 Billion(-37.5%)
Consumer Spending by Income QuartileC
onsu
mer
Spe
ndin
g Pe
r Day
($ B
illion
s)

2019 Top Income Quartile 2020 Top Income Quartile2019 Bottom Income Quartile 2020 Bottom Income Quartile
$+0.2 Billion(+4.5%)
$-0.7 Billion(-7.3%)
2
4
6
8
10
Feb 1 Mar 1 Apr 1 May 1 Jun 1 Jul 1 Aug 1 Sep 1 Oct 1 Nov 1 Dec 1
$-1.0 Billion(-26.7%)
$-3.1 Billion(-37.5%)
Consumer Spending by Income QuartileC
onsu
mer
Spe
ndin
g Pe
r Day
($ B
illion
s)

Changes in Small Business Revenues from January to April by ZIP CodeSan Francisco

Changes in Small Business Revenues vs. Rent, by ZIP CodeFrom January to April 2020
Slope = -13% per $1000 (s.e. = 0.38)-60%
-50%
-40%
-30%
-20%
$500 $1,000 $1,500 $2,000
Median Two Bedroom Monthly Rent in 2018
Change in Small Business RevenueRelative to January

Top Income Quartile
Third Quartile
Second Quartile
Bottom Income Quartile
Apr 15 June 10 Apr 1
-24%(7.6m)
-8%(2.6m)
-1%(0.3m)
2%(-0.7m)
-35%(11.2m)
-24%(7.7m)
-17%(5.5m)
-11%(3.7mjobs lost)
-22%(7.0m)
-12%(3.8m)
-6%(2.0m)
-1%(0.2m)
-40%
-30%
-20%
-10%
0%
Cha
nge
in E
mpl
oym
ent (
%)
Rel
ativ
e to
Jan
uary
202
0
Jan 1 Feb 1 Mar 1 Apr 1 May 1 Jun 1 Jul 1 Aug 1 Sep 1 Oct 1 Nov 1 Dec 1 Jan 1 Feb 1Mar 1 Apr 1 May 1
Employment Changes by Income Quartile
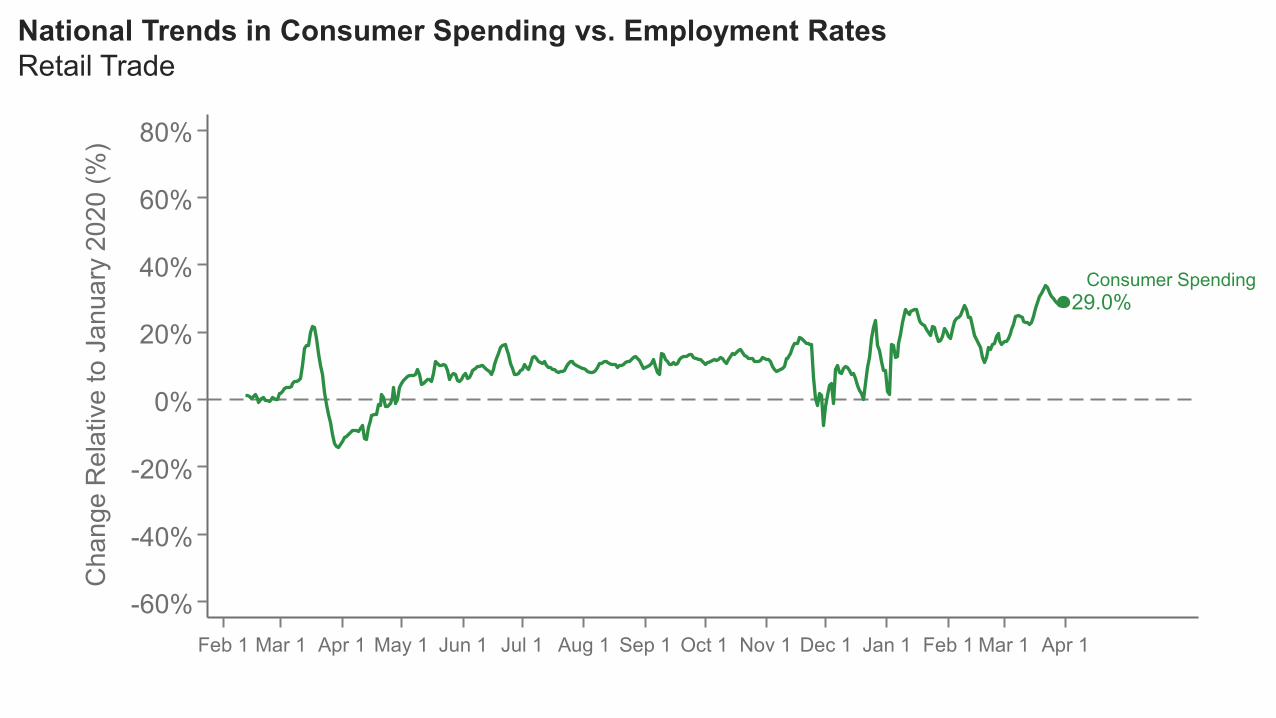
29.0%
-60%
-40%
-20%
0%
20%
40%
60%
80%C
hang
e R
elat
ive
to J
anua
ry 2
020
(%)
Feb 1 Mar 1 Apr 1 May 1 Jun 1 Jul 1 Aug 1 Sep 1 Oct 1 Nov 1 Dec 1 Jan 1 Feb 1 Mar 1 Apr 1
National Trends in Consumer Spending vs. Employment RatesRetail Trade
Consumer Spending

6.4%
-14.8%
29.0%
-60%
-40%
-20%
0%
20%
40%
60%
80%C
hang
e R
elat
ive
to J
anua
ry 2
020
(%)
Feb 1 Mar 1 Apr 1 May 1 Jun 1 Jul 1 Aug 1 Sep 1 Oct 1 Nov 1 Dec 1 Jan 1 Feb 1 Mar 1 Apr 1
National Trends in Consumer Spending vs. Employment RatesRetail Trade
Consumer Spending
Top Wage QuartileEmployment
Bottom Wage QuartileEmployment

6.4%
-14.8%
29.0%
62.6%
-60%
-40%
-20%
0%
20%
40%
60%
80%C
hang
e R
elat
ive
to J
anua
ry 2
020
(%)
Feb 1 Mar 1 Apr 1 May 1 Jun 1 Jul 1 Aug 1 Sep 1 Oct 1 Nov 1 Dec 1 Jan 1 Feb 1 Mar 1 Apr 1
National Trends in Consumer Spending vs. Employment RatesRetail Trade
Consumer Spending
Top Wage QuartileEmployment
Bottom Wage QuartileEmployment
Minimum Req.’sJob Postings

Effects of Stimulus Payments
DataCase Study:
StimulusImpacts of COVID-19

Coronavirus Aid, Relief, and Economic Security (CARES) Act of April 2020
$1200 checks (phased out at higher incomes, supplement for children)
April 15, 2020 deposits for the majority of payments
Coronavirus Response and Relief Act of December 2020
$600 checks (phased out at higher incomes, supplement for children)
January 4, 2021 or January 6, 2021 deposits for the majority of payments
Were stimulus payments effective in increasing consumer spending?
Estimating the Effects of Stimulus Payments

4th 7th 10th 13th 4th 7th 10th 13th 16th 19th
December January
Consumer SpendingSeasonally Adjusted
Spending Increased 7.9 p.p.(s.e. = 2.2 p.p)
$600 Stimulus ChecksDisbursed on Jan 4
Effect of the January 2021 Stimulus Checks on Daily Consumer Spending
–10 p.p.
0 p.p.
+10 p.p.
+20 p.p.
+30 p.p.
Bottom Income Quartile ZIP CodesMedian Household Income < $46,000
holidayspermutation

December January4th 7th 10th 13th 4th 7th 10th 13th 16th 19th
December January
Consumer SpendingSeasonally Adjusted
4th 7th 10th 13th 4th 7th 10th 13th 16th 19th
Spending Increased 7.9 p.p.(s.e. = 2.2 p.p)
Spending Increased 0.2 p.p.(s.e. = 1.6 p.p)
$600 Stimulus ChecksDisbursed on Jan 4
$600 Stimulus ChecksDisbursed on Jan 4
Effect of the January 2021 Stimulus Checks on Daily Consumer Spending
–10 p.p.
0 p.p.
+10 p.p.
+20 p.p.
+30 p.p.
–10 p.p.
0 p.p.
+10 p.p.
+20 p.p.
+30 p.p.
Bottom Income Quartile ZIP CodesMedian Household Income < $46,000
Top Income Quartile ZIP CodesMedian Household Income > $78,000
holidayspermutation

$126$140
$90
$45
0
50
100
150
200
COVID Relief Act (January 2021)
Consumer SpendingEstimate of 1-monthspending per $600
Effect of the COVID Stimulus Bills on Spending, by Income Group
<$46,000 $46,000 to $59,000 $59,000 to $78,000 >$78,000
ZIP Code Median Household Income

$189
$225 $229 $235
$126$140
$90
$45
0
50
100
150
200
CARES Act (April 2020)
COVID Relief Act (January 2021)
Consumer SpendingEstimate of 1-monthspending per $600
Effect of the COVID Stimulus Bills on Spending, by Income Group
<$46,000 $46,000 to $59,000 $59,000 to $78,000 >$78,000
ZIP Code Median Household Income

$0
$1000
$2000
$3000
$4000
January 12020
Mar 15 Apr 15 December 312020
Top Quartile
$2,500
$2,000
$1,300
Estimated Cumulative Increase in SavingsSavings = Earnings + Unemployment Insurance + Stimulus Checks – Spending
Δ Savings Per Personcompared to 2019
$4,000
Bottom Quartile
Q3
Q2
Aug 1

January 2021Stimulus Policy
Projected Effect of Stimulus Checks on SpendingCouple with No Children
$600
$0 $150,000 $174,000$75,000
$1400
$0 $150,000 $200,000$75,000
Household Income
March 2021Stimulus Policy
Proposal

January 2021Stimulus Policy
Projected Effect of Stimulus Checks on SpendingCouple with No Children
$600
$0 $150,000 $174,000$75,000
$1400
$0 $150,000 $200,000$75,000
Household Income
March 2021Stimulus Policy
Proposal
Fiscal cost = $200 billion
Projected 1-month spendingincrease < $15 billion

January 2021Stimulus Policy
Projected Effect of Stimulus Checks on SpendingCouple with No Children
$600
$0 $150,000 $174,000$75,000
$1400
$0 $160,000 $200,000$75,000
Household Income
March 2021Stimulus Policy
$20 billionreallocated

1. Research: we hope these new public data (www.tracktherecovery.org) will be helpful in supporting future work in this recession and beyond
2. Policy: fine tuning based on state of the economy and observed policy impacts
Help target proposed $100 billion in job re-training programs, avert jobless recovery
3. Contribute to Economic Statistics
On-going collaboration with federal statistical agencies using these data to improve existing methodologies and develop new statistics
Broader Implications and Future Work

Appendix

Consumer Spending BenchmarkingCredit/Debit Card Data (Affinity Solutions) vs. National Accounts (Advance Monthly Retail Trade Survey)
Change in Consumer SpendingRelative to January
Retail
-50%
-25%
0%
+25%
+50%
January2019
April July October January2020
April July October January2021
Affinity
NationalAccounts
Affinity
NationalAccounts
Food and Accommodation

In-PersonServices (68%)
In-PersonServices: (33%)
0%
25%
50%
75%
100%
Share of Decline(Jan to Mar 25-Apr 14)
Share of Pre-COVID Spending
Remote Services
Health Care
Transportation
Hotels & Food
Durable Goods
Non-Durable Goods
Recreation
Other In-Person Services
Health Care
Remote Services
Recreation
Transportation
Hotels & Food
Durable Goods
Non-Durable Goods
Other In-Person Services
Change in Consumer Spending by Sector

58.6%
44.3%
19.5%13.3%
67.2%
-2.9%0%
25%
50%
75%Sh
are
of P
eak
to T
roug
h D
eclin
e in
Pe
rson
al C
onsu
mpt
ion
Expe
nditu
re (%
)
Durables Non-Durables Services
Great Recession COVID-19
Change in Consumer Spending by SectorCOVID vs Great Recession
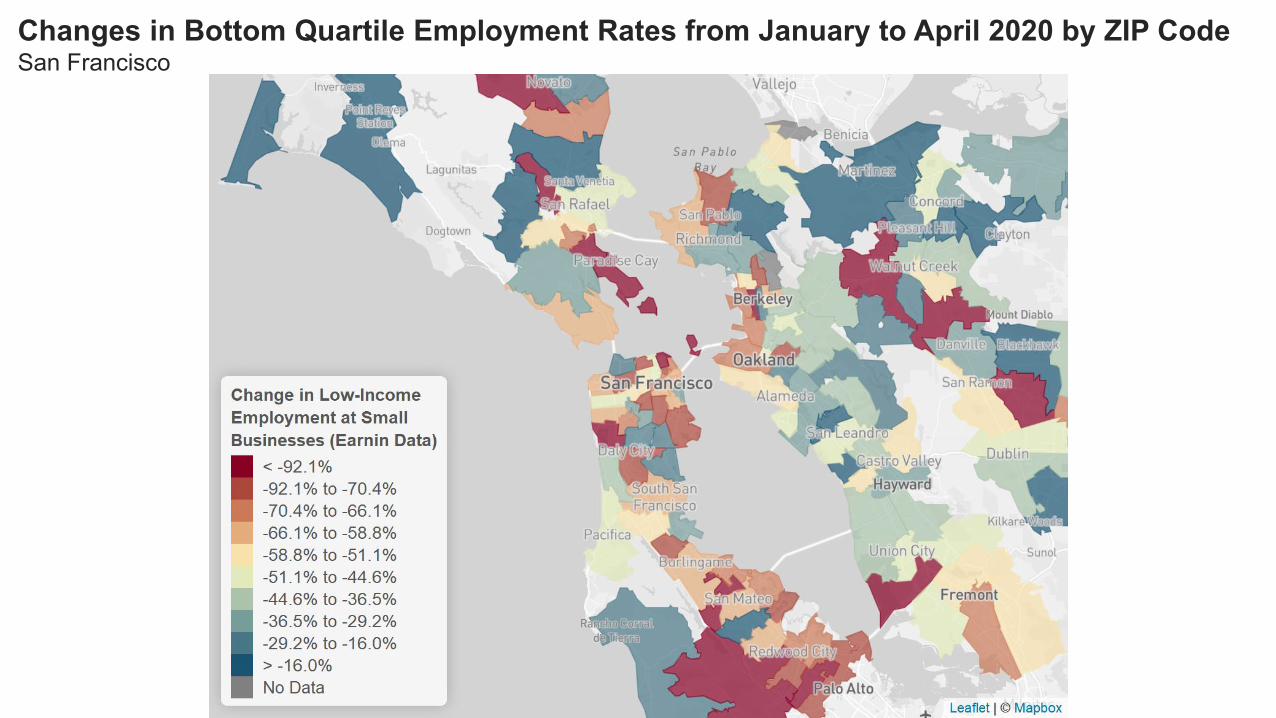
Changes in Bottom Quartile Employment Rates from January to April 2020 by ZIP CodeSan Francisco

CARES Act also provided $500 billion in loans to small businesses starting on April 3
Loans were forgivable if payroll was not reduced significantly relative to pre-COVID levels
Firms with fewer than 500 employees were eligible for these loans (with some exceptions)
Paycheck Protection Program

PPP Program BeginsApril 3
Estimated Effect to August 15:1.78 p.p. (s.e. = 1.99 p.p.)
501-800 Employees (ineligible)
100-500 Employees (eligible)
-25%
-20%
-15%
-10%
-5%
0%
Cha
nge
in E
mpl
oym
ent (
%)
Rel
ativ
e to
Jan
uary
202
0
Feb 15 Mar 15 Apr 15 May 15 Jun 15 Jul 15 Aug 15 Sep 15
Impact of Paycheck Protection Program on EmploymentReweighted to Match Industries (Excl. Food Services), with NAICS x County x Income Quartile FEs

-25%
-20%
-15%
-10%
-5%
0%
Cha
nge
in E
mpl
oym
ent (
%)
Rel
ativ
e to
Jan
uary
202
0
Feb 15 Mar 15 Apr 15 May 15 Jun 15 Jul 15 Aug 15 Sep 15
Impact of Paycheck Protection Program on EmploymentReweighted to Match Industries (Excl. Food Services), with NAICS x County x Income Quartile FEs
Cost Per Job Saved = $377K($119K at lower bound of 95% CI)
501-800 Employees (ineligible)
100-500 Employees (eligible)
PPP Program BeginsApril 3
Estimated Effect to August 15:1.78 p.p. (s.e. = 1.99 p.p.)

Why has PPP had limited impact on employment despite substantial expenditure?
Businesses who took up loans may not have intended to lay off their workers to begin with
Ex: very high take-up rate among firms providing professional and scientific services despite low job losses in that sector
Consistent with evidence that loans flowed to areas with smaller employment losses in March [Granja, Makridis, Yannelis, Zwick 2020]
Paycheck Protection Program