Embed Size (px)
Citation preview
RESEARCH ARTICLE Open Access
Patterns of molecular and phenotypic diversity inpearl millet [Pennisetum glaucum (L.) R. Br.] fromWest and Central Africa and their relation togeographical and environmental parametersBenjamin Stich1*, Bettina IG Haussmann2, Raj Pasam3, Sankalp Bhosale3, C Tom Hash4, Albrecht E Melchinger3,Heiko K Parzies3
Abstract
Background: The distribution area of pearl millet in West and Central Africa (WCA) harbours a wide range ofclimatic and environmental conditions as well as diverse farmer preferences and pearl millet utilization habitswhich have the potential to lead to local adaptation and thereby to population structure. The objectives of ourresearch were to (i) assess the geographical distribution of genetic diversity in pearl millet inbreds derived fromlandraces, (ii) assess the population structure of pearl millet from WCA, and (iii) identify those geographicalparameters and environmental factors from the location at which landraces were sampled, as well as thosephenotypic traits that may have affected or led to this population structure. Our study was based on a set of 145inbred lines derived from 122 different pearl millet landraces from WCA.
Results: Five sub-groups were detected within the entire germplasm set by STRUCTURE. We observed that thephenotypic traits flowering time, relative response to photoperiod, and panicle length were significantly associatedwith population structure but not the environmental factors which are expected to influence these traits in naturalpopulations such as latitude, temperature, or precipitation.
Conclusions: Our results suggested that for pearl millet natural selection is compared to artificial selection lessimportant in shaping populations.
BackgroundPearl millet [Pennisetum glaucum (L.) R. Br.] is anannual, diploid, highly allogamous cereal with sevenchromosome pairs [1]. It can be grown in a vast rangeof environmental conditions including environmentsthat are characterized by frequent drought events andpoor soil fertility [2]. This is one reason that pearl milletis one of the most important staple food crops in Westand Central Africa (WCA) [3]. The other reason is thatpearl millet grain has relatively high nutritional valuesfor a cereal. Its grain has higher protein and fat contentthan wheat or rice and its amino acid composition is
more appropriate for human nutrition than that ofwheat or polished rice [4-6].Cultivated pearl millet displays tremendous phenoty-
pic variability for traits such as flowering time, paniclelength, grain and stover characteristics, tolerance todrought, pests, and diseases, as well as nutritional value(e.g., [7]). Efficient and systematic exploitation of thisdiversity is the key to any crop improvement program[8]. This, however, requires in a first step the assessmentof genetic diversity and population structure of the spe-cies under consideration.For pearl millet, several studies have examined these
issues. [9] determined the influence of farmer manage-ment on pearl millet landrace diversity in two villages inNorth-Eastern Nigeria. [10] assessed the genetic diver-sity within and between ten Indian pearl millet land-races. The genetic diversity of 46 wild and 421
* Correspondence: [email protected] Planck Institute for Plant Breeding Research, Carl-von-Linné Weg 10,50829 Köln, GermanyFull list of author information is available at the end of the article
Stich et al. BMC Plant Biology 2010, 10:216http://www.biomedcentral.com/1471-2229/10/216
© 2010 Stich et al; licensee BioMed Central Ltd. This is an Open Access article distributed under the terms of the Creative CommonsAttribution License (http://creativecommons.org/licenses/by/2.0), which permits unrestricted use, distribution, and reproduction inany medium, provided the original work is properly cited.
cultivated genotypes of pearl millet from Niger was ana-lyzed by [11,12] examined the phylogeny and origin ofpearl millet. However, to our knowledge, no earlierstudy examined the genetic diversity and populationstructure of pearl millet across a wide geographic rangein WCA.The distribution area of pearl millet in WCA harbours
a wide range of climatic and environmental conditionsas well as diverse farmer preferences and pearl milletutilization habits (cf. [13]). This may lead to local adap-tation and thereby to population structure. However, noearlier study examined systematically the forces thatmay have affected or led to the observed populationstructure in pearl millet.The objectives of our research were to (i) assess the
geographical distribution of genetic diversity, (ii) assessthe population structure of pearl millet from WCA, and(iii) identify those geographical parameters and environ-mental factors from the location at which landraceswere sampled, as well as those phenotypic traits thatmay have affected or led to this population structure.
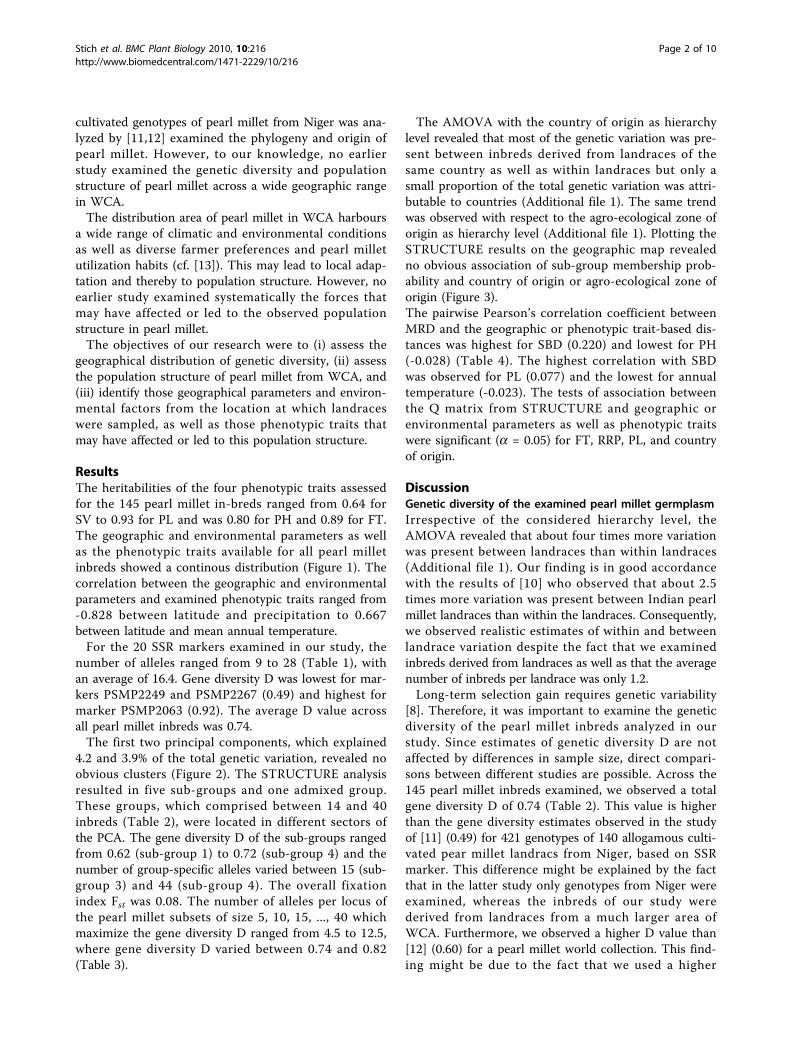
ResultsThe heritabilities of the four phenotypic traits assessedfor the 145 pearl millet in-breds ranged from 0.64 forSV to 0.93 for PL and was 0.80 for PH and 0.89 for FT.The geographic and environmental parameters as wellas the phenotypic traits available for all pearl milletinbreds showed a continous distribution (Figure 1). Thecorrelation between the geographic and environmentalparameters and examined phenotypic traits ranged from-0.828 between latitude and precipitation to 0.667between latitude and mean annual temperature.For the 20 SSR markers examined in our study, the
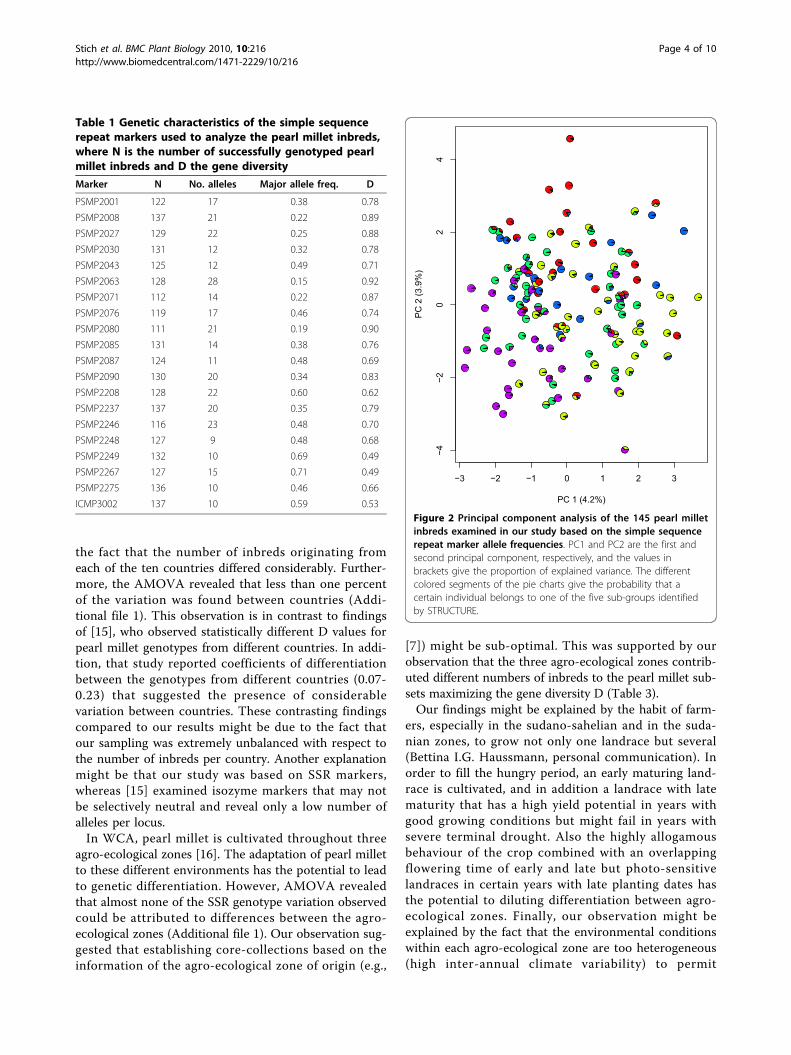
number of alleles ranged from 9 to 28 (Table 1), withan average of 16.4. Gene diversity D was lowest for mar-kers PSMP2249 and PSMP2267 (0.49) and highest formarker PSMP2063 (0.92). The average D value acrossall pearl millet inbreds was 0.74.The first two principal components, which explained
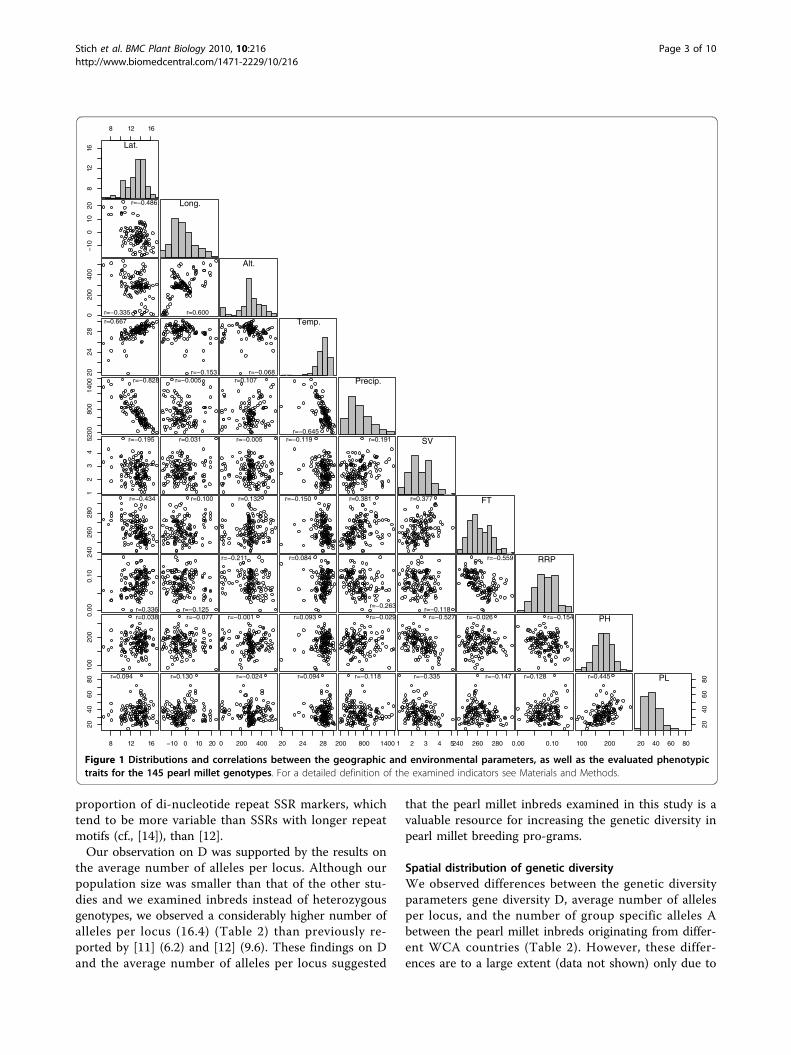
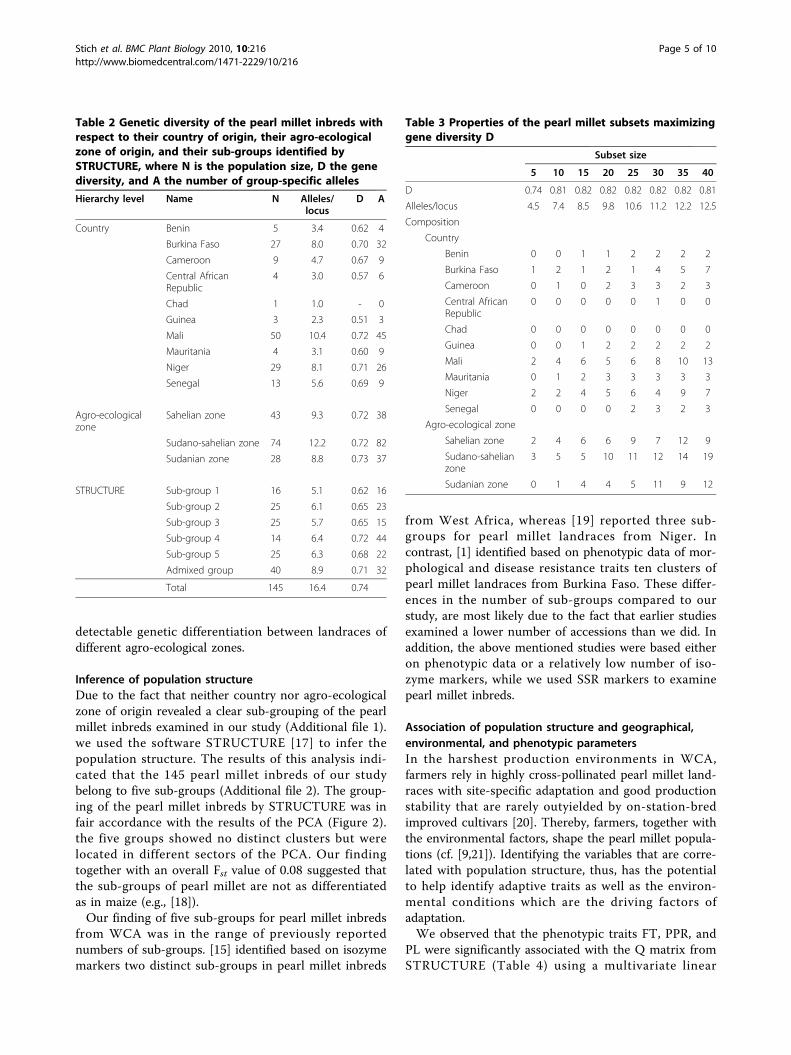
4.2 and 3.9% of the total genetic variation, revealed noobvious clusters (Figure 2). The STRUCTURE analysisresulted in five sub-groups and one admixed group.These groups, which comprised between 14 and 40inbreds (Table 2), were located in different sectors ofthe PCA. The gene diversity D of the sub-groups rangedfrom 0.62 (sub-group 1) to 0.72 (sub-group 4) and thenumber of group-specific alleles varied between 15 (sub-group 3) and 44 (sub-group 4). The overall fixationindex Fst was 0.08. The number of alleles per locus ofthe pearl millet subsets of size 5, 10, 15, ..., 40 whichmaximize the gene diversity D ranged from 4.5 to 12.5,where gene diversity D varied between 0.74 and 0.82(Table 3).
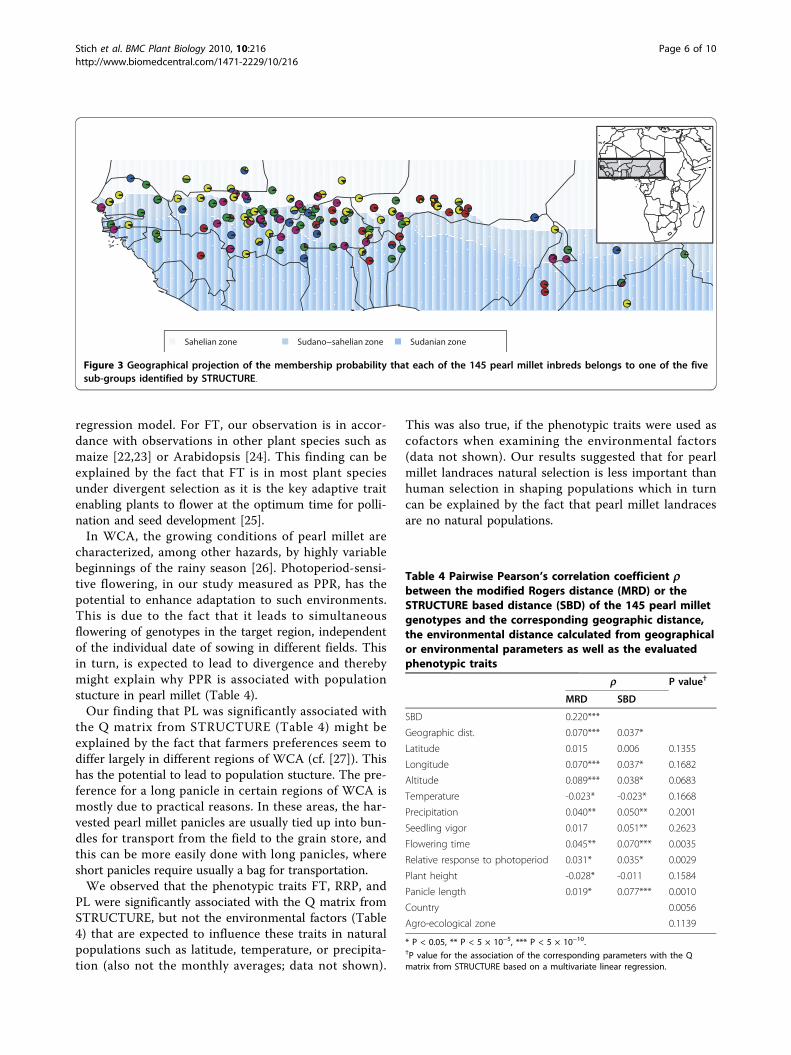
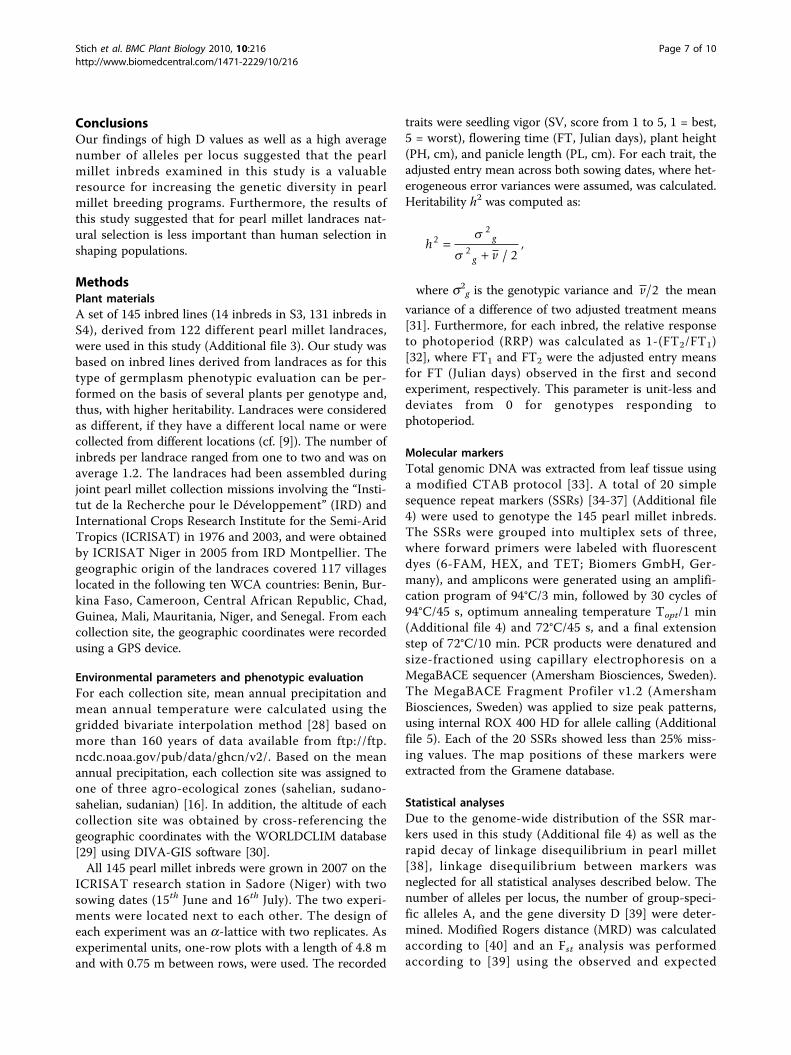
The AMOVA with the country of origin as hierarchylevel revealed that most of the genetic variation was pre-sent between inbreds derived from landraces of thesame country as well as within landraces but only asmall proportion of the total genetic variation was attri-butable to countries (Additional file 1). The same trendwas observed with respect to the agro-ecological zone oforigin as hierarchy level (Additional file 1). Plotting theSTRUCTURE results on the geographic map revealedno obvious association of sub-group membership prob-ability and country of origin or agro-ecological zone oforigin (Figure 3).The pairwise Pearson’s correlation coefficient betweenMRD and the geographic or phenotypic trait-based dis-tances was highest for SBD (0.220) and lowest for PH(-0.028) (Table 4). The highest correlation with SBDwas observed for PL (0.077) and the lowest for annualtemperature (-0.023). The tests of association betweenthe Q matrix from STRUCTURE and geographic orenvironmental parameters as well as phenotypic traitswere significant (a = 0.05) for FT, RRP, PL, and countryof origin.
DiscussionGenetic diversity of the examined pearl millet germplasmIrrespective of the considered hierarchy level, theAMOVA revealed that about four times more variationwas present between landraces than within landraces(Additional file 1). Our finding is in good accordancewith the results of [10] who observed that about 2.5times more variation was present between Indian pearlmillet landraces than within the landraces. Consequently,we observed realistic estimates of within and betweenlandrace variation despite the fact that we examinedinbreds derived from landraces as well as that the averagenumber of inbreds per landrace was only 1.2.Long-term selection gain requires genetic variability
[8]. Therefore, it was important to examine the geneticdiversity of the pearl millet inbreds analyzed in ourstudy. Since estimates of genetic diversity D are notaffected by differences in sample size, direct compari-sons between different studies are possible. Across the145 pearl millet inbreds examined, we observed a totalgene diversity D of 0.74 (Table 2). This value is higherthan the gene diversity estimates observed in the studyof [11] (0.49) for 421 genotypes of 140 allogamous culti-vated pear millet landracs from Niger, based on SSRmarker. This difference might be explained by the factthat in the latter study only genotypes from Niger wereexamined, whereas the inbreds of our study werederived from landraces from a much larger area ofWCA. Furthermore, we observed a higher D value than[12] (0.60) for a pearl millet world collection. This find-ing might be due to the fact that we used a higher
Stich et al. BMC Plant Biology 2010, 10:216http://www.biomedcentral.com/1471-2229/10/216
Page 2 of 10
proportion of di-nucleotide repeat SSR markers, whichtend to be more variable than SSRs with longer repeatmotifs (cf., [14]), than [12].Our observation on D was supported by the results on
the average number of alleles per locus. Although ourpopulation size was smaller than that of the other stu-dies and we examined inbreds instead of heterozygousgenotypes, we observed a considerably higher number ofalleles per locus (16.4) (Table 2) than previously re-ported by [11] (6.2) and [12] (9.6). These findings on Dand the average number of alleles per locus suggested
that the pearl millet inbreds examined in this study is avaluable resource for increasing the genetic diversity inpearl millet breeding pro-grams.
Spatial distribution of genetic diversityWe observed differences between the genetic diversityparameters gene diversity D, average number of allelesper locus, and the number of group specific alleles Abetween the pearl millet inbreds originating from differ-ent WCA countries (Table 2). However, these differ-ences are to a large extent (data not shown) only due to
8 12 16
812
16
Lat.
−10
010
20
r=−0.486 Long.
020
040
0
r=−0.335 r=0.600
Alt.
2024
28
r=0.667
r=−0.153 r=−0.068
Temp.
200
800
1400 r=−0.828 r=−0.005 r=0.107
r=−0.645
Precip.
12
34
5 r=−0.195 r=0.031 r=−0.005 r=−0.119 r=0.191 SV
240
260
280
r=−0.434 r=0.100 r=0.132 r=−0.150 r=0.381 r=0.377 FT
0.00
0.10
r=0.336 r=−0.125
r=−0.211 r=0.084
r=−0.263 r=−0.118
r=−0.559 RRP
100
200
r=0.038 r=−0.077 r=−0.001 r=0.093 r=−0.029 r=−0.527 r=−0.026 r=−0.154 PH
8 12 16
2040
6080
r=0.094
−10 0 10 20
r=0.130
0 200 400
r=−0.024
20 24 28
r=0.094
200 800 1400
r=−0.118
1 2 3 4 5
r=−0.335
240 260 280
r=−0.147
0.00 0.10
r=0.128
100 200
r=0.445
20 40 60 80
2040
6080PL
Figure 1 Distributions and correlations between the geographic and environmental parameters, as well as the evaluated phenotypictraits for the 145 pearl millet genotypes. For a detailed definition of the examined indicators see Materials and Methods.
Stich et al. BMC Plant Biology 2010, 10:216http://www.biomedcentral.com/1471-2229/10/216
Page 3 of 10
the fact that the number of inbreds originating fromeach of the ten countries differed considerably. Further-more, the AMOVA revealed that less than one percentof the variation was found between countries (Addi-tional file 1). This observation is in contrast to findingsof [15], who observed statistically different D values forpearl millet genotypes from different countries. In addi-tion, that study reported coefficients of differentiationbetween the genotypes from different countries (0.07-0.23) that suggested the presence of considerablevariation between countries. These contrasting findingscompared to our results might be due to the fact thatour sampling was extremely unbalanced with respect tothe number of inbreds per country. Another explanationmight be that our study was based on SSR markers,whereas [15] examined isozyme markers that may notbe selectively neutral and reveal only a low number ofalleles per locus.In WCA, pearl millet is cultivated throughout three
agro-ecological zones [16]. The adaptation of pearl milletto these different environments has the potential to leadto genetic differentiation. However, AMOVA revealedthat almost none of the SSR genotype variation observedcould be attributed to differences between the agro-ecological zones (Additional file 1). Our observation sug-gested that establishing core-collections based on theinformation of the agro-ecological zone of origin (e.g.,
[7]) might be sub-optimal. This was supported by ourobservation that the three agro-ecological zones contrib-uted different numbers of inbreds to the pearl millet sub-sets maximizing the gene diversity D (Table 3).Our findings might be explained by the habit of farm-
ers, especially in the sudano-sahelian and in the suda-nian zones, to grow not only one landrace but several(Bettina I.G. Haussmann, personal communication). Inorder to fill the hungry period, an early maturing land-race is cultivated, and in addition a landrace with latematurity that has a high yield potential in years withgood growing conditions but might fail in years withsevere terminal drought. Also the highly allogamousbehaviour of the crop combined with an overlappingflowering time of early and late but photo-sensitivelandraces in certain years with late planting dates hasthe potential to diluting differentiation between agro-ecological zones. Finally, our observation might beexplained by the fact that the environmental conditionswithin each agro-ecological zone are too heterogeneous(high inter-annual climate variability) to permit
Table 1 Genetic characteristics of the simple sequencerepeat markers used to analyze the pearl millet inbreds,where N is the number of successfully genotyped pearlmillet inbreds and D the gene diversity
Marker N No. alleles Major allele freq. D
PSMP2001 122 17 0.38 0.78
PSMP2008 137 21 0.22 0.89
PSMP2027 129 22 0.25 0.88
PSMP2030 131 12 0.32 0.78
PSMP2043 125 12 0.49 0.71
PSMP2063 128 28 0.15 0.92
PSMP2071 112 14 0.22 0.87
PSMP2076 119 17 0.46 0.74
PSMP2080 111 21 0.19 0.90
PSMP2085 131 14 0.38 0.76
PSMP2087 124 11 0.48 0.69
PSMP2090 130 20 0.34 0.83
PSMP2208 128 22 0.60 0.62
PSMP2237 137 20 0.35 0.79
PSMP2246 116 23 0.48 0.70
PSMP2248 127 9 0.48 0.68
PSMP2249 132 10 0.69 0.49
PSMP2267 127 15 0.71 0.49
PSMP2275 136 10 0.46 0.66
ICMP3002 137 10 0.59 0.53
−3 −2 −1 0 1 2 3
−4−2
02
4
PC 1 (4.2%)
PC
2 (3
.9%
)
Figure 2 Principal component analysis of the 145 pearl milletinbreds examined in our study based on the simple sequencerepeat marker allele frequencies. PC1 and PC2 are the first andsecond principal component, respectively, and the values inbrackets give the proportion of explained variance. The differentcolored segments of the pie charts give the probability that acertain individual belongs to one of the five sub-groups identifiedby STRUCTURE.
Stich et al. BMC Plant Biology 2010, 10:216http://www.biomedcentral.com/1471-2229/10/216
Page 4 of 10
detectable genetic differentiation between landraces ofdifferent agro-ecological zones.
Inference of population structureDue to the fact that neither country nor agro-ecologicalzone of origin revealed a clear sub-grouping of the pearlmillet inbreds examined in our study (Additional file 1).we used the software STRUCTURE [17] to infer thepopulation structure. The results of this analysis indi-cated that the 145 pearl millet inbreds of our studybelong to five sub-groups (Additional file 2). The group-ing of the pearl millet inbreds by STRUCTURE was infair accordance with the results of the PCA (Figure 2).the five groups showed no distinct clusters but werelocated in different sectors of the PCA. Our findingtogether with an overall Fst value of 0.08 suggested thatthe sub-groups of pearl millet are not as differentiatedas in maize (e.g., [18]).Our finding of five sub-groups for pearl millet inbreds
from WCA was in the range of previously reportednumbers of sub-groups. [15] identified based on isozymemarkers two distinct sub-groups in pearl millet inbreds
from West Africa, whereas [19] reported three sub-groups for pearl millet landraces from Niger. Incontrast, [1] identified based on phenotypic data of mor-phological and disease resistance traits ten clusters ofpearl millet landraces from Burkina Faso. These differ-ences in the number of sub-groups compared to ourstudy, are most likely due to the fact that earlier studiesexamined a lower number of accessions than we did. Inaddition, the above mentioned studies were based eitheron phenotypic data or a relatively low number of iso-zyme markers, while we used SSR markers to examinepearl millet inbreds.
Association of population structure and geographical,environmental, and phenotypic parametersIn the harshest production environments in WCA,farmers rely in highly cross-pollinated pearl millet land-races with site-specific adaptation and good productionstability that are rarely outyielded by on-station-bredimproved cultivars [20]. Thereby, farmers, together withthe environmental factors, shape the pearl millet popula-tions (cf. [9,21]). Identifying the variables that are corre-lated with population structure, thus, has the potentialto help identify adaptive traits as well as the environ-mental conditions which are the driving factors ofadaptation.We observed that the phenotypic traits FT, PPR, and
PL were significantly associated with the Q matrix fromSTRUCTURE (Table 4) using a multivariate linear
Table 2 Genetic diversity of the pearl millet inbreds withrespect to their country of origin, their agro-ecologicalzone of origin, and their sub-groups identified bySTRUCTURE, where N is the population size, D the genediversity, and A the number of group-specific alleles
Hierarchy level Name N Alleles/locus
D A
Country Benin 5 3.4 0.62 4
Burkina Faso 27 8.0 0.70 32
Cameroon 9 4.7 0.67 9
Central AfricanRepublic
4 3.0 0.57 6
Chad 1 1.0 - 0
Guinea 3 2.3 0.51 3
Mali 50 10.4 0.72 45
Mauritania 4 3.1 0.60 9
Niger 29 8.1 0.71 26
Senegal 13 5.6 0.69 9
Agro-ecologicalzone
Sahelian zone 43 9.3 0.72 38
Sudano-sahelian zone 74 12.2 0.72 82
Sudanian zone 28 8.8 0.73 37
STRUCTURE Sub-group 1 16 5.1 0.62 16
Sub-group 2 25 6.1 0.65 23
Sub-group 3 25 5.7 0.65 15
Sub-group 4 14 6.4 0.72 44
Sub-group 5 25 6.3 0.68 22
Admixed group 40 8.9 0.71 32
Total 145 16.4 0.74
Table 3 Properties of the pearl millet subsets maximizinggene diversity D
Subset size
5 10 15 20 25 30 35 40
D 0.74 0.81 0.82 0.82 0.82 0.82 0.82 0.81
Alleles/locus 4.5 7.4 8.5 9.8 10.6 11.2 12.2 12.5
Composition
Country
Benin 0 0 1 1 2 2 2 2
Burkina Faso 1 2 1 2 1 4 5 7
Cameroon 0 1 0 2 3 3 2 3
Central AfricanRepublic
0 0 0 0 0 1 0 0
Chad 0 0 0 0 0 0 0 0
Guinea 0 0 1 2 2 2 2 2
Mali 2 4 6 5 6 8 10 13
Mauritania 0 1 2 3 3 3 3 3
Niger 2 2 4 5 6 4 9 7
Senegal 0 0 0 0 2 3 2 3
Agro-ecological zone
Sahelian zone 2 4 6 6 9 7 12 9
Sudano-sahelianzone
3 5 5 10 11 12 14 19
Sudanian zone 0 1 4 4 5 11 9 12
Stich et al. BMC Plant Biology 2010, 10:216http://www.biomedcentral.com/1471-2229/10/216
Page 5 of 10
regression model. For FT, our observation is in accor-dance with observations in other plant species such asmaize [22,23] or Arabidopsis [24]. This finding can beexplained by the fact that FT is in most plant speciesunder divergent selection as it is the key adaptive traitenabling plants to flower at the optimum time for polli-nation and seed development [25].In WCA, the growing conditions of pearl millet are
characterized, among other hazards, by highly variablebeginnings of the rainy season [26]. Photoperiod-sensi-tive flowering, in our study measured as PPR, has thepotential to enhance adaptation to such environments.This is due to the fact that it leads to simultaneousflowering of genotypes in the target region, independentof the individual date of sowing in different fields. Thisin turn, is expected to lead to divergence and therebymight explain why PPR is associated with populationstucture in pearl millet (Table 4).Our finding that PL was significantly associated with
the Q matrix from STRUCTURE (Table 4) might beexplained by the fact that farmers preferences seem todiffer largely in different regions of WCA (cf. [27]). Thishas the potential to lead to population stucture. The pre-ference for a long panicle in certain regions of WCA ismostly due to practical reasons. In these areas, the har-vested pearl millet panicles are usually tied up into bun-dles for transport from the field to the grain store, andthis can be more easily done with long panicles, whereshort panicles require usually a bag for transportation.We observed that the phenotypic traits FT, RRP, and
PL were significantly associated with the Q matrix fromSTRUCTURE, but not the environmental factors (Table4) that are expected to influence these traits in naturalpopulations such as latitude, temperature, or precipita-tion (also not the monthly averages; data not shown).
This was also true, if the phenotypic traits were used ascofactors when examining the environmental factors(data not shown). Our results suggested that for pearlmillet landraces natural selection is less important thanhuman selection in shaping populations which in turncan be explained by the fact that pearl millet landracesare no natural populations.
Figure 3 Geographical projection of the membership probability that each of the 145 pearl millet inbreds belongs to one of the fivesub-groups identified by STRUCTURE.
Table 4 Pairwise Pearson’s correlation coefficient rbetween the modified Rogers distance (MRD) or theSTRUCTURE based distance (SBD) of the 145 pearl milletgenotypes and the corresponding geographic distance,the environmental distance calculated from geographicalor environmental parameters as well as the evaluatedphenotypic traits
r P value†
MRD SBD
SBD 0.220***
Geographic dist. 0.070*** 0.037*
Latitude 0.015 0.006 0.1355
Longitude 0.070*** 0.037* 0.1682
Altitude 0.089*** 0.038* 0.0683
Temperature -0.023* -0.023* 0.1668
Precipitation 0.040** 0.050** 0.2001
Seedling vigor 0.017 0.051** 0.2623
Flowering time 0.045** 0.070*** 0.0035
Relative response to photoperiod 0.031* 0.035* 0.0029
Plant height -0.028* -0.011 0.1584
Panicle length 0.019* 0.077*** 0.0010
Country 0.0056
Agro-ecological zone 0.1139
* P < 0.05, ** P < 5 × 10⁻⁵, *** P < 5 × 10⁻¹⁰.†P value for the association of the corresponding parameters with the Qmatrix from STRUCTURE based on a multivariate linear regression.
Stich et al. BMC Plant Biology 2010, 10:216http://www.biomedcentral.com/1471-2229/10/216
Page 6 of 10
ConclusionsOur findings of high D values as well as a high averagenumber of alleles per locus suggested that the pearlmillet inbreds examined in this study is a valuableresource for increasing the genetic diversity in pearlmillet breeding programs. Furthermore, the results ofthis study suggested that for pearl millet landraces nat-ural selection is less important than human selection inshaping populations.
MethodsPlant materialsA set of 145 inbred lines (14 inbreds in S3, 131 inbreds inS4), derived from 122 different pearl millet landraces,were used in this study (Additional file 3). Our study wasbased on inbred lines derived from landraces as for thistype of germplasm phenotypic evaluation can be per-formed on the basis of several plants per genotype and,thus, with higher heritability. Landraces were consideredas different, if they have a different local name or werecollected from different locations (cf. [9]). The number ofinbreds per landrace ranged from one to two and was onaverage 1.2. The landraces had been assembled duringjoint pearl millet collection missions involving the “Insti-tut de la Recherche pour le Développement” (IRD) andInternational Crops Research Institute for the Semi-AridTropics (ICRISAT) in 1976 and 2003, and were obtainedby ICRISAT Niger in 2005 from IRD Montpellier. Thegeographic origin of the landraces covered 117 villageslocated in the following ten WCA countries: Benin, Bur-kina Faso, Cameroon, Central African Republic, Chad,Guinea, Mali, Mauritania, Niger, and Senegal. From eachcollection site, the geographic coordinates were recordedusing a GPS device.
Environmental parameters and phenotypic evaluationFor each collection site, mean annual precipitation andmean annual temperature were calculated using thegridded bivariate interpolation method [28] based onmore than 160 years of data available from ftp://ftp.ncdc.noaa.gov/pub/data/ghcn/v2/. Based on the meanannual precipitation, each collection site was assigned toone of three agro-ecological zones (sahelian, sudano-sahelian, sudanian) [16]. In addition, the altitude of eachcollection site was obtained by cross-referencing thegeographic coordinates with the WORLDCLIM database[29] using DIVA-GIS software [30].All 145 pearl millet inbreds were grown in 2007 on the
ICRISAT research station in Sadore (Niger) with twosowing dates (15th June and 16th July). The two experi-ments were located next to each other. The design ofeach experiment was an a-lattice with two replicates. Asexperimental units, one-row plots with a length of 4.8 mand with 0.75 m between rows, were used. The recorded
traits were seedling vigor (SV, score from 1 to 5, 1 = best,5 = worst), flowering time (FT, Julian days), plant height(PH, cm), and panicle length (PL, cm). For each trait, theadjusted entry mean across both sowing dates, where het-erogeneous error variances were assumed, was calculated.Heritability h2 was computed as:
hvg
g
22
2
2=
+
/,
where s2g is the genotypic variance and v 2 the mean
variance of a difference of two adjusted treatment means[31]. Furthermore, for each inbred, the relative responseto photoperiod (RRP) was calculated as 1-(FT2/FT1)[32], where FT1 and FT2 were the adjusted entry meansfor FT (Julian days) observed in the first and secondexperiment, respectively. This parameter is unit-less anddeviates from 0 for genotypes responding tophotoperiod.
Molecular markersTotal genomic DNA was extracted from leaf tissue usinga modified CTAB protocol [33]. A total of 20 simplesequence repeat markers (SSRs) [34-37] (Additional file4) were used to genotype the 145 pearl millet inbreds.The SSRs were grouped into multiplex sets of three,where forward primers were labeled with fluorescentdyes (6-FAM, HEX, and TET; Biomers GmbH, Ger-many), and amplicons were generated using an amplifi-cation program of 94°C/3 min, followed by 30 cycles of94°C/45 s, optimum annealing temperature Topt/1 min(Additional file 4) and 72°C/45 s, and a final extensionstep of 72°C/10 min. PCR products were denatured andsize-fractioned using capillary electrophoresis on aMegaBACE sequencer (Amersham Biosciences, Sweden).The MegaBACE Fragment Profiler v1.2 (AmershamBiosciences, Sweden) was applied to size peak patterns,using internal ROX 400 HD for allele calling (Additionalfile 5). Each of the 20 SSRs showed less than 25% miss-ing values. The map positions of these markers wereextracted from the Gramene database.
Statistical analysesDue to the genome-wide distribution of the SSR mar-kers used in this study (Additional file 4) as well as therapid decay of linkage disequilibrium in pearl millet[38], linkage disequilibrium between markers wasneglected for all statistical analyses described below. Thenumber of alleles per locus, the number of group-speci-fic alleles A, and the gene diversity D [39] were deter-mined. Modified Rogers distance (MRD) was calculatedaccording to [40] and an Fst analysis was performedaccording to [39] using the observed and expected
Stich et al. BMC Plant Biology 2010, 10:216http://www.biomedcentral.com/1471-2229/10/216
Page 7 of 10
heterozygosities for the population under consideration.Principal component analysis (PCA) of the 145 inbredsbased on the (i) SSR allele frequency matrix and (ii) geo-graphical and environmental parameters as well as theevaluated phenotypic traits (Additional file 6) was car-ried out. Analyses of molecular variance (AMOVA)were performed using Arlequin [41].In order to identify those r = 5, 10, 15, ..., 40 pearl
millet inbreds which maximize the gene diversity D, weused an algorithm which is based on an iterative maxi-mization procedure [42]. Briefly, a subset of r inbredswas first chosen at random from the entire 145 pearlmillet inbreds. In step one, all the subsets of size (r - 1)were examined. The subset having the highest level of Dwas retained. In step two, among the remnant inbreds,the inbred bringing the greatest increase in D wasadded. These two steps were repeated until the genediversity D of the subset reached a maximum.A model-based approach implemented in software
package STRUCTURE [17] was used to determine thepresence of population structure and assign pearl milletinbred lines to sub-groups. In our investigations, the setof 145 inbreds was analyzed by setting the number ofsub-groups from one to 20 with five repetitions. Foreach run of STRUCTURE, the burn-in time as well asthe iteration number for the Markov chain Monte Carloalgorithm was set to 100,000. We used the ad hoc cri-terion described by [43] to estimate the number of sub-groups. From the five repetitions with the estimatednumber of sub-groups, the one with the maximum like-lihood was used to assign lines with membership prob-abilities of 0.80 or more to sub-groups. Inbreds withmembership probabilities less than 0.80 for all individualsub-groups were assigned to an admixed group.Pairwise geographic distances between all 145 pearl
millet inbreds were calculated from the geographic coor-dinates. Furthermore, for each geographic and environ-mental parameter, phenotypic trait, as well as for the Qmatrix from STRUCTURE (SBD), distances ED betweenall pairs of pearl millet inbreds were calculated as:
EDt t
t
t t
tijik k
k
jk k
kk
n
= − −−⎛
⎝⎜⎜
⎞
⎠⎟⎟
− −
=∑
1
2
,
where EDij is the distance between inbred i and j, nthe number of dimensions of the examined parameter,tik and tjk the parameter values of the inbreds i and j for
the kth dimension, t k− the mean parameter value of the
kth dimension across all inbreds, and t kthe standard
deviation of the parameter values for the kth dimensionacross all inbreds. For the Q matrix from STRUCTURE,n = 4, where n = 1 for the other parameters.
Pearson’s correlation coefficient was calculated for allcombinations between MRD and the above mentioneddistances as well as between SBD and the above men-tioned distances. In addition, we used the followingmultivariate linear regression model:
Q t eil l i il= + + ,
where Qil is the probability that the ith pearl milletinbred belongs to the lth sub-group (i.e., the value ofthe ith row in the lth column of the Q matrix fromSTRUCTURE), μl the intercept term for the lth columnof the Q matrix from STRUCTURE, ti the parametervalue of the ith pearl millet inbred, and eil the residual.We examined the geographic or environmental para-meters as well as phenotypic traits with this model inorder to identify those parameterrs which explain bestthe variation in the Q matrix from STRUCTURE.If not stated differently, all analyses were performed
with the statistical software R [44].
Additional material
Additional file 1: Analysis of molecular variance for the 145 pearlmillet inbred genotypes of this study. Analysis of molecular variancefor the 145 pearl millet inbred genotypes with respect to their countryand agro-ecological zone of origin, where DF are the degrees offreedom, SSD the sum of squares deviations, s2 the variance component,and % the percentage of variance contributed by each source ofvariation.
Additional file 2: Graphical representation of the results ofSTRUCTURE. Graphical representation of the results of STRUCTURE,where K is the number of sub-groups.
Additional file 3: Details for the 145 pearl millet inbred genotypesexamined in this study. Details of the 145 pearl millet inbredgenotypes examined in this study.
Additional file 4: Simple sequence repeats markers used in thisstudy. Simple sequence repeats markers used in this study, where LG isthe linkage group, Pos. the position in cM, and Topt the optimizedannealing temperature.
Additional file 5: Screen shot of the MegaBACE Fragment Profiler.Screen shot of the MegaBACE Fragment Profiler to illustrate theprocedure of allele calling.
Additional file 6: Principal component analysis of the 145 pearlmillet inbreds examined in our study based on the correspondinggeographical and environmental parameters as well as theevaluated phenotypic traits. Principal component analysis of the 145pearl millet inbreds examined in our study based on the correspondinggeographical and environmental parameters as well as the evaluatedphenotypic traits. PC1 and PC2 are the first and second principalcomponent, respectively, and the values in brackets give the proportionof explained variance. The different colored segments of the pie chartsgive the probability that a certain individual belongs to one of the fivesub-groups identified by STRUCTURE.
AcknowledgementsThis research was funded by the Federal Ministry for Economic Cooperationand Development (BMZ), Germany (ICRISAT/GTZ Project No. 05.7860.9-001.00). Funding for BS was provided by the Max Planck Society. Theauthors would like to acknowledge the excellent technical assistance of
Stich et al. BMC Plant Biology 2010, 10:216http://www.biomedcentral.com/1471-2229/10/216
Page 8 of 10
Adamou Hamadou, Ada Abarchi, Djingri Lankoande (ICRSAT Niger) andSabine Braun (University of Hohenheim).
Author details1Max Planck Institute for Plant Breeding Research, Carl-von-Linné Weg 10,50829 Köln, Germany. 2International Crops Research Institute for the Semi-Arid Tropics (ICRISAT), Niamey, BP 12404, Niamey, Niger. 3Institute of PlantBreeding, Seed Science, and Population Genetics, University of Hohenheim,70593 Stuttgart, Germany. 4ICRISAT, Patancheru, Hyderabad 502324, AndhraPradesh, India.
Authors’ contributionsBS, BIGH, and HKP designed the study. RP, SB, and BIGH carried out themolecular marker and phenotypic evaluation work. BS performed theanalyses. BS, BIGH, CTH, AEM, and HKP wrote the manuscript. All authorsread and approved the final version of the manuscript.
Received: 4 May 2010 Accepted: 6 October 2010Published: 6 October 2010
References1. Wilson JP, Burton GW, Zongo JD, Dicko IO: Diversity among pearl-millet
landraces collected in central Burkina Faso. Crop Science 1990, 30:40-43.2. Rachie KO, Majumdar JV: Pearl millet Pennsilvania State University 1980.3. Poncet V, Lamy F, Enjalbert J, Joly H, Sarr A, Robert T: Genetic analysis of
the domestication syndrome in pearl millet (Pennisetum glaucum L.,Poaceae): inheritance of the major characters. Heredity 1998, 81:648-658.
4. Goswami AK, Sharma KP, Sehgal KI: Nutritive value of proteins of pearlmillet of high-yielding varieties and hybrids. British Journal of Nutrition1969, 23:913-916.
5. Sawaya WN, Khalil JK, Safi WJ: Nutritional quality of pearl-millet flour andbread. Plant Foods for Human Nutrition 1984, 34:117-125.
6. Khairwal IS, Rai KN, Andrews DJ, Harinarayana G: Pearl millet breeding Oxford& IBH, New Dehli, India 1999.
7. Bhattacharjee R, Khairwal IS, Bramel PJ, Reddy KN: Establishment of a pearlmillet [Pennisetum glaucum (L.) R. Br.] core collection based ongeographical distribution and quantitative traits. Euphytica 2007,155:35-45.
8. Allard RW: Principles of plant breeding John Wiley and Sons, Inc., New York1960.
9. Busso CS, Devos KM, Ross G, Mortimore M, Adams WM, Ambrose MJ,Alldrick S, Gale MD: Genetic diversity within and among landraces ofpearl millet (Pennisetum glaucum ) under farmer management in WestAfrica. Genetic Resources and Crop Evolution 2000, 47:561-568.
10. Bhattacharjee R, Bramel P, Hash CT, Kolesnikova-Allen MA, Khairwal IS: As-sessment of genetic diversity within and between pearl millet landraces.Theoretical and Applied Genetics 2002, 105:666-673.
11. Mariac C, Luong V, Kapran I, Mamadou A, Sagnard F, Deu M, Chantereau J,Gerard B, Ndjeunga J, Bezancon G, Pham JL, Vigouroux Y: Diversity of wildand cultivated pearl millet accessions (Pennisetum glaucum [L.] R. Br.) inNiger assessed by microsatellite markers. Theoretical and Applied Genetics2006, 114:49-58.
12. Oumar I, Mariac C, Pham JL, Vigouroux Y: Phylogeny and origin of pearlmillet (Pennisetum glaucum [L.] R. Br.) as revealed by microsatellite loci.Theoretical and Applied Genetics 2008, 117:489-497.
13. Leblanc JM, Pernes J: Enzyme polymorphism of Pennisetum americanumin the Ivory-coast. Japanese Journal of Genetics 1983, 58:121-131.
14. Heckenberger M, Bohn M, Ziegle JS, Joe LK, Hauser JD, Hutton M,Melchinger AE: Variation of DNA fingerprints among accessions withinmaize inbred lines and implications for identification of essentiallyderived varieties. I. Genetic and technical sources of variation in SSRdata. Molecular Breeding 2002, 10:181-191.
15. Tostain S, Riandey M, Marchais L: Enzyme diversity in pearl-millet(Pennisetum glaucum).1. West-Africa. Theoretical and Applied Genetics 1987,74:188-193.
16. Saidou AA, Mariac C, Luong V, Pham JL, Bezancon G, Vigouroux Y:Association studies identify natural variation at PHYC linked to floweringtime and morphological variation in pearl millet. Genetics 2009,182:899-910.
17. Pritchard JK, Stephens M, Donnelly P: Inference of population structureusing multilocus genotype data. Genetics 2000, 155:945-959.
18. van Inghelandt D, Melchinger AE, Lebreton C, Stich B: Population structureand genetic diversity in a commercial maize breeding program assessedwith SSR and SNP markers. Theoretical and Applied Genetics 2010,120:1289-1299.
19. Tostain S: Isozymic classification of pearl-millet (Pennisetum glaucum,poaceae) landraces from Niger (West-Africa). Plant Systematics andEvolution 1994, 193:81-93.
20. Weltzien-Rattunde E, Whitaker ML, Rattunde HFW, Dhamotharan M,Anders MM: Seeds of choice. Making the most of new varieties for smallfarmers Oxford & IBH, New Dehli, India 1998 chap. Participatory approachesin pearl millet breeding.
21. vom Brocke KV, Christinck A, Weltzien R, Presterl T, Geiger HH: Farmers’seed systems and management practices determine pearl millet geneticdiversity patterns in semiarid regions of India. Crop Science 2003,43:1680-1689.
22. Thornsberry JM, Goodman MM, Doebley J, Kresovich S, Nielsen D,Buckler ES: Dwarf8 polymorphisms associate with variation in floweringtime. Nature Genetics 2001, 28:286-289.
23. Camus-Kulandaivelu L, Veyrieras JB, Madur D, Combes V, Fourmann M,Barraud S, Dubreuil P, Gouesnard B, Manicacci D, Charcosset A: Maizeadaptation to temperate climate: relationship between populationstructure and polymorphism in the Dwarf8 gene. Genetics 2006,172:2449-2463.
24. Zhao K, Aranzana MJ, Kim S, Lister C, Shindo C, Tang C, Toomajian C,Zheng H, Dean C, Marjoram P, Nordborg M: An Arabidopsis example ofassociation mapping in structured samples. PLoS Genetics 2007, 3:71-82.
25. Cockram J, Jones H, Leigh FJ, O’Sullivan D, Powell W, Laurie DA,Greenland AJ: Control of flowering time in temperate cereals: genes,domestication, and sustainable productivity. Journal of ExperimentalBotany 2007, 58:1231-1244.
26. Haussmann BIG, Boureima SS, Kassari IA, Moumouni KH, Boubacar A:Mechanisms of adaptation to climate variability in West African pearlmillet landraces a preliminary assessment. Journal of SAT AgriculturalResearch 2007, 3.
27. Haussmann BIG, Boubacar A, Boureima SS, Vigouroux Y: Multiplication andpreliminary characterization of West and Central African pearl milletlandraces. Journal of SAT Agricultural Research 2006, 2.
28. Akima H: Algorithm 761: Scattered-data surface fitting that has theaccuracy of a cubic polynomial. ACM Transactions on MathematicalSoftware 1996, 22:362-371.
29. Hijmans RJ, Cameron SE, Parra JL, Jones PG, Jarvis A: Very high resolutioninterpolated climate surfaces for global land areas. International Journalof Climatology 2005, 25:1965-1978.
30. Hijmans RJ, Guarino L, Bussink C, Mathur P, Cruz M, Barrentes I, Roja E:DIVA-GIS. Vsn. 5.0. A geographic information system for the analysis of speciesdistribution data 2004.
31. Holland JB, Nyquist WE, Cervantes-Martinez CT: Estimating andinterpreting heritability for plant breeding: An update. Plant BreedingReviews 2003, 22:9-112.
32. White JW, Laing DR: Photoperiod response of flowering in diversegenotypes of common bean (Phaseolus vulgaris). Field Crops Research1989, 22:113-128.
33. Saghai-Maroof MA, Soliman KM, Jorgensen RA, Allard RW: Ribosomal DNAspacer-length polymorphisms in barley - mendelian inheritance,chromosomal location, and population-dynamics. Proceedings of theNational Academy of Sciences of the United States of America 1984,81:8014-8018.
34. Allouis S, Qi X, Lindup S, Gale MD, Devos KM: Construction of a BAClibrary of pearl millet, Pennisetum glaucum. Theoretical and AppliedGenetics 2001, 102:1200-1205.
35. Qi X, Lindup S, Pittaway TS, Allouis S, Gale MD, Devos KM: Development ofsimple sequence repeat markers from bacterial artificial chromosomeswithout subcloning. BioTechniques 2001, 31:355-362.
36. Qi X, Pittaway TS, Lindup S, Liu H, Waterman E, Padi FK, Hash CT, Zhu J,Gale MD, Devos KM: An integrated genetic map and a new set of simplesequence repeat markers for pearl millet, Pennisetum glaucum.Theoretical and Applied Genetics 2004, 109:1485-1493.
37. Senthilvel S, Jayashree B, Mahalakshmi V, Kumar PS, Nakka S, Nepolean T,Hash CT: Development and mapping of Simple Sequence Repeatmarkers for pearl millet from data mining of Expressed Sequence Tags.BMC Plant Biology 2008, 8:119.
Stich et al. BMC Plant Biology 2010, 10:216http://www.biomedcentral.com/1471-2229/10/216
Page 9 of 10
38. Li Y, Bhosale S, Haussmann BIG, Stich B, Melchinger AE, Parzies HK: Geneticdiversity and linkage disequilibrium of two homologous genes to maizeD8 : Sorghum SbD8 and pearl millet PgD8. Journal of Plant Breeding andCrop Science 2010.
39. Nei M: Molecular evolutionary genetics Colombia University Press, New York1987.
40. Wright S: Evolution and genetics of populations The University of ChicagoPress, Chicago 1978, IV.
41. Excoffier L, Laval G, Schneider S: Arlequin (version 3.0): An integratedsoftware package for population genetics data analysis. EvolutionaryBioinformatics 2005, 1:47-50.
42. Gouesnard B, Bataillon T, Decoux G, Rozale C, Schoen D, David J: MSTRAT:An algorithm for building germ plasm core collections by maximizingallelic or phenotypic richness. Journal of Heredity 2001, 92:93-94.
43. Evanno G, Regnaut S, Goudet J: Detecting the number of clusters ofindividuals using the software STRUCTURE: a simulation study. MolecularEcology 2005, 14:2611-2620.
44. Team RDC: R: A Language and Environment for Statistical Computing RFoundation for Statistical Computing, Vienna, Austria 2009.
doi:10.1186/1471-2229-10-216Cite this article as: Stich et al.: Patterns of molecular and phenotypicdiversity in pearl millet [Pennisetum glaucum (L.) R. Br.] from West andCentral Africa and their relation to geographical and environmentalparameters. BMC Plant Biology 2010 10:216.
Submit your next manuscript to BioMed Centraland take full advantage of:
• Convenient online submission
• Thorough peer review
• No space constraints or color figure charges
• Immediate publication on acceptance
• Inclusion in PubMed, CAS, Scopus and Google Scholar
• Research which is freely available for redistribution
Submit your manuscript at www.biomedcentral.com/submit
Stich et al. BMC Plant Biology 2010, 10:216http://www.biomedcentral.com/1471-2229/10/216
Page 10 of 10