Embed Size (px)
Citation preview

Joint analysis of phenotypic and molecular diversity provides new insightson the genetic variability of the Brazilian physic nut germplasm bank
Alexandre Alonso Alves1, Leonardo Lopes Bhering2, Tatiana Barbosa Rosado1, Bruno Galvêas Laviola1,Eduardo Fernandes Formighieri1 and Cosme Damião Cruz2
1Embrapa Agroenergia, Brasilia, DF, Brazil.2Universidade Federal de Viçosa, Viçosa, MG, Brazil.
Abstract
The genetic variability of the Brazilian physic nut (Jatropha curcas) germplasm bank (117 accessions) was assessedusing a combination of phenotypic and molecular data. The joint dissimilarity matrix showed moderate correlationwith the original matrices of phenotypic and molecular data. However, the correlation between the phenotypic dis-similarity matrix and the genotypic dissimilarity matrix was low. This finding indicated that molecular markers (RAPDand SSR) did not adequately sample the genomic regions that were relevant for phenotypic differentiation of the ac-cessions. The dissimilarity values of the joint dissimilarity matrix were used to measure phenotypic + molecular diver-sity. This diversity varied from 0 to 1.29 among the 117 accessions, with an average dissimilarity among genotypesof 0.51. Joint analysis of phenotypic and molecular diversity indicated that the genetic diversity of the physic nutgermplasm was 156% and 64% higher than the diversity estimated from phenotypic and molecular data, respec-tively. These results show that Jatropha genetic variability in Brazil is not as limited as previously thought.
Keywords: molecular variability, Jatropha curcas L., phenotypic variability.
Received: January 28, 2013, Accepted: April 18, 2013.
Introduction
The high quality of physic nut (Jatropha curcas L.)oil (which meets Brazilian, US and European quality stan-dards) and the ease with which it can be converted intobiodiesel by either chemical (Berchmans and Hirata, 2008)or biological transesterification reactions (Modi et al.,2007) have made this species, together with the oil palm(Elaeis guineensis), the most promising plant species(Laviola et al., 2010) for complementing soybean as asource of oil for biodiesel production in the near future(Durães et al., 2011). The existence of an intense,well-organized research program led by the Brazilian Agri-cultural Research Corporation (Embrapa) that addressesmost of the problems related to Jatropha cultivation and oilproduction (Durães et al., 2011) has favored this species tothe detriment of others that lack such an initiative.
As one of the first steps to ensure that Jatropha maybe cultivated in large scale production fields, Embrapa hasinitiated a breeding program. The initial results have beenvery promising (Drumond et al., 2010; Rosado et al., 2010;Gurgel et al., 2011; Laviola et al., 2010, 2012a,b; Rocha et
al., 2012; Bhering et al., 2012, 2013). Specifically, these re-sults show that (1) it is possible to phenotypically select su-
perior physic nut families and individuals, regardless of theselection strategy used, (2) physic nut genotypes responddifferentially to different selection methods, (3) combinedselection and BLUP (Best Linear Unbiased Prediction) arethe best methods for rapid improvement of the species, (4)the application of combined selection or BLUP to the Bra-zilian physic nut leads to high genetic gains in the initialstages of the breeding program and (5) genotypes with en-hanced productivity can be selected and released as im-proved cultivars. The application of molecular tools is alsobeing investigated as a means of accelerating the domesti-cation of this species and for identifying superior genotypesto be released for commercial purposes (Durães et al.,2011; Silva-Junior et al., 2011).
Virtually all of these results rely on the evaluation ofthe Jatropha germplasm collection established byEmbrapa. This germplasm bank is one of the largest in theworld in terms of absolute number of accessions (~200) andplants (> 2000), and is thought to represent most of the ge-netic variability of the species in Brazil (Rosado et al.,2010). Initial characterization of the Brazilian Jatropha
germplasm bank using molecular markers (Rosado et al.,2010) indicated the existence of limited genetic variability.Similarity-based clustering revealed only 43 uniquemulti-locus profiles in the 192 accessions evaluated. Con-sidering that the physic nut is preferentially an outcrossing
Genetics and Molecular Biology, 36, 3, 371-381 (2013)Copyright © 2013, Sociedade Brasileira de Genética. Printed in Brazilwww.sbg.org.br
Send correspondence to Alexandre Alonso Alves. Embrapa Agro-energy, Avenida W3 Norte, Parque Estação Biológica, 70770-901Brasilia, DF, Brazil. E-mail: [email protected].
Research Article
species (Ginwal et al., 2005) a high degree of genetic varia-tion was expected to occur. Other reports that have exam-ined the genetic diversity of J. curcas using different typesof molecular markers have also shown that in general thereis limited variation in the most accessible germplasm re-sources of this species in various countries (Ram et al.,2008; Sun et al., 2008; Pamidimarri et al., 2009;Subramanyam et al., 2009).
The recurrent finding of low genetic diversity indi-cates that this is a worldwide phenomenon, probably be-cause physic nut dispersal has depended mainly onanthropic action. During the initial dispersal, seeds from alimited number of plants were probably collected andplanted abroad. In addition, since physic nut plants oftenoccur as isolated individuals interbreeding is not very fre-quent, and this may further limit the genetic diversity. Ex-perimentally, neutral molecular marker techniques such asRAPD (random amplified polymorphic DNA) or SSR(simple sequence repeats) that are commonly used in mo-lecular diversity studies may sample diversity innon-coding regions of the genome (Collard et al., 2005)and may therefore have limited use in predicting thephenotypic diversity of individuals, especially in complextraits such as yield. Consequently, low molecular variabil-ity may not be accompanied by low phenotypic variabilityfor important traits. In agreement with this conclusion, andas confirmation of the representativeness of the Embrapagermplasm collection, we have reported the existence ofmoderate phenotypic diversity that allows elevated geneticgains to be obtained within a short period (Laviola et al.,2010, 2012a,b).
Based on the foregoing considerations, it is clear thatthe genetic variability of the Brazilian Jatropha germplasmbank has not been fully investigated. Given the importanceof this germplasm bank, it would be interesting not only tomeasure genetic diversity based on molecular orphenotypic traits separately, but to combine them into a sin-gle analysis in order to get a clear picture of the actual di-versity available. Methods that allow such an analysis exist(Cruz et al., 2011), but are not used very often because onlya few germplasm collections have been characterizedphenotypically and molecularly. Since the BrazilianJatropha germplasm collection has already been character-ized phenotypically and molecularly, the objectives of thisstudy were to (1) determine the extent to which moleculardiversity resembles phenotypic diversity, (2) determinehow well the combined distance matrix correlates with dis-tance matrices based on phenotypic and molecular data, (3)evaluate the suitability of different procedures for perform-ing a joint analysis of phenotypic and molecular diversity,(4) verify whether a joint analysis of phenotypic and molec-ular diversity could help discriminate genotypes within theBrazilian Jatropha population and (5) verify whether ajoint analysis of phenotypic and molecular diversity can re-veal novel patterns of genotype grouping. By using two
complementary data sets (phenotypic and molecular datapreviously generated by our group) we sought to provide abetter assessment of the existing diversity. The results ofthis study may be helpful in determining the need for addi-tional collections to improve the representativeness of thegermplasm bank and allow further genetic characterizationof Jatropha.
Material and Methods
Plant material and experimental design
A set of 117 J. curcas accessions collected in differ-ent geographical regions throughout Brazil (Rosado et al.,2010) and belonging to the Embrapa germplasm bank wasused in the experiment. The germplasm bank is located inthe experimental area of Embrapa Cerrados at Planaltina,DF, Brazil (15°35’30” south latitude and 47°42’30” westlongitude, at 1007 m altitude)]. The field experiment wasdone using a randomized blocks design with two replicatesand five adult plants per plot arranged in rows (4 m x 2 mspacing). The cultural management practices, i.e., nutrition,pest and disease control, for maintenance of the germplasmbank were those recommended for the species (Dias et al.,2007; Laviola et al., 2010).
Phenotypic and molecular characterization
Phenotypic evaluation of the 117 accessions wasdone in the second year of cultivation and was based on re-productive and vegetative traits (Laviola et al., 2010). Thefollowing phenotypic traits were evaluated: (1) grain yield(Yield, g), (2) weight of 100 seeds (W100, g), (3) number ofseeds per fruit (NSF, n), (4) endosperm/seed ratio (E/S), (5)seed length (SL, mm), (6) seed width (SW, mm), (7) seedthickness (ST, mm), (8) total number of branches per plantat 0.5 m above ground (TNB 0.5), (9) total number ofbranches per plant at 1 m above ground (TNB 1.0), (10) to-tal number of branches per plant at 1.5 m above ground(TNB 1.5), (11) plant height (height, m), (12) stem diame-ter (SD, mm), (13) canopy projection on the row measuredas the extent of the canopy (in meters) in the planting row(CPR, m), (14) canopy projection between lines (CPBL, m),(15) canopy volume, measured as the extent of the canopy(in meters) between adjacent planting lines (CV, m3), (16)juvenility measured as the number of days from planting tofirst flowering (NDF, days) and (17) height of the first in-florescence (HFI, m). The canopy volume was estimated byapproximating the volume of a cylinder with an ellipticalbase using the formula
VD D
hcanopy � � ��
��
�
� 1 2
2 2,
where Vcanopy = canopy volume (m3), = 3.14159, D1 = can-opy diameter at the widest point (m), D2 = canopy diameterat the narrowest point (m) and h = plant height (m), as pre-viously used by Laviola et al. (2010). We have previously
372 Alves et al.

estimated genetic and environmental parameters usingmixed models (REML/BLUP) and have found that mediumto high accuracies can be obtained for breeding values byusing only one measure in a single environment (Laviola et
al., 2010, 2012a,b). This finding demonstrates that the typeof evaluation used in this experiment is useful for predict-ing the genetic value of accessions.
The molecular data used in this study were obtainedas reported by Rosado et al. (2010). Briefly, total genomicDNA was extracted from the young leaves of two plants peraccession, i.e., two biological replicates, using a CTABprotocol (Grattapaglia and Sederoff, 1994). The DNA con-centration was measured using a Nanodrop spectrophoto-meter (Nanodrop Products, Wilmington, DE, USA) and theconcentration of each sample was adjusted to 2-5 ng/�L.Fifteen RAPD primers (Operon Technologies, Inc.,Huntsville, AL, USA; DT Technologies, Coralville, IA,USA) and two SSR primer pairs (jcps20-1 and jcps20-2)were scored. The selected primers were previously testedfor polymorphism in this same set of Jatropha accessionsand found to amplify robust (reproducible) loci (Rosado et
al., 2010). RAPD and SSR loci were amplified by the poly-merase chain reaction (PCR) using standard procedures(Rosado et al., 2010). RAPD products were visualized on1.5% agarose gels and SSR products were electroinjectedin an ABI 3100XL Genetic Analyzer (Applied Biosystems,Foster City, CA, USA) and data were collected with virtualfilter D using GeneScan 2.0. Alleles were declared usingGenotyper 2.1 (Applied Biosystems). An internal size stan-dard labeled with ROX (Brondani and Grattapaglia, 2001)was used for sizing SSR alleles. All analyses related to theamplification, interpretation and robustness of RAPDmarkers were done as described by Grattapaglia and Se-deroff (1994) and Reis and Grattapaglia (2004).
Genetic diversity analyses
Since we had access to morphological and moleculardata, different strategies for studying the genetic diversityof physic nut based on parallel molecular and phenotypicanalyses were tested. Initially, the phenotypic data wereused to generate a dissimilarity matrix based on Gower’smethod (Gower, 1971) and the molecular data were used togenerate a dissimilarity matrix based on Jaccard’s coeffi-cient (Jaccard, 1901). To combine phenotypic and molecu-lar data, the Gower and Jaccard dissimilarity matrices weresummed algebraically to generate a new matrix referred toas the joint dissimilarity matrix. By combining dissimilar-ity matrices based on different data sets, i.e., phenotypicand molecular, our aim was to simultaneously assess all in-formation at once, thereby capturing all available informa-tion.
Graphic representations of the matrices were gener-ated based on color gradients that were used to express thedissimilarity between genotypes. Red was used to indicatelower genetic dissimilarity while green was used to indicate
the most dissimilar accessions. A score of zero corre-sponded to the lowest genetic dissimilarity (represented byred) while a score of 1 corresponded to maximum geneticdissimilarity (represented by green). The correlation be-tween the dissimilarity matrices described above was alsoexamined. The correlations and their significances weretested by using Mantel’s Z test with 1000 permutations(Manly, 1997). This procedure allowed us to assess the re-semblance between the genotypic and phenotypic matricesand between the genetic dissimilarity matrices and jointdissimilarity matrix.
After generating the dissimilarity matrices the geneticdiversity of the Brazilian physic nut population was ini-tially assessed based on a 3D dispersion analysis. For this,the dissimilarity matrices generated with Gower’s index,Jaccard’s index and by combining the Gower and Jaccardinformation were used to produce three groups of x, y and zcoordinates, i.e., a distance projection in three dimensionalspace using Genes software (Cruz, 2009). The coordinateswere later used to construct 3D scatter plots with SigmaPlotv.12.0. In these graphs, greater dot dispersion indicatedgreater genetic diversity of the population. We later ex-panded this group analysis by using Tocher’s clusteringmethod. In this method the accessions were assigned togroups consisting of equivalent genotypes. The groupswere presented using letter coded group profiles. Acces-sions allocated to the same group based on Tocher’s clusteranalysis were presented in the same color in the 3D scatterplots.
Results
The phenotypic and molecular diversity of physic nutwas assessed by generating various dissimilarity matricesbased on Gower’s and Jaccard’s indices. Table 1 shows theminimum, maximum and mean genetic dissimilarities andFigure 1 shows the graphic representation of the dissimilar-ity matrices. The data in Table 1 and Figure 1 indicate thatphysic nut diversity is limited at the molecular and pheno-typic levels, as shown by the yellow and red points in thefigure. Red and yellow points indicate highly and moder-ately similar genotype pairs, whereas green points indicatehighly divergent genotype pairs. Although numerous re-ports have indicated low molecular diversity, the presentdata indicate that the mean molecular dissimilarity isgreater than the mean phenotypic dissimilarity. However,
Genetic diversity of Jatropha 373
Table 1 - Descriptive statistics for genetic diversity in the physic nut ac-cording to the method used to calculate genetic distances.
Method Genetic dissimilarity
Minimum Maximum Mean
Gower 0.055268176 0.481279647 0.199820516
Jaccard 0.000000000 1.000000000 0.312200570
Gower + Jaccard 0.067696118 1.290304000 0.512086000

more genotypic pairs are closely related to each other basedon molecular markers than on phenotypic data (Figure 1).The higher individual dissimilarities in the molecular datacompared to phenotypic data most likely accounted for thehigher general mean in the former. In accordance with thisconclusion, the 3D dispersion graphs representing the rela-tionship among genotypes (accessions) based on the twodissimilarity indices (Figure 2) demonstrated that most ofthe genotypes were concentrated in a dense dot “cloud”when analyzed with phenotypic data. On the other hand, the
molecular data allowed genotypes to be allocated into dis-tinct groups that were more divergent among each other.Table 2 shows the results of the statistical analysis of the 3Dscatterplots, including the distortion associated with the es-timated coordinates. As can be seen, the projections pre-sented in Figure 3 were not error free since there was asmall distortion in all cases.
Since the grouping of genotypes into significant clus-ters was found to be impossible based on visual examina-tion of the scatter plots, we undertook a cluster analysis
374 Alves et al.
Figure 1 - (A) Gower’s dissimilarity matrix and (B) Jaccard’s dissimilarity matrix. A color gradient was used to graphically express the dissimilarity be-tween genotypes. Red indicates the most similar accessions, i.e., lowest genetic dissimilarity, while green indicates the most dissimilar accessions, i.e.,lowest genetic similarity. A value of zero corresponded to the lowest genetic dissimilarity (represented by red) while 1 corresponded to the maximum ge-netic dissimilarity (represented by green). The dissimilarity matrices were symmetric and, consequently, the dissimilarity values below the diagonal wereequivalent to those above the diagonal.
Figure 2 - 3D scatter plots showing the relationship among physic nut accessions assessed using (A) phenotypic data (Gower’s dissimilarity matrix) and(B) molecular data (Jaccard’s dissimilarity matrix). The dots representing distinct groups of accessions (based on Tocher’s cluster analysis) are show indifferent colors in each graph. X, Y and Z axis coordinates were calculated based on the distance projection. Note the different scales of the graphs.
based on Tocher’s method (Tables 3 and 4). This analysisrevealed 14 and 15 distinct groups for the 117 accessionsbased on phenotypic and molecular data, respectively. Dotsrepresenting distinct groups of accessions were then differ-entiated in the scatter plot using different colors (Figure 2).Interestingly, nearly 60% of 117 accessions occurred in asingle group (Group A) based on phenotypic and molecularinformation, thus confirming the previous conclusion re-garding limited phenotypic and molecular diversity in theBrazilian cultivated germplasm.
Although the diversity analyses based on phenotypicor molecular data resulted in a similar number of indistin-guishable groups and a similar concentration of genotypesin a single group, the correlation between Gower’s dissimi-larity matrix and Jaccard’s dissimilarity matrix was never-theless low (Table 5). This finding indicates that molecularmarkers (RAPDs and SSRs) are not sampling the samegenomic regions that are relevant to phenotypic differentia-tion of the accessions.
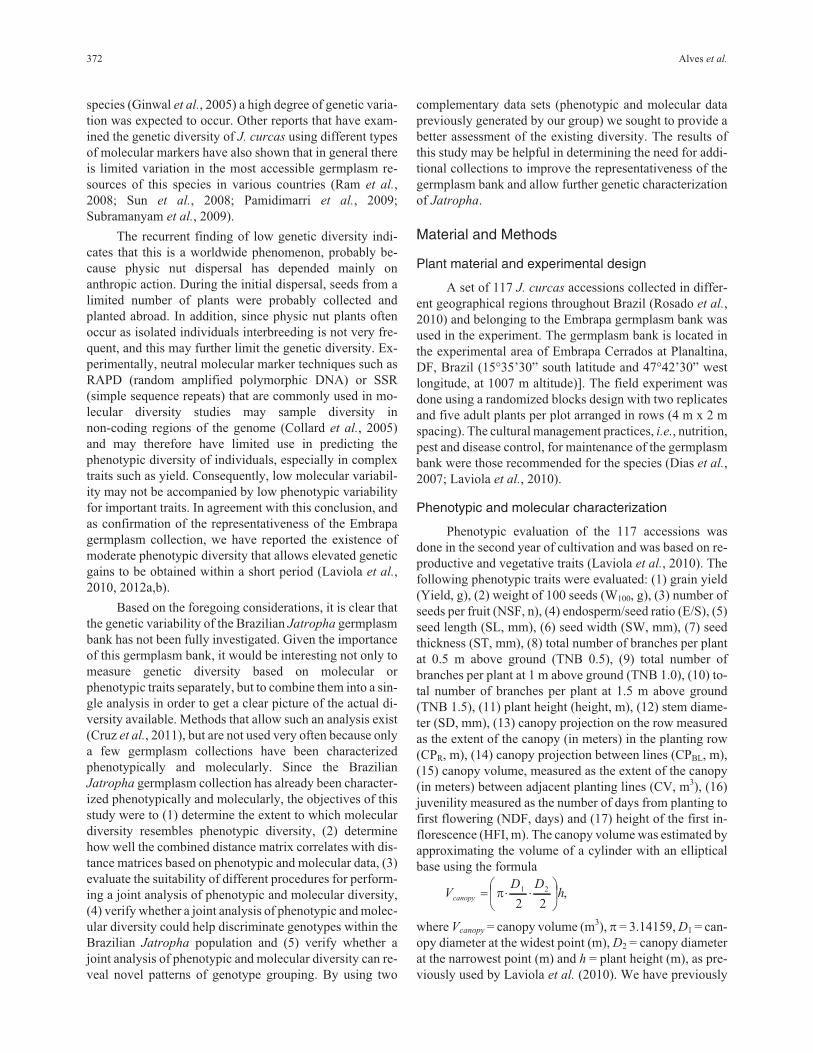
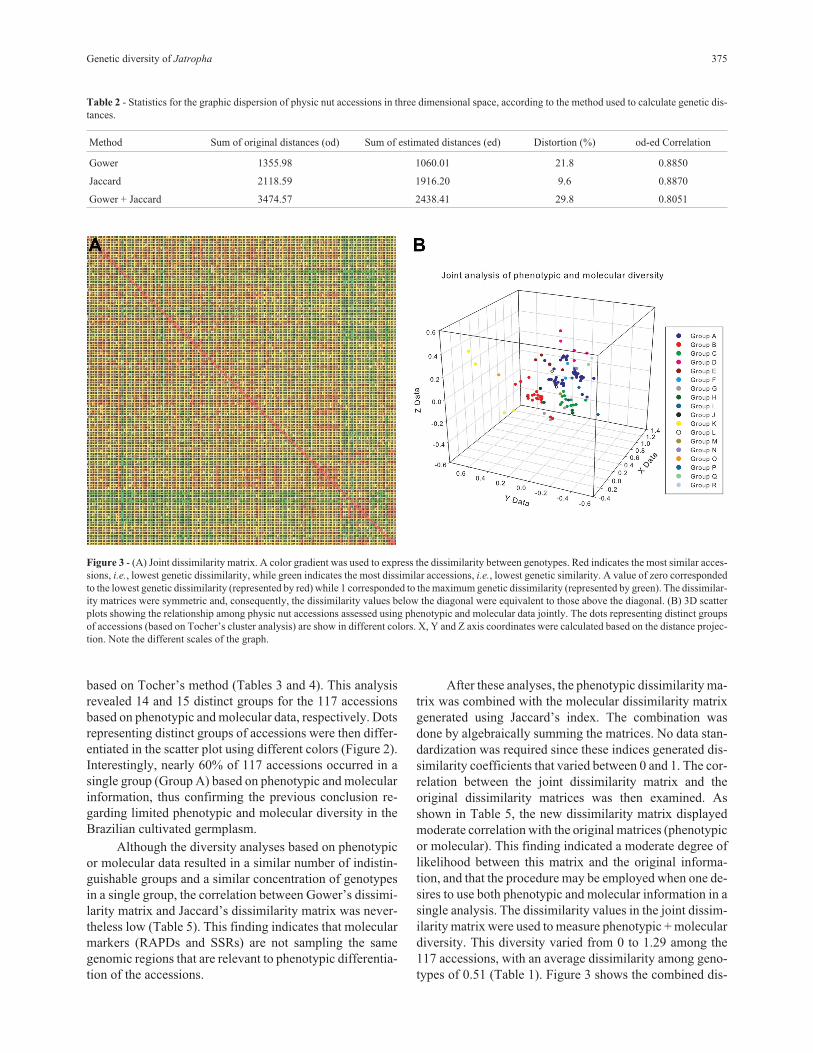
After these analyses, the phenotypic dissimilarity ma-trix was combined with the molecular dissimilarity matrixgenerated using Jaccard’s index. The combination wasdone by algebraically summing the matrices. No data stan-dardization was required since these indices generated dis-similarity coefficients that varied between 0 and 1. The cor-relation between the joint dissimilarity matrix and theoriginal dissimilarity matrices was then examined. Asshown in Table 5, the new dissimilarity matrix displayedmoderate correlation with the original matrices (phenotypicor molecular). This finding indicated a moderate degree oflikelihood between this matrix and the original informa-tion, and that the procedure may be employed when one de-sires to use both phenotypic and molecular information in asingle analysis. The dissimilarity values in the joint dissim-ilarity matrix were used to measure phenotypic + moleculardiversity. This diversity varied from 0 to 1.29 among the117 accessions, with an average dissimilarity among geno-types of 0.51 (Table 1). Figure 3 shows the combined dis-
Genetic diversity of Jatropha 375
Figure 3 - (A) Joint dissimilarity matrix. A color gradient was used to express the dissimilarity between genotypes. Red indicates the most similar acces-sions, i.e., lowest genetic dissimilarity, while green indicates the most dissimilar accessions, i.e., lowest genetic similarity. A value of zero correspondedto the lowest genetic dissimilarity (represented by red) while 1 corresponded to the maximum genetic dissimilarity (represented by green). The dissimilar-ity matrices were symmetric and, consequently, the dissimilarity values below the diagonal were equivalent to those above the diagonal. (B) 3D scatterplots showing the relationship among physic nut accessions assessed using phenotypic and molecular data jointly. The dots representing distinct groupsof accessions (based on Tocher’s cluster analysis) are show in different colors. X, Y and Z axis coordinates were calculated based on the distance projec-tion. Note the different scales of the graph.
Table 2 - Statistics for the graphic dispersion of physic nut accessions in three dimensional space, according to the method used to calculate genetic dis-tances.
Method Sum of original distances (od) Sum of estimated distances (ed) Distortion (%) od-ed Correlation
Gower 1355.98 1060.01 21.8 0.8850
Jaccard 2118.59 1916.20 9.6 0.8870
Gower + Jaccard 3474.57 2438.41 29.8 0.8051

similarity matrix along with the 3D dispersion graph repre-senting the relationship among genotypes (accessions) interms of their joint phenotypic and molecular diversity.Comparison of this graphical representation with the gra-phical representation of Gower’s or Jaccard’s dissimilaritymatrices (Figure 1) suggests that the joint dissimilarity ma-trix shares a high degree of likelihood with the original ma-trices (shown earlier by correlation analysis) and, at the
same time, that this procedure is efficient in enhancing thesampling of genetic diversity. Such a matrix is thereforeprobably more realistic than the other matrices.
The results of Tocher’s cluster analysis, based on thejoint dissimilarity matrix, are presented in Table 6. Com-pared to previous studies, the joint analysis of phenotypicand molecular diversity revealed new insights into the ge-netic diversity of the germplasm of cultivated physic nut.
376 Alves et al.
Table 3 - Results for Tocher’s cluster analysis based on Gower’s dissimilarity matrix. Indistinguishable accessions (Gower’s similarity = 1.0) weregrouped in letter-coded groups.
Group Number of accessions Accessions
A 71 72, 92, 41, 83, 80, 102, 96, 47, 109, 35, 69, 82, 71, 31, 48, 2, 74, 79, 33, 12, 50, 18, 37, 94, 13, 30, 77, 75,11, 53, 34, 16, 10, 26, 6, 63, 117, 25, 95, 49, 111, 64, 110, 27, 73, 29, 44, 59, 112, 23, 105, 65, 51, 70, 86,28, 5, 62, 9, 56, 91, 88, 60, 24, 89, 58, 85, 103, 116, 84, 19
B 13 40, 61, 66, 97, 38, 99, 108, 98, 36, 104, 76, 21, 7
C 6 14, 15, 54, 32, 39, 22
D 6 68, 113, 42, 57, 52, 115
E 5 101, 107, 100, 87, 45
F 4 3, 67, 114, 78
G 3 81, 93, 46
H 2 90, 106
I 2 8, 17
J 1 20
K 1 1
L 1 43
M 1 55
N 1 4
Table 4 - Results for Tocher’s cluster analysis based on Jaccard’s dissimilarity matrix. Accessions with indistinguishable multilocus marker genotypes(Jaccard’s dissimilarity = 0) were grouped in letter-coded groups.
Group Number of accessions Accessions
A 70 2, 11, 20, 21, 26, 32, 36, 45, 46, 48, 49, 55, 69, 4, 6, 7, 9, 15, 24, 28, 31, 33, 40, 41, 44, 51, 53, 56, 58, 63,64, 77, 78, 1, 5, 42, 81, 35, 8, 13, 19, 22, 23, 61, 62, 66, 73, 84, 89, 92, 94, 95, 113, 38, 54, 60, 80, 111, 3,34, 43, 50, 67, 68, 72, 88, 90, 91, 93, 59
B 17 57, 65, 82, 86, 97, 100, 102, 104, 105, 106, 107, 115, 116, 117, 83, 103, 110
C 6 12, 87, 71, 47, 70, 96
D 5 25, 39, 17, 37, 18
E 3 29, 109, 114
F 3 85, 101, 98
G 2 10, 16
H 2 79, 108
I 2 75, 112
J 2 30, 76
K 1 74
L 1 27
M 1 52
N 1 99
O 1 14

The joint dissimilarity was greater than phenotypic or mo-lecular dissimilarity (156% and 64% higher, respectively).Tocher’s clustering method revealed an increase in thenumber of indistinguishable groups among the 117 acces-sions (18 groups). Interestingly, the largest group (group A)generated by the joint analysis of phenotypic and moleculardata contained only 44% of the 117 accessions. Comparedto the largest group generated using phenotypic and molec-ular independently, this number is nearly 27% smaller.Moreover, considering only this major group in the cluster-ing generated by Tocher/Gower, Tocher/Jaccard andTocher phenotypic/molecular data analyses, 42 of the ac-cessions that were grouped in Group A based on molecularmarkers were also grouped based on phenotypic data, 35 ofthe accessions grouped in Group A based on phenoty-pic/molecular data were also grouped based on phenotypicdata, 52 of the accessions grouped in Group A based on
phenotypic/molecular data were also grouped based on mo-lecular data and 35 accessions were consistently groupedtogether, regardless of the dissimilarity matrix in which thecluster analysis was performed (Figure 4). This result indi-cates that some genotypes are always grouped together, re-gardless of the strategy used to study genetic diversity andshould really be considered as duplicates or close geno-types when assessing germplasm conservation.
Together, these results indicate that the genetic diver-sity in the germplasm bank of the Brazilian physic nut issmall, but not as limited as previously thought based on thestudies by Rosado et al. (2010) and Laviola et al. (2010,2012b). These results also indicate that the joint analysis ofphenotypic and molecular data is effective in capturing allexisting genetic variability.
Discussion
To the best of our knowledge this is the most compre-hensive assessment of the genetic diversity of the cultivatedphysic nut germplasm in Brazil, and one of the first to bebased on phenotypic and molecular data. The phenotypicdata used in this study were derived from two of the mostcomprehensive studies of genetic parameters in physic nutperformed to date (Laviola et al., 2010, 2012b). The traitslist encompassed vegetative (tree architecture traits) and re-productive traits, including grain yield, considered to be themost important trait to be improved in forthcoming years to
Genetic diversity of Jatropha 377
Table 5 - Correlation coefficients between the dissimilarity matrices forphenotypic and molecular data.
Matrices Correlation
Jaccard (Jac) and Gower (Gow) 0.26360+*
Jaccard (Jac) and Joint (Jac+Gow) 0.94380++**
Gower (Gow) and Joint (Jac+Gow) 0.35516++**
*,**p < 0.05 and 0.01, respectively (t-test). +,++p < 0.05 and p, < 0.01, re-spectively (Mantel test with 1000 simulations). Gow: dissimilarity matrixobtained with Gower’s method; Jac: dissimilarity matrix obtained withJaccard’s dissimilarity coefficient.
Table 6 - Results of Tocher’s cluster analysis based on a summed Gower and Jaccard dissimilarity matrix. Indistinguishable accessions were grouped inletter coded group profiles.
Group Number of accessions Accessions
A 52 2, 4-9, 11, 13, 15, 19, 20-24, 26, 28, 31-33, 40, 41, 44-46, 48-51, 53, 55, 56, 58, 61-64, 66, 69, 73, 77, 78,80, 81, 84, 89, 92, 94, 95, 111, 113
B 19 12, 57, 65, 82, 83, 86, 87, 97, 100, 102-107, 110, 115- 117
C 13 3, 34, 42, 43, 67, 68, 72, 74, 88, 90, 91, 93, 96
D 5 17, 18, 25, 37, 39
E 4 36, 38, 54, 60
F 3 10, 16, 59
G 3 71, 79, 108
H 3 85, 98, 101
I 3 35, 75, 112
J 2 47, 70
K 2 29, 109
L 2 30, 76
M 1 27
N 1 1
O 1 99
P 1 52
Q 1 14
R 1 114

make Jatropha a truly viable biofuel crop (Durães et al.,2011; Laviola et al., 2012a,b; Rocha et al., 2012).
The extensive list of phenotypic traits evaluated en-sured that the phenotypic diversity data generated and, con-sequently, the results of this study, have a direct, fastapplication in the breeding program [see Laviola et al.
(2012a,b) for more information regarding the genetic pa-rameters and potential of this population for breeding pur-poses]. The RAPD and SSR markers used in this studyprovided a robust platform for an initial assessment ofphysic nut molecular diversity and allowed us to be confi-dent about the conclusions reached [see Rosado et al.
(2010) for information regarding marker polymorphism,SSR allele frequencies, RAPD reproducibility, band infor-mativeness and RAPD primer resolving power].
Physic nut genetic diversity was low based on bothmolecular and phenotypic data. The average dissimilarityamong the 117 genotypes was 0.31 and 0.19 based on mo-lecular and phenotypic data, respectively. These valuesagree with those previously reported for the most accessi-ble physic nut germplasm worldwide (Ram et al., 2008;Sun et al., 2008; Kumar et al., 2009; Pamidimarri et al.,2009; Subramanyam et al., 2009; Rosado et al., 2010; Sunilet al., 2011). The average genetic dissimilarity estimatedamong the 117 accessions was also low when compared toanother preferentially allogamous and closely relatedEuphorbiaceae species (Asante and Offei, 2003; Colomboet al., 2000). Compared to the levels of genetic diversityfound in 307 plant studies surveyed with molecular mark-
ers (Nybom, 2004), the genetic diversity in the germplasmof the cultivated Brazilian physic nut is limited. Accordingto Rosado et al. (2010) the limited genetic diversity andconsiderable extent of duplications found in thisgermplasm collection despite its widespread origin andlarge size most likely reflects a common ancestry, drift andintensive selection of the currently cultivated material sinceits introduction into Brazil. Rosado et al. (2010) also sug-gested the occurrence of extensive homozygosity in thegermplasm of cultivated J. curcas, despite its allogamoushabit (Divakara et al., 2010). Other recent reports that havesampled diversity using different molecular markers havereached similar conclusions regarding the limited variationin the most accessible germplasm resources of J. curcas invarious countries (Kumar et al., 2009; Pamidimarri et al.,2009; Subramanyam et al., 2009).
Comparison of the genetic dissimilarity determinedhere based on molecular markers with the data provided byRosado et al. (2010) revealed a slight increase in the corre-sponding value (from 0.11 to 0.31). This may be related tothe set of accessions used. Whereas Rosado et al. (2010)analyzed 192 accessions our analysis was based on a set of117 accessions, for which we had good quality phenotypicdata; the remaining 75 accessions were all related, [accord-ing to Rosado et al. (2010); data not shown]. Consequently,our optimized set of physic nut accessions consisted of themost diverse collection of Brazilian genotypes. This obser-vation indicates that the germplasm collection can be opti-mized by maintaining only a set of the most diversegenotypes.
The limited genetic diversity and considerablehomozygosity found in the Brazilian germplasm collectioncontrasted with previous reports of phenotypic variability(Laviola et al., 2010, 2012a,b; Rocha et al., 2012). In thisregard, we have previously unequivocally demonstratedthe breeding potential of this population. Laviola et al.
(2010) first described the genetic parameters for the traitsused here to assess the phenotypic diversity of thisgermplasm. Based on the existence and magnitude of theadditive genetic variance we considered that this popula-tion was adequate for selection purposes. Laviola et al.
(2012b) latter re-estimated the genetic parameters usingnew data and confirmed the existence of genetic variabilityfor traits such as grain yield. Laviola et al. (2012a) andBhering et al. (2012, 2013) later demonstrated that the ex-isting genetic variability could support high genetic gains,regardless of the selection strategy used.
Based on these findings, it is clear that there is somediscordance between the data corresponding to molecularvariability and those related to the variability available forbreeding purposes (phenotypic variability). We anticipated(Laviola et al., 2012b) that this disparity could arise fromthe fact that neutral molecular markers, such as RAPD orSSR, commonly used in molecular diversity studies, maybe located in non-coding regions of the genome (Collard et
378 Alves et al.
Figure 4 - Venn diagram showing the overlapping of physic nut acces-sions grouped together in Group A based on Tocher-Gower clustering(green circle), Tocher-Jaccard clustering (red circle) and Tocher-pheno-typic/molecular data-based clustering (blue circle). Forty-two of the ac-cessions grouped based on molecular markers in Group A were alsogrouped based on phenotypic data, 35 of the accessions grouped based onphenotypic/molecular data in Group A were also grouped based on pheno-typic data, 52 of the accessions grouped based on phenotypic/moleculardata in Group A were also grouped based on molecular data and 35 acces-sions were consistently grouped together, regardless of the similarity ma-trix in which the cluster analysis was performed. The numbers in eachnon-overlapping part of the circles indicate the number of genotypesgrouped solely based on one specific strategy. Numbers outside the circlesindicate the total number of accessions grouped based on each strategy.

al., 2005) and therefore be of limited use in predicting thephenotypic diversity of individuals, especially in complextraits such as yield.
As shown here, the molecular markers used to assessmolecular diversity indeed do not sample the same geno-mic regions that are involved in the genetic control of phe-notypes. The correlation between the genetic dissimilaritymatrices obtained using molecular data and phenotypicdata was very low. If the markers were sampling the genesresponsible for the phenotypic expression of the traits eval-uated then a high correlation between the dissimilarity ma-trices would be expected. Many studies have found weakrelationships between genetic distances estimated frommolecular data and genetic distances estimated from mor-phological data (Lewontin, 1984; Reed and Frankham,2001; Koehler-Santos et al., 2003; Martins et al., 2011).For instance, Sunil et al. (2011) detected such a weak rela-tionship in a Jatropha germplasm in India. In their study,the accessions identified as the most diverse based on theanalysis of eight phenotypic traits (quantitative traits) werenot corroborated as diverse by molecular analysis. Simi-larly, the accessions that were detected as outliers in ourmolecular analysis were also not unique based on pheno-typic data. Hamza et al. (2011), in a study of the genetic di-versity of date palm (Phoenix dactylifera L.), also did notdetect significant correlation between the genetic distancesestimated based on morphological data and genetic dis-tances estimated based on molecular data in which SSRmarkers were instead of RAPD. In both cases, the naturaland human selective forces acting on molecular variationapparently differed from those acting on morphologicaltraits. A further consideration is that morphological traitsare heavily affected by the environment when they are ex-pressed, whereas molecular markers are not subject to suchvariation and their variation is based directly on DNA se-quence variation (Collard et al., 2005).
Together, these findings indicate that arbitrary mo-lecular markers such as RAPD and anonymous markerssuch as SSR are not efficient in capturing the polymor-phism that results in phenotypic variation in physic nuts.This scenario could change if, instead of a small battery ofRAPD markers and anonymous SSR, a battery encompass-ing thousands of single nucleotide polymorphisms (SNPs)densely covering the entire genome (and possibly everypredicted gene-model) and EST-derived SSR are used. Inthis regard, some reports have indicated that when an ade-quate set of molecular markers is used to assess the geneticdiversity of germplasm collections, the estimated molecu-lar genetic distances can be successfully correlated withphenotypic variation (Sestili et al., 2011). Since we have al-ready developed a large number of SNPs for Jatropha
(Silva-Junior et al., 2011) and in view of the availability ofgenomic resources (EST sequences generated usingIllumina’s GA IIx) that could be used to design primers toamplify EST-derived SSR (primer design is underway), a
more detailed study of molecular diversity and of its rela-tionship with phenotypic variation is within the reach in thenear future.
By analyzing phenotypic and molecular data to-gether, the average dissimilarity among genotypes in-creased by 156% and 64% with respect to the original meanphenotypic and molecular dissimilarities. This occurred ba-sically because non-overlapping information was com-bined into one data set. By combining phenotypic andmolecular data the sampling intensity of the genetic diver-sity was markedly increased; a similar trend was describedby Bosetti et al. (2011) and Martins et al. (2011).
Our results indicate that physic nut variability in Bra-zil is indeed limited (more than 50% of the average similar-ity), but not as much as previously thought. The slightchange in the sampling intensity also affected the clusteringof genotypes, and indicated that the joint analysis of pheno-typic and molecular data was effective in capturing mostexisting genetic variability. Considering Tocher’s cluster-ing based on the Gower and Jaccard dissimilarity matrix,respectively, joint analysis provided an increase of nearly29% and 6% in the number of groups. Joint analysis alsodecreased the genotype concentration in a single group andwas effective in discriminating among genotypes. Geno-types that were considered to be most diverse based solelyon phenotypic or molecular data were now grouped to-gether with other genotypes. The opposite also occurred,i.e., some genotypes that could not be correctly discrimi-nated based solely on phenotypic or molecular data werenow placed in single accession groups.
These associations completely changed the pictureregarding the genetic diversity of physic nuts in Brazil. Fora species that is only now starting to be improved based onsystematic methods, the clear definition of sets of diversegenotypes is an extremely important finding as it can beused to guide future crosses and breeding strategies (Cruzet al., 2011; Bhering et al., 2012; Laviola et al., 2012b;Bhering et al., 2013). However, considering that the Brazil-ian physic nut germplasm collection forms the basis of thebreeding program for the species, it is important not only toidentify the existing genetic diversity, but also to use thegenetic diversity data to establish some guidelines. Thefinding that genetic dissimilarity among physic nut geno-types is indeed limited reinforces the need of adding morediversity to the germplasm bank to ensure long-term use ofthe germplasm in breeding programs. This initiative wouldbe ideally performed by collecting new samples from thecenter of origin/diversity of the species, as suggested byRosado et al. (2010) and Laviola et al. (2012b) in Braziland other countries (Divakara et al., 2010).
Taken together, the results presented here demon-strate that: (1) the molecular diversity of the physic nut doesnot resemble its phenotypic variability, (2) the algebraiccombination of Gower’s phenotypic dissimilarity matrixwith Jaccard’s molecular dissimilarity matrix can be used
Genetic diversity of Jatropha 379

to successfully perform a joint genetic diversity analysis,(3) the combination of phenotypic and molecular diversitymatrices increases sampling of the physic nut genetic diver-sity, (4) joint analysis of phenotypic and molecular diver-sity reveals that physic nut variability in Brazil is indeedlimited, but not as much as previously thought, and (5) ad-ditional collections are urgently needed to enhance thegermplasm representativeness and usefulness in terms ofspecies improvement.
Acknowledgments
We thank the Embrapa Agroenergy support staff fortheir assistance during the experiments, as well as our stu-dents, research collaborators and breeders for their constantscientific input and discussions. We also thank the anony-mous reviewers for their detailed analyses and helpful com-ments on the manuscript. This work was supported by theBrazilian Ministry of Science, Technology and Innovation(MCTI) through a FINEP grant (BRJATROPHA). CDCwas supported by a research fellowship from the BrazilianNational Research Council (CNPq).
References
Asante IK and Offei SK (2003) RAPD-based genetic diversitystudy of fifty cassava (Manihot esculenta Crantz) geno-types. Euphytica 131:113-119.
Berchmans HJ and Hirata S (2008) Biodiesel production fromcrude Jatropha curcas L. seed oil with a high content of freefatty acids. Bioresource Technol 99:1716-1721.
Bhering LL, Laviola BG, Sanchez CFB, Salgado CC, Rosado TBand Alves AA (2012) Prediction of genetic gains inJatropha using selection indexes. Pesqui Agropecu Bras47:402-408.
Bhering LL, Sanchez CFB, Ortega D, Laviola BG, Alves AA,Rosado TB and Cruz CD (2013) Differential response ofJatropha genotypes to different selection methods indicatesthat combined selection is more suited than other methodsfor rapid improvement of the species. Ind Crop Prod41:260-265.
Bosetti F, Zucchi MI and Pinheiro JB (2011) Molecular and mor-phological diversity in Japanese rice germplasm. PlantGenet Resourc Charact Util 9:229-232.
Brondani RPV and Grattapaglia D (2001) Cost-effective methodto synthesize a fluorescent internal DNA standard for auto-mated fragment sizing. Biotechniques 31:793-800.
Collard BCY, Jahufer MZZ, Brouwer JB and Pang ECK (2005)An introduction to markers, quantitative trait loci (QTL)mapping and marker-assisted selection for crop improve-ment: The basic concepts. Euphytica 142:169-196.
Colombo C, Second G and Charrier A (2000) Diversity withinAmerican cassava germ plasm based on RAPD markers.Genet Mol Biol 23:189-199.
Cruz CD (2009) Genes: A software for genetics analysis. Univer-sidade Federal de Viçosa, Viçosa, MG.
Cruz CD, Ferreira FM and Pessoni LA (2011) Biometria Aplicadaao Estudo da Diversidade Genética, vol. 1. Editora UFV,Viçosa, 620 pp.
Dias LAS, Leme LP, Laviola BG, Pallini Filho A, Pereira OL,Carvalho M, Manfio CE, Santos AS, Sousa LCA, OliveiraTS, et al. (2007) Cultivo de Pinhão Manso (Jatropha curcas
L.) para Produção de Óleo Combustível. Universidade Fed-eral de Viçosa, Viçosa, 40 pp.
Divakara BN, Upadhyaya HD, Wani SP and Laxmipathi GowdaCL (2010) Biology and genetic improvement of Jatropha
curcas L.: A review. Appl Energy 87:732-742.Drumond MA, Santos CAF, Oliveira VR, Martins JC, Anjos JB
and Evangelista MRV (2010) Agronomic performance ofdifferent genotypes of physic nut in the semi-arid zone ofPernambuco state. Ciênc Rural 40:44-57.
Durães FMO, Laviola BG and Alves AA (2011) Potential andchallenges in making physic nut (Jatropha curcas L.) a via-ble biofuel crop: The Brazilian perspective. CAB Reviews:Perspectives in Agriculture, Veterinary Science, Nutritionand Natural Resources 6:43.
Ginwal HS, Phartyal SS, Rawat PS and Srivastava RL (2005)Seed source variation in morphology, germination and seed-ling growth of Jatropha curcas Linn. in central India. SilvaeGenet 54:76-80.
Gower JC (1971) A general coefficient of similarity and some ofits properties. Biometrics 27:857-871.
Grattapaglia D and Sederoff R (1994) Genetic-linkage maps ofEucalyptus grandis and Eucalyptus urophylla using apseudo-testcross - Mapping strategy and rapd markers. Ge-netics 137:1121-1137.
Gurgel FD, Laviola BG, da Silva DM, Kobayashi AK and RosadoTB (2011) Phenology and biometry of physic nut in the Bra-zilian savannah. Cienc Agrotec 35:1122-1131.
Hamza H, Elbekkay M, Ben Abederrahim MA and Ali AF (2011)Molecular and morphological analyses of date palm (Phoe-
nix dactylifera L.) subpopulations in southern Tunisia. SpanJ Agric Res 9:484-493.
Jaccard P (1901) Étude comparative de la distribution florale dansune portion des Alpes et des Jura. Bull Soc Vaud Sci Nat37:547-579 [In French].
Koehler-Santos P, Dornelles ALC and de Freitas LB (2003) Char-acterization of mandarin citrus germplasm from southernBrazil by morphological and molecular analyses. PesquiAgropecu Bras 38:797-806.
Kumar RV, Tripathi YK, Shukla P, Ahlawat SP and Gupta VK(2009) Genetic diversity and relationships among germ-plasm of Jatropha curcas L. revealed by RAPDs. Trees-Struct Funct 23:1075-1079.
Laviola BG, Rosado TB, Bhering LL, Kobayashi AK and Re-sende MDV (2010) Genetic parameters and variability inphysic nut accessions during early developmental stages.Pesqui Agropecu Bras 45:1117-1123.
Laviola BG, Alves AA, Gurgel FD, Rosado TB, Costa RD, RochaRB and Bhering LL (2012a) Estimate of genetic parametersand predicted genetic gains with early selection of physicnut families. Cienc Agrotec 36:163-170.
Laviola BG, Alves AA, Gurgel FD, Rosado TB, Rocha RB andAlbrecht JC (2012b) Estimates of genetic parameters forphysic nut traits based in the germplasm two years evalua-tion. Ciência Rural 42:429-435.
Lewontin RC (1984) Detecting population differences in quanti-tative characters as opposed to gene-frequencies. Am Nat123:115-124.
380 Alves et al.

Manly BFJ (1997) Randomization, Bootstrap and Monte CarloMethods in Biology. Chapman & Hall, London, 399 pp.
Martins FA, Carneiro PCS, da Silva DJH, Cruz CD and CarneiroJED (2011) Integration of data in studies of genetic diversityof tomato. Pesqui Agropecu Bras 46:1496-1502.
Modi MK, Reddy JRC, Rao BVSK and Prasad RBN (2007)Lipase-mediated conversion of vegetable oils into biodieselusing ethyl acetate as acyl acceptor. Bioresource Technol98:1260-1264.
Nybom H (2004) Comparison of different nuclear DNA markersfor estimating intraspecific genetic diversity in plants. MolEcol 13:1143-1155.
Pamidimarri DVNS, Singh S, Mastan SG, Patel J and Reddy MP(2009) Molecular characterization and identification ofmarkers for toxic and non-toxic varieties of Jatropha curcas
L. using RAPD, AFLP and SSR markers. Mol Biol Rep36:1357-1364.
Ram SG, Parthiban KT, Kumar RS, Thiruvengadam V and Para-mathma M (2008) Genetic diversity among Jatropha spe-cies as revealed by RAPD markers. Genet Resour Crop Ev55:803-809.
Reed DH and Frankham R (2001) How closely correlated are mo-lecular and quantitative measures of genetic variation? Ameta-analysis. Evolution 55:1095-1103.
Reis AMM and Grattapaglia D (2004) RAPD variation in agermplasm collection of Myracrodruon urundeuva
(Anacardiaceae), an endangered tropical tree: Recommen-dations for conservation. Genet Resour Crop Evol 51:529-538.
Rocha RB, Ramalho AR, Teixeira AL, Laviola BG, da Silva FCGand Militao JSLT (2012) Selection efficiency for increasingphysic nut oil content. Pesqui Agropecu Bras 47:44-50.
Rosado TB, Laviola BG, Faria DA, Pappas MR, Bhering LL,Quirino B and Grattapaglia D (2010) Molecular markers re-veal limited genetic diversity in a large germplasm collec-tion of the biofuel crop Jatropha curcas L. in Brazil. CropSci 50:2372-2382.
Sestili S, Giardini A and Ficcadenti N (2011) Genetic diversityamong Italian melon inodorus (Cucumis melo L.) germ-plasm revealed by ISSR analysis and agronomic traits. PlantGenet Resourc Charact Util 9:214-217.
Silva-Junior OB, Rosado TB, Laviola BG, Pappas MR, Pappas GJand Grattapaglia D (2011) Genome-wide SNP discoveryfrom a pooled sample of accessions of the biofuel plantJatropha curcas based on whole-transcriptome Illuminaresequencing. BMC Proc 5:P57.
Subramanyam K, Muralidhararao D and Devanna N (2009) Ge-netic diversity assessment of wild and cultivated varieties ofJatropha curcas (L.) in India by RAPD analysis. Afr JBiotechnol 8:1900-1910.
Sun QB, Li LF, Li Y, Wu GJ and Ge XJ (2008) SSR and AFLPmarkers reveal low genetic diversity in the biofuel plantJatropha curcas in China. Crop Sci 48:1865-1871.
Sunil N, Sujatha M, Kumar V, Vanaja M, Basha SD and Vara-prasad KS (2011) Correlating the phenotypic and moleculardiversity in Jatropha curcas L. Biomass Bioenerg 35:1085-1096.
Associate Editor: Marcio C. Silva Filho
License information: This is an open-access article distributed under the terms of theCreative Commons Attribution License, which permits unrestricted use, distribution, andreproduction in any medium, provided the original work is properly cited.
Genetic diversity of Jatropha 381