Embed Size (px)
Citation preview
RICHARD E. CAVES Harvard University
MICHAEL D. WHINSTON Harvard University and National Bureau of Economic Research
MARK A. HURWITZ Columbia Law School
Patent Expiration, Entry, and Competition in the U.S. Pharmaceutical Industry
THE ETHICAL PHARMACEUTICAL industry is an important one, not so much for its economic size as for the benefits that it delivers to users of its products. The industry has been transformed structurally since the 1940s from a producer of selected chemicals to a research-oriented sector that makes a major contribution to the technology of health care. I
Its very success in generating a stream of new drugs with important therapeutic benefits has involved the industry in intense public policy debates over the financing of the cost of its research, the veracity of claims for its products, the prices charged for them (not to mention who pays those charges), and the socially optimal degree of patent protection.
The policies and policy debates bearing on competition in the phar- maceutical industry revolve around two interrelated issues of welfare economics. The first is the trade-off between promoting innovative effort and securing competitive market outcomes. The research-oriented
We would like to thank Joshua Angrist, Zvi Griliches, Andrea Shepard, and members of the National Bureau of Economic Research productivity group for helpful comments and discussion; numerous individuals in the industry who generously gave their time to provide us with background information; Denise Neumann for research assistance; and Ann Flack and Claudia Napolilli for their help in preparing this manuscript. Whinston thanks the National Science Foundation for financial support (SES-8921996).
1. Temin (1980, chaps. 1-4).
1
2 Brookings Papers: Microeconomics 1991
sector of the industry relies heavily on the patent system. In principle, the expected monopoly profits from sales during the patent's life warrant the innovator's risky investment, while the onset of competition after the patent expires limits society's cost to the deadweight losses stem- ming from monopoly pricing under patent.2 Because regulation has had important effects on the cost of innovation in the pharmaceutical in- dustry, a great deal of research has been done on the innovation end of this trade-off between innovation and competition. The costs of innovation, the effect of regulation on cost and innovative output, and the dependence of pharmaceutical manufacturers' rents on innovation have been much studied. Little is known, however, about the postpatent competitive process: the speed and fullness with which competitive entry then erodes patent-protected monopoly rents and eliminates the associated deadweight losses.3 Although the patent on an innovative drug expires on a specific date, the drug's trademark lives on as the vehicle for maintaining the innovator's goodwill and possibly delaying or impeding subsequent competition. That possibility, however, touches on the other issue of welfare economics, the information structure of the drug market.
Promotional activities in the ethical segment of the pharmaceutical industry raise important questions of "information vs. persuasion." The dissemination of information by the drug's innovator may serve to inform physicians and pharmacists efficiently about the therapeutic ef- fects of a particular chemical entity and the indications for its use. On the other hand, because the health care professionals who choose the prescription drugs that patients consume may have only attenuated in- centives to minimize the cost of drugs to the users (or their insurers), sales promotion by pharmaceutical firms may also exploit rent-seeking opportunities that stem from the imperfect alignment of the incentives of these providers with the interests of their patients. This second policy
2. As Nordhaus (1969) showed, the patent's life can then be set to optimize the trade- off between surplus from consuming the innovative good and deadweight losses due to monopoly pricing.
3. As Comanor (1986) pointed out, most modern research on the industry was motivated by the 1962 amendments to the Pure Food Act (requiring drug innovators to demonstrate effectiveness as well as safety) and the extensive congressional hearings that preceded them. Dominated by efforts to measure and evaluate the rate of new-drug introduction, this research consequently slighted the market behavior of patent recipients.
Richard E. Caves, Michael D. Whinston, and Mark A. Hurwitz 3
issue is not without link to the first, because the nature of the promo- tional process in these markets may strongly influence the course of events expected once a patent expires and generic competitors enter the market. To the extent that an innovative company's promotion merely disseminates information about the benefits of the chemical entity, ge- neric entrants are unlikely to be particularly disadvantaged. In contrast, persuasion activities that incline providers toward prescribing the brand of the innovating company may serve to attenuate the welfare gains arising from postpatent generic competition.
In addition to these important issues for public policy, the phar- maceutical industry offers an excellent site for examining some general issues in industrial organization. Because a legal monopoly of an in- novative product in this industry commonly depends on a single patent (that on the chemical entity itself), the industry provides a setting in which the conditions of entry and competition change radically on a given date set by the terms of the patent law. This natural experiment offers a unique opportunity to study both the process and effects of entry.
In this paper we report on an exploratory analysis of the patterns of competition surrounding patent expiration and subsequent generic entry in ethical pharmaceutical markets.4 We identify the patterns displayed by branded and generic drugs' prices, market shares, and quantities sold as well as branded drugs' advertising over the years 1976-87 for a panel of thirty drugs that lost patent protection during this period. The use of a panel data set permits us to follow these variables over time and to employ controls for changes in these variables that would occur with the natural unfolding of a drug's life cycle and with changes in market conditions in either its therapeutic class or the industry in general.
Given the exploratory nature of our investigation, our approach here is nonstructural, focusing on the "semireduced" form relationship be- tween the occurrence of patent expiration and generic entry and these various endogenous variables. Such an approach is responsive to the difficulty of imposing any single a priori theoretical model on the pro- cess of generic entry and postentry competition. The literature of in-
4. A few previous researchers have also addressed parts of this issue. We discuss this work and its relation to our own in our review of market structure.
4 Brookings Papers: Microeconomics 1991
dustrial organization is, of course, awash with models of entry, entry deterrence, and postentry competition. Our approach is designed to reveal the basic characteristics of these aspects of pharmaceutical com- petition within a broad range. The patterns observed in this manner are not only directly informative about the competitive process in the in- dustry, but also, by suggesting the relative importance of particular mechanisms of strategic behavior, will serve, we hope, as a useful step toward development of more complete structural models of competitive interaction in this industry.
In the next section of this paper we survey the structure of markets for ethical pharmaceuticals and review past research on behavior of the various types of decisionmakers that may affect postpatent competition. The third section describes the sources and construction of the data base and provides descriptive statistics. The fourth explains the statis- tical procedure in detail and presents our empirical results concerning the effects of generic entry and competition. The concluding section summarizes our findings, discusses the light they shed on behavior and structure in the industry as well as their implications for public policy, and indicates desirable avenues for future research.
Structure of the Market
As background to our study, here we summarize structural charac- teristics of the pharmaceutical industry relevant to the rivalry that stems from patent expiration and subsequent entry by generic competitors. The prescription and use of ethical pharmaceuticals as well as their production and marketing are closely regulated, so we also refer to the major government regulations that shape market structure and behavior.
Demand Side Inf uences
Unlike most markets, the realized demands for pharmaceuticals de- pend not only on ultimate consumers' tastes but also on the behavior of physicians who prescribe these drugs and the retail and hospital pharmacists who dispense the prescriptions. Since 1938 the decision about the patient's consumption of any drug with substantial therapeutic
Richard E. Caves, Michael D. Whinston, and Mark A. Hurwitz 5
effect has been in the hands of the physician. The physician's primary choice is what drug (that is, chemical entity) to prescribe. The physician then can designate that drug by either a brand or its generic name. The trademarked brand name attached to a pioneering drug by the innovator is short and easier to remember than its generic name, which in turn is a shorter, simpler version of the chemical name that describes the molecular structure of the active chemical entity to scientists.
Physicians may not be well positioned to choose drug therapies that maximize value for their patients. Evidence on this point pertains to choices among similar but distinct drugs as well as to choices between branded and generic versions of the same drug. As Temin showed, the physician lacks ready and well-organized information on the compar- ative effectiveness and riskiness of substitute chemical entities, and the choice is based strongly on custom as evolved in the peer community of prescribers.S Customary prescribing behavior not only minimizes effort but also provides a legal defense.
When the choice lies between a branded pioneer drug and its generic competitors, the physician may not be sensitive to price differences. Physicians do not ordinarily have information on the drug prices charged by pharmacists, and that information is certainly not pressed upon them in the promotional information supplied by makers of branded drugs. Surveys accordingly have found physicians ill-informed about the prices of competing drugs.6 Furthermore, except possibly in the treatment of chronic conditions, prescribing a drug therapy in the most cost-effective way is a relatively minor aspect in the overall performance of the physician's function. Correspondingly, patients seem unlikely to select or change physicians simply because they do not prescribe the lowest- cost drugs. In addition, physicians may be concerned about the quality or therapeutic equivalence of generic drugs (evidence on this point is noted below). Confirming the low priority that minimizing prescription costs holds for physicians, Masson and Steiner found that the incidence of generic prescribing depends strongly on a seemingly trivial factor:
5. Temin (1980, chap. 5). Temin pointed out that the individual physician typically does not obtain a great deal of experience with the effects of any particular drug and that the available published research on competing drugs tends to deal with bioavailability rather than actual effects.
6. Temin (1980, pp. 102-06).
6 Brookings Papers: Microeconomics 1991
whether the form of the prescription pad makes permitting or precluding generic substitution the easier course of action.7 In 1989 physicians prohibited substitution in 23 percent of prescriptions overall, 41 percent of prescriptions where physicians could easily prohibit substitutions by signing on one rather than another line of the form and only 11 percent in jurisdictions where a specific notation had to be written.8
The potential importance of physicians' prescribing behavior for generic drug use can be seen in the distribution of new prescriptions by number (from IMS America, National Prescription Audit):
1980 1989
Single source drugs 31.0% 28.8% Multisource drugs:
Written by brand name 54.5 57.8 Written generically 14.5 13.5
Somewhat surprisingly, the proportion of prescriptions for multisource drugs that were written generically actually fell from 21 percent in 1980 to 19 percent in 1989.
Once the physician has chosen to prescribe a drug that is available generically, the pharmacist and the consumer may play a role in deciding whether the original brand or a generic equivalent is dispensed. At one time laws in most states required the pharmacist to fill a prescription as written, precluding generic dispensing when the physician had writ- ten the brand name, but the last of these antisubstitution laws was repealed in 1984 (most were repealed in the mid- to late-1970s). They were replaced by legislation that in some cases requires substitution in the absence of contraindication by the physician but generally leaves the choice with the pharmacist and the consumer. Masson and Steiner provided evidence that generic products not only carry lower prices than branded drugs, but also tend to yield higher gross margins to pharmacists, so that both pharmacist and consumer share an interest in substituting generic products where possible.
Aggregate statistics on ways in which prescriptions for multisource drugs are written and dispensed reveal two basic facts about the process.
7. Masson and Steiner (1985, pp. 89, 101). See also Grabowski and Vernon (1979). 8. "National Audit Finds Drug Substitution Rate Steady," Drug Topics, June 4, 1990,
pp. 12-14.
Richard E. Caves, Michael D. Whinston, and Mark A. Hurwitz 7
First, generic substitution for brand-written multisource prescriptions is relatively infrequent, confined to 29 percent of these prescriptions in 1989. Interestingly, nearly all generically written prescriptions are filled generically, suggesting that pharmacists and/or consumers place sig- nificant faith in the physician's choice.9 Second, generic substitution has nonetheless increased substantially over time, for generics were substituted for only 5 percent of brand-written multisource prescriptions in 1980.10 One factor behind the increase is intensified pressure from some third-party payers for the minimization of drug prices. Masson and Steiner observed a strong effect of federal and state reimbursement limits for medicaid prescriptions; the substitution rates on these pre- scriptions are more than double those on prescriptions subject to reim- bursement by private insurers. 11 Those results were confirmed by another study, which found also that substitution decreases as the intrinsic risk associated with the drug's use increases.12
This review of the demand for prescription drugs has so far concen- trated on prescriptions written by independent physicians and filled by pharmacists. In 1989 the pharmacy market accounted for 82 percent of the total value of drugs distributed through pharmacies and hospitals together. When drugs are prescribed and dispensed in hospitals, the incentives and information capabilities of the actors may be rather dif- ferent. The hospital's formulary system rests on a contract under which the hospital may fill generically prescriptions written by brand name unless the physician indicates otherwise. The physician is encouraged to prescribe those products listed on the hospital's formulary, which is a continuously revised list of drug products approved by a therapeutic committee consisting of pharmacy, clinical, and nursing staff members.
9. Combined with the prescription distribution data presented above, these substitution figures imply that the generic market share for multisource drugs in 1989 was approximately 42 percent (based on the number of new prescriptions filled).
10. Tabulation provided by IMS America (from National Prescription Audit). Masson and Steiner (1985, pp. 41-47) placed significant weight on drug consumers' own resistance to generic substitution as a reason why it had not proceeded farther. Note also that the increased ease of generic substitution may possibly have contributed to the decrease in generic prescribing observed above.
11. Masson and Steiner (1985, chap. 4). Private insurers have stepped up their efforts to contain drug costs (Milt Freudenheim, "Insurers Press Use of Cheaper Drugs," New York Times, November 18, 1990, sec. 1, p. 1).
12. Carroll, Siridhara, and Fincham (1987, pp. 11-18).
8 Brookings Papers: Microeconomics 1991
This system serves to pool information on the cost and effectiveness of different drugs and assists cost minimization, an objective increas- ingly pressed upon the hospitals by the public and third-party payers, who together cover 82 percent of hospitals' drug expenditures.13
The proposition that the choice between generic and branded drugs is more price-sensitive for drugs dispensed in hospitals than through retail pharmacies implies less payout for advertising to the hospital sector. Leffler noted the low levels of sales promotion by pharmaceutical manufacturers for drugs sold mainly through hospitals. Hurwitz and Caves (weakly) confirmed this observation and also showed that the shares retained by branded producers against their generic competitors in the hospital market are significantly less sensitive than in the phar- macy market to both their current sales promotion and accumulated goodwill. 14
Supply Side Influences
The pharmaceutical industry consists of a large number of firms (584 in the 1982 Census of Manufactures) that produce many different (and mainly nonsubstitutable) drug products, ethical and over-the-counter, branded and generic. As Temin showed, the industry assumed its mod- ern research-oriented form after World War II, when a number of firms emerged that both carried out extensive research and maintained ex- tensive sales forces to promote their innovations. 15 Their rise, however, was not accompanied by a decline in the number of small firms, and even among the research-oriented firms, concentration is low. 16 In 1989 approximately 400 companies had approved New Drug Applications (NDAs) with the Food and Drug Administration (FDA).17
Of course, the number of firms producing any given (off-patent) drug or drugs that are close substitutes within a therapeutic class is commonly much smaller. Scale economies in production are not important. The fermentation technologies extensively used to produce the active chem-
13. For more detail and sources, see Hurwitz and Caves (1988, pp. 306-7). 14. Leffler (1981, pp. 53-54); and Hurwitz and Caves (1988, pp. 316-17). 15. Temin (1979). See also Grabowski and Vernon (1976). 16. According to data from IMS America, the largest firm's sales in 1989 accounted
for 7.4 percent of total sales, the largest four firms 23.8 percent. 17. U.S. Food and Drug Administration (annual).
Richard E. Caves, Michael D. Whinston, and Mark A. Hurwitz 9
ical entities are batch processes carried out on small scales. Both quality- control considerations and the small absolute quantities of active in- gredients produced discourage large-scale continuous-process technol- ogies. 18 Production capacity for assembling active and inert ingredients into pills or capsules is largely fungible. Thus, although actual com- petitors for a given drug or therapy may be few, potential entrants are numerous.
Although manufacturing and distribution are not generally inte- grated, the research-oriented drugmakers are partly integrated forward. These firms (members of the Pharmaceutical Manufacturers Associa- tion) make 68 percent of their sales to wholesalers, 32 percent directly to hospitals, health maintenance organizations (HMOs), and pharmacy chains. The wholesale percentage has increased from 45 percent in 1972.19 Because the major drug manufacturers vary greatly in their reliance on arm's-length wholesalers, the choice of integration is ap- parently a close call. The increased role of independent wholesalers stems from computerization that allows specialist wholesalers to provide extensive services for pharmacies (including hospital pharmacies) that they supply exclusively. While the largest wholesaler accounts for one- fourth of the U.S. wholesale market, many small firms also exist.20 The generic producers depend entirely on full-line marketing and wholesaling firms, some of which are large and themselves take an active role in postpatent entry into the markets of innovative drugs.21
The innovation process has been studied intensively since the 1962 amendments to the Pure Food Act (also known as the Kefauver amend- ments) required that effectiveness as well as safety be demonstrated for approval by the FDA. Each of the twenty or so new molecular entities introduced each year was estimated in 1987 to incur total development costs of $125 million.22 The profitability of pharmaceutical innovation may have been reduced by the 1962 legislation, not only because of the cost of compliance to the manufacturer but also because of the delay that the approval process causes between the time patent protection is granted and the time the new drug can be placed on the market. For the typical
18. Walker (1971, pp. 36-37). 19. Pharmaceutical Manufacturers Association (1988, p. 5). 20. Smith (1985, pp. 249-63). 21. Smith (1985, pp. 201-2). 22. Wiggins (1987).
10 Brookings Papers. Microeconomics 1991
patented drug the period of exclusive marketing contracted substantially after 1962; Grabowski and Vernon reported a decline from 13.6 years for patents expiring in 1966 to 9.5 years in 1979.23 A considerable controversy ensued over the extent of the decline in pharmaceutical innovation attrib- utable to this regulation and the degree to which it pushed pharmaceutical innovation and initial availability of new drugs overseas.24
If regulations based on the 1962 legislation cut into the profitability of drug innovations, they also imposed a barrier to entry by generic com- petitors once the patent expired. That barrier stemmed from the require- ment that subsequent entrants duplicate the testing for safety and efficacy undertaken by the innovator. The Waxman-Hatch Act of 1984 eliminated the requirement of socially wasteful duplicative testing by generic entrants and granted drug innovators some restoration of the effective lives of their patents. The act allows a generic entrant to submit an Abbreviated New Drug Application (ANDA) that demonstrates only the bioequivalence of its drug to the original. At the same time, the 1984 law permits the innovator to recoup part of the interval of patent protection lost due to regulatory delay and allows a period of exclusive marketing for new drugs regardless of their patent protection.25
Apart from the cost of obtaining FDA approval, generic entrants ap- parently face only minor barriers to entry on the cost side. They may encounter technical difficulty in producing the active chemical ingredient for some drugs. The evidence does not, however, suggest any substantial scale-economy barriers in production or distribution.26 The primary im-
23. Grabowski and Vernon (1983, p. 50). On the other hand, drug innovators have sometimes forestalled this costly shortening of their period of monopoly by using amended applications to stretch out the process of the patent's consideration and delay approval, or by securing patent protection with broad claims for therapeutic usefulness that are focused by subsequent applications making narrower and more specific claims. A study prepared by the generic drug producers claimed that the effective patent life for the leading twelve products in 1980 was 18.5 years, more than the statutory life of a patent. For the next thirteen products the mean was 15.1 years, suggesting that innovators invest in prolonging patent lives in proportion to the expected value of potential rents. The tactics employed by drug innovators are apparently no different from those used by other inventors. See U.S. House of Representatives, Committee on Science and Technology (1982, pp. 206-21, 236-49).
24. See, for example, Peltzman (1974); Grabowski (1980); Temin (1980); and Wiggins (1981).
25. Grabowski and Vernon (1986). 26. Schwartzman (1976, pp. 260-64).
Richard E. Caves, Michael D. Whinston, and Mark A. Hurwitz 11
pediments appear to come on the demand side from the accumulated goodwill assets of branded producers and any concerns about quality differences between branded and generic drugs.27
The potential generic competitors with an off-patent drug include the large research-intensive firms other than its innovator. Thus, a distinction can be made between "branded generics," emanating from research- oriented firms whose company names enjoy goodwill value, and generic drugs from other (small) producers. We do not pursue this distinction in the analysis that follows, although some evidence suggests that prescribers regard branded generics as closer substitutes for the innovator's drug, increasing the likelihood that the innovator will lower its prices in response to a reduction in generic prices.28
Decision Variables of Innovators
Pharmaceutical innovators have two principal instruments, price and sales-promotion outlays, for maximizing the value of their innovations, both during the period of exclusive marketing and in the postentry game.
Sales promotion takes several forms. The most important is detailing, visits to health-care professionals by the manufacturer's representatives who provide information on new drugs and their administration and answer ques- tions from the physician.29 The large staffs of detailers employed by the big, research-oriented drug firms represent a substantial fixed cost and an incentive for these firms to maintain a steady flow of innovations over time so that the sales representatives are fully utilized. Temin showed that detailing forces evolved as the industry assumed its modem shape, serving as a strong com-
27. Two specific quality issues arise. One is that of bioequivalence, which prevails when different producers' versions of the drug have the same bioavailability at the site of therapeutic effect. Information disseminated by the Food and Drug Administration now seems adequate to establish where bioequivalence does and does not prevail. In any case differences in bioavailability where found do not appear to be therapeutically significant (Temin, 1980, pp. 96-102). The second issue is that of quality control. Schwartzman (1976, pp. 215-23, 226-50) noted that small generic producers may have less to lose in reputational assets than large producers from suboptimal quality control. However, the evidence does not seem to indicate any therapeutically significant differences in quality control between branded and generic producers.
28. See the case studies by Schwartzman (1976, pp. 273-92) of pricing behavior in antibiotics and some other drugs.
29. The term "detailing" has apparently fallen out of use in the industry but is retained here because of its prevalence in the academic research literature.
12 Brookings Papers: Microeconomics 1991
plement to the innovation process itself.30 Detailing certainly disseminates valuable information to physicians and thereby expands demand for the drugs thus promoted, but it is also widely regarded as an instrument for inducing brand loyalty.31
In 1989 detailing accounted for 74 percent of total promotion outlays, advertisements in medical journals accounted for 23 percent, and direct- mail advertising the remaining 3 percent.32 Journal and direct-mail ad- vertising conveys information and for new drugs is regarded as comple- mentary to visits by the detailers, but such advertising also evidently seeks to maintain the general goodwill of the company.
Leffler and Hurwitz and Caves concluded that sales promotion outlays represent a mixture of information and persuasion. Spending in a thera- peutic class increases with the number of new products entering the class and the extent of their therapeutic benefit, and may be lower for "main- tenance" drugs that serve to treat chronic rather than acute and sporadic conditions. Promotion outlays increase strongly with the extent to which a drug is sold through the pharmacy market rather than to hospitals, consistent with the difference in information sets and incentives noted above.
Promotion may also serve as a competitive weapon and therefore possibly as a vehicle for strategic behavior. The large overall volume of advertised information aimed at each physician by the major drug producers has been suspected to exert a signal-jamming effect on the promotions mounted by generic entrants or firms introducing substitute therapies. Hurwitz and Caves found that the shares attained by generic entrants and the numbers of generic entrants decrease as both the current promotion outlays and the goodwill stocks of innovators' brands increases.33 The degree to which promotion can be used in this manner should affect rates of expenditure over time on promotion of a given drug-examined below-but previous research yields no evidence on this point.
30. Temin (1979). During this period the previously common practice of licensing new chemical entities to other producers dried up as the innovators sought to capture for them- selves all rents generated by the information disseminated by their detailing forces.
31. Observers taking these positions are cited by Comanor (1986). 32. Promotional audits by IMS America. 33. Walker (1971, p. 47); Hurwitz and Caves (1988, pp. 313, 316); see also Temin
(1980, pp. 115-18). Leffler (1981) found no reactions of incumbents' advertising levels to new entry, but his analysis pertained to members of a therapeutic class and not to producers of the same chemical entity.
Richard E. Caves, Michael D. Whinston, and Mark A. Hurwitz 13
Previous research on pricing behavior gives only a little indication how drug pioneers react to either substitute products or generic entry. Isolated data quoted from the 1960-62 Kefauver Committee hearings suggest that variable costs may be as low as 5 percent of price.34 Statman's analysis of twelve drugs that lost patent protection -between 1970 and 1976 showed that in 1978 only four charged real prices lower than those prevailing three years before the patent's expiration. Schwartzman's case study of antibiotics in the 1960s revealed diverse behavior, with most innovators holding their prices constant while losing varying amounts of market share and a minority meeting the prices of imitators and generic competitors. 35
In none of these studies did the authors control for what would have happened to innovaters' prices, absent competition, due to either general shifts in market conditions or the normal pattern traced by a drug's price over its life cycle, nor were the precise responses to the level of entry quantified.
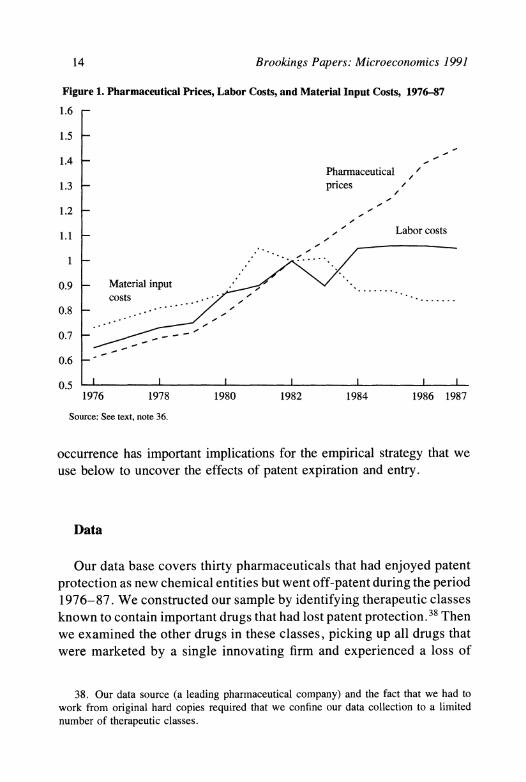
As background for analyzing the movement of these decision variables over the years 1976-87, we examined aggregate data on drug prices and costs during this period. Figure 1 plots an index of unit labor costs and an index of prices of bulk pharmaceutical prices as well as an output price index for the pharmaceutical industry overall.36 The pattern is clearly peculiar after 1982. The rise in unit labor costs came to a halt, and the cost of bulk pharmaceutical inputs fell, yet the prices of outputs rose quite sharply.37 Although the causes of this price rise are not our focus, its
34. Data from the Senate Judiciary Antitrust and Monopoly Subcommittee (known as the Kefauver Committee) hearings are quoted by Steele (1962, pp. 159-60).
35. Statman (1981); and Schwartzman (1976, pp. 257, 273-92). Diversity in pricing competition was also suggested by Cocks and Virts (1974).
36. Employment and employee-compensation information for Standard Industrial Clas- sification (SIC) industry 2834 was taken from U.S. Bureau of the Census, 1982 Census of Manufacturers, Industry Statistics, section 28C, tables lB and 7, and U.S. Bureau of the Census, Annual Survey of Manufactures, various years. A weighted index of employment costs based on data for production and nonproduction workers was then converted to an index of unit labor costs using information on productivity growth from U.S. Bureau of Labor Statistics, Productivity Measures for Selected Industries, 1958-84, Bulletin No. 2256, extrapolated to later years. The index of pharmaceutical input costs is simply the output price index for SIC 2833, taken from U.S. Bureau of Labor Statistics, Producer Prices and Price Indexes. In 1982 inputs purchased from SIC 2833 made up 42.5 percent of the costs of material inputs purchased by SIC 2834. The output price index for SIC 2834 is also taken from Producer Prices and Price Indexes.
37. For a recent work investigating the accuracy of the pharmaceutical price index, see Berndt, Griliches, and Rosett (1990).
14 Brookings Papers: Microeconomics 1991
Figure 1. Pharmaceutical Prices, Labor Costs, and Material Input Costs, 1976-87
1.6 -
1.5 -
1.4 - Pharmaceutical , '
1.3 - prices /
1.2 - ,
1.1 _~ , 'Labor costs
0.9 Material input costs . .......
0.8 .__ -_ ,
0.7
0.6 -
0.5 1976 1978 1980 1982 1984 1986 1987
Source: See text, note 36.
occurrence has important implications for the empirical strategy that we use below to uncover the effects of patent expiration and entry.
Data
Our data base covers thirty pharmaceuticals that had enjoyed patent protection as new chemical entities but went off-patent during the period 1976-87. We constructed our sample by identifying therapeutic classes known to contain important drugs that had lost patent protection. 38 Then we examined the other drugs in these classes, picking up all drugs that were marketed by a single innovating firm and experienced a loss of
38. Our data source (a leading pharmaceutical company) and the fact that we had to work from original hard copies required that we confine our data collection to a limited number of therapeutic classes.
Richard E. Caves, Michael D. Whinston, and Mark A. Hurwitz 15
patent protection during our period of observation.39 The drugs (and their number) belong to the following therapeutic classes: cardiovas- cular (11), psychotherapeutic (7), systemic anti-infectives (4), diabetes therapy (4), antiarthritics (2), diuretics (1), and antispasmodics (1).40
Because of our focus on generic entry, it was important that drugs included in the sample have unambiguous dates of patent expiration. We determined these by consulting lists compiled by various sources within the trade, including the Merck Drug Index and the U.S. Patent and Trademark Register as well as data from IMS America. In most cases we also contacted the innovating company itself to verify the month and year of patent expiration. We believe that each drug retained in the sample relied on a single key patent.41
Data on sales revenue, quantities sold, and sales-promotion expen- ditures were obtained from the Drugstore, Hospital, Detailing, and Journal Audits compiled by IMS America. The information on sales revenue and quantity reflects transactions at the wholesale level (that is, purchases by pharmacies and hospitals) and is obtained from two sources: warehouse withdrawal information from wholesalers and the actual invoices of a panel of pharmacy and hospital purchasers.42 The data obtained from these sources are then extrapolated to the national market. The information on sales revenue and quantity permit average transaction prices to be calculated directly. These prices reflect actual wholesale transaction prices subject to two qualifications. First, the invoiced price is the price indicated for the specific drug in question.
39. Occasionally, new drugs are sold by more than one firm, due either to licensing by a foreign innovator or to simultaneous discovery combined with a cross-licensing agree- ment.
40. The therapeutic classes used to obtain the sample were not these broad, two-digit classes but finer, five-digit classes. The specific drugs included are: Aldomet, Apresazide, Catapres, Combipres, Diutensen, Harmonyl, Inderal, Ismelin, Minipress, Norpace, and Salutensin (cardiovasculars); Ativan, Haldol, Mellaril, Serax, Transxene, Valium, and Vesprin (psychotherapeutics); Declomycin, Keflex, Keflin, and Minocin (anti-infectives); Diabinese, Dymelor, Orinase, and Tolinase (diabetes therapy); Indocin and Meclomen (antiarthritics); Hygroton (diuretic); and Reglan (antispasmodic).
41. None of our drugs were affected by the patent extension or exclusive marketing provisions of the Waxman-Hatch Act.
42. For most products the information on warehouse withdrawals comes from a virtually complete sample of warehouses; for the remainder we rely on a sample of twenty-four warehouses that is then used to provide population estimates. The panels of pharmacy and hospital purchasers are used to capture direct sales that do not go through wholesalers.
16 Brookings Papers: Microeconomics 1991
Thus, if volume discounts are applied to a total order rather than to the purchase of an individual drug or if manufacturers offer rebates directly to purchasers, these discounts are missed. Second, for pharmacy chains that utilize their own warehouses, the recorded price is an intrafirm transfer price. Because of our study's focus on the change in prices over time and with respect to patent expiration, these issues will present problems for our conclusions only to the extent that the biases involved vary in a manner related to these variables.
This information on sales revenues and quantities is reported in each year for each seller of a given drug, both branded and generic, and by individual dosage. Following most previous researchers, we chose to work with the most popular dosage of each drug for the purpose of measuring prices, sales volumes, and market shares.43
The data from IMS America also distinguish between sales to phar- macies and sales to hospitals. We retained this distinction because of the bases, indicated above, for expecting that the willingness of pre- scribers and consumers to switch to lower-priced generics might differ between the sectors. Finally, the IMS data provide the month and year that each innovative drug was first marketed.
The generic sellers of record in the IMS data are commonly generic drug distributors rather than the actual manufacturers. The number of recorded distributors for a given drug may not be the best measure of the degree of generic threat to a drug innovator, because a typical generic manufacturer may supply several generic distributors whose number is relatively independent of the conditions of competition in any one drug.4 We therefore obtained information on entry into generic manufacturing of each drug by looking at the dates of approval by the FDA of all pertinent NDAs and ANDAs.45
Sales-promotion information was also taken from IMS America tab- ulations, which are in turn obtained from a survey of the medical jour-
43. Occasionally, minor generic sales are recorded before the date of patent expiration and regulatory approval of any generic competitor's New Drug Application. We ignored these sales, concluding that they must have been made, probably indirectly, by the innovator.
44. An additional problem with using the information on distributors arises because different divisions of a single generic distributor may be recorded with different names.
45. Approval dates after 1982 were taken from U.S. Food and Drug Administration (annual); approval dates prior to 1982 were obtained through a Freedom of Information Act request.
Richard E. Caves, Michael D. Whinston, and Mark A. Hurwitz 17
Table 1. Average Characteristics (and Standard Deviations) of Sample Drugs
Drugs with patents expiring
Characteristic All drugs 1976-81 1982-87
Number of drugs 30 9 21
Market size, year before expiration, in 67.3 28.7 83.9 millions of 1982 dollars (76.1) (33.3) (83.7)
Mean annual growth rate under patent of 0.068 0.024 0.086 quantity solda (0.194) (0.198) (0.194)
Proportion of sales through pharmaciesb 0.87 0.87 0.87 (0.20) (0.16) (0.21)
Sales promotion fraction of salesb 0.062 0.056 0.065 (0.066) (0.052) (0.072)
Detailing proportion of sales promotionb 0.62 0.74 0.58 (0.27) (0.21) (0.28)
Years of exclusive marketing 14.7 16.4 14.0 (6.4) (4.8) (7.0)
Source: See text. a. Annualized proportional change in quantity sold between 1976 and year patent expired. b. Measured in year of patent's expiration.
nals for journal advertising and a panel of physicians for time spent by detailers in the direct promotion of individual drugs. This information is converted by IMS to estimated expenditures on the basis of quoted advertising rates of the publications and dollar conversions of minutes spent by sales representatives.
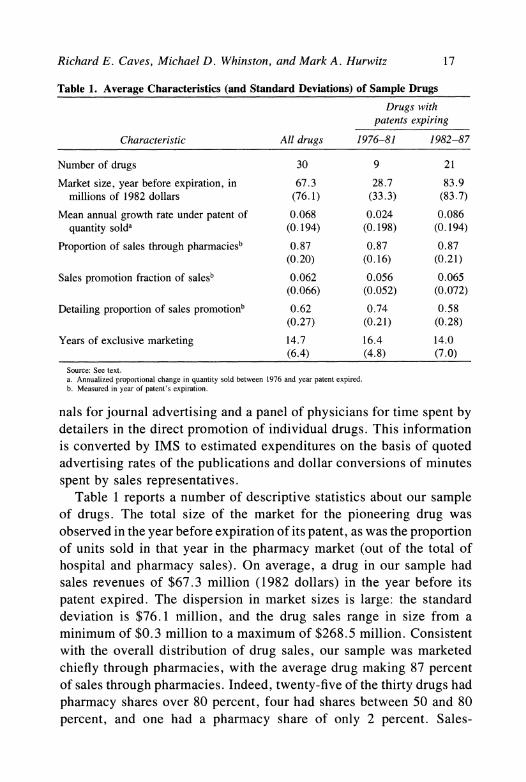
Table 1 reports a number of descriptive statistics about our sample of drugs. The total size of the market for the pioneering drug was observed in the year before expiration of its patent, as was the proportion of units sold in that year in the pharmacy market (out of the total of hospital and pharmacy sales). On average, a drug in our sample had sales revenues of $67.3 million (1982 dollars) in the year before its patent expired. The dispersion in market sizes is large: the standard deviation is $76.1 million, and the drug sales range in size from a minimum of $0.3 million to a maximum of $268.5 million. Consistent with the overall distribution of drug sales, our sample was marketed chiefly through pharmacies, with the average drug making 87 percent of sales through pharmacies. Indeed, twenty-five of the thirty drugs had pharmacy shares over 80 percent, four had shares between 50 and 80 percent, and one had a pharmacy share of only 2 percent. Sales-

18 Brookings Papers: Microeconomics 199]
promotion outlays as a fraction of sales are not particularly large by the year of patent expiration, about 6 percent, although they are typically higher in the early years of a drug's market life. The bulk of outlays are for detailing. The mean annual growth rate of quantity sold over the drug's period of exclusive marketing was 7 percent, but declines are not uncommon and indeed become common as the patent's expi- ration approaches. The mean period of exclusive marketing, 14.7 years, was close to the full patent term (17 years), and the range was between 4 and 26 years. Our sample does not display the shortened lifespans of exclusive marketing noted in aggregate data by Grabowski and Vernon (but see footnote 23). Table 1 also distinguishes between drugs that went off-patent in 1976-81 and those whose patents expired in 1982- 87. The latter group was not only more numerous but also tended to have larger markets as measured by real sales revenue in the year before patent expiration.
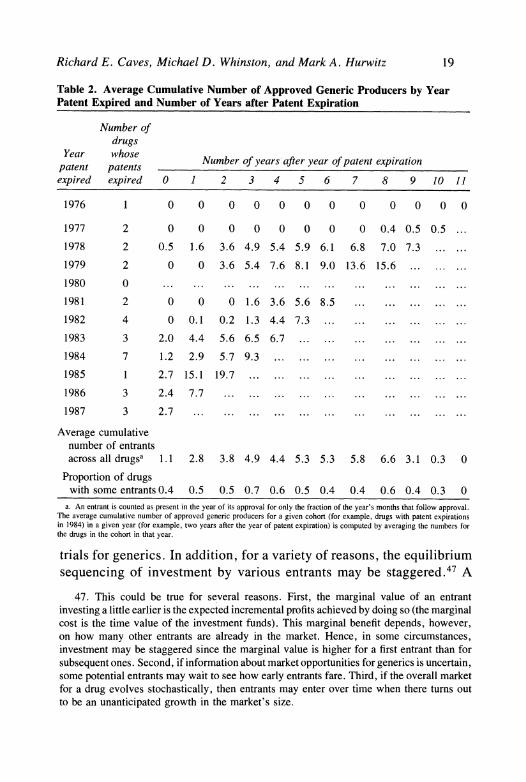
In table 2 information on the patent expiration and generic entry process is summarized for the thirty drugs. The distribution of drugs by year of patent expiration can be seen in the left two columns of the table. Of the thirty drugs, the patents of seven expired before 1980, sixteen between 1980 and 1984, and seven after 1984 (the Waxman- Hatch Act was passed at the end of 1984). The remaining columns of table 2 provide, for the drugs whose patents expired in any given year, a count of the average cumulative number of generic NDAs and ANDAs approved a given number of years after the year of patent expiration.46
At least two points are notable about this information. First, the generics that enter a given drug market do not all enter on the date the drug's patent expires but rather flow into the market over time. Several factors might lie behind this observation. First, even if all entrants begin their attempts to enter at the same time, the time needed to gain approval (starting from the date of initial investment) is no doubt ran- dom, particularly before the Waxman-Hatch Act eliminated cli-nical
46. Thus, for each of the seven drugs whose patents expired in 1984, the average number of generics active in 1985 (averaged across the seven drugs) is 2.9. The number of active generics for a given drug in a given year is calculated by attributing to each approved generic producer of that chemical entity the number of months remaining in the year from the time of approval.
Richard E. Caves, Michael D. Whinston, and Mark A. Hurwitz 19
Table 2. Average Cumulative Number of Approved Generic Producers by Year Patent Expired and Number of Years after Patent Expiration
Number of drugs
Year whose Number of years after year of patent expiration patent patents expired expired 0 1 2 3 4 5 6 7 8 9 10 11
1976 1 0 0 0 0 0 0 0 0 0 0 0 0
1977 2 0 0 0 0 0 0 0 0 0.4 0.5 0.5 ...
1978 2 0.5 1.6 3.6 4.9 5.4 5.9 6.1 6.8 7.0 7.3 ... ...
1979 2 0 0 3.6 5.4 7.6 8.1 9.0 13.6 15.6 ... ... ... 1980 0 ... ... ... ... ... ... ... ... ... ... ... ... 1981 2 0 0 0 1.6 3.6 5.6 8.5 ... ... ... ... ... 1982 4 0 0.1 0.2 1.3 4.4 7.3 ... ... ... ... ... 1983 3 2.0 4.4 5.6 6.5 6.7 ...... ... ............ 1984 7 1.2 2.9 5.7 9.3 ... ... ... ... ... ... ... ... 1985 1 2.7 15.1 19.7 ... ... ... ... ... ... ... 1986 3 2.4 7.7 ... ... ... .... ... ... ... ... 1987 3 2.7 ... ... ... ... ... ... ... ... ... ... ...
Average cumulative number of entrants across all drugsa 1.1 2.8 3.8 4.9 4.4 5.3 5.3 5.8 6.6 3.1 0.3 0
Proportion of drugs with some entrants 0.4 0.5 0.5 0.7 0.6 0.5 0.4 0.4 0.6 0.4 0.3 0
a. An entrant is counted as present in the year of its approval for only the fraction of the year's months that follow approval. The average cumulative number of approved generic producers for a given cohort (for example, drugs with patent expirations in 1984) in a given year (for example, two years after the year of patent expiration) is computed by averaging the numbers for the drugs in the cohort in that year.
trials for generics. In addition, for a variety of reasons, the equilibrium sequencing of investment by various entrants may be staggered.47 A
47. This could be true for several reasons. First, the marginal value of an entrant investing a little earlier is the expected incremental profits achieved by doing so (the marginal cost is the time value of the investment funds). This marginal benefit depends, however, on how many other entrants are already in the market. Hence, in some circumstances, investment may be staggered since the marginal value is higher for a first entrant than for subsequent ones. Second, if information about market opportunities for generics is uncertain, some potential entrants may wait to see how early entrants fare. Third, if the overall market for a drug evolves stochastically, then entrants may enter over time when there turns out to be an unanticipated growth in the market's size.
20 Brookings Papers: Microeconomics 1991
second point of interest is the marked shift in the rate of entry in the three years (1985-87) following the passage of the Waxman-Hatch Act. While one explanation for this change is surely the change in regulations governing generic entry that accompanied passage of the act, the fact that large drug markets were losing protection during this period (recall table 1) is likely also to have been important.
The bottom of table 2 reports two additional pieces of information regarding the flow of entrants into these markets. First, the average number of approved generics by years after the year of patent expiration is averaged over all cohorts. This cumulative total rises until roughly eight years after expiration and then declines; the decline is explained by the fact that only drugs whose patents expired in the 1970s have postpatent experiences of more than eight years in our sample, and overall these drugs attracted fairly little competition from generics en- tering the market, which is why it is important to look at entry by cohort. Second, the last row in table 2 reports on the proportion of drugs for which one or more generics entered the market by any number of years after the year of the patent expiration. For similar reasons, this proportion first rises and then declines. Overall, for six of the thirty drugs no generic competition entered the market during our sample period.
Finally, for our sample of drugs, the average number of approved generic producers across postpatent expiration observations is 3.66. Restricting attention to those drugs and years in which entry actually occurred (that is, conditional on entry), the average number of entrants is 7.28. By the end of the sample period, of course, the average cu- mulative number of entrants is larger, equal in 1987 to 7.63 over all of the drugs and to 9.54 for those drugs that actually experienced generic entry.
One omission from the data is any measure of the closeness of sub- stitution between the sampled drugs and others in their therapeutic classes. Although we sought to develop controls for this important factor influencing the elasticity of demand for a drug, we found the problem of quantifying the closeness of substitutes a daunting one. The familiar relevant concepts are not easily applied to the available information on medical practice. A given pharmaceutical might represent the therapy of choice for certain symptoms, although not in the face of side con- ditions that occur in unknown proportions of patients. A drug may be
Richard E. Caves, Michael D. Whinston, and Mark A. Hurwitz 21
one of several used to treat a given condition, with the selection resting on trial-and-error with individual patients or local preferences among prescribers. A drug used for several conditions might face different substitutes in each use. Furthermore, these patterns change continually as competing drugs enter a therapeutic class, large shifts occur in their relative prices, and accumulations of evidence shift prescribers' pref- erences. Reluctantly, we abandoned our effort to reduce this information to some summary measure of closeness of substitution in the therapeutic class.
Entry and Competitive Patterns
The investigation turns next to the general patterns of competitive behavior that accompany patent expiration and the subsequent entry of generic competitors for our sample of drugs. We begin with an ex- amination of branded drugs' prices, and then investigate, in turn, ge- nerics' prices and market shares, branded drugs' advertising, and quantities of each drug sold.
Prices of Branded Drugs
To examine the general price movements induced by patent expi- ration and entry, we estimate several simple " semireduced" form equa- tions. Although we do not formally derive these equations from any fully specified structural model of competition between branded and generic producers, they can probably best be understood with reference to a simple constant-elasticity pricing formula. This pricing rule relates the price of branded drug i in period t, Pit, to marginal cost for that drug in period t, C(i, t), and a markup term, O(i, t), that is a function of the elasticity of demand faced by the producer of branded drug i in period t:
(1) Pit = O(i,t)C(i,t).
Because we do not have any information on costs of specific drugs, we first decompose the marginal cost term C(i, t) into the product of a drug- specific effect Ai and an industry aggregate effect MCt:
(2) Pit = O(i,t) AipMC,.
22 Brookings Papers: Microeconomics 1991
Taking logarithms of equation 2, we then have
(3) Pit = 0(i,t) + Xi + mc,
where lowercase letters now refer to natural logarithms of the respective variables.
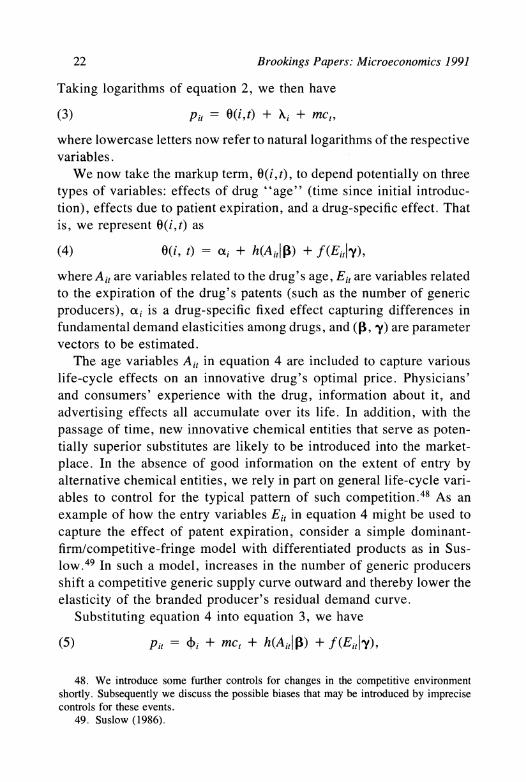
We now take the markup term, 0(i,t), to depend potentially on three types of variables: effects of drug "age" (time since initial introduc- tion), effects due to patient expiration, and a drug-specific effect. That is, we represent 0(i,t) as
(4) 0(i, t) = oti + h(Ait||9) + f(Eitl'y),
where Ait are variables related to the drug's age, Eit are variables related to the expiration of the drug's patents (such as the number of generic producers), oi is a drug-specific fixed effect capturing differences in fundamental demand elasticities among drugs, and (,, y) are parameter vectors to be estimated.
The age variables Ait in equation 4 are included to capture various life-cycle effects on an innovative drug's optimal price. Physicians' and consumers' experience with the drug, information about it, and advertising effects all accumulate over its life. In addition, with the passage of time, new innovative chemical entities that serve as poten- tially superior substitutes are likely to be introduced into the market- place. In the absence of good information on the extent of entry by alternative chemical entities, we rely in part on general life-cycle vari- ables to control for the typical pattern of such competition.48 As an example of how the entry variables Eit in equation 4 might be used to capture the effect of patent expiration, consider a simple dominant- firm/competitive-fringe model with differentiated products as in Sus- low.49 In such a model, increases in the number of generic producers shift a competitive generic supply curve outward and thereby lower the elasticity of the branded producer's residual demand curve.
Substituting equation 4 into equation 3, we have
(5) pit = 4i + mct + h(Ait|,) + f(Eit'y),
48. We introduce some further controls for changes in the competitive environment shortly. Subsequently we discuss the possible biases that may be introduced by imprecise controls for these events.
49. Suslow (1986).
Richard E. Caves, Michael D. Whinston, and Mark A. Hurwitz 23
where -i (oti + Xi). In principle, we might consider estimating equations based on equa-
tion 5 using some industrywide cost index for mct. As figure 1 suggests, however, this approach is unlikely to prove very fruitful, as industry price movements during the 1982-87 period seem to bear little relation to any such measure of costs. Instead, we decided to make use of the panel structure of our data set to estimate the mct term for our drugs. That is, we replace equation 5 with
(6) Pit = 4i + pt + h(Aitlo) + f(EityT),
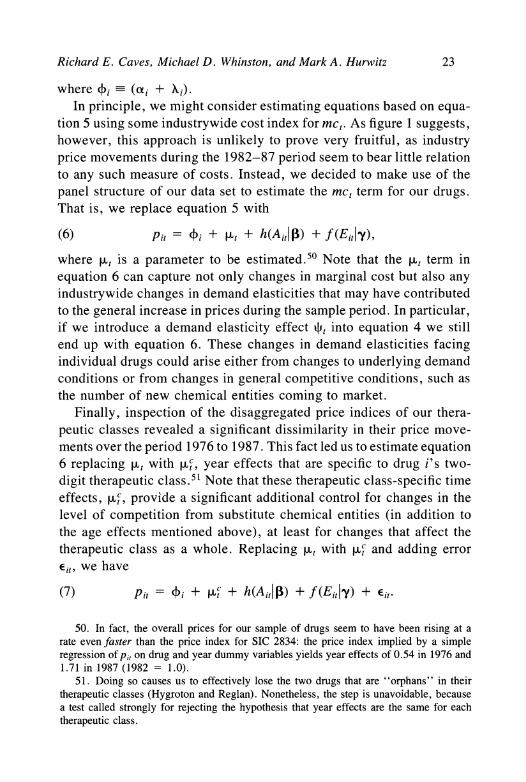
where pt is a parameter to be estimated.5 Note that the pt term in equation 6 can capture not only changes in marginal cost but also any industrywide changes in demand elasticities that may have contributed to the general increase in prices during the sample period. In particular, if we introduce a demand elasticity effect 4t into equation 4 we still end up with equation 6. These changes in demand elasticities facing individual drugs could arise either from changes to underlying demand conditions or from changes in general competitive conditions, such as the number of new chemical entities coming to market.
Finally, inspection of the disaggregated price indices of our thera- peutic classes revealed a significant dissimilarity in their price move- ments over the period 1976 to 1987. This fact led us to estimate equation 6 replacing pt with pc, year effects that are specific to drug i's two- digit therapeutic class.51 Note that these therapeutic class-specific time effects, Kc provide a significant additional control for changes in the level of competition from substitute chemical entities (in addition to the age effects mentioned above), at least for changes that affect the therapeutic class as a whole. Replacing pt with Kc and adding error Eit, we have
(7) P = t i + p c + h(A it|I) + f(Eit|y) + Eit.
50. In fact, the overall prices for our sample of drugs seem to have been rising at a rate even faster than the price index for SIC 2834: the price index implied by a simple regression of pi, on drug and year dummy variables yields year effects of 0.54 in 1976 and 1.71 in 1987 (1982 = 1.0).
51. Doing so causes us to effectively lose the two drugs that are "orphans" in their therapeutic classes (Hygroton and Reglan). Nonetheless, the step is unavoidable, because a test called strongly for rejecting the hypothesis that year effects are the same for each therapeutic class.
24 Brookings Papers: Microeconomics 1991
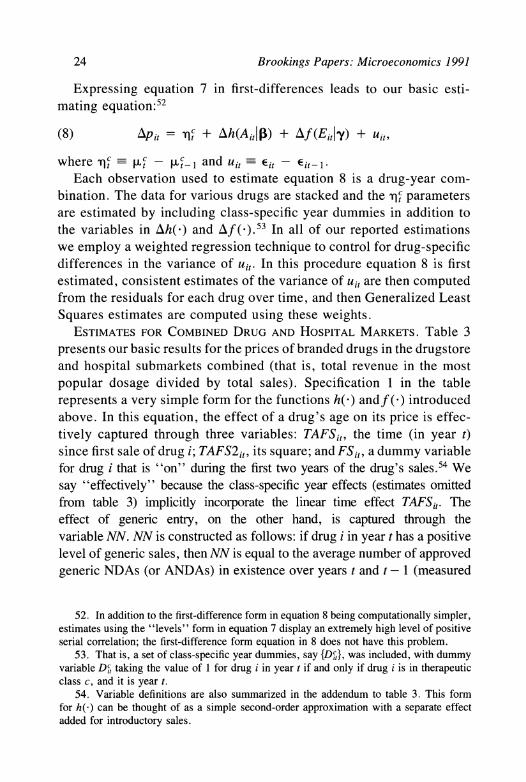
Expressing equation 7 in first-differences leads to our basic esti- mating equation:52
(8) APit= qc + Ah(Ait|p) + Af(Eit|y) + uit,
where c t K - Kc- I and uit Eit - Eit1.
Each observation used to estimate equation 8 is a drug-year com- bination. The data for various drugs are stacked and the qc parameters are estimated by including class-specific year dummies in addition to the variables in lAh(-) and lAf ().53 In all of our reported estimations we employ a weighted regression technique to control for drug-specific differences in the variance of uit. In this procedure equation 8 is first estimated, consistent estimates of the variance of uit are then computed from the residuals for each drug over time, and then Generalized Least Squares estimates are computed using these weights.
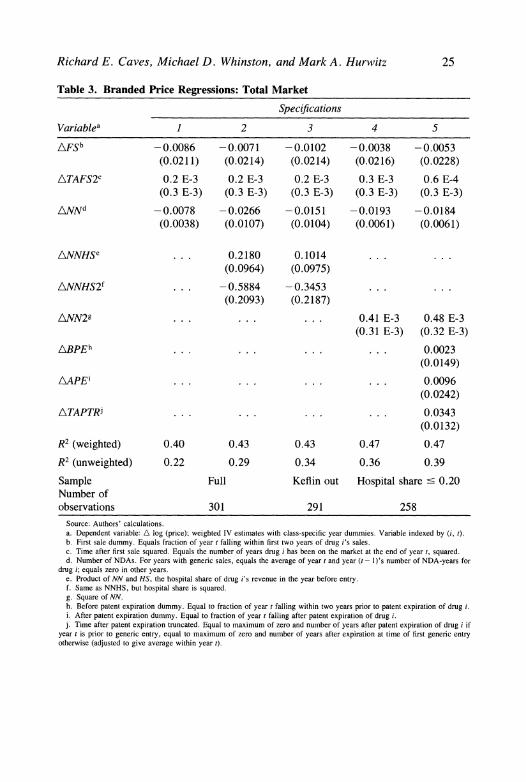
ESTIMATES FOR COMBINED DRUG AND HOSPITAL MARKETS. Table 3 presents our basic results for the prices of branded drugs in the drugstore and hospital submarkets combined (that is, total revenue in the most popular dosage divided by total sales). Specification 1 in the table represents a very simple form for the functions h(-) andf(-) introduced above. In this equation, the effect of a drug's age on its price is effec- tively captured through three variables: TAFSit, the time (in year t) since first sale of drug i; TAFS2it, its square; and FSit, a dummy variable for drug i that is "on" during the first two years of the drug's sales.54 We say "effectively" because the class-specific year effects (estimates omitted from table 3) implicitly incorporate the linear time effect TAFSit. The effect of generic entry, on the other hand, is captured through the variable NN. NN is constructed as follows: if drug i in year t has a positive level of generic sales, then NN is equal to the average number of approved generic NDAs (or ANDAs) in existence over years t and t - 1 (measured
52. In addition to the first-difference form in equation 8 being computationally simpler, estimates using the "levels" form in equation 7 display an extremely high level of positive serial correlation; the first-difference form equation in 8 does not have this problem.
53. That is, a set of class-specific year dummies, say {D,}, was included, with dummy variable DC taking the value of 1 for drug i in year t if and only if drug i is in therapeutic class c, and it is year t.
54. Variable definitions are also summarized in the addendum to table 3. This form for h(-) can be thought of as a simple second-order approximation with a separate effect added for introductory sales.
Richard E. Caves, Michael D. Whinston, and Mark A. Hurwitz 25
Table 3. Branded Price Regressions: Total Market
Specifications
Variablea 1 2 3 4 5
AFSb -0.0086 -0.0071 -0.0102 -0.0038 -0.0053 (0.0211) (0.0214) (0.0214) (0.0216) (0.0228)
ATAFS2C 0.2 E-3 0.2 E-3 0.2 E-3 0.3 E-3 0.6 E-4 (0.3 E-3) (0.3 E-3) (0.3 E-3) (0.3 E-3) (0.3 E-3)
ANNd -0.0078 -0.0266 -0.0151 -0.0193 -0.0184 (0.0038) (0.0107) (0.0104) (0.0061) (0.0061)
ANNHSe ... 0.2180 0.1014 ...
(0.0964) (0.0975)
ANNHS21 ... -0.5884 -0.3453 ...
(0.2093) (0.2187)
ANN29 ... ... ... 0.41 E-3 0.48 E-3 (0.31 E-3) (0.32 E-3)
ABPEh .. . ... ... ... 0.0023
(0.0149)
L\APEi ... ..... ... 0.0096 (0.0242)
ATAPTRi ... ... ... ... 0.0343
(0.0132)
R2 (weighted) 0.40 0.43 0.43 0.47 0.47
R2 (unweighted) 0.22 0.29 0.34 0.36 0.39
Sample Full Keflin out Hospital share < 0.20 Number of observations 301 291 258
Source: Authors' calculations. a. Dependent variable: A log (price); weighted IV estimates with class-specific year dummies. Variable indexed by (i, t). b. First sale dummy. Equals fraction of year t falling within first two years of drug i's sales. c. Time after first sale squared. Equals the number of years drug i has been on the market at the end of year t, squared. d. Number of NDAs. For years with generic sales, equals the average of year t and year (t- I)'s number of NDA-years for
drug i; equals zero in other years. e. Product of NN and HS, the hospital share of drug i's revenue in the year before entry. f. Same as NNHS, but hospital share is squared. g. Square of NN. h. Before patent expiration dummy. Equal to fraction of year t falling within two years prior to patent expiration of drug i. i. After patent expiration dummy. Equal to fraction of year t falling after patent expiration of drug i. j. Time after patent expiration truncated. Equal to maximum of zero and number of years after patent expiration of drug i if
year t is prior to generic entry, equal to maximum of zero and number of years after expiration at time of first generic entry otherwise (adjusted to give average within year t).
26 Brookings Papers: Microeconomics 1991
in NDA-years) for that drug.55 We employ this averaging procedure because some delay typically occurs between the awarding of an NDA or ANDA and initial sales by a generic entrant. Thus, specification 1 involves taking Ah(A) and Af ( ) in equation 8 to be Ah(A) = LAFSit + 02ATAFS2it and
APf() = 'y1ANNit. Specification 1 is estimated by means of an instrumental-variables tech-
nique that instruments for the endogenous variable lANN. Natural choices for instruments (and the ones we employ) are combinations of variables repre- senting the amount of time that has passed since patent expiration, a time trend, a dummy indicating passage of the Waxman-Hatch Act, and measures of the drug's general level of demand. Lacking more directly exogenous measures for the last of these instruments, we used the drug's level of (real) sales revenue in the year prior to patent expiration. While not as fully exogenous as our other instruments, the dramatic range displayed by this variable across our sample of drugs (discussed above) relative to the variation in sales revenue for any drug over time, and our use of market size before expiration, lead us to believe that the bias introduced by the use of this instrument is slight relative to the increase in precision it affords.56
The results for specification 1 reported in table 3 reveal a statistically significant, but small, effect of entry on branded drugs' prices: each generic NDA leads to a fall of 0.8 percent in the branded drug's price. At the mean number of generic entrants for our sample of 2.46 (that is, the mean of NN computed over all postpatent expiration observations), this coef- ficient implies a postentry price decline of roughly 2 percent. Even con- ditional on a drug facing generic competition in a given year, for which the conditional mean level of NN is 5.67, the decline in branded price due to generic entry is only 4.5 percent. The age-related variables FS and TAFS2, on the other hand, are both insignificant.
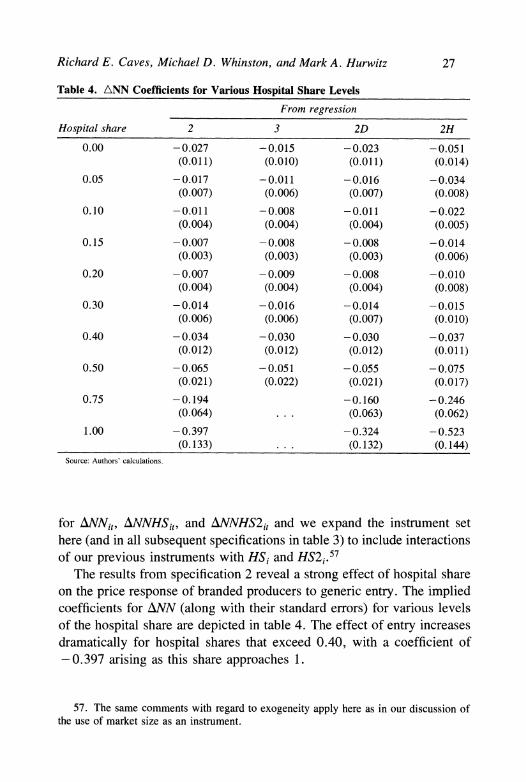
For reasons discussed above, it is natural to wonder whether the share of the market accounted for by hospital sales has important effects on the responses of branded drugs' prices to generic entry. In specification 2 of table 3 we investigate this possibility, expanding the function f( ) by introducing interactions of NNit with HSi, the hospital share of drug i in the year before patent expiration, and with its square, HS2j, yielding variables NNHSit and NNHS2it respectively. We now need to instrument
55. We use the numbers of NDAs and ANDAs in existence over all dosage forms for a drug.
56. Unfortunately, estimates without this instrument are fairly imprecise.
Richard E. Caves, Michael D. Whinston, and Mark A. Hurwitz 27
Table 4. ANN Coefficients for Various Hospital Share Levels
From regression
Hospital share 2 3 2D 2H
0.00 -0.027 -0.015 -0.023 -0.051 (0.011) (0.010) -(0.011) (0.014)
0.05 -0.017 -0.011 -0.016 -0.034 (0.007) (0.006) (0.007) (0.008)
0.10 -0.011 -0.008 -0.011 -0.022 (0.004) (0.004) (0.004) (0.005)
0.15 -0.007 -0.008 -0.008 -0.014 (0.003) (0.003) (0.003) (0.006)
0.20 -0.007 -0.009 -0.008 -0.010 (0.004) (0.004) (0.004) (0.008)
0.30 -0.014 -0.016 -0.014 -0.015 (0.006) (0.006) (0.007) (0.010)
0.40 -0.034 -0.030 -0.030 -0.037 (0.012) (0.012) (0.012) (0.011)
0.50 -0.065 -0.051 -0.055 -0.075 (0.021) (0.022) (0.021) (0.017)
0.75 -0.194 -0.160 -0.246 (0.064) ... (0.063) (0.062)
1.00 -0.397 -0.324 -0.523 (0.133) ... (0.132) (0.144)
Source: Authors' calculations.
for ANNit, ANNHSi,, and ANNHS2it and we expand the instrument set here (and in all subsequent specifications in table 3) to include interactions of our previous instruments with HSi and HS2j.57
The results from specification 2 reveal a strong effect of hospital share on the price response of branded producers to generic entry. The implied coefficients for ANN (along with their standard errors) for various levels of the hospital share are depicted in table 4. The effect of entry increases dramatically for hospital shares that exceed 0.40, with a coefficient of - 0.397 arising as this share approaches 1.
57. The same comments with regard to exogeneity apply here as in our discussion of the use of market size as an instrument.
28 Brookings Papers: Microeconomics 1991
Because of our sample's uneven distribution of markets by hospital share, we had some concern that the presence of just one drug sold primarily to hospitals (Keflin, with a hospital ratio of 0.98) might distort the estimates for the remainder of the sample. Specification 3 in table 3 drops Keflin from the sample. Table 4 depicts the implied coefficient of ANN for various levels of hospital share (the sample now includes only drugs with hospital shares less than 0.50). Although the results have a flavor similar to those of specification 2 (the effect of entry still tends to increase as hospital shares exceed 0.30), the magnitude of the hospital share's effect is somewhat smaller, and a quasi-likelihood ratio test for the significance of the ANNHS and ANNHS2 terms can now only reject the hypothesis of no effect at a critical value of around 0.30. Finally, note that both here and in specification 2, the implied coefficient on ANN is larger than that in specification 1 at almost every hospital share level; the unmodeled heterogeneity of hospital shares in specification 1 must have distorted the estimates of the drug, class-year, or age effects in a way that lowered the estimated effect of ANN.
Given these results, in examining two further specifications we focused our attention on the relatively homogeneous majority of our sample that had hospital shares below 20 percent (twenty-five of the thirty drugs). First, it is natural to think that the effect of generic entry on the prices of branded drugs would be largest for the first few entrants and would decline after that (this pattern is predicted by most models of oligopolistic inter- action in which branded price converges on some minimum point as generic prices approach marginal cost). To investigate this possibility, we included the square of NN, NN2, in the function f().
The results depicted in specification 4 of table 3 support this view somewhat, although the t-statistic on ANN2 is only 1.32. The inclusion of ANN2 raises the estimated coefficient on ANN (compare with values in the 0.00-0.20 range in table 4).58 Now the branded drug's price falls roughly 2 percent with the entry of the first generic competitor, 8.5 percent with five generic competitors, 15 percent with ten generic com- petitors, and 22 percent with twenty generic producers.59
58. A regression for the restricted sample using only /NN yields a coefficient on ANN of 0.013 (0.003).
59. To calculate the total price decline for any given level of NN, we take exp(A) where A is the value attained by the estimated effects for that level of NN.
Richard E. Caves, Michael D. Whinston, and Mark A. Hurwitz 29
Second, we wondered whether patent expiration might exert any effects not tied to entry per se. These effects could arise for two basic reasons. First, pricing decisions could have dynamic aspects. For ex- ample, producers of branded drugs could conceivably practice some kind of limit pricing during this interval, or, alternatively, the lags in doctors' information about prices might cause pricing in any year to affect primarilyfuture demand. In the latter case, prices might rise in the period prior to entry, because the likelihood of future entry reduces the loss in future sales revenue caused by a price increase today. Second, the anticipation of entry could lead to changes in other variables, notably advertising, that indirectly affect the optimal choice of price by the branded drug's producer. In principle, a change in advertising could either increase or decrease price. Decreases in advertising might at first be thought to lower the demand for the drug and hence the optimal price. However, if advertising is primarily aimed at increasing sales of the drug for uses in which close substitutes exist, a reduction in advertising might reduce demand to only those users for whom the drug lacks good alternatives and might therefore lead to an increase in the branded producer's optimal price.60 To capture this effect we added three variables to the function f(): BPEit, a dummy variable equal to 1 in the two years preceding drug i's patent expiration; APEit, a dummy variable equal to 1 after drug i's patent expiration, and TAPTRit, a variable equal to the number of years after patent expiration in period t if drug i has not yet had any generic entrants and equal to the number of years after expiration that entry occurred if drug i does face generic competition by year t (that is, it is a TRuncated version of the Time After Patent expiration).61
The results of this specification (number 5 in table 3) suggest that the prices of branded drugs tend to increase in the period between
60. This could occur if doctors become price-sensitive in their prescribing patterns only when they can choose among several roughly equivalent drugs. A related point is that doctors may be hesitant to switch patients who are already successfully using the branded drug. If advertising largely serves to stimulate demand for new prescriptions, for which there is greater price sensitivity, more advertising may lead to lower prices.
61. Thus, TAPTR captures any effects that accumulate during the period between patent expiration and generic entry. The truncation casues the entry variables (NN and NN2) to measure the effect of entry from the price level in existence at the time of first generic entry. Note that TAPTR is a function of the endogenous variable NN, so it too is instru- mented.
30 Brookings Papers: Microeconomics 1991
patent expiration and entry. Although the coefficients on A!BPE and AAPE are insignificant, that on AITAPTR is significant and indicates that branded prices tend to increase at a rate of roughly 3.5 percent a year in this interval. Although specification 5 does not directly reveal the reasons for this price increase, below we investigate the pattern of advertising expenditures for clues. Finally, the estimates of the effects of entry on branded prices are similar to those seen in specification 4, although slightly smaller.
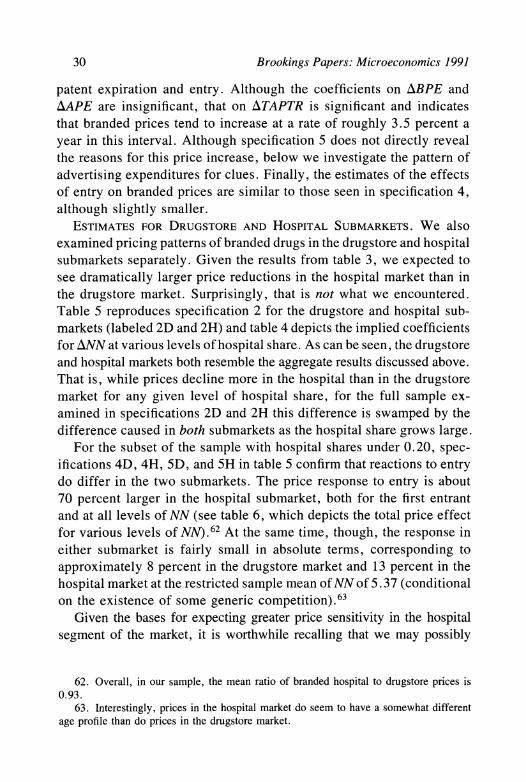
ESTIMATES FOR DRUGSTORE AND HOSPITAL SUBMARKETS. We also examined pricing patterns of branded drugs in the drugstore and hospital submarkets separately. Given the results from table 3, we expected to see dramatically larger price reductions in the hospital market than in the drugstore market. Surprisingly, that is not what we encountered. Table 5 reproduces specification 2 for the drugstore and hospital sub- markets (labeled 2D and 2H) and table 4 depicts the implied coefficients for ANN at various levels of hospital share. As can be seen, the drugstore and hospital markets both resemble the aggregate results discussed above. That is, while prices decline more in the hospital than in the drugstore market for any given level of hospital share, for the full sample ex- amined in specifications 2D and 2H this difference is swamped by the difference caused in both submarkets as the hospital share grows large.
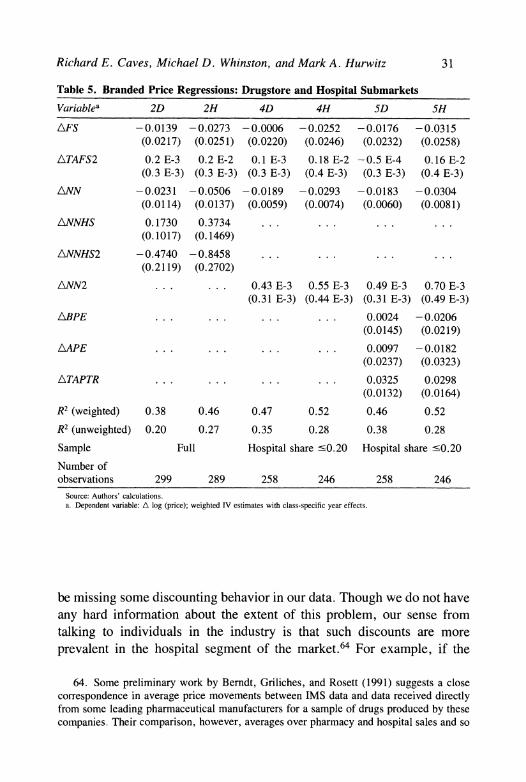
For the subset of the sample with hospital shares under 0.20, spec- ifications 4D, 4H, 5D, and 5H in table 5 confirm that reactions to entry do differ in the two submarkets. The price response to entry is about 70 percent larger in the hospital submarket, both for the first entrant and at all levels of NN (see table 6, which depicts the total price effect for various levels of NN).62 At the same time, though, the response in either submarket is fairly small in absolute terms, corresponding to approximately 8 percent in the drugstore market and 13 percent in the hospital market at the restricted sample mean of NN of 5.37 (conditional on the existence of some generic competition).63
Given the bases for expecting greater price sensitivity in the hospital segment of the market, it is worthwhile recalling that we may possibly
62. Overall, in our sample, the mean ratio of branded hospital to drugstore prices is 0.93.
63. Interestingly, prices in the hospital market do seem to have a somewhat different age profile than do prices in the drugstore market.
Richard E. Caves, Michael D. Whinston, and Mark A. Hurwitz 31
Table 5. Branded Price Regressions: Drugstore and Hospital Submarkets
Variablea 2D 2H 4D 4H SD SH
AFS -0.0139 -0.0273 -0.0006 -0.0252 -0.0176 -0.0315 (0.0217) (0.0251) (0.0220) (0.0246) (0.0232) (0.0258)
ATAFS2 0.2 E-3 0.2 E-2 0.1 E-3 0.18 E-2 -0.5 E-4 0.16 E-2 (0.3 E-3) (0.3 E-3) (0.3 E-3) (0.4 E-3) (0.3 E-3) (0.4 E-3)
ANN -0.0231 -0.0506 -0.0189 -0.0293 -0.0183 -0.0304 (0.0114) (0.0137) (0.0059) (0.0074) (0.0060) (0.0081)
ANNHS 0.1730 0.3734 ... ... ... ... (0.1017) (0.1469)
ANNHS2 -0.4740 -0.8458 ... ... ...
(0.2119) (0.2702)
ANN2 ... ... 0.43 E-3 0.55 E-3 0.49 E-3 0.70 E-3 (0.31 E-3) (0.44 E-3) (0.31 E-3) (0.49 E-3)
ABPE . . . ... ... 0.0024 -0.0206 (0.0145) (0.0219)
AAPE ... ... ... ... 0.0097 -0.0182 (0.0237) (0.0323)
ATAPTR ... ... ... ... 0.0325 0.0298 (0.0132) (0.0164)
R2 (weighted) 0.38 0.46 0.47 0.52 0.46 0.52
R2 (unweighted) 0.20 0.27 0.35 0.28 0.38 0.28
Sample Full Hospital share '0.20 Hospital share '<0.20
Number of observations 299 289 258 246 258 246
Source: Authors' calculations. a. Dependent variable: A log (price); weighted IV estimates with class-specific year effects.
be missing some discounting behavior in our data. Though we do not have any hard information about the extent of this problem, our sense from talking to individuals in the industry is that such discounts are more prevalent in the hospital segment of the market.64 For example, if the
64. Some preliminary work by Berndt, Griliches, and Rosett (1991) suggests a close correspondence in average price movements between IMS data and data received directly from some leading pharmaceutical manufacturers for a sample of drugs produced by these companies. Their comparison, however, averages over pharmacy and hospital sales and so
32 Brookings Papers: Microeconomics 1991
Table 6. Implied Percentage Branded Price Reductions from Specifications 5D and 5H
Submarket
Number of generics Drugstores Hospitals
1 -0.018 -0.030 2 -0.034 -0.056
3 -0.049 -0.081
5 -0.076 -0.126
10 -0.125 -0.209
15 -0.151 -0.258
20 -0.156 -0.280
Minimum attained at: 18.7 21.7
Value at minimum: -0.157 -0.281
Source: Authors' calculations.
optimal price of a branded drug to final users in the hospital segment is lower than in the pharmacy market and if the branded drug producer is unable to directly control the prices charged by the wholesaler to these two sets of users, the branded producer may decide to pay direct discounts to hospital purchasers. Indeed, such a scenario coincides with that de- scribed to us by these individuals: sales to hospitals are largely channeled through the same wholesalers that sell to the pharmacy market, while hospitals and hospital buying groups solicit bids from manufacturers on the level of "charge-backs" the manufacturers will provide for purchases of their products (these rebate levels are not observed by the wholesalers). While discounts present a problem for our estimates only if their extent is related to patent expiration, in this case these hospital discounts could increase in response to generic entry if the required price differential grows. We shall return to this issue below after considering the responses of several other variables across the two markets.
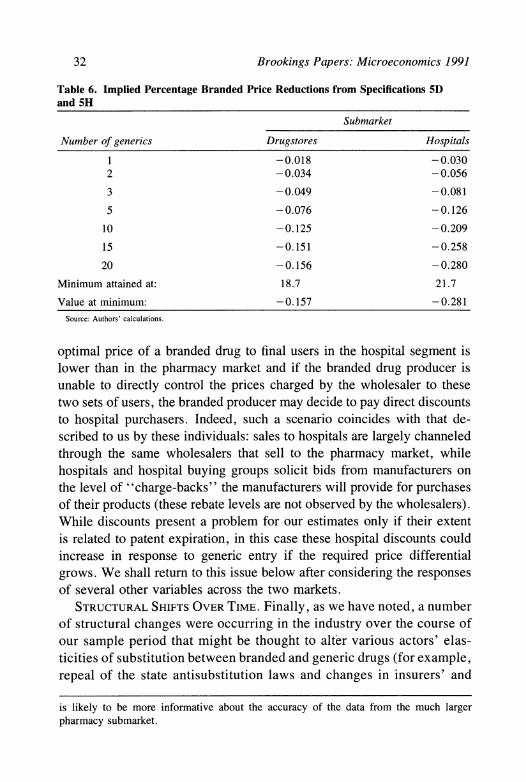
STRUCTURAL SHIFTS OVER TIME. Finally, as we have noted, a number
of structural changes were occurring in the industry over the course of our sample period that might be thought to alter various actors' elas- ticities of substitution between branded and generic drugs (for example, repeal of the state antisubstitution laws and changes in insurers' and
is likely to be more informative about the accuracy of the data from the much larger pharmacy submarket.
Richard E. Caves, Michael D. Whinston, and Mark A. Hurwitz 33
Table 7. Branded Price Regressions: Time Effects by Submarket
Variablea Drugstores Hospitals
AFS -0.0030 -0.0315 (0.0233) (0.0248)
ATAFS2 -0.4 E-4 0.16 E-2 (0.3 E-3) (0.4 E-3)
ANN -0.0210 -0.0470 (0.0088) (0.0113)
A[NN*(1987-Year)] 0.0016 0.0074 (0.0034) (0.0041)
ANN2 0.65 E-3 0.16 E-2 (0.47 E-3) (0.67 E-3)
ABPE 0.0019 -0.0218 (0.0147) (0.0214)
AAPE 0.0063 -0.0247 (0.0244) (0.0320)
ATAPTR 0.0316 0.0263 (0.0134) (0.0161)
R2 (weighted) 0.46 0.55
R2 (unweighted) 0.38 0.30
Sample Hospital share ' 0.20
Number of observations 258 246 Source: Authors' calculations. a. Dependent variable: A log (price); weighted IV estimates with class-specific year dummies.
hospitals' behavior). We wondered whether the price reaction of branded drugs to generic entry might have increased. To investigate this issue we reestimated specifications 5D and 5H from table 5, including a variable in the function f () interacting NNi, with (1 987-t). Unfortu- nately, for this subsample (those with hospital shares less than 0.20), there is no generic entry before 1982, so we can at best pick up the effects of structural shifts in the latter part of our sample.65 Table 7 reports the results. The coefficient of this new variable is positive in
65. This problem would not be solved by looking at the entire sample; for the full sample we have only four drug-years with generic entrants before 1982 (out of a total of sixty-five over all years).
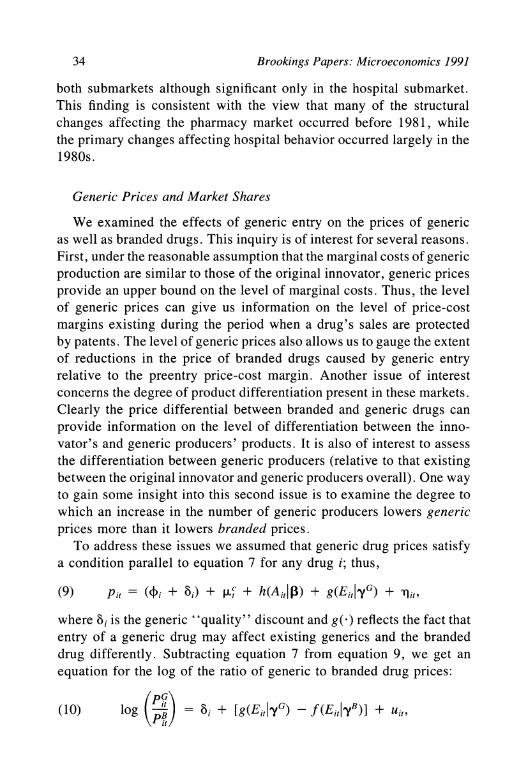
34 Brookings Papers: Microeconomics 1991
both submarkets although significant only in the hospital submarket. This finding is consistent with the view that many of the structural changes affecting the pharmacy market occurred before 1981, while the primary changes affecting hospital behavior occurred largely in the 1980s.
Generic Prices and Market Shares
We examined the effects of generic entry on the prices of generic as well as branded drugs. This inquiry is of interest for several reasons. First, under the reasonable assumption that the marginal costs of generic production are similar to those of the original innovator, generic prices provide an upper bound on the level of marginal costs. Thus, the level of generic prices can give us information on the level of price-cost margins existing during the period when a drug's sales are protected by patents. The level of generic prices also allows us to gauge the extent of reductions in the price of branded drugs caused by generic entry relative to the preentry price-cost margin. Another issue of interest concerns the degree of product differentiation present in these markets. Clearly the price differential between branded and generic drugs can provide information on the level of differentiation between the inno- vator's and generic producers' products. It is also of interest to assess the differentiation between generic producers (relative to that existing between the original innovator and generic producers overall). One way to gain some insight into this second issue is to examine the degree to which an increase in the number of generic producers lowers generic prices more than it lowers branded prices.
To address these issues we assumed that generic drug prices satisfy a condition parallel to equation 7 for any drug i; thus,
(9) pit = (4ti + 8i) + At + h(Aitl$) + g(EitlyG) + -q,tg
where 8i is the generic "quality" discount and g( ) reflects the fact that entry of a generic drug may affect existing generics and the branded drug differently. Subtracting equation 7 from equation 9, we get an equation for the log of the ratio of generic to branded drug prices:
(10) log ( p) =8 + [g(Ej,jyG) -f (EitlyB)] + ui,
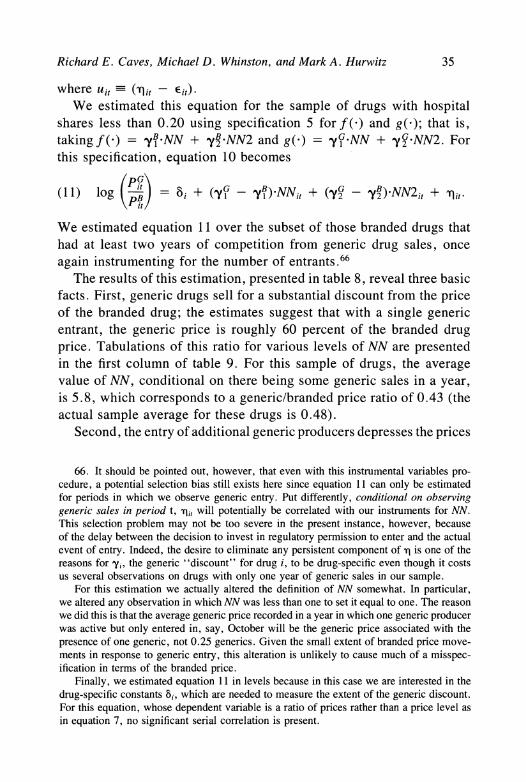
Richard E. Caves, Michael D. Whinston, and Mark A. Hurwitz 35
where uit- (it- Eit)-
We estimated this equation for the sample of drugs with hospital shares less than 0.20 using specification 5 forf(-) and g( ); that is, taking f() = y NN + y *NN2 and g(-) = yGNN + y G *NN2. For this specification, equation 10 becomes
( 1) log ( ) = 8 + (,yG - yB)NNit + (yG - yB) NN2j, + qit
We estimated equation 11 over the subset of those branded drugs that had at least two years of competition from generic drug sales, once again instrumenting for the number of entrants.66
The results of this estimation, presented in table 8, reveal three basic facts. First, generic drugs sell for a substantial discount from the price of the branded drug; the estimates suggest that with a single generic entrant, the generic price is roughly 60 percent of the branded drug price. Tabulations of this ratio for various levels of NN are presented in the first column of table 9. For this sample of drugs, the average value of NN, conditional on there being some generic sales in a year, is 5.8, which corresponds to a generic/branded price ratio of 0.43 (the actual sample average for these drugs is 0.48).
Second, the entry of additional generic producers depresses the prices
66. It should be pointed out, however, that even with this instrumental variables pro- cedure, a potential selection bias still exists here since equation 11 can only be estimated for periods in which we observe generic entry. Put differently, conditional on observing generic sales in period t, qi, will potentially be correlated with our instruments for NN. This selection problem may not be too severe in the present instance, however, because of the delay between the decision to invest in regulatory permission to enter and the actual event of entry. Indeed, the desire to eliminate any persistent component of q is one of the reasons for yi, the generic "discount" for drug i, to be drug-specific even though it costs us several observations on drugs with only one year of generic sales in our sample.
For this estimation we actually altered the definition of NN somewhat. In particular, we altered any observation in which NN was less than one to set it equal to one. The reason we did this is that the average generic price recorded in a year in which one generic producer was active but only entered in, say, October will be the generic price associated with the presence of one generic, not 0.25 generics. Given the small extent of branded price move- ments in response to generic entry, this alteration is unlikely to cause much of a misspec- ification in terms of the branded price.
Finally, we estimated equation 11 in levels because in this case we are interested in the drug-specific constants 8i, which are needed to measure the extent of the generic discount. For this equation, whose dependent variable is a ratio of prices rather than a price level as in equation 7, no significant serial correlation is present.
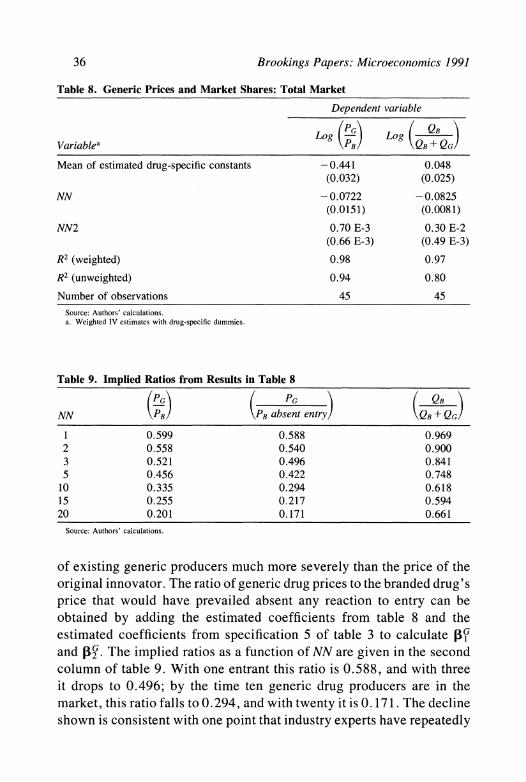
36 Brookings Papers: Microeconomics 1991
Table 8. Generic Prices and Market Shares: Total Market
Dependent variable
Variablea (PB) Log (QB+ QG)
Mean of estimated drug-specific constants -0.441 0.048 (0.032) (0.025)
NN -0.0722 -0.0825 (0.0151) (0.0081)
NN2 0.70 E-3 0.30 E-2 (0.66 E-3) (0.49 E-3)
R2 (weighted) 0.98 0.97
R2 (unweighted) 0.94 0.80
Number of observations 45 45 Source: Authors' calculations. a. Weighted IV estimates with drug-specific dummies.
Table 9. Implied Ratios from Results in Table 8
PG ~ ( PG QB__
NN PB PB absent entry QB+QG
1 0.599 0.588 0.969 2 0.558 0.540 0.900 3 0.521 0.496 0.841 5 0.456 0.422 0.748
10 0.335 0.294 0.618 15 0.255 0.217 0.594 20 0.201 0.171 0.661
Source: Authors' calculations.
of existing generic producers much more severely than the price of the original innovator. The ratio of generic drug prices to the branded drug's price that would have prevailed absent any reaction to entry can be obtained by adding the estimated coefficients from table 8 and the estimated coefficients from specification 5 of table 3 to calculate PI and ,G . The implied ratios as a function of NN are given in the second column of table 9. With one entrant this ratio is 0.588, and with three it drops to 0.496; by the time ten generic drug producers are in the market, this ratio falls to 0.294, and with twenty it is 0.171. The decline shown is consistent with one point that industry experts have repeatedly
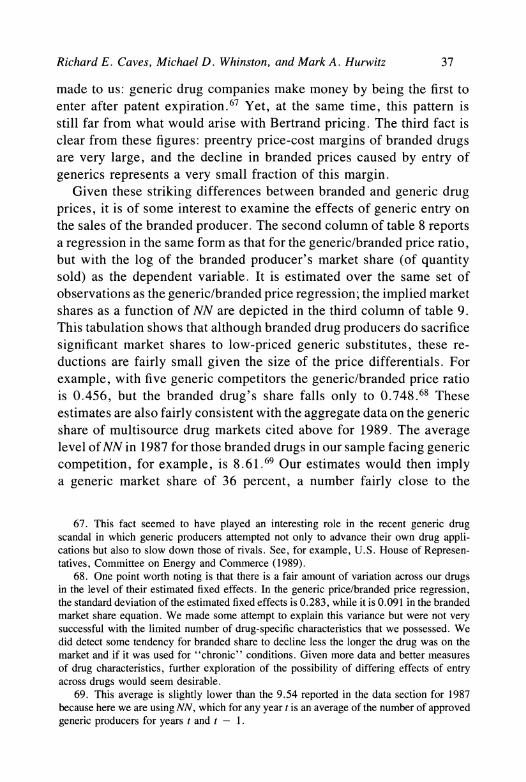
Richard E. Caves, Michael D. Whinston, and Mark A. Hurwitz 37
made to us: generic drug companies make money by being the first to enter after patent expiration.67 Yet, at the same time, this pattern is still far from what would arise with Bertrand pricing. The third fact is clear from these figures: preentry price-cost margins of branded drugs are very large, and the decline in branded prices caused by entry of generics represents a very small fraction of this margin.
Given these striking differences between branded and generic drug prices, it is of some interest to examine the effects of generic entry on the sales of the branded producer. The second column of table 8 reports a regression in the same form as that for the generic/branded price ratio, but with the log of the branded producer's market share (of quantity sold) as the dependent variable. It is estimated over the same set of observations as the generic/branded price regression; the implied market shares as a function of NN are depicted in the third column of table 9. This tabulation shows that although branded drug producers do sacrifice significant market shares to low-priced generic substitutes, these re- ductions are fairly small given the size of the price differentials. For example, with five generic competitors the generic/branded price ratio is 0.456, but the branded drug's share falls only to 0.748.68 These estimates are also fairly consistent with the aggregate data on the generic share of multisource drug markets cited above for 1989. The average level of NN in 1987 for those branded drugs in our sample facing generic competition, for example, is 8.61.69 Our estimates would then imply a generic market share of 36 percent, a number fairly close to the
67. This fact seemed to have played an interesting role in the recent generic drug scandal in which generic producers attempted not only to advance their own drug appli- cations but also to slow down those of rivals. See, for example, U.S. House of Represen- tatives, Committee on Energy and Commerce (1989).
68. One point worth noting is that there is a fair amount of variation across our drugs in the level of their estimated fixed effects. In the generic price/branded price regression, the standard deviation of the estimated fixed effects is 0.283, while it is 0.091 in the branded market share equation. We made some attempt to explain this variance but were not very successful with the limited number of drug-specific characteristics that we possessed. We did detect some tendency for branded share to decline less the longer the drug was on the market and if it was used for "chronic" conditions. Given more data and better measures of drug characteristics, further exploration of the possibility of differing effects of entry across drugs would seem desirable.
69. This average is slightly lower than the 9.54 reported in the data section for 1987 because here we are using NN, which for any year t is an average of the number of approved generic producers for years t and t - 1.
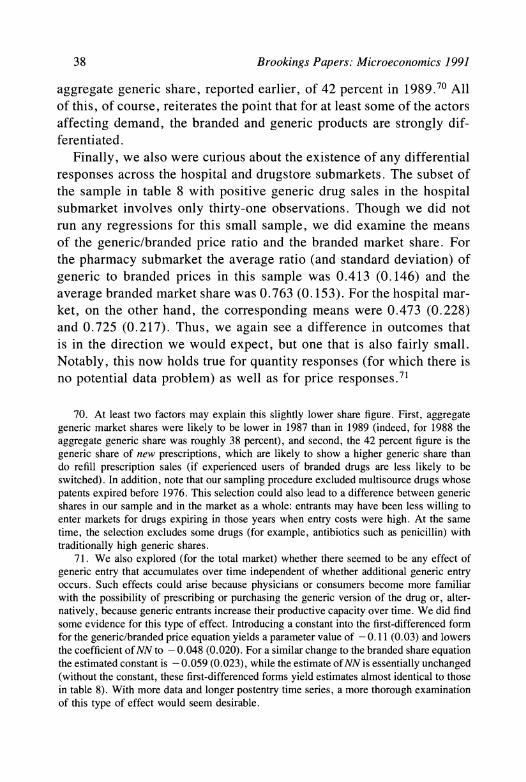
38 Brookings Papers: Microeconomics 1991
aggregate generic share, reported earlier, of 42 percent in 1989.70 All of this, of course, reiterates the point that for at least some of the actors affecting demand, the branded and generic products are strongly dif- ferentiated.
Finally, we also were curious about the existence of any differential responses across the hospital and drugstore submarkets. The subset of the sample in table 8 with positive generic drug sales in the hospital submarket involves only thirty-one observations. Though we did not run any regressions for this small sample, we did examine the means of the generic/branded price ratio and the branded market share. For the pharmacy submarket the average ratio (and standard deviation) of generic to branded prices in this sample was 0.413 (0.146) and the average branded market share was 0.763 (0.153). For the hospital mar- ket, on the other hand, the corresponding means were 0.473 (0.228) and 0.725 (0.217). Thus, we again see a difference in outcomes that is in the direction we would expect, but one that is also fairly small. Notably, this now holds true for quantity responses (for which there is no potential data problem) as well as for price responses.71
70. At least two factors may explain this slightly lower share figure. First, aggregate generic market shares were likely to be lower in 1987 than in 1989 (indeed, for 1988 the aggregate generic share was roughly 38 percent), and second, the 42 percent figure is the generic share of new prescriptions, which are likely to show a higher generic share than do refill prescription sales (if experienced users of branded drugs are less likely to be switched). In addition, note that our sampling procedure excluded multisource drugs whose patents expired before 1976. This selection could also lead to a difference between generic shares in our sample and in the market as a whole: entrants may have been less willing to enter markets for drugs expiring in those years when entry costs were high. At the same time, the selection excludes some drugs (for example, antibiotics such as penicillin) with traditionally high generic shares.
71. We also explored (for the total market) whether there seemed to be any effect of generic entry that accumulates over time independent of whether additional generic entry occurs. Such effects could arise because physicians or consumers become more familiar with the possibility of prescribing or purchasing the generic version of the drug or, alter- natively, because generic entrants increase their productive capacity over time. We did find some evidence for this type of effect. Introducing a constant into the first-differenced form for the generic/branded price equation yields a parameter value of - 0. 11 (0. 03) and lowers the coefficient of NN to - 0.048 (0.020). For a similar change to the branded share equation the estimated constant is - 0.059 (0.023), while the estimate of NN is essentially unchanged (without the constant, these first-differenced forms yield estimates almost identical to those in table 8). With more data and longer postentry time series, a more thorough examination of this type of effect would seem desirable.
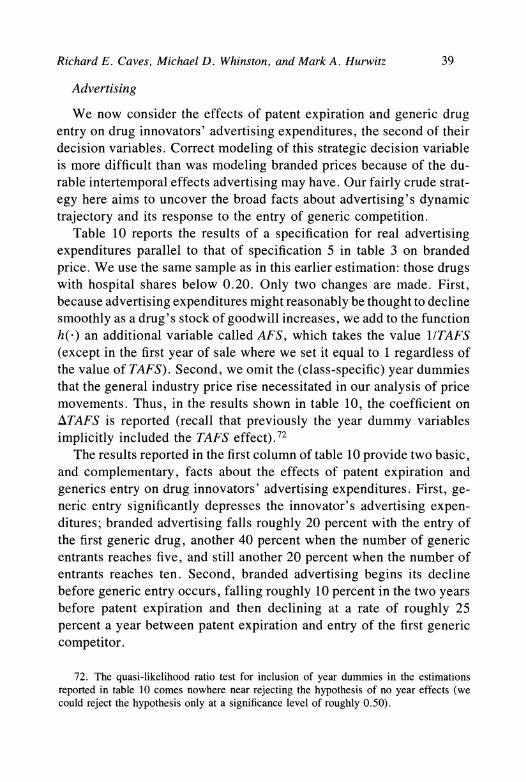
Richard E. Caves, Michael D. Whinston, and Mark A. Hurwitz 39
Advertising
We now consider the effects of patent expiration and generic drug entry on drug innovators' advertising expenditures, the second of their decision variables. Correct modeling of this strategic decision variable is more difficult than was modeling branded prices because of the du- rable intertemporal effects advertising may have. Our fairly crude strat- egy here aims to uncover the broad facts about advertising's dynamic trajectory and its response to the entry of generic competition.
Table 10 reports the results of a specification for real advertising expenditures parallel to that of specification 5 in table 3 on branded price. We use the same sample as in this earlier estimation: those drugs with hospital shares below 0.20. Only two changes are made. First, because advertising expenditures might reasonably be thought to decline smoothly as a drug's stock of goodwill increases, we add to the function h(-) an additional variable called AFS, which takes the value 1/TAFS (except in the first year of sale where we set it equal to 1 regardless of the value of TAFS). Second, we omit the (class-specific) year dummies that the general industry price rise necessitated in our analysis of price movements. Thus, in the results shown in table 10, the coefficient on ATAFS is reported (recall that previously the year dummy variables implicitly included the TAFS effect).72
The results reported in the first column of table 10 provide two basic, and complementary, facts about the effects of patent expiration and generics entry on drug innovators' advertising expenditures. First, ge- neric entry significantly depresses the innovator's advertising expen- ditures; branded advertising falls roughly 20 percent with the entry of the first generic drug, another 40 percent when the number of generic entrants reaches five, and still another 20 percent when the number of entrants reaches ten. Second, branded advertising begins its decline before generic entry occurs, falling roughly 10 percent in the two years before patent expiration and then declining at a rate of roughly 25 percent a year between patent expiration and entry of the first generic competitor.
72. The quasi-likelihood ratio test for inclusion of year dummies in the estimations reported in table 10 comes nowhere near rejecting the hypothesis of no year effects (we could reject the hypothesis only at a significance level of roughly 0.50).
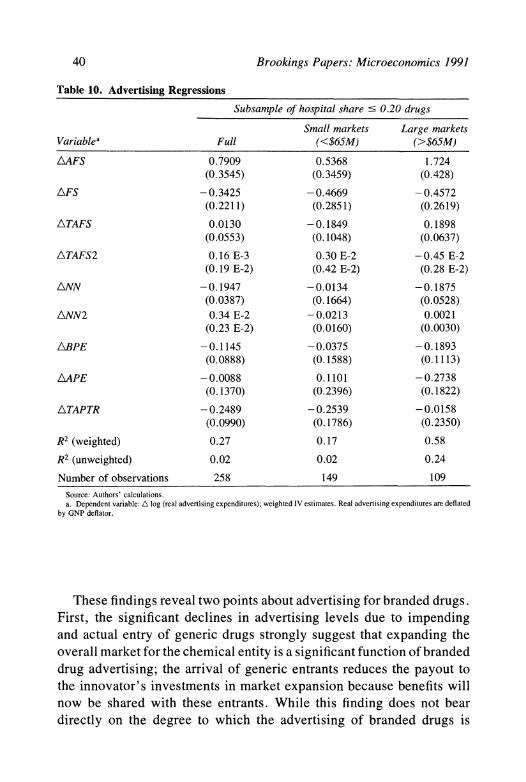
40 Brookings Papers: Microeconomics 1991
Table 10. Advertising Regressions
Subsample of hospital share ' 0.20 drugs
Small markets Large markets Variablea Full (<$65M) (>$65M)
AAFS 0.7909 0.5368 1.724 (0.3545) (0.3459) (0.428)
AFS -0.3425 -0.4669 -0.4572 (0.2211) (0.2851) (0.2619)
ATAFS 0.0130 -0.1849 0.1898 (0.0553) (0.1048) (0.0637)
ATAFS2 0.16 E-3 0.30 E-2 -0.45 E-2 (0.19 E-2) (0.42 E-2) (0.28 E-2)
ANN -0.1947 -0.0134 -0.1875 (0.0387) (0.1664) (0.0528)
ANN2 0.34 E-2 -0.0213 0.0021 (0.23 E-2) (0.0160) (0.0030)
ABPE -0.1145 -0.0375 -0.1893 (0.0888) (0.1588) (0.1113)
AAPE -0.0088 0.1101 -0.2738 (0.1370) (0.2396) (0.1822)
ATAPTR -0.2489 -0.2539 -0.0158 (0.0990) (0.1786) (0.2350)
R2 (weighted) 0.27 0.17 0.58
R2 (unweighted) 0.02 0.02 0.24
Number of observations 258 149 109
Source: Authors' calculations. a. Dependent variable: A log (real advertising expenditures); weighted IV estimates. Real advertising expenditures are deflated
by GNP deflator.
These findings reveal two points about advertising for branded drugs. First, the significant declines in advertising levels due to impending and actual entry of generic drugs strongly suggest that expanding the overall market for the chemical entity is a significant function of branded drug advertising; the arrival of generic entrants reduces the payout to the innovator's investments in market expansion because benefits will now be shared with these entrants. While this finding does not bear directly on the degree to which the advertising of branded drugs is
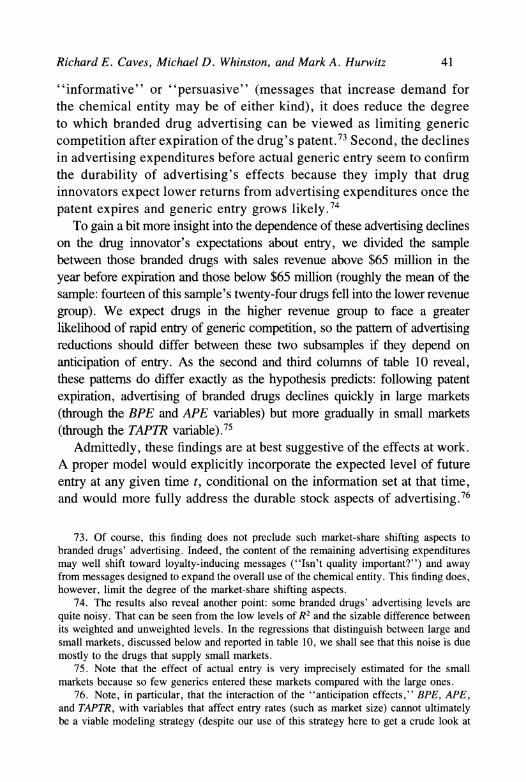
Richard E. Caves, Michael D. Whinston, and Mark A. Hurwitz 41
"informative" or "persuasive" (messages that increase demand for the chemical entity may be of either kind), it does reduce the degree to which branded drug advertising can be viewed as limiting generic competition after expiration of the drug's patent.73 Second, the declines in advertising expenditures before actual generic entry seem to confirm the durability of advertising's effects because they imply that drug innovators expect lower returns from advertising expenditures once the patent expires and generic entry grows likely.74
To gain a bit more insight into the dependence of these advertising declines on the drug innovator's expectations about entry, we divided the sample between those branded drugs with sales revenue above $65 million in the year before expiration and those below $65 million (roughly the mean of the sample: fourteen of this sample's twenty-four drugs fell into the lower revenue group). We expect drugs in the higher revenue group to face a greater likelihood of rapid entry of generic competition, so the pattern of advertising reductions should differ between these two subsamples if they depend on anticipation of entry. As the second and third columns of table 10 reveal, these patterns do differ exactly as the hypothesis predicts: following patent expiration, advertising of branded drugs declines quickly in large markets (through the BPE and APE variables) but more gradually in small markets (through the TAPTR variable).75
Admittedly, these findings are at best suggestive of the effects at work. A proper model would explicitly incorporate the expected level of future entry at any given time t, conditional on the information set at that time, and would more fully address the durable stock aspects of advertising.76
73. Of course, this finding does not preclude such market-share shifting aspects to branded drugs' advertising. Indeed, the content of the remaining advertising expenditures may well shift toward loyalty-inducing messages ("Isn't quality important?") and away from messages designed to expand the overall use of the chemical entity. This finding does, however, limit the degree of the market-share shifting aspects.
74. The results also reveal another point: some branded drugs' advertising levels are quite noisy. That can be seen from the low levels of R2 and the sizable difference between its weighted and unweighted levels. In the regressions that distinguish between large and small markets, discussed below and reported in table 10, we shall see that this noise is due mostly to the drugs that supply small markets.
75. Note that the effect of actual entry is very imprecisely estimated for the small markets because so few generics entered these markets compared with the large ones.
76. Note, in particular, that the interaction of the "anticipation effects," BPE, APE, and TAPTR, with variables that affect entry rates (such as market size) cannot ultimately be a viable modeling strategy (despite our use of this strategy here to get a crude look at
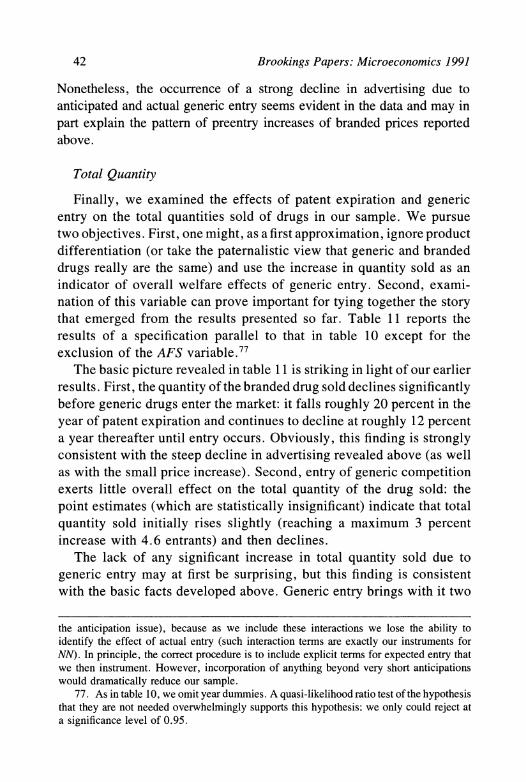
42 Brookings Papers: Microeconomics 1991
Nonetheless, the occurrence of a strong decline in advertising due to anticipated and actual generic entry seems evident in the data and may in part explain the pattern of preentry increases of branded prices reported above.
Total Quantity
Finally, we examined the effects of patent expiration and generic entry on the total quantities sold of drugs in our sample. We pursue two objectives. First, one might, as a first approximation, ignore product differentiation (or take the paternalistic view that generic and branded drugs really are the same) and use the increase in quantity sold as an indicator of overall welfare effects of generic entry. Second, exami- nation of this variable can prove important for tying together the story that emerged from the results presented so far. Table 11 reports the results of a specification parallel to that in table 10 except for the exclusion of the AFS variable.77
The basic picture revealed in table 11 is striking in light of our earlier results. First, the quantity of the branded drug sold declines significantly before generic drugs enter the market: it falls roughly 20 percent in the year of patent expiration and continues to decline at roughly 12 percent a year thereafter until entry occurs. Obviously, this finding is strongly consistent with the steep decline in advertising revealed above (as well as with the small price increase). Second, entry of generic competition exerts little overall effect on the total quantity of the drug sold: the point estimates (which are statistically insignificant) indicate that total quantity sold initially rises slightly (reaching a maximum 3 percent increase with 4.6 entrants) and then declines.
The lack of any significant increase in total quantity sold due to generic entry may at first be surprising, but this finding is consistent with the basic facts developed above. Generic entry brings with it two
the anticipation issue), because as we include these interactions we lose the ability to identify the effect of actual entry (such interaction terms are exactly our instruments for NN). In principle, the correct procedure is to include explicit terms for expected entry that we then instrument. However, incorporation of anything beyond very short anticipations would dramatically reduce our sample.
77. As in table 10, we omit year dummies. A quasi-likelihood ratio test of the hypothesis that they are not needed overwhelmingly supports this hypothesis: we only could reject at a significance level of 0.95.
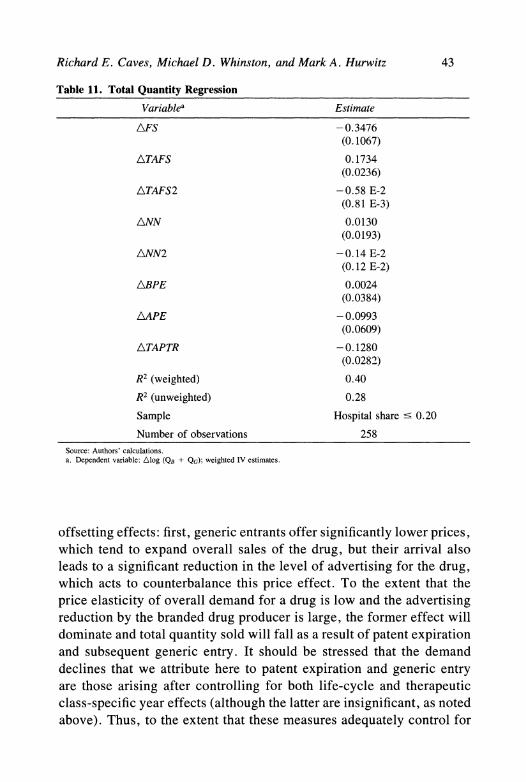
Richard E. Caves, Michael D. Whinston, and Mark A. Hurwitz 43
Table 11. Total Quantity Regression
Variablea Estimate
AFS - 0.3476 (0.1067)
ATAFS 0. 1734 (0.0236)
ATAFS2 -0.58 E-2 (0.81 E-3)
ANN 0.0130 (0.0193)
ANN2 -0.14 E-2 (0. 12 E-2)
ABPE 0.0024 (0.0384)
AAPE -0.0993 (0.0609)
ATAPTR -0. 1280 (0.0282)
R2 (weighted) 0.40
R2 (unweighted) 0.28
Sample Hospital share ? 0.20
Number of observations 258 Source: Authors' calculations. a. Dependent variable: Alog (QB + QG); weighted IV estimates.
offsetting effects: first, generic entrants offer significantly lower prices, which tend to expand overall sales of the drug, but their arrival also leads to a significant reduction in the level of advertising for the drug, which acts to counterbalance this price effect. To the extent that the price elasticity of overall demand for a drug is low and the advertising reduction by the branded drug producer is large, the former effect will dominate and total quantity sold will fall as a result of patent expiration and subsequent generic entry. It should be stressed that the demand declines that we attribute here to patent expiration and generic entry are those arising after controlling for both life-cycle and therapeutic class-specific year effects (although the latter are insignificant, as noted above). Thus, to the extent that these measures adequately control for
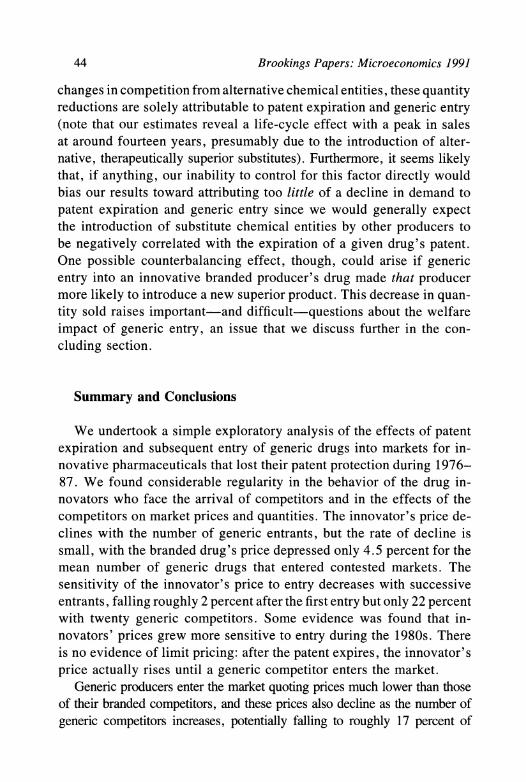
44 Brookings Papers: Microeconomics 1991
changes in competition from alternative chemical entities, these quantity reductions are solely attributable to patent expiration and generic entry (note that our estimates reveal a life-cycle effect with a peak in sales at around fourteen years, presumably due to the introduction of alter- native, therapeutically superior substitutes). Furthermore, it seems likely that, if anything, our inability to control for this factor directly would bias our results toward attributing too little of a decline in demand to patent expiration and generic entry since we would generally expect the introduction of substitute chemical entities by other producers to be negatively correlated with the expiration of a given drug's patent. One possible counterbalancing effect, though, could arise if generic entry into an innovative branded producer's drug made that producer more likely to introduce a new superior product. This decrease in quan- tity sold raises important-and difficult-questions about the welfare impact of generic entry, an issue that we discuss further in the con- cluding section.
Summary and Conclusions
We undertook a simple exploratory analysis of the effects of patent expiration and subsequent entry of generic drugs into markets for in- novative pharmaceuticals that lost their patent protection during 1976- 87. We found considerable regularity in the behavior of the drug in- novators who face the arrival of competitors and in the effects of the competitors on market prices and quantities. The innovator's price de- clines with the number of generic entrants, but the rate of decline is small, with the branded drug's price depressed only 4.5 percent for the mean number of generic drugs that entered contested markets. The sensitivity of the innovator's price to entry decreases with successive entrants, falling roughly 2 percent after the first entry but only 22 percent with twenty generic competitors. Some evidence was found that in- novators' prices grew more sensitive to entry during the 1980s. There is no evidence of limit pricing: after the patent expires, the innovator's price actually rises until a generic competitor enters the market.
Generic producers enter the market quoting prices much lower than those of their branded competitors, and these prices also decline as the number of generic competitors increases, potentially falling to roughly 17 percent of
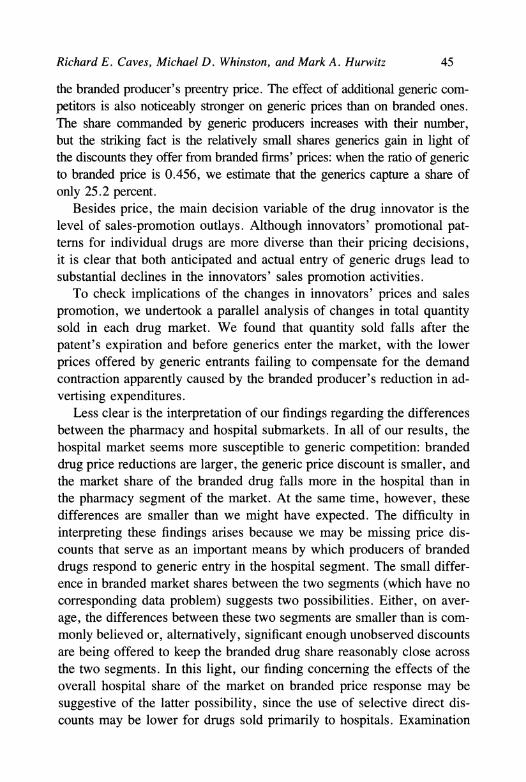
Richard E. Caves, Michael D. Whinston, and Mark A. Hurwitz 45
the branded producer's preentry price. The effect of additional generic com- petitors is also noticeably stronger on generic prices than on branded ones. The share commanded by generic producers increases with their number, but the striking fact is the relatively small shares generics gain in light of the discounts they offer from branded firms' prices: when the ratio of generic to branded price is 0.456, we estimate that the generics capture a share of only 25.2 percent.
Besides price, the main decision variable of the drug innovator is the level of sales-promotion outlays. Although innovators' promotional pat- terns for individual drugs are more diverse than their pricing decisions, it is clear that both anticipated and actual entry of generic drugs lead to substantial declines in the innovators' sales promotion activities.
To check implications of the changes in innovators' prices and sales promotion, we undertook a parallel analysis of changes in total quantity sold in each drug market. We found that quantity sold falls after the patent's expiration and before generics enter the market, with the lower prices offered by generic entrants failing to compensate for the demand contraction apparently caused by the branded producer's reduction in ad- vertising expenditures.
Less clear is the interpretation of our findings regarding the differences between the pharmacy and hospital submarkets. In all of our results, the hospital market seems more susceptible to generic competition: branded drug price reductions are larger, the generic price discount is smaller, and the market share of the branded drug falls more in the hospital than in the pharmacy segment of the market. At the same time, however, these differences are smaller than we might have expected. The difficulty in interpreting these findings arises because we may be missing price dis- counts that serve as an important means by which producers of branded drugs respond to generic entry in the hospital segment. The small differ- ence in branded market shares between the two segments (which have no corresponding data problem) suggests two possibilities. Either, on aver- age, the differences between these two segments are smaller than is com- monly believed or, alternatively, significant enough unobserved discounts are being offered to keep the branded drug share reasonably close across the two segments. In this light, our finding concerning the effects of the overall hospital share of the market on branded price response may be suggestive of the latter possibility, since the use of selective direct dis- counts may be lower for drugs sold primarily to hospitals. Examination
46 Brookings Papers: Microeconomics 1991
of a sample with a larger set of drugs primarily sold to hospitals might prove helpful in sorting out these hypotheses more definitely.
Implications for Market Behavior and Structure
The research design that yielded these conclusions does not embody any particular model of competitive interaction between producers of branded and generic drugs. Nevertheless, it does seem to suggest a number of preliminary conclusions regarding structure and behavior in these markets. First, the goodwill stock that the drug innovator develops over the course of the period of exclusive marketing clearly seems to provide a significant degree of differentiation from later generic en- trants. The extent of this differentiation can be seen in the relatively small share that generic drug firms achieve despite their significant price discounts, the relatively muted price response of the branded producer to generic entry, and the quite different effects that successive generic entries have on branded and generic prices.
Second, while the branded producer does accumulate loyalty-inducing goodwill during the period of patent protection, the marked decline in promotional activity caused by patent expiration and generic entry, as well as the accompanying decline in quantities sold, suggests that a significant component of sales promotion activity for branded drugs is of the "market expansion" variety. While this fact does not lead to any direct conclusions regarding the relative share of "informative" and "per- suasive" messages in sales promotion activities for branded drugs, it does reduce the extent to which those activities can be viewed as limiting the opportunities faced by generic competitors. One possible reading of these two findings is that the advantage achieved by the innovative drug relative to later generic entrants is in large part tied to doctors' habitual use of the brand name; after generic entry, however, a large share of possible pro- motional activities by the branded producer would have positive spillovers to generic producers, not only by increasing prescriptions written for generics, but also through generic substitution of brand-written prescrip- tions.
Third, we see little in this evidence that suggests any very active attempt by producers of branded drugs to deter the entry of rivals. Although such concerns about deterrence may still affect branded producers' prices and
Richard E. Caves, Michael D. Whinston, and Mark A. Hurwitz 47
advertising levels on the margin, the overall response seems to be one that takes the likely extent of entry as given and optimizes accordingly.
Implications for Public Policy
In undertaking this analysis, we sought to contribute to the debate on "innovation vs. competition" by providing additional evidence on the effects of postpatent competition. One of the aspects of our results that perhaps most surprises us is the ultimate ambiguity they yield regarding the welfare effects of this competition. As we expected when we began our study, generic entry makes a drug available at much lower prices than prevailed during its period of patent protection. Yet it does not significantly lower the prices of branded drugs and, even more importantly, it does not lead to increases in the quantities of the con- tested drug that are sold. Indeed, quantities may decrease relative to those sold before patent expiration. While this fact may be in part related to the presence of low demand elasticities for these drugs, we suspect that the decline in advertising expenditures on branded drugs is an important factor in this finding. Thus, in the end, it appears that any evaluation of the welfare impact of generic entry must inevitably address the difficult question of the welfare properties of advertising for branded drugs. In particular, it seems that the welfare consequences of generic entry are ultimately closely tied to the degree to which promotion by innovative pharmaceutical manufacturers is informative rather than per- suasive.78
Directions for Further Research
Like most studies, ours fails to preempt opportunities for further research. We see at least three desirable directions for further study.
78. This discussion has focused only on the welfare impact of generic entry gross of any fixed entry costs. A second welfare concern surrounds the issue of whether there is excess entry of generics relative to these fixed costs. See, for example, Mankiw and Whinston (1986). The relatively small increases in overall generic market share achieved as the number of generic competitors increases might suggest some concern in this regard. The lowering of these fixed entry costs that accompanied the passage of the Waxman-Hatch Act, however, seems likely to have lowered the extent of any welfare losses arising from this problem, as discussed in Mankiw and Whinston (1986).
48 Brookings Papers: Microeconomics 1991
The first is a more structural empirical modeling of the competitive interaction in these drug markets. Clearly, a number of questions whose answers we desire can be addressed only through such an approach. (For example, what is the elasticity of demand for these drugs? What is the cross-elasticity between branded and generic drugs? What model of competitive interaction best describes behavior here?) We hope the results we have described can serve as a useful guide to such efforts by narrowing down the set of reasonable structural models.
Second, in all of the preceding analysis we took a drug "market" to consist of the demand for a single chemical entity. As we noted earlier, however, various chemical entities are in fact substitutes for other chemical entities for a variety of conditions and in varying de- grees. While our study employs a number of direct controls for such changes in competitive conditions, explicit consideration of the effects of this differentiated product structure on competition in the pharma- ceutical industry seems desirable.
Finally, in this paper we have addressed the competition that arises as patents expire and generic entry occurs without any explicit exam- ination of the process of entry itself. As in the work of Bresnahan and Reiss, and Berry, such an examination can provide another source of information about the market opportunities of generic firms.79 Of ad- ditional interest is the assessment it could provide of the impact that the Waxman-Hatch Act has had on the extent of generic entry, an impact that is difficult to discern directly from table 2 because of the generally larger sizes of the markets whose patents expired in the latter part of our sample. In contrast to the work of Bresnahan and Reiss, and Berry, however, here a proper model of this phenomenon will need to take account of the explicitly dynamic process by which entrants flow into a drug market after the drug's patent has expired.
79. Bresnahan and Reiss (1990); and Berry (1990).
Comments and Discussion
Comment by Ariel Pakes: This paper is the first cut at analyzing the data on an interesting and important problem. This problem is "cleaner" than most related industrial organization problems for several reasons. First, there is a legal monopoly for the first T years of the product's existence, and then free entry occurs at a fixed sunk cost thereafter (the cost of approval by the Federal Drug Administration), giving us a well- defined set of rules to determine possible market interactions. Second, we are probably willing to believe that there are common and fairly constant costs of production for the drugs being sold. Third, after in- troduction of the branded drug, there seems to be only one major type of investment (advertising), and we have reasonably detailed data on it. There is, however, a difficult set of economic problems in modeling demand and in defining precisely what we mean by "brand loyalty." I come back to this concern later in my comments, but I would like to say at the outset that we probably do not have much chance of gaining a more detailed understanding of demand without data that follow in- dividual doctors, or users, over time. So at least at this level of gen- erality we are going to have to make some simplistic approximations.
The authors have, rightly in my opinion, started with an intuitive "reduced-form" analysis. One can do this in many ways. Clearly theirs has been careful and productive. I have only two comments on what has actually been done. First, I did not understand the logic of elimi- nating therapeutic class-specific time effects. It is hard to believe that much of the variance in movements over time in these effects is caused by changes in production cost (and what there is could probably be handled in a much less drastic way), so I am worried that they are eliminating precisely that part of the variance that their models ought
49
50 Brookings Papers: Microeconomics 1991
to be explaining. Second, given the efforts of the authors to limit themselves to using only exogenous instruments, I was surprised to see market size before patent expiration on the instrument list, as it is at least partly determined by past investments or by the factors that cause past investments and future entry.
As I read the paper, I asked myself some additional questions. I will share two of them with you-but keep in mind that the authors cannot put every piece of empirical analysis in a finite paper. First, I would have liked to know more about the relationships between the equations estimated. We are getting R2's in the various equations of around 0.4, so 60 percent of the variance is unexplained. One would like to know whether the same factors are causing the unexplained variance in all equations or whether the variance from the unobserved factors looks more like noise. I would have looked at a system of at least five equa- tions: an equation for price to drugstore, an equation for price to hos- pitals, equations for quantities demanded for the two submarkets, and an equation for advertising. This system would have allowed the authors to analyze, for example, whether the (unobserved) factors that generate increases in drugstore prices are related to the factors that cause in- creases in prices to the hospital market. The authors could also analyze whether the price and quantity changes in the pharmacy market are more closely related to advertising changes than those in the hospital market are. Finally, this type of residual analysis could have been extended to provide insights into the nature of the dynamics being studied. For example, Granger-type tests could have been used to ana- lyze whether unobserved changes in advertising preceded the unob- served changes in quantities and prices and whether there was feedback from quantity and price changes to advertising. These procedures are much in the spirit of the reduced-form analysis in the current paper and could have provided some useful insights.
I think it would also have been useful to work with a "reduced- form" entry equation directly. The authors mention this equation as a possibility for future study, but some of the more simple analysis of the determinants of the time to first entry, and, possibly, the quantity of entry in the first few periods, might have provided some facts that would have been useful for the subsequent analysis (for example, Did the entry process seem to change as a result of the Waxman-Hatch act?
Richard E. Caves, Michael D. Whinston, and Mark A. Hurwitz 51
Does the share of hospital to drugstore sales of the branded drug affect entry?, and so on).
Finally, I would have liked more information on the relationship of hospital share to advertising and more detail on the distribution of different characteristics (in contrast to sufficing with the mean). This need for information is particularly true regarding the relationship of the price of generics to the price of branded alternatives (are generics always a lot cheaper, or is there significant variance that might be attributable to more detailed economic analysis?), and of the relation- ship of the price of branded drugs to hospitals to the price of branded drugs to drugstores.
The authors have done a good job of summarizing their basic findings, so there is no need for me to be repetitious. However, I would like to stress a few results because of their impact on subsequent model choice. First, as Michael Whinston stressed in his discussions with me, there is a lot of dispersion when the generics enter as well as dispersion in the quantities of generics. Though there is a problem of truncation here, it seems that the data favor a mode for the entry distribution at about three to four years after patent expiration. One can apply for approval for the generic before the expiration of the patent on the branded al- ternative, so the first moment of the FDA approval lag should not, in itself, cause this kind of delay in the entry process, though some of it may be explained by variance in the time of approval. I would have liked more information on the amount of that variance. We seem, therefore, to be largely left with explanations for the delay in the timing of entry that stem from uncertainty about the value of the generic (because of the possible appearance of substitute drugs, uncertainty in the extent of attachment to the branded alternative, or, possibly, general uncertainty about demand conditions). The uncertainty would allow for a generic, which looked marginally unprofitable in one period, to look marginally profitable in the next. To obtain some idea of the nature and importance of such uncertainty, it might have been useful to know if any of the new entrants failed and exited shortly after entering-or, more generally, to know something about the distribution of profits actually earned by the new entrants. There are references in the paper to the availability of such information, but none is really presented. If my reading is correct, however, a model that accounts for the data is
52 Brookings Papers: Microeconomics 1991
going to need something to generate uncertainty in the profit streams that accrue to entrants.
Second, in subsequent modeling, the difference in behavior between the hospital and drugstore markets should be noted. That part of the analysis that is done separately for the two markets reveals substantial differences in coefficients, and this difference mirrors the differences in the nature of demand in the two markets that the authors stress in the paper. Thus the focus should be on models that allow for such differences. Moreover the existence of the two submarkets gives one a natural experiment for the econometric analysis-cost conditions in the two submarkets are the same, and only demand differs.
Let me now turn to one of the tasks the authors have given themselves for subsequent analysis and for which they requested some input from me: providing an estimable structural model, which would seem to be broadly consistent with the facts, and, if estimated, allow one to provide a more detailed interpretation of the data. The model I am going to sketch is a variant of a model developed by Rick Ericson and me, and the idea of using this model to study entry in the generic drug market was suggested to me by my colleague, Steve Berry, who has been exploring related possibilities with Nancy Lutz.80
As already noted, there are difficult questions to handle in modeling demand. If we had more microlevel data, we would probably want a structural model of "brand loyalty"; that is, one where there was an estimable direct effect of advertising and past purchases on today's preferences. At the current level of aggregation, we probably can only go after shifts in the distribution of preferences over consumers, so we may as well stay within a simpler, more "reduced-form" framework in which we simply try to estimate the effect of advertising on that distribution. That is, if UjJ provides the utility of consumer i from consuming drug j, then let
Uij = Vj -P. + Eij,
where pj* is the price of good j, vj is the mean of different individuals' perceived utility from the drug (movements over time will be deter- mined, in part, by advertising expenditures), and the vector (n,l,- --,Ej,N) is independently distributed over agents (indexed by i; this
80. Ericson and Pakes (1989); and Berry and Lutz (1989).
Richard E. Caves, Michael D. Whinston, and Mark A. Hurwitz 53
distribution is assumed known up to a parameter vector, which is to be estimated).
For simplicity I will work with only one market, though, as noted, the empirical analysis should clearly distinguish between the pharmacy and the hospital submarkets. Consider first the period of patent protec- tion. In this period there are only three alternatives for the patient. He or she can either consume the patented drug (the j = 1 alternative), consume a drug that is not bioequivalent (the j = 2 alternative), or not purchase a drug at all. Initially assume that there is a fixed quantity of prescribed drugs (M) independent of pricing decisions. (This framework is extended below to allow for many choices, and then it is easy to allow for the no-choice alternative.) The consumer i chooses drug j if
E2j - Elj -
VI - V2 -(PI - P2) =-'-1 - Pi,
so that the demand for the product is
D(w,p) = M>U-PdF(EI - E2) = MF(w-p).
Note that the elasticity of demand with respect to price is
[aF(ap]/F() -f= -p)IF(w-p),
which will be small at points in which the density is small relative to the cumulative distribution (then few people change their choices as a result of the change in price). One would expect this to happen when w is large so that we are in the "tail of the distribution" of consumers.
The producer chooses price to maximize profits, or
,rr(w) = maxp { M F(w-p) [p-c]},
so that
p = c + F(w-p)/f(w-p),
and price cost margins will be large when the demand elasticity is small or in the tail case discussed above. The price cost margin will depend on the value of w and will fluctuate over time as w fluctuates. This, and the related effect on demand, will allow us to estimate the impact of advertising on w. (Second-order conditions will be satisfied provided that af() ' 0).
Given price, quantity is determined from demand, and the combi-
54 Brookings Papers: Microeconomics 1991
nation of price and quantity gives us r()r. So that is all we need for the static profit function. This is a simple model of the differentiated product model derived and analyzed in Berry and in Berry, Levinson, and Pakes.81 These papers show how the parameters determining static prof- its (M, c, and the parameters of the distribution of e) can be estimated from information on price and quantity sold.
For the dynamics two stories are needed. One is the effect of ad- vertising on w, and the other is the effect of advertising for the branded good on the perceived quality index of a generic substitute. We let the perceived quality of a generic, if it were to be introduced in the current period, be w*. Then, for period t<T, where T is the statutory limit to patent protection, the value of the firm is determined by the recursion
V(w,w* ;t) = max{cf,sup,L[r(w) - c(x) + IBE(o) ,X*,V(w ,w*' ,t
+ 1)p(WI w,x)p(w *Iw*,x)]},
where (F is the alternative value of the capital resources involved in producing the branded drug, and x is the quantity of advertising ex- penditures. Here (F is what the firm gets if it exits the market (allowing for this possibility becomes more important once we allow for entry of generics), and advertising expenditures affect the conditional distri- butions of both w, and of w* tomorrow, conditional on their values today. The effect of advertising on w* is the market expansion effect discussed by the authors in the paper.
Note that w* affects the value of the branded drug even though it does not affect current profits. This result occurs because the value of
* at the time the patent expires and thereafter will determine profits in those years. As a result the firms' advertising expenditures will be determined with both the effect of x on w and its effect on w * in mind, and, as noted by the authors, we might well expect it to decline in dates before patent expiration (because then the effect of w* on profits are more immediate).
The density functions p( determine the nature of the dynamics. Recall that the only thing that affects individual choices is the difference between the utility from the branded good and the utility from the nonbioequivalent alternative. Thus the evolution of w is determined as
81. Berry (1991); and Berry, Levinsohn, and Pakes (1990).
Richard E. Caves, Michael D. Whinston, and Mark A. Hurwitz 55
a convolution (the difference) of two processes. One is an exogenous process determining the evolution of the nonbioequivalent substitutes. This evolution determines the extent to which other drugs are likely to be developed, which either partly or totally substitutes for the use of this drug. It also provides an exogenous source of uncertainty that might help explain the observed differences in entry dates. The other process provides the effect of advertising on the perceived quality of the branded drug. Both of these processes are known up to a vector of parameters to be estimated.
The parameters determining p(w'jw,x) can be estimated from the evolution of price and quantity. To estimate the parameters determining
p(w*lw,x) from data in the preentry period, we would need to use the data on advertising expenditures. There are two ways to go, but one is much more simple computationally. The simpler procedure is to derive a Euler equation for advertising expenditures which, when combined with the information the price and the quantity series gives us on the effect of advertising on w, gives us the parameters determining the effect of advertising on w * (the harder, though more efficient, procedure would be to derive the implications of different values of the parameter vector on the levels of advertising and then fit those predictions directly to the data on advertising). For the simpler procedure we need a Euler equation for a model that allows for uncertainty in the outcomes of the investment process, that is, for a model with "stochastic accumula- tion. "82 The postentry data have more direct information on the effect of advertising on w *, though one may want to allow for difference in that effect in the pre- and postentry periods.
Next consider modeling the post-patent-protection market. The profit function changes once entry occurs, and the possibility of entry changes the nature of the functional equation, which determines the expected discounted value of future net cash flows. The profit function for the many marketed goods case is derived in exactly the same way as the profit function above. That is, each consumer chooses the drug that maximizes utility conditional on the w and the price vectors of all competitors. Each firm chooses its price to maximize profits conditional on the price of its competitors and on demand conditions. Under certain conditions one can show that this process produces a unique Nash
82. These models are developed in Pakes (1991).
56 Brookings Papers: Microeconomics 1991
equilibrium in prices, and estimates of the relevant parameters can be obtained by using the methods discussed in the literature cited above.83
To finish the dynamic story we need a model for how entry actually occurs after patent expiration. Different models could be fit into the current framework. A simple starting point would require entrants to sink K dollars to apply for FDA approval and obtain approval at some random stopping time T thereafter. At that point they enter at the w *
prevalent at T. Entrants sink their K dollars sequentially, and new en- trants enter until the expected discounted value of net returns from the next investment is less than the cost of entry.
Once a generic enters, it can also invest in advertising to increase its w. Of course whether or not it will, and whether or not there will be more entry, is determined by the actions of all competitors (since the profits a given investment will bring depend on the future distri- bution of 's among competitors). So we need an equilibrium concept for the dynamic interactions. The easiest assumption to start with is that there is also a Nash equilibrium in investment and entry policies.84
Now we can fit everything together. Conditional on a given function for V(w, w*;T), we can compute the value function for t= 1,...,T by the backward recursion given above. The needed V(w,w*:T) function can be computed by modifying the techniques and program provided in Pakes and McGuire to allow for random entry times and locations. 85 Though this program is complicated, it is already up and running, so using it poses no real additional difficulties. Of course the results of the computations will depend on the value of the parameter vector fed into it, which was the reason for providing the details needed to get estimators in the first place.
What do we get after such a complicated procedure? We have a consistent story that allows us to interpret the interrelationships among advertising, entry, prices, and quantities; how these factors have changed in response to policy changes in the past; and how they would change as a result of possible policy changes in the future. Thus the at least potential empirical importance of various intuitive economic lines of reasoning can be assessed. We can also analyze the effects of the policy
83. Caplin and Nalebuff (1991). 84. Ericson and Pakes (1989) show that at least one such equilibrium exists. 85. Pakes and McGuire (1991).
Richard E. Caves, Michael D. Whinston, and Mark A. Hurwitz 57
changes that have occurred in the time covered by the data, including the Waxman-Hatch act and the institution of renewal fees on patents. The model is not only rich enough to calculate effects on prices, quan- tities, advertising, and so on, but it can also be used to calculate the effects of the change on the welfare derived from the drugs that have been produced. 86 These calculations do not, however, capture the effect of the change in the environment on the amount of research done by the drug companies, that is, the incentive effects on research (though we can calculate the effect of the change in the environment on the profits of marketed drugs).
Finally we can also evaluate the effects of policy changes that might be feasible in the future. These include possible changes in the cost of obtaining FDA approval (indeed, it may well be the case that we should be subsidizing generic entry), the time that needs to be spent before that approval can be obtained, changes in the statutory limit to the length of patent lives, and changes in institutional structure that affect either the cost or the efficacy of advertising.
Of course, the quality of all of our analysis will depend on the quality of our estimates, and robustness analysis will be needed. However, these issues are very complicated, and it is unlikely that one can figure out the interrelationship between policy in this area and its implications without some coherent, logical framework.
Comment by Peter Temin: This paper takes aim at one of the most difficult markets for economists to understand. The market for phar- maceutical drugs does not fulfill many of the conditions necessary to a well-functioning market, and it has been a difficult market to model.
Many of the problems are common to the various markets involving health, but some are unique to drugs. Two in particular may be used as a summary. First, the market for prescription drugs is characterized by pervasive uncertainty. By definition, these drugs are chosen by one group of people (physicians) and purchased and consumed by another (patients). I documented the extreme difficulty any physician would have in informing himself or herself about choices between drugs. 87
And, as Richard Caves, Michael Whinston, and Mark Hurwitz docu-
86. See Pakes and McGuire (1991) for examples of such calculations. 87. Temin (1980).
58 Brookings Papers: Microeconomics 1991
ment, the pace of change is rapid. For all these reasons, information relevant to the choice between drugs and between suppliers of drugs is scarce. Second, a complex and multilayered regulatory structure has been constructed to deal with this uncertainty. Regulation removes some of the hazards arising from scarce information, but it creates problems of its own.
Caves, Whinston, and Hurwitz have resisted the impulse to propose a fancy model of this complex industry and then see if there is any reason to believe it. Instead, they have started from the data and at- tempted to construct some "stylized facts" for model-builders to use. The new data collected and analyzed by these authors expand our knowl- edge of competition in prescription drugs.
The data come, as data on this industry generally do, from IMS America. We must be grateful to this data-collecting firm for its en- couragement of academic research. And we also need to ask about the appropriateness of the data used by Caves, Whinston, and Hurwitz. Keflin seems to be an outlier in the proportion of sales to hospitals. Are there other outliers in other dimensions? In particular, in light of the product life of drugs described in the paper, it would be interesting to know about newer drugs that compete with the sample. Caves, Whin- ston, and Hurwitz say it is hard to know which drugs are competitors, but it cannot be impossible. They also discuss the problems of distin- guishing distributors and manufacturers, but they assume this veil is transparent to pharmacists. Is it actually so sheer?
Caves, Whinston, and Hurwitz distill "two basic facts" from the aggregate data. They characterize generic substitution as "relatively infrequent," restricted to 29 percent of multisource brand-written pre- scriptions. The force of this observation is that doctors and pharma- cists-faced with a choice-do not exercise it.
The data reveal a more complex pattern. Twenty percent of pre- scriptions for multisource drugs are generic; 20 percent prohibit sub- stitution. Only 60 percent therefore are up for grabs at the pharmacy. About 40 percent of these prescriptions are filled with generic drugs. In other words, doctors make explicit choices in 40 percent of pre- scriptions for multisource drugs, dividing equally between brand name and generic. Pharmacists make the choice in the remaining 60 percent, dividing their choices 60-40 in favor of the brand-name drugs.
Caves, Whinston, and Hurwitz attempt to explain this variation as
Richard E. Caves, Michael D. Whinston, and Mark A. Hurwitz 59
a function of hospital sales, age, and generics. Other variables might also be important. For example, does important variation come from differences between drugs? Caves, Whinston, and Hurwitz could dis- aggregate their sample by drugs and provide a partial answer. Does the variation come from differences between states? Caves, Whinston, and Hurwitz note that some of it does. The proportion of multisource brand- name prescriptions when substitution is permitted is 90 percent when doctors have to explicitly rule it out but only 60 percent when it is easy to prohibit it. This discrepancy is well known. Doctors seem to be exquisitely sensitive to small variations in regulations.
Alvin Klevorick mentioned the usefulness of psychology in studies of industrial organization in his comments. In this industry demand can be affected by trivial differences, such as whether the substitutable line is at the bottom or the top of the prescription pad. Economics may not be able to explain this phenomenon. It is hard to know how to treat it in this context.
Less than half of permitted substitutions are made by pharmacists. This variation may be responsive to state rules, particularly on markups. The paper does not talk much about pharmacists, but they exert a powerful influence on generic market shares. Caves, Whinston, and Hurwitz implicitly assume all this is orthogonal to their interests. I am not so sure.
The second basic fact noted by Caves, Whinston, and Hurwitz is that generics have gained market share over time, entirely because of an increase in substitution-a decision of the pharmacist. The industry probably is not in a long-run equilibrium. It may still be in transition from the peak of the patented drug share in the 1950s and 1960s to a new balance of patented and unpatented drugs.
Caves, Whinston, and Hurwitz discern other patterns from their dis- aggregated data. First, total sales of a drug begin to decline just as competition is introduced. This counterintuitive finding comes from the coincidence of two influences. The product cycle of drugs appears to peak at about fourteen years, which is not too far from the effective life of a patent for a prescription drug.
Even though Caves, Whinston, and Hurwitz "found the problem of quantifying the closeness of substitutes a daunting one," the market is aware of new drugs that substitute for old ones. Competing new drugs come on the market at about this time for many of the drugs in their
60 Brookings Papers: Microeconomics 1991
sample. The time trend in the regressions is a proxy for entry of pa- tented, as opposed to generic, drugs. Entry comes, in other words, at both ends of the market.
Second, the price response of branded drugs to new (generic) entry is small. Generic drug prices respond more strongly to entry than brand- name prices. Third, advertising for a specific drug already has started its decline by the time there is entry and is depressed sharply in addition when entry does occur. Fourth, despite the lack of price response of brand-name drugs and despite the reduction of advertising, the market shares for generics remain embarrassingly small. With a price differ- ential of 40 percent, the first generic captures an average market share of 5 percent. With two generic suppliers, the price ratio drops slightly, and their combined market share rises to only 10 percent.
To show how striking this last observation is, let me contrast it with one from another of my favorite industries: telecommunications. With a price differential that has been declining over time from around 10 percent to 2 or 3 percent, "generic" entrants have reduced AT&T's share of interstate telecommunication by about 40 percent.88
As Caves, Whinston, and Hurwitz note, this figure is close to the 42 percent aggregate share that generics hold in the multisource drug market. The low market share of the initial entrants then is a description of the process by which the generic market grew, not a statement about a stable equilibrium. It would be interesting to learn if the path was determined by forces on the demand side (strong brand loyalty) or supply side (low capacity of the initial generic entrants).
Can these curious characteristics be combined into a coherent view of this industry? Here is a rough cut. Competition, let us assume, is an entirely different process for brand-name and generic manufacturers. The differences in prescribing and dispensing patterns noted above are not noise. They are related to characteristics of the market: to the regulation of doctors and compensation of pharmacists. What appears to be variations in a single market is in fact the aggregation of two separate, but related, markets.
The major drug companies engage in Schumpeterian competition in which the rewards are for innovation. Advertising informs the medical community about new innovations. It is socially useful, creating rather
88. Communication Workers of America (1990).
Richard E. Caves, Michael D. Whinston, and Mark A. Hurwitz 61
than diverting demand. Once sales of a particular drug have begun to peak owing to the entry of newer, patented drugs, these firms turn their attention to their own newer discoveries while enjoying lingering rents from their investments in technology and information. Advertising trails off with sales as the expected return to supplying information declines.
Generic drug producers by contrast are commodity producers. They enter the market for a drug as soon as they are allowed. They compete largely with one another on the basis of price. Prices follow a Cournot- like path, approaching marginal cost as more firms enter. Their market expands over a long period of time, accounting for the difference be- tween the regression evidence on newly available generics and generics as a whole.
Two questions arise immediately from this view. First, why do brand- name market shares decay so slowly? In the absence of information generated by consumers, behavior appears to exhibit hysteresis. Even trained professionals act very conservatively in the presence of new suppliers. As Senator Kefauver said thirty years ago, their incentives to save other people's money are not strong. Supply constraints may also add to these demand-dominated delays. In the long run, regulation determines whether price will be set near marginal costs or not. In the short run, history rules.
Second, why does regulation permit generic entry just as the market for a typical drug begins to decline? Legislative histories tend to pit worthy consumers against venal drug manufacturers. A more sophis- ticated view might search for bargains that are mutually beneficial. Drug companies have become adept at using regulatory rules and at influencing Congress to shape these rules. They may well have been iterating toward a profit-maximizing patent length, conditional on the life cycle of individual drugs. Conditional, that is, on the rate of entry of new patented drugs. Caves, Whinston, and Hurwitz argue that the suppliers of brand-name drugs do not use price to deter entry. They may, however, use regulation.
Third, what determines the markup of brand-name drugs during the monopoly period? If generic prices do in fact approach marginal costs as the number of generic suppliers increases and if marginal costs do not change rapidly, then it should be possible to estimate the brand- name suppliers' marginal costs of production. The markup of prices over marginal costs could be combined with the estimated cost of in-
62 Brookings Papers: Microeconomics 1991
troducing a drug to calculate a rough rate of return. Alternatively, the markup might be used to infer the elasticity of demand. (This exercise is hazardous in light of the well-known difficulty of estimating well- behaved demand curves for prescription drugs.) Caves, Whinston, and Hurwitz make a start down this road, but they do not travel very far.
Caves, Whinston, and Hurwitz have provided a useful step in the iterative process of discovery. It would be interesting to have simple models of some implications of their observations, such as the ones described here, that could lead to further empirical work. The "(semi-) reduced form relationships" estimated by Caves, Whinston, and Hurwitz are intriguing and tantalizing. The next step is to impose a bit more structure on our thinking and the data.
General Discussion: Several participants commented on the potential social welfare benefits arising from generic drug entry. Ralph Landau made several points with respect to this issue. First, he noted that many drugs produced generically are soon replaced by improved patented drugs, thereby reducing the total welfare benefit from generics. Second, he pointed out that the suspect quality of some generics, an issue re- cently highlighted in the media, would clearly have a negative impact on their social benefit. Finally, he observed that the authors' paper relies on wholesale prices. He suspected that cost reductions in drugs brought about by generic entry are not being passed along to the con- sumer, but are instead being captured by other segments of the system, including pharmacies.
George Borts asserted that the welfare benefits of generic entry might be substantial. He said that if one assumes a simple model with a linear demand curve and zero marginal cost, an "entrant [can] provide the consumer with as much as 25 percent of the area under the demand curve. "
Zvi Griliches asserted that the fact that entry by generics does not increase total demand for that particular drug is not surprising. He said that such entry occurs in markets that are fifteen to twenty years old- markets in which the product is in the mature phase of its life cycle.
Several participants also commented on the relationship between advertising and pharmaceutical demand. Lawrence White disagreed with the authors' claim that brand drug advertising drops off as a result of anticipation of future entry by generics. He said that such a drop off
Richard E. Caves, Michael D. Whinston, and Mark A. Hurwitz 63
was more likely the result of increased competition by substitute brand drugs. Timothy Bresnahan disagreed with White, claiming that the behavior of advertising was indicative of either very high returns to scale or some change in the private return to advertising not related to competition.
Nancy Rose believed that changes in the demand for a particular brand drug are most likely driven by the rise of a substitute brand drug. She wondered whether the entry of patented alternative drugs is driven by technology in such a fashion that it takes fourteen or fifteen years for such entry to occur after initial entry in a particular therapeutic class, or whether this entry is an endogenous response to exogenously fixed patent life.
Bronwyn Hall said that the authors' paper might show that hospitals have a significant impact on drug prices. She said that results from the paper, though possibly driven by the effects of one drug (Keflin), sug- gest that generic entry forces substantial pharmaceutical price cuts only in markets where hospitals are big purchasers. Such results, she said, could be attributed to either monopsony power or the fact that hospitals, as direct purchasers of drugs, have an incentive to seek low prices that individual consumers, whose drug purchases are usually paid by health insurers, do not.
With respect to policy, Landau noted that the paper provided some evidence of the effect of the Waxman-Hatch Act on generic entry. He said that the paper shows that in the post-Waxman period (from 1984 on) there is a significant increase in the number of generic entries occurring only a short time after patent expiration. His own feeling was that as a result of this act, the time it takes for generic penetration to reach half of the sales of a particular drug has probably been reduced from five years to one year.
Franklin Fisher wondered if the results shown in the paper were affected by their treatment of first-order serial correlation.
Both Bronwyn Hall and Zvi Griliches were concerned with the time trend dummy variables used by the authors in their regressions. Hall felt that these variables should be removed from the model because they were having very significant effects on the results. Griliches said that replacing the dummies with one general time trend might be an improvement in the model.
Several people asserted that the authors' finding that quantities drop
64 Brookings Papers: Microeconomics 1991
with patent expiration and generic entry is due simply to new chemical entities coming into the marketplace. Michael Whinston said it is not clear a priori what the direction of any bias would be, if there is one, and that the issue is by no means simple.
References
Berndt, Ernst R., Zvi Griliches, and Joshua G. Rosett. 1990. "On the Accuracy of Producer Price Indexes for Pharmaceutical Preparations: An Audit Based on Detailed Firm-Specific Data." Working Paper 3490. Cambridge, Mass.: National Bureau of Economic Research (NBER).
. 1991. "Price Indices for Pharmaceutical Preparations: Additional Findings." Presentation at NBER Productivity Program Meeting.
Berry, Steven. 1990. "Estimation of a Model of Entry in the Airline Industry." Mimeo, Yale University. (July).
. 1990. "Discrete Choice Models of Oligopoly Product Differentia- tion." Mimeo, Yale University (February).
Berry Steven, Jim Levinsohn, and Ariel Pakes. 1990. "Automobile Prices in Market Equilibrium." Mimeo, Yale University (December).
Berry, S., and Lutz, N., 1989. "A Proposal for Research on Pharmaceutical Markets Pricing and Promotion." Mimeo, Yale University (September).
Bond, Ronald S., and David F. Lean. 1977. Sales, Promotion, and Product Differentiation in Two Prescription Drug Markets. Staff Report to the Federal Trade Commission. Washington: Federal Trade Commission.
Bresnahan, Timothy F., and Peter C. Reiss. 1990. "Entry in Monopoly Mar- kets." Review of Economic Studies 57 (October):531-53.
Caplin, A., and Nalebuff B. 1991. "Aggregation and Imperfect Competition: On the Existence of Equilibrium." Econometrica, forthcoming.
Carroll, Norman V., Chanaporn Siridhara, and Jack E. Fincham. 1987. "Fac- tors Affecting Market Acceptance of Generic Drug Products: An Examination of Inherent Risk, Price, and Maximum Allowable Cost Coverage." Akron Business and Economic Review 18 (Spring): 11- 18.
Cocks, Douglas L., and John R. Virts. 1974. "Pricing Behavior of the Ethical Pharmaceutical Industry." Journal of Business 47 (July):349-62.
Comanor, William S. 1986. "The Political Economy of the Pharmaceutical Industry. " Journal of Economic Literature 24 (September):1 178-1217.
Communications Workers of America. 1990. CWA Information Industry Re- port. Washington (November).
Ericson, Richard, and Ariel Pakes. 1989. "An Alternative Model of Firm and Industry Dynamics." Mimeo, Columbia University (September).
Richard E. Caves, Michael D. Whinston, and Mark A. Hurwitz 65
Grabowski, Henry G. 1980. "Regulation and the International Diffusion of Pharmaceuticals." In The International Supply of Medicines: Implications of U.S. Regulatory Reform, edited by Robert B. Helms. American Enterprise Institute.
Grabowski, Henry G., and John M. Vernon. 1976. "Structural Effects of Regulation on Innovation in the Ethical Drug Industry." In Essays on In- dustrial Organization in Honor of Joe S. Bain, edited by Robert J. Masson and P. David Qualls. Ballinger.
. 1979. "Substitution Laws and Innovation in the Pharmaceutical In- dustry." Law and Contemporary Problems 43 (Winter-Spring):43-66.
. 1983. The Regulation of Pharmaceuticals: Balancing the Benefits and Risks. American Enterprise Institute.
* 1986. "Longer Patents for Lower Imitation Barriers: The 1984 Drug Act." American Economic Review, Papers and Proceedings, 1985 76 (May): 195-98.
Hurwitz, Mark A., and Richard E. Caves. 1988. "Persuasion or Information? Promotion and the Shares of Brand Name and Generic Pharmaceuticals." Journal of Law and Economics 31 (October):299-320.
Leffler, Keith B. 1981. "Persuasion or Information? The Economics of Pre- scription Drug Advertising." Journal of Law and Economics 24 (April):45- 74.
Mankiw, N. Gregory, and Michael D. Whinston. 1986. "Free Entry and Social Inefficiency." Rand Journal of Economics 17 (Spring):48-58.
Masson, Alison, and Robert L. Steiner. 1985. Generic Subsitution and Pre- scription Drug Prices: Economic Effects of State Drug Product Selection Laws. Washington: Federal Trade Commission.
Nordhaus, William D. 1969. Invention, Growth and Welfare: A Theoretical Treatment of Technological Change. MIT Press.
Pakes, Ariel, 1991. "Structural Econometric Modeling; Problems and Pros- pects-Part II: Mixed Continuous Discrete Control Models and Market In- teractions." In Advances in Econometrics, proceedings of the Sixth World Congress of the Econometric Society, edited by C. Sims, forthcoming.
Pakes, Ariel, and Paul McGuire. 1991. "Computation of Markov Perfect Equi- libria: A Dynamic Differentiated Product Model." Mimeo, Yale University (February).
Peltzman, Sam. 1974. Regulation of Pharmaceutical Innovation: The 1962 Amendments. American Enterprise Institute.
Pharmaceutical Manufacturers Association. 1988. PMA Statistical Fact Book. Washington.
Schwartzman, David. 1976. Innovation in the Pharmaceutical Industry. Johns Hopkins University Press.
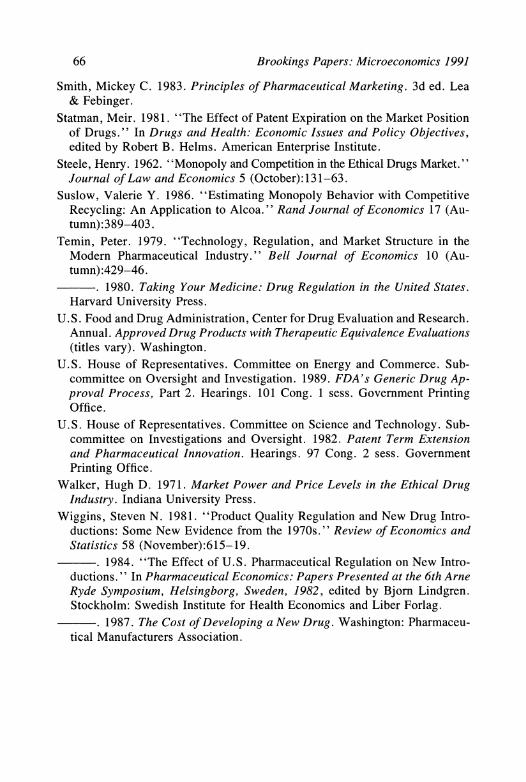
66 Brookings Papers: Microeconomics 1991
Smith, Mickey C. 1983. Principles of Pharmaceutical Marketing. 3d ed. Lea & Febinger.
Statman, Meir. 1981. "The Effect of Patent Expiration on the Market Position of Drugs." In Drugs and Health: Economic Issues and Policy Objectives, edited by Robert B. Helms. American Enterprise Institute.
Steele, Henry. 1962. "Monopoly and Competition in the Ethical Drugs Market." Journal of Law and Economics 5 (October): 131-63.
Suslow, Valerie Y. 1986. "Estimating Monopoly Behavior with Competitive Recycling: An Application to Alcoa." Rand Journal of Economics 17 (Au- tumn):389-403.
Temin, Peter. 1979. "Technology, Regulation, and Market Structure in the Modern Pharmaceutical Industry." Bell Journal of Economics 10 (Au- tumn):429-46.
. 1980. Taking Your Medicine: Drug Regulation in the United States. Harvard University Press.
U.S. Food and Drug Administration, Center for Drug Evaluation and Research. Annual. Approved Drug Products with Therapeutic Equivalence Evaluations (titles vary). Washington.
U.S. House of Representatives. Committee on Energy and Commerce. Sub- committee on Oversight and Investigation. 1989. FDA's Generic Drug Ap- proval Process, Part 2. Hearings. 101 Cong. 1 sess. Government Printing Office.
U.S. House of Representatives. Committee on Science and Technology. Sub- committee on Investigations and Oversight. 1982. Patent Term Extension and Pharmaceutical Innovation. Hearings. 97 Cong. 2 sess. Government Printing Office.
Walker, Hugh D. 1971. Market Power and Price Levels in the Ethical Drug Industry. Indiana University Press.
Wiggins, Steven N. 1981. "Product Quality Regulation and New Drug Intro- ductions: Some New Evidence from the 1970s." Review of Economics and Statistics 58 (November):615-19.
. 1984. "The Effect of U.S. Pharmaceutical Regulation on New Intro- ductions." In Pharmaceutical Economics: Papers Presented at the 6th Arne Ryde Symposium, Helsingborg, Sweden, 1982, edited by Bjorn Lindgren. Stockholm: Swedish Institute for Health Economics and Liber Forlag.
. 1987. The Cost of Developing a New Drug. Washington: Pharmaceu- tical Manufacturers Association.