Embed Size (px)
Citation preview
M e t h o d s a n d A p p r o a c h e s
The Rockefeller University Press $30.00J. Gen. Physiol. 2016 Vol. 148 No. 1 65–76www.jgp.org/cgi/doi/10.1085/jgp.201511559
65
I N T R O D U C T I O N
The number of particles on cell membranes is a funda-mental quantity required for biophysical studies of membrane proteins, especially ion channels and trans-porters (Hille, 2001). This information can be used to derive important biophysical properties such as single molecule conductance, open probability, ionic selectiv-ity, and stoichiometry of ligand binding or subunit as-sembly. Long before the era of single molecule biophysics, elegant strategies were developed to count ion channels on cell membranes, including the use of radiolabeled neurotoxins to specifically label certain ion channels (saxitoxin and tetrodotoxin for Na chan-nels and α-bungarotoxin for acetylcholine receptors; Moore et al., 1967; Salpeter and Loring, 1985), the mea-surement of macroscopic gating currents for voltage- gated channels divided by the number of gating charges per channel (Armstrong and Bezanilla, 1974, 1977), and the application of fluctuation analysis to ensembles of macroscopic current recordings (nonstationary noise analysis [NSNA]; DeFelice, 1981; Sigworth, 1984; Alva-rez et al., 2002). These classical techniques—dating back to the 60s—elegantly bridged macroscopic obser-vations with molecular properties that had been diffi-cult to approach, such as the density of channels on cell membranes and single-channel conductance. Later on, the single-channel recording technique made it possi-ble to directly detect transitions between open and
closed channels and to derive the total number of chan-nels from single-channel conductance and open proba-bility measurements (Neher and Sakmann, 1976; Sigworth and Neher, 1980). However, single-channel recording is not suitable for ion channels with an ex-tremely small conductance or flickering openings, nor for most transporters. Further, a condition of NSNA is that the membrane patch must sustain repetitive stimu-lations up to 100 times. Moreover, particular gating properties, such as cooperative opening or closing, could complicate the interpretation of noise analysis. Therefore, alternative strategies that help delineate macroscopic measurements and shed light on molecu-lar properties are still useful.
In the potassium channel superfamily, cyclic nucleo-tide–gated (CNG) and hyperpolarization-activated and cyclic nucleotide–regulated (HCN) channels share sim-ilar architecture. Each subunit within the tetrameric as-sembly contains six transmembrane α-helixes and a cyclic nucleotide–binding domain in the C terminus (Jan and Jan, 1990; Zagotta and Siegelbaum, 1996; Kaupp and Seifert, 2002; Biel et al., 2009). Intracellular cyclic nucleotides, including cAMP and cGMP, directly bind to and activate CNG and HCN channels. Single- channel recordings of CNG channels, first reported in the 80s, provided important mechanistic insights into their biophysical and physiological properties, such as
Counting ion channels on cell membranes is of fundamental importance for the study of channel biophysics. Channel counting has thus far been tackled by classical approaches, such as radioactive labeling of ion channels with blockers, gating current measurements, and nonstationary noise analysis. Here, we develop a counting method based on patch-clamp fluorometry (PCF), which enables simultaneous electrical and optical recordings, and apply it to EGFP-tagged, hyperpolarization-activated and cyclic nucleotide–regulated (HCN) channels. We use a well-characterized and homologous cyclic nucleotide–gated (CNG) channel to establish the relationship between macroscopic fluorescence intensity and the total number of channels. Subsequently, based on our esti-mate of the total number of HCN channels, we determine the single-channel conductance of HCN1 and HCN2 to be 0.46 and 1.71 pS, respectively. Such a small conductance would present a technical challenge for traditional electrophysiology. This PCF-based technique provides an alternative method for counting particles on cell mem-branes, which could be applied to biophysical studies of other membrane proteins.
Patch-clamp fluorometry–based channel counting to determine HCN channel conductance
Chang Liu,1,2 Changan Xie,1 Khade Grant,1 Zhuocheng Su,1 Weihua Gao,1 Qinglian Liu,1 and Lei Zhou1
1Department of Physiology and Biophysics, School of Medicine, Virginia Commonwealth University, Richmond, VA 232982School of Medicine, Nankai University, Tianjin 300071, China
©2016 Liu et al. This article is distributed under the terms of an Attribution–Noncommercial–Share Alike–No Mirror Sites license for the first six months after the publication date (see http ://www .rupress .org /terms). After six months it is available under a Creative Commons License (Attribution–Noncommercial–Share Alike 3.0 Unported license, as described at http ://creativecommons .org /licenses /by -nc -sa /3 .0 /).
Correspondence to Lei Zhou: [email protected] used in this paper: CNG, cyclic nucleotide–gated; HCN, hyper-
polarization-activated and cyclic nucleotide–regulated; NSNA, nonstationary noise analysis; PCF, patch-clamp fluorometry; ROI, region of interest.
The
Jour
nal o
f G
ener
al P
hysi
olo
gy
Dow
nloaded from http://rupress.org/jgp/article-pdf/148/1/65/1232608/jgp_201511559.pdf by guest on 22 February 2022

Patch-clamp fluorometry–based channel counting | Liu et al.66
the density of CNG channels on photoreceptor cell membranes (Matthews and Watanabe, 1988; Goulding et al., 1992, 1994; Ruiz and Karpen, 1997; Li and Lester, 1999). However, because of the extremely small sin-gle-channel conductance of HCN channels, studies to directly address single-channel properties have been rare (DiFrancesco, 1986; Biel et al., 2009). Among the four vertebrate HCN subtypes, HCN1 to HCN4, only HCN2 has been subjected to single-channel electro-physiology, and the conductance was determined to be <2 pS (Dekker and Yellen, 2006; Thon et al., 2013). The NSNA approach has also been applied to native and heterologously expressed HCN channels, yielding use-ful information (Table S1; Kole et al., 2006; Flynn et al., 2007; Barrow and Wu, 2009).
Here, we develop a new method to measure the num-ber of channels on cell membranes, based on the patch-clamp fluorometry (PCF) technique. PCF combines simultaneous electrical recording of ionic currents and fluorescence intensity from a membrane patch held within a glass recording pipette (Zheng and Zagotta, 2003; Kusch and Zifarelli, 2014). It has been an effective tool in the study of channel biophysics, with topics rang-ing from the calmodulin-dependent regulation of CNG channels to ligand-dependent gating mechanisms in CNG and HCN channels (Zheng and Zagotta, 2000; Kusch et al., 2010; Wu et al., 2011, 2012). We apply this method to estimate the number of HCN1, HCN2, and spHCN channels on membrane patches and then study their single-channel conductance and ionic selectivity. Our results not only provide new information on basic biophysical properties of HCN channels but also high-light the application of PCF as an alternative channel counting method for the study of membrane proteins with ionic conductance.
M AT E R I A L S A N D M E T H O D S
Construction of EGFP-tagged CNG and HCN fusion proteinsFor the chimeric CNG channel (ROO NS; provided by S. Siegelbaum, Columbia University, New York, NY), the DNA sequence encoding EGFP was added to the C ter-minus through the cut sites of SalI and HindIII (New England Biolabs, Inc.). Five amino acids (VDA GA) were added between CNG (…STQD) and EGFP (MVSK…). Another five amino acids (SGL RS) were added between EGFP (…DEL YK) and the stop codon. For the spHCN channel (provided by B. Kaupp and R. Seifert, Abtei-lung Molekulare Neurosensorik, Center of Advanced European Studies and Research, Bonn, Germany), the EGFP was inserted between I690 and P691. An alanine and a glycine residue were added to the N and C ter-mini of EGFP, respectively. For the mouse HCN1 chan-nel, the EGFP was inserted between E609 and I610, with an alanine and a glycine added to the N and C termini
of EGFP, respectively. For the mouse HCN2 channel, the EGFP was inserted after A662 through the BsmI cut site. An extra BsmI cut site was engineered to the C ter-minus of EGFP, with three extra amino acids (ENA) added after EGFP.
Functional expression in Xenopus laevis oocytes and electrophysiological characterizationcDNAs encoding HCN and CNG channels related to this study were cloned into the pGH19 vector and lin-earized by NheI (CNG and spHCN) and SphI (HCN). mMES SAGE machine (Ambion) was used for cRNA syn-thesis. 40–50 ng cRNA was injected into each oocyte at stage VI. After 1–2 d of incubation at 18°C, injected oo-cytes were selected for recording. For patch-clamp re-cording, the electrode solution (extracellular) and bath solution (intracellular) were symmetrical and contained 110 mM KCl, 2 mM NaCl, 10 mM HEP ES, and 1 mM EDTA (pH 7.4 adjusted by KOH). All experiments were performed at room temperature.
PCFThe PCF setup was constructed based on a BX50WI microscope (Olympus) equipped with a 60× water immersion lens (LUMPlanFL, N.A. 1.0). A 473-nm di-ode-pumped solid-state (DPSS) laser (Ultralasers Inc.) was used as the excitation light source. The following filter set was used for collecting the EGFP fluorescence signal: exciter, D480/30; dichroic mirror, DC505LP; emitter, D510LP (Chroma Technology Corp.). Opti-cal signals were detected by a 16-bit EMC CD camera (Cascade 1K; Photometrics). An 18-bit data acquisition board (PCI-6289; National Instruments) was used for analogue and digital I/O. WinWCP was used for data acquisition. The laser light source, the CCD camera exposure, and the amplifier for patch-clamp recording were synchronized by TTL signals.
Macroscopic current traces were collected in the pres-ence of a saturating concentration of cAMP and with a hyperpolarizing voltage step that, based on the Boltz-mann equation, was enough to produce maximal chan-nel opening. Fluorescence signals were collected with four increasing exposure times: 25, 50, 100, and 200 ms. No obvious bleach of the EGFP molecules was detected (Fig. S8). The optical signals were collected within the linear range of the CCD camera. The ImageJ program (National Institutes of Health) was used to analyze the fluorescence images (Schneider et al., 2012). To specif-ically measure the fluorescence signal near the excised membrane, a region of interest (ROI) was selected around the arc of membrane patch. ΔF was defined as mean fluorescence intensity in the ROI with back-ground fluorescence subtracted. The background fluo-rescence was collected by moving the tip of the recording pipette out of the view field. The following linear equation was used to fit the F-I relationship:
Dow
nloaded from http://rupress.org/jgp/article-pdf/148/1/65/1232608/jgp_201511559.pdf by guest on 22 February 2022
67JGP Vol. 148, No. 1
F = A + B · I, (1)
where A and B represent the intercept and slope, re-spectively. OriginPro 8.1 was used for curve fitting. A linear equation was used to fit the F-I results. The Pear-son correlation coefficient, of which the value of 1 indi-cates perfect positive correlation and 0 indicates no correlation, is listed in figure legends. The confidence interval bands (95%) are plotted in green.
I is defined by the following equation:
I = N · Po · i = N · Po · V · γ, (2)
where N is the total number of channels, Po is the open probability, i represent single-channel current, V is the membrane voltage minus the reversal potential, and γ represents single-channel conductance. Thus, the F-N relationship can be expanded to
F = A + B · Po · V · γ · N. (3)
Because CNG and HCN channels share similar topol-ogy, we assume the slope of the F-N relationship is inde-pendent of the channel type. Thus, the conductance of HCN channel could be derived based on the fol-lowing equation:
B CNG · P CNG o · V CNG · γ CNG = B HCN · P HCN o · V HCN · γ HCN
γ HCN =
B CNG · P CNG o · V CNG · γ CNG __________________ B HCN · P HCN o · V HCN .
(4)
NSNAmHCN2 and spHCN channels were activated by a hy-perpolarizing voltage step given every 10 s repeated 100 times. Raw data were collected by the WinWCP program and exported to pCLA MP format. The traces were fil-tered with a low-pass Gaussian filter set at 500 Hz by Clampfit. The program for the following calculations was written in Fortran.
We used the following equations to derive the vari-ance versus macroscopic current data points:
Step 1. Calculate the difference between two succes-sive traces of macroscopic current:
y m ( t ) = I m ( t ) − I m+1 ( t ) __________ 2 , (5)
where m is the trace index (1–100) and I is the mac-roscopic current.
Step 2. Calculate the mean current differences:
Y ( t ) = 1 ____ M − 1 ∑ m=1
M
y m ( t ) , (6)
where M represents the total number of traces collected.
Step 3. Calculate the variance of the mac-roscopic current:
σ 2 ( t ) = 2 ____ M − 1 ∑ m=1
M
( y m ( t ) − Y ( t ) ) 2 . (7)
Step 4. Fit the data points of variance − macroscopic current amplitude by the following parabolic function:
σ 2 ( I ) = i · I − I 2 __ N + k, (8)
where i represents the single-channel current, N rep-resents the total number of channels, and k is the back-ground offset (Kole et al., 2006; Barrow and Wu, 2009). The polynomial fit function with two orders from Origin-Pro 8.1 was used for curve fitting. Adjusted R2 values are provided in each figure legend. For HCN channels that show significant current rundown, using the difference between neighboring traces is essential to obtain reason-ably good results. Separately, we calculated the current variance based on the difference from the averaged cur-rent trace but obtained extremely high values of variance and unrealistic single-channel conductance (Fig. S7).
Online supplemental materialA document supplementary to the main manuscript provides the information on previous published results for HCN channel conductance (Table S1), calibration of the optical system using fluorescent plates (Fig. S1), voltage-dependent channel activation curves for mHCN2 and spHCN channels (Figs. S2 and S3), NSNA results for mHCN2, spHCN-EGFP, and spHCN channels (Figs. S4, S5, and S6), and a test of a traditional method to calculate the current variance in NSNA (Fig. S7). Fig. S8 shows the selection of ROI and photobleaching of EGFP molecules. Online supplemental material is available at http ://www .jgp .org /cgi /content /full /jgp .201511559 /DC1.
R E S U LT S
Establishing the relationship between macroscopic fluorescence intensity F and the total number of channels N on a membrane patchWe began by establishing the relationship between the number of channels and the macroscopic fluorescence intensity from a well-characterized chimeric CNG chan-nel (ROO NS) for which the total number of channels can be determined purely by electrophysiology record-ings at single-channel and macroscopic levels. ROO NS was constructed based on the bovine CNGA1 channel, of which the N terminus and the pore domain of CNGA1 were replaced by the corresponding parts from catfish CNGA2 to improve the gating efficacy (Goulding et al., 1994; Tibbs et al., 1997). We first started from single- channel recordings of ROO NS-EGFP, with a subsaturat-ing concentration of cGMP (3.5 µM) applied to the in-tracellular side (Fig. 1 A, top). Then we applied a high concentration of cGMP (35 µM) and determined the open probability to be 94.9% (Fig. 1 A, top). Histogram analysis revealed that the single-channel conductance of
Dow
nloaded from http://rupress.org/jgp/article-pdf/148/1/65/1232608/jgp_201511559.pdf by guest on 22 February 2022

Patch-clamp fluorometry–based channel counting | Liu et al.68
ROO NS-EGFP is 53.6 ± 7.1 pS (n = 7), close to the orig-inal characterization of this channel (Fig. 1 B; Goulding et al., 1993). Thus, based on the macroscopic current recorded under 35 µM cGMP, we could directly calculate the total number of ROO NS-GFP channels on the mem-brane patch by dividing the macroscopic current ampli-tude by the open probability and the single-channel current (Fig. 1, C [left] and E [top and bottom x axes]; N = I/[i × Po], where I is the macroscopic current, i is the single-channel current, and Po is the open probabil-
ity). Thus, electrophysiology recordings can provide a reliable estimation of the number of ROO NS channels (N) on the cell membrane, which will be used to cali-brate the corresponding fluorescence intensity (F).
To establish the F-N relationship, we applied PCF to collect the macroscopic current trace and the corre-sponding fluorescence image for each membrane patch (Fig. 1 C, right). To ensure the optical recording system functions within the linear range, we sequentially col-lected four fluorescence images by increasing the expo-
Figure 1. Use ROO NS-EGFP as a model to determine the relationship between macroscopic fluorescence intensity and the total number of channels on the membrane patch. (A, top) Two single-channel traces of ROO NS-EGFP channel recorded at the po-tential of 80 mV. Transitions between opening and closing were recorded in the presence of 3.5 µM cGMP, a sub-saturating concentration for ROO NS-EGFP. (bottom left) Maximal channel opening recorded with 35 µM cGMP. The current level corresponding to the closed state is indicated by a gray line. (bottom right) The current trace of the same patch recorded in the absence of cGMP. The gray line represents the current level of the open state. (B) His-togram of the top recording trace from A. Averaged amplitude of single-chan-nel currents was 4.29 ± 0.57 pA (n = 7). (C, left) Macroscopic current recorded under 35 µM cGMP and a voltage step from 0 to 40 mV. (right) The corre-sponding brightfield and fluorescence images. (D, left) Histogram of the pixel intensities of the whole fluorescence image collected using four different ex-posure durations. The Cascade 1K is a 16-bit camera so that the pixel intensity ranges from 0 to 65,535. (right) Total fluorescence intensity from the ROI sur-rounding the patch of membrane patch (green) and the background (blue), which was separately recorded after moving the recording pipette out of the view. (E) Cross-plots of fluorescence intensity versus current amplitude. Two x axes show the macroscopic current (bottom) and the corresponding num-ber of channels (top). The amplitude of single-channel current, 4.29 pA, was used in the conversion. Linear fit sta-tistics: Pearson correlation coefficient, 0.823. Green curves show the confi-dence bands (95%).
Dow
nloaded from http://rupress.org/jgp/article-pdf/148/1/65/1232608/jgp_201511559.pdf by guest on 22 February 2022
69JGP Vol. 148, No. 1
sure time from 50, 100, 200, to 400 ms. We plotted the histogram of the pixel intensities for each image to de-tect saturated pixels (Fig. 1 D). We also used a fluores-cent plate (Chroma Technology Corp.) to calibrate the optical detection system on a daily basis (Fig. S1). After collecting patches of membranes containing a diverse range of channel numbers, we cross-plotted the current amplitudes and the corresponding fluorescence inten-sities and fitted the data with a linear function, which was used as a ruler in the subsequent experiments on HCN channels (Fig. 1 E and Eqs. 1, 2, and 3). The slope of the F-I relationship carries information about the number of particles on the membrane, the biophysical properties of the channel (open probability; single- channel current), and properties of the optical system (quantum yield of the EGFP molecule, excitation light intensity, settings of the optical filters, and quantum ef-ficiency of the CCD camera). Most properties of the op-tical system are independent from the channel type, but the quantum yield of EGFP can be affected by the as-sembly of multiple subunits and the resonance among EGFP molecules. Therefore, this method is more suit-able for the channels or transporters sharing similar molecular architecture.
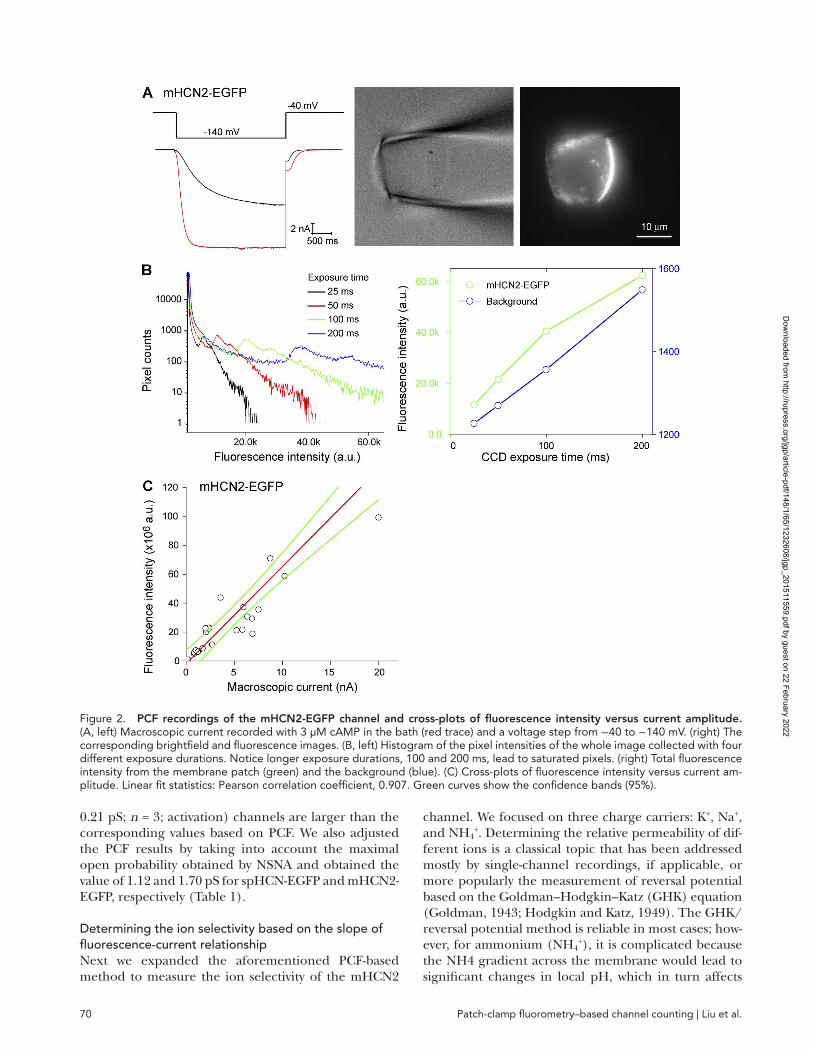
Applying the relationship between fluorescence intensity and channel number to count HCN channelsBecause CNG and HCN channels are homologous and share similar folding and assembly, the relationship between fluorescence intensity and channel number, which was established based on ROO NS-EGFP data, can be applied to count HCN channels. We constructed chimeric spHCN, mHCN1, and mHCN2 channels by inserting EGFP to the C-terminal end of the cyclic nu-cleotide–binding domain, comparable with the con-struction of ROO NS-EGFP. Macroscopic currents were recorded in the presence of saturating concentrations of cAMP (3 µM for mHCN1-EGFP and mHCN2-EGFP; 30 µM for spHCN-EGFP; Fig. 2 A, left). The correspond-ing fluorescence images were recorded using the same protocol as for ROO NS-EGFP (Fig. 2 A, right). For the patches with a high density of channels, histogram anal-ysis of pixel intensities did reveal saturated pixels (ex-posure duration: 100 and 200 ms; Fig. 2 B). In those cases, images collected with shorter exposure dura-tions were used.
After collecting electrical and optical recordings from membrane patches of a diverse range of channel densi-ties, we plotted the current amplitude versus fluores-cence intensity and fitted the results with a linear relationship (Fig. 2 C; mHCN2-EGFP). For mHCN1 and spHCN channels, the macroscopic current trace and the corresponding images are shown in Fig. 3 (A and B, respectively). Linear fits of the F-I plots are shown in Fig. 3 (C and D), which we used in the final analysis (see Materials and methods; Eq. 4). To ensure
channel opening reach steady-state, the hyperpolariz-ing voltage steps for activating spHCN, mHCN1, and mHCN2 channels were chosen based on the corre-sponding Boltzmann fit of the channel activation curve (Figs. S2 and S3). If we assume the open probabilities for these channels to be 100%, our analysis revealed that the single-channel conductance for spHCN-EGFP, mHCN1-EGFP, and mHCN2-EGFP channel are 0.88, 0.46, and 1.46 pS, respectively. These values represent a lower estimation because applying NSNA to these chan-nels suggests the maximal open probabilities are <100%.
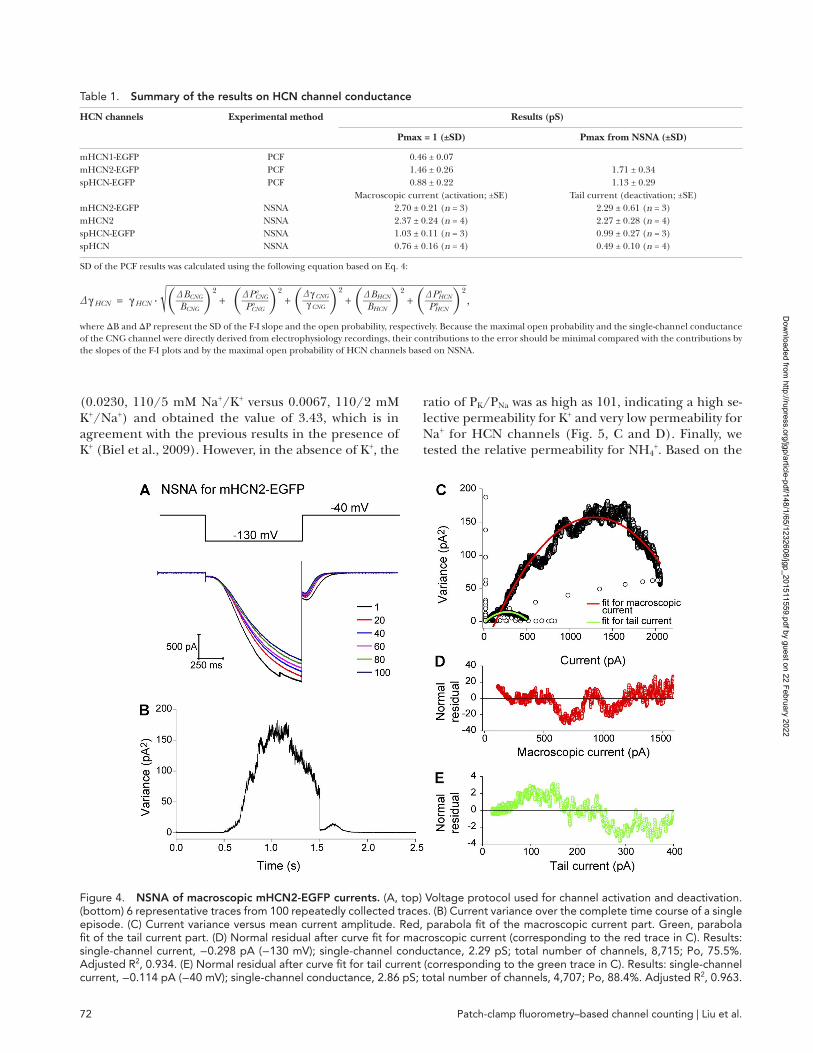
Applying NSNA to macroscopic currents to estimate the single-channel conductance and the total number of channelsTo corroborate the aforementioned results based on PCF, we switched to NSNA, a classical approach for esti-mating the single-channel conductance and the total number of channels that is based on fluctuation analysis of macroscopic currents. Because of the technical diffi-culty in collecting an ensemble (ideally 100) of stable HCN current traces with extremely negative potentials, to our best knowledge, only four publications in the lit-erature had applied NSNA to HCN channels: two for heterologously expressed WT spHCN or mHCN2 chan-nels and two for native neuronal HCN currents (John-son and Zagotta, 2005; Kole et al., 2006; Flynn et al., 2007; Barrow and Wu, 2009). Here we started from mHCN2-EGFP and mHCN2 channels and then ex-tended the study to spHCN-EGFP and spHCN channels. We did not apply NSNA to mHCN1 channel because of the technical difficulty in obtaining stable current traces. For channel activation, we chose the hyperpolar-izing voltage step of −130 (mHCN2 channels) or −90 mV (spHCN channels) in the presence of saturating concentrations of cAMP (3 µM for mHCN2; 30 µM for spHCN; Fig. 4 A). Then we calculated the variance along the whole trace including both the on current and the tail current (Fig. 4 B). To circumvent the known issue of rundown for HCN channels, we calculated the current variance based on the difference between neighboring current traces instead of the deviation from the mean current of all traces (Fig. 4 C and Eqs. 5, 6, and 7). We separately fit the on-current and the tail current portions of the variance versus current plots with the parabolic equation (Eq. 8), which yielded the total number of channels and the single-channel cur-rent (Fig. 4, C–E). The results for mHCN2, spHCN-EGFP, and spHCN channels are shown in Figs. S4, S5, and S6. The NSNA results are summarized in Table 1. Noticeably, the results based on on-current, which cor-respond to the process of channel activation, are com-parable with the results based on tail currents that reflect the deactivation process. The values of single- channel conductance for both spHCN-EGFP (1.03 ± 0.11 pS; n = 3; activation) and mHCN2-EGFP (2.70 ±
Dow
nloaded from http://rupress.org/jgp/article-pdf/148/1/65/1232608/jgp_201511559.pdf by guest on 22 February 2022
Patch-clamp fluorometry–based channel counting | Liu et al.70
0.21 pS; n = 3; activation) channels are larger than the corresponding values based on PCF. We also adjusted the PCF results by taking into account the maximal open probability obtained by NSNA and obtained the value of 1.12 and 1.70 pS for spHCN-EGFP and mHCN2-EGFP, respectively (Table 1).
Determining the ion selectivity based on the slope of fluorescence-current relationshipNext we expanded the aforementioned PCF-based method to measure the ion selectivity of the mHCN2
channel. We focused on three charge carriers: K+, Na+, and NH4
+. Determining the relative permeability of dif-ferent ions is a classical topic that has been addressed mostly by single-channel recordings, if applicable, or more popularly the measurement of reversal potential based on the Goldman–Hodgkin–Katz (GHK) equation (Goldman, 1943; Hodgkin and Katz, 1949). The GHK/reversal potential method is reliable in most cases; how-ever, for ammonium (NH4
+), it is complicated because the NH4 gradient across the membrane would lead to significant changes in local pH, which in turn affects
Figure 2. PCF recordings of the mHCN2-EGFP channel and cross-plots of fluorescence intensity versus current amplitude. (A, left) Macroscopic current recorded with 3 µM cAMP in the bath (red trace) and a voltage step from −40 to −140 mV. (right) The corresponding brightfield and fluorescence images. (B, left) Histogram of the pixel intensities of the whole image collected with four different exposure durations. Notice longer exposure durations, 100 and 200 ms, lead to saturated pixels. (right) Total fluorescence intensity from the membrane patch (green) and the background (blue). (C) Cross-plots of fluorescence intensity versus current am-plitude. Linear fit statistics: Pearson correlation coefficient, 0.907. Green curves show the confidence bands (95%).
Dow
nloaded from http://rupress.org/jgp/article-pdf/148/1/65/1232608/jgp_201511559.pdf by guest on 22 February 2022

71JGP Vol. 148, No. 1
the function of many channels including the HCN channel (Boron, 2004; Musa-Aziz et al., 2009).
Because the macroscopic fluorescence intensity of the membrane patch reflects the total number of channels on the membrane, the slope of the F-I relationship should directly reflect the permeability of the channel to that particular charge carrier. In turn, the ratio of the slope of F-I curves can be used to determine the relative selective permeability among different charge carriers. For each charge carrier, we used symmetrical solutions on both sides of the membrane. As in the aforemen-
tioned experiments, we collected the macroscopic cur-rent trace together with the fluorescence image from membrane patches that express a diverse range of num-ber of channels (Fig. 5, A and B). We started from PK/PNa and used it as the positive control because the PK/PNa has been well documented to be around 3:1 for HCN channels (in the presence of at least 5 mM K+; Biel et al., 2009). Also, it is known that in the absence of K+ ions, the permeability of Na+ ions through the HCN channel is very low (Frace et al., 1992; Ludwig et al., 1998; Biel et al., 2009). Indeed, we calculated the ratio of the slopes
Figure 3. Cross-plots of fluorescence intensity versus current amplitude for mHCN1-EGFP and spHCN-EGFP channels. (A, left) Macroscopic current of the mHCN1-EGFP channel recorded with 3 µM cAMP in the bath. A voltage step from 0 to −120 mV was used for channel activation. Tail current was recorded at −40 mV. (B, left) Macroscopic current of spHCN-EGFP channel recorded with 30 µM cAMP in the bath. A voltage step from 0 to −120 mV was used for channel activation. Tail current was recorded at 40 mV. (A and B, right) The corresponding brightfield and fluorescence images. (C) Cross-plots of fluorescence intensity versus current amplitude for the mHCN1-EGFP channel. Linear fit statistics: Pearson correlation coefficient, 0.973. (D) Cross-plots of fluorescence intensity versus current amplitude for the spHCN-EGFP channel. Linear fit statistics: Pearson correlation coefficient, 0.859. Green curves show the confidence bands (95%).
Dow
nloaded from http://rupress.org/jgp/article-pdf/148/1/65/1232608/jgp_201511559.pdf by guest on 22 February 2022
Patch-clamp fluorometry–based channel counting | Liu et al.72
(0.0230, 110/5 mM Na+/K+ versus 0.0067, 110/2 mM K+/Na+) and obtained the value of 3.43, which is in agreement with the previous results in the presence of K+ (Biel et al., 2009). However, in the absence of K+, the
ratio of PK/PNa was as high as 101, indicating a high se-lective permeability for K+ and very low permeability for Na+ for HCN channels (Fig. 5, C and D). Finally, we tested the relative permeability for NH4
+. Based on the
Figure 4. NSNA of macroscopic mHCN2-EGFP currents. (A, top) Voltage protocol used for channel activation and deactivation. (bottom) 6 representative traces from 100 repeatedly collected traces. (B) Current variance over the complete time course of a single episode. (C) Current variance versus mean current amplitude. Red, parabola fit of the macroscopic current part. Green, parabola fit of the tail current part. (D) Normal residual after curve fit for macroscopic current (corresponding to the red trace in C). Results: single-channel current, −0.298 pA (−130 mV); single-channel conductance, 2.29 pS; total number of channels, 8,715; Po, 75.5%. Adjusted R2, 0.934. (E) Normal residual after curve fit for tail current (corresponding to the green trace in C). Results: single-channel current, −0.114 pA (−40 mV); single-channel conductance, 2.86 pS; total number of channels, 4,707; Po, 88.4%. Adjusted R2, 0.963.
Table 1. Summary of the results on HCN channel conductance
HCN channels Experimental method Results (pS)
Pmax = 1 (±SD) Pmax from NSNA (±SD)
mHCN1-EGFP PCF 0.46 ± 0.07mHCN2-EGFP PCF 1.46 ± 0.26 1.71 ± 0.34spHCN-EGFP PCF 0.88 ± 0.22 1.13 ± 0.29
Macroscopic current (activation; ±SE) Tail current (deactivation; ±SE)mHCN2-EGFP NSNA 2.70 ± 0.21 (n = 3) 2.29 ± 0.61 (n = 3)mHCN2 NSNA 2.37 ± 0.24 (n = 4) 2.27 ± 0.28 (n = 4)spHCN-EGFP NSNA 1.03 ± 0.11 (n = 3) 0.99 ± 0.27 (n = 3)spHCN NSNA 0.76 ± 0.16 (n = 4) 0.49 ± 0.10 (n = 4)
SD of the PCF results was calculated using the following equation based on Eq. 4:
Δ γ HCN = γ HCN · √
__________________________________________
( Δ B CNG _____ B CNG ) 2
+ ( Δ P CNG o _____ P CNG o ) 2
+ ( Δ γ CNG
_____ γ CNG ) 2
+ ( Δ B HCN _____ B HCN ) 2
+ ( Δ P HCN o _____ P HCN o ) 2
,
where ΔB and ΔP represent the SD of the F-I slope and the open probability, respectively. Because the maximal open probability and the single-channel conductance of the CNG channel were directly derived from electrophysiology recordings, their contributions to the error should be minimal compared with the contributions by the slopes of the F-I plots and by the maximal open probability of HCN channels based on NSNA.
Dow
nloaded from http://rupress.org/jgp/article-pdf/148/1/65/1232608/jgp_201511559.pdf by guest on 22 February 2022

73JGP Vol. 148, No. 1
ratio of slopes, the PK/PNH4 was determined to be 13.1 (without K+) or 12.1 (with 5 mM K+; Fig. 5, E and F).
D I S C U S S I O N
Counting the number of particles on cell membranes is a classic topic for the study of not only ion channels
but also transporters and other types of membrane proteins. It is not a trivial task and historically has been addressed by carefully designed experiments including radioactive labeling of channels/receptors (Moore et al., 1967), gating current and gating charge measure-ments (Armstrong and Bezanilla, 1974, 1977), and noise analysis like NSNA (DeFelice, 1981; Sigworth, 1984).
Figure 5. Determining the relative ionic selectivity for the mHCN2-EGFP channel. Symmetrical solutions were used on both sides of the membrane. All recordings were collected in the presence of saturating concentration of cAMP (3 µM). (A) Current trace recorded with solutions containing 110 mM Na+ and 5 mM K+ as the charge carriers. (B) Current trace recorded with solutions con-taining 110 mM NH4
+ and 5 mM K+. (C) Cross-plots of fluorescence intensity versus current amplitude. Symmetric solutions contain 110 mM Na+ only. The slope was 0.676 a.u./pA. As the control, the slope of the condition with 110 mM K+ and 2 mM Na+ was 0.0067 a.u./pA. Thus, PK+/PNa+ based on the ratio of two slopes was 101 (in the absence of K+). Linear fit statistics: Pearson correlation coefficient, 0.766. (D) Results of 110 mM Na+ and 5 mM K+. The slope was 0.023 a.u./pA. PK+/PNa+ was 3.4 (in the presence of 5 mM K+). Linear fit statistics: Pearson correlation coefficient, 0.845. (E) Results of 110 mM NH4
+ only. The slope was 0.088 a.u./pA. PK+/PNH4
+ was 13.1 (in the absence of K+). Linear fit statistics: Pearson correlation coefficient, 0.811. (F) Results of 110 mM NH4+ and
5 mM K+. The slope was 0.081 a.u./pA. PK+/PNH4+ was 12.1 (in the presence of 5 mM K+). Linear fit statistics: Pearson correlation
coefficient, 0.832. Green curves show the confidence bands (95%).
Dow
nloaded from http://rupress.org/jgp/article-pdf/148/1/65/1232608/jgp_201511559.pdf by guest on 22 February 2022
Patch-clamp fluorometry–based channel counting | Liu et al.74
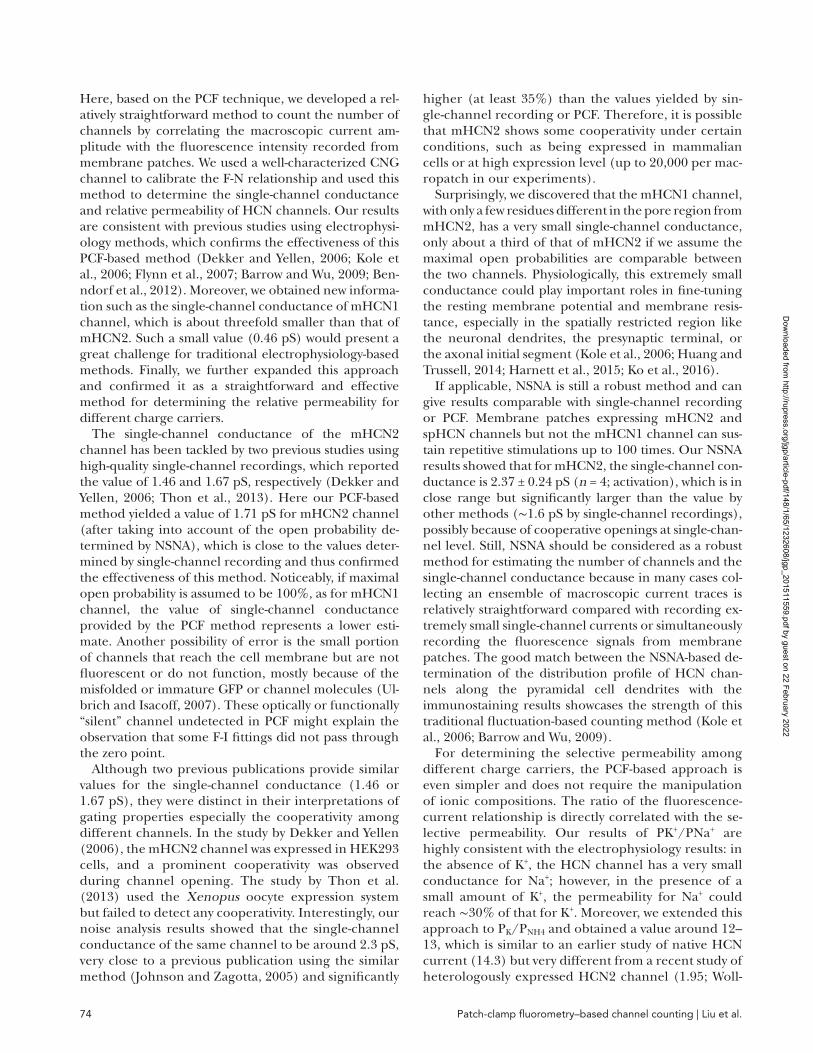
Here, based on the PCF technique, we developed a rel-atively straightforward method to count the number of channels by correlating the macroscopic current am-plitude with the fluorescence intensity recorded from membrane patches. We used a well-characterized CNG channel to calibrate the F-N relationship and used this method to determine the single-channel conductance and relative permeability of HCN channels. Our results are consistent with previous studies using electrophysi-ology methods, which confirms the effectiveness of this PCF-based method (Dekker and Yellen, 2006; Kole et al., 2006; Flynn et al., 2007; Barrow and Wu, 2009; Ben-ndorf et al., 2012). Moreover, we obtained new informa-tion such as the single-channel conductance of mHCN1 channel, which is about threefold smaller than that of mHCN2. Such a small value (0.46 pS) would present a great challenge for traditional electrophysiology-based methods. Finally, we further expanded this approach and confirmed it as a straightforward and effective method for determining the relative permeability for different charge carriers.
The single-channel conductance of the mHCN2 channel has been tackled by two previous studies using high-quality single-channel recordings, which reported the value of 1.46 and 1.67 pS, respectively (Dekker and Yellen, 2006; Thon et al., 2013). Here our PCF-based method yielded a value of 1.71 pS for mHCN2 channel (after taking into account of the open probability de-termined by NSNA), which is close to the values deter-mined by single-channel recording and thus confirmed the effectiveness of this method. Noticeably, if maximal open probability is assumed to be 100%, as for mHCN1 channel, the value of single-channel conductance provided by the PCF method represents a lower esti-mate. Another possibility of error is the small portion of channels that reach the cell membrane but are not fluorescent or do not function, mostly because of the misfolded or immature GFP or channel molecules (Ul-brich and Isacoff, 2007). These optically or functionally “silent” channel undetected in PCF might explain the observation that some F-I fittings did not pass through the zero point.
Although two previous publications provide similar values for the single-channel conductance (1.46 or 1.67 pS), they were distinct in their interpretations of gating properties especially the cooperativity among different channels. In the study by Dekker and Yellen (2006), the mHCN2 channel was expressed in HEK293 cells, and a prominent cooperativity was observed during channel opening. The study by Thon et al. (2013) used the Xenopus oocyte expression system but failed to detect any cooperativity. Interestingly, our noise analysis results showed that the single-channel conductance of the same channel to be around 2.3 pS, very close to a previous publication using the similar method (Johnson and Zagotta, 2005) and significantly
higher (at least 35%) than the values yielded by sin-gle-channel recording or PCF. Therefore, it is possible that mHCN2 shows some cooperativity under certain conditions, such as being expressed in mammalian cells or at high expression level (up to 20,000 per mac-ropatch in our experiments).
Surprisingly, we discovered that the mHCN1 channel, with only a few residues different in the pore region from mHCN2, has a very small single-channel conductance, only about a third of that of mHCN2 if we assume the maximal open probabilities are comparable between the two channels. Physiologically, this extremely small conductance could play important roles in fine-tuning the resting membrane potential and membrane resis-tance, especially in the spatially restricted region like the neuronal dendrites, the presynaptic terminal, or the axonal initial segment (Kole et al., 2006; Huang and Trussell, 2014; Harnett et al., 2015; Ko et al., 2016).
If applicable, NSNA is still a robust method and can give results comparable with single-channel recording or PCF. Membrane patches expressing mHCN2 and spHCN channels but not the mHCN1 channel can sus-tain repetitive stimulations up to 100 times. Our NSNA results showed that for mHCN2, the single-channel con-ductance is 2.37 ± 0.24 pS (n = 4; activation), which is in close range but significantly larger than the value by other methods (∼1.6 pS by single-channel recordings), possibly because of cooperative openings at single-chan-nel level. Still, NSNA should be considered as a robust method for estimating the number of channels and the single-channel conductance because in many cases col-lecting an ensemble of macroscopic current traces is relatively straightforward compared with recording ex-tremely small single-channel currents or simultaneously recording the fluorescence signals from membrane patches. The good match between the NSNA-based de-termination of the distribution profile of HCN chan-nels along the pyramidal cell dendrites with the immunostaining results showcases the strength of this traditional fluctuation-based counting method (Kole et al., 2006; Barrow and Wu, 2009).
For determining the selective permeability among different charge carriers, the PCF-based approach is even simpler and does not require the manipulation of ionic compositions. The ratio of the fluorescence- current relationship is directly correlated with the se-lective permeability. Our results of PK+/PNa+ are highly consistent with the electrophysiology results: in the absence of K+, the HCN channel has a very small conductance for Na+; however, in the presence of a small amount of K+, the permeability for Na+ could reach ∼30% of that for K+. Moreover, we extended this approach to PK/PNH4 and obtained a value around 12–13, which is similar to an earlier study of native HCN current (14.3) but very different from a recent study of heterologously expressed HCN2 channel (1.95; Woll-
Dow
nloaded from http://rupress.org/jgp/article-pdf/148/1/65/1232608/jgp_201511559.pdf by guest on 22 February 2022
75JGP Vol. 148, No. 1
muth and Hille, 1992; Carrisoza-Gaytán et al., 2011). It is possible that in the later study applying high concen-trations of NH4
+ to the extracellular solution leads to acidification of intracellular environment, which in turn affects the function of HCN channels.
Currently, our approach relies on the measurement of macroscopic fluorescence intensity and a separate calibration curve based on an EGFP-tagged homolo-gous channel of which the total number can be purely derived based on electrophysiology recordings. Be-cause we used the same settings during the optical recording, factors including efficiencies of excitation and collection of emitted fluorescent light can be can-celled out from the calculation. Moreover, the shape of the membrane patch and its orientation against the lens focal plane would affect the fluorescence reading, but both factors should equally affect EG-FP-tagged CNG and HCN channels so that they could also be cancelled out. In practice, we noticed that it was difficult to consistently adjust the focal plane to the horizontal equator of the membrane dome, which should be a source of variation among patches of membrane but could be overcome by further increas-ing the number of data points. Finally, this PCF-based counting method could be improved by incorporat-ing measurements of single fluorescent particles and thus bypassing the requirement of a well-characterized homologous channel for calibration purpose, which requires more careful experiment design and result interpretation but ought to broaden the application of this approach to other membrane proteins.
A C K N O W L E D G M E N T S
We acknowledge the technical support and the help during the pilot study from A. Hackett, F. Marni, and H. Xu. We thank Dr. Steve Siegelbaum for cDNA clones of ROO NS, mHCN1, and mHCN2 cDNA, and Drs. Benjamin Kaupp and Reinhard Seifert for the cDNA clone of spHCN. We are grateful for the comments and suggestions on the manuscript by Dr. Louis DeFelice.
This work was supported by National Institutes of Health (NIH) grants R01GM098592 and R01GM109193 and the startup funds from Virginia Commonwealth University to Q. Liu and L. Zhou. C. Liu was supported by the China Scholarship Council (no. 201406205012).
The authors declare no competing financial interests.Sharona E. Gordon served as editor.
Submitted: 17 December 2015Accepted: 23 May 2016
R E F E R E N C E SAlvarez, O., C. Gonzalez, and R. Latorre. 2002. Counting channels:
a tutorial guide on ion channel fluctuation analysis. Adv. Physiol. Educ. 26:327–341. http ://dx .doi .org /10 .1152 /advan .00006 .2002
Armstrong, C.M., and F. Bezanilla. 1974. Charge movement associated with the opening and closing of the activation gates of the Na channels. J. Gen. Physiol. 63:533–552. http ://dx .doi .org /10 .1085 /jgp .63 .5 .533
Armstrong, C.M., and F. Bezanilla. 1977. Inactivation of the sodium channel. II. Gating current experiments. J. Gen. Physiol. 70:567–590. http ://dx .doi .org /10 .1085 /jgp .70 .5 .567
Barrow, A.J., and S.M. Wu. 2009. Low-conductance HCN1 ion channels augment the frequency response of rod and cone photoreceptors. J. Neurosci. 29:5841–5853. http ://dx .doi .org /10 .1523 /JNE URO SCI .5746 -08 .2009
Benndorf, K., S. Thon, and E. Schulz. 2012. Unraveling subunit cooperativity in homotetrameric HCN2 channels. Biophys. J. 103:1860–1869. http ://dx .doi .org /10 .1016 /j .bpj .2012 .09 .024
Biel, M., C. Wahl-Schott, S. Michalakis, and X. Zong. 2009. Hyperpolarization-activated cation channels: from genes to function. Physiol. Rev. 89:847–885. http ://dx .doi .org /10 .1152 /physrev .00029 .2008
Boron, W.F. 2004. Regulation of intracellular pH. Adv. Physiol. Educ. 28:160–179. http ://dx .doi .org /10 .1152 /advan .00045 .2004
Carrisoza-Gaytán, R., C. Rangel, C. Salvador, R. Saldaña-Meyer, C. Escalona, L.M. Satlin, W. Liu, B. Zavilowitz, J. Trujillo, N.A. Bobadilla, and L.I. Escobar. 2011. The hyperpolarization-activated cyclic nucleotide-gated HCN2 channel transports ammonium in the distal nephron. Kidney Int. 80:832–840. http ://dx .doi .org /10 .1038 /ki .2011 .230
DeFelice, L.J. 1981. Introduction to Membrane Noise. Plenum Press, New York. 500 pp. http ://dx .doi .org /10 .1007 /978 -1 -4613 -3135 -3
Dekker, J.P., and G. Yellen. 2006. Cooperative gating between single HCN pacemaker channels. J. Gen. Physiol. 128:561–567. http ://dx .doi .org /10 .1085 /jgp .200609599
DiFrancesco, D. 1986. Characterization of single pacemaker channels in cardiac sino-atrial node cells. Nature. 324:470–473. http ://dx .doi .org /10 .1038 /324470a0
Flynn, G.E., K.D. Black, L.D. Islas, B. Sankaran, and W.N. Zagotta. 2007. Structure and rearrangements in the carboxy-terminal region of SpIH channels. Structure. 15:671–682. http ://dx .doi .org /10 .1016 /j .str .2007 .04 .008
Frace, A.M., F. Maruoka, and A. Noma. 1992. External K+ increases Na+ conductance of the hyperpolarization-activated current in rabbit cardiac pacemaker cells. Pflugers Arch. 421:94–96. http ://dx .doi .org /10 .1007 /BF00374739
Goldman, D.E. 1943. Potential, impedance, and rectification in membranes. J. Gen. Physiol. 27:37–60. http ://dx .doi .org /10 .1085 /jgp .27 .1 .37
Goulding, E.H., J. Ngai, R.H. Kramer, S. Colicos, R. Axel, S.A. Siegelbaum, and A. Chess. 1992. Molecular cloning and single-channel properties of the cyclic nucleotide-gated channel from catfish olfactory neurons. Neuron. 8:45–58. http ://dx .doi .org /10 .1016 /0896 -6273(92)90107 -O
Goulding, E.H., G.R. Tibbs, D. Liu, and S.A. Siegelbaum. 1993. Role of H5 domain in determining pore diameter and ion permeation through cyclic nucleotide-gated channels. Nature. 364:61–64. http ://dx .doi .org /10 .1038 /364061a0
Goulding, E.H., G.R. Tibbs, and S.A. Siegelbaum. 1994. Molecular mechanism of cyclic-nucleotide-gated channel activation. Nature. 372:369–374. http ://dx .doi .org /10 .1038 /372369a0
Harnett, M.T., J.C. Magee, and S.R. Williams. 2015. Distribution and function of HCN channels in the apical dendritic tuft of neocortical pyramidal neurons. J. Neurosci. 35:1024–1037. http ://dx .doi .org /10 .1523 /JNE URO SCI .2813 -14 .2015
Hille, B. 2001. Ion Channels of Excitable Membranes. Third edi-tion. Sinauer, Sunderland, MA. 814 pp.
Hodgkin, A.L., and B. Katz. 1949. The effect of sodium ions on the electrical activity of giant axon of the squid. J. Physiol. 108:37–77. http ://dx .doi .org /10 .1113 /jphysiol .1949 .sp004310
Dow
nloaded from http://rupress.org/jgp/article-pdf/148/1/65/1232608/jgp_201511559.pdf by guest on 22 February 2022

Patch-clamp fluorometry–based channel counting | Liu et al.76
Huang, H., and L.O. Trussell. 2014. Presynaptic HCN channels regulate vesicular glutamate transport. Neuron. 84:340–346. http ://dx .doi .org /10 .1016 /j .neuron .2014 .08 .046
Jan, L.Y., and Y.N. Jan. 1990. A superfamily of ion channels. Nature. 345:672. http ://dx .doi .org /10 .1038 /345672a0
Johnson, J.P. Jr., and W.N. Zagotta. 2005. The carboxyl-terminal region of cyclic nucleotide-modulated channels is a gating ring, not a permeation path. Proc. Natl. Acad. Sci. USA. 102:2742–2747. http ://dx .doi .org /10 .1073 /pnas .0408323102
Kaupp, U.B., and R. Seifert. 2002. Cyclic nucleotide-gated ion channels. Physiol. Rev. 82:769–824. http ://dx .doi .org /10 .1152 /physrev .00008 .2002
Ko, K.W., M.N. Rasband, V. Meseguer, R.H. Kramer, and N.L. Golding. 2016. Serotonin modulates spike probability in the axon initial segment through HCN channels. Nat. Neurosci. 19:826–834. http ://dx .doi .org /10 .1038 /nn .4293
Kole, M.H., S. Hallermann, and G.J. Stuart. 2006. Single Ih channels in pyramidal neuron dendrites: properties, distribution, and impact on action potential output. J. Neurosci. 26:1677–1687. http ://dx .doi .org /10 .1523 /JNE URO SCI .3664 -05 .2006
Kusch, J., and G. Zifarelli. 2014. Patch-clamp fluorometry: electrophysiology meets fluorescence. Biophys. J. 106:1250–1257. http ://dx .doi .org /10 .1016 /j .bpj .2014 .02 .006
Kusch, J., C. Biskup, S. Thon, E. Schulz, V. Nache, T. Zimmer, F. Schwede, and K. Benndorf. 2010. Interdependence of receptor activation and ligand binding in HCN2 pacemaker channels. Neuron. 67:75–85. http ://dx .doi .org /10 .1016 /j .neuron .2010 .05 .022
Li, J., and H.A. Lester. 1999. Single-channel kinetics of the rat ol-factory cyclic nucleotide-gated channel expressed in Xenopus oocytes. Mol. Pharmacol. 55:883–893.
Ludwig, A., X. Zong, M. Jeglitsch, F. Hofmann, and M. Biel. 1998. A family of hyperpolarization-activated mammalian cation channels. Nature. 393:587–591. http ://dx .doi .org /10 .1038 /31255
Matthews, G., and S. Watanabe. 1988. Activation of single ion channels from toad retinal rod inner segments by cyclic GMP: concentration dependence. J. Physiol. 403:389–405. http ://dx .doi .org /10 .1113 /jphysiol .1988 .sp017255
Moore, J.W., T. Narahashi, and T.I. Shaw. 1967. An upper limit to the number of sodium channels in nerve membrane? J. Physiol. 188:99–105. http ://dx .doi .org /10 .1113 /jphysiol .1967 .sp008126
Musa-Aziz, R., L. Jiang, L.M. Chen, K.L. Behar, and W.F. Boron. 2009. Concentration-dependent effects on intracellular and surface pH of exposing Xenopus oocytes to solutions containing NH3/NH4+. J. Membr. Biol. 228:15–31. http ://dx .doi .org /10 .1007 /s00232 -009 -9155 -7
Neher, E., and B. Sakmann. 1976. Single-channel currents recorded from membrane of denervated frog muscle fibres. Nature. 260:799–802. http ://dx .doi .org /10 .1038 /260799a0
Ruiz, M.L., and J.W. Karpen. 1997. Single cyclic nucleotide-gated channels locked in different ligand-bound states. Nature. 389:389–392. http ://dx .doi .org /10 .1038 /38744
Salpeter, M.M., and R.H. Loring. 1985. Nicotinic acetylcholine receptors in vertebrate muscle: properties, distribution and neural control. Prog. Neurobiol. 25:297–325. http ://dx .doi .org /10 .1016 /0301 -0082(85)90018 -8
Schneider, C.A., W.S. Rasband, and K.W. Eliceiri. 2012. NIH Image to ImageJ: 25 years of image analysis. Nat. Methods. 9:671–675. http ://dx .doi .org /10 .1038 /nmeth .2089
Sigworth, F.J. 1984. Nonstationary noise analysis of membrane currents. In Membranes, Channels, and Noise. R.S. Eisenberg, M. Frank, and C.F. Stevens, editors. Springer US, Boston. 21–48. http ://dx .doi .org /10 .1007 /978 -1 -4684 -4850 -4 _2
Sigworth, F.J., and E. Neher. 1980. Single Na+ channel currents observed in cultured rat muscle cells. Nature. 287:447–449. http ://dx .doi .org /10 .1038 /287447a0
Thon, S., R. Schmauder, and K. Benndorf. 2013. Elementary functional properties of single HCN2 channels. Biophys. J. 105:1581–1589. http ://dx .doi .org /10 .1016 /j .bpj .2013 .08 .027
Tibbs, G.R., E.H. Goulding, and S.A. Siegelbaum. 1997. Allosteric activation and tuning of ligand efficacy in cyclic-nucleotide-gated channels. Nature. 386:612–615. http ://dx .doi .org /10 .1038 /386612a0
Ulbrich, M.H., and E.Y. Isacoff. 2007. Subunit counting in membrane-bound proteins. Nat. Methods. 4:319–321. http ://dx .doi .org /10 .1038 /nmeth1024
Wollmuth, L.P., and B. Hille. 1992. Ionic selectivity of Ih channels of rod photoreceptors in tiger salamanders. J. Gen. Physiol. 100:749–765. http ://dx .doi .org /10 .1085 /jgp .100 .5 .749
Wu, S., Z.V. Vysotskaya, X. Xu, C. Xie, Q. Liu, and L. Zhou. 2011. State-dependent cAMP binding to functioning HCN channels studied by patch-clamp fluorometry. Biophys. J. 100:1226–1232. http ://dx .doi .org /10 .1016 /j .bpj .2011 .01 .034
Wu, S., W. Gao, C. Xie, X. Xu, C. Vorvis, F. Marni, A.R. Hackett, Q. Liu, and L. Zhou. 2012. Inner activation gate in S6 contributes to the state-dependent binding of cAMP in full-length HCN2 channel. J. Gen. Physiol. 140:29–39. http ://dx .doi .org /10 .1085 /jgp .201110749
Zagotta, W.N., and S.A. Siegelbaum. 1996. Structure and function of cyclic nucleotide-gated channels. Annu. Rev. Neurosci. 19:235–263. http ://dx .doi .org /10 .1146 /annurev .ne .19 .030196 .001315
Zheng, J., and W.N. Zagotta. 2000. Gating rearrangements in cyclic nucleotide-gated channels revealed by patch-clamp fluorometry. Neuron. 28:369–374. http ://dx .doi .org /10 .1016 /S0896 -6273(00)00117 -3
Zheng, J., and W.N. Zagotta. 2003. Patch-clamp fluorometry record-ing of conformational rearrangements of ion channels. Sci. STKE. 2003:PL7.
Dow
nloaded from http://rupress.org/jgp/article-pdf/148/1/65/1232608/jgp_201511559.pdf by guest on 22 February 2022