Embed Size (px)
Citation preview
*For correspondence:
[email protected] (RTA);
[email protected] (YK)
Competing interests: The
authors declare that no
competing interests exist.
Funding: See page 26
Received: 16 December 2020
Accepted: 18 May 2021
Published: 19 May 2021
Reviewing editor: Baron
Chanda, Washington University
in St. Louis, United States
Copyright Andriani and Kubo.
This article is distributed under
the terms of the Creative
Commons Attribution License,
which permits unrestricted use
and redistribution provided that
the original author and source are
credited.
Voltage-clamp fluorometry analysis ofstructural rearrangements of ATP-gatedchannel P2X2 upon hyperpolarizationRizki Tsari Andriani1,2*, Yoshihiro Kubo1,2*
1Division of Biophysics and Neurobiology, National Institute for PhysiologicalSciences, Aichi, Japan; 2Department of Physiological Sciences, The GraduateUniversity for Advanced Studies, School of Life Science, Kanagawa, Japan
Abstract Gating of the ATP-activated channel P2X2 has been shown to be dependent not only
on [ATP] but also on membrane voltage, despite the absence of a canonical voltage-sensor domain.
We aimed to investigate the structural rearrangements of rat P2X2 during ATP- and voltage-
dependent gating, using a voltage-clamp fluorometry technique. We observed fast and linearly
voltage-dependent fluorescence intensity (F) changes at Ala337 and Ile341 in the TM2 domain,
which could be due to the electrochromic effect, reflecting the presence of a converged electric
field. We also observed slow and voltage-dependent F changes at Ala337, which reflect structural
rearrangements. Furthermore, we determined that the interaction between Ala337 in TM2 and
Phe44 in TM1, which are in close proximity in the ATP-bound open state, is critical for activation.
Taking these results together, we propose that the voltage dependence of the interaction within
the converged electric field underlies the voltage-dependent gating.
IntroductionP2X2 is a member of the P2X receptor family, a ligand-gated cation channel that opens upon the
binding of extracellular ATP (Brake et al., 1994; Valera et al., 1994). P2X receptors consist of seven
sub-classes (P2X1–P2X7) that assemble to form trimeric homomers or heteromers (e.g., P2X2/P2X3)
(Radford et al., 1997; North, 2002; Jiang et al., 2003a). Based on known crystal structures, P2X
receptors have two transmembrane (TM) domains (TM1 and TM2), a large extracellular ligand bind-
ing loop (ECD), which is the location of the ATP binding site, and intracellular N- and C- termini
(Kawate et al., 2009; Hattori and Gouaux, 2012; Mansoor et al., 2016; McCarthy et al., 2019).
P2X2 is mainly distributed in smooth muscle, the central nervous system (CNS), the retina, chro-
maffin cells, and autonomic and sensory ganglia (Burnstock, 2003). Recent studies have shown that
the P2X2 receptor in hair cells and supporting cells has an important role in auditory transduction. A
dominant negative polymorphism in human results in progressive hearing loss (Yan et al., 2013).
Furthermore, P2X2 in the cochlea is involved in adaptation to elevated sound levels (Housley et al.,
2013).
The P2X2 receptor has complex gating properties that consist of (1) [ATP]-dependent gating and
(2) voltage-dependent gating. The latter is despite the absence of a canonical voltage sensor
domain, in clear contrast to typical voltage-gated ion channels. In the presence of ATP, there is a
gradual increase of inward current upon hyperpolarization. ATP shifts the conductance–voltage rela-
tionship toward depolarized potentials. Thus, activation of the P2X2 channel is voltage-dependent
as well as [ATP]-dependent (Nakazawa et al., 1997; Zhou and Hume, 1998; Nakazawa and Ohno,
2005; Fujiwara et al., 2009; Keceli and Kubo, 2009). Previous studies have reported that this acti-
vation is indeed an intrinsic property of the channel (Nakazawa et al., 1997; Zhou and Hume,
1998; Fujiwara et al., 2009).
Andriani and Kubo. eLife 2021;10:e65822. DOI: https://doi.org/10.7554/eLife.65822 1 of 30
RESEARCH ARTICLE
It is of interest to know how P2X2 has voltage-dependent gating despite the absence of a canoni-
cal VSD. Previous studies have extensively investigated the roles of amino acid residues in TM1 and
TM2 during ATP-dependent gating and permeation (Haines et al., 2001; Jiang et al., 2001;
Li et al., 2004; Khakh and Egan, 2005; Cao et al., 2007; Samways et al., 2008; Cao et al., 2009).
In contrast, there is limited information about the roles of amino acid residues, particularly those
within TM domains, in voltage-dependent gating. A previous study identified positively charged
amino acid residues in the ATP binding pocket (K69, K71, R290, and K308; rP2X2 numbering) and
aromatic amino acid residues in TM1 (Y43, F44, and Y47; rP2X2 numbering), which are critical for
ATP- and voltage-dependent gating of the P2X2 receptor (Keceli and Kubo, 2009). However, those
residues were not the only determinants of [ATP]- and voltage-dependent gating of the P2X2 recep-
tor. The interpretation as to the mechanism is not yet straightforward and, thus, the key amino acid
residue in the voltage sensing mechanism of the P2X2 receptor is yet to be discovered.
Moreover, the details of the structural rearrangements upon ATP binding in the pore region
remain controversial. First, there are discrepancies between zfP2X4 structural data (Kawate et al.,
2009; Hattori and Gouaux, 2012) and experimental data on P2X from metal bridging experiments,
molecular dynamics simulations, and photo-switchable cross-linker experiments focusing on the TM
domains (Kracun et al., 2010; Li et al., 2010; Heymann et al., 2013; Habermacher et al., 2016).
Second, there are discrepancies between the crystal structures of the TM domains of zfP2X4 and
hP2X3; hP2X3 has longer TM domains. Furthermore, the ATP-bound open state of hP2X3 and rP2X7
has a cytoplasmic cap that was not seen in the crystal structure of zfP2X4 (Kawate et al., 2009;
Hattori and Gouaux, 2012; Mansoor et al., 2016; McCarthy et al., 2019). Thus, the present study
aims at analyzing the structural rearrangements of the P2X2 receptor in (1) ATP- and (2) voltage-
dependent gating, by voltage-clamp fluorometry (VCF), using a fluorescent unnatural amino acid
(fUAA) as a probe.
The combination of fluorometry and voltage-clamp recording offers a powerful method for ana-
lyzing real-time conformational changes within the ion channel structure (Mannuzzu et al., 1996;
Cha and Bezanilla, 1997; Pless and Lynch, 2008; Nakajo and Kubo, 2014; Talwar and Lynch,
2015). The use of an fUAA as a probe makes it possible to label any residue within the protein,
including those in the lower TM and intracellular regions, which are not accessible by conventional
VCF fluorophores, such as Alexa-488 maleimide (Kalstrup and Blunck, 2013; Sakata et al., 2016;
Kalstrup and Blunck, 2018; Klippenstein et al., 2018). Moreover, direct incorporation of the fUAA
increases the labeling efficiency and also prevents non-specific labeling (Kalstrup and Blunck, 2013;
Sakata et al., 2016).
The fUAA used here, 3-(6-acetylnaphthalen-2-ylamino)�2-aminopropionic acid (Anap), was incor-
porated into the rP2X2 protein by using a nonsense suppression method, in which the tRNA Anap-
CUA and tRNA-synthetase pair is used to introduce Anap at an amber nonsense codon mutation
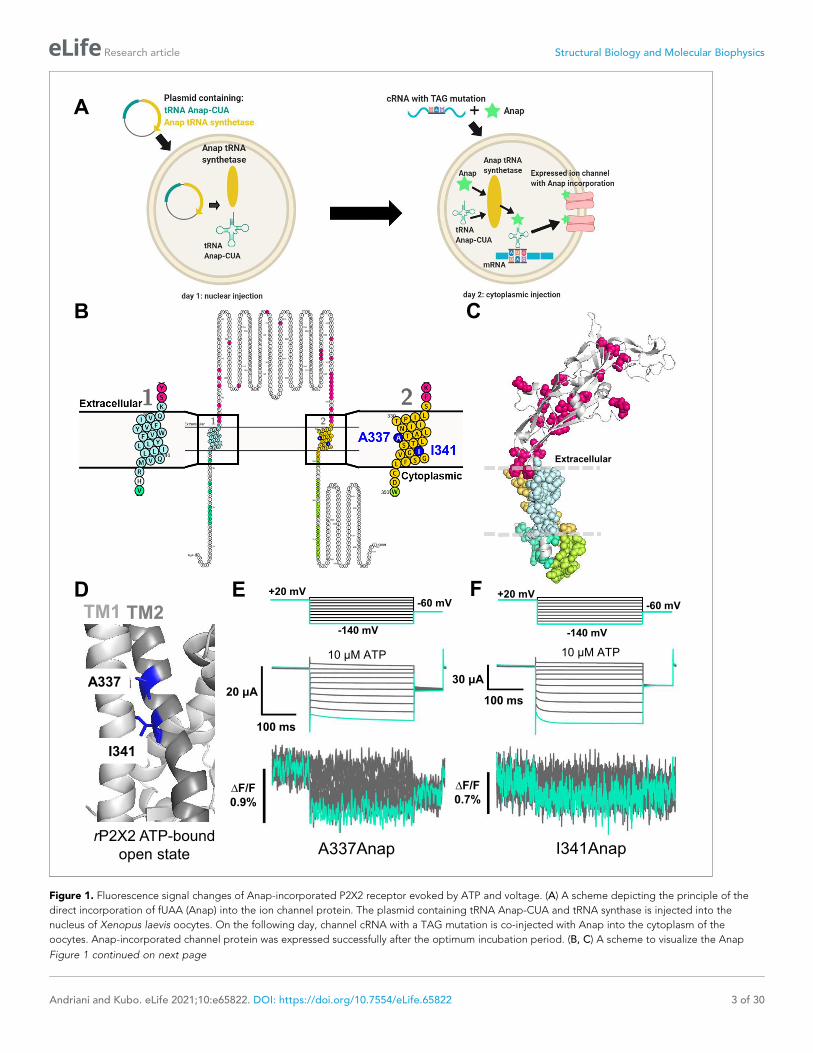
(Lee et al., 2009; Chatterjee et al., 2013; Klippenstein et al., 2018), as shown in Figure 1A. By
performing VCF recording, using Anap as a fluorophore, we analyzed the structural dynamics of the
P2X2 receptor undergoing complex gating. In the present study, we observed evidence of voltage-
dependent conformational changes in the transmembrane regions. We also investigated the key
amino acid residues in each TM region whose interaction might have major contributions to the
ATP- and voltage-dependent gating of the P2X2 receptor.
Results
Fluorescence signal changes of Anap-labeled P2X2 receptor evoked byATP and voltageAs the P2X2 receptor does not have a canonical voltage-sensing domain (VSD), we performed Anap
scanning by introducing TAG mutations one at a time in all regions of the P2X2 receptor, including
the cytoplasmic N-terminus (eight positions), TM1 (20 positions), ECD, where the ATP binding site is
located (25 positions), TM2 (24 positions), and cytoplasmic C-terminus (19 positions) (Figure 1B,C).
The whole of TM1 and TM2 was scanned, as these are the transmembrane domains in which a non-
canonical voltage sensor might be located.
Of the total of 96 positions of Anap mutants in the P2X2 receptor, many showed ATP-evoked
fluorescence intensity (F) changes (DF) (Supplementary file 1). As major and overall structural
Andriani and Kubo. eLife 2021;10:e65822. DOI: https://doi.org/10.7554/eLife.65822 2 of 30
Research article Structural Biology and Molecular Biophysics
A337Anap I341Anap
B
E F
A
B
rP2X2 ATP-bound
open state
D
C
∆F/F
0.9%
20 μA
100 ms
30 μA
100 ms
∆F/F
0.7%
10 μM ATP 10 μM ATP
+20 mV-60 mV
-140 mV
+20 mV-60 mV
-140 mV
Extracellular
A337
I341
TM2TM1
Figure 1. Fluorescence signal changes of Anap-incorporated P2X2 receptor evoked by ATP and voltage. (A) A scheme depicting the principle of the
direct incorporation of fUAA (Anap) into the ion channel protein. The plasmid containing tRNA Anap-CUA and tRNA synthase is injected into the
nucleus of Xenopus laevis oocytes. On the following day, channel cRNA with a TAG mutation is co-injected with Anap into the cytoplasm of the
oocytes. Anap-incorporated channel protein was expressed successfully after the optimum incubation period. (B, C) A scheme to visualize the Anap
Figure 1 continued on next page
Andriani and Kubo. eLife 2021;10:e65822. DOI: https://doi.org/10.7554/eLife.65822 3 of 30
Research article Structural Biology and Molecular Biophysics
movement occurs upon the binding of ATP during the channel’s transition from closed to open state
in the P2X receptor (Kawate et al., 2009; Hattori and Gouaux, 2012; Mansoor et al., 2016;
McCarthy et al., 2019), the results accord well with the expectation that an ATP-evoked fluores-
cence change would be observed at many positions labeled by Anap.
In contrast, out of 96 mutants tested, only two produced fluorescence intensity changes in
response to voltage steps (Figure 1E,F; Supplementary file 1). These two positions are in TM2:
A337 (DF/F = 0.5 ± 0.2% upon voltage change from +40 mV to �140 mV at 440 nm [n = 3],
Figure 1D,E) and I341 (DF/F = 0.3 ± 0.2% upon voltage change from +40 mV to �140 mV at 440 nm
[n = 3], Figure 1D,F). ATP-evoked currents of both constructs were inhibited by the P2X2 receptor
non-specific blockers, Suramin and PPADS (Figure 1—figure supplement 1), confirming that the
currents are indeed P2X2 receptor currents. Voltage-dependent F changes could not be detected at
other scanned positions in TM1, TM2, or other regions (Figure 1—figure supplements 2 and
3; Supplementary file 1).
Although Anap DF was observed in several mutants, there are two major concerns, as follows: (1)
DF is close to the limit of detection because signal-to-noise ratio is low, making it hard to perform
further analysis, for example, DF/F-V relationships. (2) The incidence of fluorescence change detec-
tion in each batch is also low, 14.3 ± 4.1% (n = 5–16) and 16.02 ± 0.6% (n = 6–13) for A337Anap and
I341Anap, respectively. Three out of 13 batches showed F change for A337Anap and 2 out of 10
batches showed F change for I341Anap. Thus, at this point, further analysis to determine the struc-
tural rearrangements with which Anap DF is associated could not be performed.
SIK inhibitor treatment improved VCF optical signal in Anap labeled Ci-VSP and P2X2 receptorTo overcome the problems of small fluorescence changes and low incidence of successful detection
of fluorescence changes, a small molecule kinase inhibitor, namely a Salt-inducible Kinase (SIK) Inhib-
itor (HG-9-91-01), was applied by injection into the oocytes, to decrease the intrinsic background
fluorescence (Lee and Bezanilla, 2019). This inhibitor promotes UV-independent skin pigmentation,
by increasing the production of melanin (Mujahid et al., 2017), resulting in a darker surface of the
animal pole of the oocyte. As the intrinsic background fluorescence of the oocytes is decreased, the
percentage of fluorescence change (DF/F) is expected to increase.
Optimization of SIK inhibitor treatment in VCF experiments using Anap as fluorophore was
achieved for the following conditions: (1) the concentration of SIK inhibitor giving the maximum
decrease in intrinsic background fluorescence; (2) the location of the microinjection (nuclear or cyto-
plasmic) and the duration of incubation.
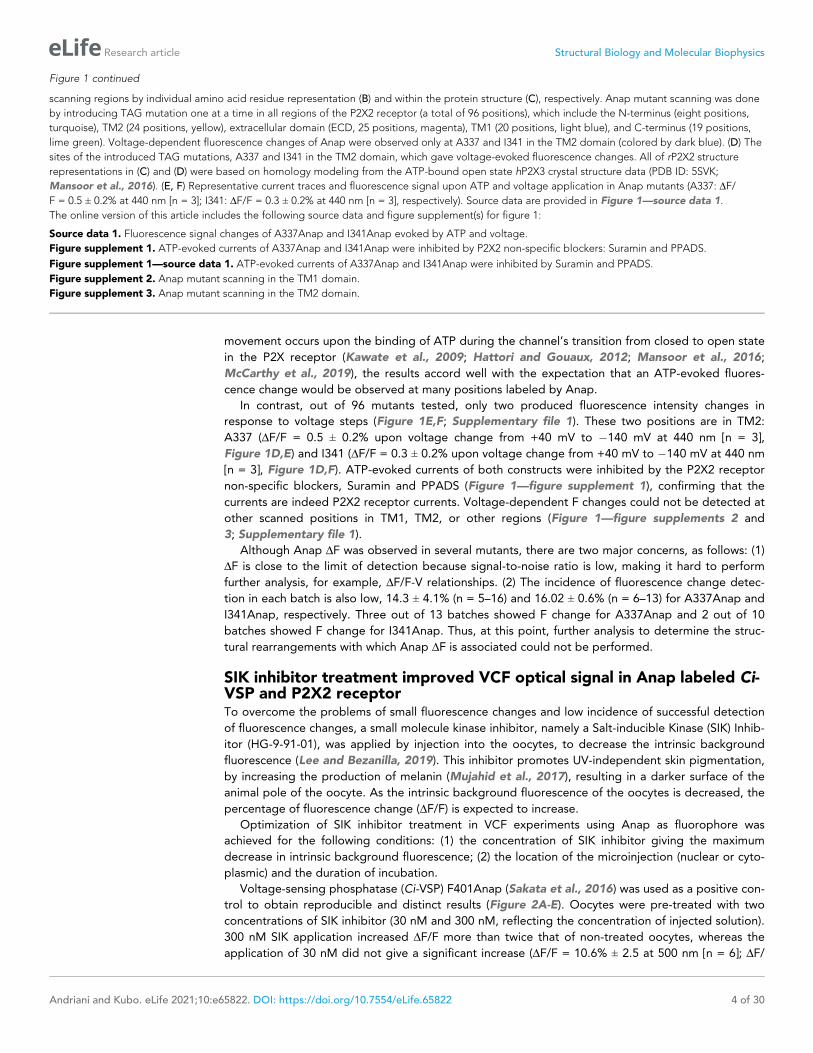
Voltage-sensing phosphatase (Ci-VSP) F401Anap (Sakata et al., 2016) was used as a positive con-
trol to obtain reproducible and distinct results (Figure 2A-E). Oocytes were pre-treated with two
concentrations of SIK inhibitor (30 nM and 300 nM, reflecting the concentration of injected solution).
300 nM SIK application increased DF/F more than twice that of non-treated oocytes, whereas the
application of 30 nM did not give a significant increase (DF/F = 10.6% ± 2.5 at 500 nm [n = 6]; DF/
Figure 1 continued
scanning regions by individual amino acid residue representation (B) and within the protein structure (C), respectively. Anap mutant scanning was done
by introducing TAG mutation one at a time in all regions of the P2X2 receptor (a total of 96 positions), which include the N-terminus (eight positions,
turquoise), TM2 (24 positions, yellow), extracellular domain (ECD, 25 positions, magenta), TM1 (20 positions, light blue), and C-terminus (19 positions,
lime green). Voltage-dependent fluorescence changes of Anap were observed only at A337 and I341 in the TM2 domain (colored by dark blue). (D) The
sites of the introduced TAG mutations, A337 and I341 in the TM2 domain, which gave voltage-evoked fluorescence changes. All of rP2X2 structure
representations in (C) and (D) were based on homology modeling from the ATP-bound open state hP2X3 crystal structure data (PDB ID: 5SVK;
Mansoor et al., 2016). (E, F) Representative current traces and fluorescence signal upon ATP and voltage application in Anap mutants (A337: DF/
F = 0.5 ± 0.2% at 440 nm [n = 3]; I341: DF/F = 0.3 ± 0.2% at 440 nm [n = 3], respectively). Source data are provided in Figure 1—source data 1.
The online version of this article includes the following source data and figure supplement(s) for figure 1:
Source data 1. Fluorescence signal changes of A337Anap and I341Anap evoked by ATP and voltage.
Figure supplement 1. ATP-evoked currents of A337Anap and I341Anap were inhibited by P2X2 non-specific blockers: Suramin and PPADS.
Figure supplement 1—source data 1. ATP-evoked currents of A337Anap and I341Anap were inhibited by Suramin and PPADS.
Figure supplement 2. Anap mutant scanning in the TM1 domain.
Figure supplement 3. Anap mutant scanning in the TM2 domain.
Andriani and Kubo. eLife 2021;10:e65822. DOI: https://doi.org/10.7554/eLife.65822 4 of 30
Research article Structural Biology and Molecular Biophysics
A
D
500 ms
∆F/F
8%
500 ms
∆F/F
13%
Control
B 30 nM SIK inhibitor
C 300 nM SIK inhibitor
500 ms
∆F/F
18%
F Control
G 300 nM SIK inhibitor
E
H
50 μA
100 ms
∆F/F
1.7%
20 μA
100 ms
∆F/F
1.8%
100 μM ATP
100 μM ATP
P2X2 R313W/A337AnapCi-VSP F401Anap
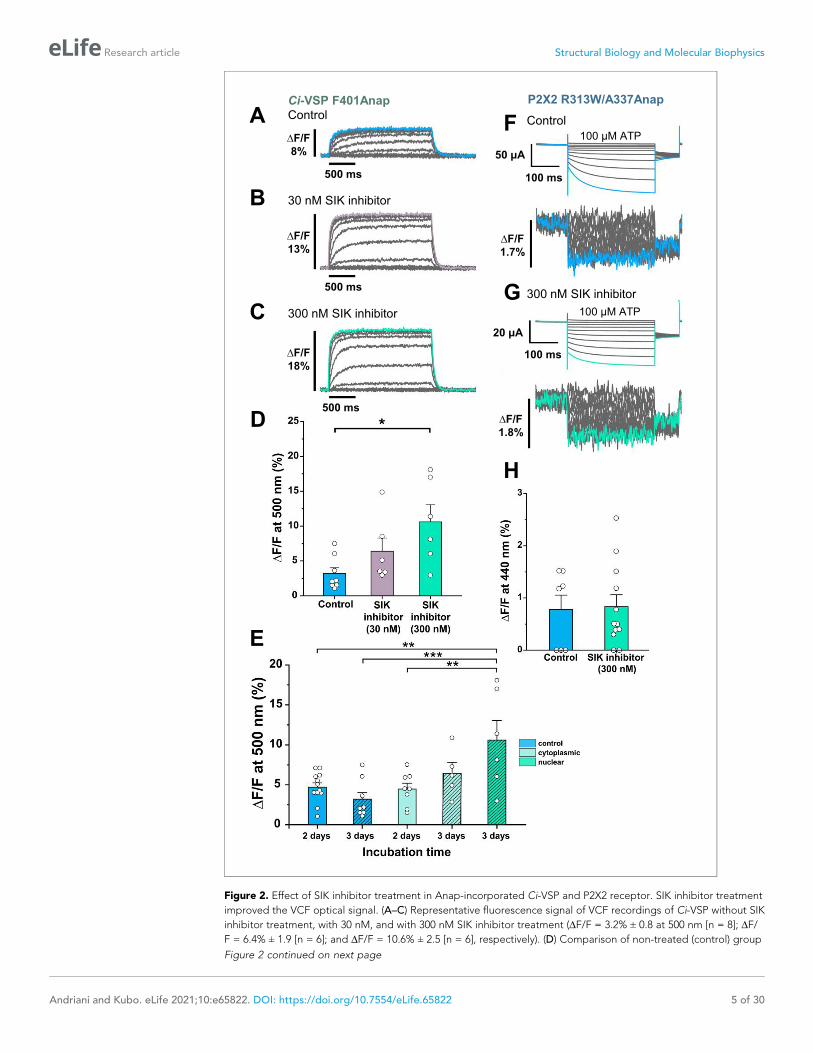
Figure 2. Effect of SIK inhibitor treatment in Anap-incorporated Ci-VSP and P2X2 receptor. SIK inhibitor treatment
improved the VCF optical signal. (A–C) Representative fluorescence signal of VCF recordings of Ci-VSP without SIK
inhibitor treatment, with 30 nM, and with 300 nM SIK inhibitor treatment (DF/F = 3.2% ± 0.8 at 500 nm [n = 8]; DF/
F = 6.4% ± 1.9 [n = 6]; and DF/F = 10.6% ± 2.5 [n = 6], respectively). (D) Comparison of non-treated (control) group
Figure 2 continued on next page
Andriani and Kubo. eLife 2021;10:e65822. DOI: https://doi.org/10.7554/eLife.65822 5 of 30
Research article Structural Biology and Molecular Biophysics
F = 3.2% ± 0.8 [n = 8]; and DF/F = 6.4% ± 1.9 [n = 6], respectively, Figure 2A-D). This showed that
300 nM SIK inhibitor injected into the oocytes could decrease the intrinsic background fluorescence
of the oocytes, thus increasing DF/F.
Subsequently, a second series of optimization experiments was performed. In all of the following
experiments, 300 nM SIK inhibitor was used. Control groups consisted of non-treated oocytes, which
were incubated for either 2 or 3 days, resulting in DF/F = 4.7% ± 0.5 (n = 12) and DF/F = 3.2% ± 0.8
(n = 8), respectively.
The nuclear injection group, which was incubated for 3 days, had a larger DF/F than the other
groups (DF/F = 10.6% ± 2.5 at 500 nm; n = 6). The cytoplasmic injection groups, which were incu-
bated for either 2 or 3 days, resulted in DF/F = 4.5% ± 0.7 (n = 8) and DF/F = 6.4% ± 1.3 (n = 5)
respectively. These results suggest that the optimal conditions for SIK inhibitor treatment are nuclear
injection with 300 nM SIK inhibitor and 3 days incubation (Figure 2E).
After the optimal concentration, injection method, and incubation period were determined for
the Ci-VSP experiment, the SIK inhibitor was then applied to the P2X2 A337Anap/R313W mutant
(Figure 2F,G). R313W is a mutation which decreases the basal current in the absence of ATP, and
the details are described later in Figure 4 and Figure 4—figure supplement 1. 300 nM SIK inhibitor
treatment did not make any significant difference, in terms of the percentage of the fluorescence
change compared to the control group (DF/F = 0.77% ± 0.3 at 440 nm [n = 7] and DF/F = 0.83% ±
0.2 at 440 nm [n = 12], respectively, Figure 2H). However, in the analysis of the incidence of detect-
able DF of Anap, the group treated with 300 nM SIK inhibitor showed a higher incidence than the
control group (control = 57% [n = 7]; 300 nM SIK inhibitor application = 80% [n = 12]; Figure 2—fig-
ure supplement 1A, B). These results showed that in the case of P2X2, SIK inhibitor treatment
improved the incidence of detectable DF/F. Therefore, we decided to use the SIK inhibitor in all of
the following experiments.
ATP- and voltage-evoked Anap fluorescence changes at A337 and I341in TM2 exhibit fast kinetics and linear voltage dependenceApplication of 300 nM SIK inhibitor increased the incidence of DF (68.8 ± 3.2% [n = 6–9] with inhibi-
tor, vs. 14.3 ± 4.1% [n = 5–16] without inhibitor) in A337Anap, with an improved signal-to-noise ratio
(DF/F = 1.5% ± 0.2 at 440 nm [n = 8], Figure 3A). VCF recordings were performed by the application
of 10 mM ATP and voltage step pulses from +40 mV to �140 mV, with a holding potential of +20
mV. Fluorescence intensity change occurred almost instantaneously, in less than 5 ms (Figure 3B).
This showed that the kinetics of DF/F are very rapid and faster than the time course of voltage-
Figure 2 continued
(n = 8), 30 nM (n = 6), and 300 nM SIK inhibitor application (n = 6); *p�0.05, p=0.01639, one-way ANOVA with
Tukey’s post-hoc test for 300 nM, compared to the control group. (E) Comparison of the incubation time and site
of injection of SIK inhibitor treatment using 300 nM SIK inhibitor: control group, 2 days incubation (n = 12), control
group, 3 days incubation (n = 8), SIK inhibitor treatment with cytoplasmic injection with 2 days incubation (n = 8),
with cytoplasmic injection for 3 days (n = 5), with nuclear injection for 3 days (n = 6); **p�0.01, ***p�0.001, one-
way ANOVA with Tukey’s post-hoc test. (F, G) Representative current traces and fluorescence signal of VCF
recordings of P2X2 receptor (A337Anap/R313W) without SIK inhibitor treatment and with the application of 300
nM SIK inhibitor (DF/F = 0.77% ± 0.3 at 440 nm [n = 7]; and DF/F = 0.83% ± 0.2 [n = 12], respectively). (H) A
comparison of non-treated (control) group (n = 7) and 300 nM SIK inhibitor application (n = 12) (p=0.88107, two-
sample t-test for 300 nM compared to the control group). All error bars are ± s.e.m. centered on the mean. Source
data are provided in Figure 2—source data 1. Statistical analysis data are provided in Figure 2—source data 2,
Figure 2—source data 3, and Figure 2—source data 4.
The online version of this article includes the following source data and figure supplement(s) for figure 2:
Source data 1. Effect of SIK inhibitor treatment in Anap-incorporated Ci-VSP and P2X2 receptor.
Source data 2. Statistical analysis to support graph in Figure 2D.
Source data 3. Statistical analysis to support graph in Figure 2E.
Source data 4. Statistical analysis to support graph in Figure 2H.
Figure supplement 1. Effect of 300 nM SIK inhibitor application on the incidence of detectable Anap fluorescencesignal change of P2X2 receptor.
Figure supplement 1—source data 1. Effect of 300 nM SIK inhibitor application on the incidence of detectableAnap fluorescence signal change of P2X2 receptor.
Andriani and Kubo. eLife 2021;10:e65822. DOI: https://doi.org/10.7554/eLife.65822 6 of 30
Research article Structural Biology and Molecular Biophysics
A B
A337Anap
C
E
10 ms
+20 mV
-140 mV
-60 mV
I341Anap
-40 mV
-160 mV
-60 mV
F
+40 mV
+20 mV
0 mV
-40 mV -60 mV
20 ms
D-20 mV
-40 mV
-60 mV
-80 mV
-100 mV
-120 mV
-140 mV
Individual F traces at 440nm
Baseline
20 μA
100 ms
∆F/F
3%
10 μM ATP
10 μM ATP
40 μA
100 ms
∆F/F
0.8%
Individual F traces at 440nm
Baseline
+40 mV
+20 mV
0 mV
-20 mV
-40 mV
-60 mV
G
-80 mV
-100 mV
-120 mV
-140 mV
-160 mV
H
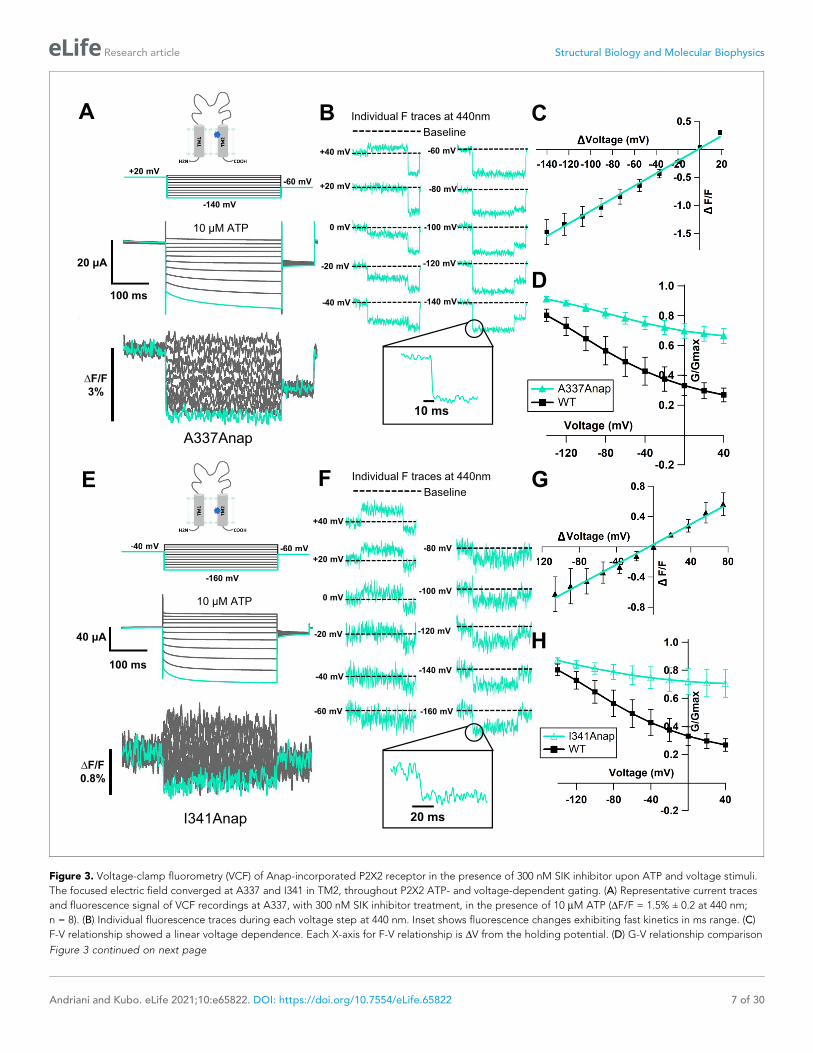
Figure 3. Voltage-clamp fluorometry (VCF) of Anap-incorporated P2X2 receptor in the presence of 300 nM SIK inhibitor upon ATP and voltage stimuli.
The focused electric field converged at A337 and I341 in TM2, throughout P2X2 ATP- and voltage-dependent gating. (A) Representative current traces
and fluorescence signal of VCF recordings at A337, with 300 nM SIK inhibitor treatment, in the presence of 10 mM ATP (DF/F = 1.5% ± 0.2 at 440 nm;
n = 8). (B) Individual fluorescence traces during each voltage step at 440 nm. Inset shows fluorescence changes exhibiting fast kinetics in ms range. (C)
F-V relationship showed a linear voltage dependence. Each X-axis for F-V relationship is DV from the holding potential. (D) G-V relationship comparison
Figure 3 continued on next page
Andriani and Kubo. eLife 2021;10:e65822. DOI: https://doi.org/10.7554/eLife.65822 7 of 30
Research article Structural Biology and Molecular Biophysics
dependent current activation. This also correlates well with the speed of the actual membrane
potential change achieved by voltage clamp. Furthermore, the DF/F–V relationship of A337Anap
showed a linear voltage dependence (y = 0.011x + 0.016; R2 = 0.99 (n = 8), Figure 3C) in the volt-
age range used. These analyses of fluorescence changes at A337 indicated that the downward fluo-
rescence change is not associated with protein conformational change. Rather, it is more likely
related to an electrochromic effect.
Electrochromic effect is a shift in the fluorophore emission spectrum due to the interaction
between two components: the fluorophore electronic state and the local electric field (Bublitz and
Boxer, 1997; Klymchenko and Demchenko, 2002; Dekel et al., 2012). It has two distinctive charac-
teristics: (1) fast kinetics of fluorescent change (DFFast); (2) linear voltage dependence of the F-V rela-
tionship (Asamoah et al., 2003; Klymchenko et al., 2006). The electrochromic effect in some
voltage-sensitive dyes is used to directly detect the change of membrane potential by attaching the
dye to the cell membrane. If the fluorophore is directly attached in a site-specific manner within ion
channels/receptors as shown by studies in the Shaker B K+ channel (Asamoah et al., 2003) and M2
muscarinic receptor (Dekel et al., 2012), the detection of electrochromic effect implies that there is
a convergence of the electric field at the position where the fluorophore is attached. Thus, the
observed fluorescence change at the position of A337 in the P2X2 receptor was explained to be due
to the electrochromic effect, indicating that there is a focused electric field at A337 in the TM2
domain.
We noted that the G-V relationship for this mutant showed that a large fraction of the channel is
already open, even at depolarized potentials, in 10 mM ATP, compared to wildtype (Figure 3D),
because of the high density of the expressed channel, shown by a rather large current amplitude
(>20 mA). A previous study showed that P2X2 channel properties are correlated with expression den-
sity (Fujiwara and Kubo, 2004). In the case of lower expression levels, A337Anap showed a wild-
type-like phenotype. For the purpose of VCF experiments, however, a high expression level is
needed to observe a detectable fluorescence change, and thus we needed to use oocytes with high
expression, resulting in a lesser fraction of voltage-dependent activation. Nonetheless, we could still
observe a weak voltage-dependent relaxation during hyperpolarization, and thus this fluorescence
change still reflects an event occurring at or around the position of A337 when the receptor senses
the change in membrane voltage.
Similarly, the application of 300 nM SIK inhibitor to I341Anap resulted in a clearer (DF/F = 0.6% ±
0.2 at 440 nm [n = 3], Figure 3E) and more frequent Anap DF/F (38.1 ± 9.2%; n = 5–9), compared to
that without SIK inhibitor application (16.02 ± 0.6%; n = 6–13) upon voltage step application in 10
mM ATP. The fluorescence intensity changes also occurred almost instantaneously, in less than 5 ms
(Figure 3F). The DF/F–V relationship of I341Anap upon voltage step pulses in the presence of 10 mM
of ATP, from +40 mV to �160 mV with a holding potential at �40 mV, also showed a linear
voltage dependence (y = 0.007x + 0.03; R2 = 0.99; n = 3, Figure 3G).
Thus, DF observed at the position of I341 in the TM2 domain also did not correlate with hyperpo-
larization-induced conformational change. The changes are likely to be due to a phenomenon similar
to that observed at the position of A337, which is related to the electrochromic effect. The G-V
Figure 3 continued
between A337Anap (turquoise filled triangle) and wildtype (black filled square) for 10 mM ATP (n = 8). Normalization was done based on the maximum
conductance in the same concentration of ATP (10 mM) for each construct. (E) Representative current traces and fluorescence signal of VCF recordings
at I341, with 300 nM SIK inhibitor treatment, in the presence of 10 mM ATP (DF/F = 0.6% ± 0.2 at 440 nm [n = 3]). (F) Individual fluorescence traces in
each voltage step at 440 nm. Inset shows fluorescence changes also exhibiting fast kinetics in ms range. (G) F-V relationship showed a linear
voltage dependence. Each X-axis for F-V relationship is DV from the holding potential. (H) G-V relationship comparison between I341Anap (turquoise
open triangle) and wildtype (black filled square) for 10 mM ATP (n = 3). Normalization was done based on the maximum conductance in the same
concentration of ATP (10 mM) for each construct. All error bars are ± s.e.m. centered on the mean. Source data are provided in Figure 3—source data
1.
The online version of this article includes the following source data and figure supplement(s) for figure 3:
Source data 1. VCF of A337Anap and I341Anap in the presence of 300 nM SIK inhibitor upon ATP and voltage stimuli.
Figure supplement 1. Voltage-clamp fluorometry (VCF) of L334Anap and L338Anap in the presence of 300 nM SIK inhibitor, with ATP and voltagesteps.
Figure supplement 1—source data 1. VCF of L334Anap and L338Anap in the presence of 300 nM SIK inhibitor, with ATP and voltage steps.
Andriani and Kubo. eLife 2021;10:e65822. DOI: https://doi.org/10.7554/eLife.65822 8 of 30
Research article Structural Biology and Molecular Biophysics
relationship of this mutant in the presence of 10 mM ATP was not different from that of A337Anap,
as shown in Figure 3H. Taking these results together, the observed fluorescence intensity changes
at I341 and A337 in the TM2 domain are best explained by an electric field convergence close to
both positions, which could be critical for the complex gating of the P2X2 receptor.
Since the Anap mutant scanning experiments were initially performed in the absence of an SIK
inhibitor, there was a possibility that there were fluorescence changes which went undetected. Thus,
we performed VCF recordings with SIK inhibitor treatment in some Anap mutants which had been
screened before. The focus was on residues surrounding A337 and I341 in the TM1 and TM2
domains. In the re-screening experiments, we observed small DF at L334 and L338: L334Anap: DF/
F = 0.38% ± 0.2 at 440 nm (n = 2), and L338Anap: DF/F = 0.26% ± 0.03 at 440 nm (n = 4), as shown
in Figure 3—figure supplement 1. Moreover, the incidence of fluorescence change detection for
L338Anap in three batches (20 cells in total) was 2/5, 0/5, and 2/10. For L334Anap it was 0/5, 0/10,
and 2/6 in three batches (21 cells in total). These results suggest that the focused electric field might
lie at TM2 from L334 down to I341, and that it is more strongly converged at A337 and I341,
because the electrochromic signal at A337 and I341 was observed more frequently.
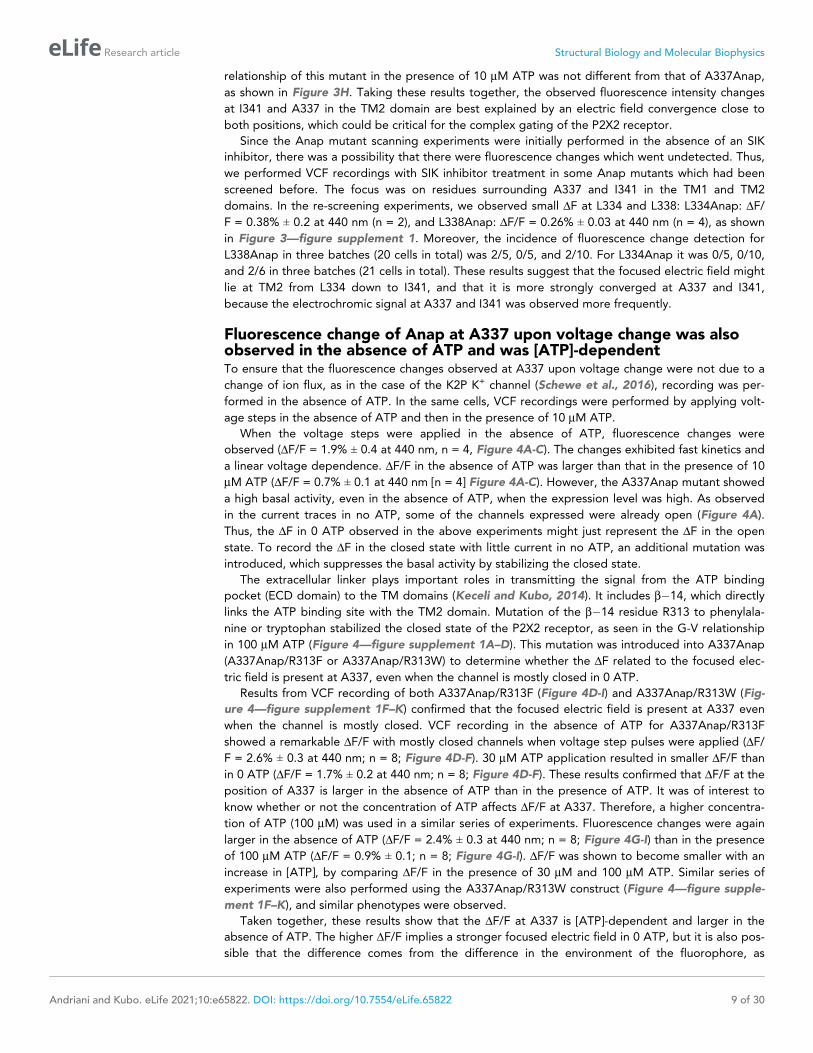
Fluorescence change of Anap at A337 upon voltage change was alsoobserved in the absence of ATP and was [ATP]-dependentTo ensure that the fluorescence changes observed at A337 upon voltage change were not due to a
change of ion flux, as in the case of the K2P K+ channel (Schewe et al., 2016), recording was per-
formed in the absence of ATP. In the same cells, VCF recordings were performed by applying volt-
age steps in the absence of ATP and then in the presence of 10 mM ATP.
When the voltage steps were applied in the absence of ATP, fluorescence changes were
observed (DF/F = 1.9% ± 0.4 at 440 nm, n = 4, Figure 4A-C). The changes exhibited fast kinetics and
a linear voltage dependence. DF/F in the absence of ATP was larger than that in the presence of 10
mM ATP (DF/F = 0.7% ± 0.1 at 440 nm [n = 4] Figure 4A-C). However, the A337Anap mutant showed
a high basal activity, even in the absence of ATP, when the expression level was high. As observed
in the current traces in no ATP, some of the channels expressed were already open (Figure 4A).
Thus, the DF in 0 ATP observed in the above experiments might just represent the DF in the open
state. To record the DF in the closed state with little current in no ATP, an additional mutation was
introduced, which suppresses the basal activity by stabilizing the closed state.
The extracellular linker plays important roles in transmitting the signal from the ATP binding
pocket (ECD domain) to the TM domains (Keceli and Kubo, 2014). It includes b�14, which directly
links the ATP binding site with the TM2 domain. Mutation of the b�14 residue R313 to phenylala-
nine or tryptophan stabilized the closed state of the P2X2 receptor, as seen in the G-V relationship
in 100 mM ATP (Figure 4—figure supplement 1A–D). This mutation was introduced into A337Anap
(A337Anap/R313F or A337Anap/R313W) to determine whether the DF related to the focused elec-
tric field is present at A337, even when the channel is mostly closed in 0 ATP.
Results from VCF recording of both A337Anap/R313F (Figure 4D-I) and A337Anap/R313W (Fig-
ure 4—figure supplement 1F–K) confirmed that the focused electric field is present at A337 even
when the channel is mostly closed. VCF recording in the absence of ATP for A337Anap/R313F
showed a remarkable DF/F with mostly closed channels when voltage step pulses were applied (DF/
F = 2.6% ± 0.3 at 440 nm; n = 8; Figure 4D-F). 30 mM ATP application resulted in smaller DF/F than
in 0 ATP (DF/F = 1.7% ± 0.2 at 440 nm; n = 8; Figure 4D-F). These results confirmed that DF/F at the
position of A337 is larger in the absence of ATP than in the presence of ATP. It was of interest to
know whether or not the concentration of ATP affects DF/F at A337. Therefore, a higher concentra-
tion of ATP (100 mM) was used in a similar series of experiments. Fluorescence changes were again
larger in the absence of ATP (DF/F = 2.4% ± 0.3 at 440 nm; n = 8; Figure 4G-I) than in the presence
of 100 mM ATP (DF/F = 0.9% ± 0.1; n = 8; Figure 4G-I). DF/F was shown to become smaller with an
increase in [ATP], by comparing DF/F in the presence of 30 mM and 100 mM ATP. Similar series of
experiments were also performed using the A337Anap/R313W construct (Figure 4—figure supple-
ment 1F–K), and similar phenotypes were observed.
Taken together, these results show that the DF/F at A337 is [ATP]-dependent and larger in the
absence of ATP. The higher DF/F implies a stronger focused electric field in 0 ATP, but it is also pos-
sible that the difference comes from the difference in the environment of the fluorophore, as
Andriani and Kubo. eLife 2021;10:e65822. DOI: https://doi.org/10.7554/eLife.65822 9 of 30
Research article Structural Biology and Molecular Biophysics
A
0 ATP
10 µM ATP
B
D E
G
0 ATP
30 µM ATP
0 ATP
100 µM ATP
H
20 μA
100 ms
∆F/F
3%
30 μA
100 ms
∆F/F
1%
5 μA
100 ms
∆F/F
3.3%
100 ms
∆F/F
2.2%
10 μA
5 μA
100 ms
∆F/F
4%
20 μA
100 ms
∆F/F
2%
C
F
I
A337Anap
R313F/A337Anap
R313F/A337Anap
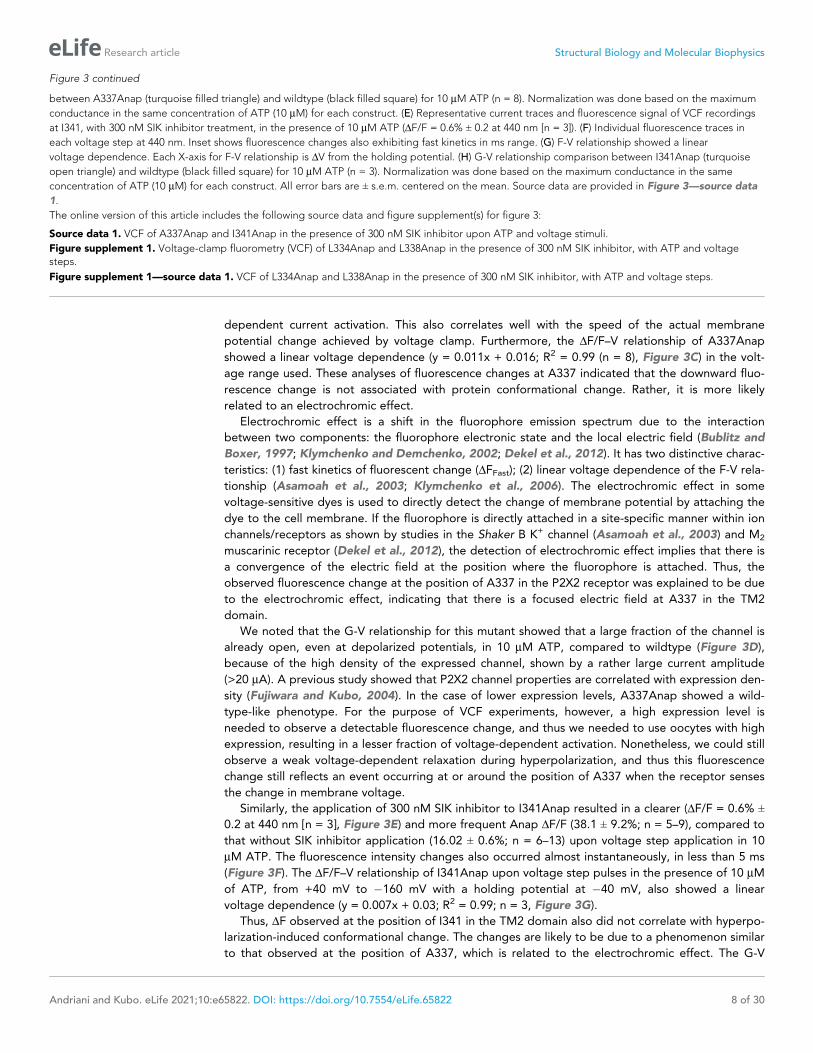
Figure 4. Voltage-clamp fluorometry (VCF) of Anap-labeled P2X2 at A337 in TM2 evoked by hyperpolarization in the absence and presence of ATP.
Anap fluorescence changes at A337 were observed even in the absence of ATP upon hyperpolarization. (A) Representative current traces and
fluorescence signal of VCF recordings at A337 in the absence of ATP (DF/F = 1.9% ± 0.4 at 440 nm (n = 4)) and in the presence of 10 mM ATP (DF/F =
0.7% ± 0.1 at 440 nm (n = 4)), from the same cell. (B) Comparison of the fluorescence changes in the absence and in the presence of 10 mM ATP
Figure 4 continued on next page
Andriani and Kubo. eLife 2021;10:e65822. DOI: https://doi.org/10.7554/eLife.65822 10 of 30
Research article Structural Biology and Molecular Biophysics
discussed later (Figure 6—figure supplement 1). In any case, it was shown that a DF/F and thus a
focused electric field are present both in the absence and the presence of ATP.
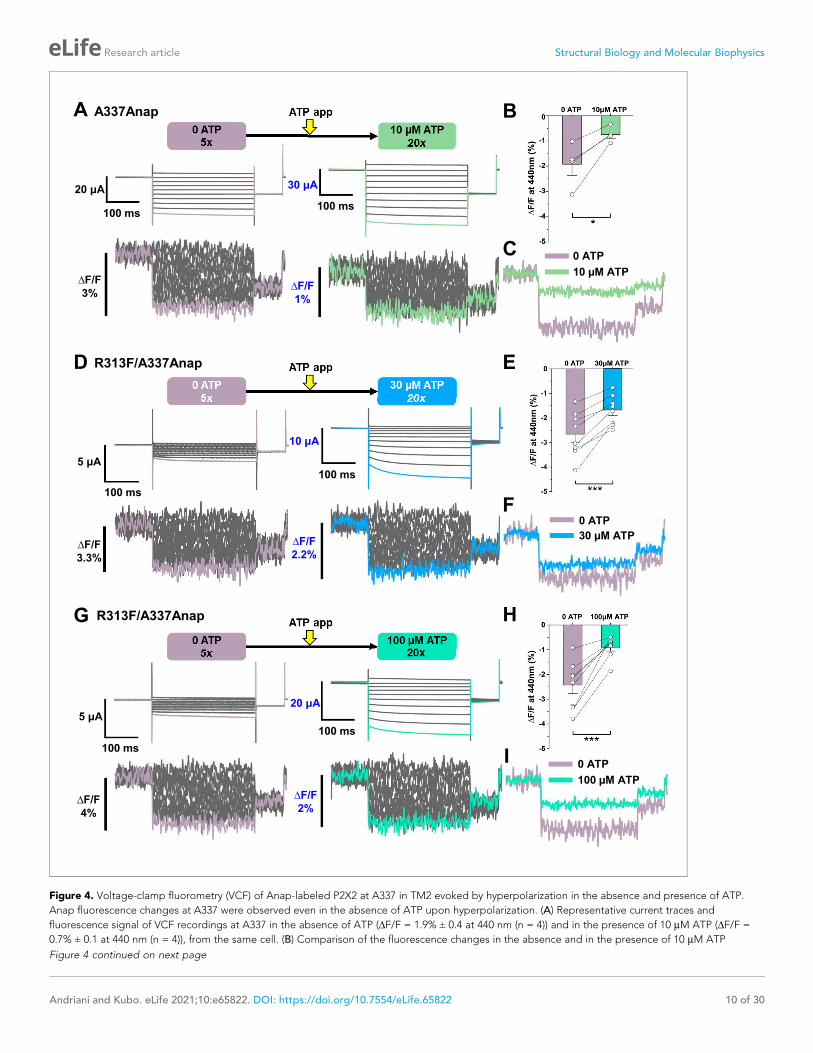
Hyperpolarization-induced structural rearrangements were detected atand around A337 in TM2, upon the additional mutation of K308RUpon ATP binding, the P2X receptor undergoes major structural rearrangements, which result in
transitions from closed to open state, with remarkable alterations in three regions: the ATP binding
site, the extracellular linker, which links ECD to TM domains, and the TM domains (Kawate et al.,
2009; Hattori and Gouaux, 2012; Mansoor et al., 2016). There is a possibility that the P2X2 recep-
tor could undergo relatively minor but important structural rearrangements in response to hyperpo-
larization of the membrane voltage, after the major structural rearrangements caused by the binding
of ATP. A fraction of a slow DF and non-linear DF/F–V has not been detected so far. This might be
due to suppression of voltage-dependent activation in high-expression oocytes, in which there is sig-
nificant activity even at depolarized potentials (e.g., Figure 3D,H). Thus, an additional mutation
which shows remarkable voltage-dependent activation, even in high expression conditions, is
needed.
We then tested this possibility by introducing a K308R mutation into A337Anap. This charge-
maintaining mutation, K308R, is shown to make the voltage-dependent activation more prominent,
that is, it is least active at depolarized potentials, even in high-expression oocytes, and it also accel-
erates the activation kinetics of P2X2 upon voltage steps (Keceli and Kubo, 2009). K308 is a con-
served residue located in the ATP binding site. It was shown to be important, not only for ATP
binding (Ennion et al., 2000; Jiang et al., 2000; Roberts et al., 2006), but also for the conforma-
tional change associated with channel opening (Cao et al., 2007). If the voltage-dependent activa-
tion is more prominent, even in the high-expression cells for VCF experiments, there was a
possibility that we might be able to detect DF associated with voltage-dependent gating.
VCF recording of K308R/A337Anap was performed in the presence of 300 mM ATP, while a volt-
age-step from +40 mV to �160 mV, with a holding potential of +20 mV, was applied. A high concen-
tration of ATP was applied because K308R/A337Anap has a lower sensitivity to ATP. ATP-evoked
current of K308/A337Anap was inhibited by both Suramin and PPADS, the P2X2 non-specific block-
ers, confirming that the current is indeed a P2X2 receptor current (Figure 5—figure supplement 1).
Hyperpolarization elicited fluorescence signals which consisted of two components, a very fast
decrease (DFFast/F) and a slow increase (DFSlow/F) to steady state (DFSteady-state/F) (Figure 5A,B). Plots
of the F-V relationship at the end of the recording time interval (at the steady state) showed that F-V
consisted of mixed components, a linear component and a non-linear component (Figure 5C). The
Figure 4 continued
(*p�0.05, p=0.02876, paired t-test; n = 4). (C) Superimposed fluorescence traces at �140 mV, in 0 ATP (light purple) and 10 mM ATP (light green), from
the same cell. (D–I) An additional R313F mutation was introduced to lower the basal activity of A337Anap and stabilize the closed state. (D)
Representative current traces and fluorescence signal of VCF recordings of A337/R313F in the absence of ATP (DF/F = 2.6% ± 0.3 at 440 nm; n = 8) and
in the presence of 30 mM ATP (DF/F = 1.7% ± 0.2; n = 8) from the same cell. (E) Comparison of the fluorescence changes in the absence and in the
presence of 30 mM ATP (***p�0.001, p=0.00045, paired t-test; n = 8). (F) Superimposed fluorescence traces at �140 mV, in 0 ATP (light purple) and 30
mM ATP (blue), from the same cell. (G) Representative current traces and fluorescence signal of VCF recordings of A337/R313F in the absence of ATP
(DF/F = 2.4% ± 0.3 at 440 nm; n = 8) and in the presence of 100 mM ATP (DF/F = 0.9% ± 0.1; n = 8). (H) Comparison of the fluorescence changes in the
absence and in the presence of 100 mM ATP (***p�0.001, p=0.0005, paired t-test; n = 8). (I) Superimposed fluorescence traces at �140 mV in 0 ATP
(light purple) and 100 mM ATP (turquoise), from the same cell. All error bars are ± s.e.m. centered on the mean. Source data are provided in Figure 4—
source data 1. Statistical analysis data are provided in Figure 4—source data 2, Figure 4—source data 3, and Figure 4—source data 4.
The online version of this article includes the following source data and figure supplement(s) for figure 4:
Source data 1. VCF of Anap-labeled P2X2 at A337 evoked by hyperpolarization in the absence and presence of ATP.
Source data 2. Statistical analysis to support graph in Figure 4B.
Source data 3. Statistical analysis to support graph in Figure 4E.
Source data 4. Statistical analysis to support graph in Figure 4H.
Figure supplement 1. VCF of Anap-labeled P2X2 at A337 in TM2 evoked by hyperpolarization in the absence and presence of ATP.
Figure supplement 1—source data 1. VCF of Anap-labeled P2X2 at A337 evoked by hyperpolarization in the absence and presence of ATP.
Figure supplement 1—source data 2. Statistical analysis to support graph in Figure 4—figure supplement 1G.
Figure supplement 1—source data 3. Statistical analysis to support graph in Figure 4—figure supplement 1J.
Andriani and Kubo. eLife 2021;10:e65822. DOI: https://doi.org/10.7554/eLife.65822 11 of 30
Research article Structural Biology and Molecular Biophysics
A
+20 mV
-160 mV
-60 mV
B
∆FFast/F
∆FSlow/F
∆Fsteady-state/F
F
G
H
K
D
E
300 μM ATP
20 μA
100 ms
∆F/F
2%
-160 mV
+20 mV+80 mV
-60 mV
300 μM ATP
20 μA
100 ms
∆F/F
4%
+80 mV
+60 mV
+40 mV
+60 mV
-140 mV
-160 mV
+40 mV
+20 mV
0 mV
-20 mV
-40 mV
-60 mV
-80 mV
-100 mV
-120 mV
-140 mV
-160 mV
Individual F traces at 440nm
BaselineC
Individual F traces at 440nm
Baseline
J
I
A337
K308
ATP-bound open state
Figure 5. Voltage-clamp fluorometry (VCF) of Anap-labeled P2X2 at A337 in TM2 with the additional mutation of K308R evoked by hyperpolarization in
the presence of ATP. (A) Representative current traces and fluorescence signal of VCF recordings of K308R/A337Anap with 300 nM SIK inhibitor
treatment in the presence of 300 mM ATP, from +40 mV to �160 mV with a holding potential of +20 mV (DFSteady-state/F = 3.4% ± 0.3 at 440 nm, n = 8).
(B) Individual fluorescence traces at each voltage step. Inset shows that the fluorescence signal of K308R/A337Anap consists of two components,
Figure 5 continued on next page
Andriani and Kubo. eLife 2021;10:e65822. DOI: https://doi.org/10.7554/eLife.65822 12 of 30
Research article Structural Biology and Molecular Biophysics
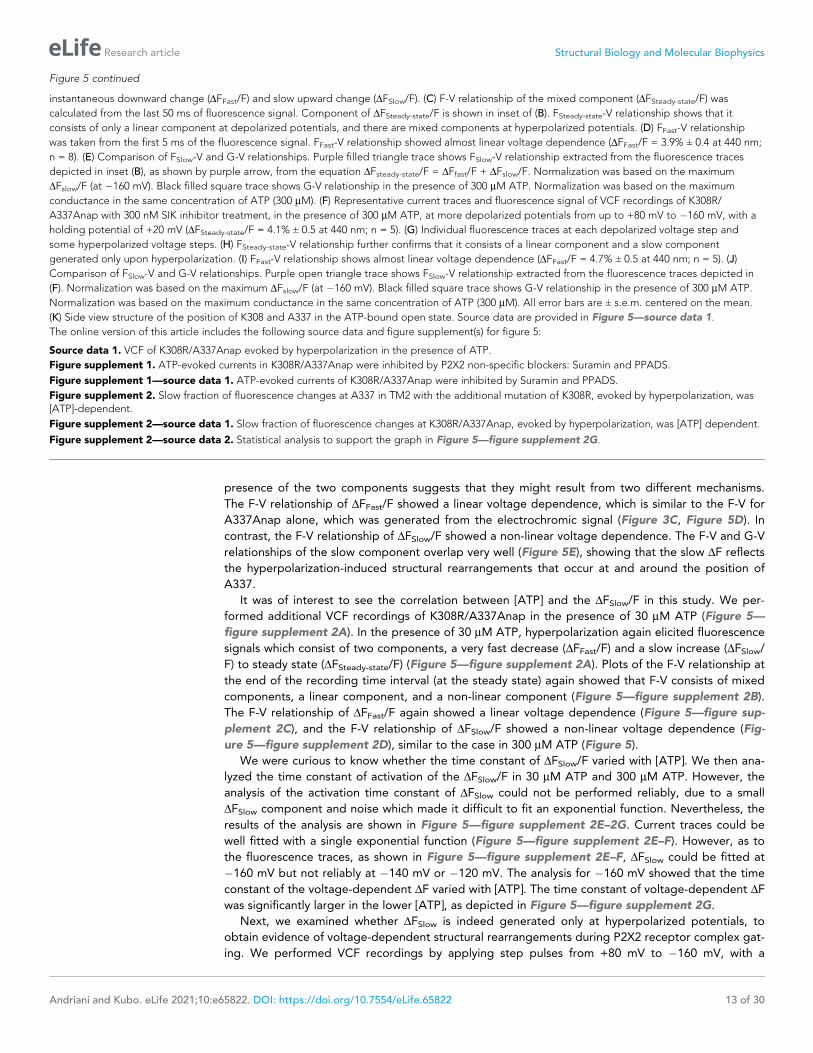
presence of the two components suggests that they might result from two different mechanisms.
The F-V relationship of DFFast/F showed a linear voltage dependence, which is similar to the F-V for
A337Anap alone, which was generated from the electrochromic signal (Figure 3C, Figure 5D). In
contrast, the F-V relationship of DFSlow/F showed a non-linear voltage dependence. The F-V and G-V
relationships of the slow component overlap very well (Figure 5E), showing that the slow DF reflects
the hyperpolarization-induced structural rearrangements that occur at and around the position of
A337.
It was of interest to see the correlation between [ATP] and the DFSlow/F in this study. We per-
formed additional VCF recordings of K308R/A337Anap in the presence of 30 mM ATP (Figure 5—
figure supplement 2A). In the presence of 30 mM ATP, hyperpolarization again elicited fluorescence
signals which consist of two components, a very fast decrease (DFFast/F) and a slow increase (DFSlow/
F) to steady state (DFSteady-state/F) (Figure 5—figure supplement 2A). Plots of the F-V relationship at
the end of the recording time interval (at the steady state) again showed that F-V consists of mixed
components, a linear component, and a non-linear component (Figure 5—figure supplement 2B).
The F-V relationship of DFFast/F again showed a linear voltage dependence (Figure 5—figure sup-
plement 2C), and the F-V relationship of DFSlow/F showed a non-linear voltage dependence (Fig-
ure 5—figure supplement 2D), similar to the case in 300 mM ATP (Figure 5).
We were curious to know whether the time constant of DFSlow/F varied with [ATP]. We then ana-
lyzed the time constant of activation of the DFSlow/F in 30 mM ATP and 300 mM ATP. However, the
analysis of the activation time constant of DFSlow could not be performed reliably, due to a small
DFSlow component and noise which made it difficult to fit an exponential function. Nevertheless, the
results of the analysis are shown in Figure 5—figure supplement 2E–2G. Current traces could be
well fitted with a single exponential function (Figure 5—figure supplement 2E–F). However, as to
the fluorescence traces, as shown in Figure 5—figure supplement 2E–F, DFSlow could be fitted at
�160 mV but not reliably at �140 mV or �120 mV. The analysis for �160 mV showed that the time
constant of the voltage-dependent DF varied with [ATP]. The time constant of voltage-dependent DF
was significantly larger in the lower [ATP], as depicted in Figure 5—figure supplement 2G.
Next, we examined whether DFSlow is indeed generated only at hyperpolarized potentials, to
obtain evidence of voltage-dependent structural rearrangements during P2X2 receptor complex gat-
ing. We performed VCF recordings by applying step pulses from +80 mV to �160 mV, with a
Figure 5 continued
instantaneous downward change (DFFast/F) and slow upward change (DFSlow/F). (C) F-V relationship of the mixed component (DFSteady-state/F) was
calculated from the last 50 ms of fluorescence signal. Component of DFSteady-state/F is shown in inset of (B). FSteady-state-V relationship shows that it
consists of only a linear component at depolarized potentials, and there are mixed components at hyperpolarized potentials. (D) FFast-V relationship
was taken from the first 5 ms of the fluorescence signal. FFast-V relationship showed almost linear voltage dependence (DFFast/F = 3.9% ± 0.4 at 440 nm;
n = 8). (E) Comparison of FSlow-V and G-V relationships. Purple filled triangle trace shows FSlow-V relationship extracted from the fluorescence traces
depicted in inset (B), as shown by purple arrow, from the equation DFsteady-state/F = DFfast/F + DFslow/F. Normalization was based on the maximum
DFslow/F (at �160 mV). Black filled square trace shows G-V relationship in the presence of 300 mM ATP. Normalization was based on the maximum
conductance in the same concentration of ATP (300 mM). (F) Representative current traces and fluorescence signal of VCF recordings of K308R/
A337Anap with 300 nM SIK inhibitor treatment, in the presence of 300 mM ATP, at more depolarized potentials from up to +80 mV to �160 mV, with a
holding potential of +20 mV (DFSteady-state/F = 4.1% ± 0.5 at 440 nm; n = 5). (G) Individual fluorescence traces at each depolarized voltage step and
some hyperpolarized voltage steps. (H) FSteady-state-V relationship further confirms that it consists of a linear component and a slow component
generated only upon hyperpolarization. (I) FFast-V relationship shows almost linear voltage dependence (DFFast/F = 4.7% ± 0.5 at 440 nm; n = 5). (J)
Comparison of FSlow-V and G-V relationships. Purple open triangle trace shows FSlow-V relationship extracted from the fluorescence traces depicted in
(F). Normalization was based on the maximum DFslow/F (at �160 mV). Black filled square trace shows G-V relationship in the presence of 300 mM ATP.
Normalization was based on the maximum conductance in the same concentration of ATP (300 mM). All error bars are ± s.e.m. centered on the mean.
(K) Side view structure of the position of K308 and A337 in the ATP-bound open state. Source data are provided in Figure 5—source data 1.
The online version of this article includes the following source data and figure supplement(s) for figure 5:
Source data 1. VCF of K308R/A337Anap evoked by hyperpolarization in the presence of ATP.
Figure supplement 1. ATP-evoked currents in K308R/A337Anap were inhibited by P2X2 non-specific blockers: Suramin and PPADS.
Figure supplement 1—source data 1. ATP-evoked currents of K308R/A337Anap were inhibited by Suramin and PPADS.
Figure supplement 2. Slow fraction of fluorescence changes at A337 in TM2 with the additional mutation of K308R, evoked by hyperpolarization, was[ATP]-dependent.
Figure supplement 2—source data 1. Slow fraction of fluorescence changes at K308R/A337Anap, evoked by hyperpolarization, was [ATP] dependent.
Figure supplement 2—source data 2. Statistical analysis to support the graph in Figure 5—figure supplement 2G.
Andriani and Kubo. eLife 2021;10:e65822. DOI: https://doi.org/10.7554/eLife.65822 13 of 30
Research article Structural Biology and Molecular Biophysics
holding potential of +20 mV. The F-V relationship in the steady state showed a mixed signal. This
set of recordings showed that at more depolarized potentials the fluorescence signal consists only of
a linear component (Figure 5F-H). Separation of the mixed fluorescence signal also resulted in a rap-
idly changing linear F-V for DFFast/F (Figure 5I) and a non-linear F-V for DFSlow/F (Figure 5J), with no
slow component from +80 mV to 0 mV.
The results further confirm that the slow rise in K308R/A337Anap fluorescence signal reflects
structural rearrangements at and around the position of A337 in response to changes in membrane
voltage.
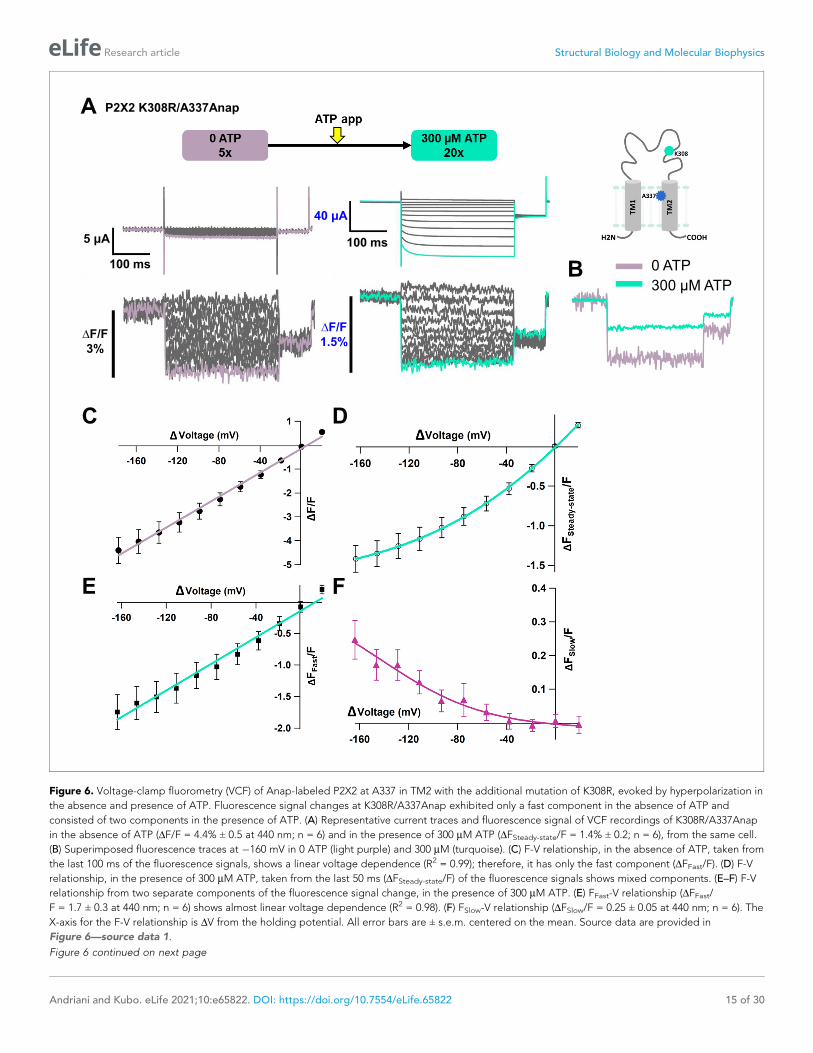
Fluorescence signal changes at A337Anap/K308R exhibited only thefast component in the absence of ATP and showed two components inthe presence of ATPWe also examined whether the non-linear component of the K308R/A337Anap fluorescence signal
was abolished in the absence of ATP. We performed VCF recordings of the same cell, by applying
voltage steps in the absence of ATP and in the presence of 300 mM ATP. In the absence of ATP, the
fluorescence signal consisted of only one component, the fast component (DFFast/F, Figure 6A,B).
The F-V relationship for DFFast/F was linear and is thought to be derived from the electrochromic
phenomenon, showing that A337 is located in the focused electric field (Figure 6C).
Subsequently, when the voltage step pulses were applied in the presence of 300 mM ATP, the
slow component could be observed (Figure 6A,B,D). The F-V relationship in the steady state
showed a mixture of the two components (Figure 6D). Separation of this mixed component resulted
in a linear F-V for the fast component (Figure 6E) and a non-linear F-V for the slow component
(Figure 6F), which is consistent with the previous experiments. Taken together, these results further
show that the slow component of the fluorescence intensity changes reflects structural rearrange-
ments of the P2X2 receptor, which depend on both [ATP] and voltage.
Additionally, results consistent with Figure 4E,F,H, and I were also obtained in terms of the fluo-
rescence intensity change of the fast component. DFFast/F in the absence of ATP was larger than in
the presence of ATP (DFFast/F = 4.4% ± 0.5 at 440 nm [n = 6] and DFFast/F = 1.7% ± 0.3 at 440
nm [n = 6]; Figure 6B). However, there was a concern that F itself significantly changed due to a dif-
ference in the environment surrounding A337Anap in the closed and open states. We performed
experiments to address this by measuring the absolute F (output of the photomultiplier tube) in the
absence and in the presence of ATP. Using the K308R/A337Anap construct, each recording was
repeated five times, for averaging, in the same cell as shown in Figure 6—figure supplement 1.
There was a slight reduction, not increase, in the F in the presence of ATP, which could be due to
fluorescence bleaching (Figure 6—figure supplement 1A,B). Thus, a larger DF/F in the absence of
ATP is thought not to be due to less F, and we concluded that DF/F was larger in the absence of
ATP. The noise level is similar (Figure 6—figure supplement 1C), showing that the apparent larger
noise level in 0 ATP (Figure 4C, F, and I; Figure 4—figure supplement 1H,K; Figure 6B) is not due
to smaller F but due to a lower number of averaged traces.
A337 in TM2 might interact with F44 in TM1 to stabilize the open stateof the P2X2 receptorThe electric field convergence at A337 and I341 and the voltage-dependent conformational changes
at or around A337 could provide us with a clue to understand the mechanism of the complex gating
of the P2X2 receptor. The existence of a strong electric field supports the possible location of a key
residue which is responsible for voltage sensing (Asamoah et al., 2003; Dekel et al., 2012). Thus,
various single amino acid mutations were introduced at the position of A337, and their electrophysi-
ological properties were analyzed, focusing on the [ATP]- and voltage-dependent gating properties,
to see whether or not this amino acid plays an important role in the P2X2 complex gating
(Figure 7A,B).
Mutations to A337R, A337K, and A337D had severe effects. When the voltage step pulses were
applied in 30 mM ATP, these mutants almost lacked voltage sensitivity. A337E, A337Y, and A337F
showed voltage sensitivity with various activation kinetics. The most striking changes were observed
in A337Y and A337F. The activation evoked by a voltage step was clearly different from wildtype,
whereas the A337E mutation had a less severe effect (Figure 7A). G-V relationships in 30 mM ATP
Andriani and Kubo. eLife 2021;10:e65822. DOI: https://doi.org/10.7554/eLife.65822 14 of 30
Research article Structural Biology and Molecular Biophysics
A
E
0 ATP
300 µM ATPB
P2X2 K308R/A337Anap
5 μA
100 ms
40 μA
100 ms
∆F/F
3%
∆F/F
1.5%
C D
F
Figure 6. Voltage-clamp fluorometry (VCF) of Anap-labeled P2X2 at A337 in TM2 with the additional mutation of K308R, evoked by hyperpolarization in
the absence and presence of ATP. Fluorescence signal changes at K308R/A337Anap exhibited only a fast component in the absence of ATP and
consisted of two components in the presence of ATP. (A) Representative current traces and fluorescence signal of VCF recordings of K308R/A337Anap
in the absence of ATP (DF/F = 4.4% ± 0.5 at 440 nm; n = 6) and in the presence of 300 mM ATP (DFSteady-state/F = 1.4% ± 0.2; n = 6), from the same cell.
(B) Superimposed fluorescence traces at �160 mV in 0 ATP (light purple) and 300 mM (turquoise). (C) F-V relationship, in the absence of ATP, taken from
the last 100 ms of the fluorescence signals, shows a linear voltage dependence (R2 = 0.99); therefore, it has only the fast component (DFFast/F). (D) F-V
relationship, in the presence of 300 mM ATP, taken from the last 50 ms (DFSteady-state/F) of the fluorescence signals shows mixed components. (E–F) F-V
relationship from two separate components of the fluorescence signal change, in the presence of 300 mM ATP. (E) FFast-V relationship (DFFast/
F = 1.7 ± 0.3 at 440 nm; n = 6) shows almost linear voltage dependence (R2 = 0.98). (F) FSlow-V relationship (DFSlow/F = 0.25 ± 0.05 at 440 nm; n = 6). The
X-axis for the F-V relationship is DV from the holding potential. All error bars are ± s.e.m. centered on the mean. Source data are provided in
Figure 6—source data 1.
Figure 6 continued on next page
Andriani and Kubo. eLife 2021;10:e65822. DOI: https://doi.org/10.7554/eLife.65822 15 of 30
Research article Structural Biology and Molecular Biophysics
for mutants and wildtype were analyzed (Figure 7B). Normalization was based on the maximum con-
ductance at the highest ATP concentration (300 mM) for each construct. Here we could also see that
A337Y and A337F preferred to stay in the closed state. Thus, the alteration of activation kinetics and
voltage dependence by mutation of A337 showed that this position is critical for the P2X2 receptor
complex gating.
Next, we aimed to identify the counterpart in the TM1 domain with which A337 might have an
interaction during complex gating. Based on the crystal structure data of hP2X3 in the closed and
ATP-bound open states (PDB ID: 5SVJ, 5SVK, respectively) (Mansoor et al., 2016), homology
modeling of rP2X2 showed that F44 in the TM1 domain rotates and moves towards A337 upon ATP
binding (Figure 7C,D). Various single amino acid mutations were then introduced at F44, and the
[ATP]- and voltage-dependent gating was analyzed (Figure 7E,F).
The F44A mutation strikingly changed the gating. It showed a relatively high basal current in the
absence of ATP and further responded to ATP application. Voltage-dependent gating was also
changed, as seen in the lack of tail current, showing that this mutant might have constitutive activity
with rectified permeation properties. Mutation to positively charged residues (F44R, F44K) resulted
in a non-functional channel and/or a very low expression level, as the recording on day four did not
evoke any response to the highest concentration of ATP used in this study (300 mM). Mutation to
negatively charged residues (F44E, F44D) and aromatic residues (F44Y, F44W) remarkably changed
the ATP-evoked response (Figure 7E). All four mutants still opened upon the application of ATP,
but current decay in the continuous presence of ATP appeared to be faster than wildtype.
F44 is conserved only in P2X2 and P2X3, within the P2X family. Other subtypes of P2X receptor,
such as P2X1, P2X4, P2X6, and P2X7, except P2X5, have valine at the corresponding position
(Kawate et al., 2009). Thus, the F44V mutation was also introduced. 10 mM of ATP could activate
F44V but resulted in faster current decay than wildtype.
Voltage step pulses were applied during the course of current decay, because there was no clear
steady state (Figure 7E). Nonetheless, the effect of the mutation at F44V on the voltage-dependent
gating could still be observed. The G-V relationship of F44V in 10 mM ATP showed that this mutant
was far less sensitive to voltage than wildtype (Figure 7F). Taken together, the results of the muta-
tions introduced at position F44 showed that this residue is critical for the proper ATP- and voltage-
dependent gating of the P2X2 receptor.
Additionally, as the single amino acid mutations at both A337 and F44 altered the gating of
P2X2, it was of interest to determine whether the introduction of swapped mutations into A337/F44
would rescue the wildtype phenotype. The phenotype of F44A/A337F was similar to F44A, and the
wildtype phenotype was not rescued (Figure 7—figure supplement 1). It is possible that an interac-
tion between A337 and F44 could not be properly formed in the swapped mutant.
Next, an artificial electrostatic bridge was introduced between A337 and F44 to prove that the
interaction between the two residues is critical in the ATP-bound open state. Various paired electro-
statically charged residues were introduced into A337 and F44, in order to see if the artificial electro-
static bridge could be formed. The F44E/A337R pair showed constitutive activity. This double
mutant was already open before ATP application and did not show any response to ATP
(Figure 7G). When voltage step pulses were applied, this mutant lacked sensitivity to voltage, with a
rectified permeation property, as seen by the total lack of tail currents (Figure 7H). Additionally,
comparison of the current amplitude before and after ATP application showed that F44E/A337R was
already open before ATP application (Figure 7I). The results showed that A337 in the TM2 domain
might interact with F44 in TM1 to stabilize the open state of the P2X2 receptor.
Figure 6 continued
The online version of this article includes the following source data and figure supplement(s) for figure 6:
Source data 1. VCF of K308R/A337Anap evoked by hyperpolarization in the absence and presence of ATP.
Figure supplement 1. Voltage-clamp fluorometry (VCF) of Anap-labeled P2X2 at A337 in TM2 with the additional mutation of K308R, evoked byhyperpolarization in the absence and presence of ATP.
Figure supplement 1—source data 1. VCF of K308R/A337Anap evoked by hyperpolarization in the absence and presence of ATP.
Figure supplement 1—source data 2. Statistical analysis to support graph in Figure 6—figure supplement 1B.
Andriani and Kubo. eLife 2021;10:e65822. DOI: https://doi.org/10.7554/eLife.65822 16 of 30
Research article Structural Biology and Molecular Biophysics
A337R A337D
A337F A337Y
F44A
A
A337E
TM2TM1
F44
A337
TM1 TM2
A337F44
E
C DWT
A337K
5 μA
100 ms
5 μA
100 ms 2 μA
100 ms
5 μA
100 ms5 μA
100 ms
5 μA
100 ms
10 μA
100 ms
30 μM ATP
30 μM ATP
30 μM ATP
30 μM ATP
30 μM ATP
30 μM ATP
30 μM ATP
Closed state ATP-bound open state
2.5 μA
2 s
10 μM ATP
5 μA
100 ms
F44E
2 μA
5 s
F44W
F44Y
WT F
I
1 μA
100 ms
5 s5 μA
5 s
15 μA
5 s
30 μM ATP F44D
3 μA
2.5 s
4 μA
100 ms
30 μM ATP
3 μM ATP
3 μM ATP
30 μM ATP
30 μM ATP
1.5 μA
10 s
4 μA
100 ms
B
F44E/A337RG
F44V
5 μA
5 s
10 μM ATP
4 μA
100 ms
5 μA
30 μM ATP
H
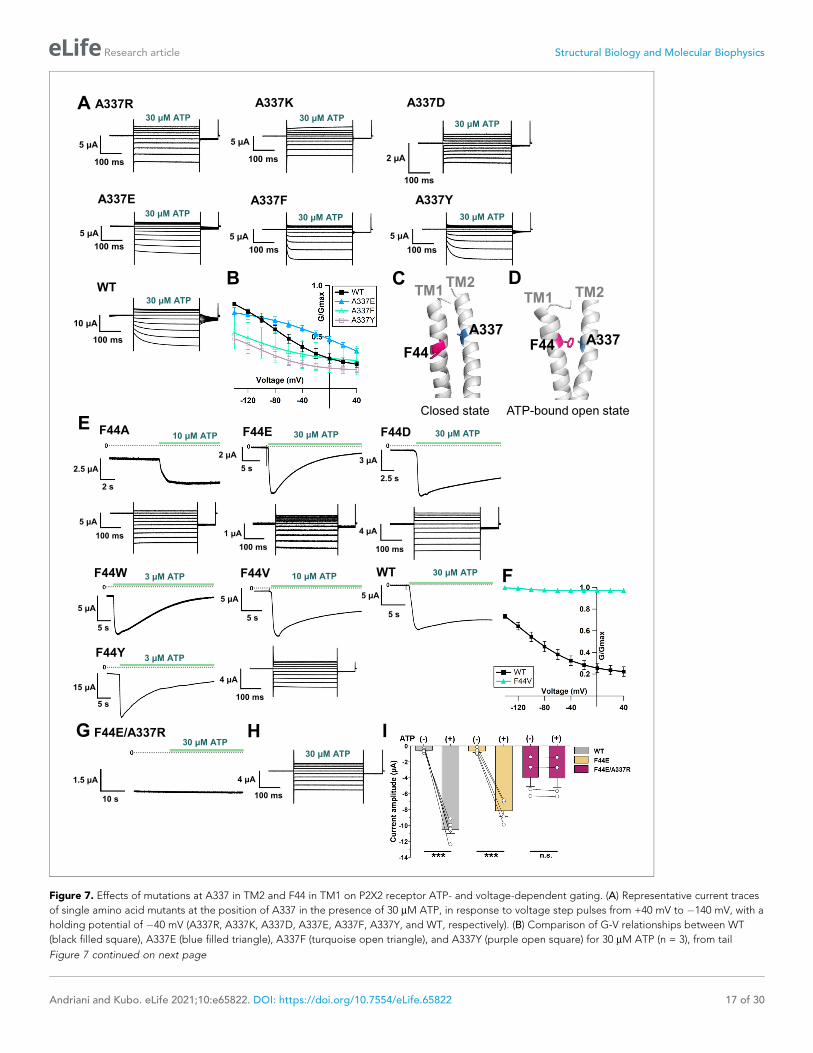
Figure 7. Effects of mutations at A337 in TM2 and F44 in TM1 on P2X2 receptor ATP- and voltage-dependent gating. (A) Representative current traces
of single amino acid mutants at the position of A337 in the presence of 30 mM ATP, in response to voltage step pulses from +40 mV to �140 mV, with a
holding potential of �40 mV (A337R, A337K, A337D, A337E, A337F, A337Y, and WT, respectively). (B) Comparison of G-V relationships between WT
(black filled square), A337E (blue filled triangle), A337F (turquoise open triangle), and A337Y (purple open square) for 30 mM ATP (n = 3), from tail
Figure 7 continued on next page
Andriani and Kubo. eLife 2021;10:e65822. DOI: https://doi.org/10.7554/eLife.65822 17 of 30
Research article Structural Biology and Molecular Biophysics
Based on the results from VCF recording, mutagenesis experiments, and the homology modeling
of rP2X2 in the open state upon ATP binding, it was shown that F44 moves into close proximity to
the converged electric field at A337 and I341 (Figure 8A,B). In the presence of ATP, voltage-depen-
dent conformational changes occur, possibly at or around the position of A337 and F44, giving influ-
ence to the interaction between A337 and F44, which is critical for stabilizing the open state. Results
of this study show that the origin of the voltage-dependent gating of P2X2 in the presence of ATP is
possibly the voltage dependence of the interaction between A337 and F44 within the converged
electric field (Figure 8).
DiscussionThe present study aims at defining the roles of the TM domains of the P2X2 receptor in complex
gating by [ATP] and voltage, using VCF with a genetically incorporated fUAA probe (Anap) and
mutagenesis. The following findings were obtained.
Detection of fast F changes with a linear voltage dependence at A337and I341We analyzed 96 mutants by VCF and detected a voltage-dependent DFFast/F at A337 and I341 in
TM2. It was very fast and showed a linear voltage dependence within the voltage range under study.
The change could be well interpreted to be due to an electrochromic effect, indicating that there is
an electric field convergence at both positions, which are located adjacent to each other.
An electrochromic signal is an intrinsic property exhibited by voltage-sensitive fluorescent dyes or
electrochromic probes to directly detect transmembrane potentials (Loew, 1982; Zhang et al.,
1998). By standard use of electrochromic probes in a lipid bilayer, it is difficult to detect the electri-
cal potential that directly acts on the voltage-sensing machinery of membrane proteins
(Asamoah et al., 2003). This is because the local electric field at a certain position in the lipid bilayer
is not steep enough. On the other hand, previous VCF studies on the Shaker K+ channel, using modi-
fied electrochromic probes (Asamoah et al., 2003), and on the M2 muscarinic receptor, using
TMRM (Dekel et al., 2012), showed that an electrochromic signal could be observed when the fluo-
rophore is directly attached to a specific position within the ion channel/receptor. These studies
stated that this phenomenon did not report conformational changes of the protein at the site of flu-
orophore attachment, but rather implied that there is an electric field convergence if the electro-
chromic signal is observed only at positions adjacent to each other (Asamoah et al., 2003;
Dekel et al., 2012). This observed electrochromic signal might indicate the possible location of a
voltage sensor (Asamoah et al., 2003; Dekel et al., 2012). Further studies are certainly required to
test this possibility.
An almost linear F-V relationship which might originate from the electrochromic signal was also
reported from VCF studies in a canonical VSD-containing membrane protein called hTMEM266,
labeled with MTS-TAMRA. The observed DFFast/F was, however, explained rather differently. Even
though the DFFast/F was observed at most of the substituted positions located in the S3-S4 linker
Figure 7 continued
current analysis at �60 mV. Normalization was based on the maximum conductance in the highest [ATP] (300 mM) for each construct. (C, D) Side view
structure of the position of F44 (magenta) and A337 (blue) in the closed (C) and ATP-bound open (D) state, respectively. (E) Representative current
traces of single amino acid mutants at the position of F44 upon application of various [ATP] (F44A, F44W, F44Y, F44E, F44D, and WT, respectively;
n = 3–6 for each mutant). (F) G-V relationship comparison between WT (black filled square) and F44V (turquoise filled triangle) for 10 mM ATP (n = 3),
showing that this mutant was equally active at all recorded voltages and was far less sensitive to voltage than wildtype. Normalization was based on the
maximum conductance in the highest [ATP] (300 mM) for each construct. (G, H) Representative current traces of F44E/A337R upon ATP (G) and voltage
(H) application. (I) Comparison of current amplitude of WT, F44E, and F44E/A337R before and after ATP application (***p�0.001, p=0.00007 for WT,
and p=0.00095 for F44E, paired t-test [n = 4–5]). All error bars are ± s.e.m. centered on the mean. Source data are provided in Figure 7—source data
1. Statistical analysis data are provided in Figure 7—source data 2.
The online version of this article includes the following source data and figure supplement(s) for figure 7:
Source data 1. Effects of mutations at A337 in TM2 and F44 in TM1 on P2X2 receptor ATP- and voltage-dependent gating.
Source data 2. Statistical analysis to support graph in Figure 7I.
Figure supplement 1. Effect of swapped mutation F44A/A337F.
Andriani and Kubo. eLife 2021;10:e65822. DOI: https://doi.org/10.7554/eLife.65822 18 of 30
Research article Structural Biology and Molecular Biophysics
and the top of the S4 segment, it was stated that DFFast/F was not due to a direct electrochromic
effect but instead was associated with rapid voltage-dependent conformational changes on a ms
time scale (Papp et al., 2019). In the case of hTMEM266, it is difficult to surmise that the fast change
detected at many positions is due to electrochromic effect, because it suggests an unlikely possibility
that the electric field is converged at various positions. Conversely, in the P2X2 receptor, there were
only two adjacent positions which exclusively showed clear DFFast/F and a linear F-V relationship.
In the hTMEM266 study, it was also a concern whether TAMRA-MTS could report an electrochro-
mic signal, because there were not any previous findings to support this case. There were also no
reports of electrochromic signals recorded using Anap as fluorophore. Anap has only been reported
as an environmental sensitive fluorophore (Lee et al., 2009; Chatterjee et al., 2013). There are no
reports that Anap is an electrochromic fluorophore, unlike the case of the modified fluorophore
used in Shaker Kv studies, which has been reported to have electrochromic properties (Zhang et al.,
A337
I341F44
TM1
TM2
F44
I341A337
TM2 TM1
A
B
Closed state
ATP-bound open state E
ATP
A337I341
Lipid bilayer
Electric field lines
C
A337
F44
I341
DClosed state
F44
A337
I341
Open state
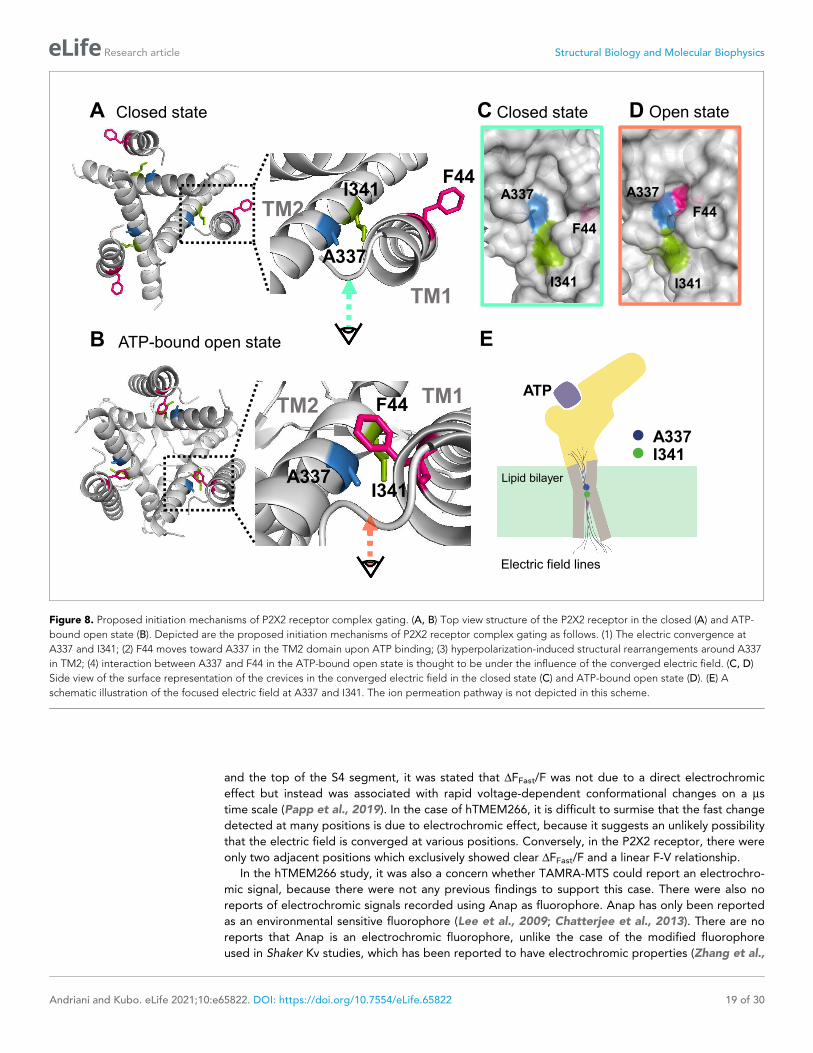
Figure 8. Proposed initiation mechanisms of P2X2 receptor complex gating. (A, B) Top view structure of the P2X2 receptor in the closed (A) and ATP-
bound open state (B). Depicted are the proposed initiation mechanisms of P2X2 receptor complex gating as follows. (1) The electric convergence at
A337 and I341; (2) F44 moves toward A337 in the TM2 domain upon ATP binding; (3) hyperpolarization-induced structural rearrangements around A337
in TM2; (4) interaction between A337 and F44 in the ATP-bound open state is thought to be under the influence of the converged electric field. (C, D)
Side view of the surface representation of the crevices in the converged electric field in the closed state (C) and ATP-bound open state (D). (E) A
schematic illustration of the focused electric field at A337 and I341. The ion permeation pathway is not depicted in this scheme.
Andriani and Kubo. eLife 2021;10:e65822. DOI: https://doi.org/10.7554/eLife.65822 19 of 30
Research article Structural Biology and Molecular Biophysics
1998; Asamoah et al., 2003). On the other hand, studies on the M2 muscarinic receptor did not dis-
cuss TMRM fluorophore properties, but still concluded that the observed fast F change with linear
F-V originated from the electrochromic signal (Dekel et al., 2012). Even though other possibilities
still remain, the most straightforward explanation to interpret the results observed in this study is
that the very fast and linearly voltage-dependent fluorescence changes of Anap at A337 and I341
are associated not with the conformational changes of the P2X2 protein but presumably with the
electrochromic signal. Consequently, the results show that there is an electric field convergence at
these positions, which could give us a clue about the possible location of the voltage sensor in the
P2X2 receptor.
We observed that DFFast/F changed with voltage in both the closed and ATP bound-open
states, implying the presence of the focused electric field in both states at the position of A337.
DFFast/F was larger in the absence than in the presence of ATP. One simple interpretation is
that the focused electric field is stronger in the absence of ATP. However, as the environment
of the fluorophore is different in the absence and presence of ATP, due to the difference in the
crevice shape (Figure 8C,D), it is not possible to directly compare the strength of the focused
electric field in the two states.
Some Cys accessibility studies were performed on the P2X2 receptor in the TM2 domain, to ana-
lyze the ATP-evoked gating mechanism (Li et al., 2008; Kracun et al., 2010; Li et al., 2010). A337
Cys mutants were first reported to be not modified by MTSET both in the presence or absence of
ATP, indicating that this residue is not involved either in the pore lining region in the open state or
in the gate of P2X2, unlike I341 Cys mutants, which were modified by MTSET (Li et al., 2008). Mean-
while in another study using Ag+, a smaller thiol-reactive ion with higher accessibility, A337C was
modified both in the absence and presence of ATP, as well as I341C (Li et al., 2010). These results
suggest that a narrow water phase penetrates down to these positions, which is consistent with the
results in this study that there is a focused electric field at the position of A337 and I341.
Detection of slow F change with non-linear voltage dependence atA337 of K308R mutantWe obtained data supporting voltage-dependent conformational rearrangements occurring at or
around the position of A337, by analyzing the mixed Anap fluorescence signal changes, which con-
tain both DFFast/F and DFSlow/F, in the presence of an additional mutation of K308R in A337Anap.
K308 is located in the ATP binding site and was reported to be important not only for ATP binding
but also for the gating of the P2X2 receptor (Ennion et al., 2000; Jiang et al., 2000; Roberts et al.,
2006; Cao et al., 2007). In VCF analysis, a high expression level is needed to detect DF successfully,
because of the background fluorescence. However, high expression makes the P2X2 channel acti-
vate even in the absence of ATP and also even at depolarized potentials, that is, the G-V
relationship is shifted to a depolarized potential, which makes the voltage-dependent activation
upon hyperpolarization unclear. To overcome this problem, we introduced the K308R mutation,
which shifts the G-V relationship in the hyperpolarized direction, with much reduced activity at depo-
larized potentials (Keceli and Kubo, 2009). By introducing the K308R mutation, we could observe
voltage-dependent gating better and succeeded in recording the slow and voltage-dependent DF at
A337 (Figure 5).
In addition, the DFSlow component was observed only at hyperpolarized potentials and in the
presence of ATP (Figure 5F-J; Figure 6). Also, the FSlow-V and G-V overlapped well, showing that
DFSlow reflects the hyperpolarization-induced structural rearrangements around the position of A337
(Figure 5E; Figure 5J). A337 in TM2 is indeed in the converged electric field, as shown by the linear
F-V relationship of the DFFast component (Figure 5D). It is possible that the voltage-dependent
DFSlow observed at A337 might not directly reflect the presumably very fast movement of the ‘volt-
age-sensor’ in response to the change in membrane voltage but might report the secondary struc-
tural rearrangements (Figure 5A,F, Figure 5—figure supplement 2, Figure 6A).
The electric field convergence takes place at residues located in TM2, as shown by the observed
Anap fluorescence changes at A337 and I341 (Figure 3). Minor changes were also observed at L334
and L338 by follow-up experiments with SIK inhibitor, after the initial screening (Figure 3—figure
supplement 1). Based on these results, the most frequently observed and the largest electrochromic
signal was from A337. Voltage-dependent structural changes were also detected at or around A337.
Although a possibility still remains that other residues are also involved but the changes were
Andriani and Kubo. eLife 2021;10:e65822. DOI: https://doi.org/10.7554/eLife.65822 20 of 30
Research article Structural Biology and Molecular Biophysics
undetected due to technical limitations, all the results so far support the interpretation that the main
focus for the voltage-sensing mechanism in the P2X2 receptor lies at or around A337.
Interaction between A337 in TM2 and F44 in TM1 in the convergedelectric fieldThe specific function of each transmembrane domain of the P2X receptor had been defined before
the crystal structure was solved but the information as to the role of each TM in P2X2 voltage-
dependent gating is limited. TM1 is shown to play a role in the binding-gating process, as mutations
in this region alter the agonist selectivity and sensitivity of channel gating (Haines et al., 2001;
Li et al., 2004; Stelmashenko et al., 2014). In contrast, TM2 plays an essential role in permeation
(Nakazawa et al., 1998; Khakh and Egan, 2005) and gating (Li et al., 2008).
Mutations of A337 in the present study suggested that this position is critical for complex gating,
as mutation to A337F and A337Y altered the channel gating as well as the activation kinetics upon
the application of ATP and voltage (Figure 7A,B). The counterpart for A337 is most likely the F44
residue in TM1. Based on the homology modeling of P2X2, in the ATP-bound open state, F44
rotates and moves toward TM2, specifically into the proximity of A337 (Figure 7C,D). Mutagenesis
at the position of F44 showed the importance of F44 to maintaining the open state in the presence
of ATP (Figure 7E,F). Taken together, the results raised the possibility that F44 serves as a voltage
sensor which has quadrupole moment due to its benzene ring (Dougherty, 1996). The aromatic side
chain of F44 could have a permanent and non-spherical charge distribution (Dougherty, 1996) that
is expected to respond to voltage changes in the converged electric field.
The artificial electrostatic bridge in the F44E/A337R mutant (Figure 7G-I) induced constitutive
activity in the absence of ATP and at all recorded voltages, confirming the importance of the interac-
tion for the maintenance of the activated state. As F44 possibly serves as the voltage sensor, this
interaction, which takes place in the converged electric field, may be influenced by the change in
membrane voltage. The structural rearrangement at F44 is of very high interest, but F44Anap was
not functional, further showing the critical role of F44.
There are several types of voltage-sensing mechanism in membrane proteins (Bezanilla, 2008):
(1) charged residues, as in the case of canonical voltage-gated ion channels (Jiang et al., 2003b;
Swartz, 2008), (2) side-chains that have an intrinsic dipole moment, such as Tyr, as in the case of the
M2 muscarinic receptor (Ben-Chaim et al., 2006; Navarro-Polanco et al., 2011; Dekel et al., 2012;
Barchad-Avitzur et al., 2016), (3) the a-helix, with its intrinsic dipole moment, and (4) cavities within
the protein structure, filled with free ions.
Based on our results, the interaction between A337 and F44 in the ATP-bound open state is
under the influence of the converged electric field (Figure 8A-E), and the results of mutagenesis
studies (Figure 7E,F) suggest that F44 might serve as a voltage-sensor due to its intrinsic quadru-
pole. The results also clearly demonstrate that there are voltage-dependent structural rearrange-
ments in the proximity of A337 in TM2.
Our interpretation, based on this study, is that F44 possibly has a two-step voltage-dependent
rearrangement, after moving into the proximity of A337 upon ATP application. (1) F44 quickly ori-
ents to A337 in the open state, which is stabilized better upon hyperpolarization. (2) The stabilization
upon hyperpolarization, as the consequence of F44 voltage sensing, results in secondary structural
rearrangements. The slow kinetics of fluorescence signal change at A337 (Figure 5, Figure 5—fig-
ure supplement 2, Figure 6) might be the result of the second step of the voltage sensing mecha-
nism by F44. Further analysis of the structural dynamics at the position of F44 will help to elucidate
the detailed mechanism of the complex gating of the P2X2 receptor.
Materials and methods
Key resources table
Reagent type(species) orresource Designation Source or reference Identifiers Additional information
Continued on next page
Andriani and Kubo. eLife 2021;10:e65822. DOI: https://doi.org/10.7554/eLife.65822 21 of 30
Research article Structural Biology and Molecular Biophysics
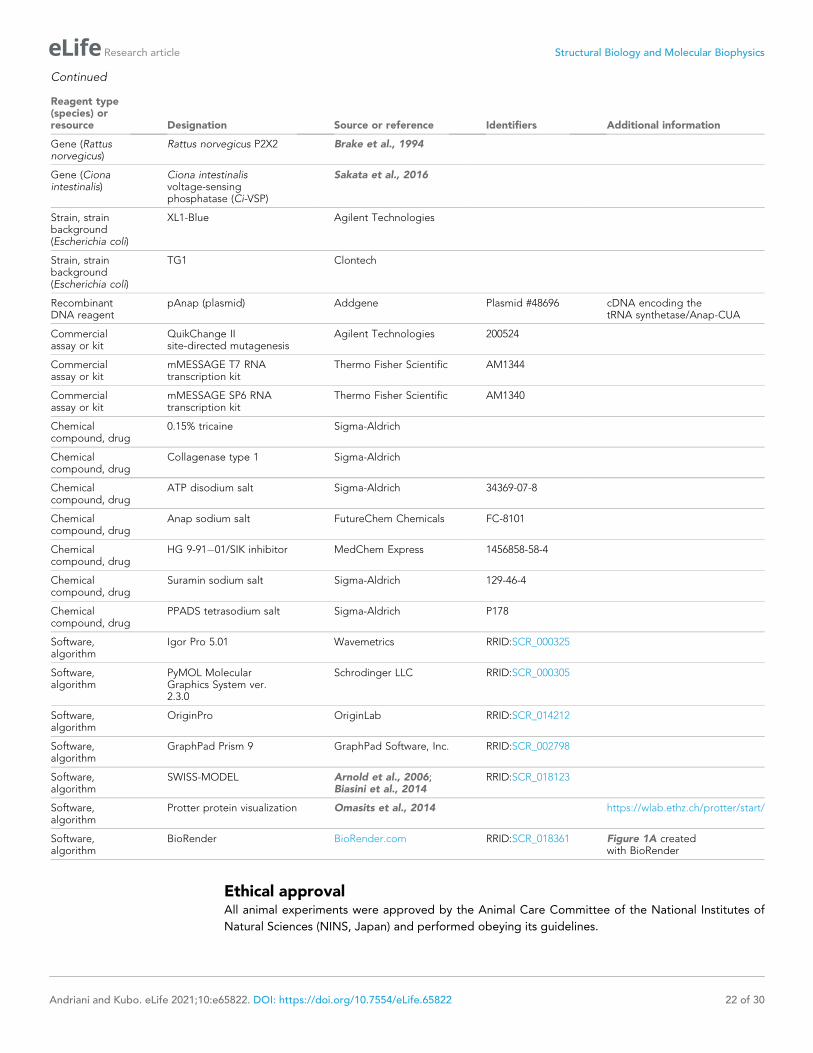
Continued
Reagent type(species) orresource Designation Source or reference Identifiers Additional information
Gene (Rattusnorvegicus)
Rattus norvegicus P2X2 Brake et al., 1994
Gene (Cionaintestinalis)
Ciona intestinalisvoltage-sensingphosphatase (Ci-VSP)
Sakata et al., 2016
Strain, strainbackground(Escherichia coli)
XL1-Blue Agilent Technologies
Strain, strainbackground(Escherichia coli)
TG1 Clontech
RecombinantDNA reagent
pAnap (plasmid) Addgene Plasmid #48696 cDNA encoding thetRNA synthetase/Anap-CUA
Commercialassay or kit
QuikChange IIsite-directed mutagenesis
Agilent Technologies 200524
Commercialassay or kit
mMESSAGE T7 RNAtranscription kit
Thermo Fisher Scientific AM1344
Commercialassay or kit
mMESSAGE SP6 RNAtranscription kit
Thermo Fisher Scientific AM1340
Chemicalcompound, drug
0.15% tricaine Sigma-Aldrich
Chemicalcompound, drug
Collagenase type 1 Sigma-Aldrich
Chemicalcompound, drug
ATP disodium salt Sigma-Aldrich 34369-07-8
Chemicalcompound, drug
Anap sodium salt FutureChem Chemicals FC-8101
Chemicalcompound, drug
HG 9-91�01/SIK inhibitor MedChem Express 1456858-58-4
Chemicalcompound, drug
Suramin sodium salt Sigma-Aldrich 129-46-4
Chemicalcompound, drug
PPADS tetrasodium salt Sigma-Aldrich P178
Software,algorithm
Igor Pro 5.01 Wavemetrics RRID:SCR_000325
Software,algorithm
PyMOL MolecularGraphics System ver.2.3.0
Schrodinger LLC RRID:SCR_000305
Software,algorithm
OriginPro OriginLab RRID:SCR_014212
Software,algorithm
GraphPad Prism 9 GraphPad Software, Inc. RRID:SCR_002798
Software,algorithm
SWISS-MODEL Arnold et al., 2006;Biasini et al., 2014
RRID:SCR_018123
Software,algorithm
Protter protein visualization Omasits et al., 2014 https://wlab.ethz.ch/protter/start/
Software,algorithm
BioRender BioRender.com RRID:SCR_018361 Figure 1A createdwith BioRender
Ethical approvalAll animal experiments were approved by the Animal Care Committee of the National Institutes of
Natural Sciences (NINS, Japan) and performed obeying its guidelines.
Andriani and Kubo. eLife 2021;10:e65822. DOI: https://doi.org/10.7554/eLife.65822 22 of 30
Research article Structural Biology and Molecular Biophysics
Molecular biologyWild type (WT) Rattus norvegicus P2X2 (rP2X2) receptor cDNA (Brake et al., 1994) was subcloned
into the BamH1 site of pGEMHE. TAG or any single amino acid mutation and/or double mutations
were introduced using a Quikchange site-directed mutagenesis kit (Agilent Technologies). The intro-
duced mutations were confirmed by DNA sequencing. The mMESSAGE T7 RNA transcription kit
(Thermo Fisher Scientific) was used to transcribe WT and mutant rP2X2 cRNAs from plasmid cDNA
linearized by Nhe1 restriction enzyme (Toyobo). The tRNA-synthetase/Anap-CUA encoding plasmid
was obtained from Addgene. The salt form of fUAA Anap was used (Futurechem).
Ciona intestinalis voltage-sensing phosphatase (Ci-VSP) with a mutation in the gating loop of the
phosphatase domain (F401Anap) was used as a positive control (Sakata et al., 2016). The mMES-
SAGE SP6 RNA transcription kit (Thermo Fisher Scientific) was used for cRNA transcription of Ci-
VSP.
Preparation of Xenopus laevis oocytesAs an anesthetic agent, 0.15% tricaine (Sigma-Aldrich) was used for Xenopus laevis before surgical
operation for isolation of oocytes. After the final collection, the frogs were humanely sacrificed by
decapitation. Follicular membranes were removed from isolated oocytes by collagenase treatment
(2 mg ml�1; type 1; Sigma-Aldrich) for 6.5 hr. Oocytes were then rinsed and stored in frog Ringer’s
solution (88 mM NaCl, 1 mM KCl, 2.4 mM NaHCO3, 0.3 mM Ca(NO3)2, 0.41 mM CaCl2, 0.82 mM
Mg2SO4, and 15 mM HEPES pH 7.6 with NaOH) containing 0.1% penicillin-streptomycin at 17˚C.
Channel expression and electrophysiological recording of rP2X2Xenopus oocytes injected with 0.5 ng of WT rP2X2 cRNA and incubated for 2 days at 17˚C showed a
high expression level phenotype of WT rP2X2 that has less voltage dependence than those of low
expression level of P2X2 (I < 4.0 mA at �60 mV) (Fujiwara and Kubo, 2004). To achieve low expres-
sion level, oocytes were injected with 0.05 ng of WT rP2X2 cRNA and incubated for 1–2 days. For
rP2X2 mutants, oocytes were injected with 0.5 ng–2.5 ng of cRNA and incubated for 1–3 days,
depending on the desired expression level.
Voltage clamp for macroscopic current recording was performed with an amplifier (OC-725C;
Warner Instruments), a digital-analogue analogue-digital converter (Digidata 1440, Molecular Devi-
ces), and pClamp10.3 software (Molecular Devices). In TEVC recording, borosilicate glass capillaries
(World Precision Instruments) were used with a resistance of 0.2–0.5 MW when filled with 3 M KOAc
and 10 mM KCl. P2X2 bath solution contained 95.6 mM NaCl, 1 mM MgCl2, 5 mM HEPES, and 2.4
mM NaOH at pH 7.35–7.45. Ca2+ was not included in the bath solution in order to avoid the inacti-
vation of the receptor and secondary intracellular effects, for example, activation of Ca2+ dependent
chloride channel currents, (Ding and Sachs, 2000).
ATP disodium salt (Sigma-Aldrich) was prepared in various concentrations (1 mM, 3 mM, 10 mM,
30 mM, 100 mM, 300 mM, 1 mM, and 3 mM) by dissolving it in the bath solution. For recording using
step-pulse protocols, ATP was applied in two ways, depending on the purpose of the experiments
and the phenotype of the mutants. (1) Direct application using a motorized pipette (Gilson pipet-
man), which was set to exchange the whole bath solution with a ligand-based solution. 2000 mL (five
times larger than the bath volume) of ligand-based solution was applied. (2) Perfusion of a recording
chamber using a perfusion system set (ISMATEC pump). In both cases, overflowed bath solution was
continuously removed using a suction pipette by negative air pressure. Oocytes were held at �40
mV and voltage step pulses were applied in the range from +40 mV to �140 mV. For TEVC record-
ings with P2X2 non-specific blockers, oocytes were held at +20 mV, and voltage step pulses were
applied in the range from +40 mV to �160 mV. 300 mM of Suramin sodium salt and 300 mM or 1
mM of PPADS tetrasodium salt (Sigma-Aldrich) was directly applied by motorized pipette. First, 10
or 300 mM ATP was applied to elicit the ATP-evoked current, and subsequently in the same cell,
either suramin or PPADS was applied. Tail currents were recorded at �60 mV to measure conduc-
tance-voltage (G-V) relationships. Recordings were performed at room temperature (24 ± 2˚C).
Expression of Anap-incorporated rP2X2 and Ci-VSPFor functional expression of channels with incorporated Anap, 1.25 ng of cDNA encoding the tRNA
synthetase/Anap-CUA pair was injected into the nucleus of defolliculated Xenopus oocytes located
Andriani and Kubo. eLife 2021;10:e65822. DOI: https://doi.org/10.7554/eLife.65822 23 of 30
Research article Structural Biology and Molecular Biophysics
in the center of the animal pole (Kalstrup and Blunck, 2013). Oocytes were then incubated for 24 hr
at 17˚C to allow tRNA transcription and synthetase expression. The subsequent step was performed
with minimization of light exposure, which otherwise may have excited the fluorophore. Either 1.4–
12.6 ng of rP2X2 cRNA or 8.2 ng of Ci-VSP cRNA in which the target site was mutated to a TAG
codon, was co-injected with 23 nL of 1 mM Anap. Oocytes were incubated in frog Ringer’s solution
(containing 0.1% penicillin-streptomycin) for 1–3 days (rP2X2) or 3–5 days (Ci-VSP) depending on the
desired expression level. In the absence of either tRNA synthetase/Anap-CUA plasmid or fUAA
Anap, no channel expression was detected in rP2X2 Anap mutants, confirming that functional chan-
nels were expressed only when they had successfully incorporated fUAA.
SIK inhibitor applicationHG 9-91�01/SIK inhibitor (MedChem Express) was dissolved in DMSO to make a stock solution of
10 mM and kept as aliquots at �80˚C. SIK inhibitor was diluted before use with RNase-free water
(Otsuka) into certain concentrations for injection to oocytes. Various concentrations of SIK inhibitor
were injected into oocyte nuclei to determine the most effective concentration to improve the opti-
cal recording of VCF-fUAA. SIK inhibitor was mixed and co-injected with either (1) tRNA synthetase/
Anap-CUA plasmid (nuclear injection) or (2) cRNA+Anap (cytoplasmic injection). 300 nM was defined
as the amount of the co-injected SIK inhibitor in the mixed solution. For instance, the actual concen-
tration of SIK inhibitor is 600 nM for 1:1 mixture with 2.5 ng tRNA synthetase/Anap-CUA plasmid.
As the volume of the oocyte nucleus is ~40 nL, and it can tolerate 15–20 nL of injected volume (Lin-
Moshier and Marchant, 2018), the final concentration of SIK inhibitor inside the oocyte nucleus
was ~150 nM.
First of all, Ci-VSP F401Anap was used to confirm reproducible effects in the initial optimization
experiments. The most effective concentration of SIK inhibitor was determined to be 300 nM. Next,
300 nM of SIK inhibitor was co-injected into either the nucleus or cytoplasm of the oocytes, which
were then incubated for different periods of time. This resulted in three test groups: (1) nuclear injec-
tion with 2 days incubation, (2) nuclear injection with 3 days incubation, and (3) cytoplasmic injection
with 2 days incubation. Cytoplasmic injection needs concentration adjustment, since the volume of
an oocyte is ~1 mL. To make the concentration inside the oocyte 150 nM, the injected concentration
was 3 mM. Control groups consisted of non-treated oocytes, incubated for either 2 or 3 days.
A follow-up confirmation experiment was done using the P2X2 A337Anap/R313W mutant, after
the optimum concentration, injection method, and incubation period were determined from the Ci-
VSP experiment. 300 nM of SIK inhibitor was co-injected into the nucleus of the oocyte. Oocytes
were then incubated for 2–3 days, after subsequent cytoplasmic co-injection of channel cRNA and
Anap.
Voltage-clamp fluorometry (VCF) recordingOocytes for VCF-fUAA recording needed to be shielded from light exposure. Oocytes were placed
in a recording chamber with the animal pole facing upward. For ATP-evoked current recording, a
gap-free protocol was applied, with the holding potential at �80 mV. ATP was applied by perfusion
system as described above. For voltage-evoked current recording, oocytes were held at +20 mV or
at �40 mV in some cases. The step pulses were applied from +40 mV to �140 mV, +40 mV to �160
mV, or +80 mV to – 160 mV.
Two recordings (ATP application and voltage application) were performed separately in different
oocytes. VCF recordings in the absence and presence of ATP using voltage step pulses, for some
mutants (A337Anap, R313F/A337Anap, R313W/A337Anap, and K308R/A337Anap), were performed
in the same oocytes.
For voltage step application, ATP was applied directly. As bath volume was measured to be 600
mL, 20 mL ATP of 30 times higher concentration was applied directly to the bath solution. For Ci-VSP
voltage-clamp recording, cells were clamped at �60 mV and the step pulses were applied from �80
mV to +160 mV every 3 s.
Fluorometric recordings were performed with an upright fluorescence microscope (Olympus
BX51WI) equipped with a water immersion objective lens (Olympus XLUMPLAN FL 20x/1.00) to col-
lect the emission light from the voltage-clamped oocytes. The light from a xenon arc lamp (L2194-
01, Hamamatsu Photonics) was applied through a band-pass excitation filter (330–360 nm for Anap).
Andriani and Kubo. eLife 2021;10:e65822. DOI: https://doi.org/10.7554/eLife.65822 24 of 30
Research article Structural Biology and Molecular Biophysics
In the case of the excitation of Anap to minimize photobleaching during ATP-application recording,
the intensity of the excitation light was decreased to 1.5% with ND filters (U-25ND6 and U-25ND25
Olympus), whereas, for step-pulse recording, the intensity of the excitation light was decreased to
6% (U-25ND6 Olympus). Emitted light was passed through band pass emission filters (Brightline,
Semrock) of 420–460 nm and 460–510 nm (Lee et al., 2009; Sakata et al., 2016). The emission sig-
nals were detected by two photomultipliers (H10722-110; Hamamatsu Photonics). The detected
emission intensities were acquired by a Digidata 1332 (Axon Instruments) and Clampex 10.3 soft-
ware (Molecular Devices) at 10 kHz for ATP application and 20 kHz for voltage application. In the
case of Ci-VSP, the detected emission was acquired at 10 kHz. To improve the signal-to-noise ratio,
VCF recording during step-pulse protocols was repeated 20 times for each sample for P2X2 in the
presence of ATP, five times in the absence of ATP, and three times for Ci-VSP. Averaged data were
used for data presentation and analysis.
Data analysisTwo electrode voltage-clamp data were analyzed using Clampfit 10.5 software (Molecular Devices)
and Igor Pro 5.01 (Wavemetrics). Analyses of conductance-voltage (G-V) relationship of P2X2 were
obtained from tail current recordings at �60 mV and fitted to a two-state Boltzmann equation using
Clampfit:
I ¼ IminþImax � Imin
1þ e
ZF
RTV�V1
2
� � (1)
where Imin and Imax are defined as the limits of the amplitudes in fittings, Z is defined as the effective
charge, V1/2 is the voltage of half activation, F is Faraday’s constant, and T is temperature in Kelvin.
In the case of P2X2, normalized conductance-voltage (G-V) relationships were plotted using:
G=Gmax ¼ I=Imin ¼ 1� 1þ eZF V�V1=2ð Þ=RT
� ��1
1� Imax=Iminð Þ (2)
In the case of VCF data, the gradual decline of fluorescence recording traces due to photobleach-
ing was compensated by subtracting the expected time-lapse decrease calculated from the trace’s
bleaching rate (R) by assuming that the fluorescence is linear. Arithmetic operations were performed
by Igor Pro 5.01 for ATP-evoked fluorescent signals.
Compensated data ¼ Recorded F data þR� point number (3)
In the case of fluorescence traces from voltage application for both P2X2 and Ci-VSP, arithmetic
operations were performed by Clampfit.
½Compensated trace� ¼ ½RecordedFtrace� � ð1�ðR� ½time�ÞÞ (4)
where [time] is the value of the point given by Clampfit. All the compensated traces were then nor-
malized by setting each baseline level (F signal at �40 mV or at +20 mV depending on the holding
potential) to be 1, to calculate the % F change (DF/F; DF = F-160mV� Fbaseline; F = Fbaseline). The frac-
tion of DFSlow/F was calculated from the equation:
DFsteady�state=F¼ DFfast=FþDFslow;F¼ Fbaseline (5)
The data were expressed as mean ± s.e.m. with n indicating the number of samples.
Statistical analysisStatistical analysis was performed by either one-way ANOVA, two-sample t-test, or paired t-test. Fol-
lowing one-way ANOVA, Tukey’s post-hoc test was applied. The data were expressed as mean± s.
e.m. with n indicating the number of samples. Values of p<0.05 were defined as statistically signifi-
cant. *, **, ***, **** denote values of p<0.05, 0.01, 0.001, 0.0001, respectively. All the statistical anal-
ysis and the bar graphs were performed and generated either with OriginPro (OriginLab) or
GraphPad Prism 9.
Andriani and Kubo. eLife 2021;10:e65822. DOI: https://doi.org/10.7554/eLife.65822 25 of 30
Research article Structural Biology and Molecular Biophysics

Three-dimensional structural modeling of rat P2X2Homology modeling was performed using a web-based environment for protein structure homology
modeling SWISS-MODEL (Arnold et al., 2006; Biasini et al., 2014), based upon the amino acid
sequence of rP2X2 (NM_053656) and the crystal structure of hP2X3 (Protein Data Bank accession
number 5SVJ and 5SVK for closed and ATP-bound open states, respectively) (Mansoor et al.,
2016). All the structural data presented in this study were generated using PyMOL molecular
graphics system ver. 2.3.0 (Schrodinger LLC). Protein visualization was generated using Protter
(Omasits et al., 2014).
AcknowledgementsThe authors thank Dr. Sakata S and Prof. Okamura Y (Osaka University, Graduate School of Medi-
cine) for the guidance of VCF experiments, Dr. Shimomura T and all members in Kubo Laboratory
for discussion, Ms. Naito C for technical support, and Dr. Collins A (Saba University, School of Medi-
cine, Dutch Caribbean) for editing the manuscript.
Additional information
Funding
Funder Grant reference number Author
Japan Society for the Promo-tion of Science
KAKENHI 17H04021 Yoshihiro Kubo
Japan Society for the Promo-tion of Science
KAKENHI 20H03424 Yoshihiro Kubo
Daiko Foundation Rizki Tsari Andriani
The funders had no role in study design, data collection and interpretation, or the
decision to submit the work for publication.
Author contributions
Rizki Tsari Andriani, Conceptualization, Data curation, Formal analysis, Writing - original draft, Writ-
ing - review and editing; Yoshihiro Kubo, Conceptualization, Supervision, Funding acquisition, Proj-
ect administration, Writing - review and editing
Author ORCIDs
Rizki Tsari Andriani https://orcid.org/0000-0002-9242-469X
Yoshihiro Kubo https://orcid.org/0000-0001-6707-0837
Ethics
Animal experimentation: All animal experiments were approved by the Animal Care Committee of
the National Institutes of Natural Sciences (NINS, Japan) and performed obeying its guidelines.
Decision letter and Author response
Decision letter https://doi.org/10.7554/eLife.65822.sa1
Author response https://doi.org/10.7554/eLife.65822.sa2
Additional filesSupplementary files. Supplementary file 1. List of introduced TAG mutations in P2X2 receptor for VCF analysis. Muta-
tions were introduced one at a time into 96 positions within the extracellular domain (ECD) near the
ATP-binding site and extracellular linker, transmembrane domains (TMs), intracellular N-terminal,
and intracellular C-terminal. ATP application ranging from 10 mM, 30 mM, or 100 mM unless
Andriani and Kubo. eLife 2021;10:e65822. DOI: https://doi.org/10.7554/eLife.65822 26 of 30
Research article Structural Biology and Molecular Biophysics

otherwise stated. (+) indicates there was either ATP-evoked fluorescence (F) signal change, voltage-
evoked F change, ATP-evoked current (I) change, or voltage-evoked I change. (-) indicates negative
results. (**) indicates mutants which have a very low expression level, so that the reliable VCF analy-
sis could not be undertaken. (***) indicates fast current decay. (–) indicates that the subsequent
recording could not be performed, as a result of fast current decay. (n.d.) indicates not determined.
. Transparent reporting form
Data availability
All data generated or analysed during this study are included in the manuscript and supporting files.
Source data files have been provided for Figure 1, Figure 1—figure supplement 1, Figure 2, Figure
2—figure supplement 1, Figure 3, Figure 3—figure supplement 1, Figure 4, Figure 4—figure supple-
ment 1, Figure 5, Figure 5—figure supplement 1, Figure 5—figure supplement 2, Figure 6, Figure
6—figure supplement 1, and Figure 7.
The following previously published datasets were used:
Author(s) Year Dataset title Dataset URLDatabase andIdentifier
Mansoor SE, Lu W,Oosterheert W,Shekhar M,Tajkhorshid E,Gouaux E
2016 5SVJ Crystal structure of the ATP-gated human P2X3 ion channel inthe closed, apo state
https://www.rcsb.org/structure/5svj
RCSB Protein DataBank, 5SVJ
Mansoor SE, Lu W,Oosterheert W,Shekhar M,Tajkhorshid E,Gouaux E
2016 5SVK Crystal structure of the ATP-gated human P2X3 ion channel inthe ATP-bound, open state
https://www.rcsb.org/structure/5svk
RCSB Protein DataBank, 5SVK
Brake AJ,Wagenbach MJ,Julius D
1994 NM_053656 Amino acid sequenceof rat P2X2
https://www.ncbi.nlm.nih.gov/nuccore/NM_053656
NCBI GenBank, NM_053656.3
ReferencesArnold K, Bordoli L, Kopp J, Schwede T. 2006. The SWISS model workspace: a web-based environment forprotein structure homology modelling. Bioinformatics 22:195–201. DOI: https://doi.org/10.1093/bioinformatics/bti770, PMID: 16301204
Asamoah OK, Wuskell JP, Loew LM, Bezanilla F. 2003. A fluorometric approach to local electric fieldmeasurements in a voltage-gated ion channel. Neuron 37:85–98. DOI: https://doi.org/10.1016/S0896-6273(02)01126-1, PMID: 12526775
Barchad-Avitzur O, Priest MF, Dekel N, Bezanilla F, Parnas H, Ben-Chaim Y. 2016. A novel voltage sensor in theorthosteric binding site of the M2 muscarinic receptor. Biophysical Journal 111:1396–1408. DOI: https://doi.org/10.1016/j.bpj.2016.08.035, PMID: 27705763
Ben-Chaim Y, Chanda B, Dascal N, Bezanilla F, Parnas I, Parnas H. 2006. Movement of ’gating charge’ is coupledto ligand binding in a G-protein-coupled receptor. Nature 444:106–109. DOI: https://doi.org/10.1038/nature05259, PMID: 17065983
Bezanilla F. 2008. How membrane proteins sense voltage. Nature Reviews Molecular Cell Biology 9:323–332.DOI: https://doi.org/10.1038/nrm2376, PMID: 18354422
Biasini M, Bienert S, Waterhouse A, Arnold K, Studer G, Schmidt T, Kiefer F, Cassarino TG, Bertoni M, Bordoli L,Schwede T. 2014. SWISS-MODEL: modelling protein tertiary and quaternary structure using evolutionaryinformation. Nucleic Acids Research 42:W252–W258. DOI: https://doi.org/10.1093/nar/gku340
Brake AJ, Wagenbach MJ, Julius D. 1994. New structural motif for ligand-gated ion channels defined by anionotropic ATP receptor. Nature 371:519–523. DOI: https://doi.org/10.1038/371519a0, PMID: 7523952
Bublitz GU, Boxer SG. 1997. Stark spectroscopy: applications in chemistry, biology, and materials science.Annual Review of Physical Chemistry 48:213–242. DOI: https://doi.org/10.1146/annurev.physchem.48.1.213,PMID: 9348658
Burnstock G. 2003. Introduction: atp and its metabolites as potent extracellular agents. Current Topics inMembranes 54:1–27. DOI: https://doi.org/10.1016/S1063-5823(03)01001-9
Cao L, Young MT, Broomhead HE, Fountain SJ, North RA. 2007. Thr339-to-serine substitution in rat P2X2receptor second transmembrane domain causes constitutive opening and indicates a gating role for Lys308.Journal of Neuroscience 27:12916–12923. DOI: https://doi.org/10.1523/JNEUROSCI.4036-07.2007, PMID: 18032665
Andriani and Kubo. eLife 2021;10:e65822. DOI: https://doi.org/10.7554/eLife.65822 27 of 30
Research article Structural Biology and Molecular Biophysics

Cao L, Broomhead HE, Young MT, North RA. 2009. Polar residues in the second transmembrane domain of therat P2X2 receptor that affect spontaneous gating, unitary conductance, and rectification. Journal ofNeuroscience 29:14257–14264. DOI: https://doi.org/10.1523/JNEUROSCI.4403-09.2009, PMID: 19906973
Cha A, Bezanilla F. 1997. Characterizing voltage-dependent conformational changes in the shaker K+ channelwith fluorescence. Neuron 19:1127–1140. DOI: https://doi.org/10.1016/S0896-6273(00)80403-1, PMID: 9390525
Chatterjee A, Guo J, Lee HS, Schultz PG. 2013. A genetically encoded fluorescent probe in mammalian cells.Journal of the American Chemical Society 135:12540–12543. DOI: https://doi.org/10.1021/ja4059553,PMID: 23924161
Dekel N, Priest MF, Parnas H, Parnas I, Bezanilla F. 2012. Depolarization induces a conformational change in thebinding site region of the M2 muscarinic receptor. PNAS 109:285–290. DOI: https://doi.org/10.1073/pnas.1119424109, PMID: 22184214
Ding S, Sachs F. 2000. Inactivation of P2X2 purinoceptors by divalent cations. The Journal of Physiology 522 Pt2:199–214. DOI: https://doi.org/10.1111/j.1469-7793.2000.t01-1-00199.x, PMID: 10639098
Dougherty DA. 1996. Cation-pi interactions in chemistry and biology: a new view of benzene, phe, tyr, and trp.Science 271:163–168. DOI: https://doi.org/10.1126/science.271.5246.163, PMID: 8539615
Ennion S, Hagan S, Evans RJ. 2000. The role of positively charged amino acids in ATP recognition by human P2X(1) receptors. Journal of Biological Chemistry 275:29361–29367. DOI: https://doi.org/10.1074/jbc.M003637200, PMID: 10827197
Fujiwara Y, Keceli B, Nakajo K, Kubo Y. 2009. Voltage- and [ATP]-dependent gating of the P2X(2) ATP receptorchannel. Journal of General Physiology 133:93–109. DOI: https://doi.org/10.1085/jgp.200810002, PMID: 19114637
Fujiwara Y, Kubo Y. 2004. Density-dependent changes of the pore properties of the P2X2 receptor channel. TheJournal of Physiology 558:31–43. DOI: https://doi.org/10.1113/jphysiol.2004.064568, PMID: 15107474
Habermacher C, Martz A, Calimet N, Lemoine D, Peverini L, Specht A, Cecchini M, Grutter T. 2016. Photo-switchable tweezers illuminate pore-opening motions of an ATP-gated P2X ion channel. eLife 5:e11050.DOI: https://doi.org/10.7554/eLife.11050, PMID: 26808983
Haines WR, Migita K, Cox JA, Egan TM, Voigt MM. 2001. The first transmembrane domain of the P2X receptorsubunit participates in the agonist-induced gating of the channel. Journal of Biological Chemistry 276:32793–32798. DOI: https://doi.org/10.1074/jbc.M104216200, PMID: 11438537
Hattori M, Gouaux E. 2012. Molecular mechanism of ATP binding and ion channel activation in P2X receptors.Nature 485:207–212. DOI: https://doi.org/10.1038/nature11010, PMID: 22535247
Heymann G, Dai J, Li M, Silberberg SD, Zhou HX, Swartz KJ. 2013. Inter- and intrasubunit interactions betweentransmembrane helices in the open state of P2X receptor channels. PNAS 110:E4045–E4054. DOI: https://doi.org/10.1073/pnas.1311071110, PMID: 24082111
Housley GD, Morton-Jones R, Vlajkovic SM, Telang RS, Paramananthasivam V, Tadros SF, Wong AC, Froud KE,Cederholm JM, Sivakumaran Y, Snguanwongchai P, Khakh BS, Cockayne DA, Thorne PR, Ryan AF. 2013. ATP-gated ion channels mediate adaptation to elevated sound levels. PNAS 110:7494–7499. DOI: https://doi.org/10.1073/pnas.1222295110, PMID: 23592720
Jiang LH, Rassendren F, Surprenant A, North RA. 2000. Identification of amino acid residues contributing to theATP-binding site of a purinergic P2X receptor. Journal of Biological Chemistry 275:34190–34196. DOI: https://doi.org/10.1074/jbc.M005481200, PMID: 10940304
Jiang LH, Rassendren F, Spelta V, Surprenant A, North RA. 2001. Amino acid residues involved in gatingidentified in the first membrane-spanning domain of the rat P2X(2) receptor. Journal of Biological Chemistry276:14902–14908. DOI: https://doi.org/10.1074/jbc.M011327200, PMID: 11278888
Jiang LH, Kim M, Spelta V, Bo X, Surprenant A, North RA. 2003a. Subunit arrangement in P2X receptors. TheJournal of Neuroscience 23:8903–8910. DOI: https://doi.org/10.1523/JNEUROSCI.23-26-08903.2003,PMID: 14523092
Jiang Y, Lee A, Chen J, Ruta V, Cadene M, Chait BT, MacKinnon R. 2003b. X-ray structure of a voltage-dependent K+ channel. Nature 423:33–41. DOI: https://doi.org/10.1038/nature01580, PMID: 12721618
Kalstrup T, Blunck R. 2013. Dynamics of internal pore opening in K(V) channels probed by a fluorescent unnaturalamino acid. PNAS 110:8272–8277. DOI: https://doi.org/10.1073/pnas.1220398110, PMID: 23630265
Kalstrup T, Blunck R. 2018. S4-S5 Linker movement during activation and inactivation in voltage-gated K+
channels. PNAS 115:E6751–E6759. DOI: https://doi.org/10.1073/pnas.1719105115, PMID: 29959207Kawate T, Michel JC, Birdsong WT, Gouaux E. 2009. Crystal structure of the ATP-gated P2X(4) ion channel in theclosed state. Nature 460:592–598. DOI: https://doi.org/10.1038/nature08198, PMID: 19641588
Keceli B, Kubo Y. 2009. Functional and structural identification of amino acid residues of the P2X2 receptorchannel critical for the voltage- and [ATP]-dependent gating. The Journal of Physiology 587:5801–5818.DOI: https://doi.org/10.1113/jphysiol.2009.182824, PMID: 19884318
Keceli B, Kubo Y. 2014. Signal transmission within the P2X2 trimeric receptor. Journal of General Physiology 143:761–782. DOI: https://doi.org/10.1085/jgp.201411166, PMID: 24863932
Khakh BS, Egan TM. 2005. Contribution of transmembrane regions to ATP-gated P2X2 channel permeabilitydynamics. Journal of Biological Chemistry 280:6118–6129. DOI: https://doi.org/10.1074/jbc.M411324200,PMID: 15556949
Klippenstein V, Mony L, Paoletti P. 2018. Probing ion channel structure and function using Light-Sensitive aminoacids. Trends in Biochemical Sciences 43:436–451. DOI: https://doi.org/10.1016/j.tibs.2018.02.012, PMID: 29650383
Andriani and Kubo. eLife 2021;10:e65822. DOI: https://doi.org/10.7554/eLife.65822 28 of 30
Research article Structural Biology and Molecular Biophysics

Klymchenko AS, Stoeckel H, Takeda K, Mely Y. 2006. Fluorescent probe based on Intramolecular proton transferfor fast ratiometric measurement of cellular transmembrane potential. The Journal of Physical Chemistry B 110:13624–13632. DOI: https://doi.org/10.1021/jp062385z, PMID: 16821890
Klymchenko AS, Demchenko AP. 2002. Electrochromic modulation of excited-state intramolecular protontransfer: the new principle in design of fluorescence sensors. Journal of the American Chemical Society 124:12372–12379. DOI: https://doi.org/10.1021/ja027669l, PMID: 12371881
Kracun S, Chaptal V, Abramson J, Khakh BS. 2010. Gated access to the pore of a P2X receptor: structuralimplications for closed-open transitions. The Journal of Biological Chemistry 285:10110–10121. DOI: https://doi.org/10.1074/jbc.M109.089185, PMID: 20093367
Lee HS, Guo J, Lemke EA, Dimla RD, Schultz PG. 2009. Genetic incorporation of a small, environmentallysensitive, fluorescent probe into proteins in Saccharomyces cerevisiae. Journal of the American ChemicalSociety 131:12921–12923. DOI: https://doi.org/10.1021/ja904896s, PMID: 19702307
Lee EEL, Bezanilla F. 2019. Methodological improvements for fluorescence recordings in Xenopus laevis oocytes.The Journal of General Physiology 151:264–272. DOI: https://doi.org/10.1085/jgp.201812189,PMID: 30606741
Li Z, Migita K, Samways DS, Voigt MM, Egan TM. 2004. Gain and loss of channel function by alanine substitutionsin the transmembrane segments of the rat ATP-gated P2X2 receptor. Journal of Neuroscience 24:7378–7386.DOI: https://doi.org/10.1523/JNEUROSCI.1423-04.2004, PMID: 15317863
Li M, Chang TH, Silberberg SD, Swartz KJ. 2008. Gating the pore of P2X receptor channels. NatureNeuroscience 11:883–887. DOI: https://doi.org/10.1038/nn.2151, PMID: 18587390
Li M, Kawate T, Silberberg SD, Swartz KJ. 2010. Pore-opening mechanism in trimeric P2X receptor channels.Nature Communications 1:44. DOI: https://doi.org/10.1038/ncomms1048, PMID: 20975702
Lin-Moshier Y, Marchant JS. 2018. Nuclear Microinjection to Assess How Heterologously Expressed ProteinsImpact Ca2+ Signals in Xenopus Oocytes. Cold Spring Harbor Protocols. DOI: https://doi.org/10.1101/pdb.prot096990
Loew LM. 1982. Design and characterization of electrochromic membrane probes. Journal of Biochemical andBiophysical Methods 6:243–260. DOI: https://doi.org/10.1016/0165-022X(82)90047-1
Mannuzzu LM, Moronne MM, Isacoff EY. 1996. Direct physical measure of conformational rearrangementunderlying potassium channel gating. Science 271:213–216. DOI: https://doi.org/10.1126/science.271.5246.213, PMID: 8539623
Mansoor SE, Lu W, Oosterheert W, Shekhar M, Tajkhorshid E, Gouaux E. 2016. X-ray structures define humanP2X(3) receptor gating cycle and antagonist action. Nature 538:66–71. DOI: https://doi.org/10.1038/nature19367, PMID: 27626375
McCarthy AE, Yoshioka C, Mansoor SE. 2019. Full-Length P2X7structures reveal how palmitoylation preventschannel desensitization. Cell 179:659–670. DOI: https://doi.org/10.1016/j.cell.2019.09.017, PMID: 31587896
Mujahid N, Liang Y, Murakami R, Choi HG, Dobry AS, Wang J, Suita Y, Weng QY, Allouche J, Kemeny LV,Hermann AL, Roider EM, Gray NS, Fisher DE. 2017. A UV-Independent topical Small-Molecule approach formelanin production in human skin. Cell Reports 19:2177–2184. DOI: https://doi.org/10.1016/j.celrep.2017.05.042, PMID: 28614705
Nakajo K, Kubo Y. 2014. Steric hindrance between S4 and S5 of the KCNQ1/KCNE1 channel hampers poreopening. Nature Communications 5:4100. DOI: https://doi.org/10.1038/ncomms5100, PMID: 24920132
Nakazawa K, Liu M, Inoue K, Ohno Y. 1997. Voltage-dependent gating of ATP-activated channels in PC12 cells.Journal of Neurophysiology 78:884–890. DOI: https://doi.org/10.1152/jn.1997.78.2.884, PMID: 9307121
Nakazawa K, Inoue K, Ohno Y. 1998. An asparagine residue regulating conductance through P2X2 receptor/channels. European Journal of Pharmacology 347:141–144. DOI: https://doi.org/10.1016/S0014-2999(98)00207-6, PMID: 9650860
Nakazawa K, Ohno Y. 2005. Characterization of voltage-dependent gating of P2X2 receptor/channel. EuropeanJournal of Pharmacology 508:23–30. DOI: https://doi.org/10.1016/j.ejphar.2004.12.005, PMID: 15680251
Navarro-Polanco RA, Moreno Galindo EG, Ferrer-Villada T, Arias M, Rigby JR, Sanchez-Chapula JA, Tristani-Firouzi M. 2011. Conformational changes in the M2 muscarinic receptor induced by membrane voltage andagonist binding. The Journal of Physiology 589:1741–1753. DOI: https://doi.org/10.1113/jphysiol.2010.204107,PMID: 21282291
North RA. 2002. Molecular physiology of P2X receptors. Physiological Reviews 82:1013–1067. DOI: https://doi.org/10.1152/physrev.00015.2002, PMID: 12270951
Omasits U, Ahrens CH, Muller S, Wollscheid B. 2014. Protter: interactive protein feature visualization andintegration with experimental proteomic data. Bioinformatics 30:884–886. DOI: https://doi.org/10.1093/bioinformatics/btt607
Papp F, Lomash S, Szilagyi O, Babikow E, Smith J, Chang TH, Bahamonde MI, Toombes GES, Swartz KJ. 2019.TMEM266 is a functional voltage sensor regulated by extracellular Zn2. eLife 8:e42372. DOI: https://doi.org/10.7554/eLife.42372, PMID: 30810529
Pless SA, Lynch JW. 2008. Illuminating the structure and function of Cys-loop receptors. Clinical andExperimental Pharmacology and Physiology 35:1137–1142. DOI: https://doi.org/10.1111/j.1440-1681.2008.04954.x, PMID: 18505452
Radford KM, Virginio C, Surprenant A, North RA, Kawashima E. 1997. Baculovirus expression provides directevidence for heteromeric assembly of P2X2 and P2X3 receptors. The Journal of Neuroscience 17:6529.DOI: https://doi.org/10.1523/JNEUROSCI.17-17-06529.1997, PMID: 9254665
Andriani and Kubo. eLife 2021;10:e65822. DOI: https://doi.org/10.7554/eLife.65822 29 of 30
Research article Structural Biology and Molecular Biophysics

Roberts JA, Vial C, Digby HR, Agboh KC, Wen H, Atterbury-Thomas A, Evans RJ. 2006. Molecular properties ofP2X receptors. Pflugers Archiv - European Journal of Physiology 452:486–500. DOI: https://doi.org/10.1007/s00424-006-0073-6, PMID: 16607539
Sakata S, Jinno Y, Kawanabe A, Okamura Y. 2016. Voltage-dependent motion of the catalytic region of voltage-sensing phosphatase monitored by a fluorescent amino acid. PNAS 113:7521–7526. DOI: https://doi.org/10.1073/pnas.1604218113, PMID: 27330112
Samways DS, Migita K, Li Z, Egan TM. 2008. On the role of the first transmembrane domain in cationpermeability and flux of the ATP-gated P2X2 receptor. Journal of Biological Chemistry 283:5110–5117.DOI: https://doi.org/10.1074/jbc.M708713200, PMID: 18048351
Schewe M, Nematian-Ardestani E, Sun H, Musinszki M, Cordeiro S, Bucci G, de Groot BL, Tucker SJ, RapediusM, Baukrowitz T. 2016. A Non-canonical Voltage-Sensing mechanism controls gating in K2P K(+) Channels. Cell164:937–949. DOI: https://doi.org/10.1016/j.cell.2016.02.002, PMID: 26919430
Stelmashenko O, Compan V, Browne LE, North RA. 2014. Ectodomain movements of an ATP-gated ion channel(P2X2 receptor) probed by disulfide locking. Journal of Biological Chemistry 289:9909–9917. DOI: https://doi.org/10.1074/jbc.M113.542811, PMID: 24515105
Swartz KJ. 2008. Sensing voltage across lipid membranes. Nature 456:891–897. DOI: https://doi.org/10.1038/nature07620, PMID: 19092925
Talwar S, Lynch JW. 2015. Investigating ion channel conformational changes using voltage clamp fluorometry.Neuropharmacology 98:3–12. DOI: https://doi.org/10.1016/j.neuropharm.2015.03.018, PMID: 25839896
Valera S, Hussy N, Evans RJ, Adami N, North RA, Surprenant A, Buell G. 1994. A new class of ligand-gated ionchannel defined by P2x receptor for extracellular ATP. Nature 371:516–519. DOI: https://doi.org/10.1038/371516a0, PMID: 7523951
Yan D, Zhu Y, Walsh T, Xie D, Yuan H, Sirmaci A, Fujikawa T, Wong AC, Loh TL, Du L, Grati M, Vlajkovic SM,Blanton S, Ryan AF, Chen ZY, Thorne PR, Kachar B, Tekin M, Zhao HB, Housley GD, et al. 2013. Mutation of theATP-gated P2X(2) receptor leads to progressive hearing loss and increased susceptibility to noise. PNAS 110:2228–2233. DOI: https://doi.org/10.1073/pnas.1222285110, PMID: 23345450
Zhang J, Davidson RM, Wei MD, Loew LM. 1998. Membrane electric properties by combined patch clamp andfluorescence ratio imaging in single neurons. Biophysical Journal 74:48–53. DOI: https://doi.org/10.1016/S0006-3495(98)77765-3, PMID: 9449308
Zhou Z, Hume RI. 1998. Two mechanisms for inward rectification of current flow through the purinoceptor P2X2class of ATP-gated channels. The Journal of Physiology 507 ( Pt 2:353–364. DOI: https://doi.org/10.1111/j.1469-7793.1998.353bt.x, PMID: 9518698
Andriani and Kubo. eLife 2021;10:e65822. DOI: https://doi.org/10.7554/eLife.65822 30 of 30
Research article Structural Biology and Molecular Biophysics